


-
In recent years, the incidence of tumors of the human reproductive system, endocrine disorders in puberty, and reproductive tract malformations in neonates has increased and received substantial attention. These phenomena may be associated with environmental pollution. Phthalates, a family of environmental pollutants, contain a group of ethers formed by the condensation of benzene-1,2-dicarboxylic acid and alcohols of different alkyl chain lengths. They are widely used as plasticizers in polyvinyl chloride plastics, additives in some medical devices, and deodorants in various personal care products[1, 2].
Phthalates usually contain one or two alkyl chains in the alcohol moiety, including bis (2-ethylhexyl) phthalate (DEHP), diisononyl phthalate, and di-n-butyl phthalate (DBP). However, bis (2-butoxyethyl) phthalate (BBOP) is a unique phthalate because it is esterified with 2-butoxyethanol, a glycol ether. The phthalate interacts with polymers in a non-covalent manner and eventually enters the environment. BBOP has been detected in water systems[3] and soil sediments[3-5]. Humans are exposed to phthalates through their entire life cycle, including pregnancy, puberty, and adulthood. Phthalates eventually enter the human body[2]. The main route of human exposure to phthalates is orally through food, whereas dermal contact and inhalation contribute only marginally[6].
Some phthalates have been found to be endocrine-disrupting chemicals, and the male reproductive endocrine system is a sensitive target of some phthalates (see review[7]). Phthalates include low molecular weight phthalates with C3-C6 carbon length alcohols esterified in the ortho-phthalate, such as di-(n-propyl)-phthalate to DEHP, and high molecular weight phthalates, which have longer carbon lengths[7]. Increasing evidence indicates that many phthalates, including DEHP, DBP, and BBOP, perturb Leydig cell function in male fetuses and adults[7,8]. However, whether BBOP affects puberty onset by affecting the development of Leydig cells in male rats remains unclear.
In puberty in male rats, Leydig cells rapidly mature from postnatal day (PND) 35 to 56[9]. In that time period, a group of immature Leydig cells mature into adult Leydig cells with full testosterone biosynthetic capacity[9]. The development of Leydig cells requires the regulation of luteinizing hormone (LH) secreted by the pituitary gland, which also secretes follicle-stimulating hormone (FSH), a regulator of Sertoli cell function that indirectly controls the development of Leydig cells[10]. Testosterone biosynthesis is actively regulated by LH. After LH binds the cell surface luteinizing hormone/choriogonadotropin receptor (LHCGR), cyclic adenosine monophosphate, a common second messenger, is induced to initiate a series of signaling cascades. This signaling ultimately increases cholesterol uptake through scavenging receptor class B member 1 (SCARB1) endocytosis; intracellular transport of cholesterol through the regulation of steroidogenic acute regulatory protein (STAR); and a series of steroidogenic enzymes, such as cholesterol side chain cleavage (CYP11A1), 3β-hydroxysteroid dehydrogenase 1 (HSD3B1), 17α-hydroxylase/17,20-lyase (CYP17A1), and 17β-hydroxysteroid dehydrogenase 3 (HSD17B3)[10]. Adult Leydig cells also express mature biomarkers, such as insulin-like 3 (INSL3) and 11β-hydroxysteroid dehydrogenase 1 (HSD11B1)[10].
Under normal circumstances, the oxidative and antioxidant systems of the testis maintain a dynamic balance. These antioxidant enzymes, mainly superoxide dismutase 1 and 2 (SOD1 and SOD2), glutathione peroxidase 1 (GPX1), and catalase, have been found to be reduced, and reactive oxygen species (ROS) are generated after phthalate exposure[11-13]. The onset of male puberty relies on the pubertal development of Leydig cells, in a process involving a variety of signaling cascades, such as the AKT, ERK1/2, GSK3β, mTOR, and SIRT1 pathways[14-17]. This study focused on the effect of BBOP on puberty onset by investigating the pubertal development of Leydig cells according to various parameters, including hormonal changes, Leydig cell numbers, steroidogenesis-associated gene and protein expression, ROS generation, and alterations in several signaling pathways.
-
BBOP (CAS registry number 117-83-9) was purchased from Fusheng Industrial Co. (Shanghai, China). An Immulite 2000 total testosterone kit was obtained from Sinopharm (Hangzhou, China). TRIzol reagent was obtained from Invitrogen (Carlsbad, CA). A reverse transcription kit and SYBR green real-time polymerase chain reaction (qPCR) kit were purchased from Takara (Otsu, Japan). A BCA protein assay kit was purchased from Beyotime (Shanghai, China). Primer information for qPCR detection is shown in Supplementary Table S1 (available in www.besjournal.com) and antibody information for immunohistochemistry and western blotting is shown in Supplementary Table S2 (available in www.besjournal.com).
Symbol Gene name Primer Sequences (5’to 3’) bp Accession No. Lhcgr Luteinizing hormone receptor Forward
ReverseCTGCGCTGTCCTGGCC
CGACCTCATTAAGTCCCCTGAA102 NM_012978 Star Steroidogenic acute regulatory protein Forward
ReverseCCCAAATGTCAAGGAAATCA
AGGCATCTCCCCAAAGTG187 NM_031558 Scarb1 Scavenger receptor class B member 1 Forward
ReverseATGGTACTGCCGGGCAGAT
CGAACACCCTTGATTCCTGGTA117 NM_031541 Cyp11a1 Cholesterol side chain cleavage Forward
ReverseAAGTATCCGTGATGTGGG
TCATACAGTGTCGCCTTTTCT127 NM_017286 Cyp17a1 17α-Hydroxylase/17,20-lyase Forward
ReverseTGGCTTTCCTGGTGCACAATC
TGAAAGTTGGTGTTCGGCTGAAG90 NM_012753 Hsd3b1 3β-Hydroxysteroid dehydrogenase 1 Forward
ReverseCCCTGCTCTACTGGCTTGC
TCTGCTTGGCTTCCTCCC189 NM_001007719 Hsd17b3 17β-Hydroxysteroid dehydrogenase 3 Forward
ReverseTGAAAGTTGGTGTTCGGCTGAAG
TGAAAGTTGGTGTTCGGCTGAAG202 NM_054007 Hsd11b1 11β-Hydroxysteroid dehydrogenase 1 Forward
ReverseGAAGAAGCATGGAGGTCAAC
GCAATCAGAGGTTGGGTCAT133 NM_017080 Sox9
FshrSRY-box transcription factor 9
Follicle-stimulating hormone receptorForward
Reverse
Forward
ReverseGCAGCGTGGGGTTGTG
TGGATGATTGGGATGGTCA
CAAAAGTCCAGCCCAATACC
AACCCCGACATAATCTTCA172
327NM_138547
NM_199237Dhh Desert hedgehog Forward
ReverseAACCCCGACATAATCTTCA
CTCGTCCCAACCTTCAGT150 NM_053367 Nr5a1 Nuclear receptor subfamily 5 group A1 Forward
ReverseCAGAGCTGCAAAATCGACAA
CCCGAATCTGTGCTTTCTTC187 NM_001191099 Insl3 Insulin-like 3 Forward
ReverseGTGGCTGGAGCAACGACA
AGAAGCCTGGTGAGGAAGC102 NM_053680 Sod1
Sod2
Cat
Gpx1
BCL2
BaxSuperoxide dismutase 1
Superoxide dismutase 2
Catalase
Glutathione peroxidase 1
BCL2 apoptosis regulator
BCL2 associated X apoptosis regulatorForward
Reverse
Forward
Reverse
Forward
Reverse
Forward
Reverse
Forward
Reverse
Forward
ReverseGCCGTGTGCGTGCTGAAGG
TGTAATCTGTCCTGACACCACAACTG
TCCCTGACCTGCCTTACGACTATG
TCGTGGTACTTCTCCTCGGTGAC
AGCGGATTCCTGAGAGAGTGGTAC
CTGTGGAGAATCGGACGGCAATAG
TGCAATCAGTTCGGACATCAGGAG
CTCACCATTCACCTCGCACTTCTC
AGCGTCAACAGGGAGATGTC
TATGCACCCAGAGTGATGCA
GACGCATCCACCAAGAAGCTGAG
GCTGCCACACGGAAGAAGACC99
130
147
129
204
134NM_017050.1
NM_017051.2
NM_012520.2
NM_030826.4
NM_016993
NM_017059Lhb Luteinizing hormone subunit beta Forward
ReverseCTGCTGCTGAGCCCAAGTGT TGCTGGTGGTGAAGGTGATG 400 NM_012858 Fshb Follicle stimulating hormone subunit beta Forward
ReverseCATTCACCCACCCTTGTCTT
GCTCCTCCTCACTACCTGTC326 NM_001007597.2 Gnrhr Gonadotropin releasing hormone receptor Forward
ReverseCTTGAAGCCCGTCCTTGG
GCGATCCAGGCTAATCAC440 NM_031038 Rps16
GapdhRibosomal protein S16
Glyceraldehyde-3-phosphate dehydrogenaseForward
Reverse
Forward
ReverseAAGTCTTCGGACGCAAGAAA
TTGCCCAGAAGCAGAACAG
GTCCATGCCATCACTGCCACTC
GATGACCTTGCCCACAGCCTTG148
132NM_001169146
NM_017008.4Table S1. qPCR primer information
Antibody Species Vendor (City, State) Dilution WB HS GAPDH Mouse Cell Signaling Technology (Danvers, MA) 1:1,000 ND CYP11A1 Rabbit Cell Signaling Technology (Danvers, MA) 1:1,000 1:200 HSD11B1 Rabbit Abcam (San Francisco, CA) 1:1,000 1:200 INSL3 Rabbit Abcam (San Francisco, CA) 1:1,000 ND DHH Mouse Santa Cruz Biotechnology (Dallas, TX) 1:100 ND pmTOR rabbit Cell Signaling Technology (Danvers, MA) 1:1,000 ND mTOR rabbit Cell Signaling Technology (Danvers, MA) 1:1,000 ND ERK1/2 mouse Cell Signaling Technology (Danvers, MA) 1:1,000 ND pERK1/2 mouse Cell Signaling Technology (Danvers, MA) 1:5,000 ND AKT1 Rabbit Cell Signaling Technology (Danvers, MA) 1:2,000 ND pAKT1 Rabbit Cell Signaling Technology (Danvers, MA) 1:5,000 ND AKT2 Rabbit Cell Signaling Technology (Danvers, MA) 1:1,000 ND pAKT2 Rabbit Cell Signaling Technology (Danvers, MA) 1:1,000 ND BAX Rabbit Abcam (San Francisco, CA) 1:1,000 ND BCL2 Rabbit Cell Signaling Technology (Danvers, MA) 1:1,000 ND SOD1 Rabbit Cell Signaling Technology (Danvers, MA) 1:1,000 ND SOD2 Rabbit Cell Signaling Technology (Danvers, MA) 1:1,000 ND PGC1α Rabbit Abcam (San Francisco, CA) 1:1,000 ND SIRT1 Rabbit Cell Signaling Technology (Danvers, MA) 1:1,000 ND Note. ND = Not detected; WB = Western blot; HS = Histochemical staining. Table S2. Antibody information
-
Male Sprague-Dawley rats [28 days of age (post weaning)] were from the Shanghai Laboratory Animal Center (Shanghai, China). All animal procedures were approved by the Ethics Committee of Animal Care and Use of Wenzhou Medical University (protocol number: wydw2014-0057). Rats were raised in clear polycarbonate cages under the following conditions: a 12-h dark/12-h light cycle, temperature range of 21–25 °C, and a humidity range of 45%–55%. After 7 days of acclimation, the rats were 35 days of age. Thirty rats were randomly assigned to five groups (with 6 animals per group) receiving BBOP at 0 (corn oil as control vehicle), 10, 100, 250, or 500 mg/kg bw per day. The dosage range was chosen on the basis of a previous study on the developmental/reproductive toxicity of BBOP, which induced abnormal changes in the morphology of fetal Leydig cells after in utero exposure through gavage for 8 days at doses as high as 500 mg/kg bw per day[8]. Different doses of BBOP were prepared by dissolving BBOP in corn oil and were administered at a rate of 2 mL/(kg·day). The administration duration (from PND 35 to 56) spanned the pubertal development of Leydig cells in rats[10]. Rats were weighed daily. At the end of administration, the rats were euthanized by CO2 asphyxiation. The testis and epididymis were harvested and weighed. Pituitary glands were collected. One testis, one epididymis, and the pituitary gland were stored at –80 °C. The other testis was immersed in Bouin’s fixative. Trunk blood was harvested for the collection of serum.
-
An Immulite 2000 total testosterone kit was used to measure serum testosterone concentrations at the Department of Medical Chemistry of our hospital, as previously documented[18].
-
Enzyme linked immunosorbent assay kits for rat LH or FSH were used to detect rat serum LH and FSH concentrations, as previously documented[19]. We prepared samples and standards in pre-coated anti-LH or anti-FSH antibody plates and added biotinylated anti-LH or anti-FSH solution, and then peroxidase-conjugated IgG solutions to the plates. After the detection substrate was added, the plates were read at 450 nm within 30 min. The lower detection limit of LH and FSH was 0.1 mIU/mL; the detection was within the linear range, and the co-variation in detection of LH and FSH was within 10%.
-
For equivalent detection of the pixel density of each antigen, the testis was prepared as a tissue array according to a previously described protocol[19]. The testis was cut into pieces and dehydrated in ethanol and xylene. The dehydrated pieces were embedded in paraffin, and 1.5 mm2 of testis tissue was randomly selected from each sample and assembled in a tissue array mold holding 30 samples (6 per group). The cross section (6 μm) was cut. Ten slides were randomly collected for immunohistochemistry analysis with an immunohistochemical kit (Vector Laboratories, Inc., Burlingame, CA) as previously described[19]. Each slide was boiled at 60 °C for 2 h, de-waxed, and rehydrated with xylene and alcohol. Peroxidase activity was blocked with 3% hydrogen peroxide. Antigens were repaired in citric acid, and the slides were blocked with 10% goat serum for 30 min. CYP11A1, which is expressed in all cells of the Leydig cell lineage[9]; HSD11B1, which is expressed in mature Leydig cells[20]; and SOX9, which is expressed in Sertoli cells[21], were selected as biomarkers for immunohistochemical staining. Anti-CYP11A1, anti-HSD11B1, and anti-SOX9 primary antibodies and subsequently conjugated secondary antibody were incubated with the slides at 4 °C. Diaminobenzidine was added for color development. The sections were counterstained with Mayer hematoxylin. The slides were scanned with a NanoZoomer-XR (Hamamatsu, Japan) at 0.23 μm per pixel to generate digital images.
-
The digital images were displayed in Image-Pro Plus software version 7 (Media Cybernetics, Silver Spring, MD). Cells with positive staining were picked, and Leydig cells and Sertoli cells were identified. The number of CYP11A1-positive Leydig cells, HSD11B1-positive Leydig cells, and SOX9-positive Sertoli cells was calculated through stereological techniques as previously described[22].
-
Leydig cell size increases with maturity[23]. The Leydig cell morphological metrics (cell size, nuclear size, and cytoplasmic area) were calculated as previously described [24]. Immunohistochemical staining for Leydig cells was performed. The digital images were displayed in Image-Pro Plus software. The peripheral contours of a Leydig cell and its nucleus were drawn, and the surface areas of the Leydig cell and its nucleus were exported into a Microsoft Excel spreadsheet by the software. The cytoplasmic size was calculated by subtraction of the nuclear area from the Leydig cell size. Fifty Leydig cells were randomly selected, and the mean value of each sample was calculated.
-
Total RNAs in testis and pituitary samples were prepared with a TRIzol extraction kit, as previously described[25]. The concentration of total RNA was determined by the optical density (OD) value at 260 nm with a NanoDrop2000 spectrophotometer (Thermo Fisher Scientific, CA). The purity of total RNA was calculated according to the OD260/OD280 ratio. Total RNA was used to prepare cDNA templates through reverse transcription[25]. The expression of each gene was measured by qPCR as described previously[19]. The following genes were analyzed. Leydig cell genes: 1) a growth factor (Insl3), 2) receptors (Lhcgr and Scrab1), 3) a cholesterol transport regulator (Star), 4) androgen synthases (Cyp11a1, Hsd3b1, Cyp17a1, and Hsd17b3), 5) a glucocorticoid steroidogenic enzyme (Hsd11b1), and 6) a transcription factor (Nr5a1); Sertoli cell genes: 1) a growth factor (Dhh), 2) a receptor (Fshr), and 3) a transcription factor (Sox9); and antioxidant enzyme genes: Sod1, Sod2, Gpx1, and Cat; anti-apoptotic and pro-apoptotic genes: 1) an anti-apoptosis gene (Bcl2) and 2) a pro-apoptosis gene (Bax); pituitary genes: 1) hormones (Lhb and Fshb), and 2) a receptor (Gnrhr); and internal house-keeping genes: Rps16 and Gapdh. After qPCR, Ct values were exported into an Excel spreadsheet for standards and samples, and the expression levels of the target genes were determined according to the standard curve as previously described[25]. No statistical difference in Rps16 or Gapdh was observed between groups. The gene Rps16 was finally selected for normalization [19].
-
Western blotting was used for the detection of testicular proteins as previously described[19]. Briefly, tissue lysate was prepared, and protein was quantified with a BCA kit. An aliquot of protein (30 μg) from each sample was added to a 10%–12% PAGE gel, and electrophoresis was performed. The proteins were electrically transferred onto a nitrocellulose membrane. The membranes were subjected to western blotting to detect the following proteins: CYP11A1, HSD11B1, INSL3, DHH; mTOR, AKT1, AKT2, ERK1/2, GSK3β, phosphorylated mTOR (pmTOR), phosphorylated AKT1 (pAKT1), phosphorylated AKT2 (pAKT2), phosphorylated GSK3β (pGSK3β), phosphorylated ERK1/2 (pERK), SIRT1, and GAPDH (an internal control). Enhanced chemiluminescence was detected with an enhanced chemiluminescence kit (Amersham, Arlington Heights, IL). The protein density was quantified in Image-Lab (Bio-Rad), and GAPDH was used for normalization.
-
Semi-quantitative immunohistochemical measurement of protein density was performed as previously described[26]. In brief, the digital images were displayed in Image-Pro plus software, and the protein was selected, and a nearby negative background area was selected for subtraction. The pixel density of CYP11A1 and SOX9 was exported by the software to determine the protein levels in individual cells. Fifty pairs of densities per sample were measured and calculated for mean value as a sample size. Optical density (in arbitrary units) represents the ratio of IOD/area for proteins.
-
MDA is a decomposition product of tri-unsaturated fatty acid hydroperoxides and is a biomarker of ROS[27]. The amount of MDA in testicular homogenates was measured with a kit (Solarbio Science and Technology Co, Beijing, China) as previously described[27]. In brief, 100 mg of testicular tissue was prepared for homogenization in the extraction solution. The solution was centrifuged at 8,000 ×g in a 4 °C centrifuge for 10 min. The supernatant was used for measurement of MDA with the kit. The plates were read at 450, 532, and 600 nm with a Bio-Tek microplate reader (Shanghai, China). The amount of MDA (mmol/g testis) was calculated with the following Formula: 5 × (12.9 × (ΔA532 – ΔA600) – 2.58 × Δ450)/0.1.
-
To study the direct effects of BBOP, we used 35-day-old male Sprague Dawley rats to purify Leydig cells, as previously described[9]. The testes were removed and perfused with a collagenase D solution (0.1 mg/mL) through the testicular artery. The testis was further digested with collagenase D (0.25 mg/mL) and DNase (0.25 mg/mL). The cell suspension was filtered with a 100 μm nylon mesh and centrifuged through a Percoll gradient, and cells in the density range of 1.070–1.088 g/mL were harvested. HSD3B1 staining was performed as previously described to determine the purity of Leydig cells[28]. Leydig cells were transferred to a 12-well culture plate at a cell density of 1.0 × 10⁶ cells/well, and 1 mL of DMEM/F12 medium was added to the well. After 24 h, the cells attached to the bottom of the well, and the medium was switched to DMEM/F12 medium containing BBOP (0, 50, 100, and 500 μmol/L) for another 24 h. The highest concentration, 500 µmol/L, was water soluble.
-
ROS levels were measured with a DCFH-DA test kit (Solarbio, Beijing, China), as previously described[29]. In brief, after Leydig cells were harvested, they were incubated with DCFH-DA in a dark room at 37 °C for 20 min, and then the fluorescence intensity was measured in a flow cytometer for ROS. The apoptosis rate was measured with an Annexin V-FITC/PI Apoptosis Detection Kit (MultiSciences Biotech Co., Hangzhou, China) as previously described[29]. Leydig cells were incubated with FITC-labeled Annexin V and PI. The apoptotic rate was measured with a flow cytometer.
-
Data are expressed as mean ± standard error (SEM). GraphPad 8 (San Diego, CA) was used for statistical analysis and graphing. Statistical evaluation was performed with one-way analysis of variance followed by Dunnett’s post hoc multiple comparison test. The significance level was set as P < 0.05.
-
Rats were exposed to BBOP (0, 10, 100, 250, or 500 mg/kg bw per day) through daily gavage during puberty (PND 35 to PND 56, Figure 1A). Compared with the control, exposure to BBOP for 21 days did not affect body weight or testis weight in rats at PND 56. BBOP significantly decreased the weight of the epididymis at doses of 250 (P < 0.05) and 500 (P < 0.01) mg/kg (Table 1). No mortality was observed in any rat group, and no abnormal behavior was observed.
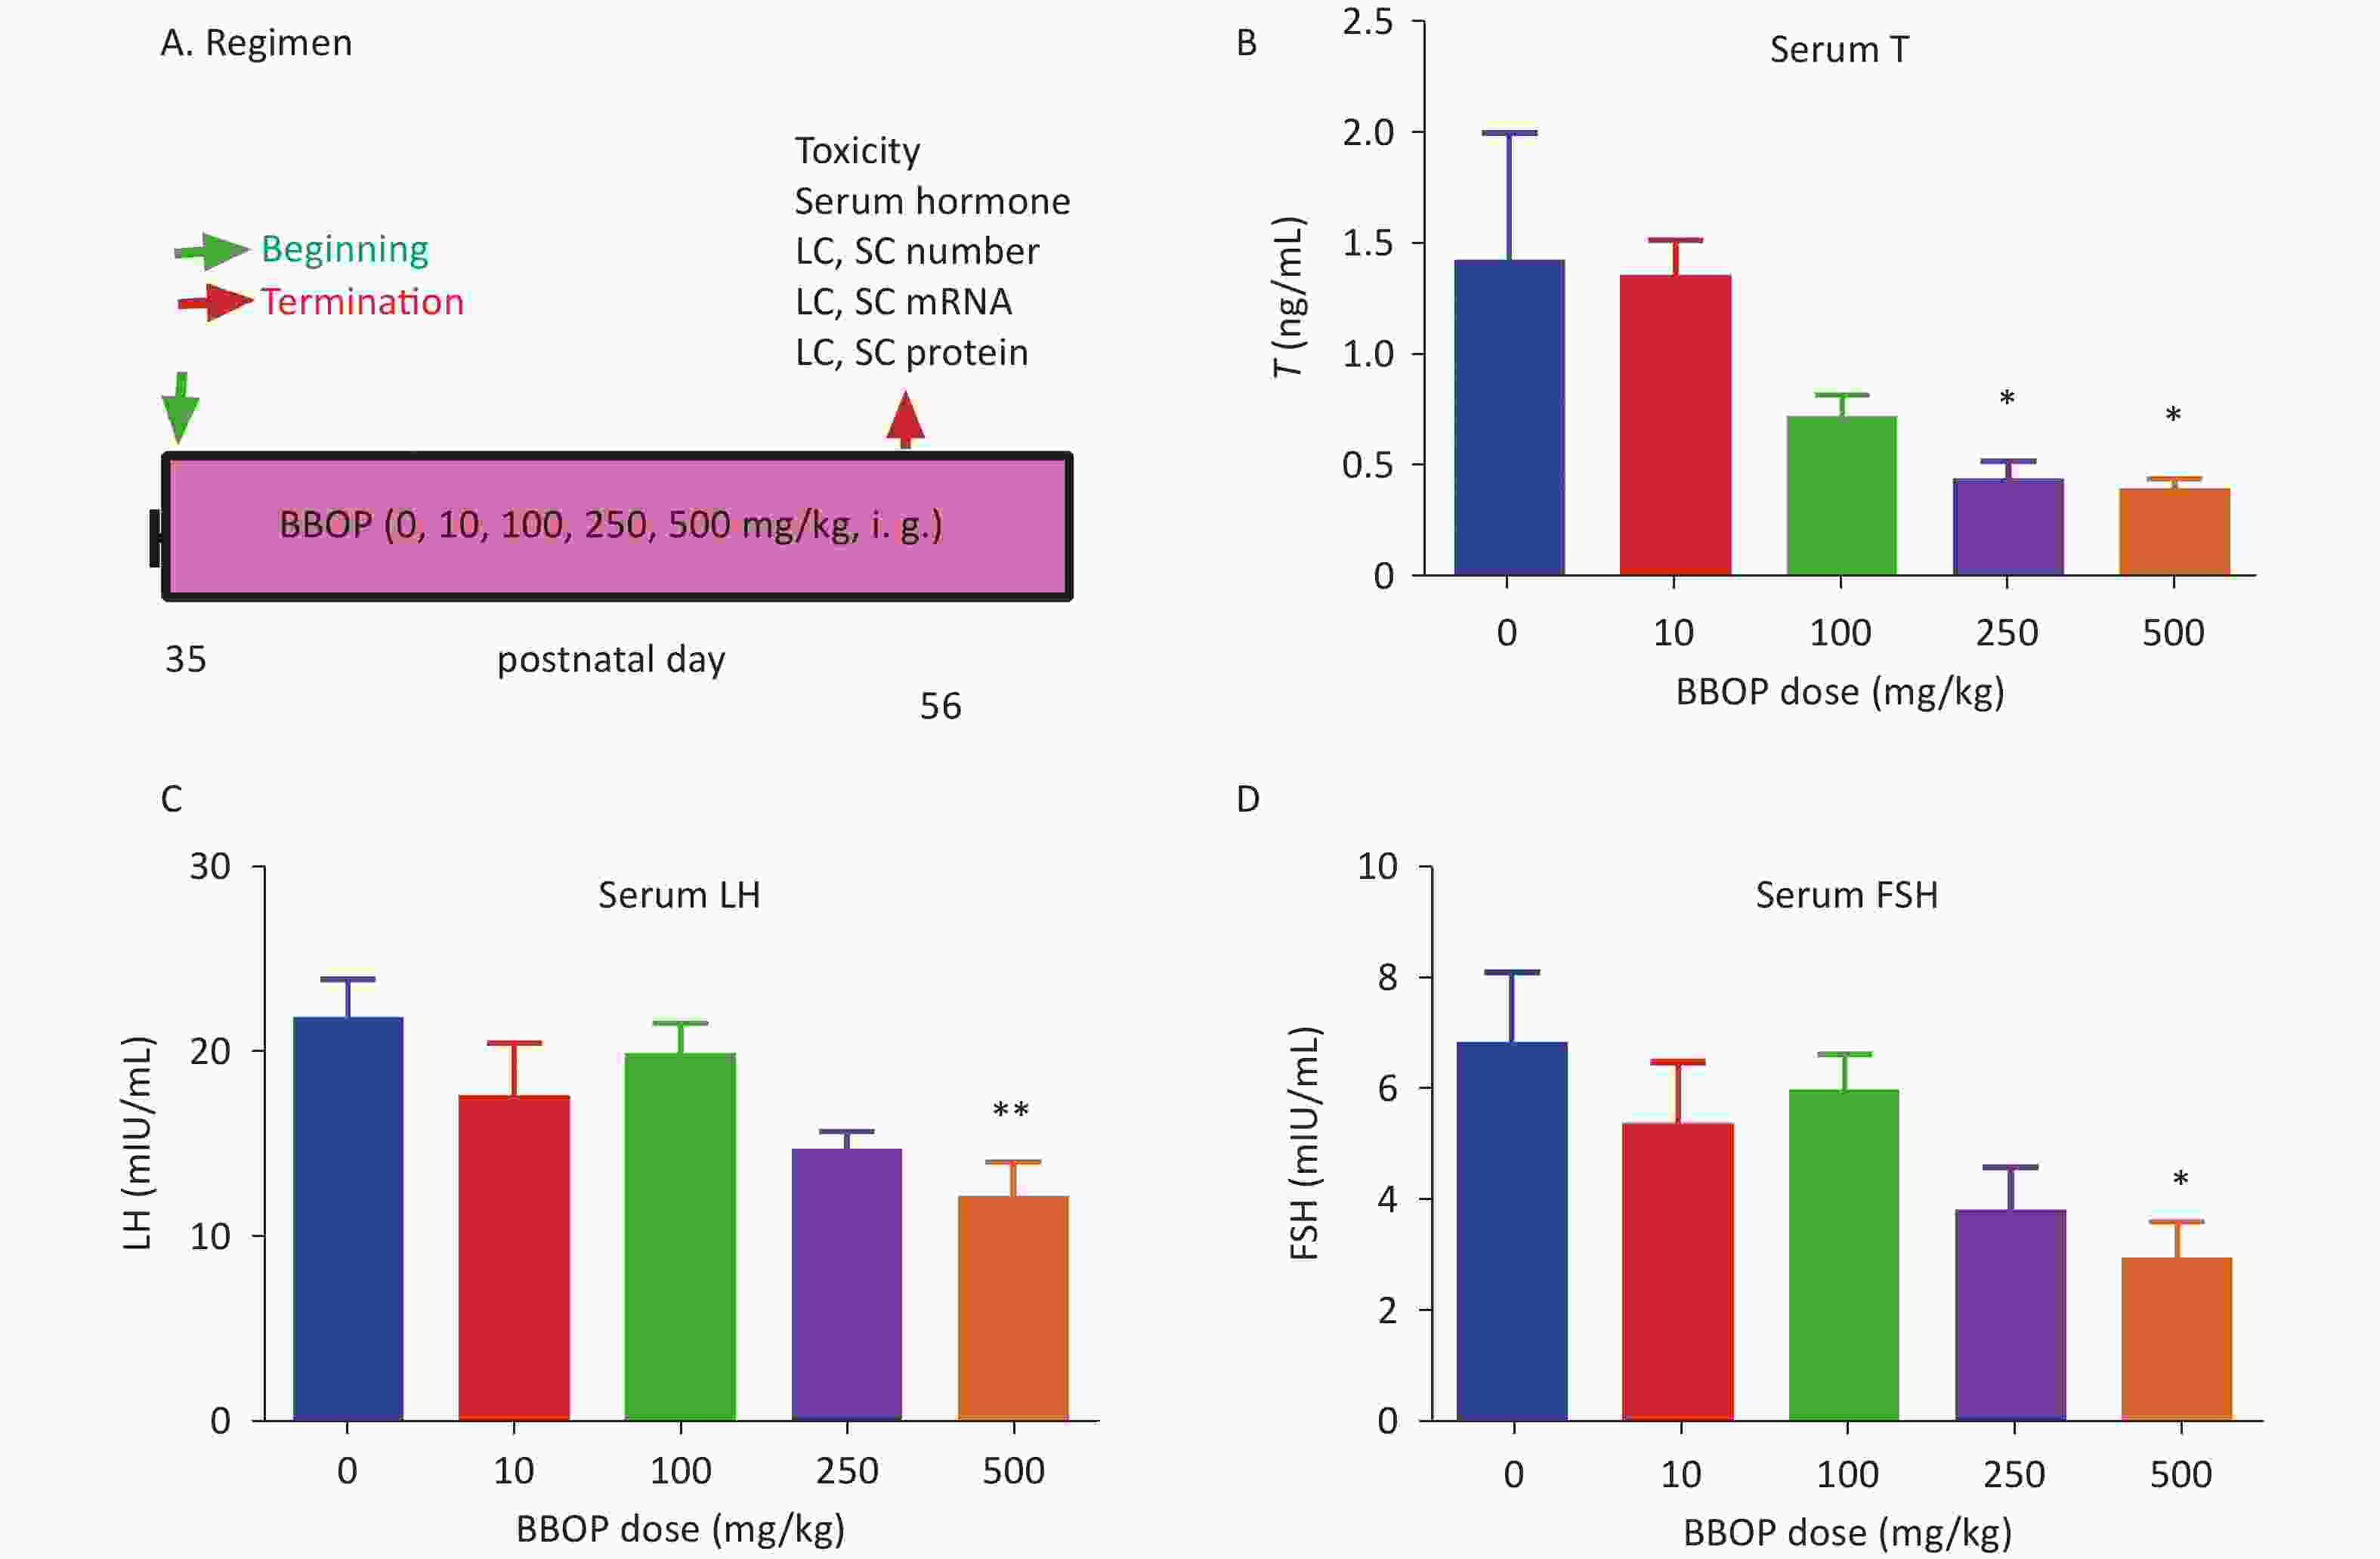
Figure 1. Regimen and serum testosterone (T), luteinizing hormone (LH), and follicle-stimulating hormone (FSH) levels after BBOP exposure in puberty. Panel A, BBOP (0, 10, 100, 250, or 500 mg/kg bw per day) was administered via gavage; Panels B–D, serum T, LH, and FSH levels, respectively. Mean ± SEM, n = 6; *P < 0.05 and **P < 0.01 in the BBOP group versus control (0 mg/kg).
Parameters BBOP [mg/(kg·day)] 0 10 100 250 500 Number 6 6 6 6 6 mortality (%) 0 0 0 0 0 BW (g) before 213.3 ± 9.3 218.3 ± 8.2 211.8 ± 11.8 204.3 ± 8.0 218.0 ± 4.8 BW (g) after 316.8 ± 20.2 321.7 ± 24.4 335.0 ± 14.4 317.5 ± 14.2 304.3 ± 18.3 Testis weight (g) 1.55 ± 0.08 1.45 ± 0.11 1.53 ± 0.10 1.53 ± 0.10 1.47 ± 0.09 Relative testis weight (g) 1.54 ± 0.07 1.42 ± 0.14 1.543 ± 0.10 1.543 ± 0.10 1.479 ± 0.07 Both epididymis weight (g) 0.81 ± 0.07 0.73 ± 0.04 0.76 ± 0.05 0.72 ± 0.05* 0.70 ± 0.03** Note. BW = body weight. Values are mean ± SEM, n = 6. *, **Indicate significant difference when compared to the control [0 mg/(kg·day) BBOP] at P < 0.05 and 0.01, respectively. Table 1. General parameters of toxicity after treatment of BBOP in puberty
-
BBOP affected serum testosterone levels, which were significantly lower than those in the control groups after treatment with BBOP at 250 and 500 mg/kg bw per day (P < 0.05, Figure 1B). Therefore, BBOP delays puberty onset by inhibiting testosterone biosynthesis. To check whether BBOP affects the development of Leydig cells by acting on the pituitary in the hypothalamus-pituitary testis axis, we measured serum LH and FSH levels. BBOP at 500 mg/kg bw per day significantly decreased the levels of LH (P < 0.01, Figure 1C) and FSH (P < 0.05, Figure 1D), mg/kg bw per day thus indicating that BBOP at the highest dose inhibited gonadotropin secretion.
-
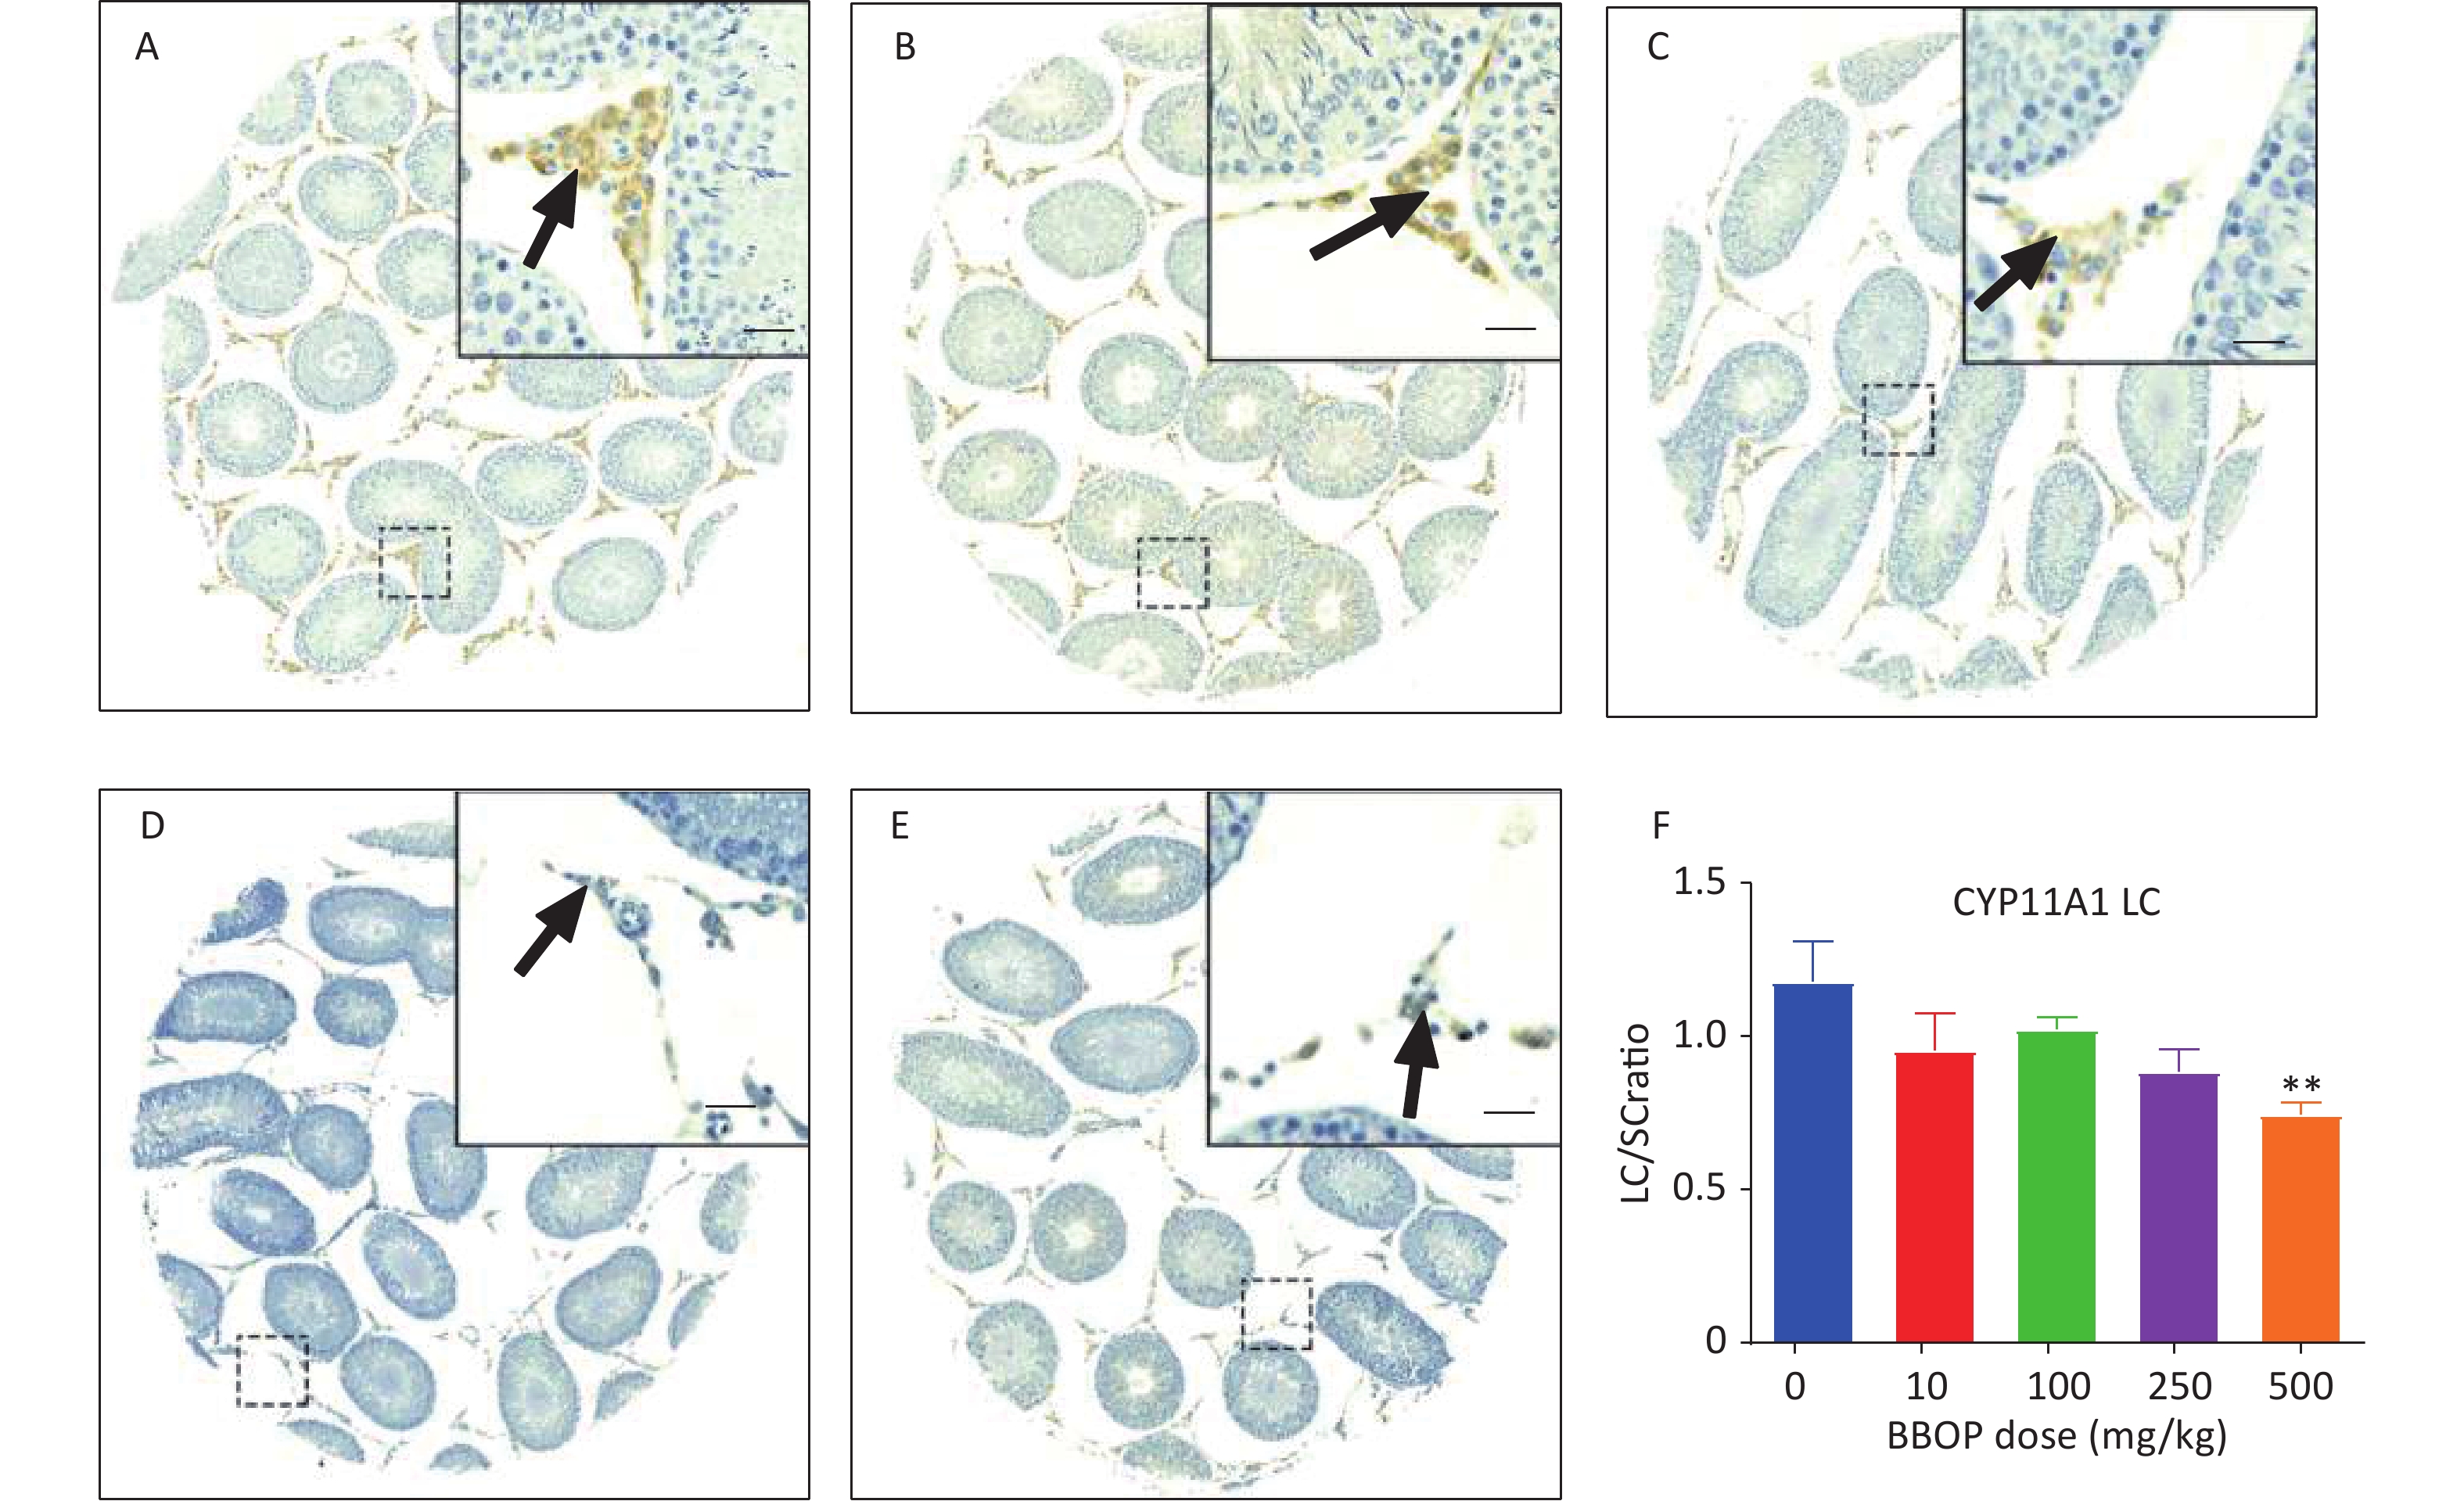
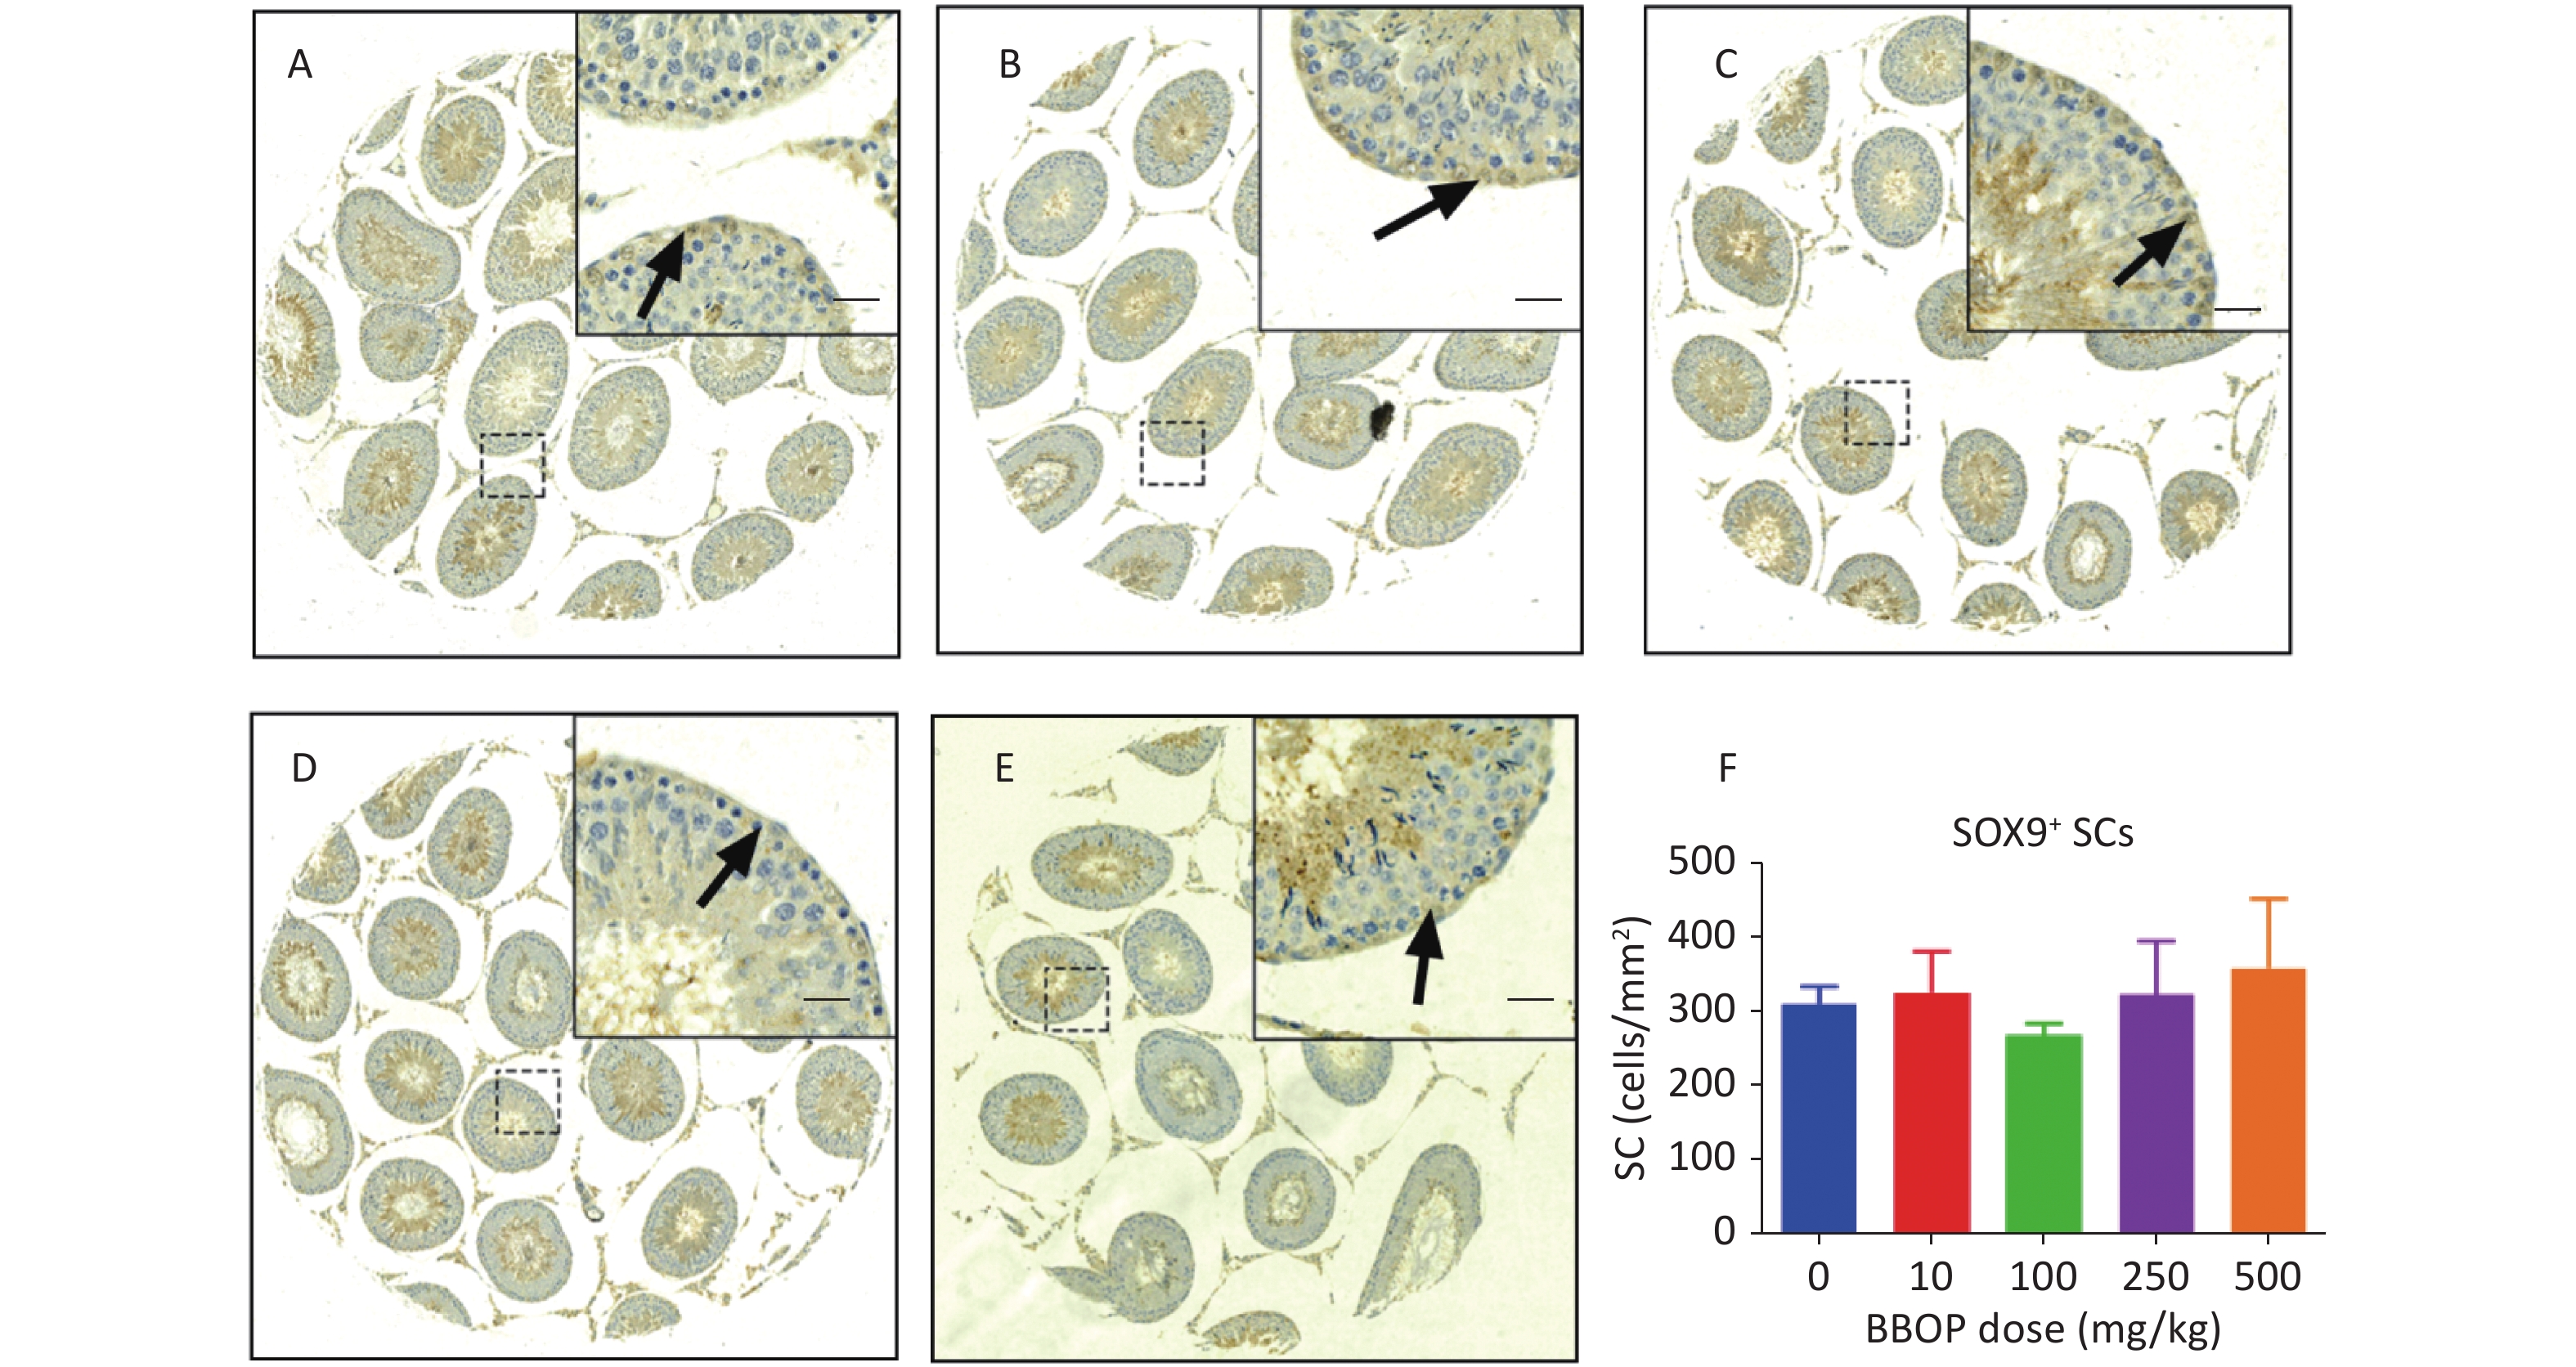
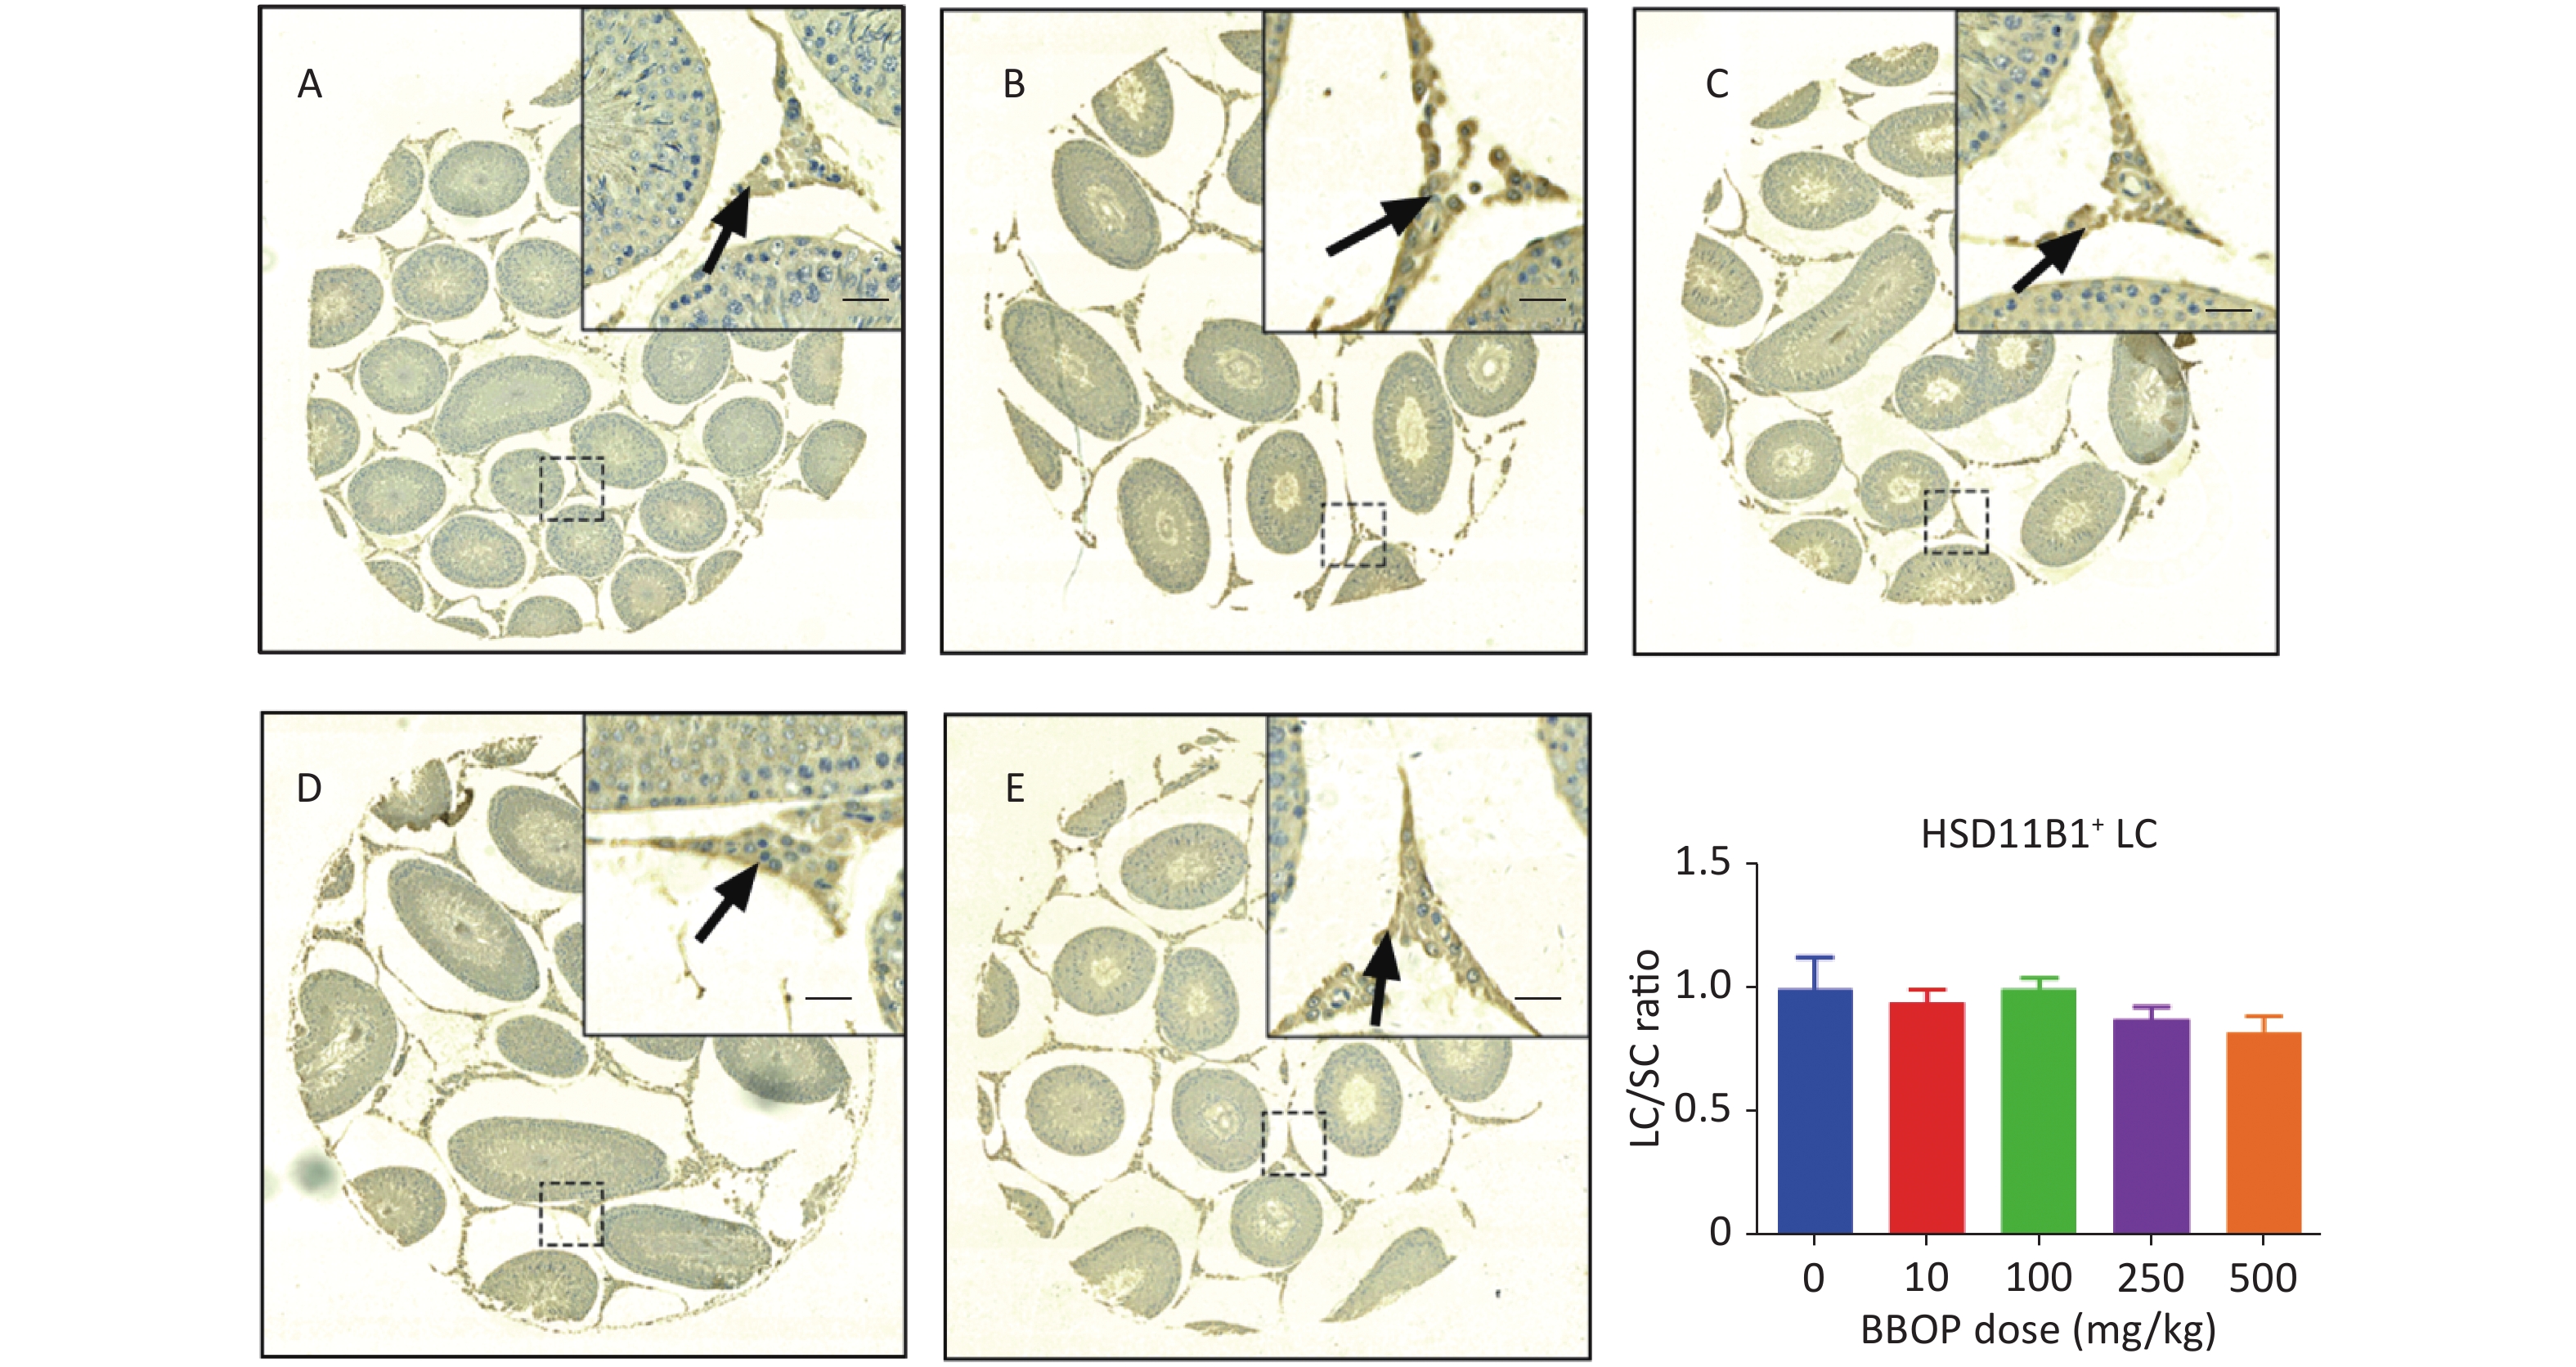
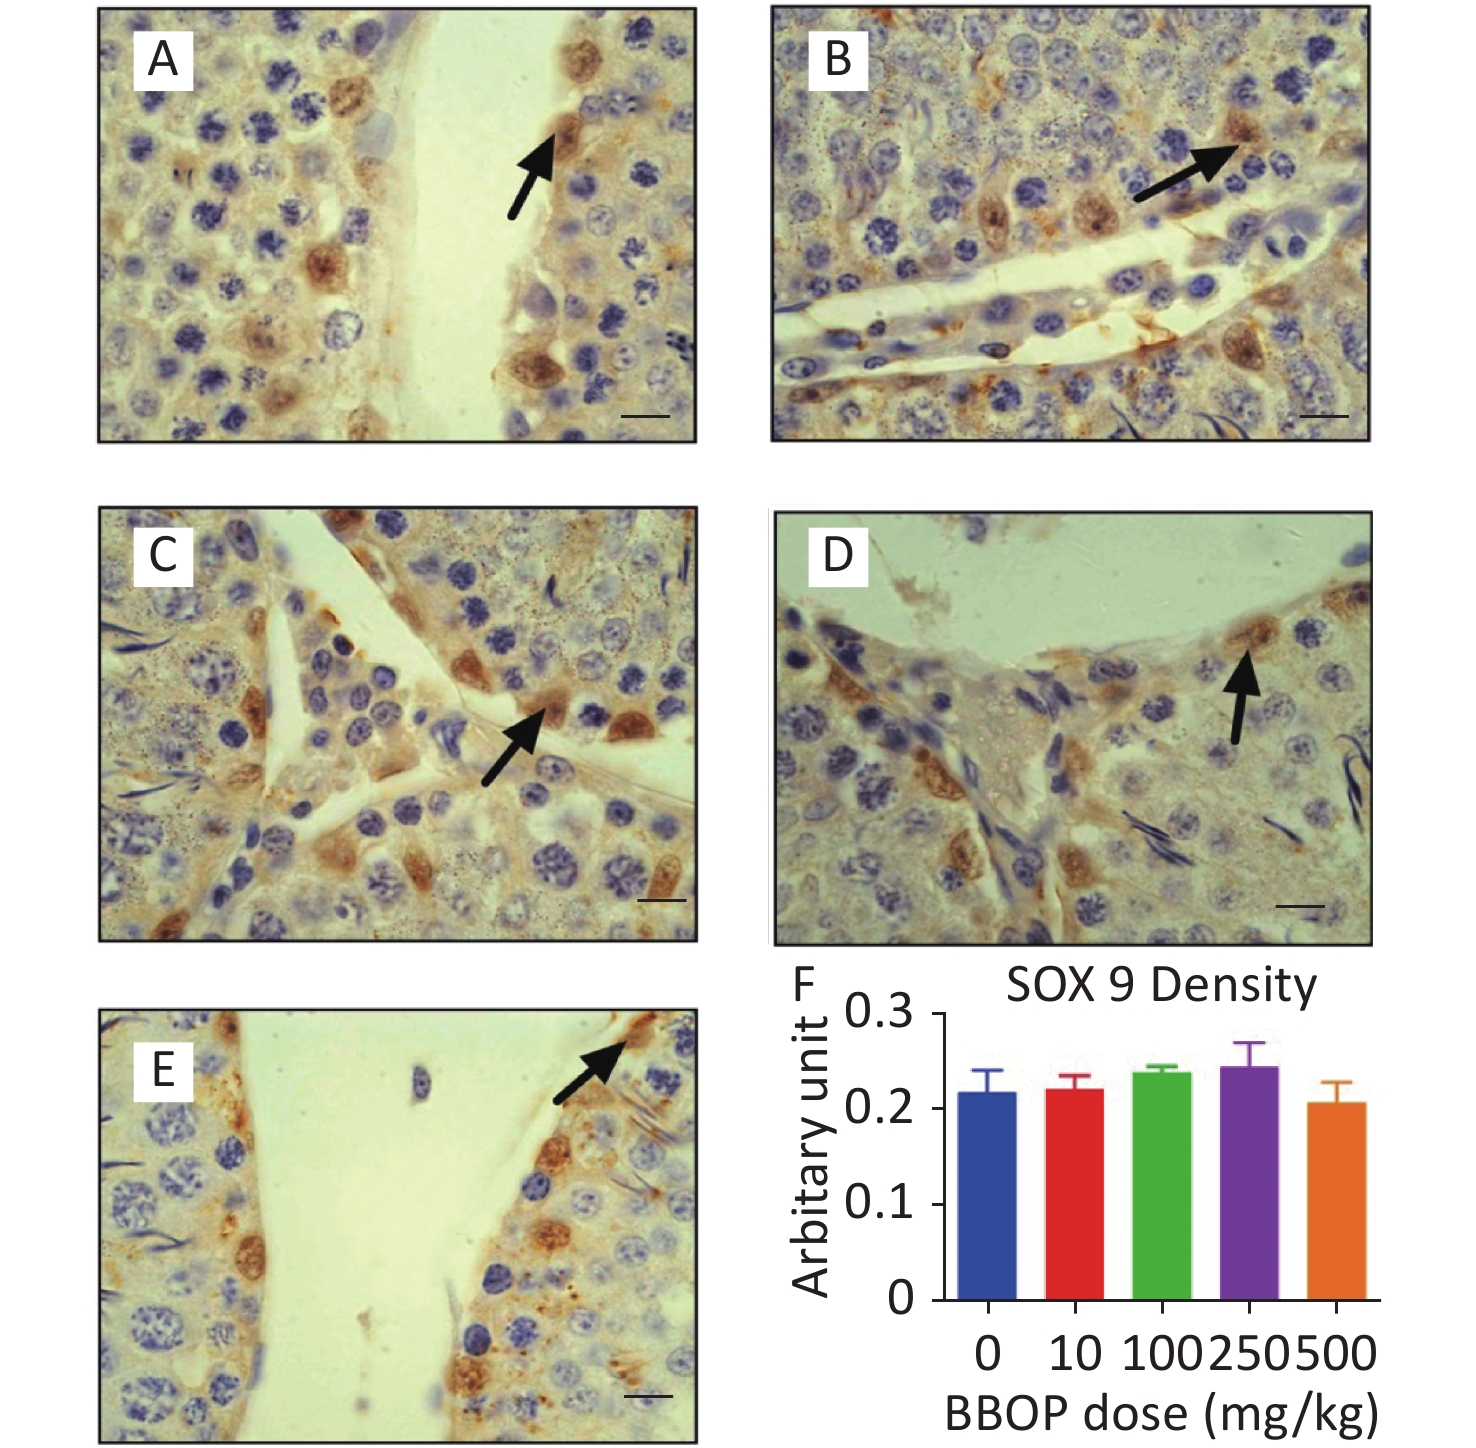
Sertoli cells were stained with anti-SOX9 antibody, which detected SOX9, a biomarker of Sertoli cells[30]. Compared with the control, BBOP did not alter the number of SOX9+ Sertoli cells (Supplementary Figure S1, available in www.besjournal.com). Because Sertoli cells do not proliferate after PND 21[31], the unaltered Sertoli cell number after BBOP treatment indicated that BBOP did not induce Sertoli cell apoptosis. CYP11A1, a steroidogenic enzyme in all cells in the Leydig cell lineage[9], is used as a universal biomarker to detect all Leydig cells. HSD11B1 is a steroidogenic enzyme in mature Leydig cells [32] that is used as a specific biomarker to detect Leydig cell maturity. BBOP exposure at 500 mg/kg bw per day markedly decreased the number of CYP11A1+ Leydig cells mg/kg bw per day (P < 0.01, Figure 2). However, no significant difference was observed in HSD11B1+ Leydig cells between the BBOP groups and the control (Supplementary Figure S2, available in www.besjournal.com). Therefore, BBOP affects the number of CYP11A+/HSD11B1- progenitor Leydig cells.
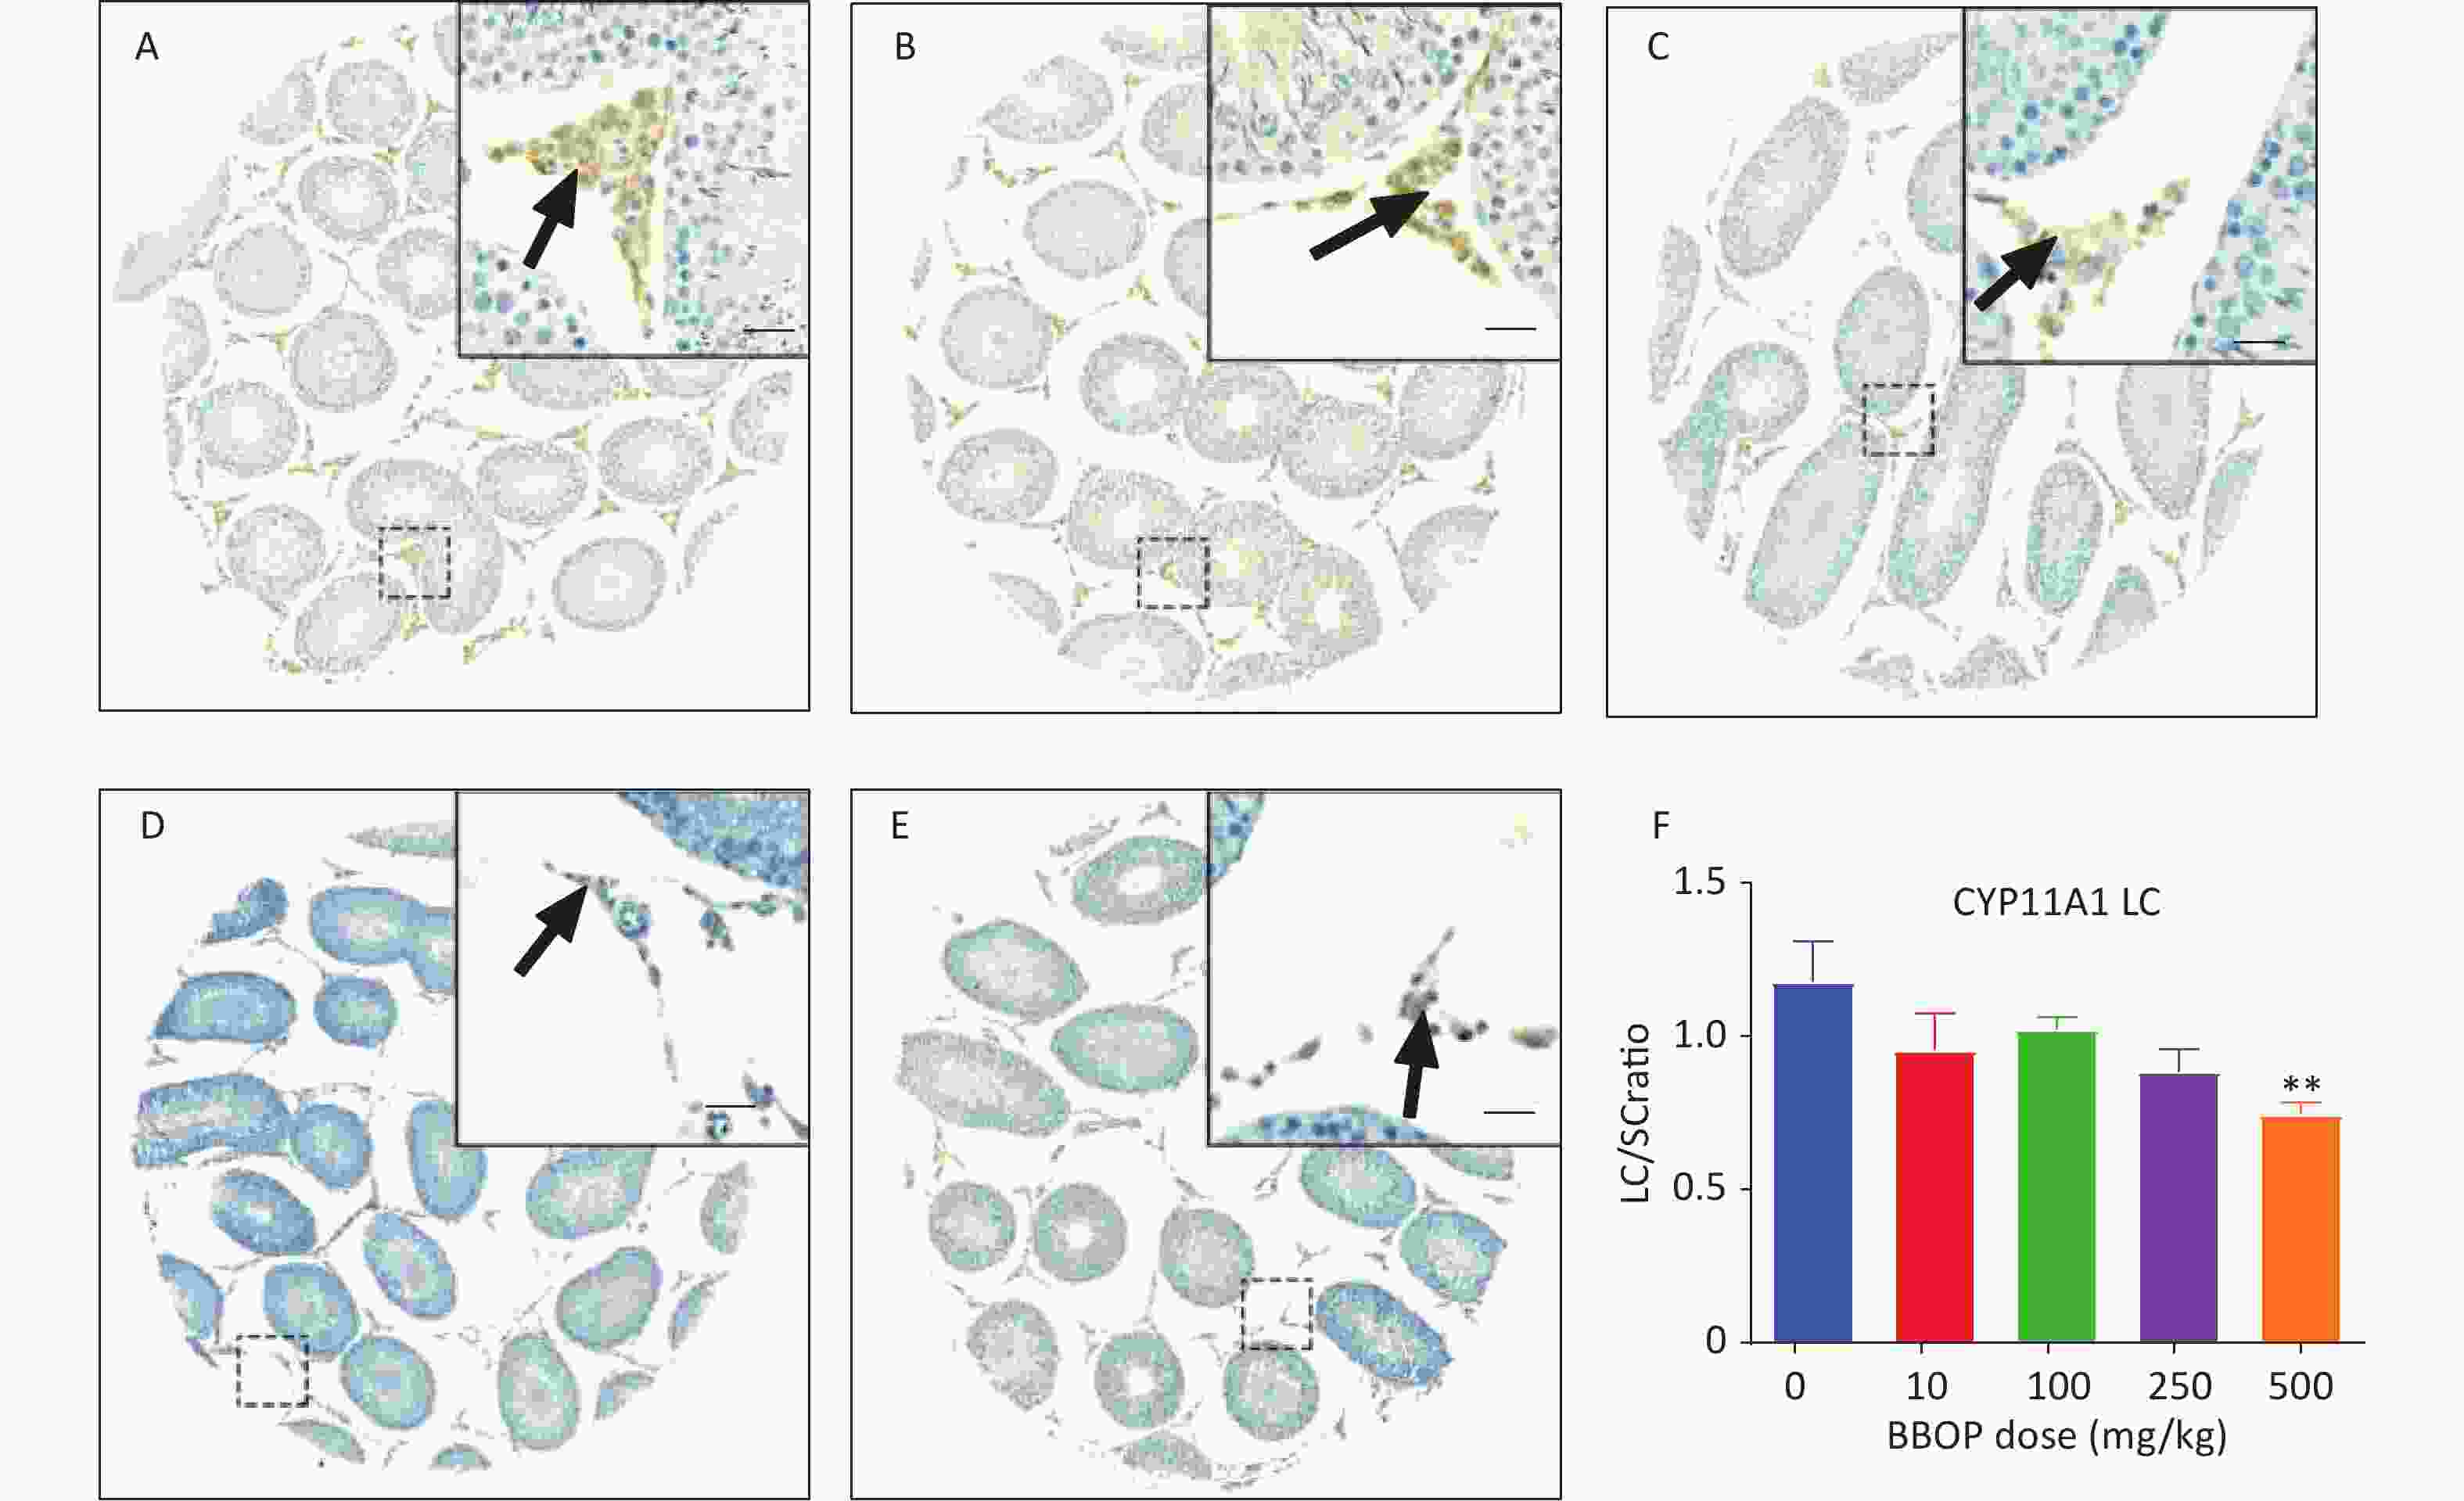
Figure 2. Immunohistochemical staining of CYP11A1 and the number of Leydig cells (LC). The LC number was normalized to that of Sertoli cells (SC). Panels A–E, CYP11A1 staining of the 0, 10, 100, 250, and 500 mg/kg bw per day BBOP groups, respectively. Black arrow indicates CYP11A1. Scale bar = 20 μm. Panel F, quantitative number. Mean ± SEM, n = 6. **P < 0.01 in the BBOP group versus the control (0 mg/kg).
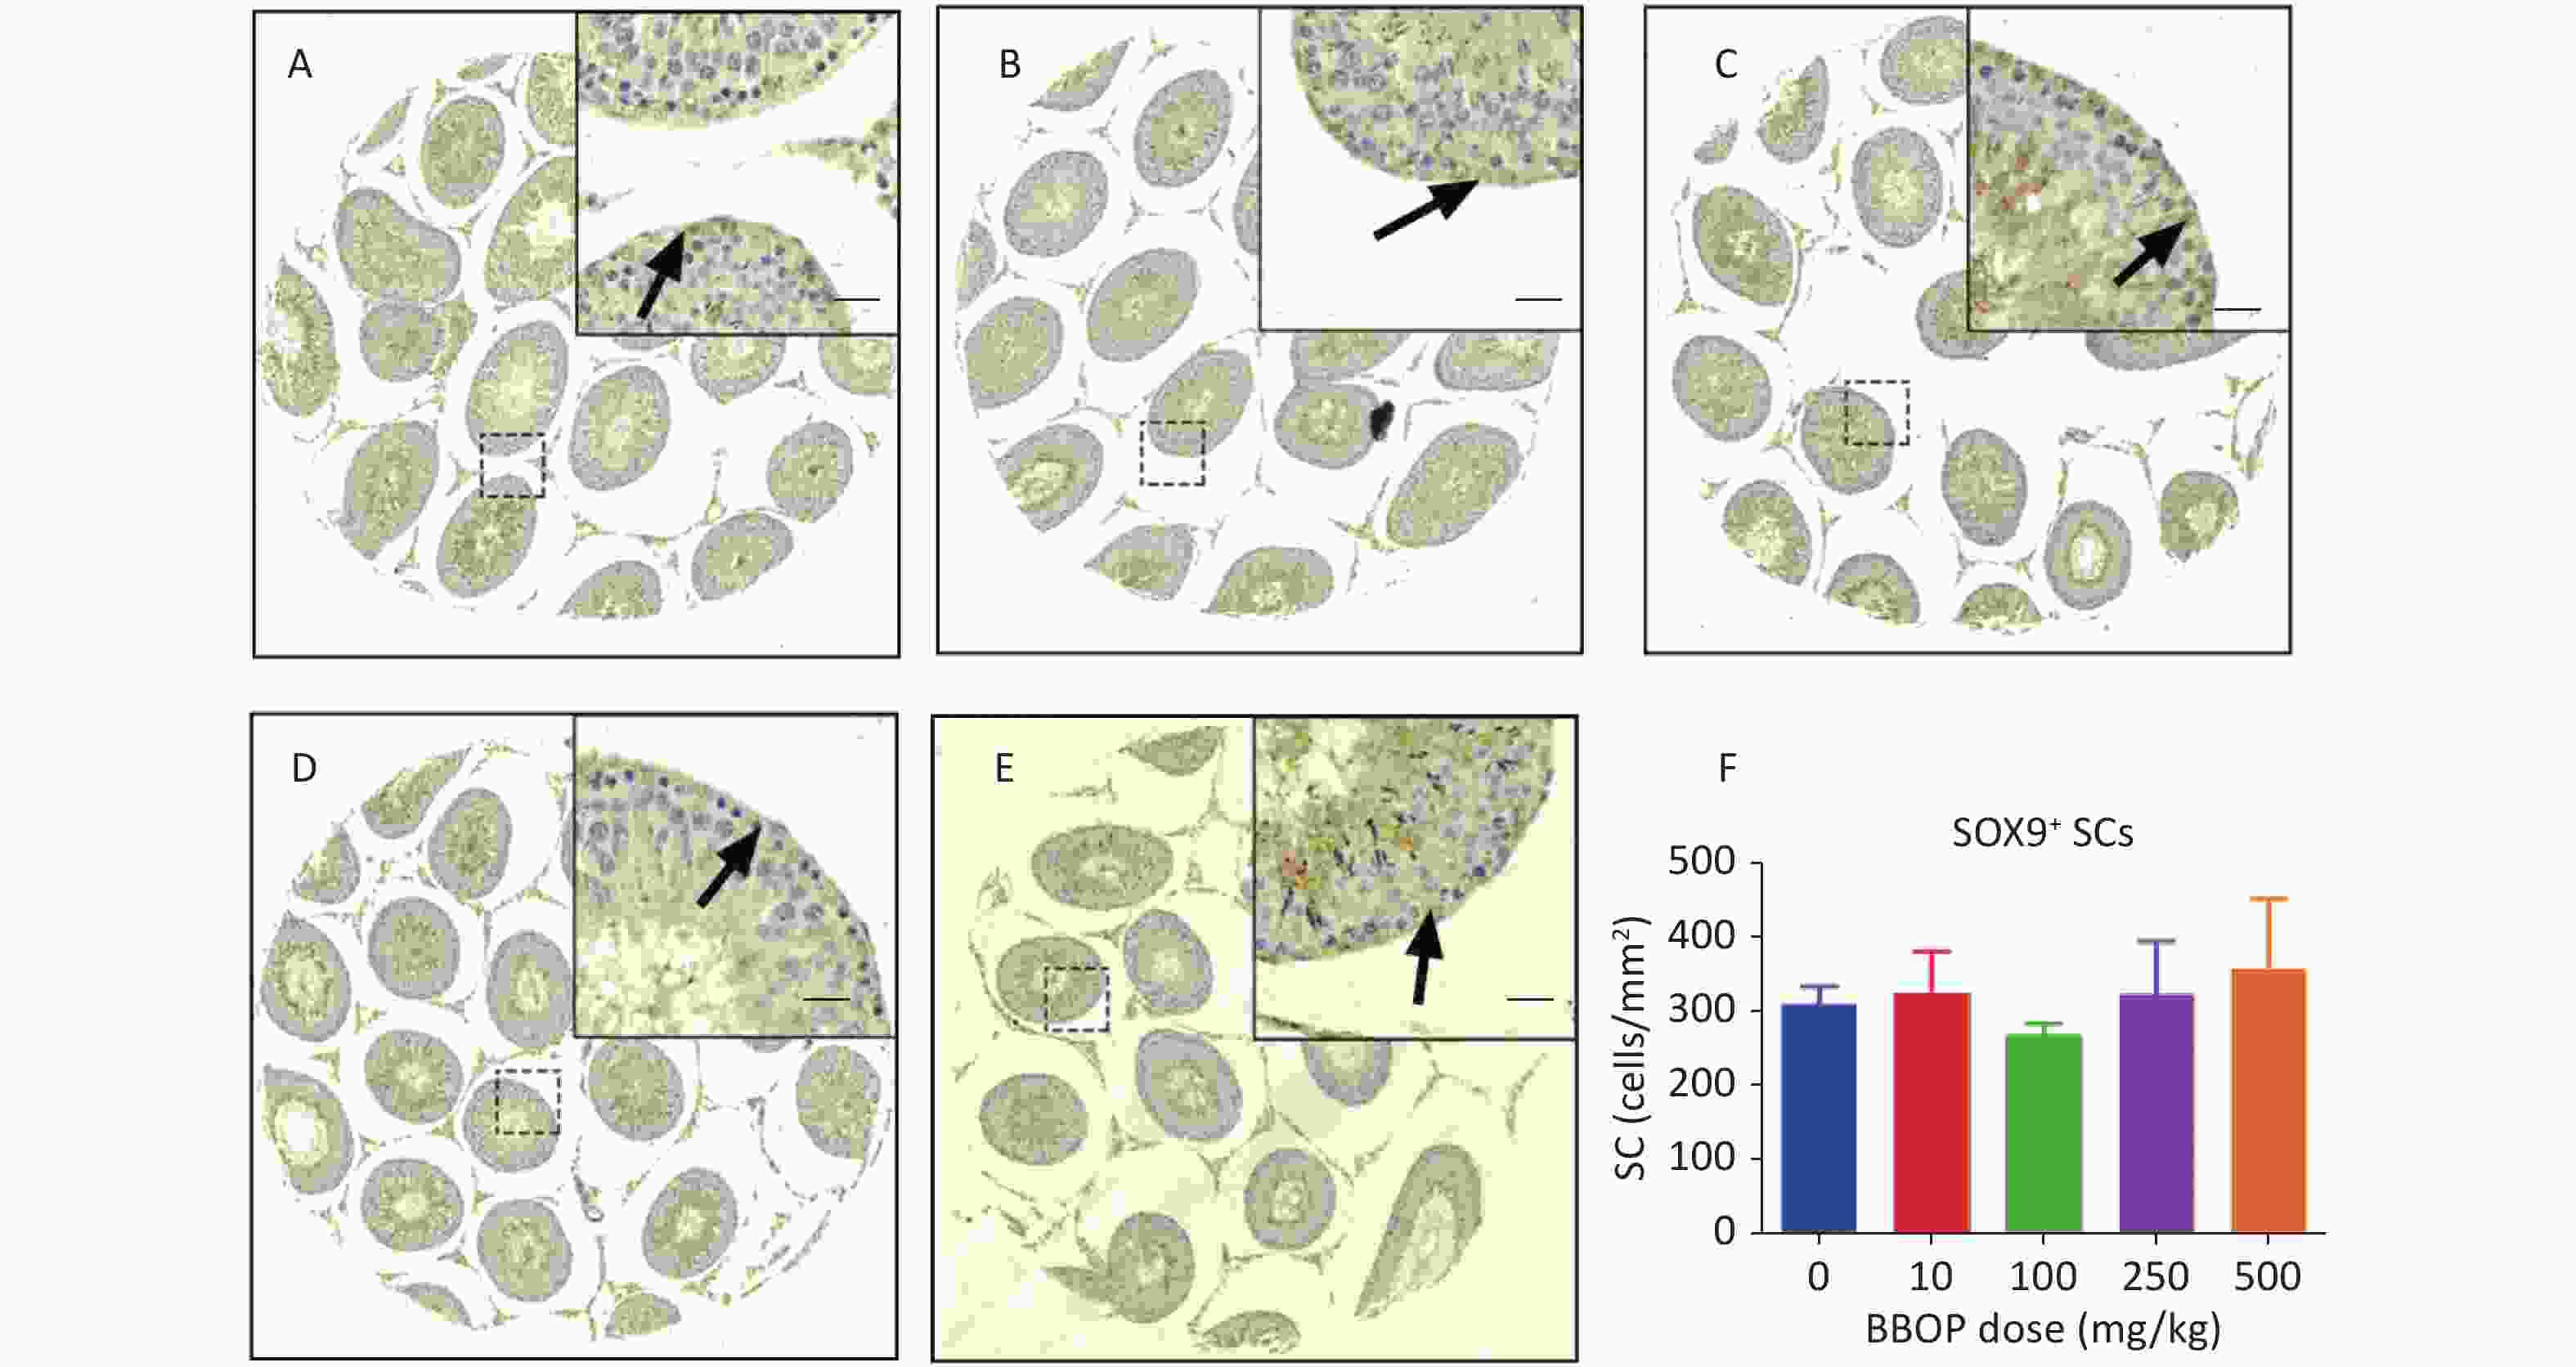
Figure S1. Immunohistochemical staining of SOX9 and Sertoli cell (SC) number in the testis after BBOP exposure from postnatal day (PND) 35 to 56 Panels A–E, SOX9 staining for 0, 10, 100, 250, and 500 mg/kg BBOP group, respectively; Black arrow points to SOX9 staining; Scale bar = 20 μm; Panel F, quantitation of SC number; Mean ± SEM, n = 6. There was no significant difference in the BBOP group versus the control (0 mg/kg).
-
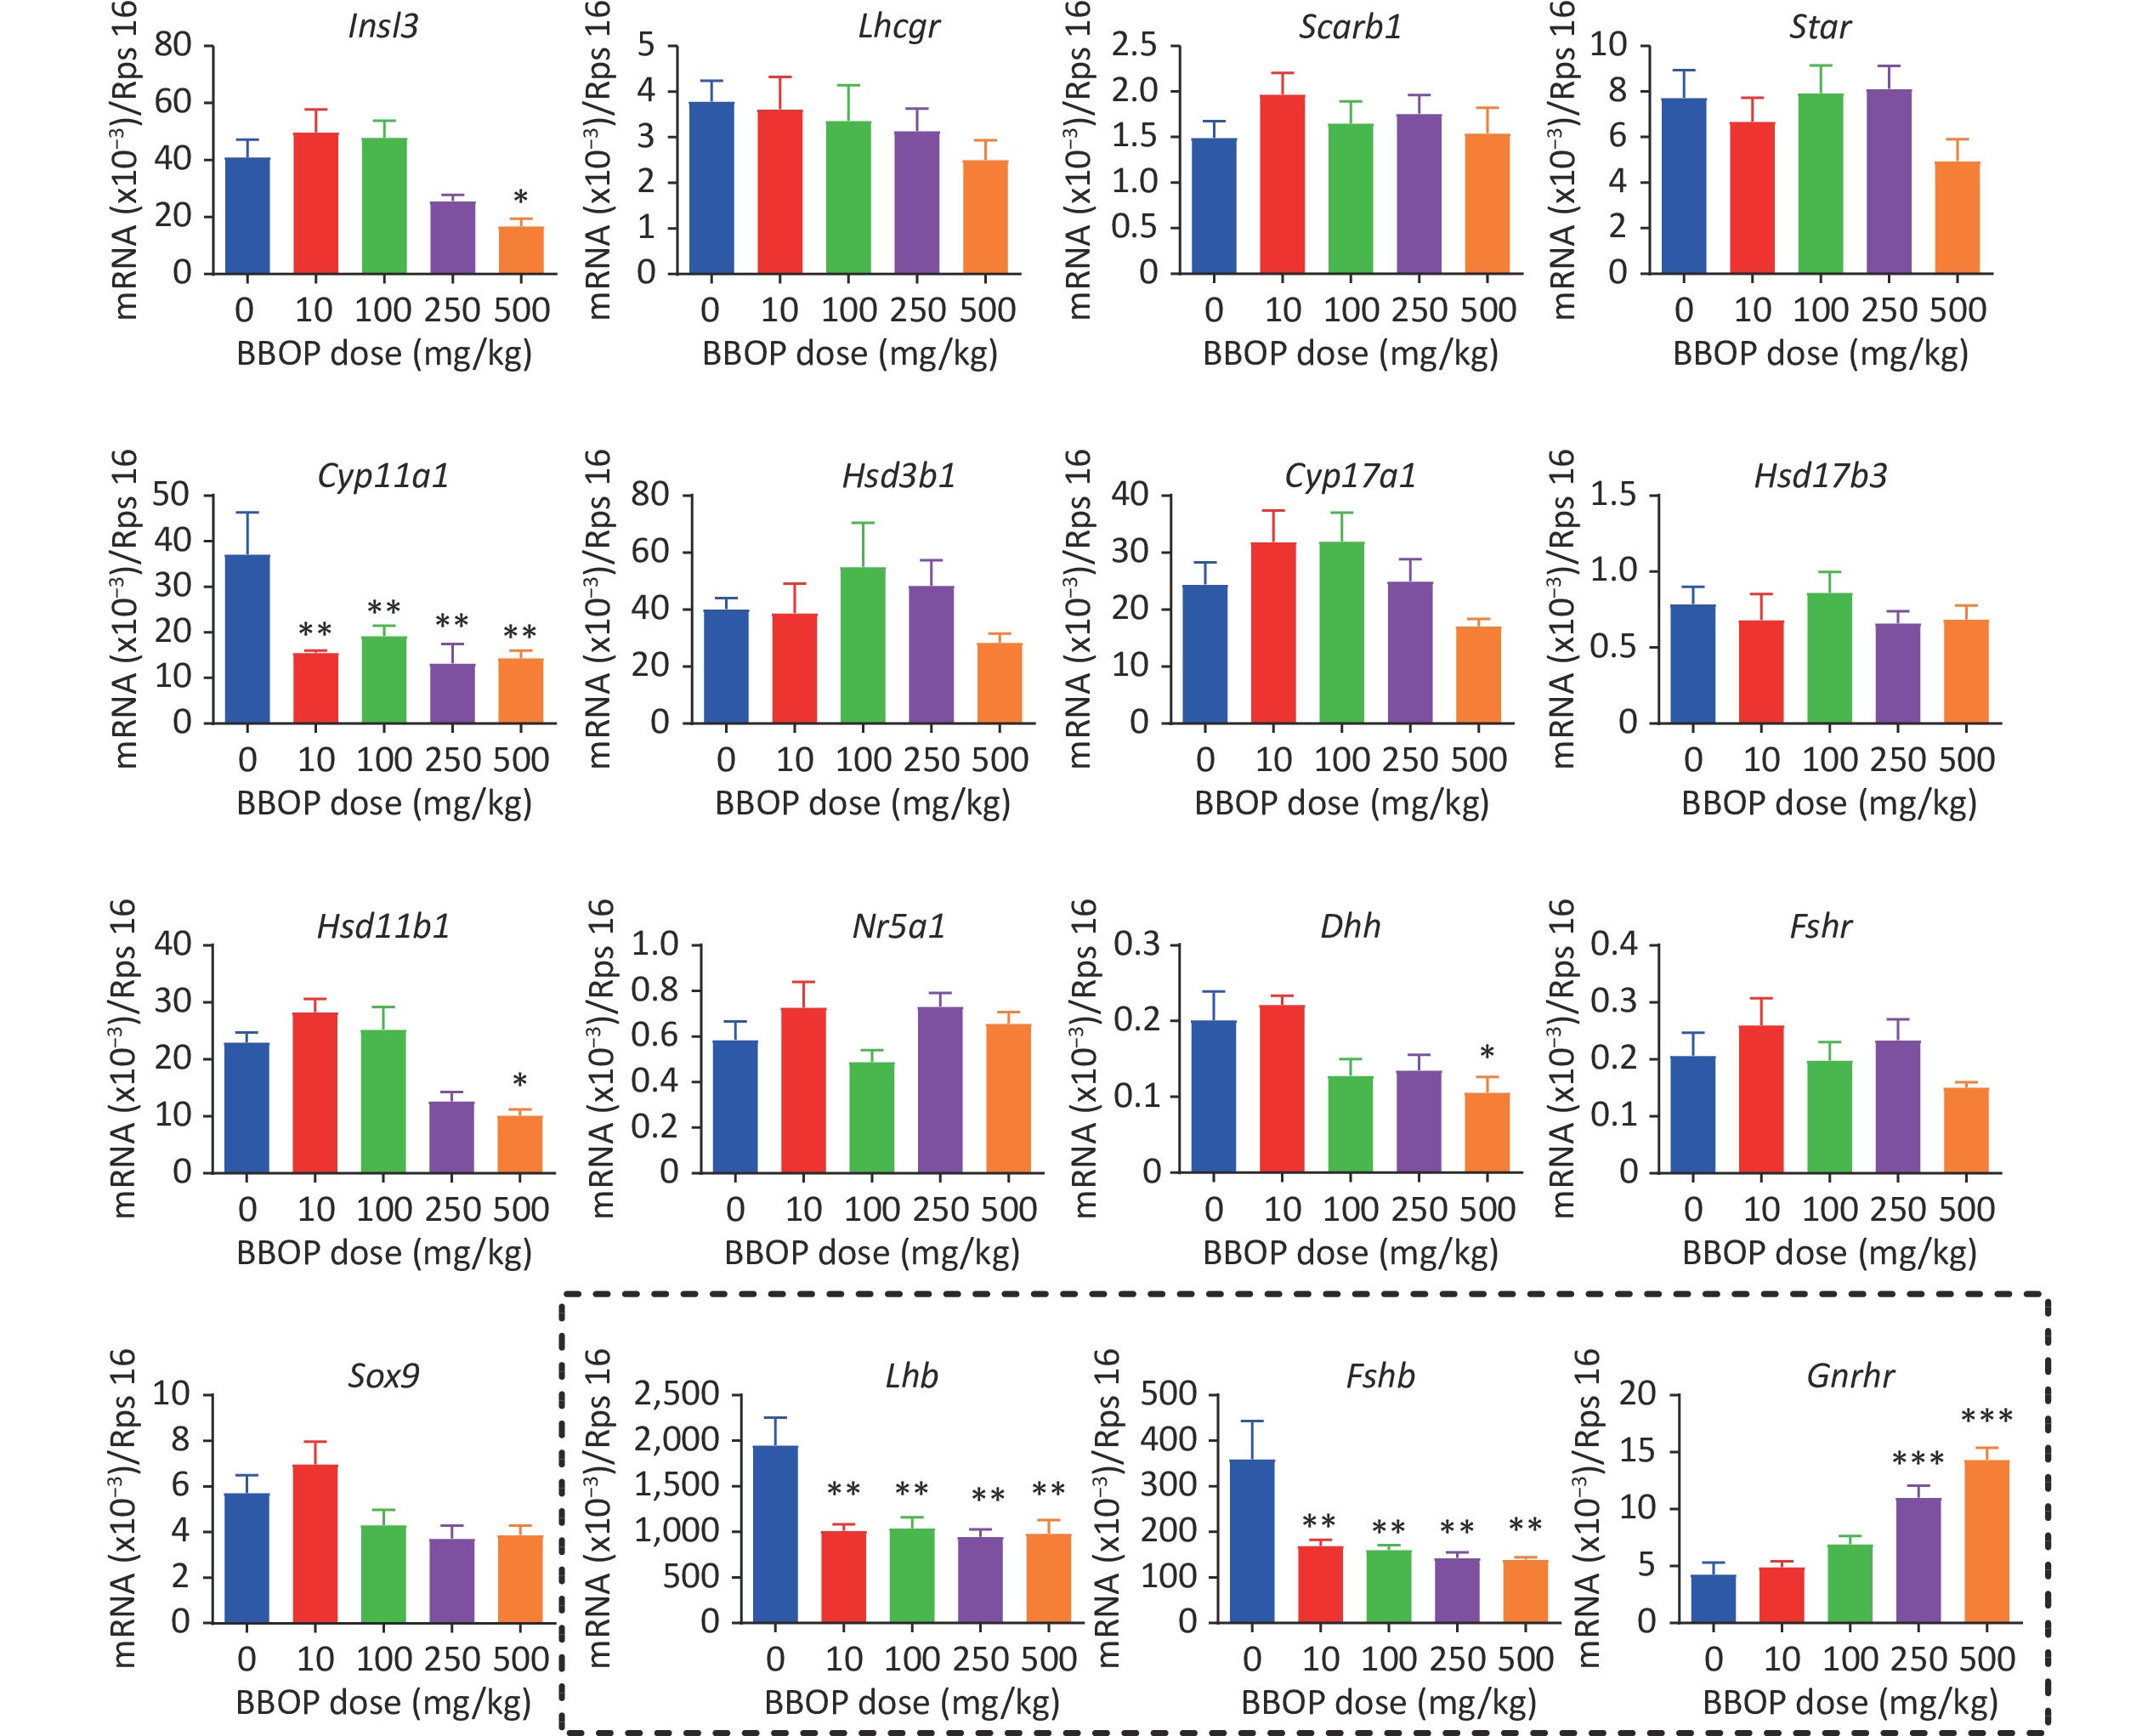
The expression of Leydig cell genes (Insl3, Lhcgr, Scarb1, Star, Cyp11a1, Hsd3b1, Cyp17a1, Hsd17b3, Hsd11b1, and Nr5a1) and Sertoli cell genes (Dhh, Fshr, and Sox9) was determined by qPCR. BBOP significantly decreased the transcript levels of Cyp11a1 at doses of 10 mg/kg or higher (P < 0.01), and the mRNA levels of Insl3, Hsd11b1, and Dhh at a dose of 500 mg/kg bw per day (P < 0.05, Figure 3), thus indicating that BBOP interferes with the expression of some Leydig cell and Sertoli cell genes. Because BBOP decreased the levels of serum LH and FSH, we asked whether BBOP might affect the expression of the pituitary genes Lhb, Fshb, and Gnrhr in the pituitary gland. BBOP markedly down-regulated the expression of Lhb and Fshb at doses of 10 mg/kg and above (P < 0.01), whereas it up-regulated the expression of Gnrhr at doses of 250 and 500 mg/kg bw per day (P < 0.001, Figure 3), thereby indicating that BBOP interferes with pituitary gene expression.
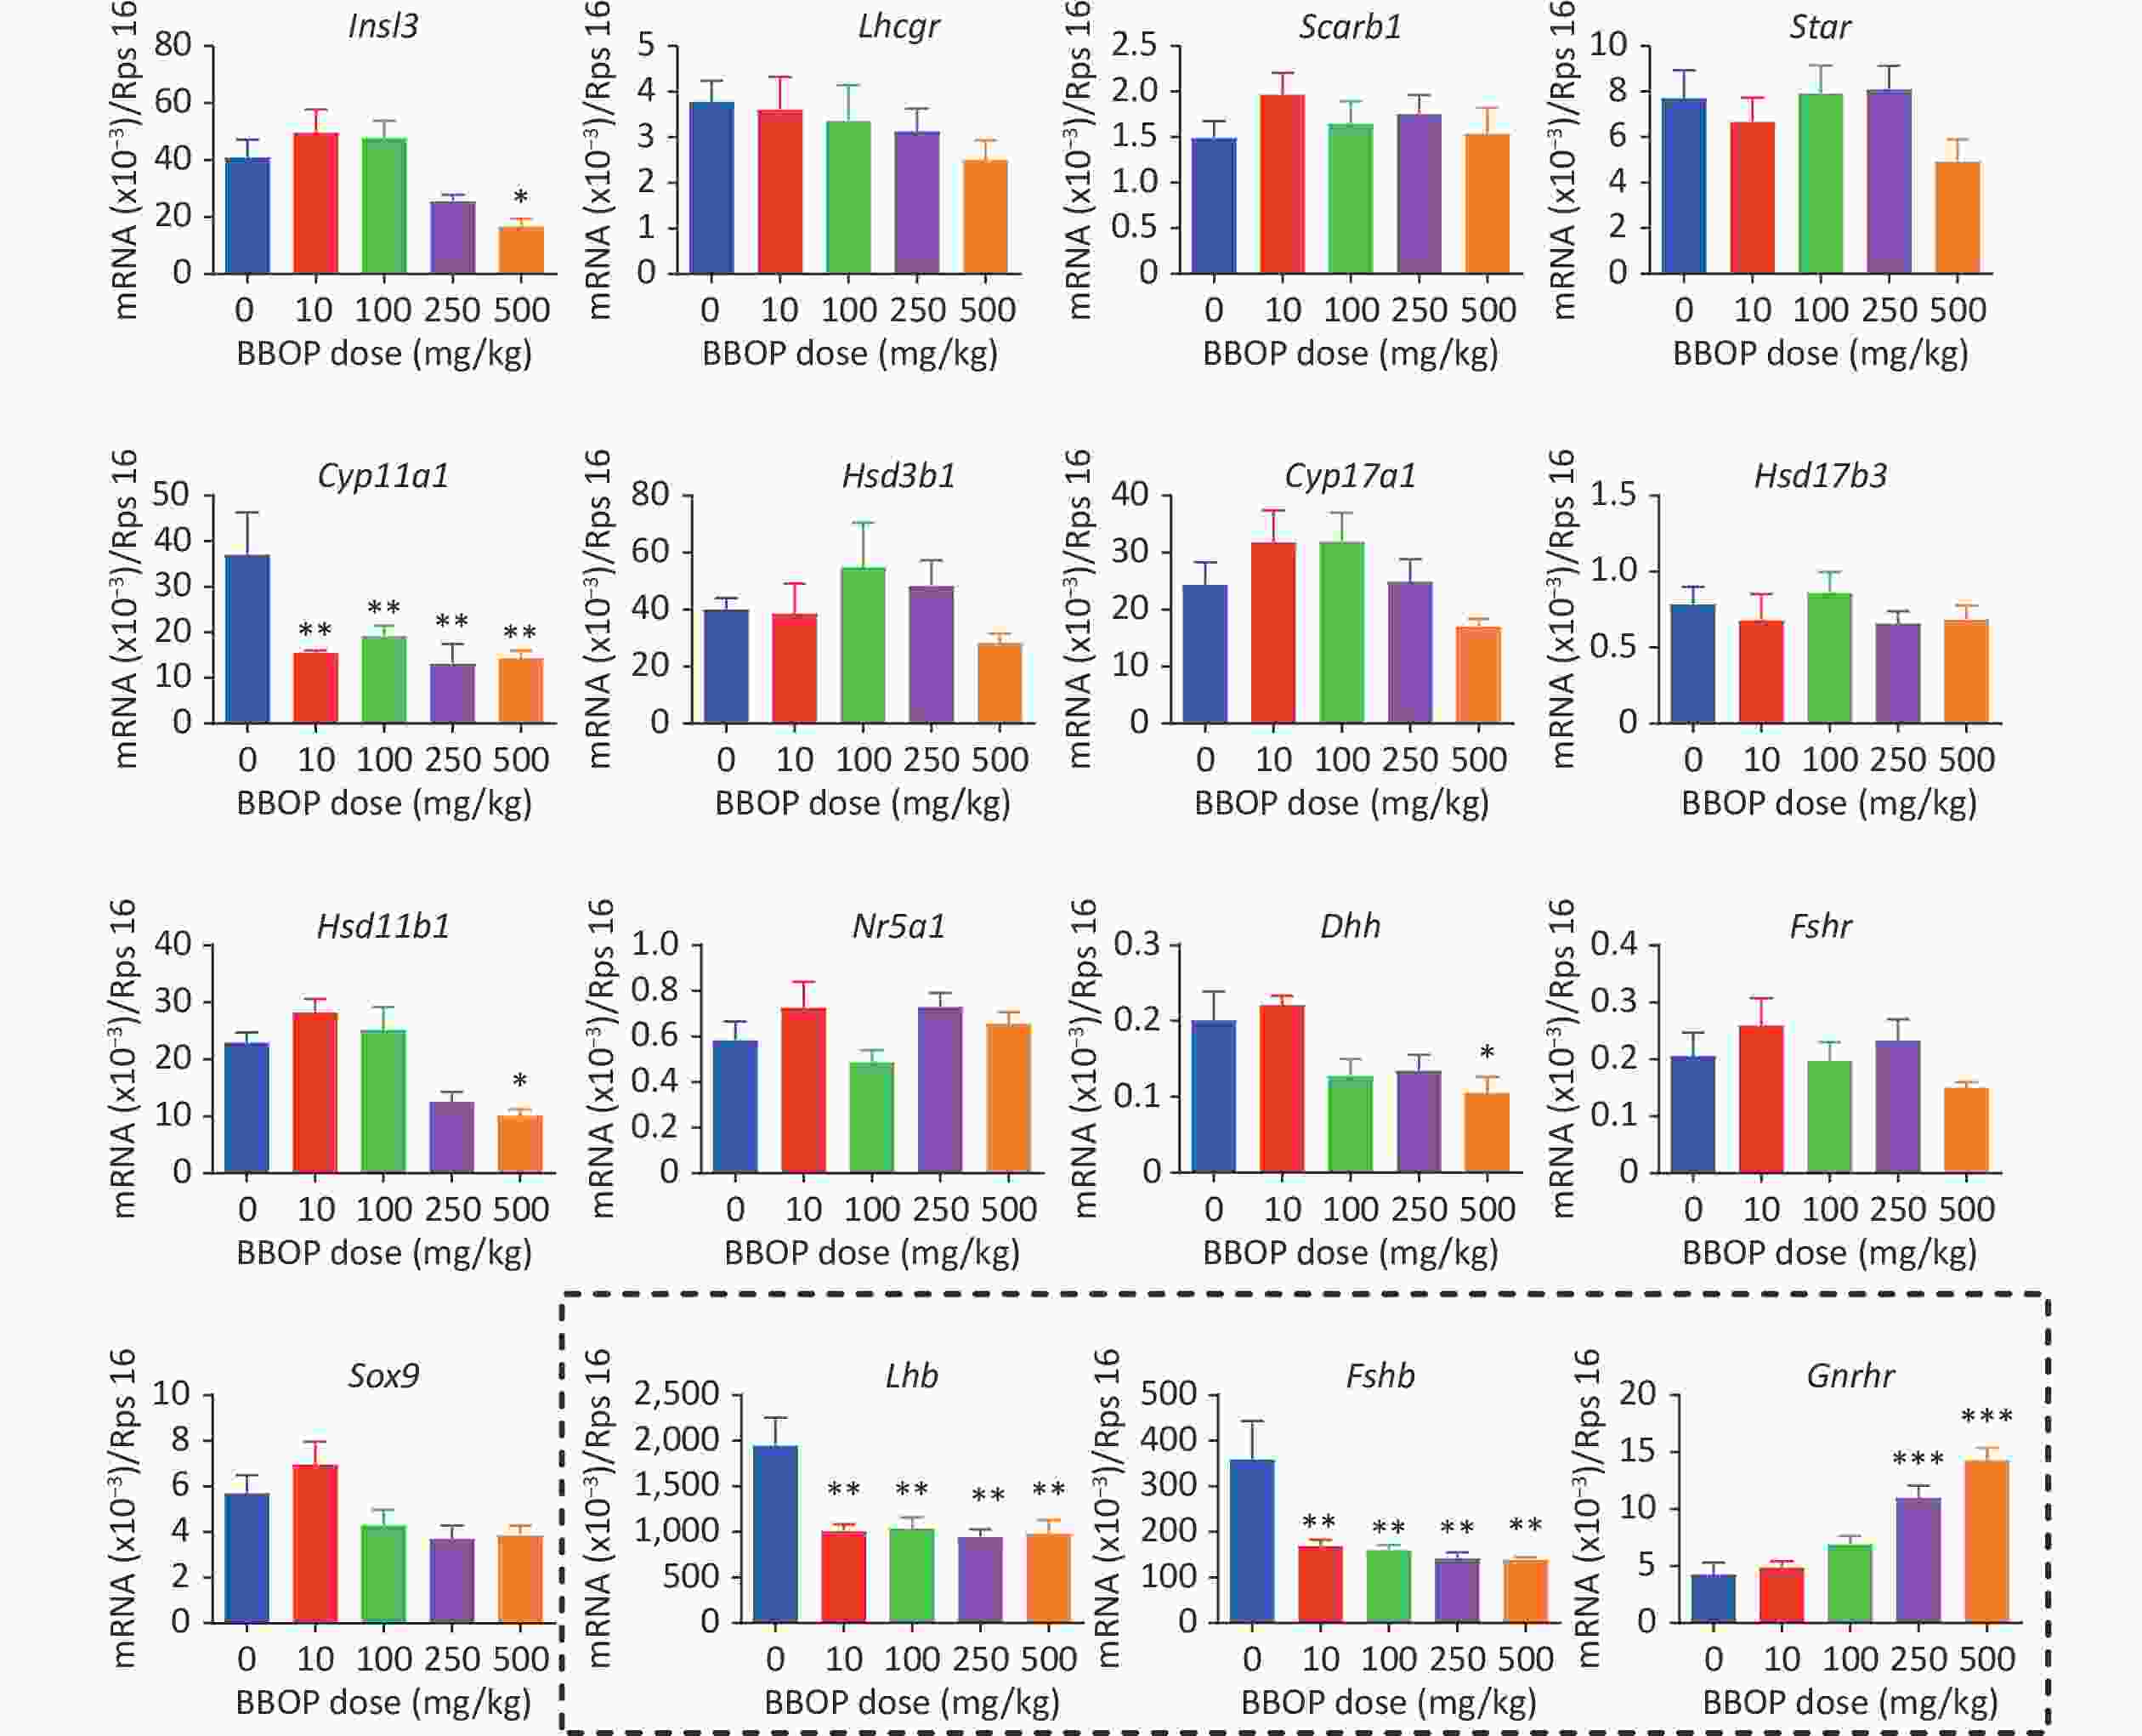
Figure 3. Gene expression in the testis and pituitary gland after BBOP exposure. The expression of the testis genes Lhcgr, Scarb1, Star, Cyp11a1, Hsd3b1, Cyp17a1, Hsd17b3, Hsd11b1, Insl3, Nr5a1, Sox9, Dhh, and Fshr and of the pituitary genes Gnrhr, Lhb, and Fshb (in the dotted box) was determined by qPCR. The mRNA levels were normalized to those of Rsp16 (internal control). Mean ± SEM, n = 6. *P < 0.05, **P < 0.01 and ***P < 0.001 in the BBOP group versus the control (0 mg/kg).
-
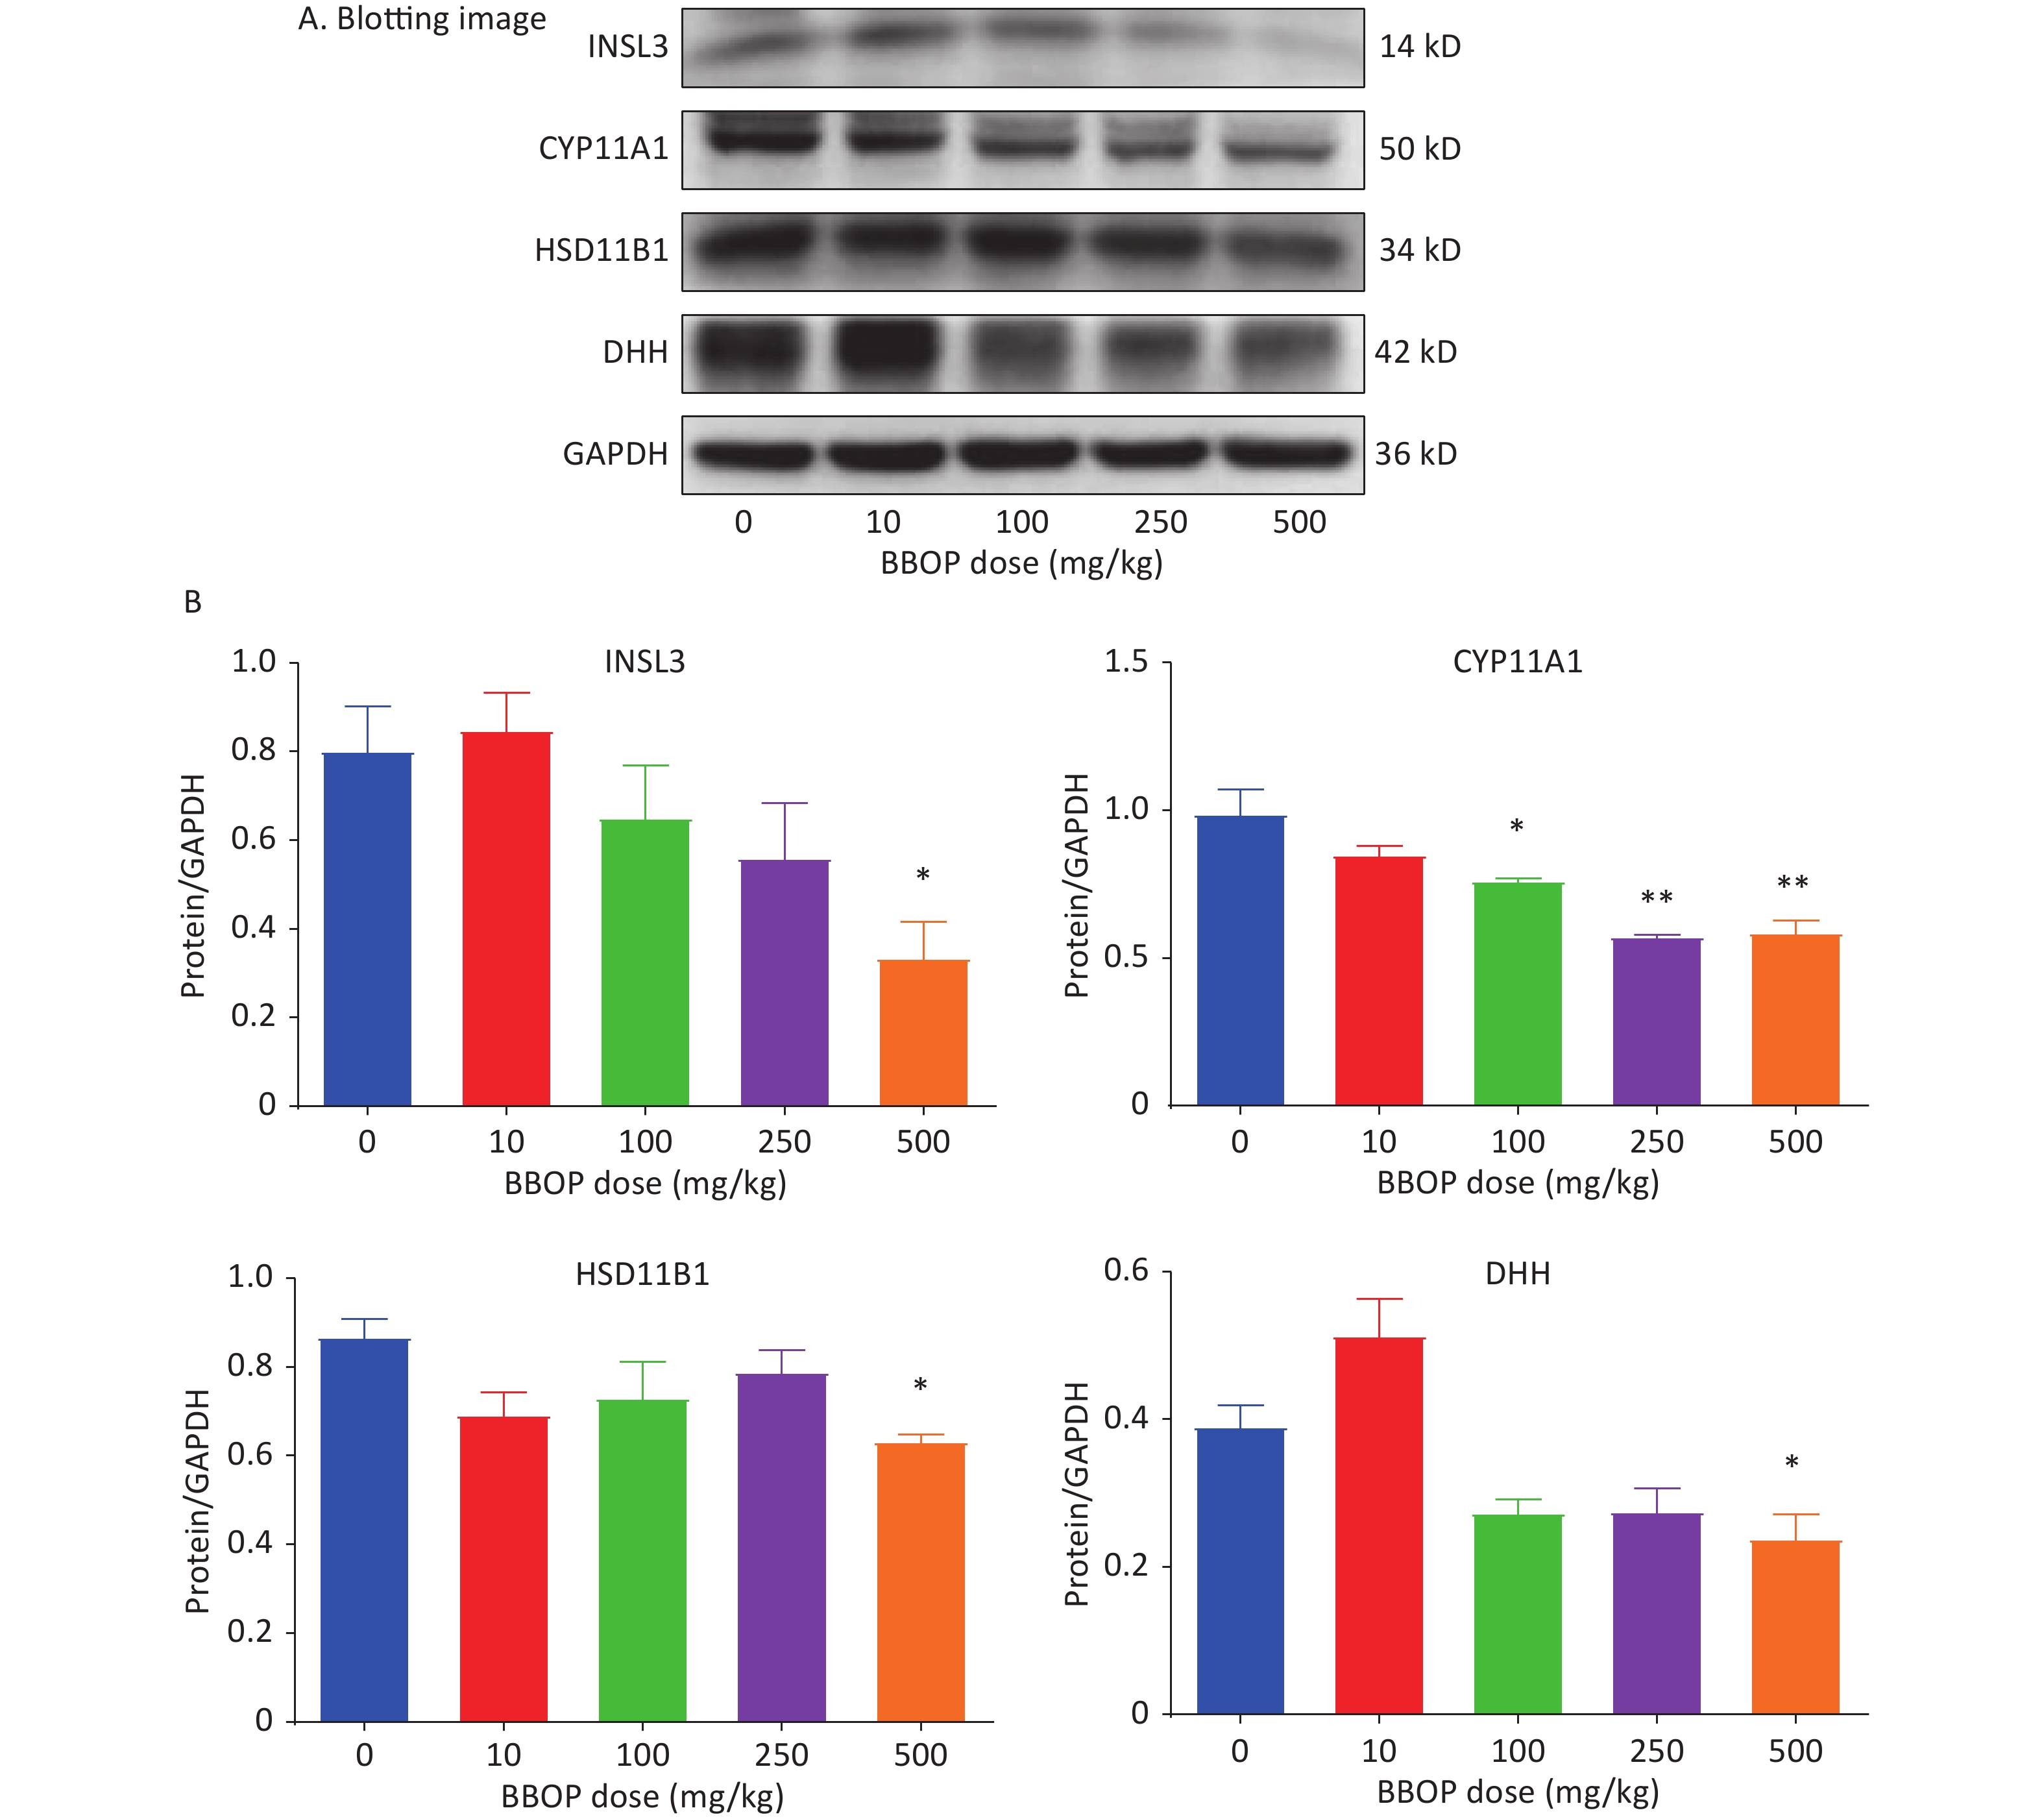
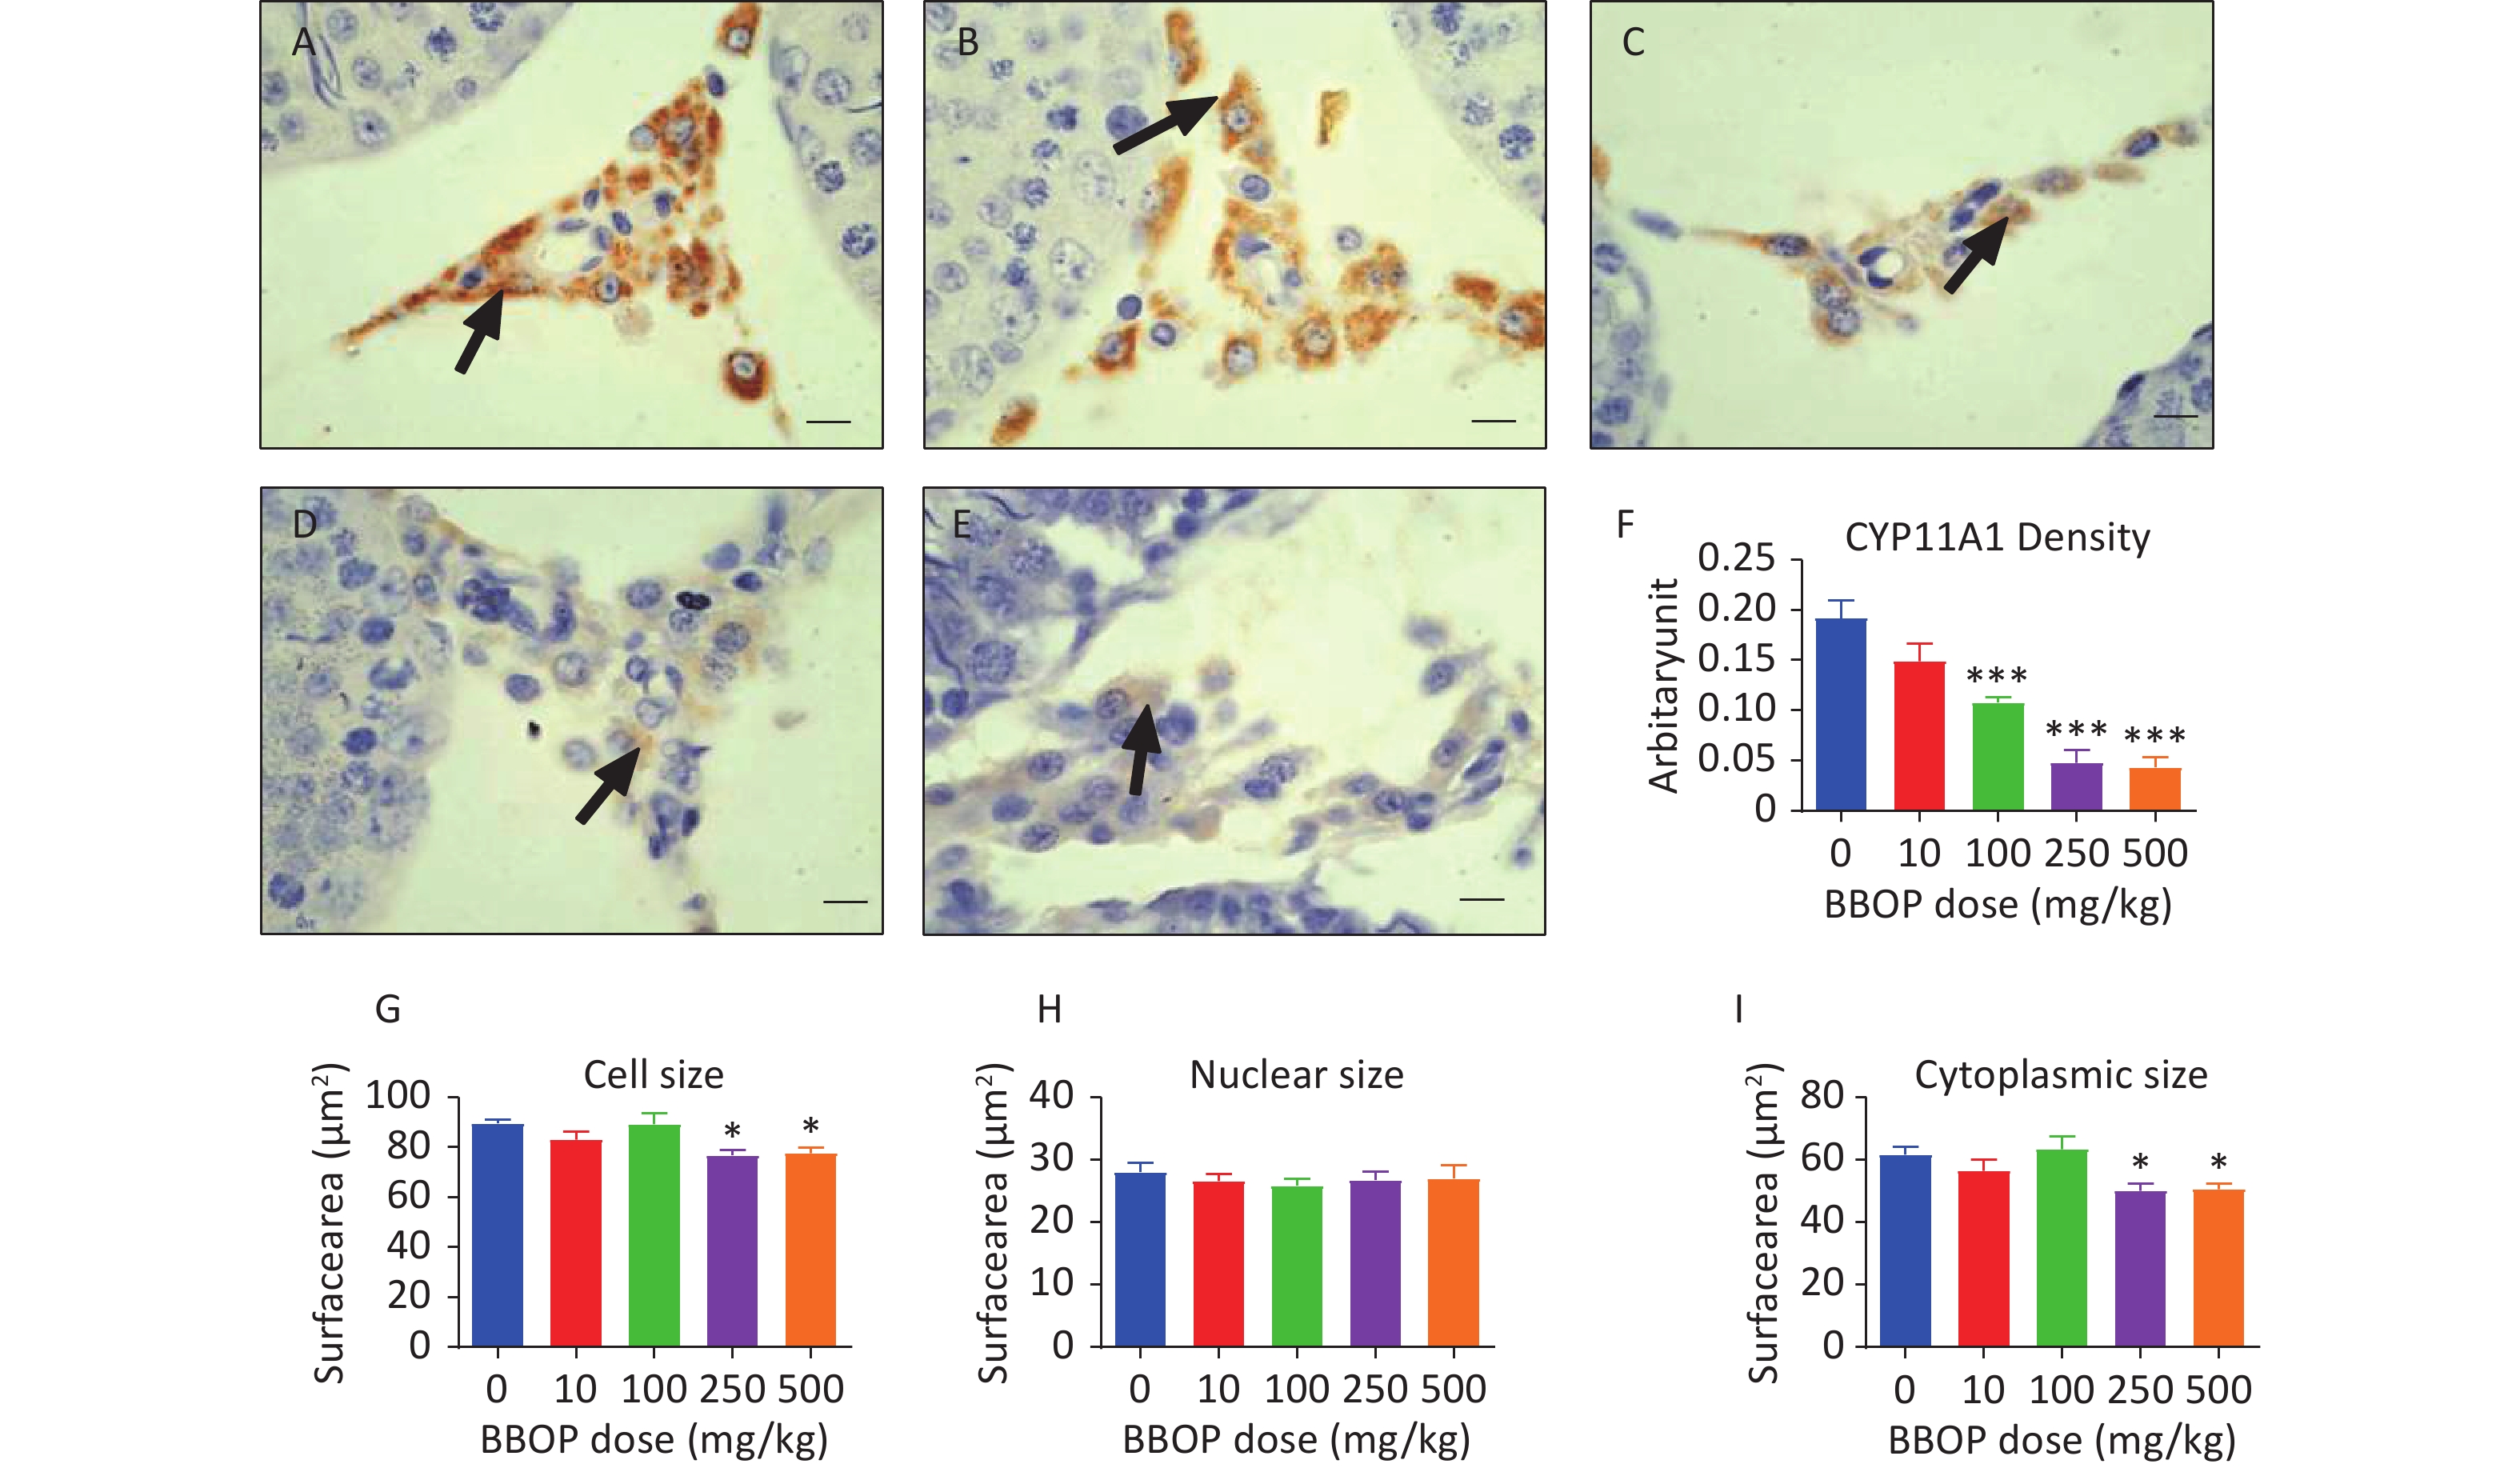
Protein levels of INSL3, CYP11A1, HSD11B1, and DHH in the testis were detected by western blotting. BBOP significantly decreased CYP11A1 levels at doses of 100 mg/kg (P < 0.05) and above (P < 0.01, Figure 4A–B), and significantly decreased the levels of INSL3, HSD11B1, and DHH at a dose of 500 mg/kg bw per day (P < 0.05, Figure 4A–B). The density of CYP11A1 and SOX9 represented the protein levels in individual cells. Semi-quantitative immunohistochemical staining used to calculate CYP11A1 and SOX9 pixel density indicated that BBOP significantly decreased CYP11A1 density at doses of 100 mg/kg or above (P < 0.001, Figure 5) without affecting SOX9 density (Supplementary Figure S3, available in www.besjournal.com), in agreement with the western blot data.
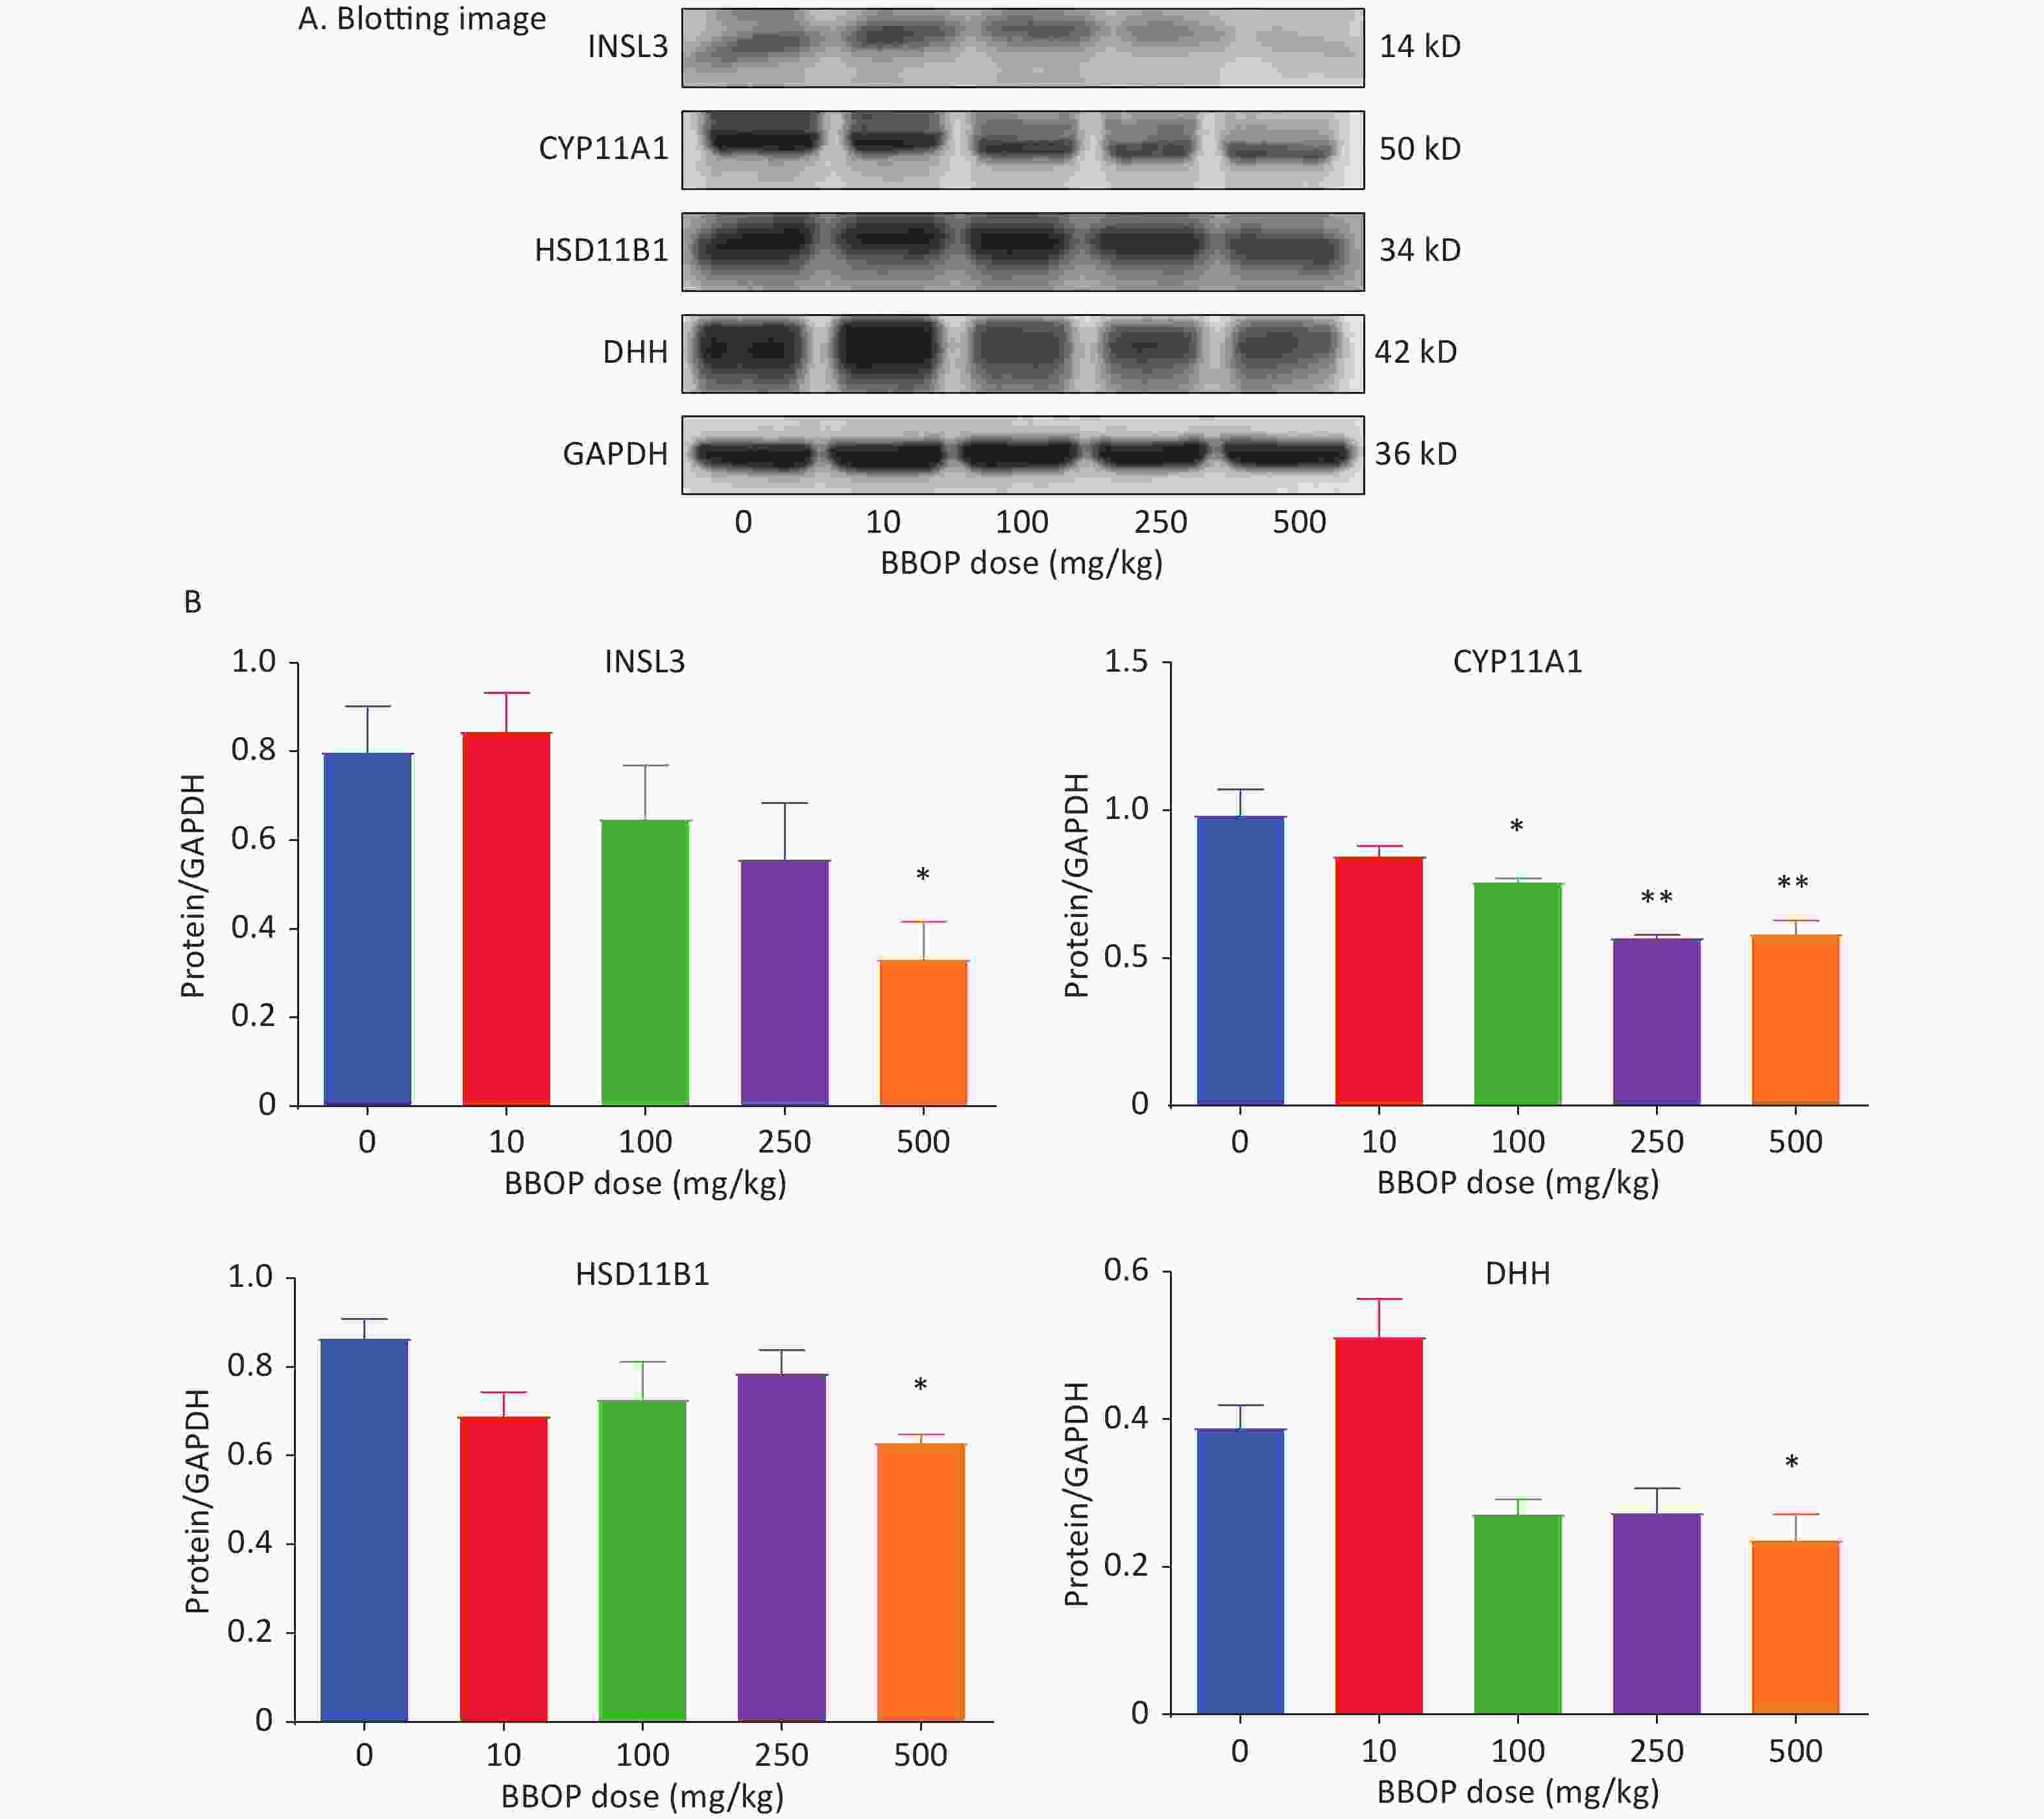
Figure 4. Protein levels in the testis after BBOP exposure. Panel A, western blotting image. Panel B, quantitative results for CYP11A1, HSD11B1, INSL3, and DHH, normalized to GAPDH (the internal control). Mean ± SEM, n = 3–4. *P < 0.05 and **P < 0.01, in the BBOP group versus the control (0 mg/kg).
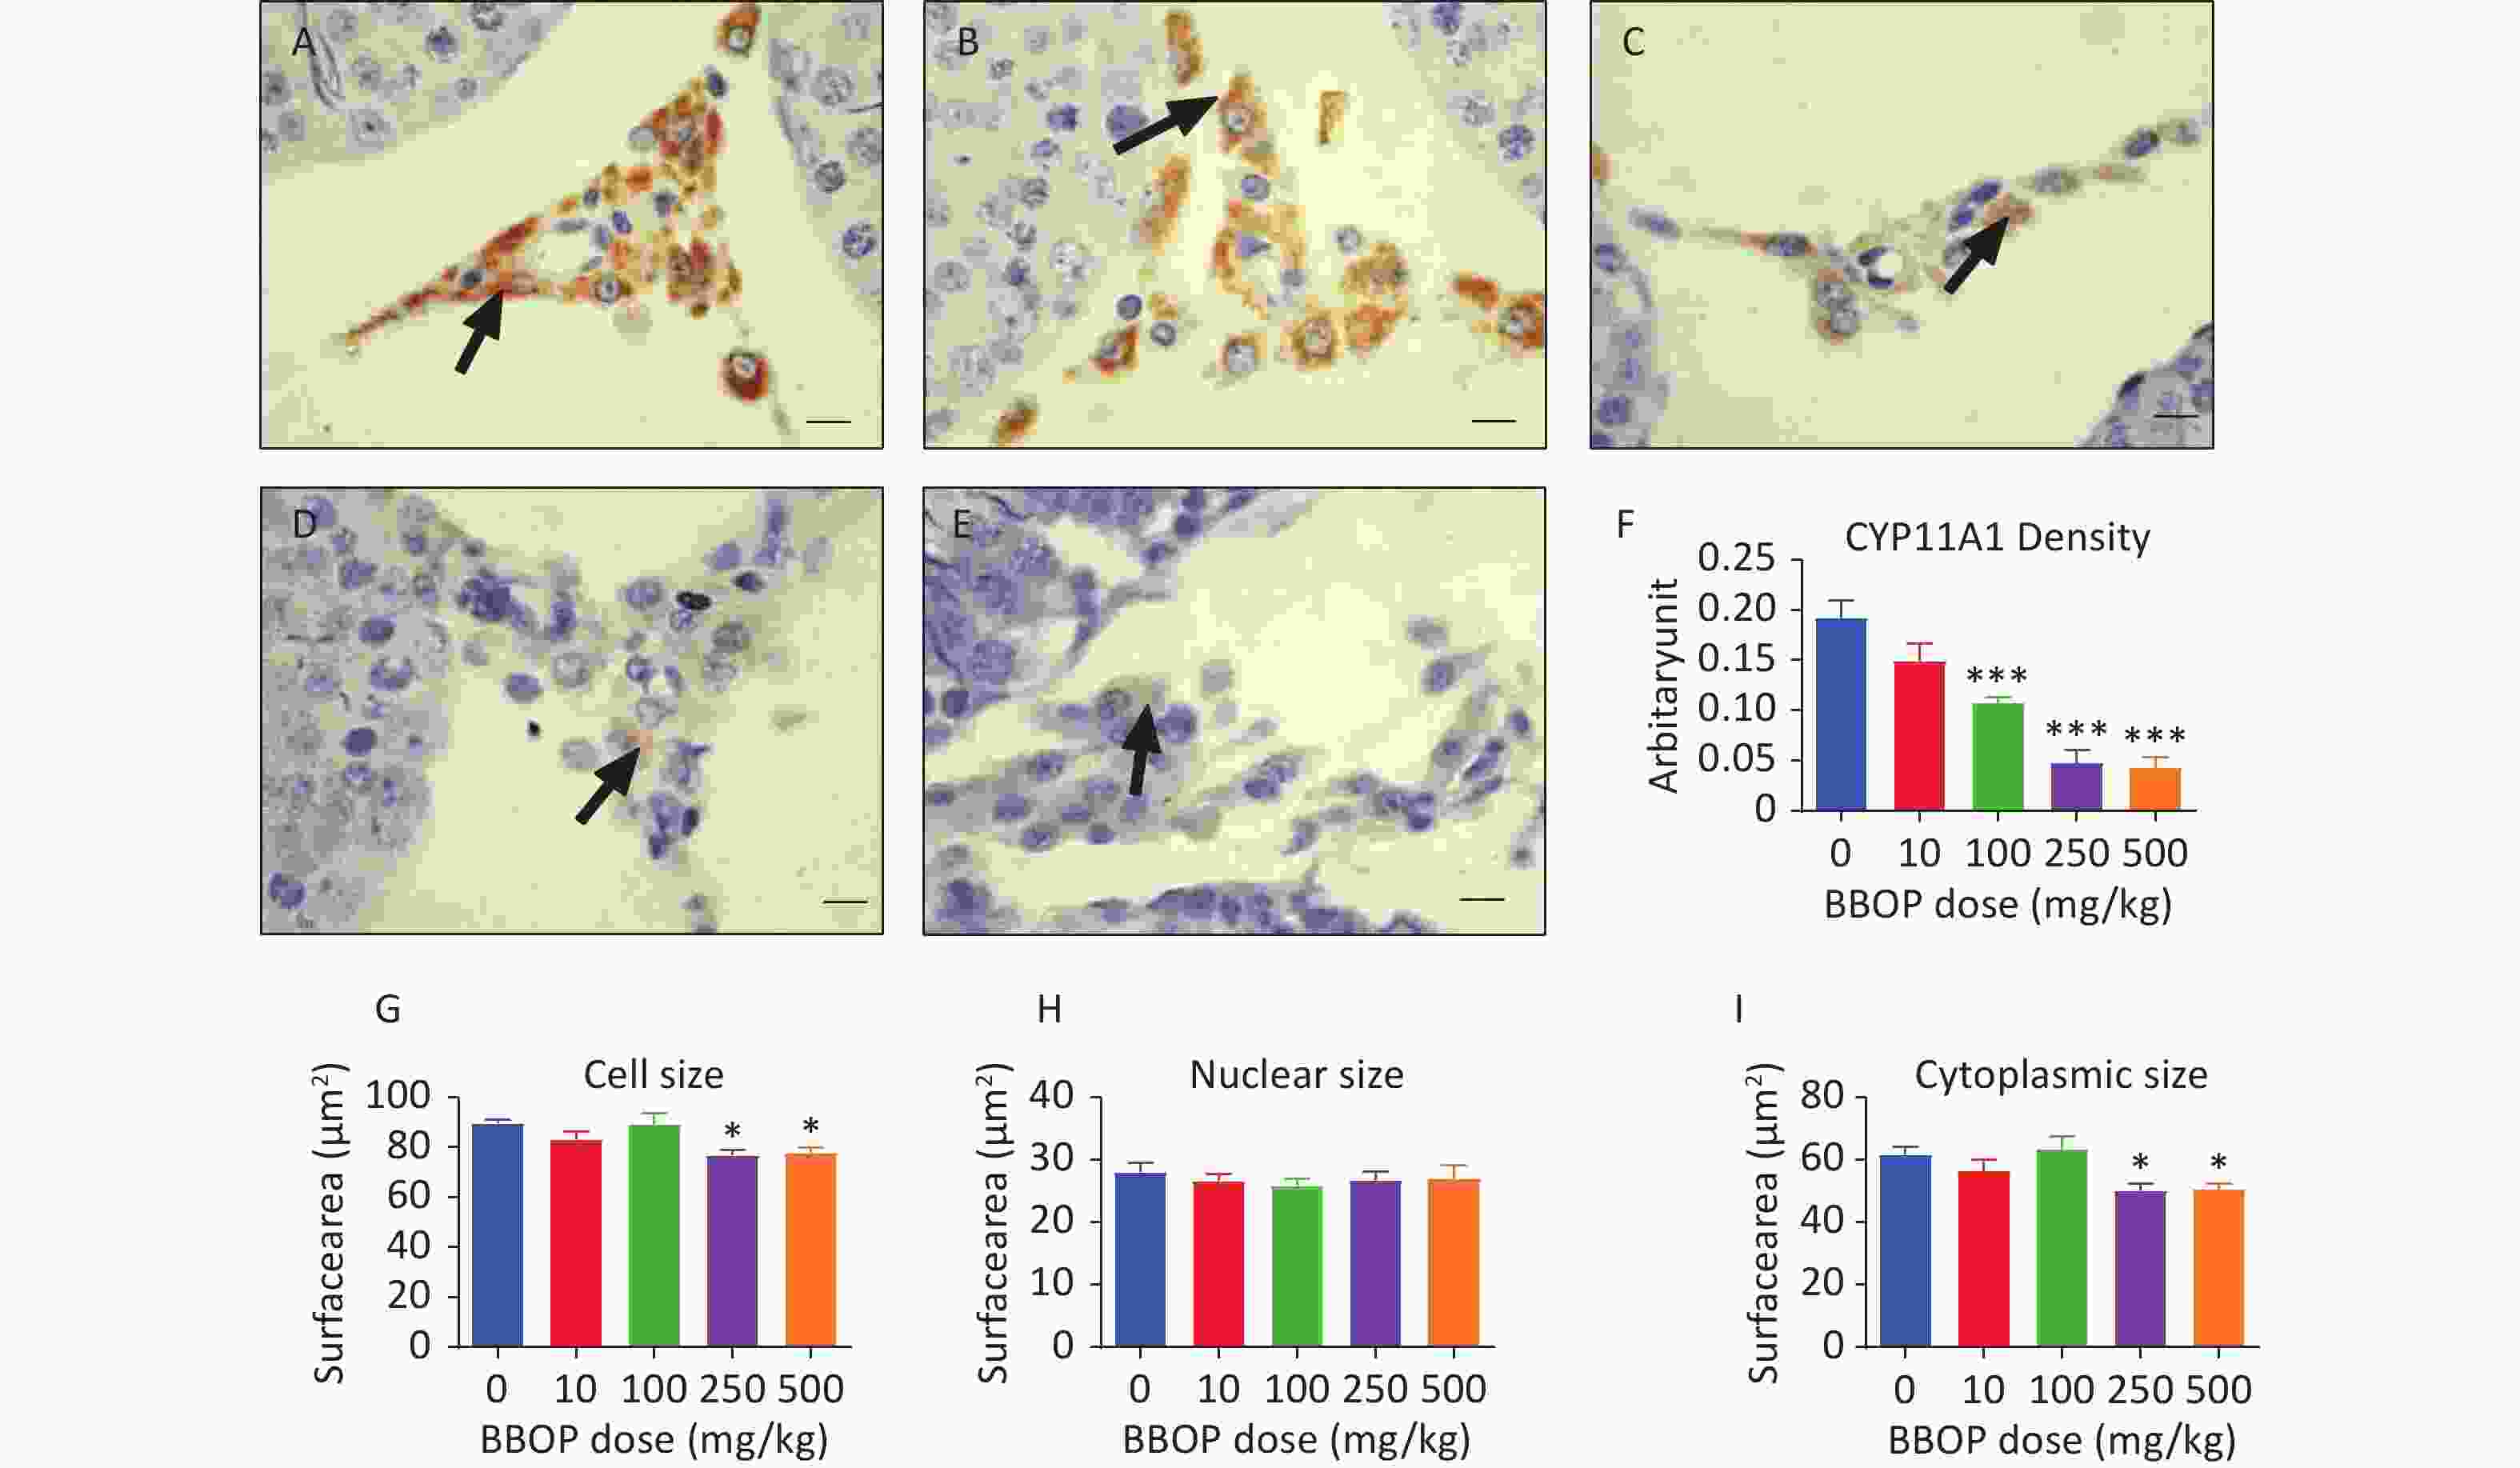
Figure 5. Semi-quantitative immunohistochemical measurement of CYP11A1 density and Leydig cell (LC) morphological metrics. Panels A–E, CYP11A1 staining for 0, 10, 100, 250, and 500 mg/kg bw per day BBOP, groups, respectively. Black arrow indicates CYP11A1 staining; scale bar = 20 μm. Panel F, CYP11A1 density. Panels G–I, LC size, nuclear size, and cytoplasm size. Mean ± SEM, n = 6. *P < 0.05 and ***P < 0.001 in the BBOP group versus the control (0 mg/kg).
-
More mature Leydig cells have larger cell sizes [23]. Both the 250 and 500 mg/kg bw per day doses of BBOP significantly decreased the Leydig cell size and cytoplasmic size (P < 0.05, Figure 5) without affecting nuclear size. Thus, the maturation of Leydig cells is delayed after exposure to BBOP in puberty.
-
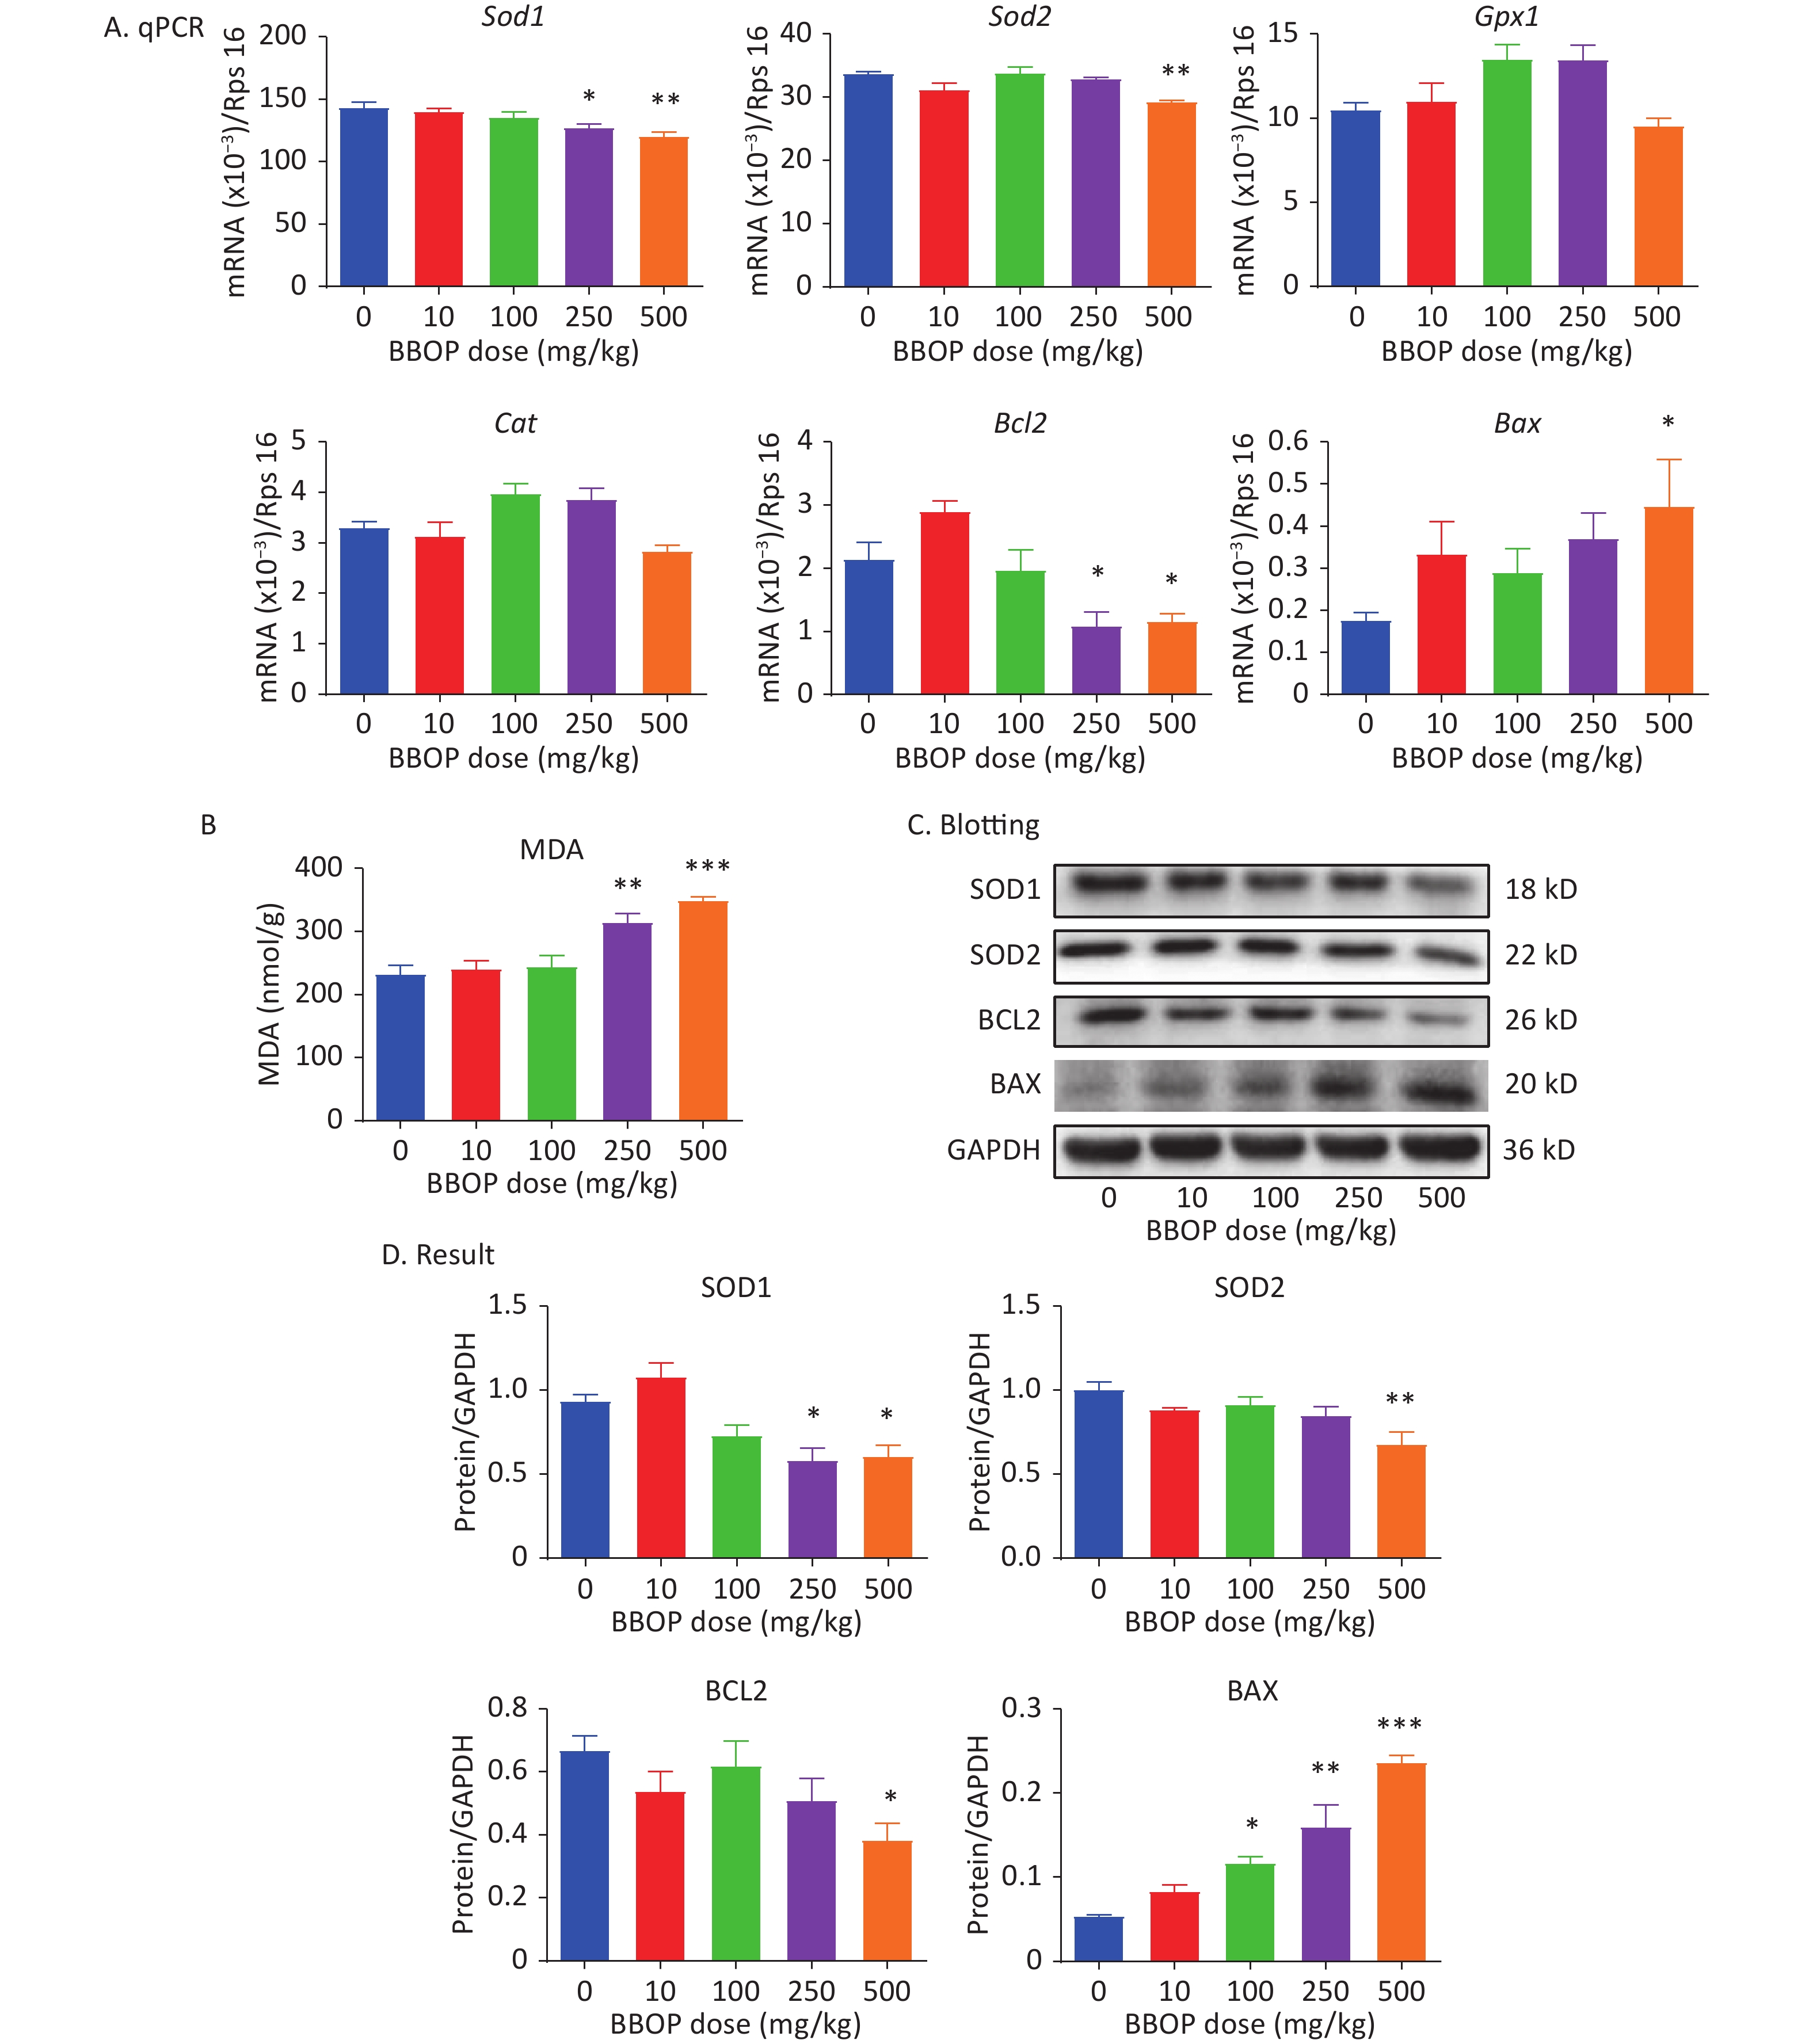
We measured the expression of antioxidant genes (Sod1, Sod2, Gpx1, and Cat), an anti-apoptotic gene (Bcl2), and a pro-apoptotic gene (Bax). BBOP significantly down-regulated the expression of Sod1 and Bcl2 at a dose of 250 (P < 0.05) or 500 (P < 0.01) mg/kg, and the expression of Sod2 at a dose of 500 mg/kg bw per day (P < 0.01), but up-regulated Bax expression at a dose of 500 mg/kg bw per day (P < 0.01, Figure 6). MDA is the end product of lipid peroxidation caused by excessive ROS. MDA was significantly greater in the 250 (P < 0.01) and 500 (P < 0.001) mg/kg bw per day groups than the control group (Figure 6B). We further detected the protein levels of SOD1, SOD2, BCL2, and BAX. BBOP treatment significantly decreased SOD1, SOD2, and BCL2 levels at a dose of 250 (P < 0.05) and 500 (P < 0.01) mg/kg, whereas it markedly elevated BAX levels at a dose of 100 mg/kg (P < 0.05) or higher (P < 0.001, Figure 6C).
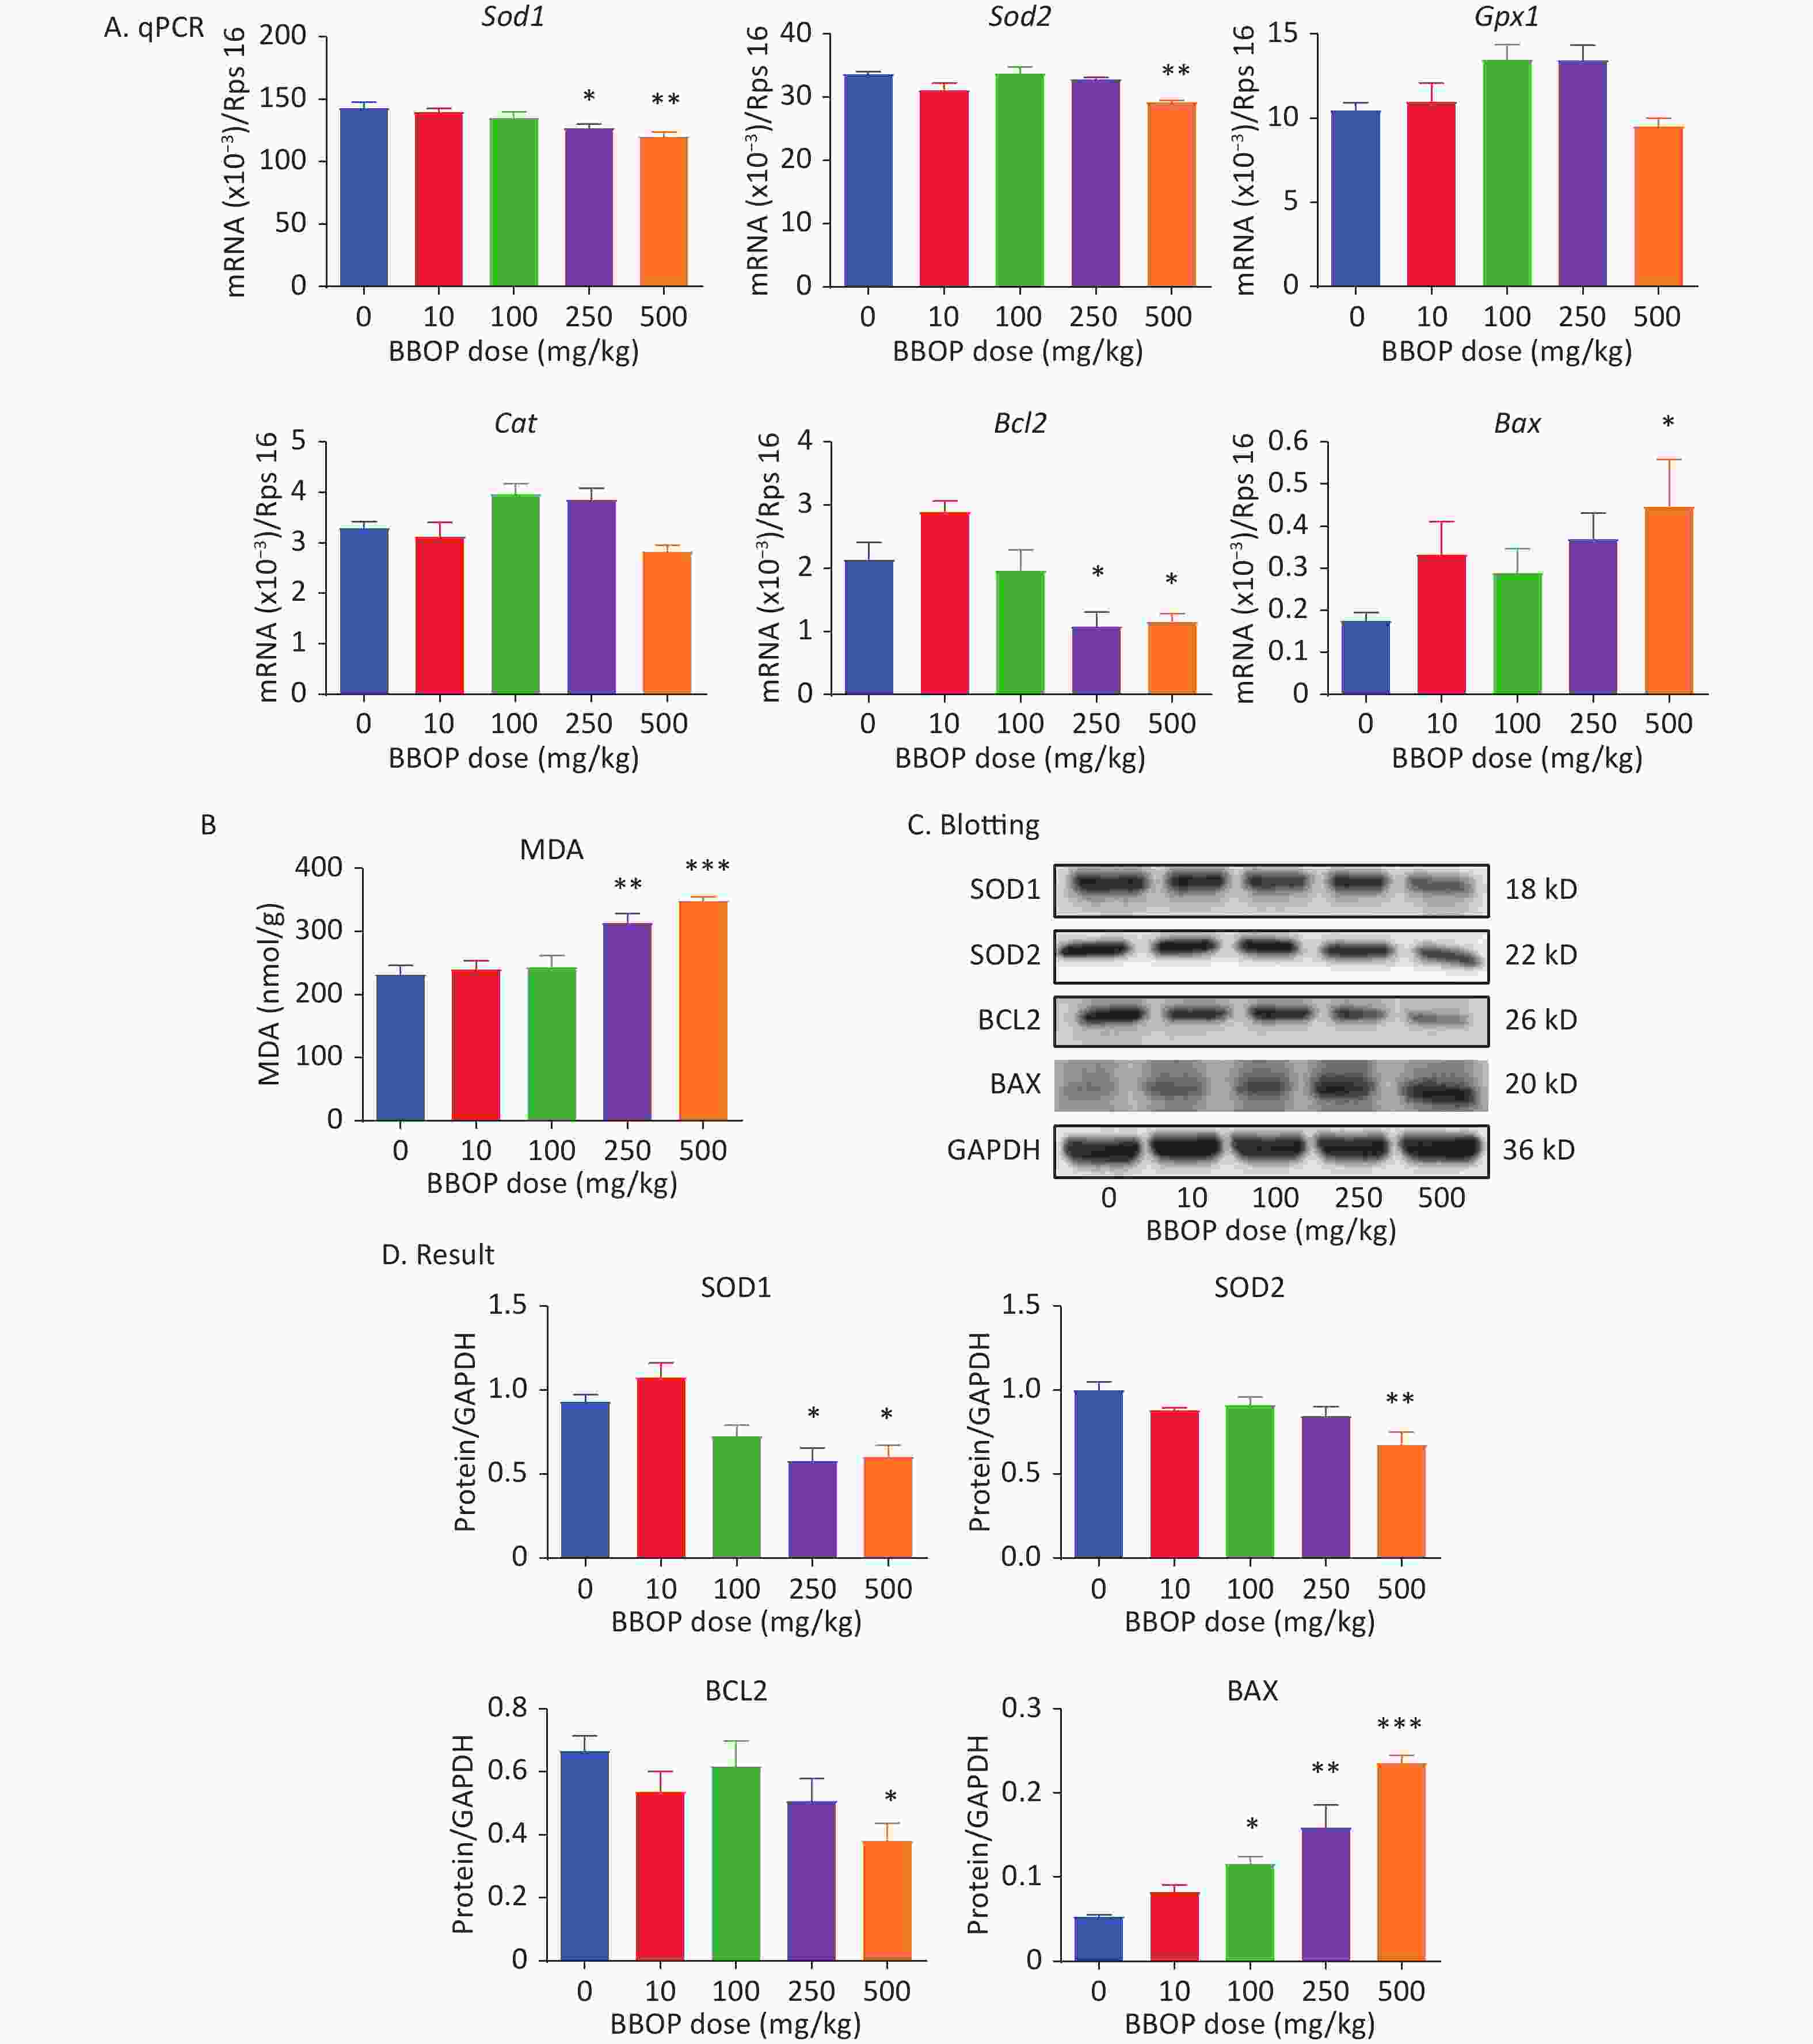
Figure 6. Expression of antioxidant enzymes, apoptosis-associated genes, and malondialdehyde (MDA) amounts after BBOP exposure. Panel A, expression of Sod1, Sod2, Gpx1, Cat, Bax, and Bcl2 in the testis, normalized to Rsp16. Panel B, testicular level of MDA. Panel C, western blotting image. Panel D, quantitative results of antioxidant enzymes and apoptosis-associated proteins. Mean ± SEM, n = 6 for mRNAs and MDA and n = 3 for western blotting. *P < 0.05, **P < 0.01, and ***P < 0.001 in the BBOP group versus the control (0 mg/kg).
-
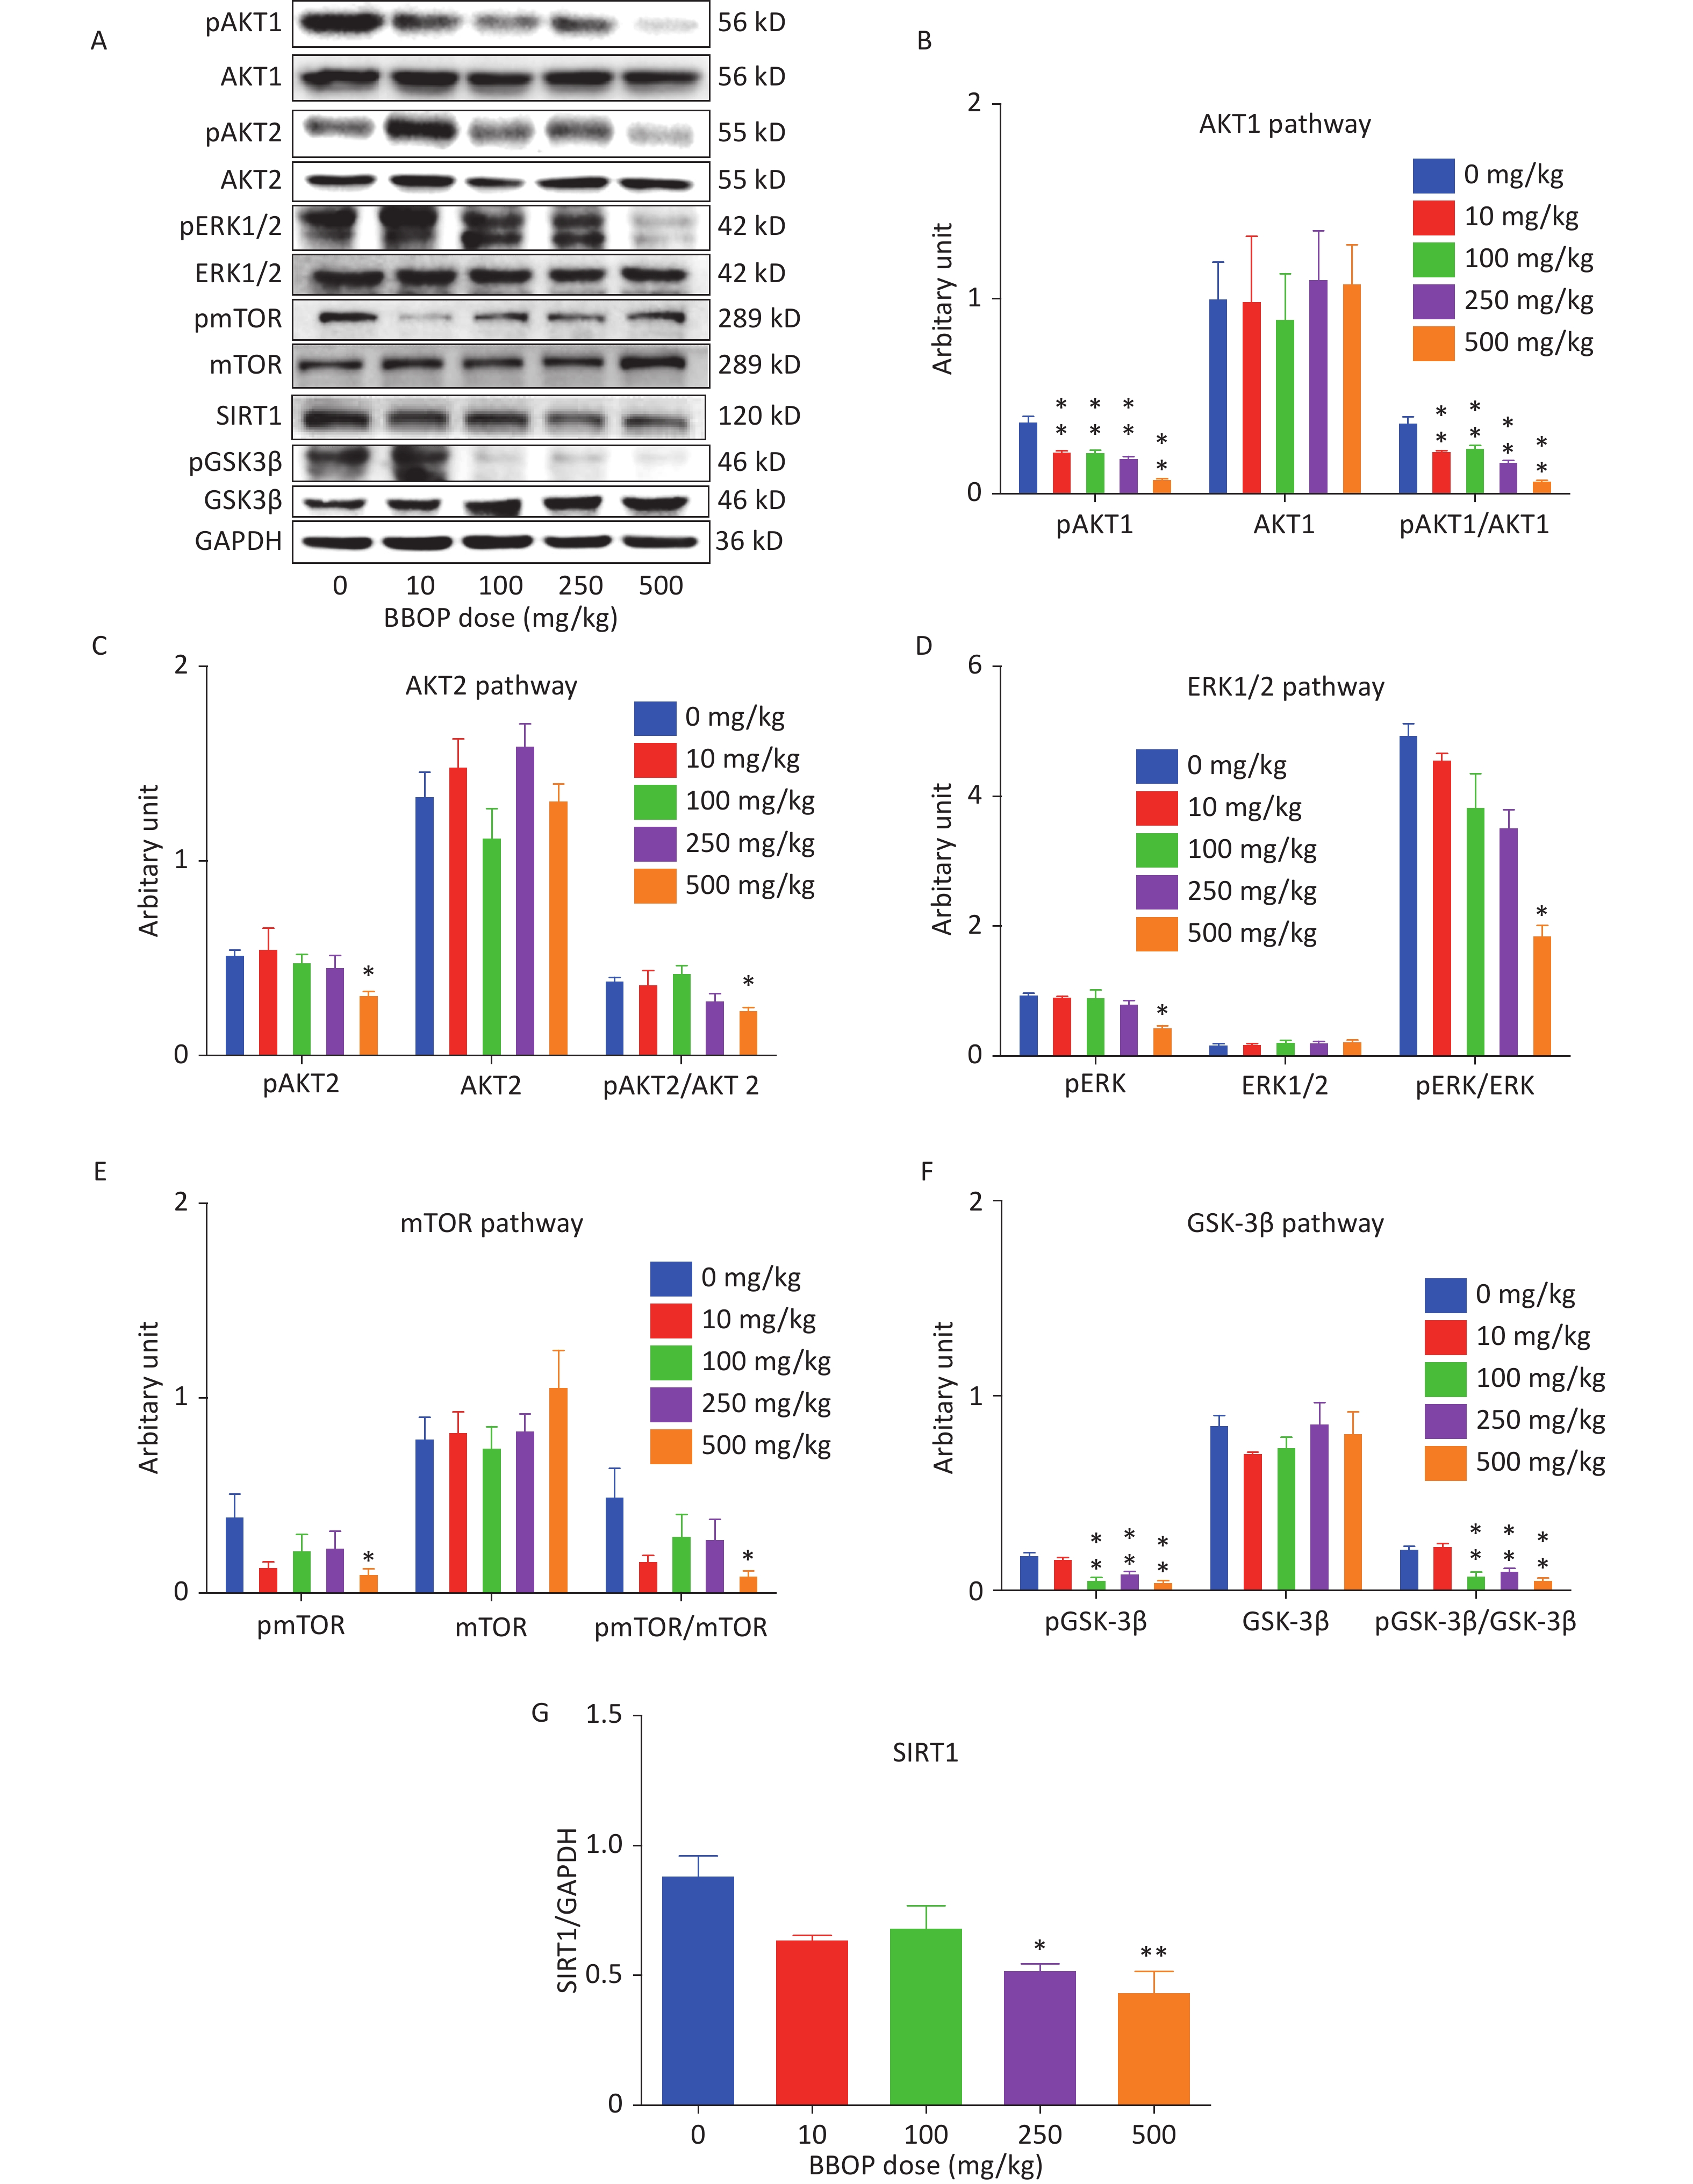
We measured the SIRT1 levels and total protein levels of AKT1, AKT2, ERK1/2, mTOR, GSK3β, and their phosphorylated proteins by western blotting. BBOP at 250 (P < 0.05) and 500 mg/kg bw per day significantly decreased SIRT1 levels mg/kg bw per day (P < 0.01, Figure 7). BBOP did not affect total protein levels of AKT1, AKT2, ERK1/2, mTOR, and GSK3β (Figure 7). However, BBOP at 10 mg/kg or higher doses (P < 0.01) significantly decreased pAKT1 levels; consequently, the pAKT1/AKT1 ratio decreased at these doses (P < 0.01). The pAKT2, pERK1/2, and pmTOR levels decreased at a BBOP dose of 500 mg/kg bw per day (P < 0.05), thereby decreasing the pAKT2/AKT2, pERK/ERK1/2, and pmTOR/mTOR ratios (P < 0.05). The pGSK3β levels decreased at BBOP doses of 100 mg/kg or higher (P < 0.01), thus significantly decreasing the pGSK3β/GSK3β ratios (P < 0.01, Figure 7).

Figure 7. SIRT1, AKT1, AKT2, ERK1/2, mTOR, and GSK3β and their phosphorylated protein levels in the rat testis. Panel A, western blotting image. Panels B–G: quantification of AKT1, AKT2, ERK1/2, mTOR, and GSK3β, and their phosphorylated proteins, as well as SIRT1. The protein levels were normalized to those of GAPDH (internal control). Mean ± SEM, n = 3. *P < 0.05 and **P < 0.01 in the BBOP group versus the control (0 mg/kg).
-
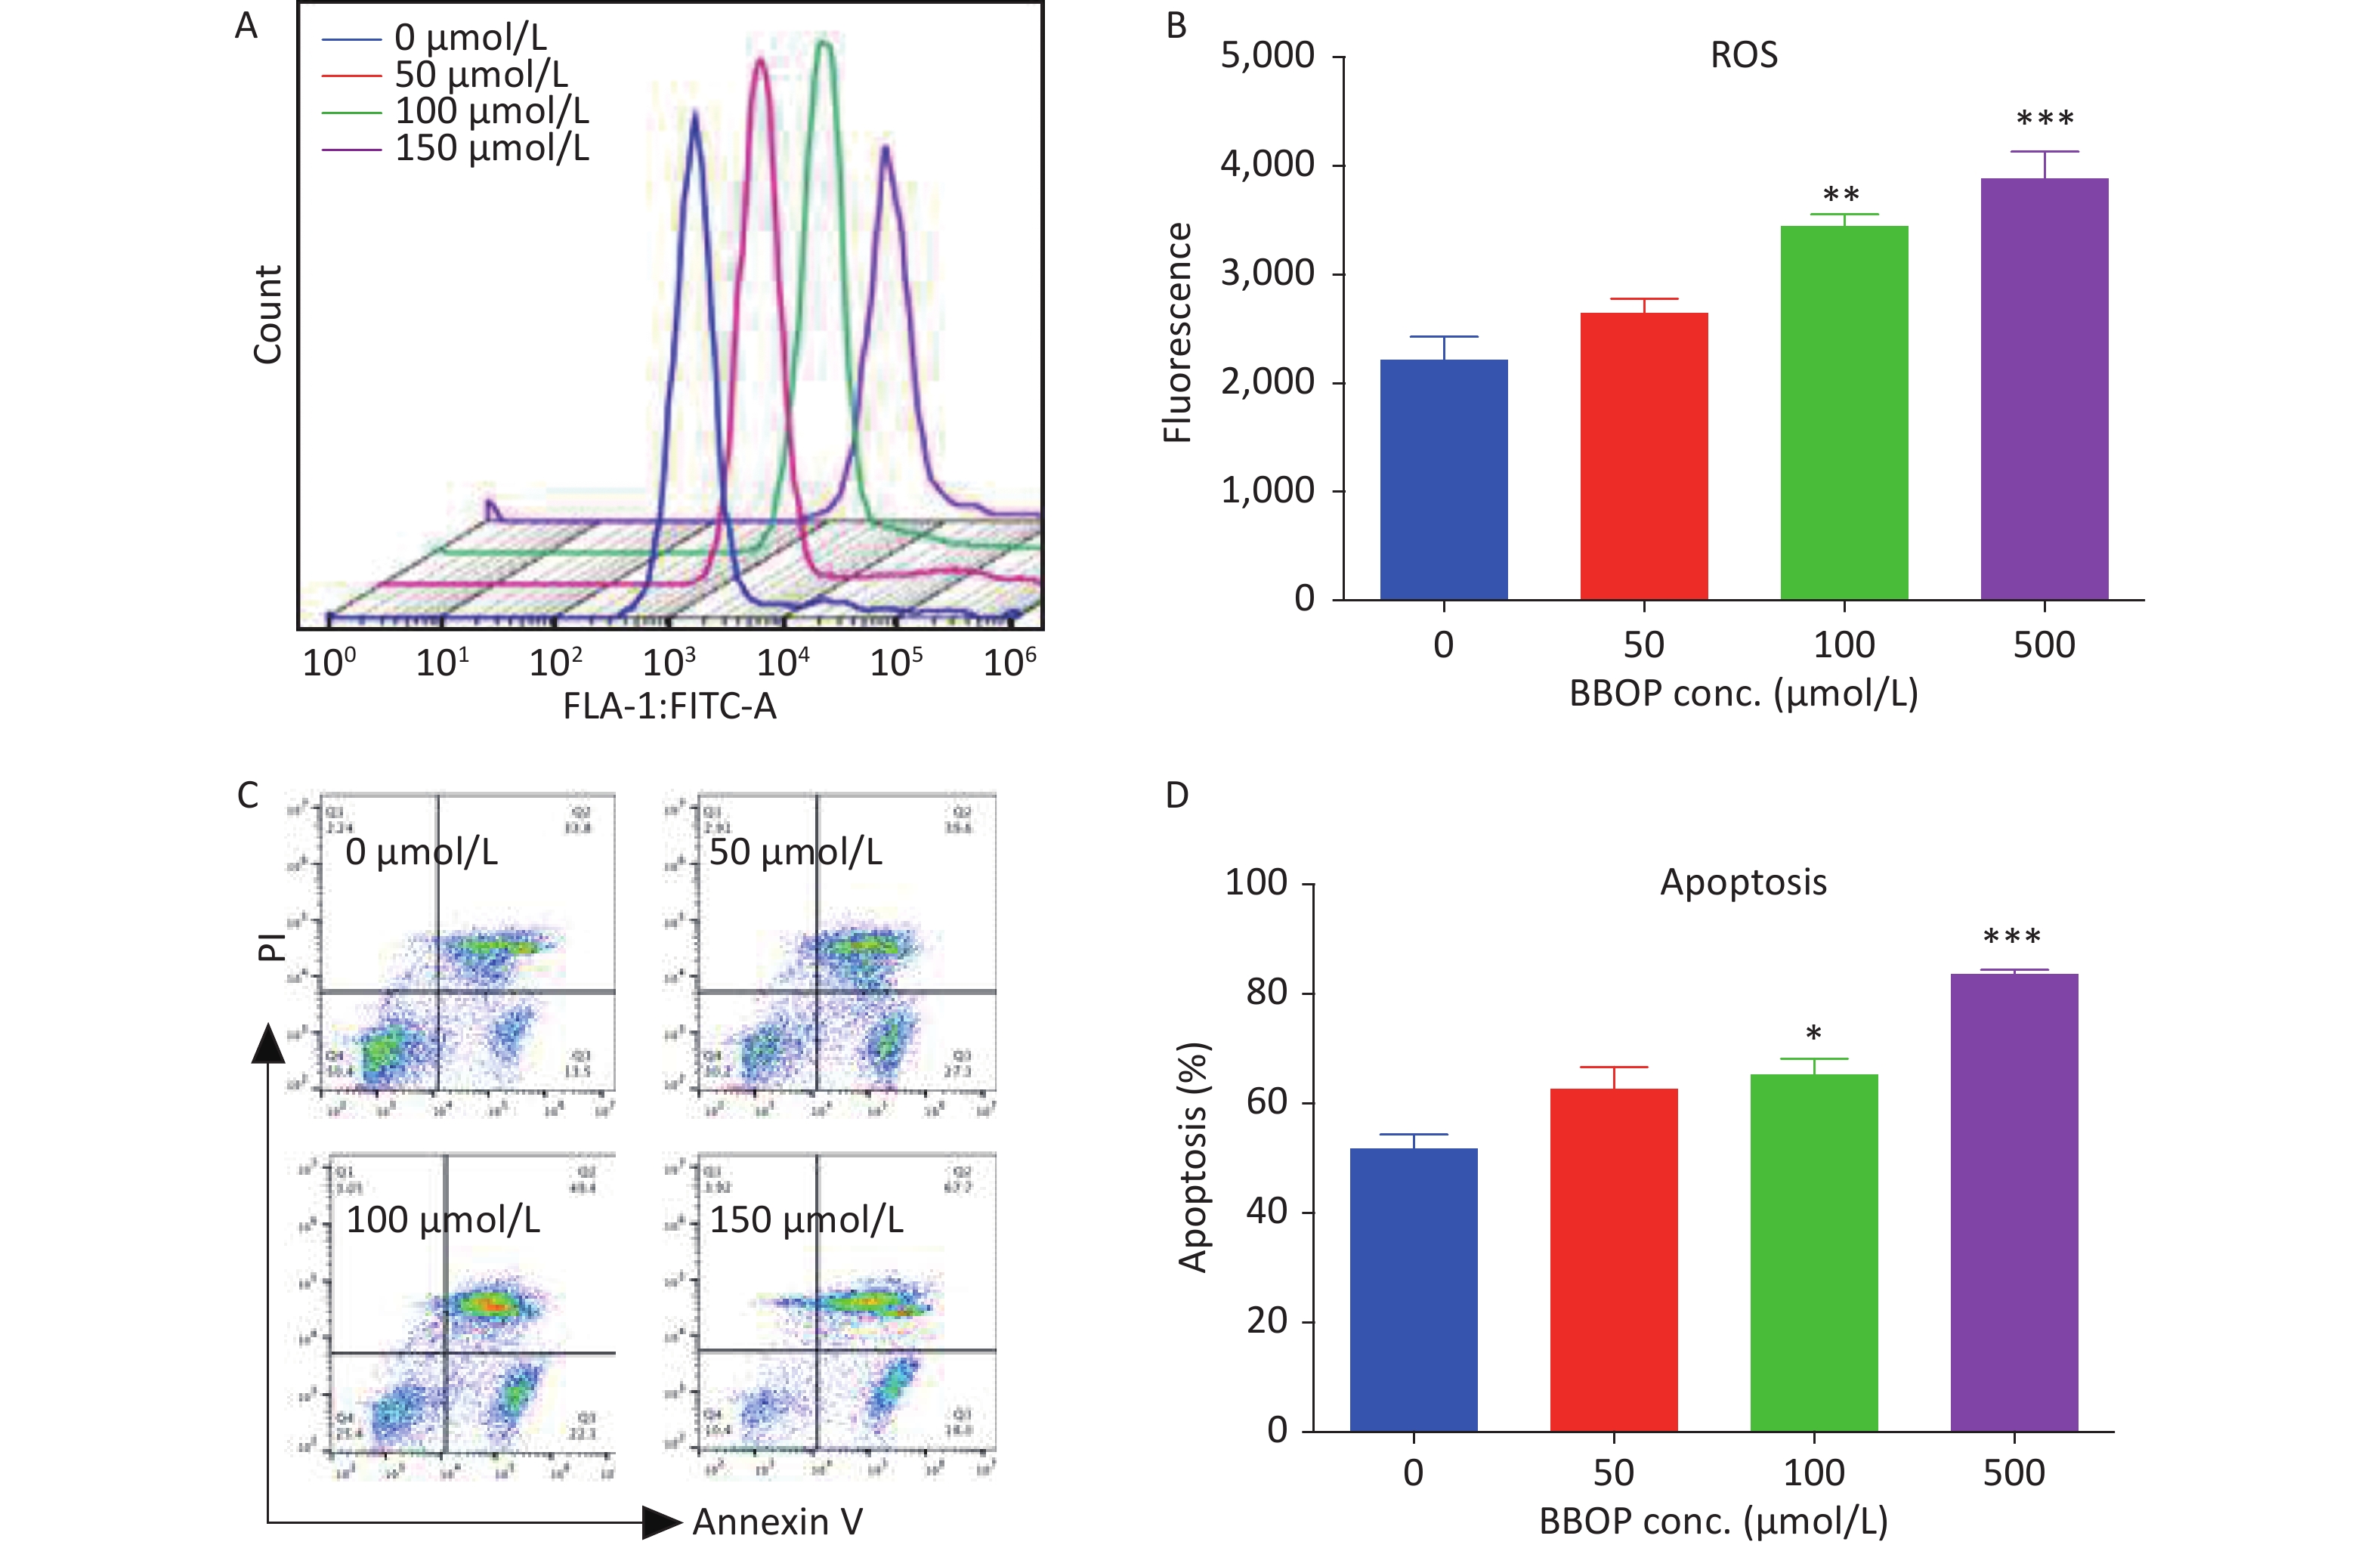
We cultured Leydig cells from 35-old rats in the presence of various concentrations (50–500 μmol/L) of BBOP. We measured ROS production by cytology with a DCFH-DA kit and apoptosis of Leydig cells with an Annexin V/PI kit at the end of treatment. BBOP significantly induced ROS production at doses of 100 μmol/L (P < 0.01) and 500 μmol/L (P < 0.001, Figure 8). BBOP also markedly increased the apoptotic rate at doses of 100 μmol/L (P < 0.05) and 500 μmol/L (P < 0.001, Figure 8). These results indicated that BBOP directly induces ROS and apoptosis in primary Leydig cells.
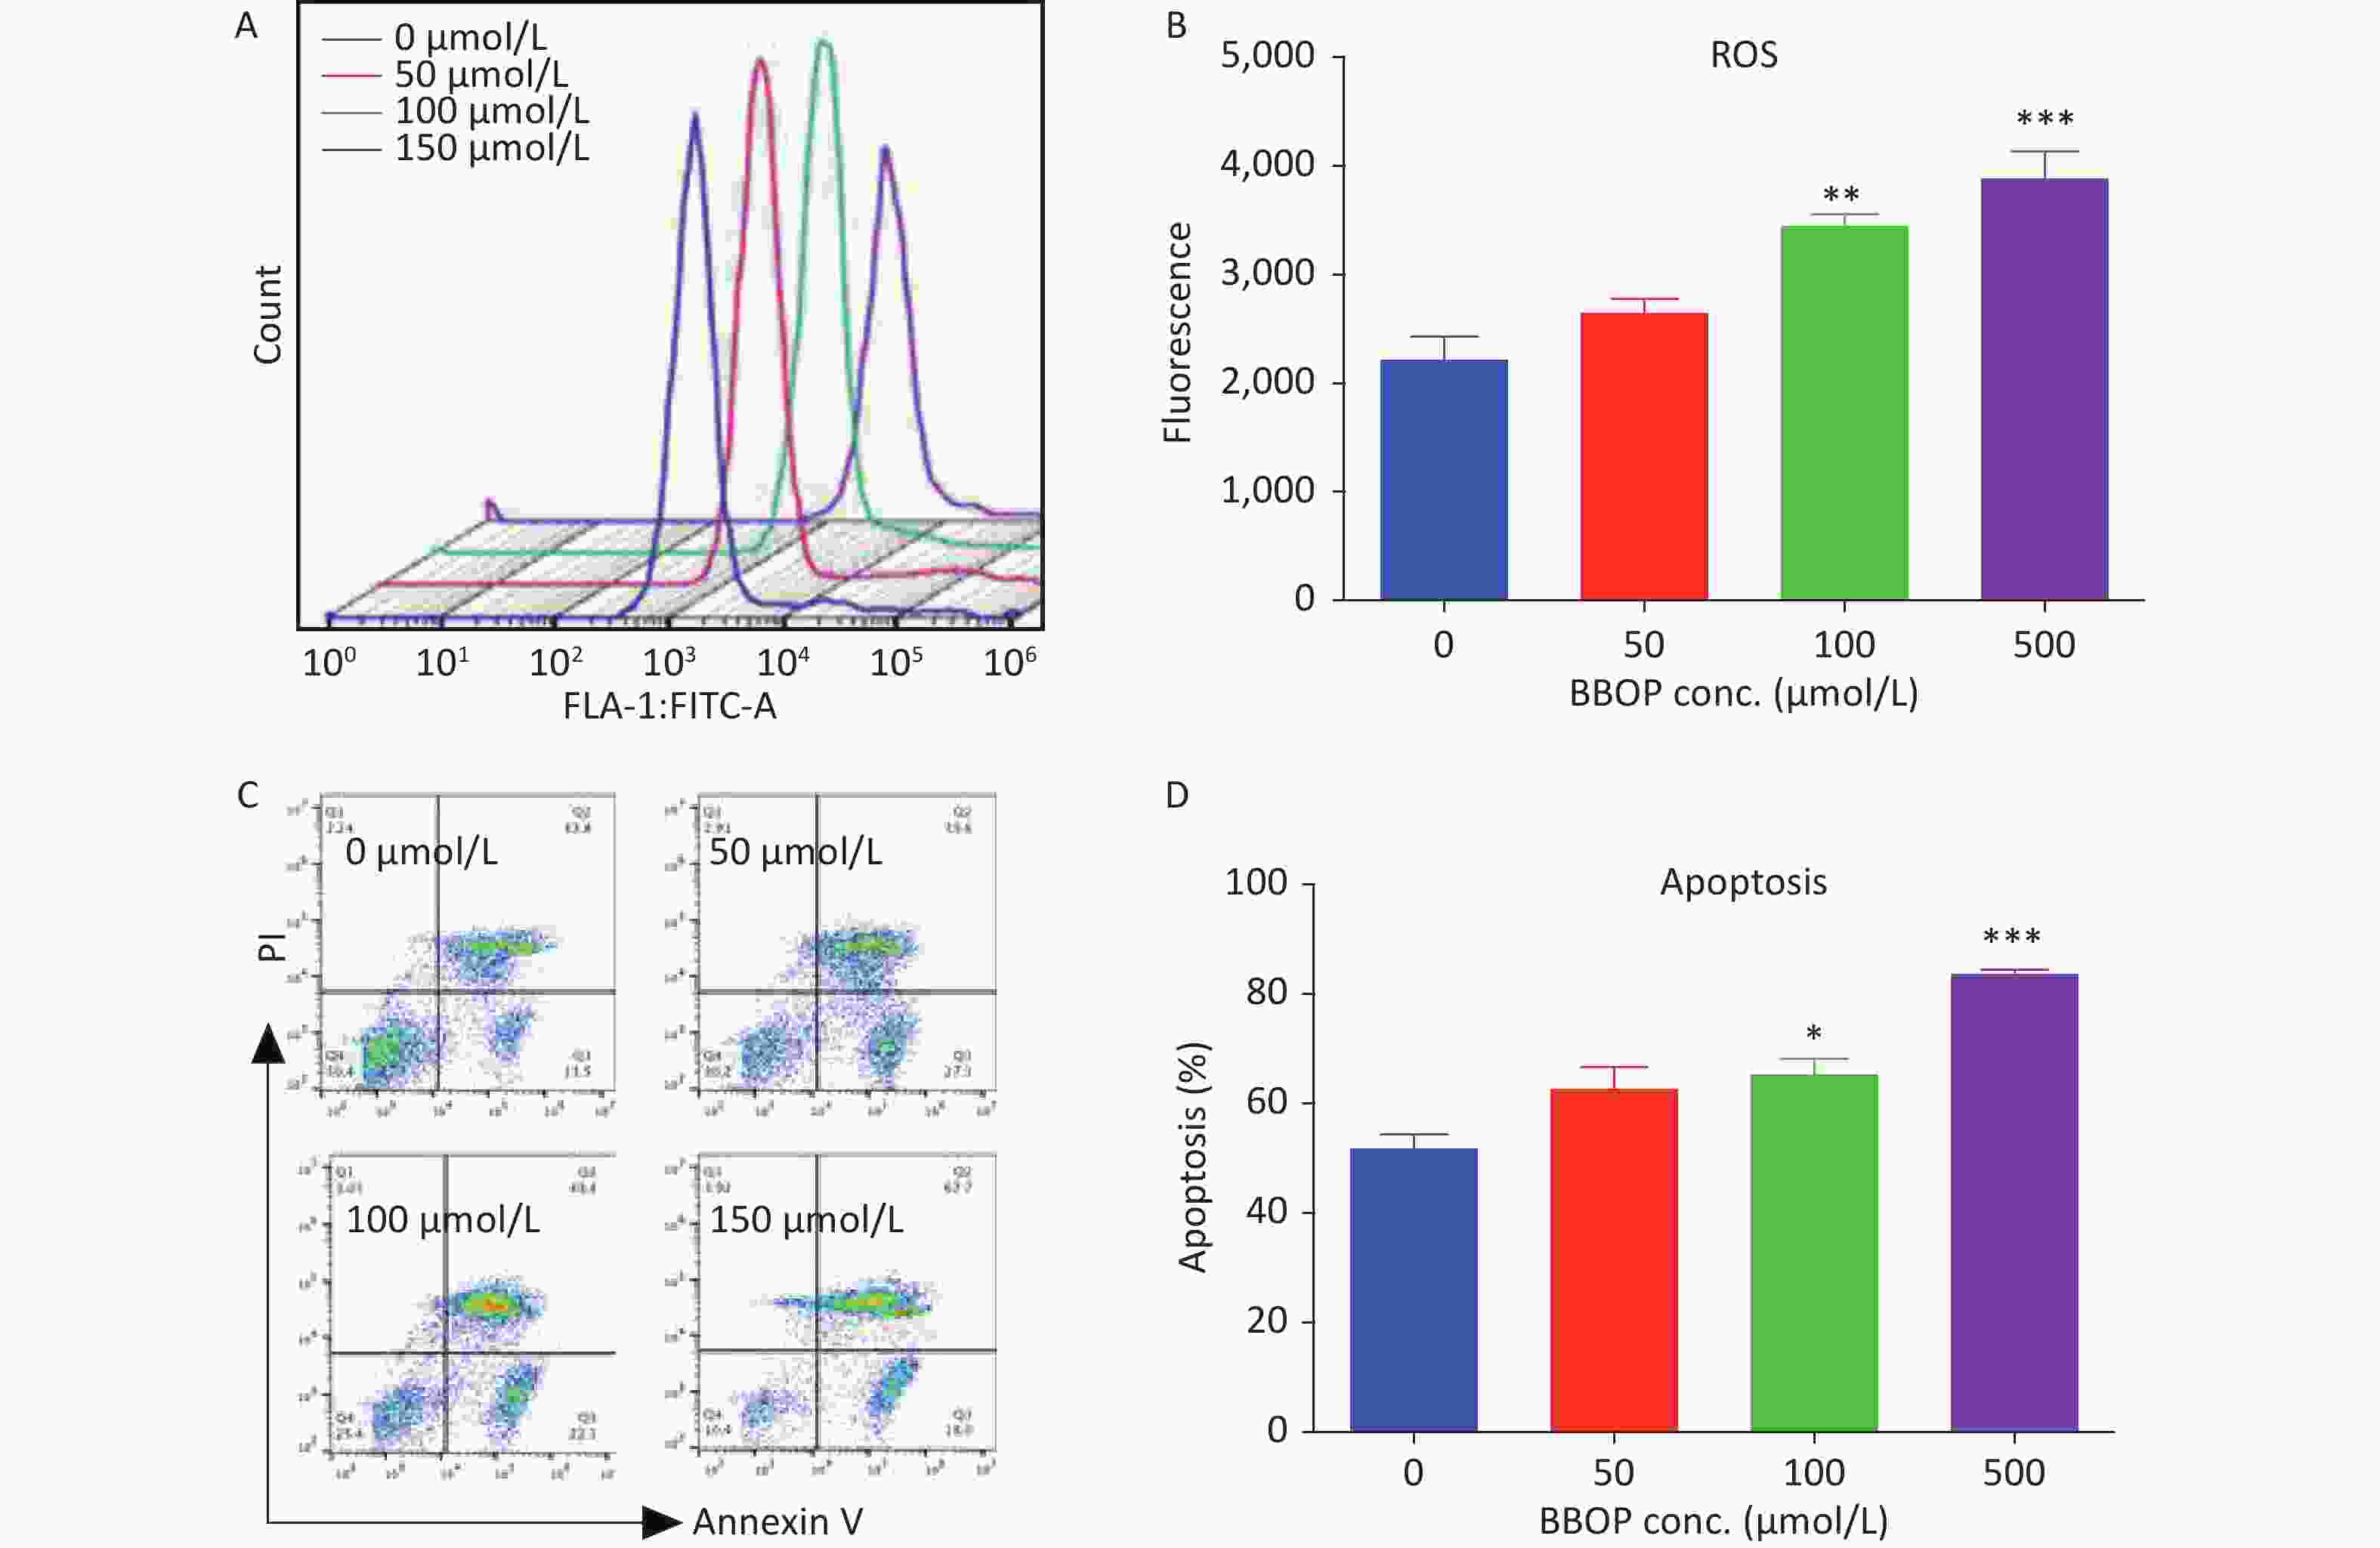
Figure 8. Effects of BBOP on reactive oxygen species (ROS) and apoptosis in Leydig cells from 35-day-old rats. Leydig cells were cultured for 24 h. Panel A: ROS fluorescence spectrum. Panel B: quantification of ROS levels. Panel C: apoptosis spectrum. Panel D: quantification of the apoptosis rate. Mean ± SEM, n = 3. *P < 0.05, **P < 0.01, and ***P < 0.001 in the BBOP group versus the control (0 μmol/L).
-
In this study, exposure to BBOP significantly decreased serum testosterone levels; down-regulated the expression of several steroidogenesis-associated genes; and decreased the LH and FSH levels after pubertal exposure. Therefore, BBOP delays puberty onset by perturbing Leydig cell development during puberty.
The alterations in serum LH and FSH levels indicated that pituitary function might be affected by BBOP exposure. Indeed, BBOP markedly down-regulated the expression of the rate-limiting genes Lhb and Fshb (Figure 3). Because the pituitary-secreted LH is the main factor regulating Leydig cells, one possible mechanism underlying the effects of BBOP on serum testosterone levels might have been direct interference with gonadotropin synthesis by the pituitary gland. This phenomenon has also been observed with 500 mg/kg bw per day DBP exposure to pubertal male rats[33]. However, DBP increases serum FSH levels mg/kg bw per day after exposure of male rats to at 500 mg/kg bw per day[33]. Moreover, BBOP decreased serum FSH levels (this study). Because LH and FSH lose negative feedback stimuli [33] after BBOP treatment, BBOP may impair testosterone biosynthesis partly via interfering with pituitary function, thereby indirectly inhibiting Leydig cell steroidogenesis. We also observed a significant increase in Gnrhr mRNA levels in the pituitary gland (Figure 3), thus indicating that the negative feedback mechanism for GnRH secretion in the hypothalamus caused by the BBOP-mediated decrease in serum testosterone levels remained intact, because the expression of Gnrhr in the pituitary gland is primarily regulated by GnRH[34].
Decreases in FSH production may also affect Sertoli cell function. Indeed, BBOP at 500 mg/kg bw per day markedly decreased the expression of DHH mg/kg bw per day. DHH is a critical growth factor regulating the proliferation and differentiation of Leydig cells postnatally[35]. DHH knockout mice show a lack of mature Leydig cells and significantly diminished testosterone levels[36].
In this study, we examined the general Leydig cell biomarker CYP11A1, and the mature Leydig cell biomarkers INSL3 and HSD11B1, after BBOP exposure. BBOP significantly decreased the expression of CYP11A1 at doses of 10 mg/kg or higher, and the expression of INSL3 and HSD11B1 at a dose of 500 mg/kg bw per day. The down-regulation of INSL3 and HSD11B1 indicated that Leydig cells after BBOP exposure are in an immature stage. We also examined the number of Leydig cells after immunohistochemical staining of CYP11A1 and HSD11B1. Interestingly, BBOP at 500 mg/kg bw per day significantly decreased the number of CYP11A1+ cells mg/kg bw per day but not HSD11B1+ Leydig cells. This finding indicated that the decrease in the number of Leydig cells came from CYP11A1+ and HSD11B1- Leydig cells, and that BBOP compromises the maturation of progenitor Leydig cells. Leydig cell size increases with maturity[23]. We further studied the cell dimensions of Leydig cells. The immunohistochemical results indicated that BBOP significantly decreased Leydig cell area and cytoplasmic dimension, thereby further confirming that the Leydig cells were immature at the end of BBOP treatment.
An association between Leydig cell dysfunction and oxidative stress induced by several phthalates has been documented [37-39]. Oxidative stress is a possible cause through which BBOP may affect the development of Leydig cells. The equilibrium between ROS and antioxidant proteins is critical for Leydig cell development and cell apoptosis[40,41]. In this study, BBOP significantly increased MDA amounts and repressed the antioxidant enzymes SOD1 and SOD2, which catalyze the conversion of superoxide radicals into hydrogen peroxide and oxygen. Immunohistochemistry has indicated the presence of SOD1 in rat Leydig cells[33], which are particularly sensitive to endocrine disruptors. In primary Leydig cells, BBOP at 100 or 500 μmol/L markedly increased ROS generation, thus confirming that BBOP induces oxidative stress in Leydig cells.
Increased ROS in Leydig cells may lead to cell apoptosis. Indeed, BBOP at 100 and 250 μmol/L significantly induced apoptosis of Leydig cells in vitro after 24 h of treatment. BAX/BCL2 apoptosis pathway analysis indicated that BBOP promoted the expression of BAX and inhibited the expression of BCL2. BAX is the major protein that triggers cell apoptosis. In contrast, BCL2 is an anti-apoptotic protein in the Bcl2 family, which is located in the outer membrane of mitochondria, the nuclear membrane, and the cytoplasm of the endoplasmic reticulum[42], where it blocks BAX-mediated action[43]. Thus, BBOP was found to be involved in the regulation of Leydig cell apoptosis, and to decrease Leydig cells at the highest dose.
SIRT1 is an enzyme that deacetylates transcription factors and acts as an energy sensor. In this study, BBOP markedly down-regulated SIRT1 levels in the testes. SIRT1 is also involved in ROS removal in tissue. Inhibition of SIRT1 significantly increases ROS levels and decreases steroid synthesis in MA-10 Leydig cells[41]. Increased ROS may interfere with other signaling pathways, including the AKT, ERK1/2, GSK3β, and mTOR pathways. AKT1 and AKT2 are present in the testis, and suppression of AKT1/AKT2 phosphorylation causes growth retardation, testicular tissue apoptosis, and decreased testosterone biosynthesis[44,45]. Indeed, BBOP exposure significantly decreased AKT1 phosphorylation at a dose of 10 mg/kg or higher, and the phosphorylation of AKT2 at a dose of 500 mg/kg bw per day. mTOR is a downstream protein in the AKT cascade, and Chen et al. have found that the PI3K/AKT/mTOR signaling pathway plays an important role in the proliferation, survival, and apoptosis of Leydig cells[46]. Indeed, BBOP at 500 mg/kg bw per day significantly decreased phosphorylated mTOR mg/kg bw per day.
The mTOR pathway is a major regulator of autophagy[47]. mTORC1 inhibits autophagy initiation by phosphorylating autophagy-associated genes[48]. When mTOR is inhibited, autophagy is induced[47]. Although basal autophagy is critical for positive regulation of Leydig cell steroidogenesis through up-regulation of SCARB1[49,50], excessive autophagy can lead to the inhibition of steroidogenesis and even cell death[51]. In this study, phosphorylated mTOR significantly decreased after 500 mg/kg bw per day BW BBOP exposure (Figure 7), thus possibly leading to autophagy. Studies have also shown that the PI3K/AKT pathway regulates autophagy through regulating mTOR[52]; therefore, the significant decrease in AKT1/AKT2 phosphorylation after BBOP treatment might be associated with the induction of autophagy. Whether BBOP can induce severe autophagy remains unclear. However, some phthalates, such as the metabolite of di-ethylhexyl phthalate, have been found to induce autophagy in testicular cells[53,54]. Future studies on the induction of autophagy of Leydig cells by BBOP may provide valuable information.
Many studies have shown that ERK1/2 signaling is involved in the development of Leydig cells, through mediating the regulation of steroid production[55,56]. Knockout of the ERK1/2 pathway in mice significantly decreases testosterone biosynthesis and Leydig cell maturation [16]. In this study, BBOP at 500 mg/kg bw per day significantly decreased ERK1/2 phosphorylation (pERK1/2) mg/kg bw per day. GSK3β[57,58] plays a role in cell survival and development. In this study, BBOP was shown to inhibit GSK3β phosphorylation.
Beyond the effects of these pathways, BBOP may also directly inhibit steroidogenic enzymes. Previous studies have shown that BBOP inhibits rat HSD3B1 and HSD17B3 activity with Ki values of 50.02 and 28.35 μmol/L, respectively [59].
BBOP is a unique phthalate whose alcohol moiety contains oxygen atoms in the alkyl chain together with 6 carbons (C6). Compared with C1-C2 and C7-C13 phthalates, C4-C6 phthalates have been reported to have more potent inhibitory effects on Leydig cell function[7]. Indeed, BBOP had comparable inhibition of LC development as DBP (C4) in puberty[33]. However, unlike DBP, BBOP had no stimulatory effect on testosterone biosynthesis at a low dose (10 mg/kg) and potently suppressed the expression of Lhb and Fshb in the pituitary gland, thereby indicating that the addition of oxygen atoms in the alcohol carbon chain leads to more severe toxicity. BBOP at 1,000 mg/kg bw per day has been reported to cause death in female rats mg/kg bw per day [8], whereas DBP gavage of 2,000 mg/kg bw per day does not have such effects [60].
Many phthalates, including DEHP and DBP, affect the development of Leydig cells in the fetal testis and adult Leydig cells in the pubertal testis. Through the study of in utero DBP exposure in rats, Driesche et al. have proposed that phthalates induce the expression of COUP-TFII, thereby leading to masculinization disorders in rodents[61]. However, clear species-dependent differences in phthalate-mediated effects exist. Experiments involving pubertal exposure of young marmosets and human fetal testis xenografts to DEHP have shown that the sensitivity of these two species to phthalates is less than that of rats[62], thus potentially explaining the differences in toxicokinetics observed among rats, marmosets, and humans[63,64]. Whether BBOP shows toxicokinetic differences requires further study.
Epidemiological studies have demonstrated that some phthalates are negatively associated with semen quality. A study in 463 infertile men has reported a negative correlation between benzyl butyl phthalate metabolite and sperm count[65]. A study in Wuhan in 2013 has found that the DEHP metabolite is negatively associated with serum estradiol and testosterone, and positively associated with sperm damage and apoptosis[66]. Xu et al. have also studied seven phthalates among 116 (32 normal control men and 84 infertile men) in Jiangsu Province (China) and found that the BBOP levels (0.079 mg/L) in the infertile semen were approximately half those of DEHP, whereas the BBOP levels in infertile semen were markedly higher than those in the normal healthy controls[67]. In this regard, the Chinese population is widely exposed to BBOP. Because many studies have used doses as high as 750–1,000 mg/(kg·day) for DEHP in rodents[68], the corresponding doses for BBOP in this study should be associated with human exposure levels.
Although no epidemiological and animal studies have examined the effects of BBOP on female puberty development, investigations of other phthalates have shown that phthalates promote puberty rather than affecting male reproduction[69,70].
This was a classic toxicity study of the effect of BBOP on the development of Leydig cells in puberty. The limitation of this study is the inability to extrapolate the research results to humans. More epidemiological studies are required to demonstrate the negative correlation of BBOP with human reproduction and BBOP exposure levels.
-
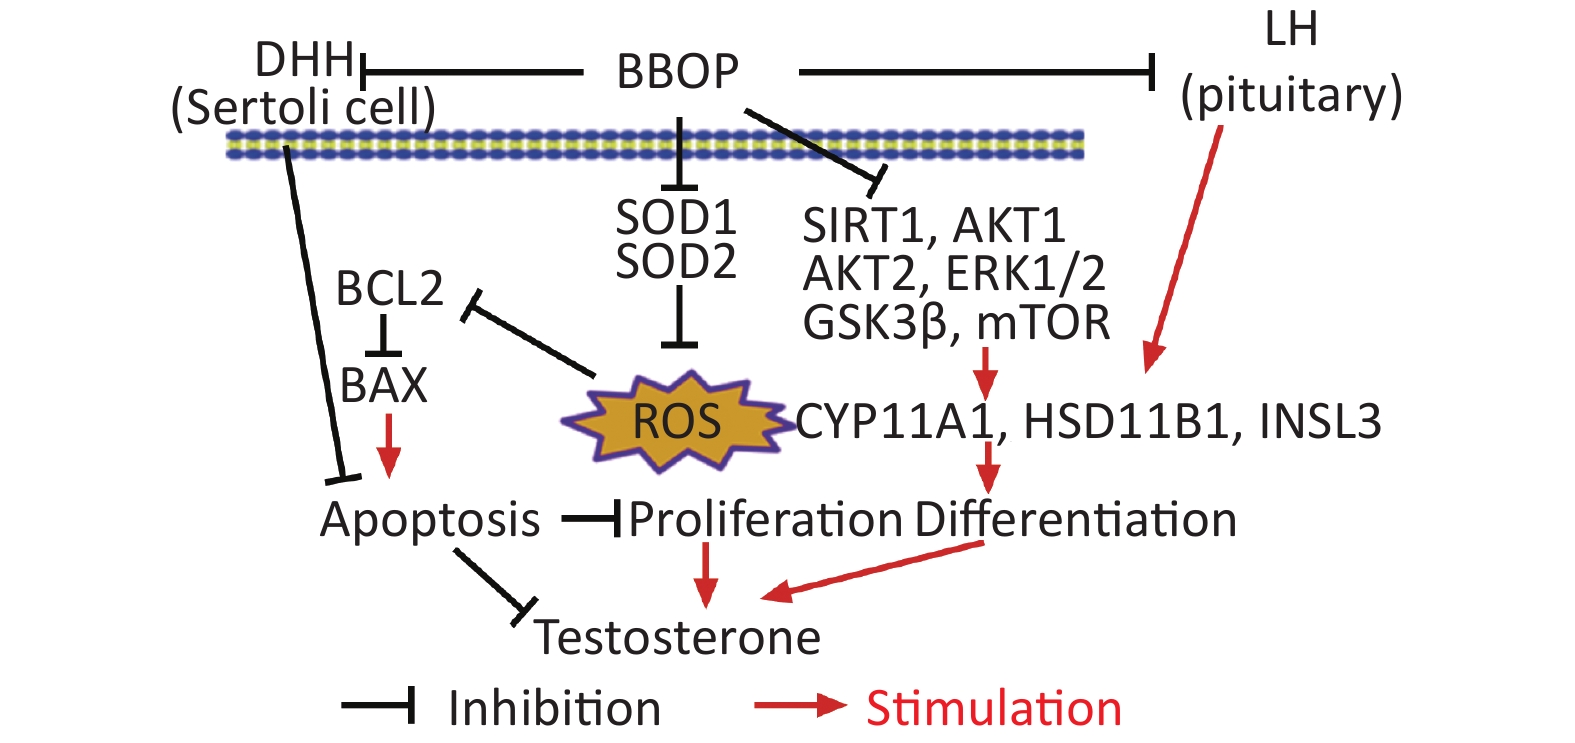
Exposure of male rats to BBOP in puberty delays puberty onset by inhibition of Leydig cell development. BBOP blocks the secretion of LH and FSH in the pituitary gland, and decreases SIRT1. Consequently, ROS are induced; phosphorylation of AKT1, AKT2, ERK1/2, GSK3β, and mTOR decreases; and the expression of steroidogenic enzymes and testosterone biosynthesis is inhibited.
-
The authors declare that the research was conducted in the absence of any commercial or financial relationships that could be construed as a potential conflict of interest.
-
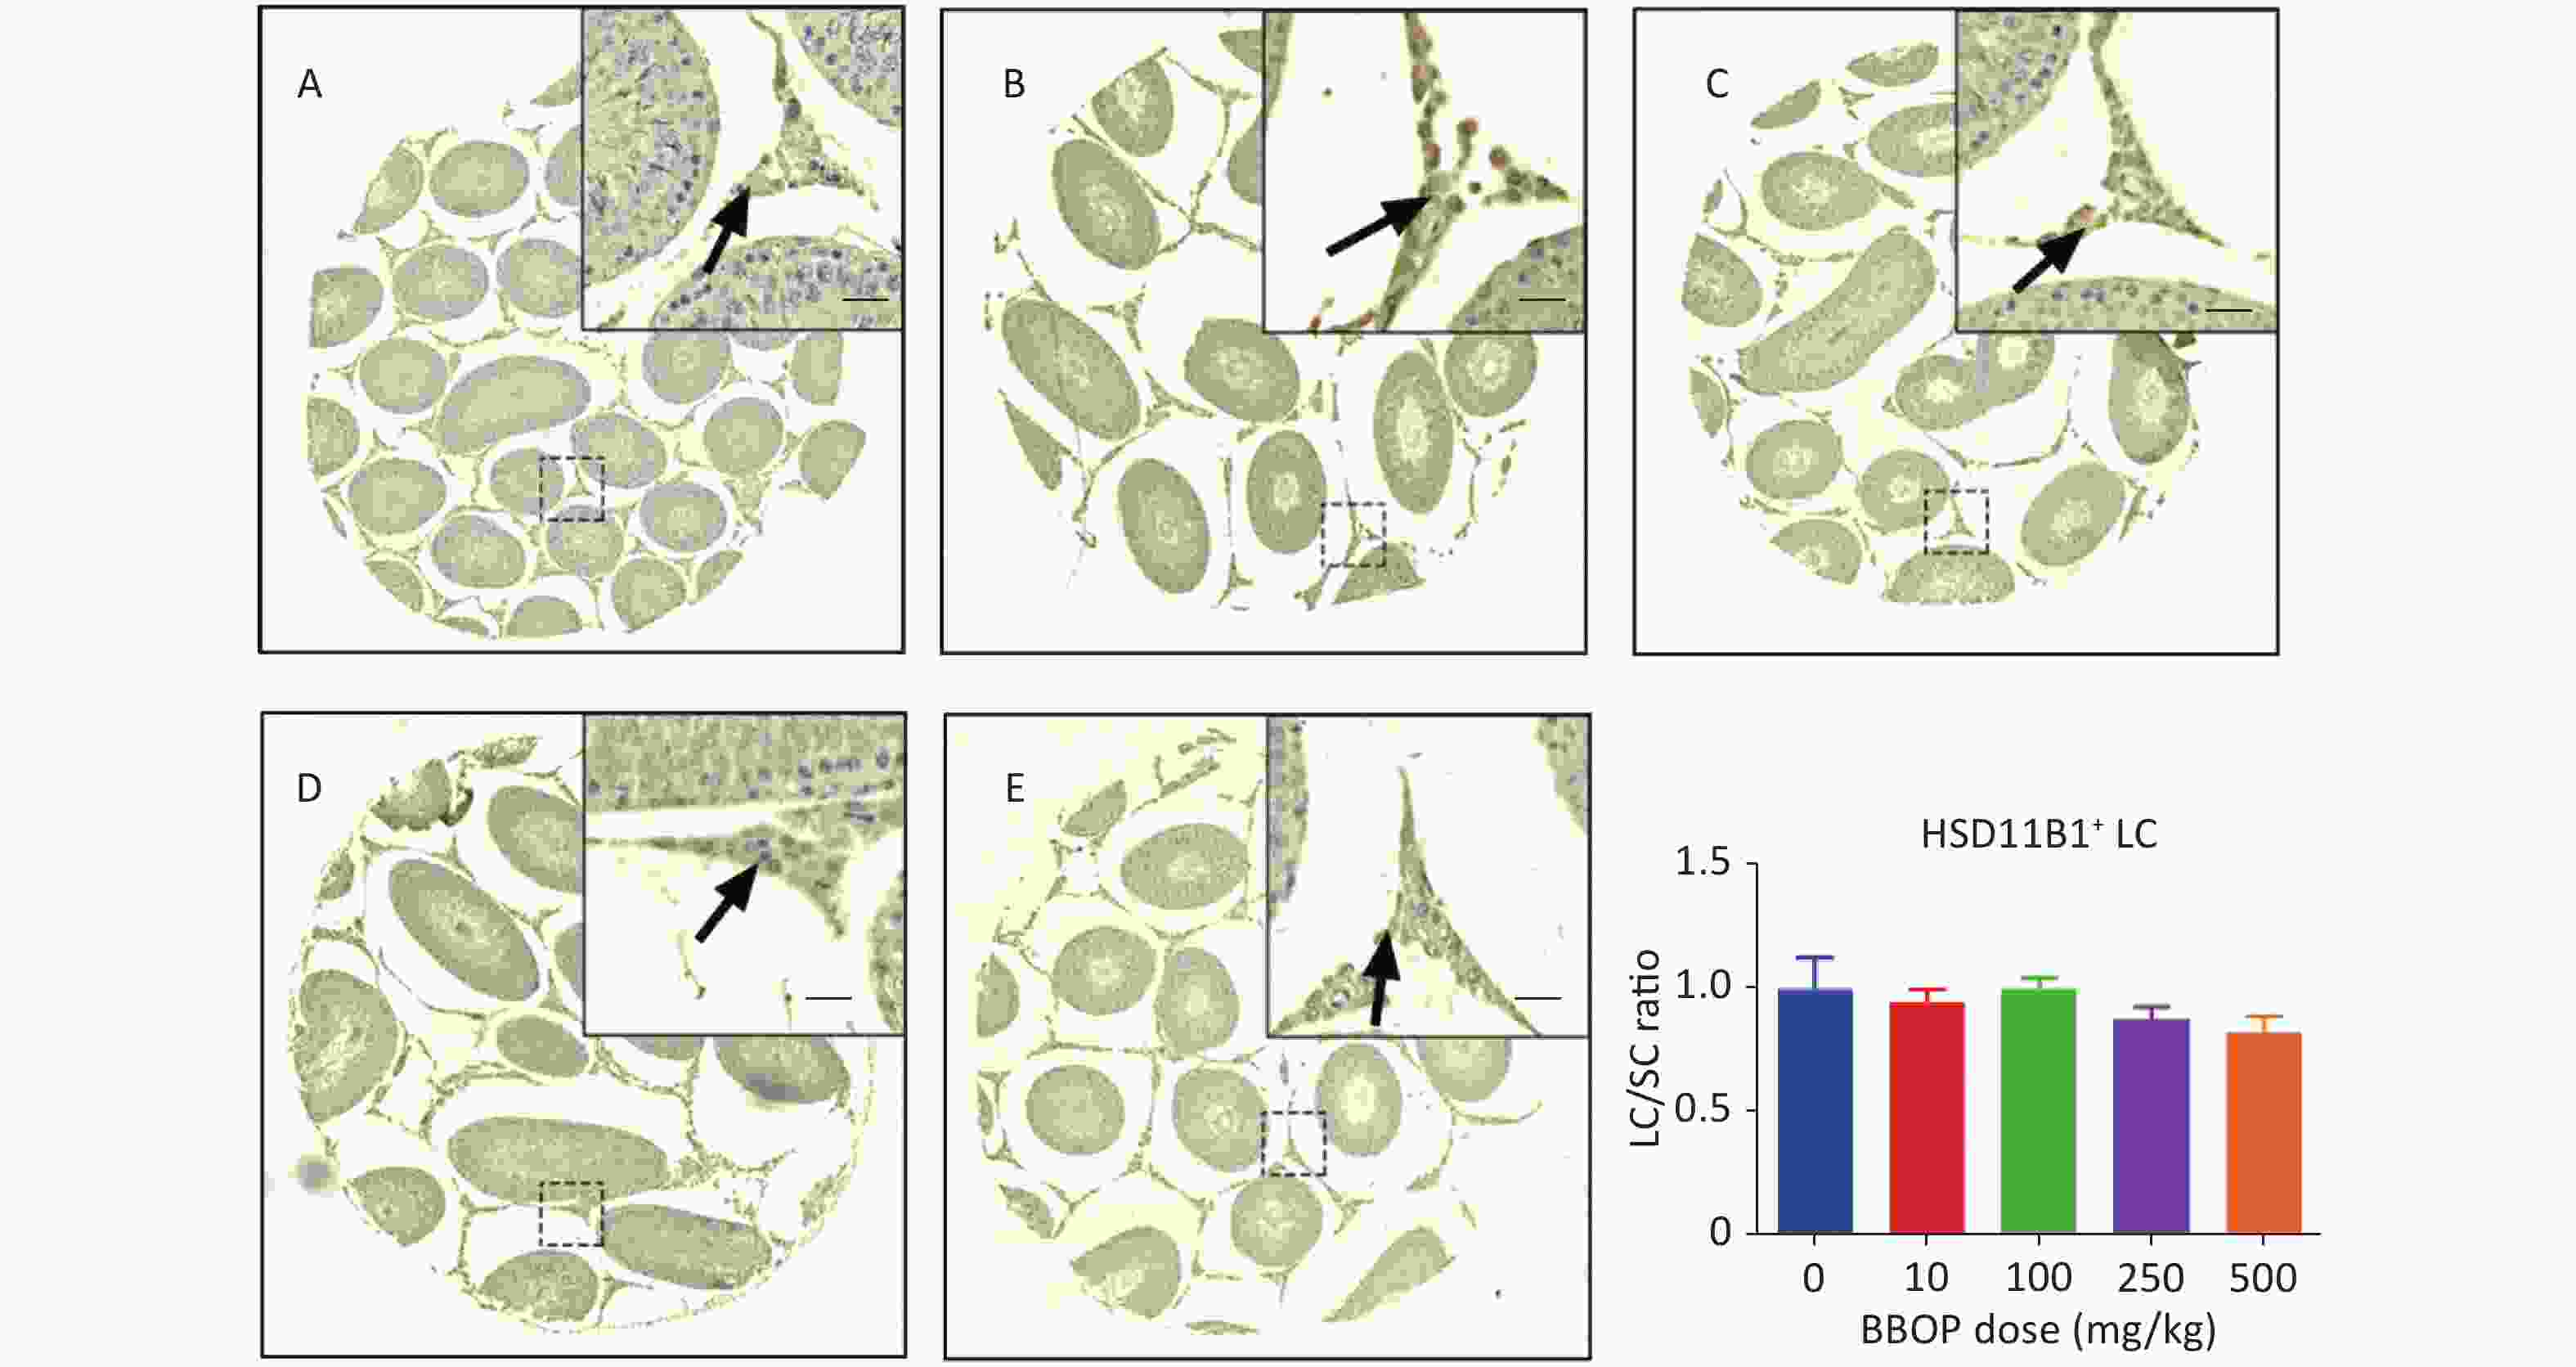
Figure S2. Immunohistochemical staining of HSD11B1 and Leydig cell (LC) number in the testis after BBOP exposure from postnatal day (PND) 35 to 56. Panels A–E, HSD11B1 staining for 0, 10, 100, 250, and 500 mg/kg BBOP group, respectively; Scale bar = 20 μm; Panel F, quantitation of LC number [normalized to Sertoli cell (SC) number]; Mean ± SEM, n = 6. There was no significant difference in the BBOP group versus the control (0 mg/kg).
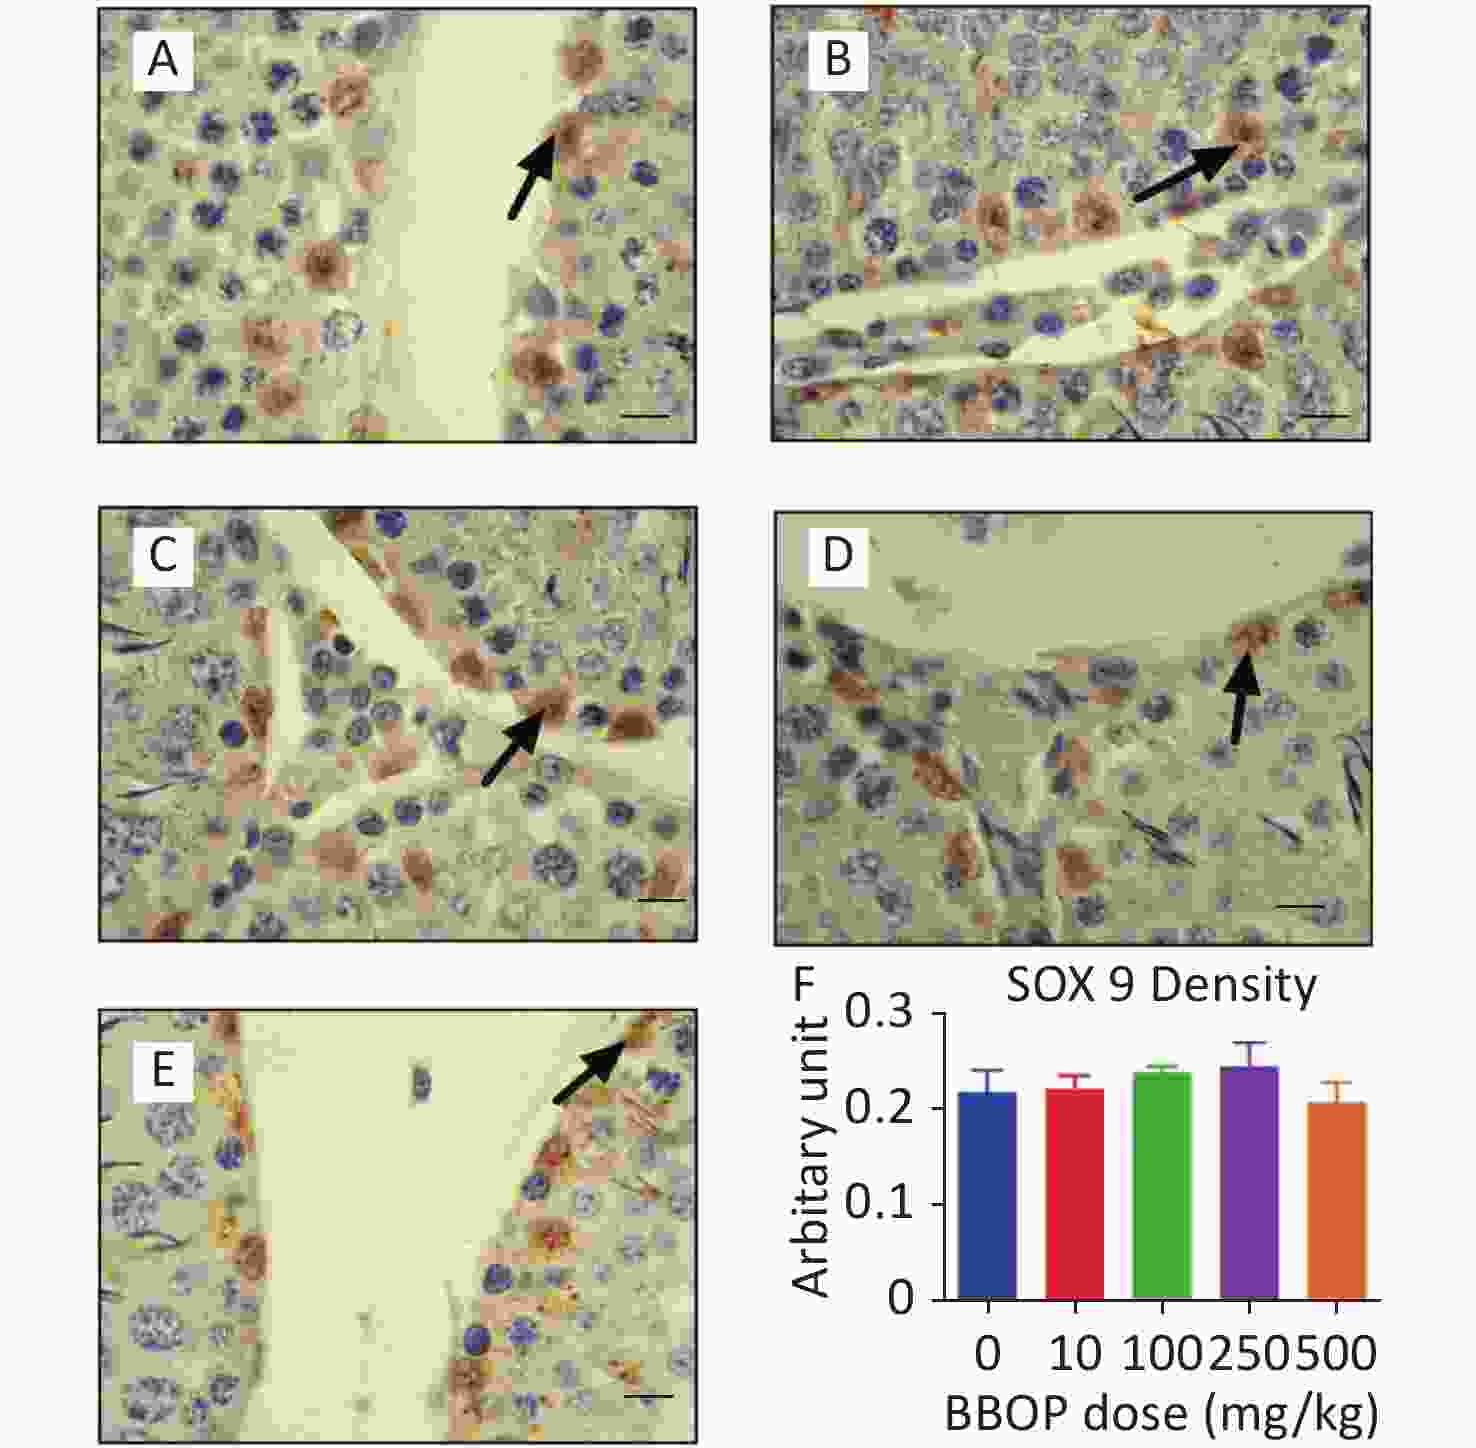
Figure S3. Semi-quantitative measurement SOX9 density in the testis after BBOP exposure from postnatal day (PND) 35 to 56. Panels A–E, SOX9 staining for 0, 10, 100, 250, and 500 mg/kg BBOP group, respectively; Black arrow points to SOX9 staining; Scale bar = 20 μm. Panel F, SOX9 density; Mean ± SEM, n = 6. There is no significant difference in the BBOP group versus the control (0 mg/kg).
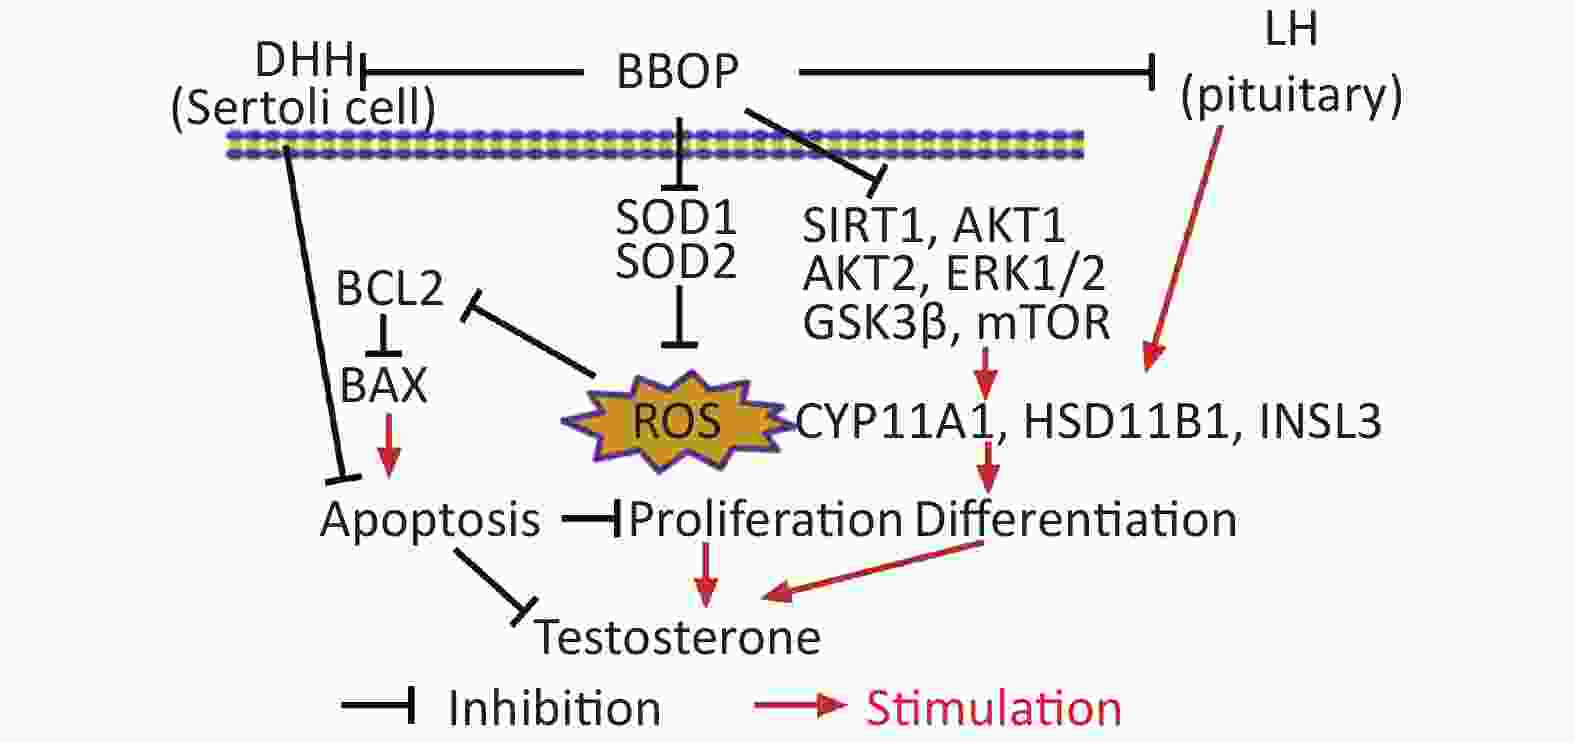
Figure S4. Graphical abstract
HTML
Reagents
Animals and Experimental Design
Measurement of Serum Testosterone Concentrations
Measurement of Serum LH and FSH Levels
Immunohistochemistry
Counting Leydig Cell and Sertoli Cell Numbers
Measurement of Leydig Cell Morphological Metrics
Total RNA Purification and qPCR
Western Blotting
Semi-quantitative Immunohistochemical Measurement of CYP11A1 and SOX9 Density
Detection of MDA Content in Testicular Homogenates
Isolation and Culture of Leydig Cells
Measurement of ROS by DCFH-DA and Apoptosis by Annexin V/PI
Statistical Analysis
Weights of the Body, Testis, and Epididymis after BBOP Exposure
BBOP Decreases Serum Testosterone Levels in Vivo
BBOP Does not affect Sertoli Cell Number but affects the Number of CYP11A1+Leydig Cells in Vivo
BBOP affects Gene Expression in Leydig and Sertoli Cells and the Pituitary Gland
BBOP Interferes with Protein Levels in Leydig and Sertoli Cells
BBOP Decreases Leydig Cell Size and Cytoplasmic Size
BBOP Induces ROS and Interferes with the Expression of Antioxidant- and Apoptosis-Associated Genes in Vivo
BBOP Alters Several Pathways in Vivo
BBOP induces ROS and Apoptosis in Primary Leydig Cells
AUTHOR CONTRIBUTIONS LIU Miao Qing, CHEN Hai Qiong, DAI Hai Peng, LI Jing Jing, TIAN Fu Hong, WANG Yi Yan, CHEN Cong De, LI Xiao Heng, LI Jun Wei, LI Zhong Rong, and GE Ren Shan defined the research topic. GE Ren Shan and LI Zhong Rong conceptualized the study design and analyzed the data. GE Ren Shan wrote the paper. All authors have contributed to, read, and approved the manuscript.
&These authors contributed equally to this work.
 22068Supplementary Materials.pdf
|

|

 Quick Links
 DownLoad: