


-
Severe acute respiratory syndrome coronavirus 2 (SARS-CoV-2) is responsible for the outbreak and rampant transmission of coronavirus disease 2019 (COVID-19)[1]. Although many measures have been taken over the past few years, confirmed cases of COVID-19 are still burgeoning because of its high contagiousness and variability, which has become a potential threat to global public health security[2]. Early diagnosis is essential to containing disease outbreaks[3]. Hence, developing rapid, inexpensive, and sensitive diagnostic tests that can be applied in clinical and non-clinical settings is necessary[4]. SARS-CoV-2 is a beta-coronavirus with a genome encoding four structural proteins: spike (S), envelope (E), matrix (M), and nucleocapsid (N)[5]. The S protein is a transmembrane protein consisting of two functional subunits, S1 and S2. It is pivotal in viral attachment, fusion, and cell entry[6]. Given the high affinity of a receptor-binding domain for angiotensin-converting enzyme II (ACE2), the S1 subunit binds to ACE2 on the surface of human cells, whereas the S2 subunit fuses the virus and host cell membranes[7]. Therefore, the S protein could be used as a target for the detection of COVID-19[8, 9].
For rapid and accurate detection of COVID-19, highly sensitive immunological diagnostic techniques that directly identify viral antigens in clinical samples involving minimum sample preparation procedures are required[10]. At present, real-time reverse transcription-polymerase chain reaction is a gold standard for COVID-19 diagnosis[11], which is based on the detection of unique viral RNA sequences[12]. This method, albeit accurate, requires a long testing time, trained operators, multiple sample handling steps, and specialized testing laboratories[13]. On the contrary, rapid antibody-based serological tests play a pivotal role in the diagnosis of COVID-19, but these methods are less sensitive and prone to false-negative results[14]. By contrast, electrochemical biosensors provide a fast, sensitive, cost-effective, and easy detection strategy[15]. In addition, the sample does not require complicated preprocessing, which greatly reduces the burden on the inspector. Furthermore, the selectivity, accuracy, and specificity of electrochemical sensors can be enhanced by introducing high-affinity recognition elements. Therefore, electrochemical biosensors can be used in detecting a large number of samples, screening infected patients, and promoting infectious disease management. In recent years, materials chemistry has been rapidly developed. A variety of emerging competent materials have shown application potential in the field of biosensors. Microgels stand out among new materials because of their unique chemical functionality, macromolecular structure, biocompatibility, and deformability, leading to new applications in the sensor field[16]. Poly-N-isopropylacrylamide (pNIPAM) is a commonly used sensor material. Researchers have improved their performance by copolymerizing them with other materials. The copolymerization of NIPAM with other materials not only improves the mechanical properties of hydrogels but also provides favorable electrical conductivity to hydrogels[17]. Moreover, this functionally modifiable affinity material provides considerable potential for the design of highly selective and controllable biosensors and immunoassays[18]. It also has a broad range of applications in drug delivery systems[19], smart light-controlled actuators[20], electrochemical biosensors[21], and many other fields[22].
Gold nanomaterials have become a hot metal in the field of biosensors because of their excellent properties[23]. These properties include easy synthesis, strong adsorption, large surface area, and easy binding to biomolecules, which are suitable for electrochemical/electrobiosensors. Given their good conductivity, biocompatibility, and catalytic properties, gold nanomaterials have been used to bind captured molecules or immobilize target substances to improve detection limits[24]. Here, based on an electrochemical sensor, a microgel composite is developed to detect the SARS-CoV-2 S protein. The composite consists of a three-dimensional (3D) pNIPAM copolymer hydrogel and gold nanoparticles. Given its abundant carboxyl groups, the hydrogel could covalently bind with amino-containing macromolecules. The conductive properties of gold nanoparticles (AuNPs) have been extensively studied. Apart from being a simple process and biocompatible with simple antibody physisorption and conjugation, the synthesis of AuNPs to improve the electron transport properties of the sensor upon binding led us to select such a process as the signal amplification component in this work[25]. In this study, pNIPAM was cross-linked with acrylic acid (AAc, pNIPAM-co-AAc) to achieve reversible swelling of the gel in an aqueous solution[26] and then uniformly mixed with gold nanoparticles to form electrode modification materials[27]. The surface of the used gold electrode was modified by a composite gel material into a complete and dense conductive film. The porous network structure provided a highly biocompatible and contamination-resistant microenvironment, similar to aqueous biological tissues, which ensured a good reaction environment for S protein capture, thereby improving the specificity and sensitivity of the sensing platform for S protein detection. Subsequently, the carboxyl groups on the surface of the material were activated by using a solution containing N-(3-dimethylaminopropyl)-N′-ethylcarbodiimide hydrochloride (EDC) and N-hydroxysuccinimide (NHS). These carboxyl groups were bound to S protein antibodies on the surface layer, and the antibodies were used to capture the S protein. Differential pulse voltammetry (DPV) was adopted as the evaluator of the electrochemical performance of the sensor.
This method demonstrated a quick, inexpensive, highly specific, and accurate assessment of the S protein. Artificial saliva was used as the experimental sample, and the content of S protein could be analyzed without sample purification and separation. This sensing platform represents a novel, fast, and simplified method for detecting SARS-CoV-2 as an auxiliary tool to control the pandemic.
-
The experimental materials included chemical reagents of analytical grade and ultra-pure water (18.25 MΩ cm). Ammonium persulfate (APS), N,N′-methylenebis(2-acrylamide) (BIS), tetrahydroxymethylphosphonium chloride (THPC), EDC, and NHS were purchased from Shanghai Aladdin Biochemical Technology Co. Tetrachloroauric acid (HAuCl4) was purchased from Sanen Chemical Technology (Shanghai) Co. 3-Butenylamine hydrochloride (B-en-A) was purchased from Shanghai Dibai Biotechnology Co., Ltd. NIPAM was obtained from Shanghai McLean Biochemical Technology Co., Ltd. AAc was purchased from Alfa Aesar (China) Chemical Co., Ltd.
Diethyl pyrocarbonate-treated water, the original strain SARS-CoV-2 spike S1-His recombinant protein (verified by HPCL), and SARS-CoV-2 spike antibody (Rabbit PAb, Antigen Affinity Purified) were prepared and purified by Sangon Biotechnology Co. Phosphate-buffered solution (PBS, 0.1 mol/L pH 7.40) was prepared from NaCl, KCl, KH2PO4, and Na2HPO4. Artificial saliva was purchased from Xiamen Haibiao Technology Co., Ltd.
Electrochemical determination [electrochemical impedance spectroscopy (EIS), cyclic voltammetry (CV), and DPV] was performed using a CHI 660E electrochemical workstation (Shanghai Chenhua Instruments Co., Ltd., China). The CV measurement parameters were set as follows: an initial potential of 0.8 V, a high potential of 0.8 V, a low potential of −0.6 V, and a scanning rate of 0.1 Vs−1. The DPV parameters were as follows: a potential of −0.1 to 0.5 V, an amplitude of 0.05 V, a pulse width of 0.05 s, and a pulse period of 0.2 S. A conventional three-electrode system was used, in which a gold electrode served as a working electrode (diameter of 4 mm), Ag/AgCl as a reference electrode, and a platinum wire as an auxiliary electrode. During electrochemical analysis, PBS (pH 7.40) complemented with a redox agent in the form of 5 mmol/L [Fe(CN)6]3−/[Fe(CN)6]4− was adopted as the electrolyte.
-
In preparing the sensor, the electrodes were polished with 0.30 μm of α-alumina powder, cleaned in ethanol and deionized water for 5 min in an ultrasonic way, and then sequentially immersed in 2 mol/L KOH solution, 0.92 mol/L H2SO4 solution, and 0.8 mol/L HNO3 for 15 min. Next, these electrodes were rinsed with deionized water between each treatment to thoroughly clean the surface and finally dried at 50 °C. Gold electrodes were placed in 0.5 mol/L H2SO4 with potential voltages ranging from −0.6 to +0.8 V, and then reproducible CVs were obtained. Afterward, the gold electrodes were rinsed with deionized water and dried under N2 flow. This preconditioning decreases charge transfer resistance.
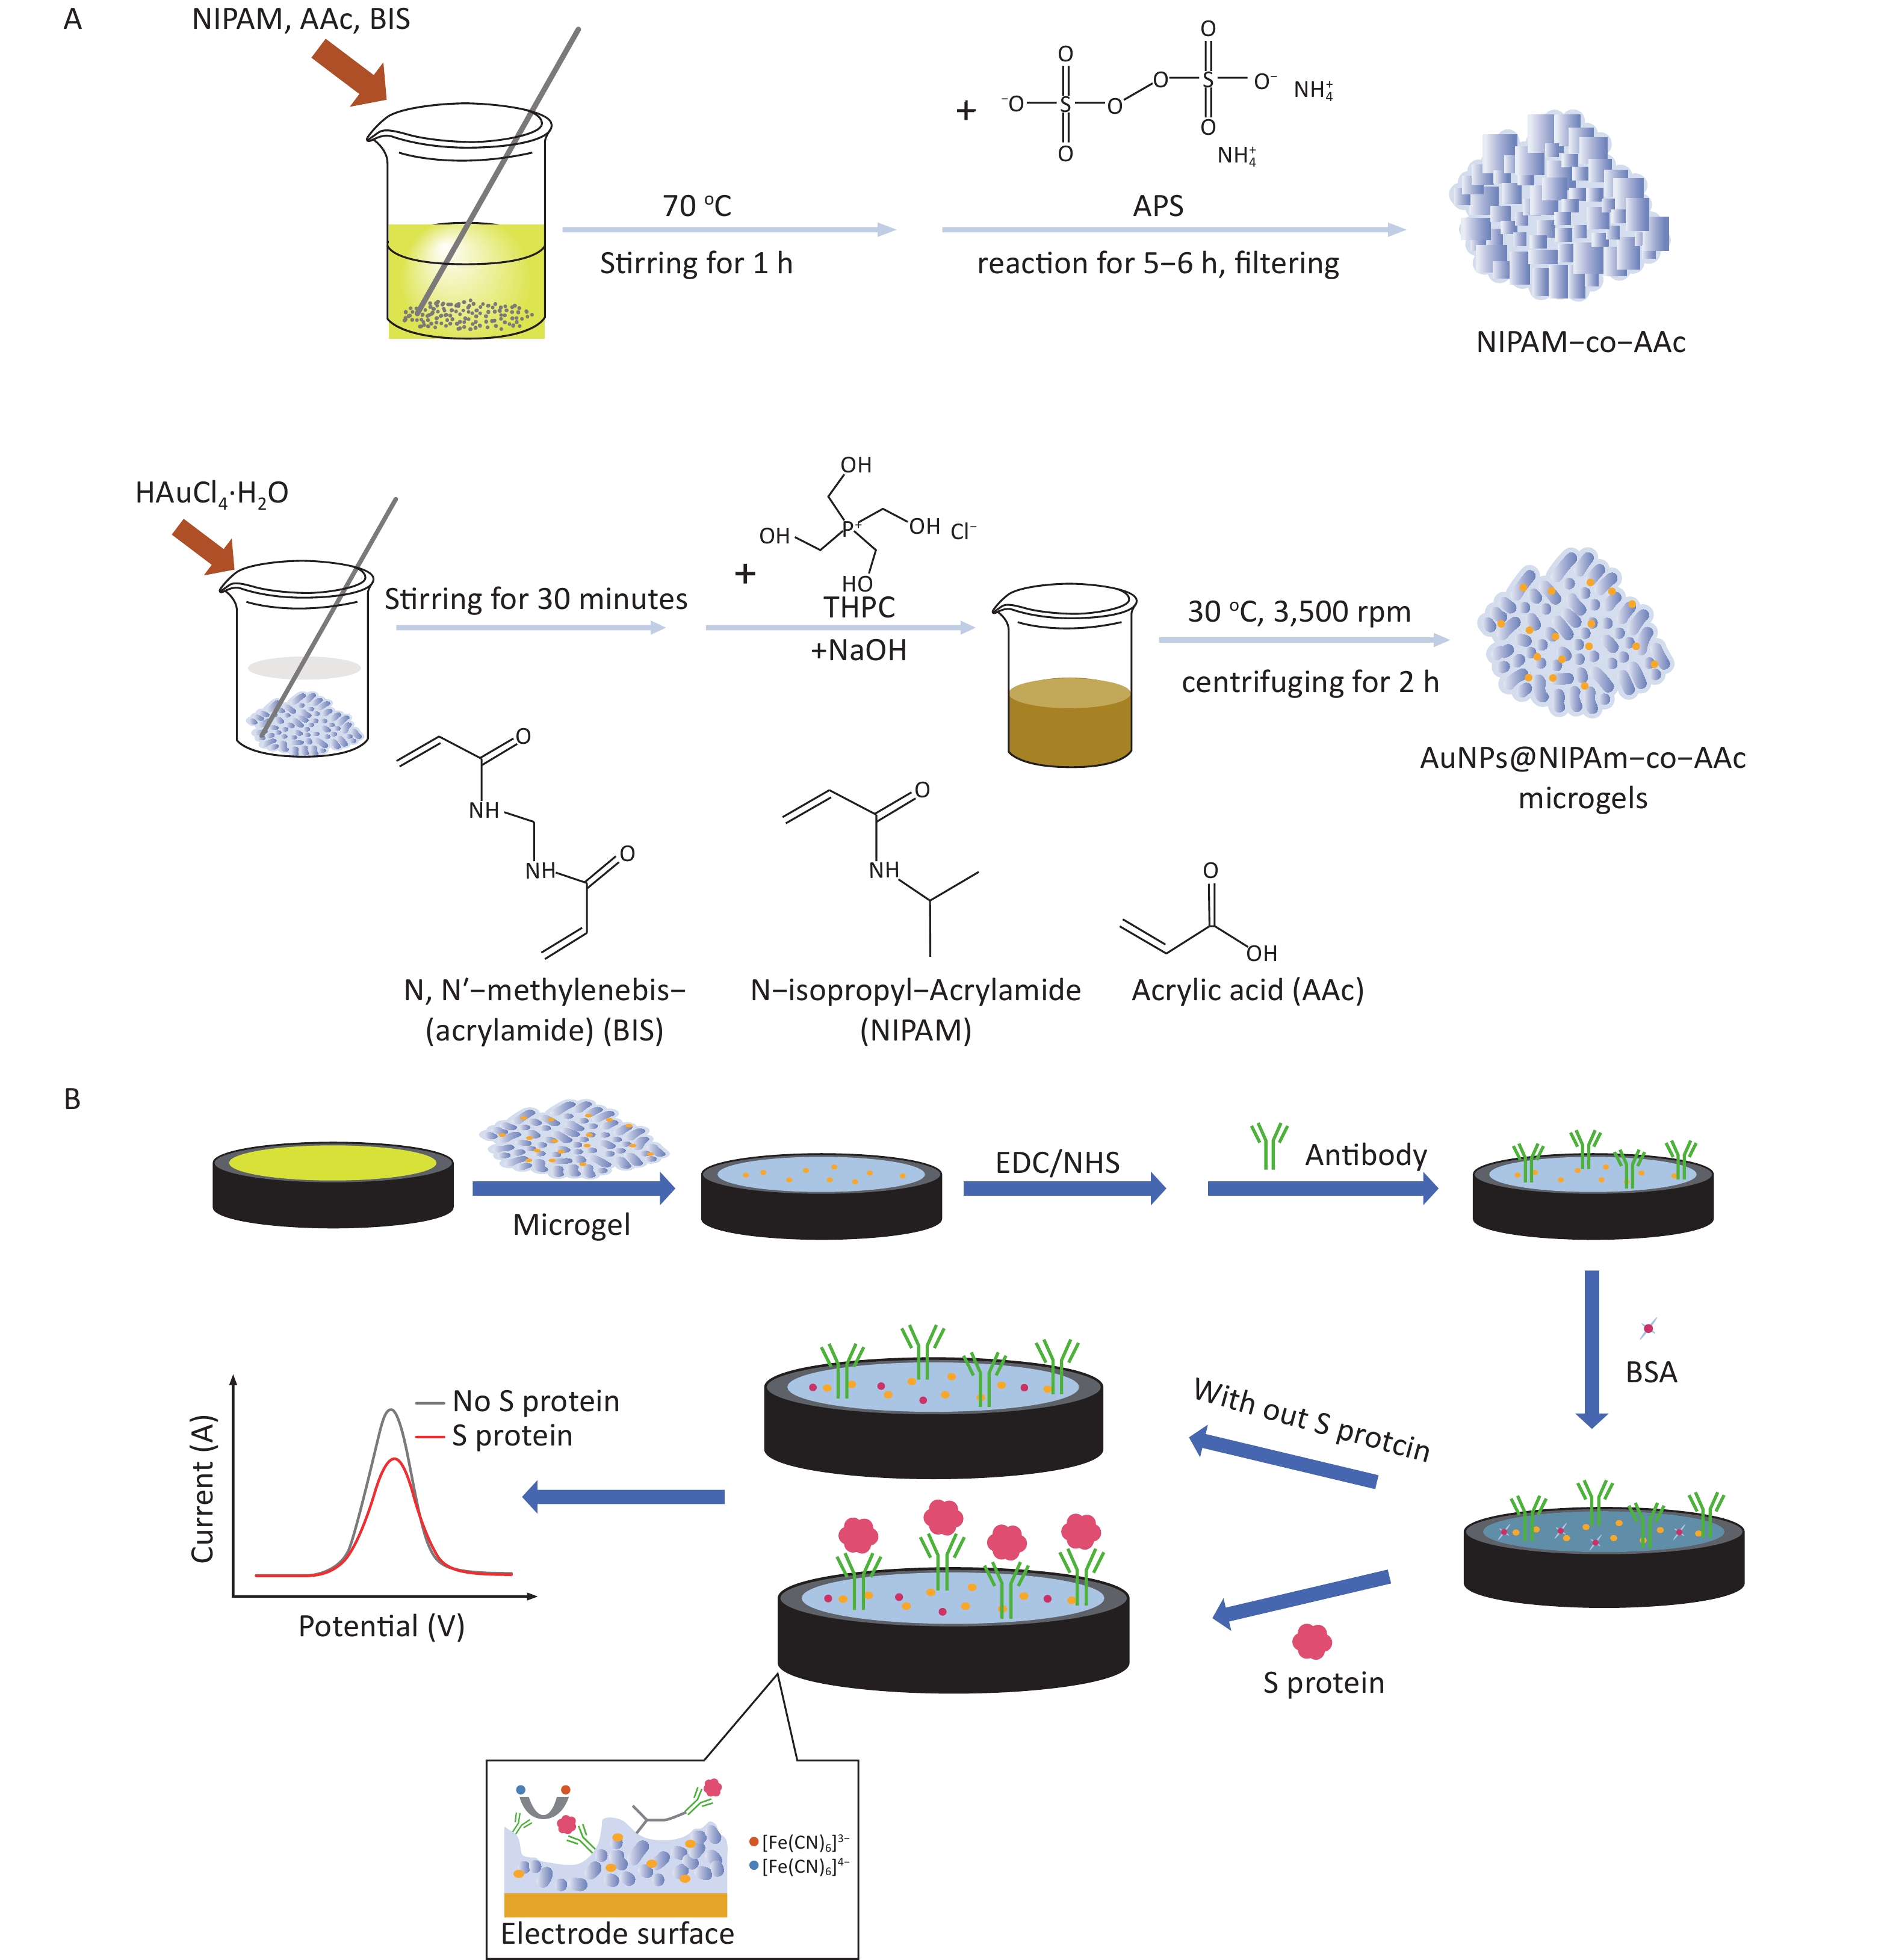
Supplementary Figure S1A (available in www.besjournal.com) shows the process of microgel preparation. Using different ratios of NIPAm and AAc can affect the structure and particle size of microgels, which has been discussed in the study conducted by Li et al.[28]. This work selected the appropriate ratio to ensure the particle size and stability of the microgel. NIPAM (1.0 g), AAc (0.05 g), and BIS (0.1 g) were dissolved in 196 mL of deionized water and stirred at 70 °C for 1 h. The addition of APS (0.4 g/4 mL of water) to the abovementioned solution served as an initiator for a subsequent reaction for 5–6 h. The resulting solution was filtered several times using filter paper to remove large aggregates and obtain a clarified hydrogel. Fifty milliliters of the hydrogel solution was mixed with 1.88 mL of HAuCl4-H2O and stirred for at least 30 min. In addition, 0.33 mL of 1 mol/L NaOH solution and 1.11 mL of THPC were added sequentially to the abovementioned solution, and the color of the solution changed from colorless to pink, red, and then brown within a few minutes. The final solution was then centrifuged at 30 °C for 2 h at 3,500 rpm, and the hydrogel containing gold nanoparticles was obtained after filtration.
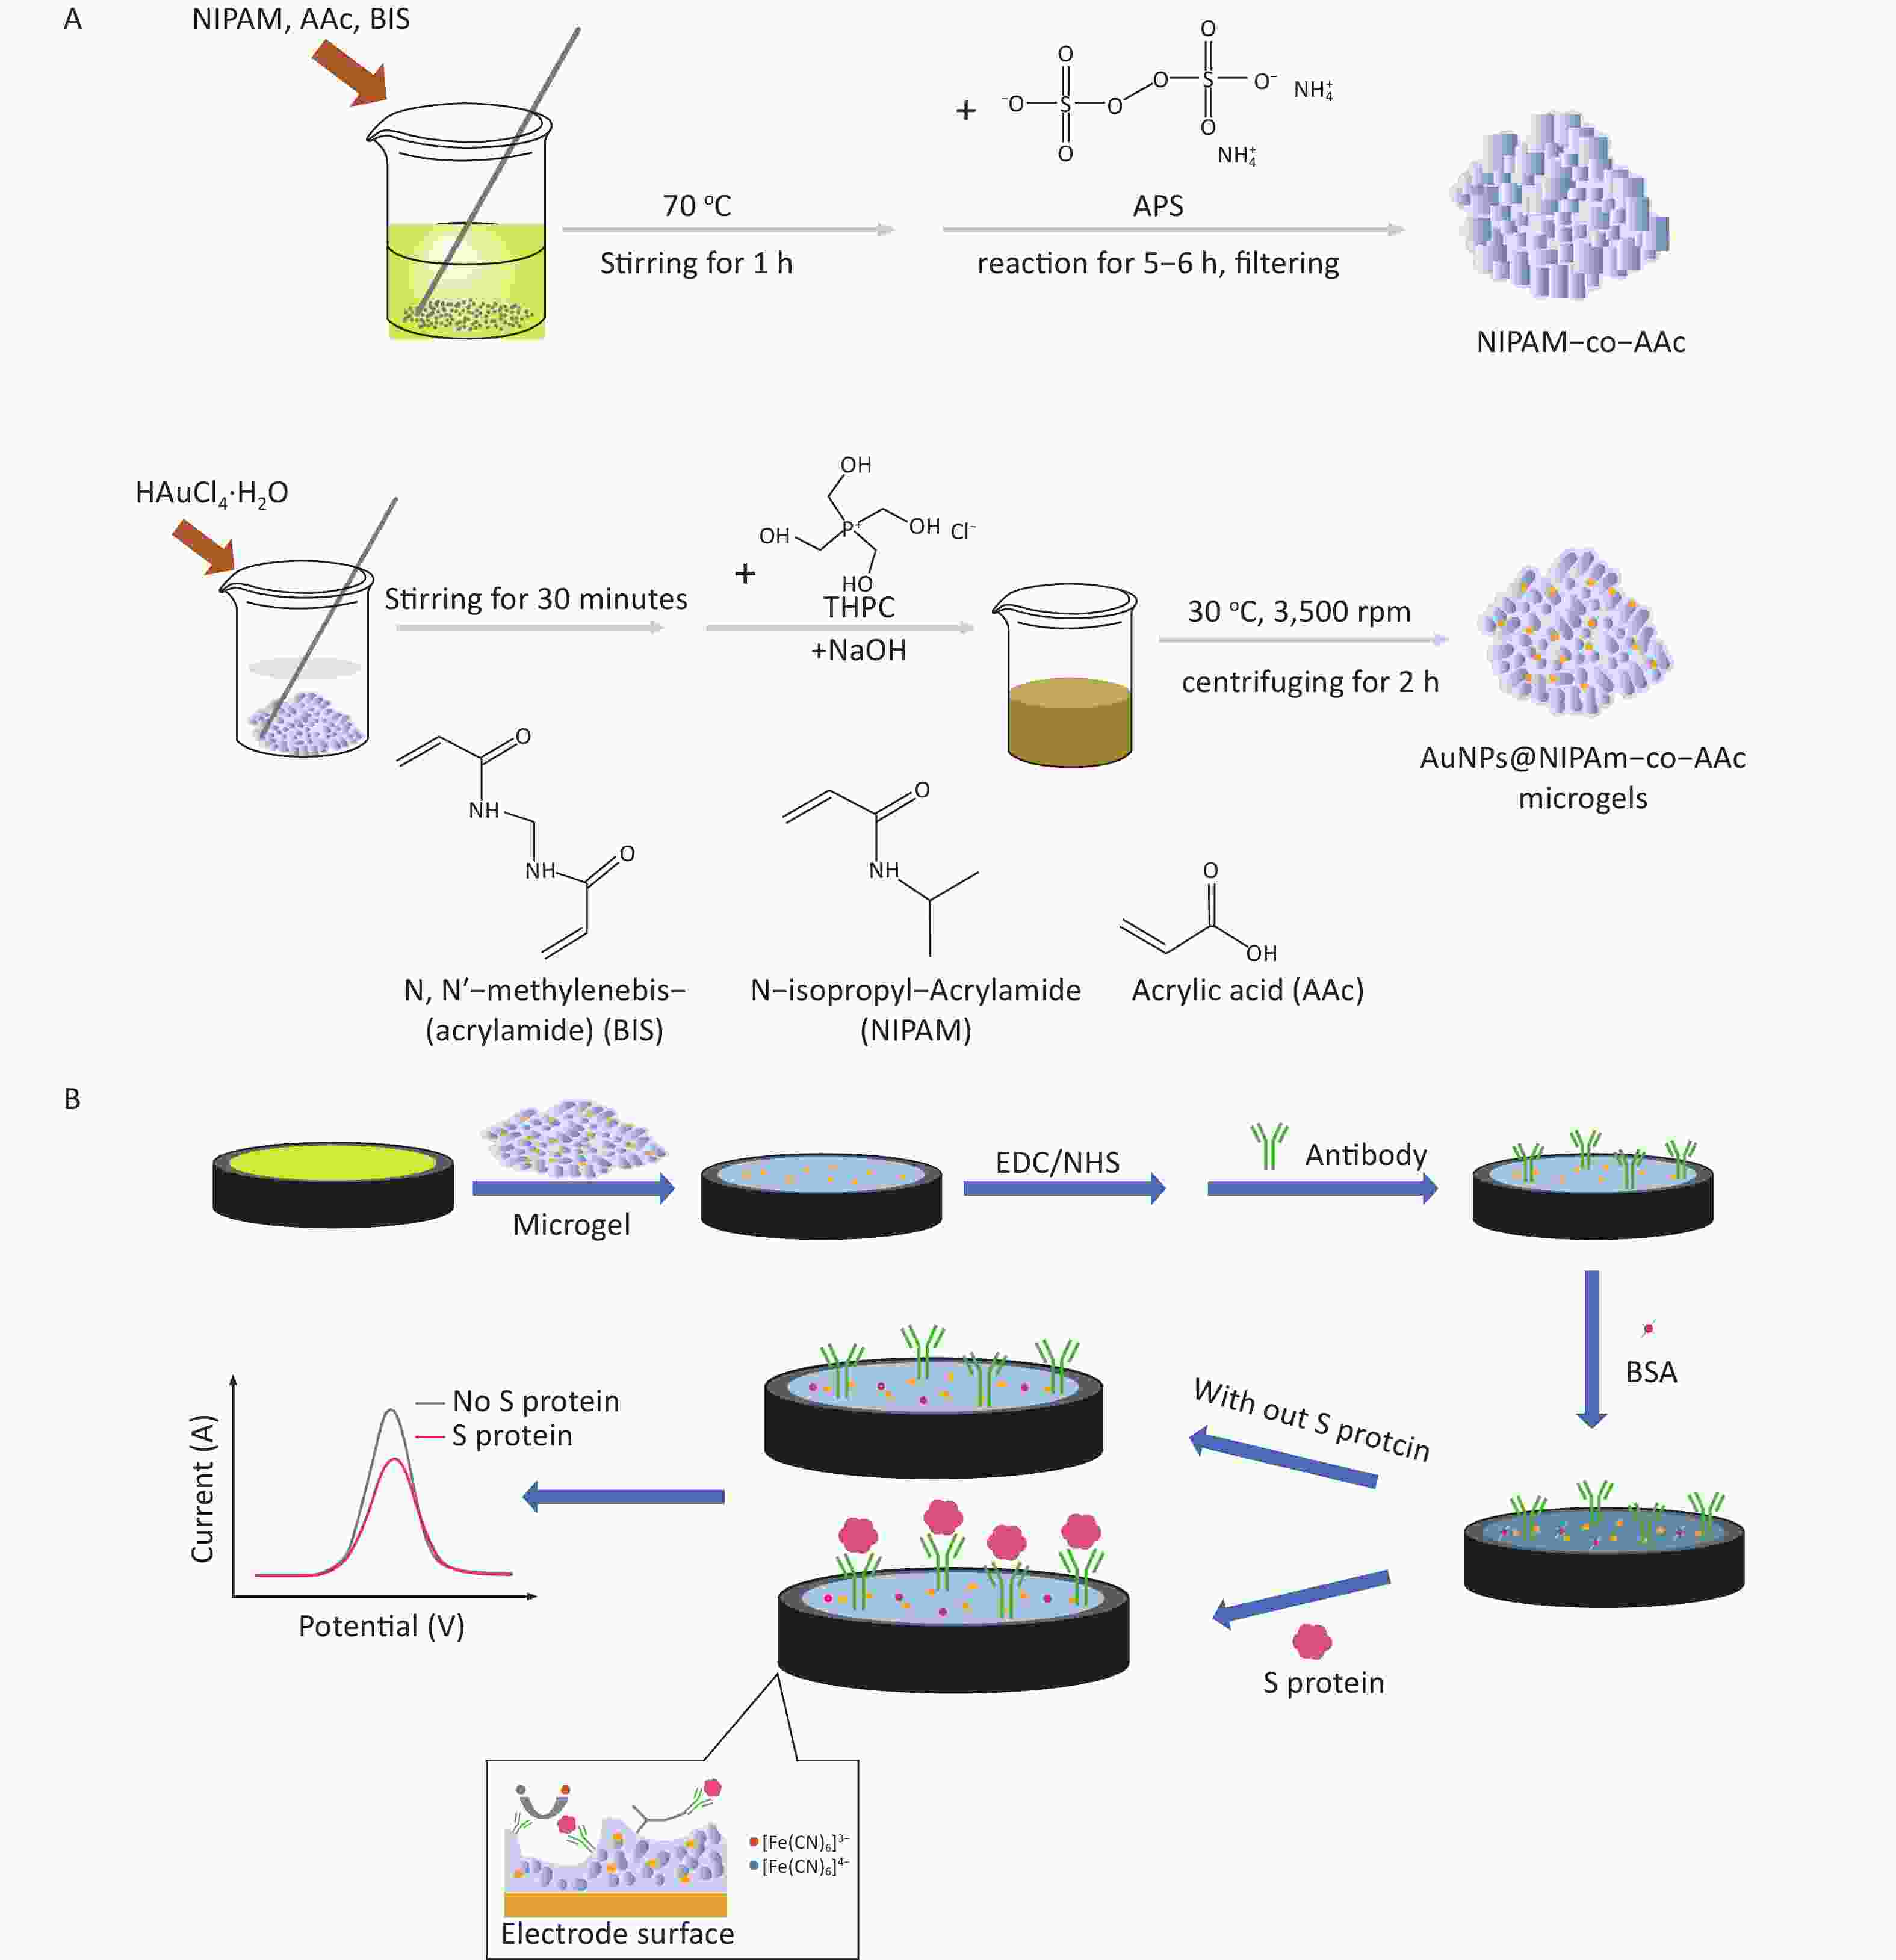
Figure S1. (A) Synthesis of AuNPs@NIPAM-co-AAc microgels. (B) Construction of the sensing platform and detection process of S protein.
-
The fabrication process of the sensor is described in Supplementary Figure S1B. Six microliters of microgel–gold nanoparticle composite was added to the surface of the gold electrode dropwise and dried at room temperature for 1 h. Then, the obtained microgel-coated electrode was placed in a water bath of deionized water for 30 min. During this process, it is firmly attached to the electrode surface by adhesion force, and a 3D microgel network was formed, which provided a suitable environment for the subsequent detection of biological samples. The microgel-modified electrodes were placed in a solution of 0.10 mol/L PBS (pH = 7.40) with 30 mmol/L EDC and 30 mmol/L NHS for 4 h to activate the carboxyl groups of the microgels and then rinsed with PBS. Afterward, 6 μL of 10 μg/mL antibody was added dropwise and incubated at 4 °C for 8 h. During this process, the antibody was covalently coupled with the carboxyl groups in the microgel via an activator, namely, EDC/NHS. Electrochemical analysis was performed using 5 mmol/L [Fe(CN)6]3−/[Fe(CN)6]4− as the redox mediator of the electrolyte. A series of 6 μL of S protein standard solutions of different contents (10−9, 10−10, 10−11, 10−12, and 10−13 mg/mL) was added to the surface of the microgel-antibody electrode at 30 °C after 50-min incubation. The electrochemical signals of different concentrations of S protein were recorded by DPV for detection.
-
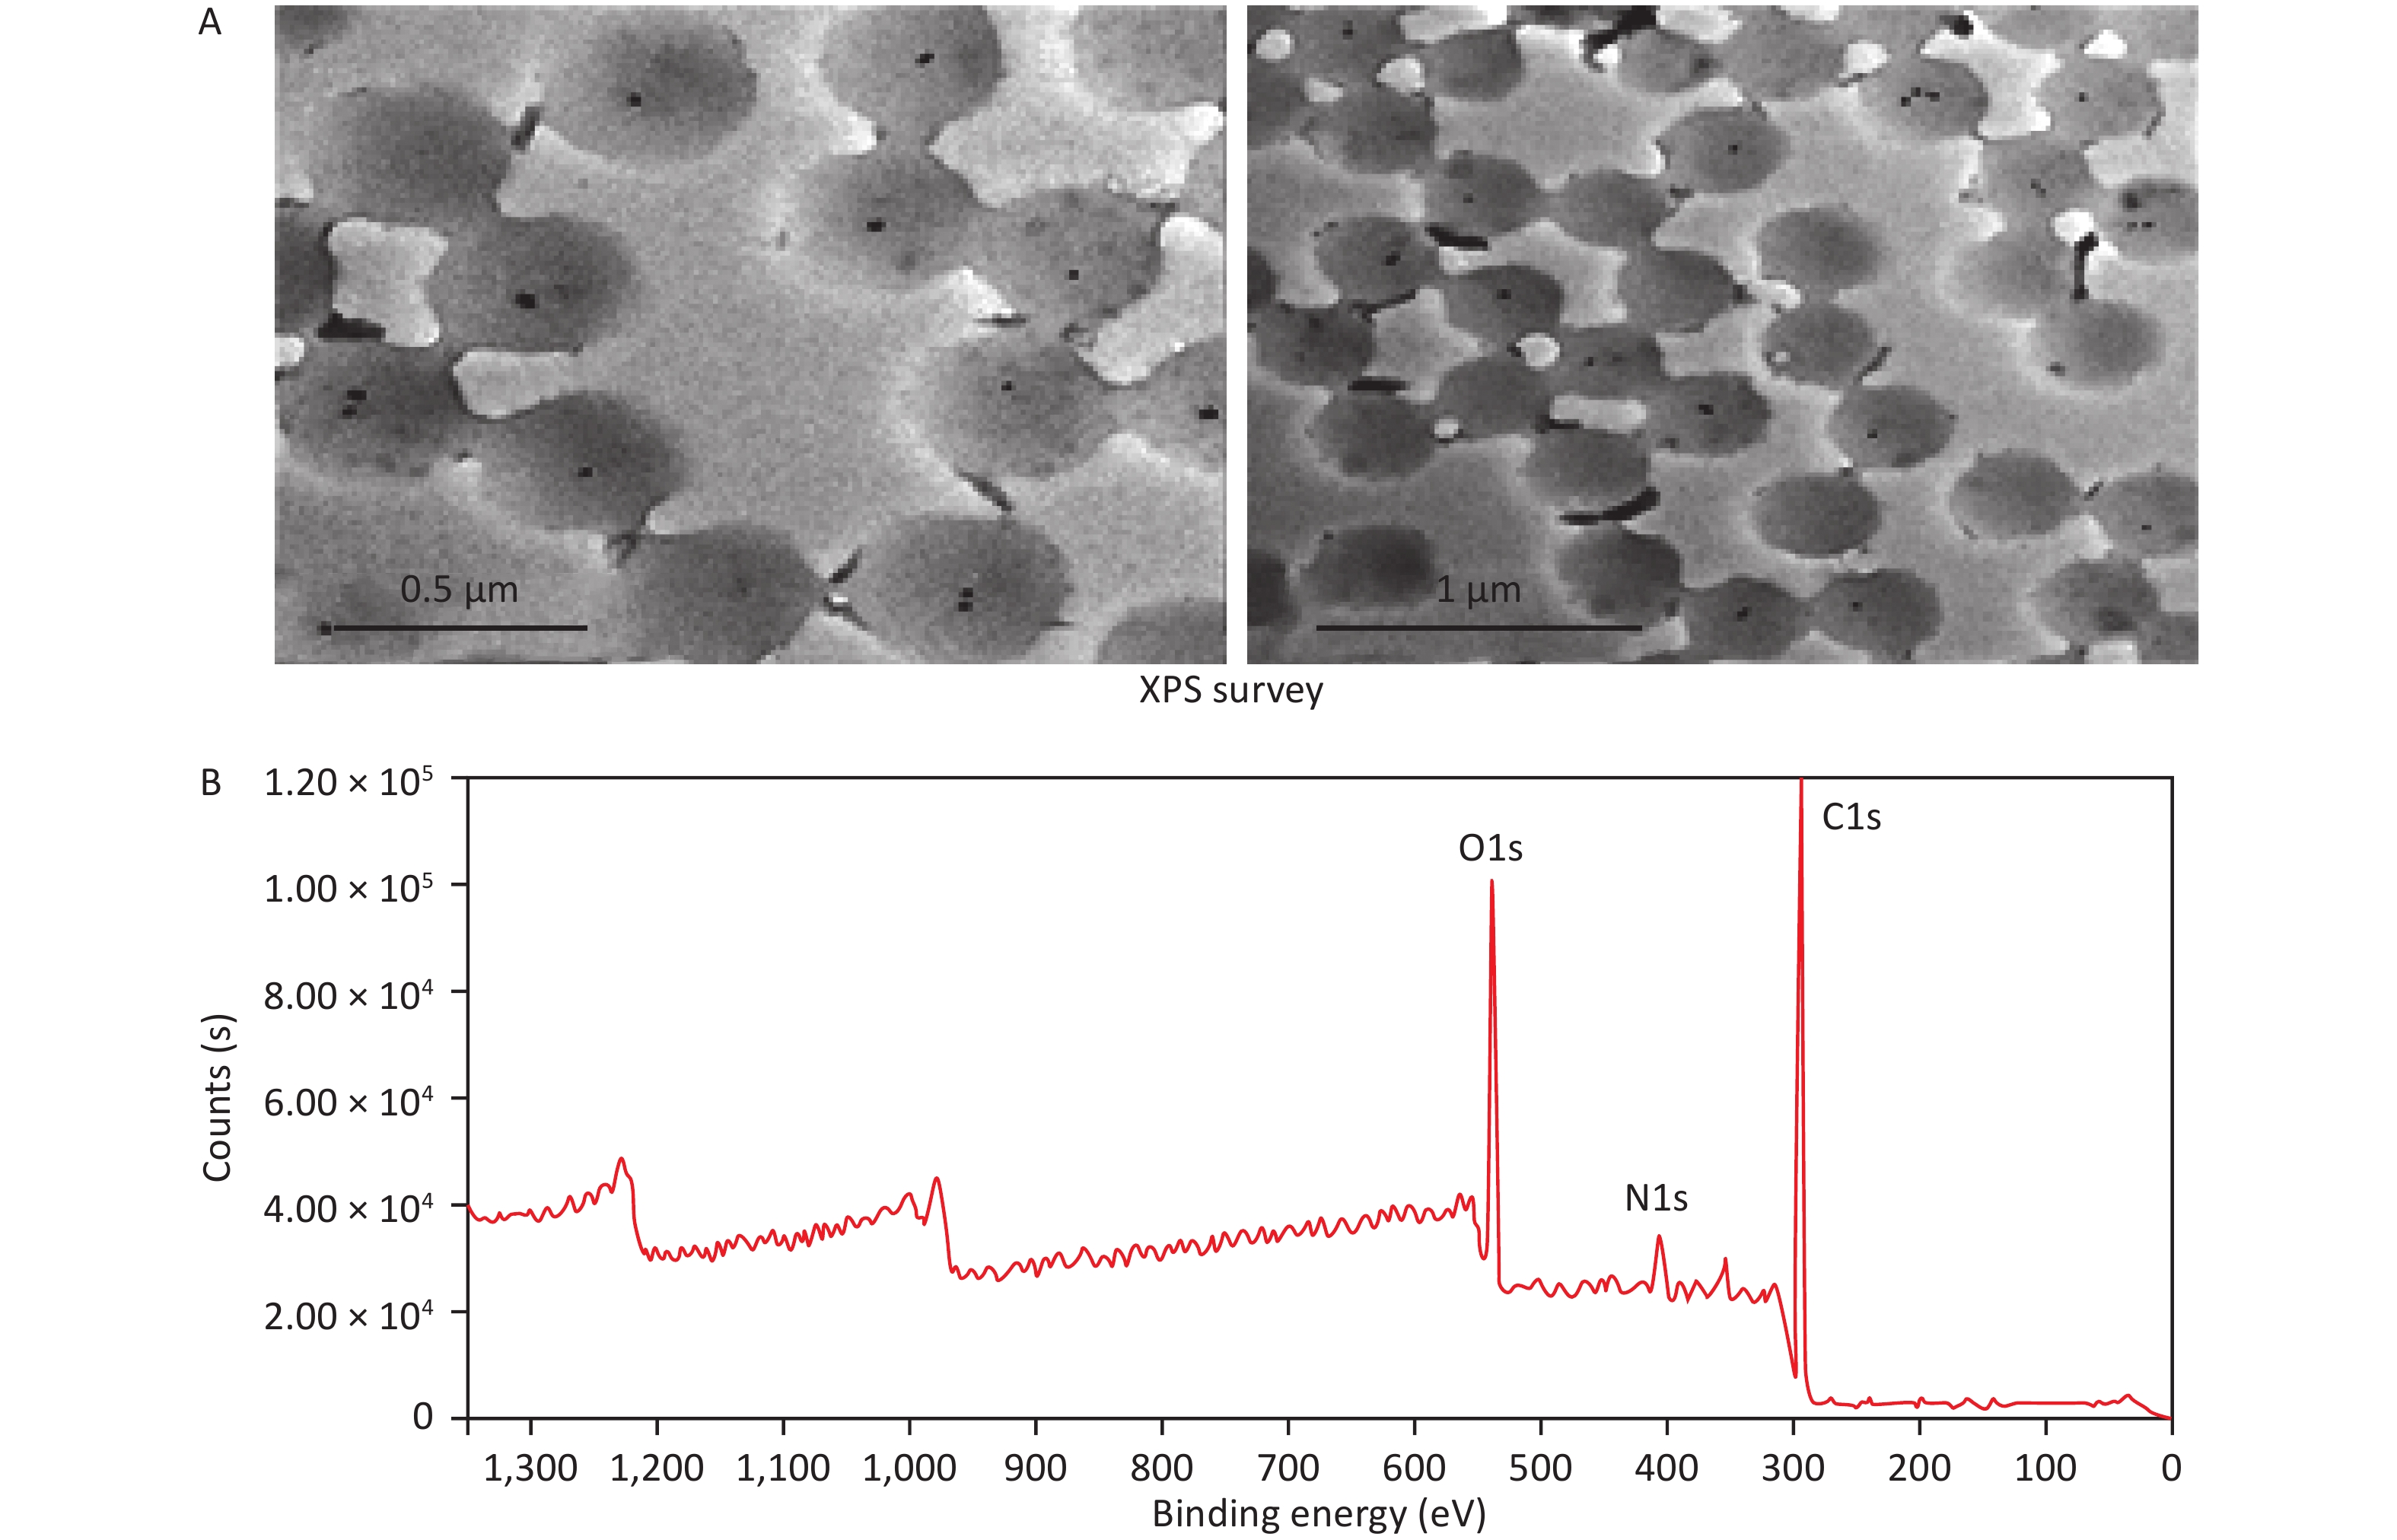
Transmission electron microscopy (FEI Tecnai G2 F30, USA) was used to study the morphological characteristics of microgels (Figure 1A). The sample was dropped on the copper mesh and imaged by using a transmission electron microscope after natural drying. The observed microgel diameter was approximately 0.5 μm, and nanoscale AuNPs were uniformly encapsulated inside the microgel. The images clearly showed that the microgel composite had a large specific surface area and porous network structure. The voids with an average size of 0.5–1 μm among these porous network microgels can provide a suitable microenvironment for S protein to bind and conduct biological activity and induce protection against interference from other proteins. X-ray photoelectron spectroscopy (Thermo ESCALAB 250XI, USA) was used to evaluate the successful synthesis of the microgels. Figure 1B shows the characteristic signals of the NIPAM-co-AAc/AuNPs microgels, in which signals at 284.8, 399.4, 531.8, and 88.0 eV represent C(1 s), N(1 s), O(1 s), and Au(4 f), respectively[29].
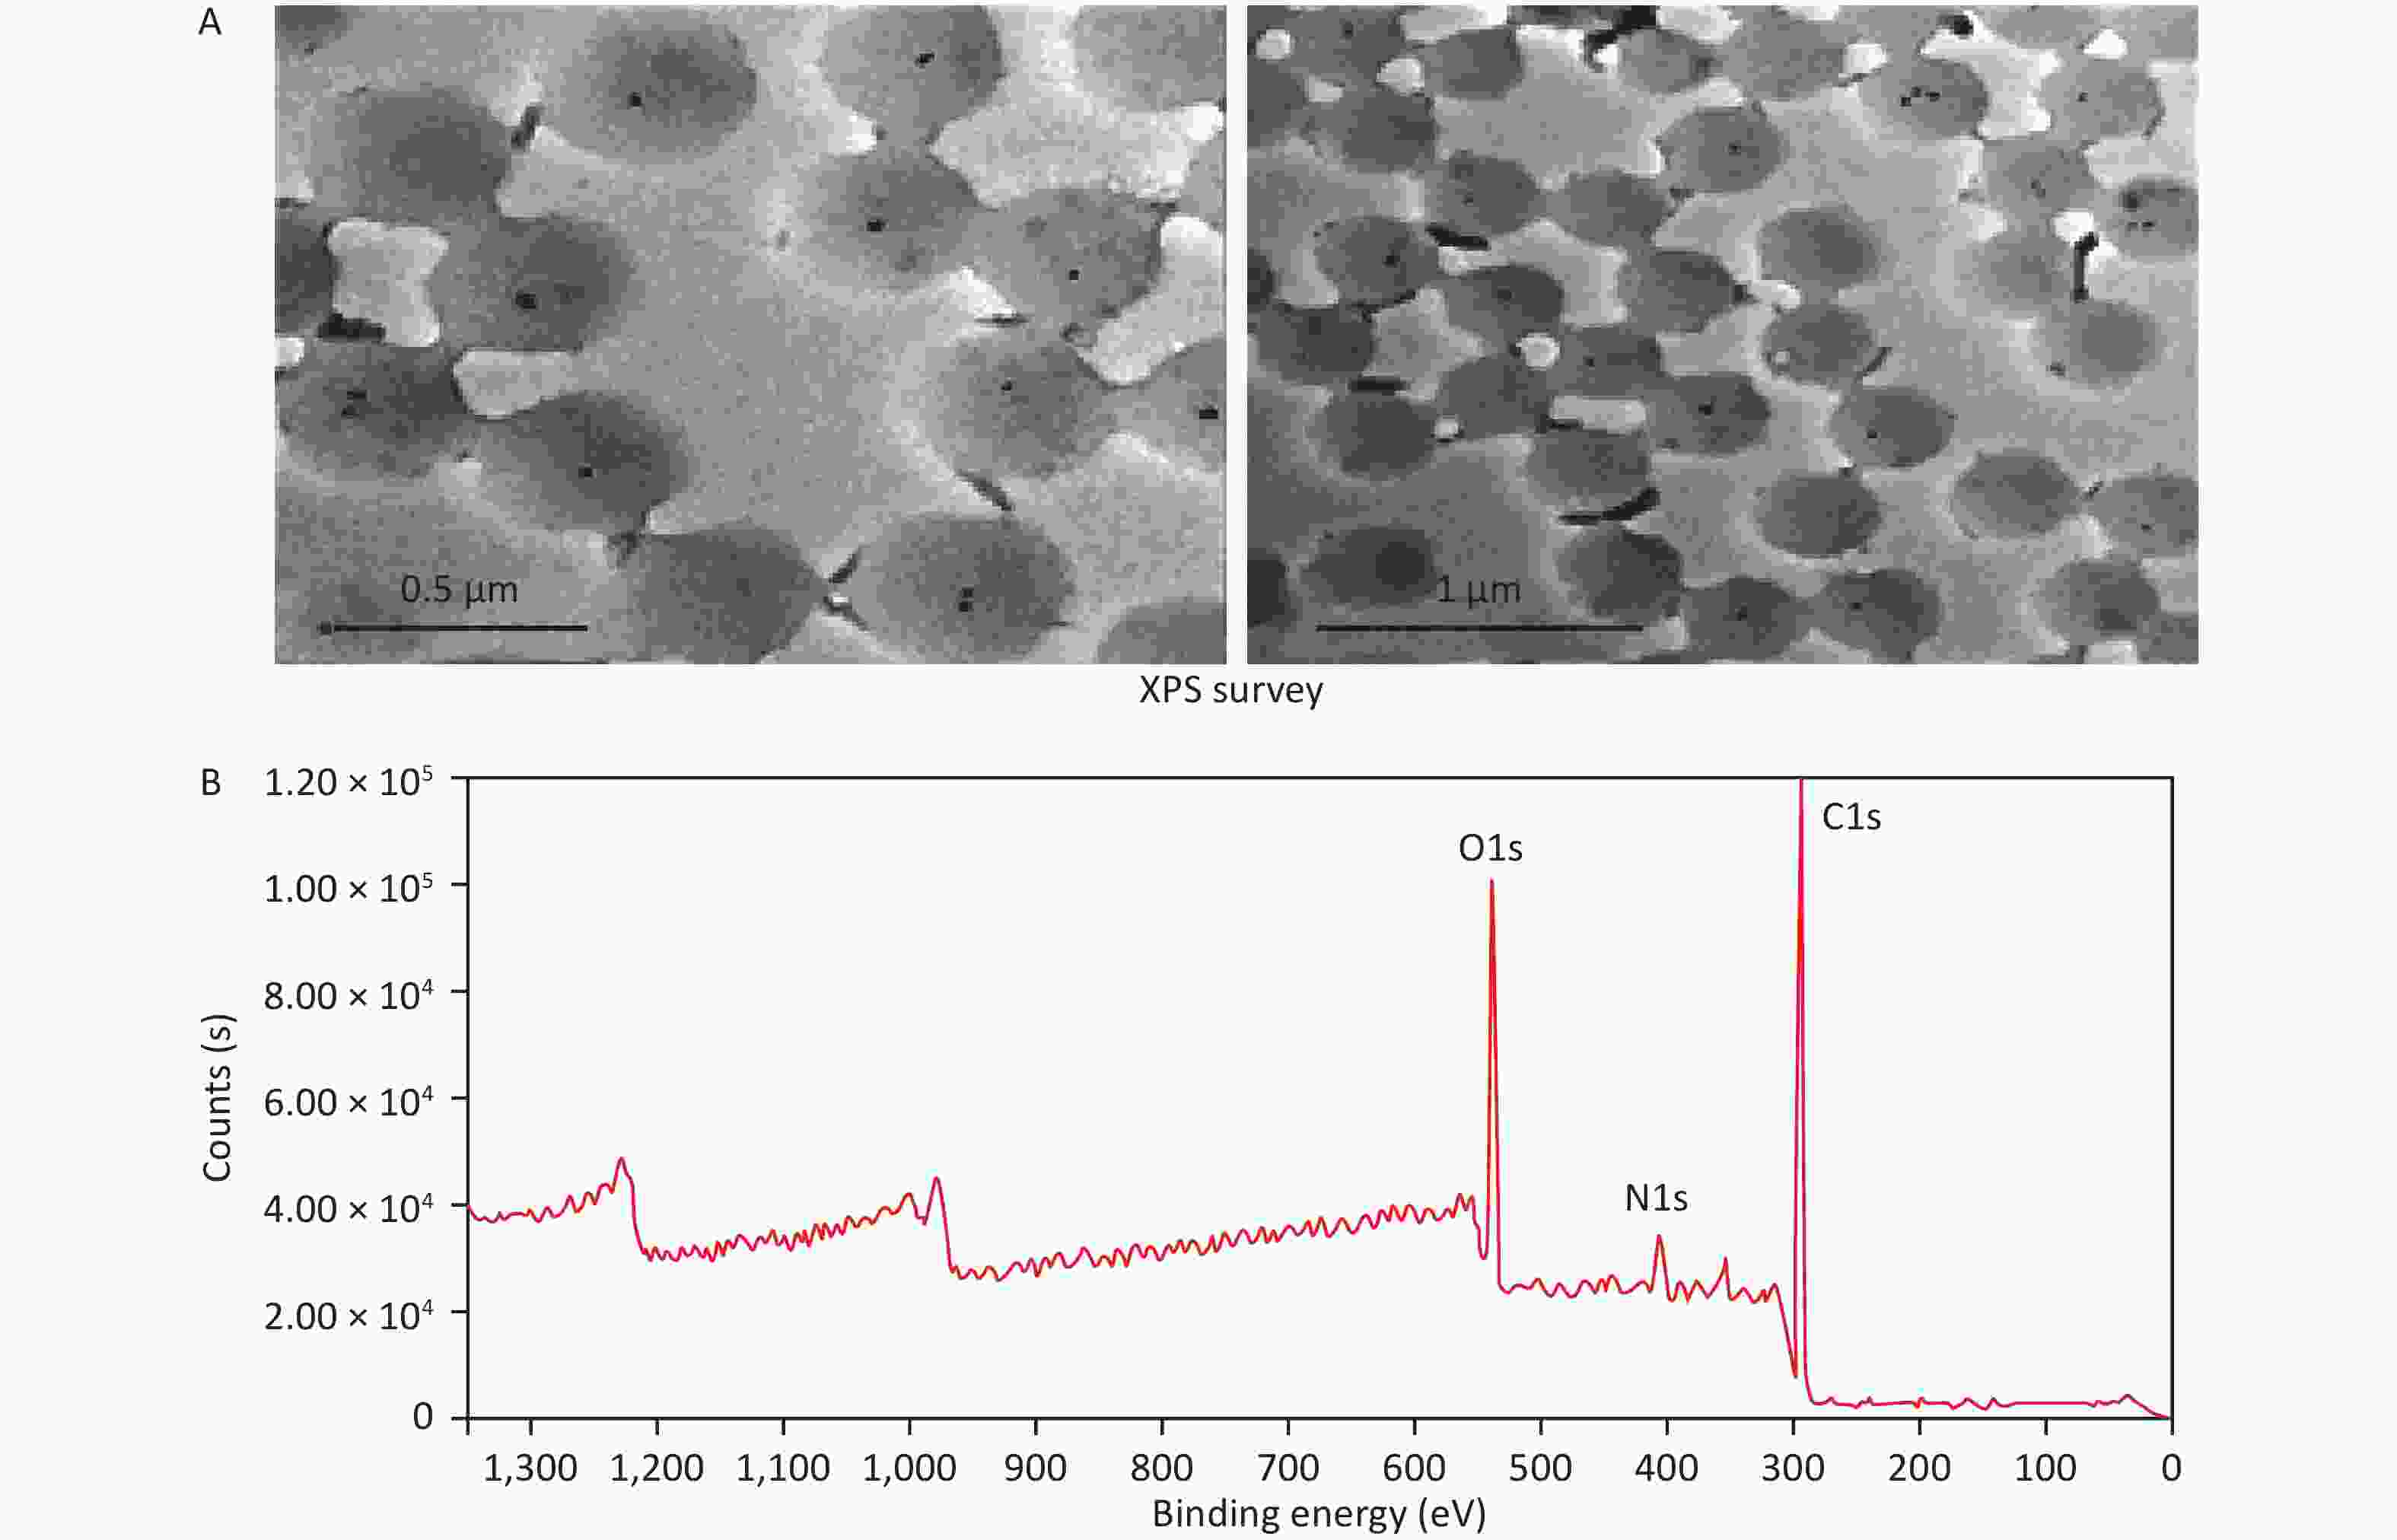
Figure 1. Morphological and structural characterization of microgels by (A) transmission electron microscopy (TEM) and (B) X-ray photoelectron spectroscopy (XPS).
-
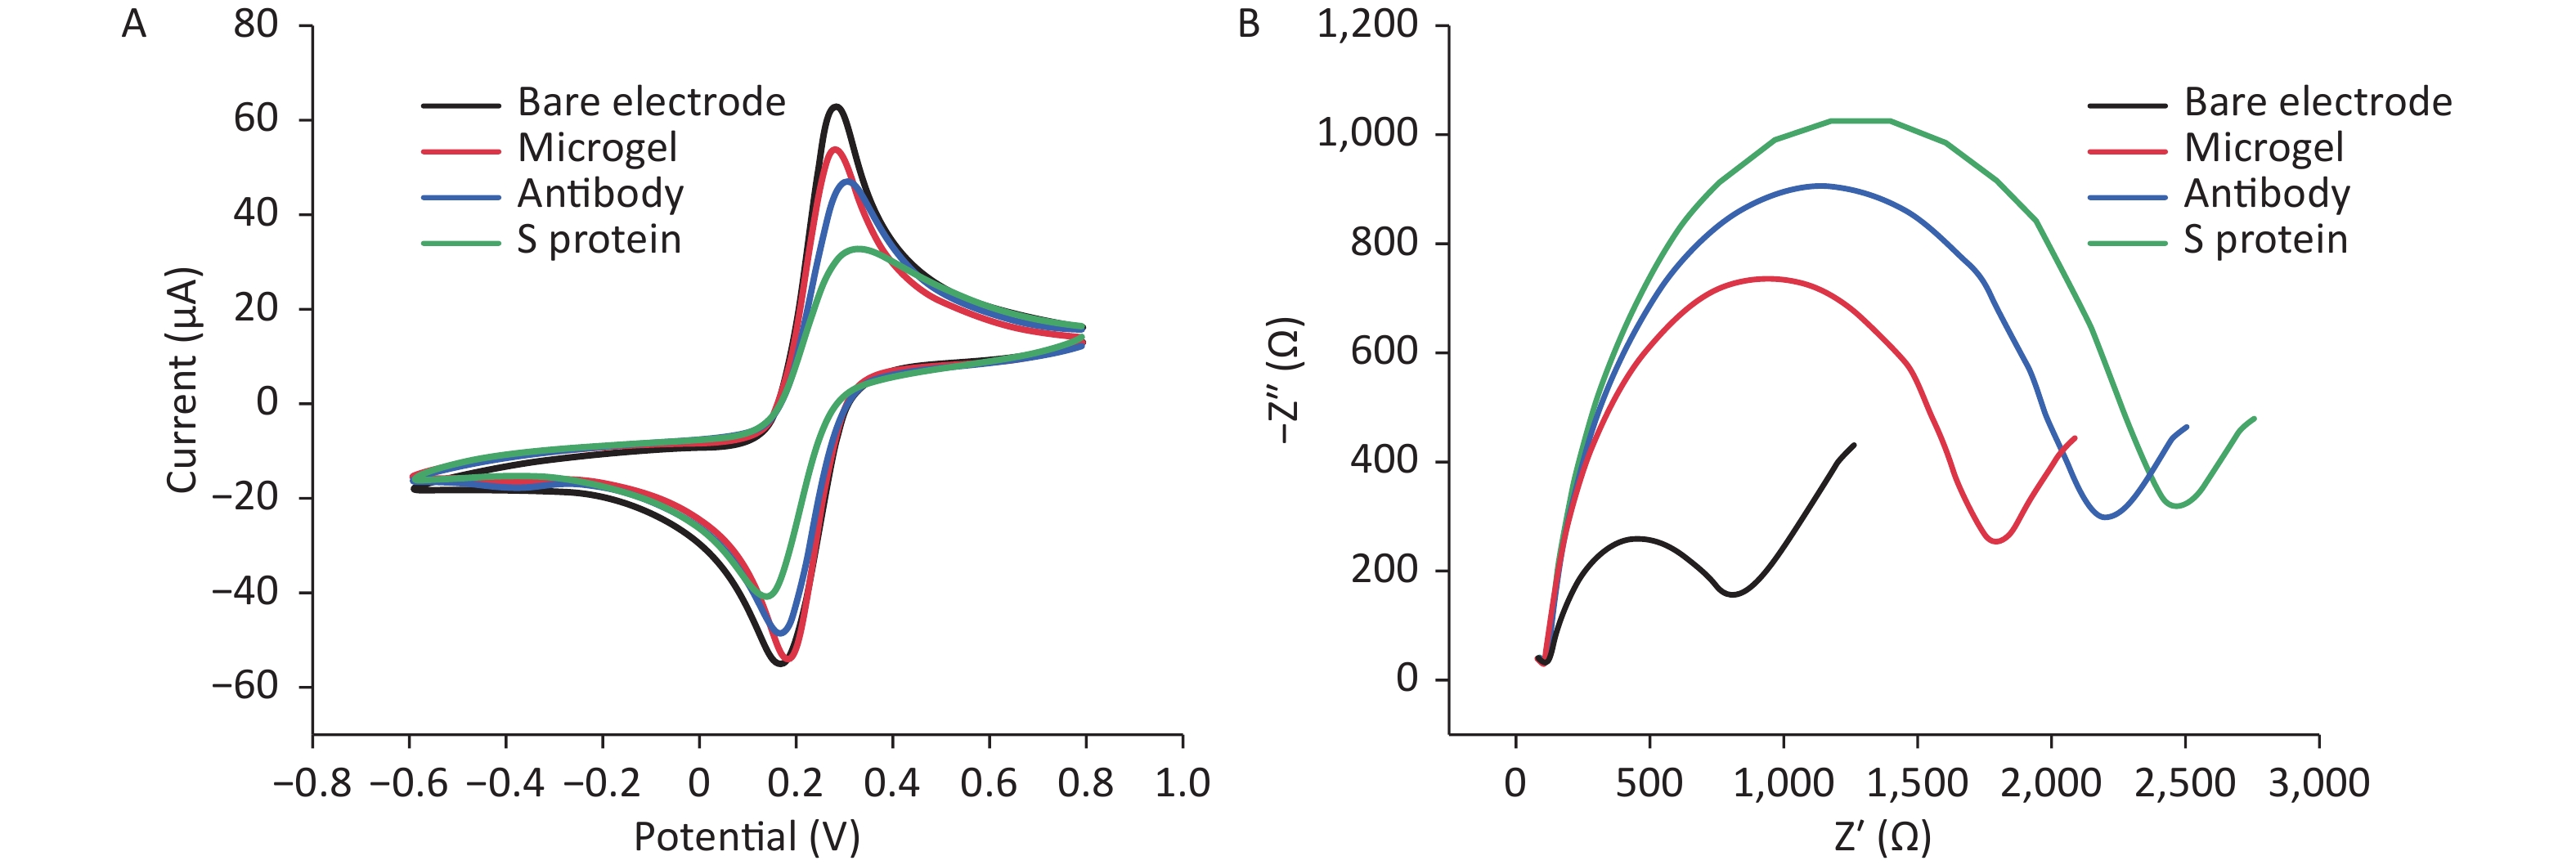
In confirming the successful construction of the sensing platform of microgels, CV and EIS were used to describe the modification of the electrode surface. Figure 2 shows the obtained CV redox curves. When the microgel, antibody, and S protein were gradually bound to the electrode surface, the peak continuously decreased because the electron exchange between the gold electrode and the electrolyte was blocked. The peak current was highest on the bare electrode, and it decreased when the microgel was bound to the upper electrode. When the S protein antibody was bound to the microgel-modified electrode surface, the current signal intensity decreased significantly, indicating that a number of negatively charged phosphate groups hindered electron exchange at the electrode surface. When the S protein was precisely captured by the antibody, the peak current signal intensity decreased. This trend was also demonstrated by EIS. Therefore, the S protein was loaded onto the modified electrode by specifically binding to the antibody.
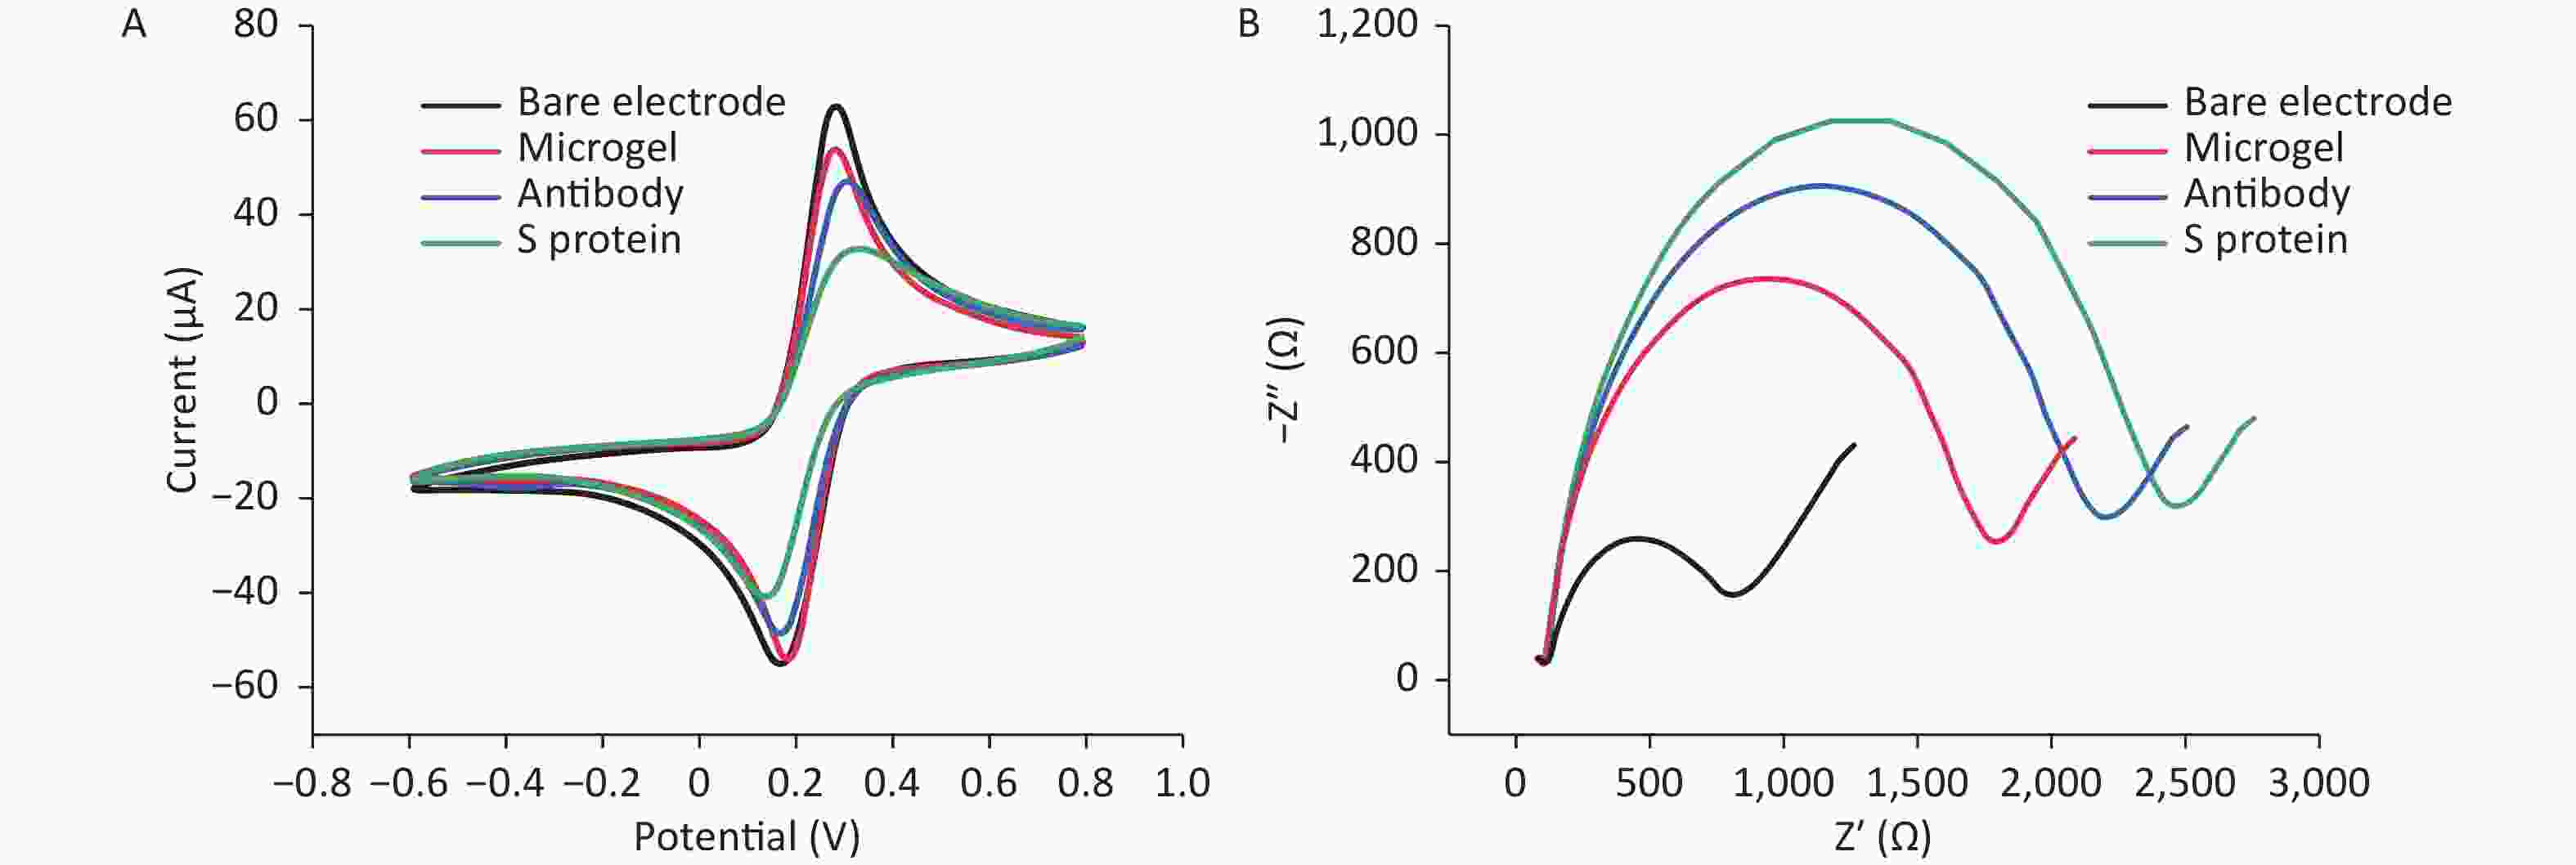
Figure 2. Electrochemical characterization of the sensing platform. (A) CV and (B) EIS curves of bare electrodes, microgels, antibodies, and proteins recorded in 5 mmol/L [Fe(CN)6]3−/[Fe(CN)6]4−.
-
In obtaining optimal conditions for the assay, the key factors (volume of the microgel, concentration of the antibody, and incubation time of the antibody with the S protein) were tested and optimized in a PBS solution with 5 mmol/L [Fe(CN)6]3−/[Fe(CN)6]4− to achieve a satisfactory signal. (current difference: ΔI = I0 − Ip; Ip is the peak current when the S protein is detected, and I0 is the peak current when no S protein is present.)
Figure 3A shows the effect of microgel dosage on the experiment. The results indicated that the current response ΔI increased rapidly to 28.01 μA as the volume of microgel on the gold electrode surface increased from 2 to 6 μL. Afterward, the microgel continuously increased, and ΔI decreased gradually. This result was due to the fact that antibody binding decreased when the microgel material was insufficient, which led to a less sensitive detection of the S protein. Moreover, when the electrode surface contained excessive materials, the increment of the thickness of the microgel film would hinder electron transfer, which would negatively affect detection. Therefore, the appropriate volume of the microgel material was 6 μL to form the most suitable film on the electrode surface for detection.
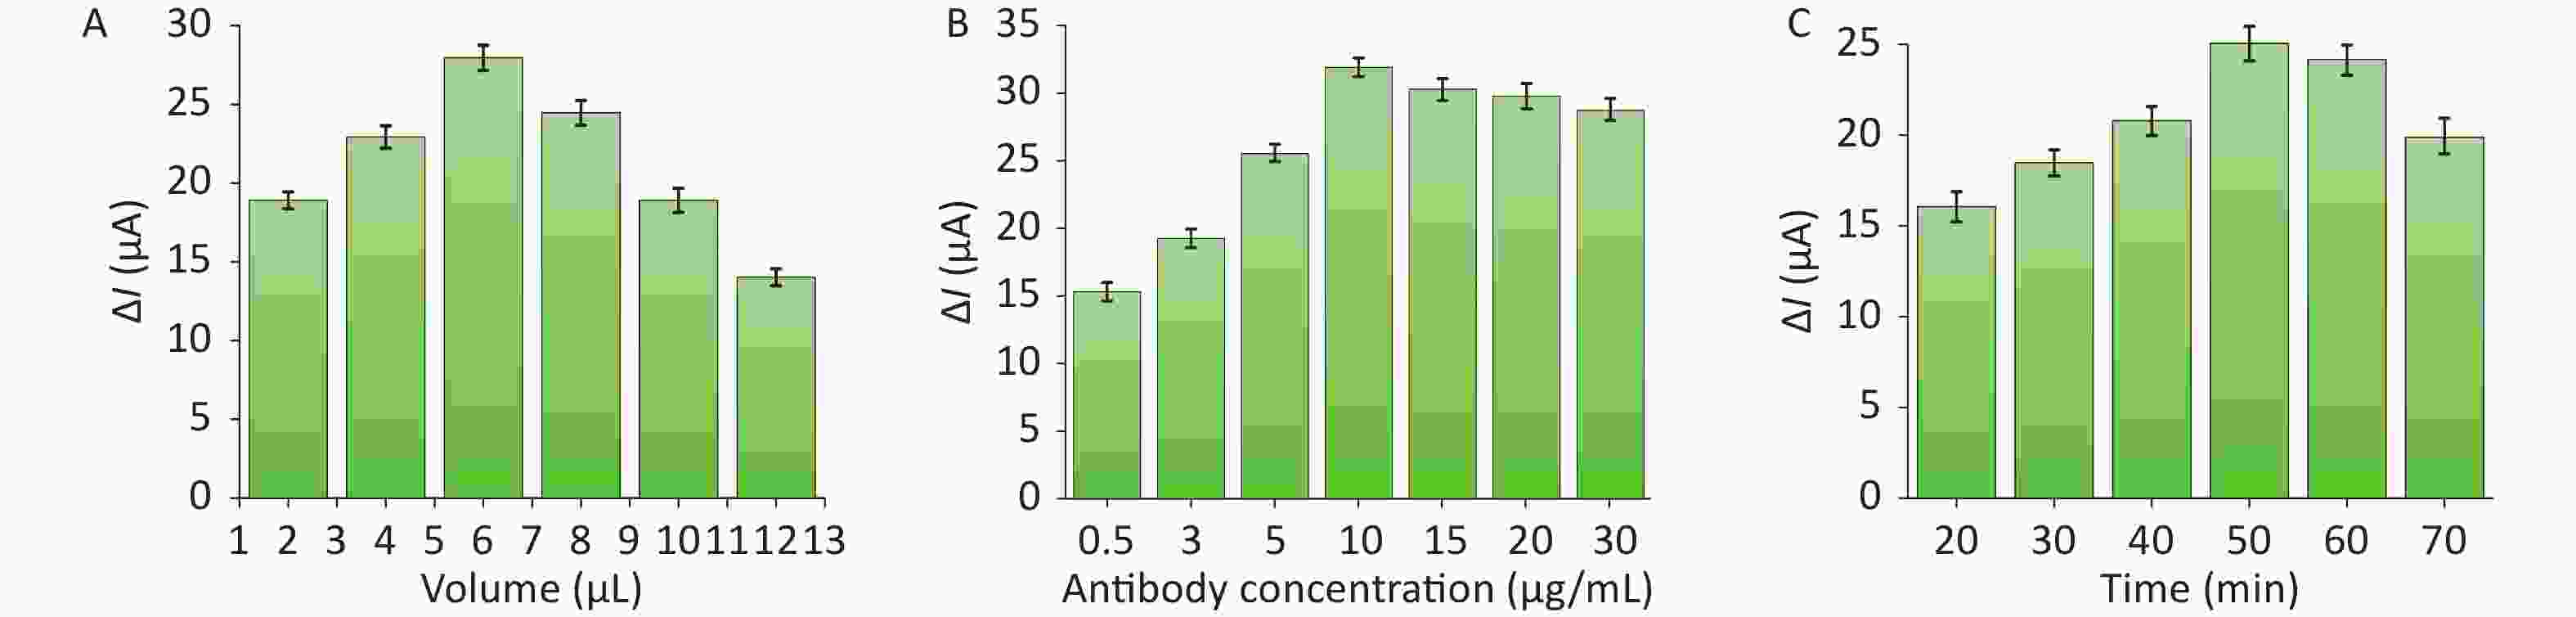
Figure 3. Assessment of the effects of different factors on the ability of the sensor to detect S proteins: (A) microgel volumes, (B) antibody concentration, and (C) incubation time.
In determining the most suitable antibody concentration, the effect of different antibody concentrations on S protein detection was investigated (Figure 3B). When the antibody concentration increased from 0.5 to 10 μg/mL, the difference in the electrochemical signal widened. On the contrary, the change in electrochemical signal stabilized when the antibody concentration continuously increased. These results indicated that the sensing device modified with 10 μg/mL of antibody on the microgel material was the suitable concentration for capturing S protein.
When the incubation time of SARS-Cov-2 S protein was 50 min, the DPV response of the sensor reached the maximum (Figure 3C). The electrochemical signal gradually increased with the increase of the incubation time of the nanoprobe and started to decrease after 50 min, indicating that binding saturation between the S protein and the nanoprobe was achieved. Hence, subsequent experiments were conducted under these optimal conditions.
-
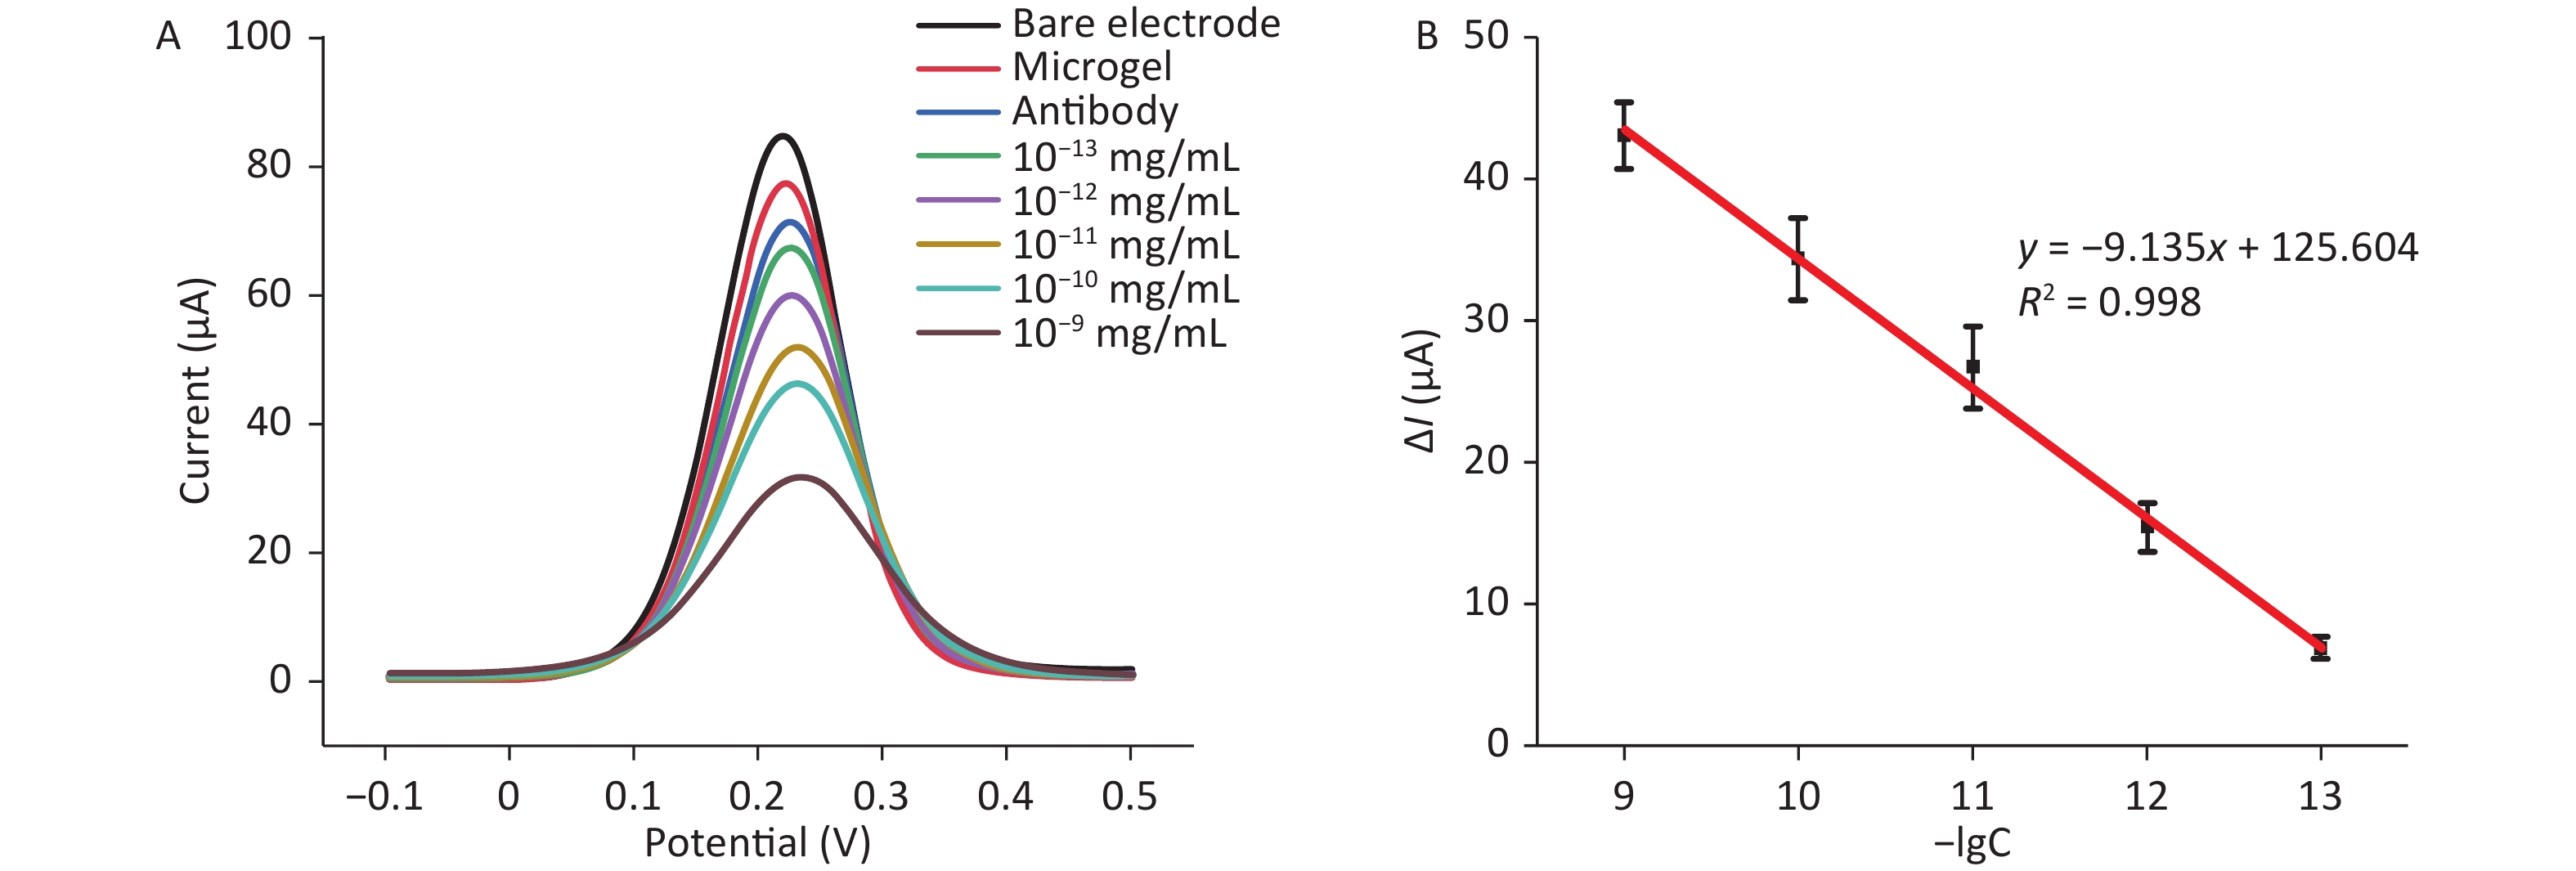
[Fe(CN)6]3−/4− (5 mmol/L) was adopted as the electrolyte, and the DPV determination of the S protein standard sample was carried out to determine its detection linear range and detection limit. As shown in Figure 4A, when the S protein concentration varied from 10−13 to 10−9 mg/mL (10−13, 10−12, 10−11, 10−10, and 10−9 mg/mL), good DPV was observed. The peak redox current decreased with the increase of S protein concentration. Antibodies could recognize and capture S protein and form antibody S protein complexes on the surface of the electrode. Thus, when the complex was formed, the electron transport channels were blocked, preventing electron transfer and resulting in a weakened electrical signal. The changing electrical signal showed a linear relation to the negative logarithm (−Log) of the S protein concentration over a linear range of 10−13 to 10−9 mg/mL, which was confirmed by plotting the negative logarithm of S protein concentration versus current ΔI, which was obtained from multiple measurements (n ≥ 3, Figure 4B). The linear regression equation was presented as follows: ΔI = −9.135lgC + 125.604. The correlation coefficient (R2) was 0.998. Based on the International Union of Theoretical and Applied Chemistry calculation, the limit of detection (LOD) is three times the standard deviation of the blank/slope, and the LOD of the sensor is 9.55 fg/mL.
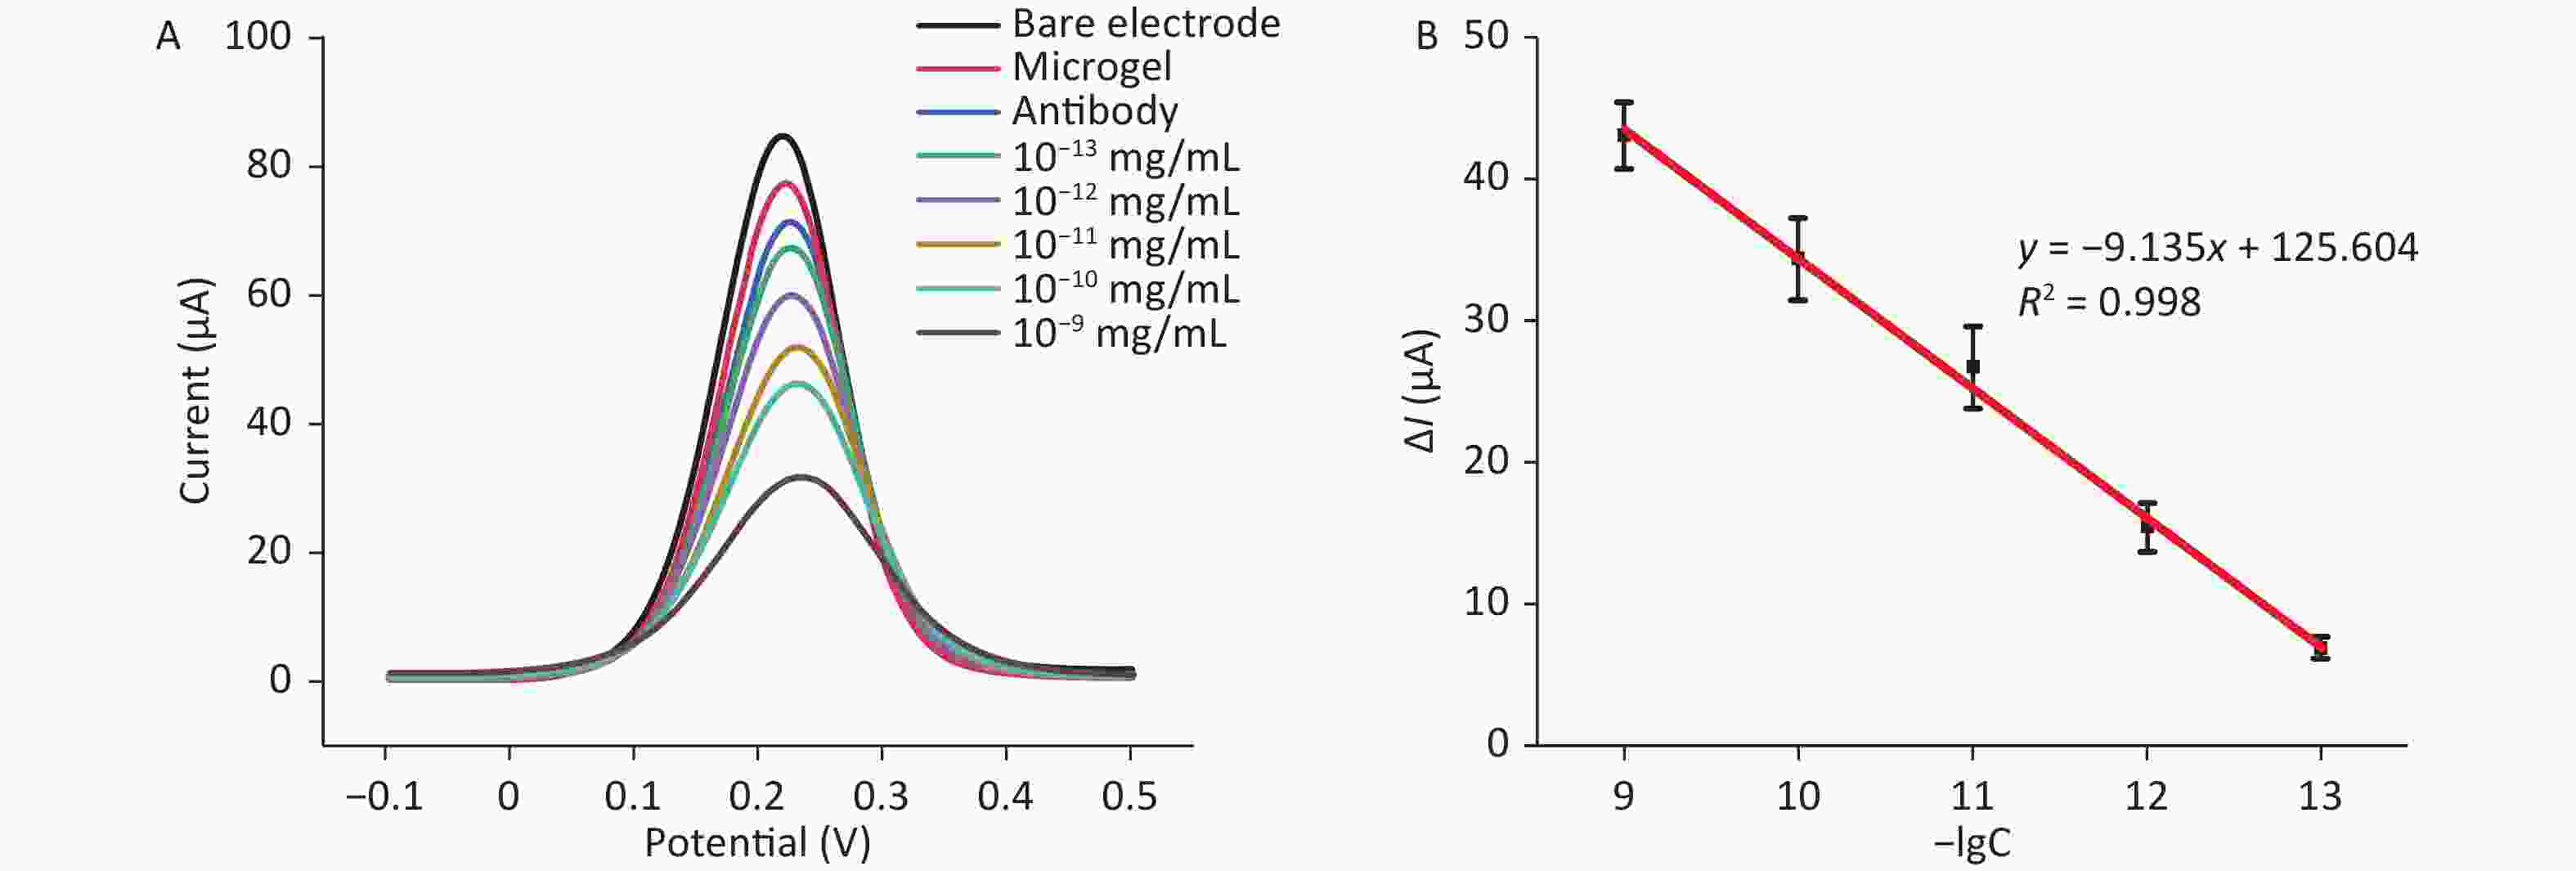
Figure 4. Detection of the S protein at different concentrations. (A) DPV detection of varying concentrations (10−13–10−9 mg/mL) of S protein. (B) Calibration curve showing the linear relationship of the biosensor in the detection of S protein. DPV, differential pulse voltammetry
-
In examining the long-term stability of the biosensors, the sensors were stored at 4 °C, and the DPV current responses of the sensors to the same concentration of S protein were evaluated every 3 days. The preservation rate of the sensor was 98.72% after 3 days of storage, 95.80% for 9 days, and 89.47% for 15 days. As shown in Figure 5A, the sensor has competent stability.
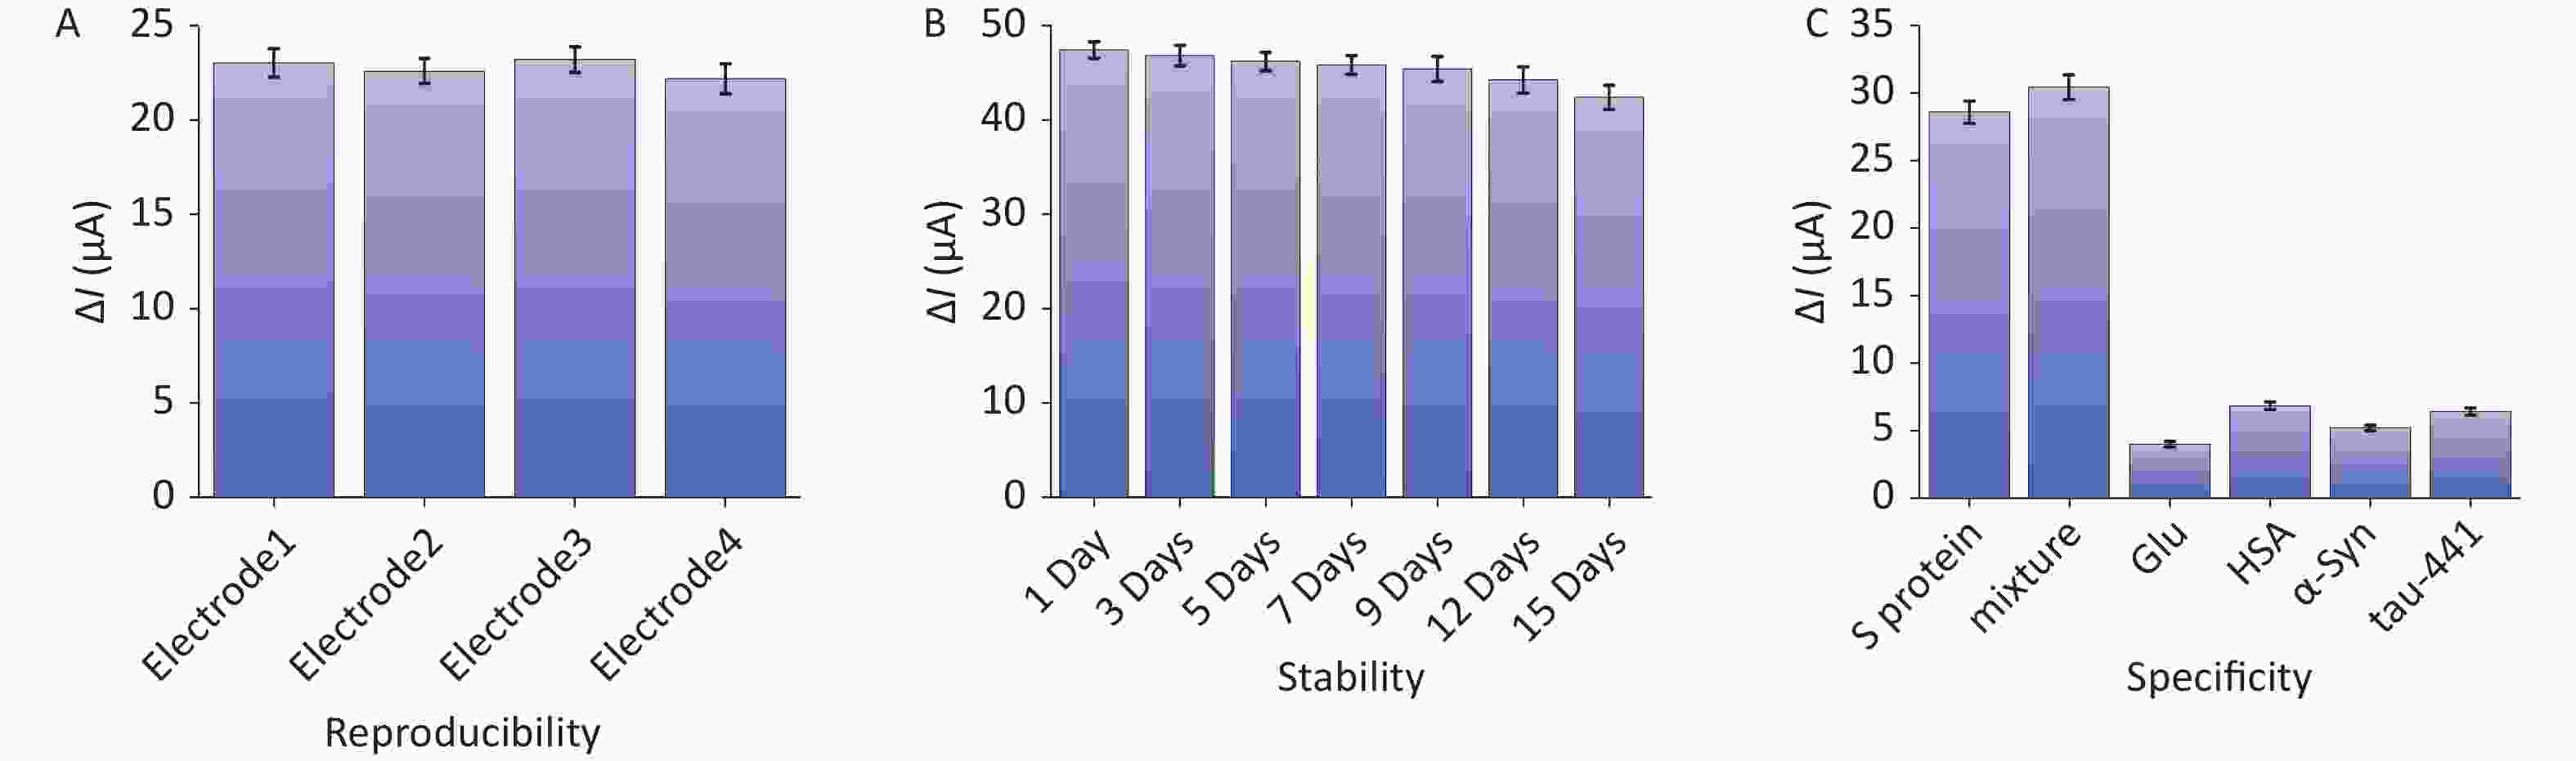
Figure 5. Assessment of microgel sensors’ performance: (A) reproducibility, (B) stability at 4 °C, and (C) specificity.
In addition, under the same operating conditions, the four electrodes were detected with the same concentration of S protein, and the signal response values were recorded to verify the repeatability of the sensor. The measurement results are shown in Figure 5B. The response values of the four electrodes were relatively close, and the relative standard deviation (RSD) was less than 5%, indicating that the sensor has evident reproducibility.
As shown in Figure 5C, four substances, including glucose, human serum albumin, α-synuclein, and Tau-441 protein, and a mixture of the four substances with S protein were selected as interference substances for the specificity experiment. Their concentration was controlled at a higher level than the detected S protein (10 pmol/L S protein and 100 pmol/L interferents). The results exhibited little difference between the peak current of S protein alone (28.61 ± 0.26 µA) and that of S protein with interfering substances (30.47 ± 0.35 µA). The binding of the S protein to the antibody remained intact, although the sensor was exposed to a mixture with a 10-fold concentration of the interferent and S protein. Simultaneously, the current exhibited by the detection of interfering substances alone was lower than that exhibited by the detection of S protein, and the difference in DPV peak currents obtained by interferents significantly narrowed. These results indicate the high selectivity of the sensing platform for the S protein.
-
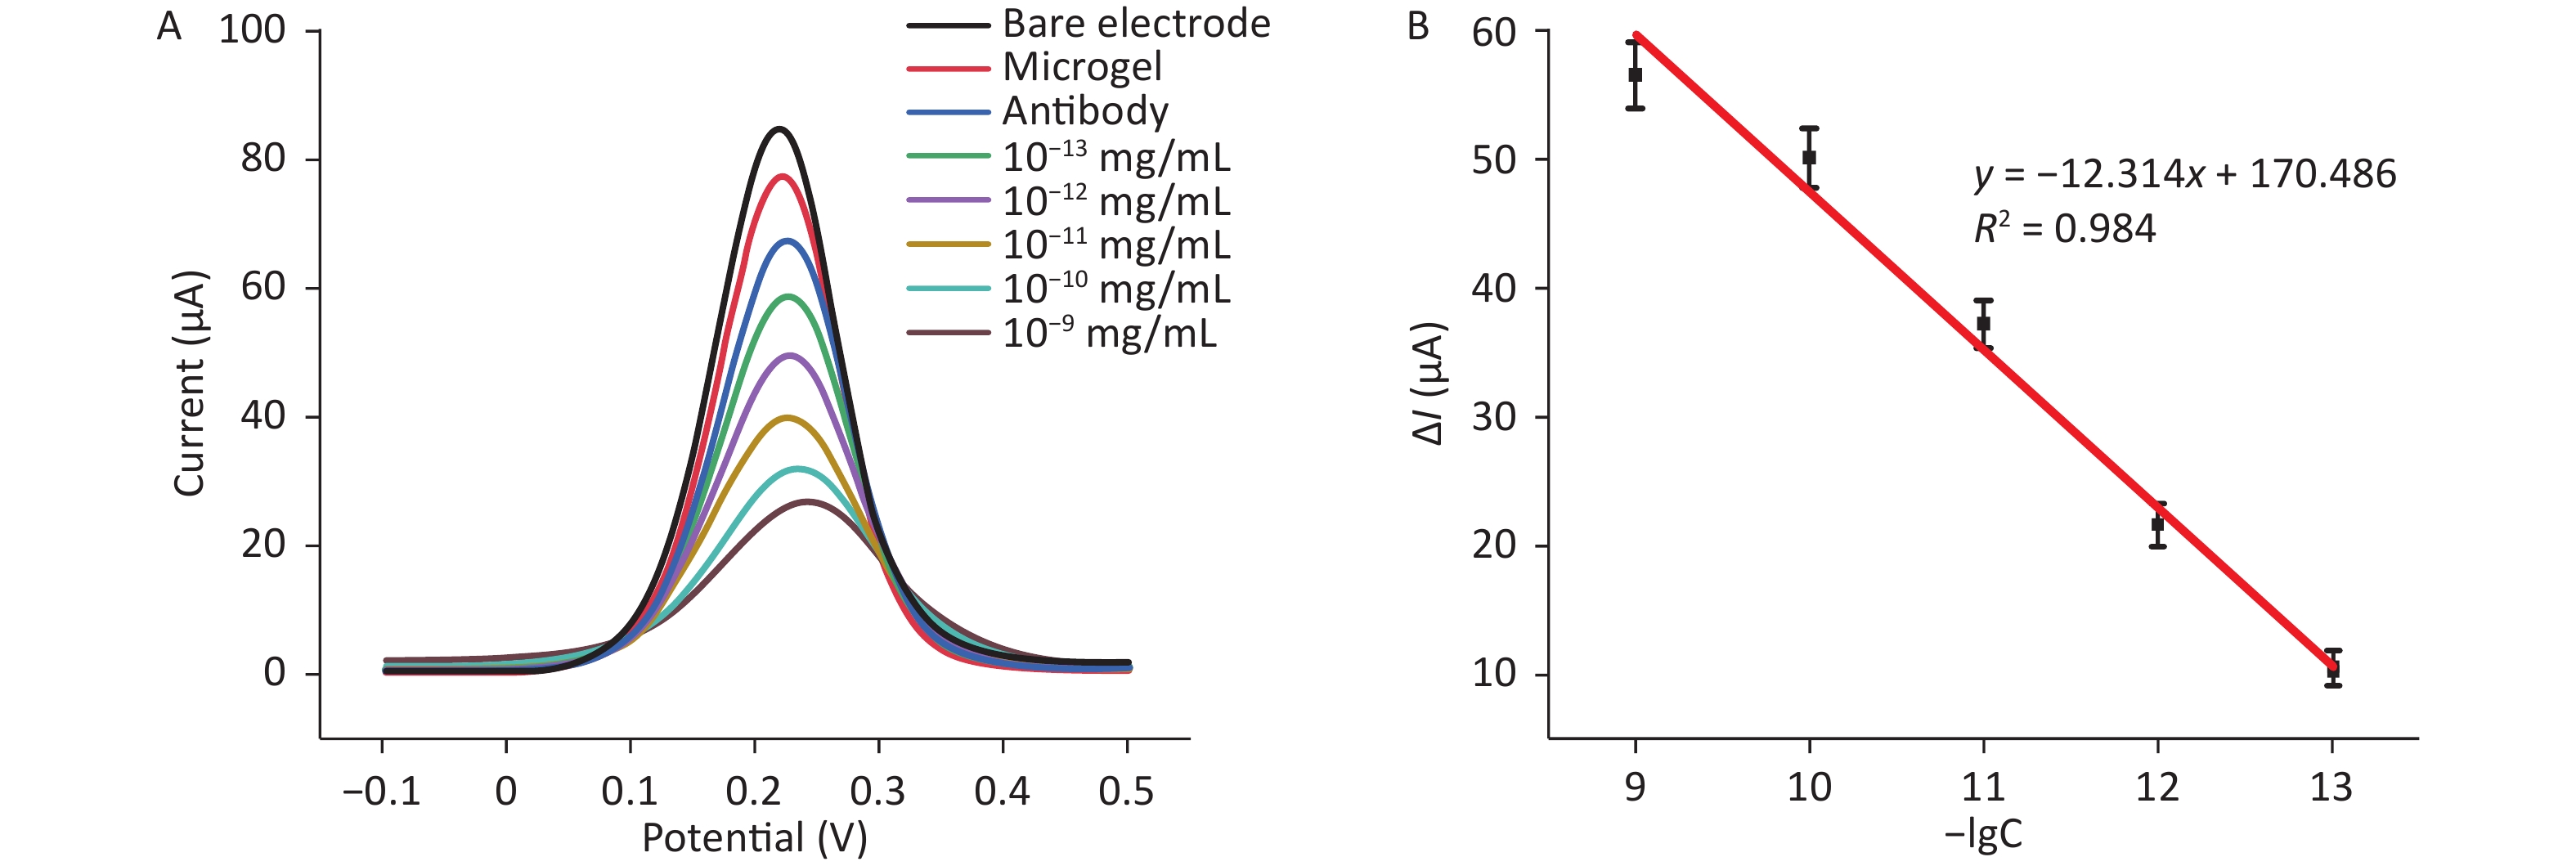
In evaluating the potential application of the microgel sensor, this sensor was used for the detection of a series of standard S protein solutions, which were prepared in artificial saliva. Artificial saliva samples had more complex properties than PBS, but the obtained results still showed no deviation from the standard curve (Figure 6). The linear range was 10−9–10−13 mg/mL, and the linear regression equation was presented as follows: ΔI = −12.314lgC + 170.486. The correlation coefficient (R2) was 0.984. Hence, the microgel sensor fabricated in this study is suitable for the detection of S protein in various real samples.
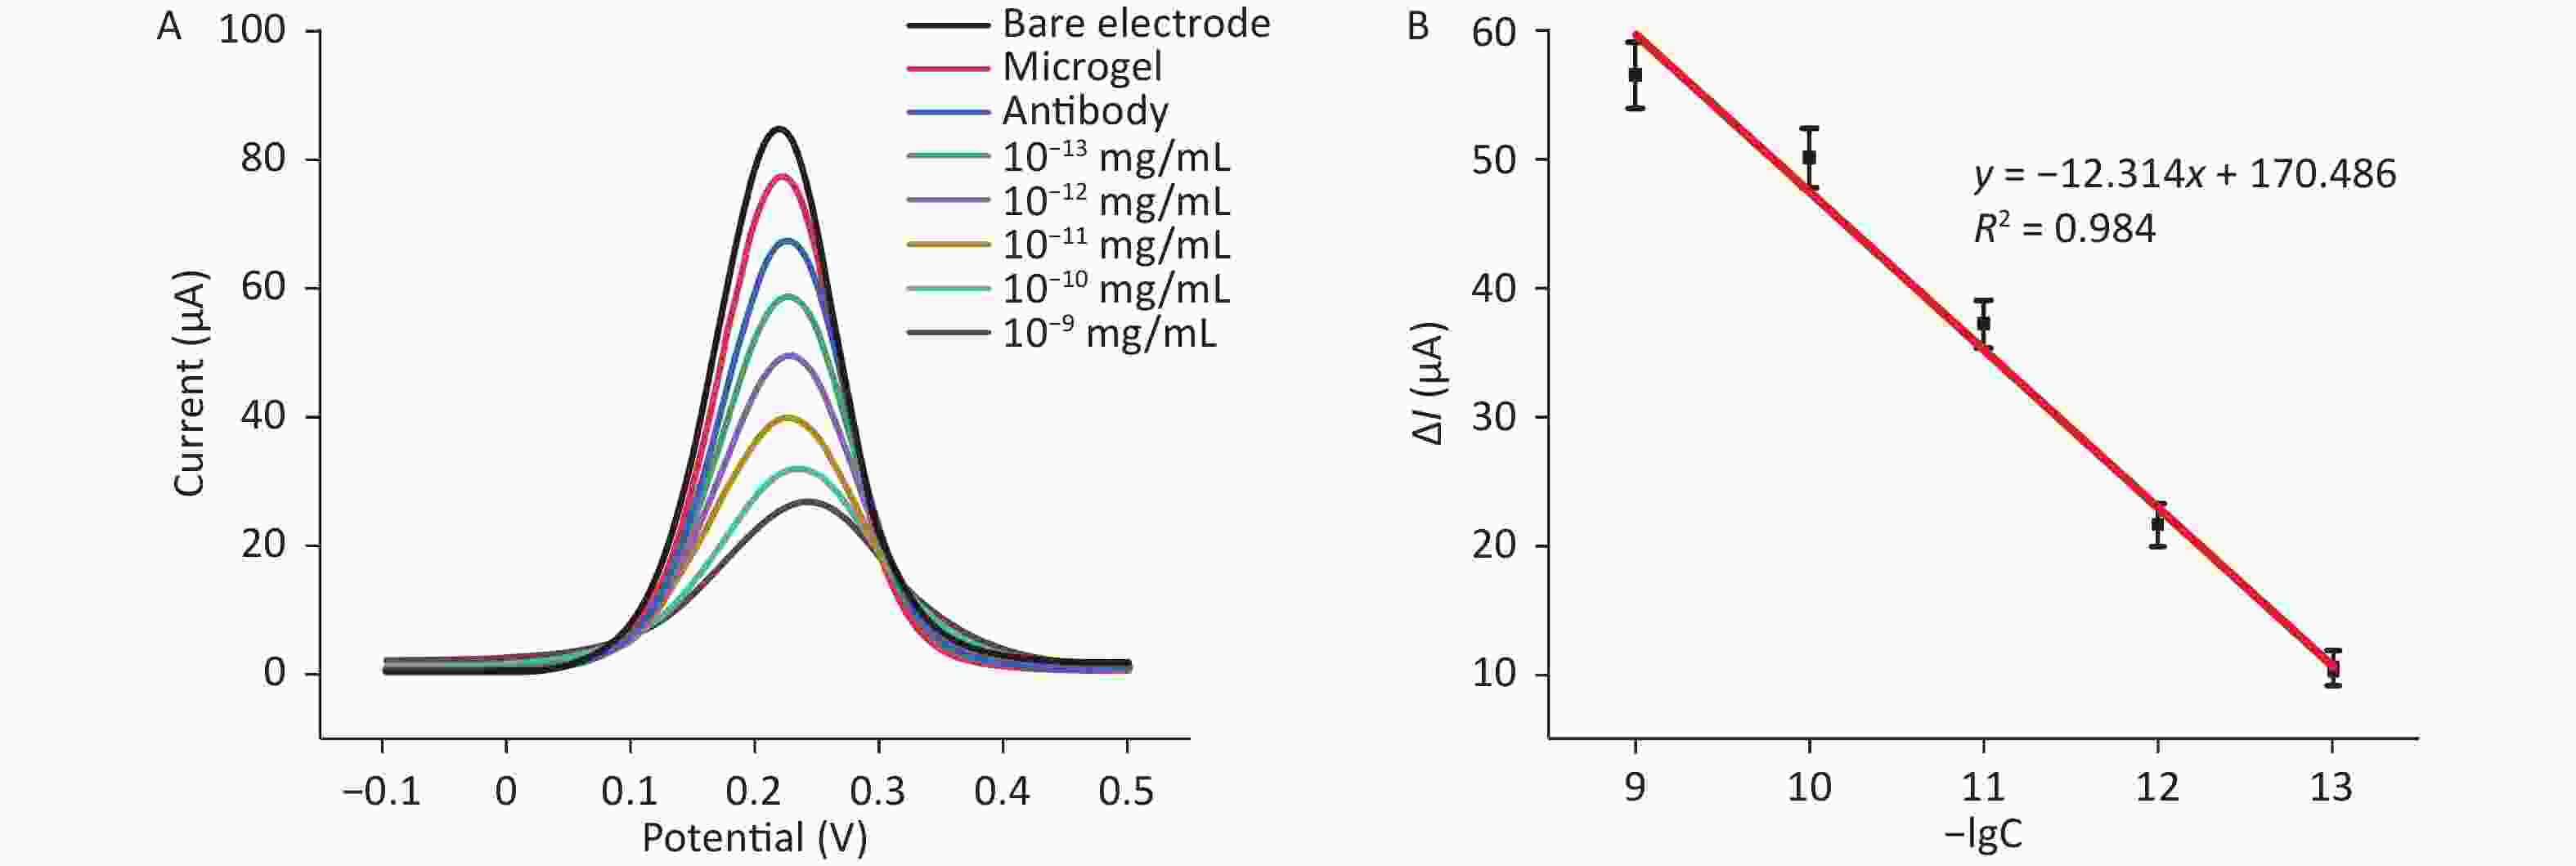
Figure 6. Detection of S protein in artificial saliva at different concentrations. (A) DPV detection of varying concentrations (10−13–10−9 mg/mL) of S protein. (B) Calibration curve showing the linear relationship of the biosensor in the detection of S protein in artificial saliva.
-
In demonstrating the reliability of the presented microgel sensor for actual specimen analyses, the sensing platform was used to measure three known different concentrations of S protein (500, 25, and 5 pg/mL). Each concentration was measured at least three times. The results are listed in Table 1. The recoveries ranged from 96.33% to 103.01%, and the RSD was less than 5%. This result indicates that the electrochemical biosensor is satisfactorily accurate and precise.
Sample Added concentration
(pg/mL)Found
(pg/mL)Recoveries
(%)RSD
(%)1 500 515.67 103.01 2.67 2 25 24.08 96.33 1.64 3 5 4.89 97.75 2.17 Note. RSD, relative standard deviation. Table 1. Measurement of recoveries (%) and RSD (%)
-
In this study, a microgel material-based sensor was used for the rapid and sensitive electrochemical detection of the SARS-COV-2 spike protein. The process parameters were scientifically and effectively optimized to obtain good sensing performance. The optimal conditions for the volume of microgel modification, the concentration of antibody, and the incubation time of antibody and S protein were 6, 10, and 50 min, respectively. This work achieved satisfactory results under optimal experimental conditions. The linear range was 10−13–10−9 mg/mL, and the detection limit was 9.55 fg/mL. The microgel was stabilized at room temperature and in an adjustable system that closely resembles the microenvironment of aqueous biological tissues. The microgel-based 3D electrode-modified material provides a natural microenvironment for S protein capture with better selectivity for S proteins than conventional 2D materials. Meanwhile, the activity of the sensing platform performed well within 15 days, and the results obtained from the modification of different electrodes showed favorable reproducibility. Therefore, the sensing platform can handle a large number of samples over the long term. The detection properties of the sensors in the experiments are compared with those of previous literature, and the previously reported sensors for the detection of SARS-CoV-2 are summarized in Table 2. The results show that the electrochemical sensor based on the microgel mode is an efficient and reliable detection platform for the detection of S protein.
Targets Material Method Linear range LOD Ref N protein Screen-printed electrodes DPV — 8 ng/mL [30] N protein Metalorganic frameworks
MIL-53(Al)DPV 0.025–50 ng/mL 8.33 pg/mL [31] S protein Pd-Au nanosheets DPV 0.01–1,000 ng/mL 0.72 × 10⁻² ng/mL [32] S protein Molecularly imprinted polymer SWV 50–400 fmol/L 64 fmol/L [33] S protein Screen-printed carbon electrodes EIS 0.01–100 nmol/L 66 pg/mL [34] S protein Screen-printed graphene EIS 0.25–1,000 fg/mL 0.25 fg/mL [35] S protein AuNP antibodies DLS — 5.29 × 10³ TCID50/mL [36] S protein — SERS — 9.3 pmol/L [37] S protein — Fiber-optic biolayer
interferometry— 36 pmol/L [38] S protein Microgel DPV 10−13–10−9mg/mL 9.55 fg/mL This work Note. DPV, differential pulse voltammetry; SWV, square wave voltammetry; EIS, electrochemical impedance spectroscopy; DLS, dynamic light scattering; SERS, surface-enhanced raman spectroscopy. Table 2. Comparison of different biosensor techniques for the detection of SARS-CoV-2 proteins
A new microgel-based electrochemical sensing system for the detection of the SARS-CoV-2 S protein has been developed. This S protein detection system displays competent sensitivity and accuracy, indicating its application potential in model biofluids. Although the practical application of this method to real-world samples needs further exploration and amelioration, our results demonstrate that this sensing platform can be integrated into portable devices to monitor the outbreak of emerging viruses. Considering that microgel synthesis can be tailored to capture any protein, this new electrochemical sensing system can be widely used to detect SARS-CoV-2 S variants of concern (VOCs) proteins and other emerging viruses. Furthermore, this method may play a role in the detection of SARS-CoV-2 VOCs and potential new outbreaks caused by emerging viruses.
The S protein detection system in this experiment showed excellent sensitivity, stability, and accuracy, with detection limits as low as 9.55 fg/mL. This sensing platform yielded more accurate reports than conventional assays at a lower cost and with a simpler and faster detection process. Despite our satisfactory results, the present sensing platform still has some limitations. Intact viruses could not be detected under the conditions used in this experiment because of the strong infectiousness of SARS-CoV-2. Therefore, further experiments must be performed to demonstrate the effectiveness of the detection of actual viruses.
-
The authors declare that they have no known economic interests or personal relationships that might affect the work reported herein.
HTML
Chemicals and Apparatus
Pretreatment of Gold Electrodes and Synthesis of AuNPs@NIPAm-co-AAc Microgels
Fabrication and Working Principle of the Electrochemical Biosensor
Characterization of Nanomaterials
Electrochemical Characterization of the Sensing Platform
Optimization of Experimental Conditions
Analysis of Standard Samples in PBS
Stability, Accuracy, and Reproducibility
Measurements with Artificial Saliva Sample
Accuracy and Precision
&These authors contributed equally to this work.
 22354Supplementary Materials.pdf
|

|

 Quick Links
 DownLoad: