


-
Triple-negative breast cancer (TNBC) is characterized by the absence of estrogen and progesterone receptors and HER2 expression. It is predominantly classified as basal breast cancer[1] and accounts for 10%–15% of all breast cancer (BC) cases. Despite the use of optimal adjuvant treatments, TNBC often exhibits early metastasis and poor prognosis[2]. However, owing to its heightened immunogenicity, significant infiltration of tumor-infiltrating lymphocytes, and elevated PD-L1 expression, TNBC may have a greater potential to benefit from immune checkpoint blockade therapies[3]. Clinical trials have demonstrated that the combination of atezolizumab and nab-paclitaxel improves survival outcomes in patients with metastatic TNBC who were PD-L1 positive. Nevertheless, the efficacy of single-agent immune checkpoint inhibitors in TNBC remains limited, necessitating the development of strategies to enhance the antitumor immune response and prolong the survival of patients with metastatic disease[4].
Recent gene expression analyses of BC have revealed distinct subtypes with clinical, biological, and therapeutic significance. Notably, the basal-like tumor group shares similarities with the clinical characteristics of breast basal/myoepithelial cells[5]. The integration of precision medicine and next-generation sequencing in cancer diagnosis has facilitated the implementation of customized treatment approaches based on molecular marker expression in both clinical practice and trial design[6]. Furthermore, large-scale gene sequencing and other “omics” techniques have shed light on dysregulated pathways in TNBC, leading to the identification of actionable molecular features, such as germline BRCA1/2 mutations or “BRCAness” the presence of androgen receptors, and rare genomic alterations[7]. A comprehensive understanding of these genetic changes may facilitate the development of novel treatment strategies for TNBC.
The presence of tumor-infiltrating lymphocytes (TILs) in adenocarcinoma has emerged as a reliable prognostic factor that positively affects patient survival, particularly in BC subtypes characterized by triple-negative and HER2 overexpression[8]. Although T cells constitute the primary TIL population[9], the correlation between quantitative and qualitative variations among T cell subpopulations and patient prognosis remains unclear. Single-cell sequencing studies revealed that BCs with abundant TILs harbor CD8+ T cells that exhibit characteristics of tissue-resident memory (TRM) cell differentiation. CD8+ TRM cells display elevated expression of immune checkpoint molecules and effector proteins. Notably, gene signatures specific to CD8+ TRM cells derived from scRNA-seq data were strongly associated with improved survival outcomes in patients with early-stage TNBC, surpassing the prognostic value of CD8 expression alone. CD8+ TRM cells play a crucial role in immune surveillance within the BC microenvironment and represent a prime target for modulating immune checkpoint inhibition[10].
Based on available data, immune checkpoint inhibitor therapy holds promise as a targeted treatment approach for patients with TNBC with the ability to predict treatment responses[11]. Timing of treatment is crucial as biomarker evaluation for patient response should ideally occur at the time of initial diagnosis, allowing for the consideration of immunotherapy as a first-line treatment option. However, the identification of reliable biomarkers that can accurately predict treatment responses remains a subject of ongoing research, necessitating further investigations to assist in the selection of optimal treatments for specific patients. Our objective was to develop a prognostic model for TNBC by analyzing immune-related genes that exhibit significant differences between CD8+ T cells and other cell types in TNBC. This model aims to identify TNBC subpopulations that are most likely to benefit from immunotherapy, thus facilitating personalized treatment strategies.
-
To obtain the necessary information on patients with TNBC, we accessed The Cancer Genome Atlas (TCGA) database (https://portal.gdc.cancer.gov/) and the METABRIC database (http://www.cbioportal.org/). These databases provide comprehensive datasets containing RNA transcriptome data (HTSeq Counts and HTSeq FPKM) and relevant clinical information specifically related to BC.
We retrieved datasets from these databases and filtered them to extract information pertaining to patients with TNBC. We obtained 271 TNBC samples from the METABRIC database as the training set and 187 TNBC samples from TCGA as the validation set for further analysis. All data obtained were standardized to ensure consistency and comparability across datasets.
-
To identify the immune-related CD8+ T genes specific to TNBC, we accessed single-cell sequencing data (GSE11068) from the TISCH database. From this dataset, we extracted differentially expressed genes associated with CD8+ T cells in TNBC.
A list of immune-related genes was obtained from the IMMPORT database. Using the R package, we performed an intersection analysis between the differentially expressed genes in CD8+ T cells and immune-related genes. This analysis identified 67 immune-related CD8+ T cell differential genes that were used for subsequent analyses.
-
We used the STRING database to construct the protein-protein interaction (PPI) network. This allowed us to visualize the interactions between the differentially expressed genes obtained in the previous step. By integrating available PPI data, a comprehensive PPI network was generated.
Next, to identify hub genes associated with prognosis, we performed univariate regression analysis of the differentially expressed genes. This analysis helped us identify the genes that exhibited significant differences in prognosis. From this analysis, we selected eight genes showing statistically significant differences for further model construction and analysis. These eight genes served as core genes for subsequent steps in this study.
-
Using the prognosis-related genes obtained earlier, we employed LASSO regression with a 10-fold cross-validation approach. The validation process involved setting a P-value threshold of 0.05 and running 1,000 cycles. To prevent overfitting, we applied random perturbations 1,000 times in each cycle.
Through the LASSO regression process, we identified three genes and their corresponding correlation coefficients, which were used to construct a prognostic model.
To assess the accuracy of the model, we analyzed its performance using a validation set. This involved conducting single-and multi-factor analyses and generating an area under the curve (AUC).
The validation process ensured the robustness and reliability of the prognostic model, provided insight into the differences observed in the validation set, and evaluated its performance through various analyses.
-
To conduct functional enrichment analysis, we used the Kyoto Encyclopedia of Genes and Genomes (KEGG) database. Specifically, we employed the “ClusterProfiler” package (V 4.6.2) to perform KEGG analysis, which allowed us to identify and analyze the significant functional pathways associated with the different groups identified in this study. This analysis provides insights into the important biological processes and pathways involved in the high- and low-risk groups.
Furthermore, mutation analysis was performed using the Maftools package (V 2.14.0). This analysis involved examining the mutation information, specifically within the high- and low-risk groups. By studying the mutation landscape, we aimed to gain a better understanding of the genomic alterations and potential driver mutations associated with different TNBC risk groups.
We performed several analyses to assess the differences in response to immunotherapy between the high- and low-risk groups. First, we examined the differences in the expression of CD274 (also known as PD-L1) between the two groups and evaluated its correlation with risk scores. This analysis provides insight into the potential association between CD274 expression and risk groups.
Next, we conducted an immune infiltration analysis to explore the variations in immune cell populations between the high- and low-risk groups. This analysis aimed to identify important factors related to the immune response within the tumor microenvironment.
Additionally, we performed immune functional analysis to assess the functional characteristics of the immune system in relation to the risk groups. By examining immune-related functional pathways and processes, we aimed to identify the key factors that may contribute to differences in immunotherapy responses.
To validate the accuracy of the risk group classification in predicting immunotherapy responses, we compared the responses of different subtypes of samples. Furthermore, we plotted the AUC to assess the predictive performance of the risk group classification in relation to immunotherapy response. This analysis provided an objective evaluation of the accuracy of the model in predicting the likelihood of positive immunotherapy outcomes.
-
To identify CD8+ T cell-related immune genes, we obtained immune-related gene data from the IMMPORT (https://www.immport.org/home) and InnateDB (https://www.innatedb.ca/) databases. We then accessed single-cell data of TNBC from the TISCH database (https://tisch.comp-genomics.org) to extract the expression profile of CD8+ T cells.
In the GSE110686 dataset, we divided the cells into 13 different subpopulations based on the expression of marker genes (Figure 1A). Subsequently, we performed cell annotation and identified six cell types: CD4+ Tconv, CD8+ T, CD8+ Tex, Mono, Tprolif, and Treg cells (Figure 1B). The pie chart shows that the sample contains 1,681 CD8+ T cells (Figure 1C).
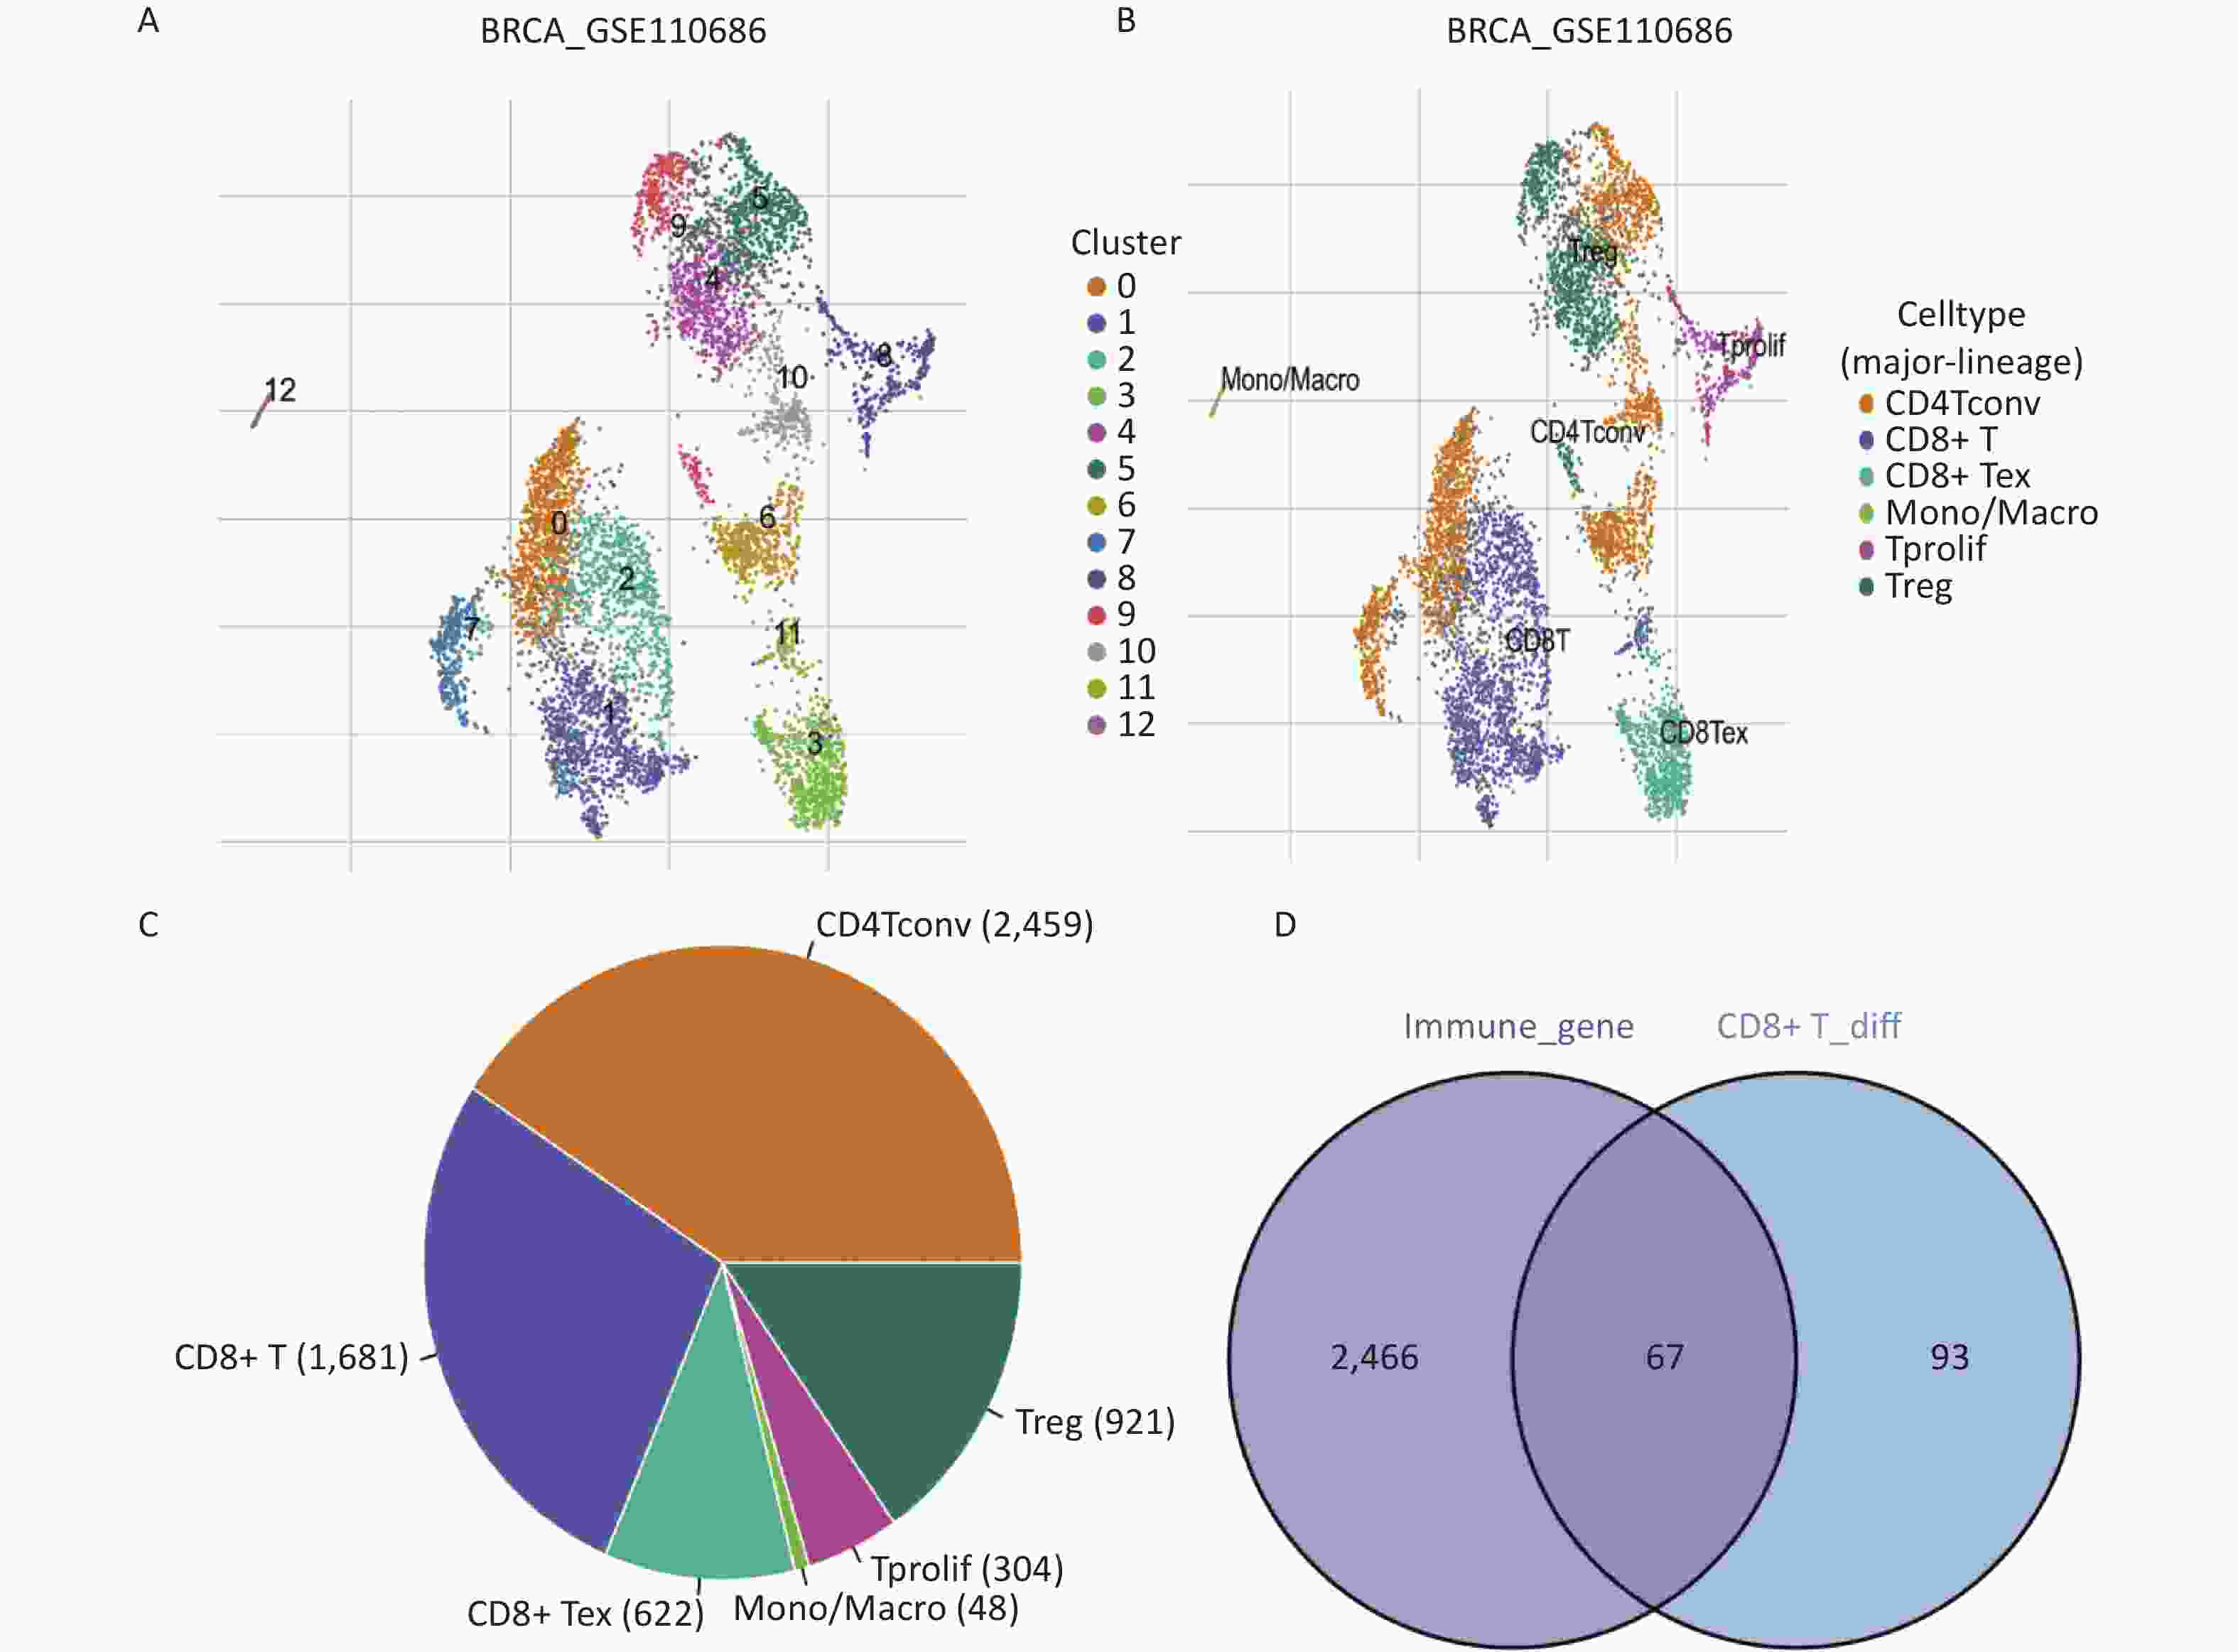
Figure 1. Identification of CD8+ T cell-related immune genes. (A, B) Triple-negative breast cancer single-cell sequencing UMAP cluster analysis visualization, there are six different cell types from 13 clusters. (C) Number of different types of cells in single-cell sequencing. (D) Venn map acquisition of 67 intersection genes.
To identify CD8+ T cell genes specifically related to immunity, we analyzed the differential gene expression within the CD8+ T cells from the GSE110686 sample. A total of 160 differentially expressed genes were identified (P < 0.05). To narrow down the list to immune-related genes, we intersected the differentially expressed genes with immune-related genes and generated a Venn plot. This resulted in the identification of 67 CD8+ T cell-related immune genes (Figure 1D). These genes represent key targets for further investigation of the immune response in TNBC.
-
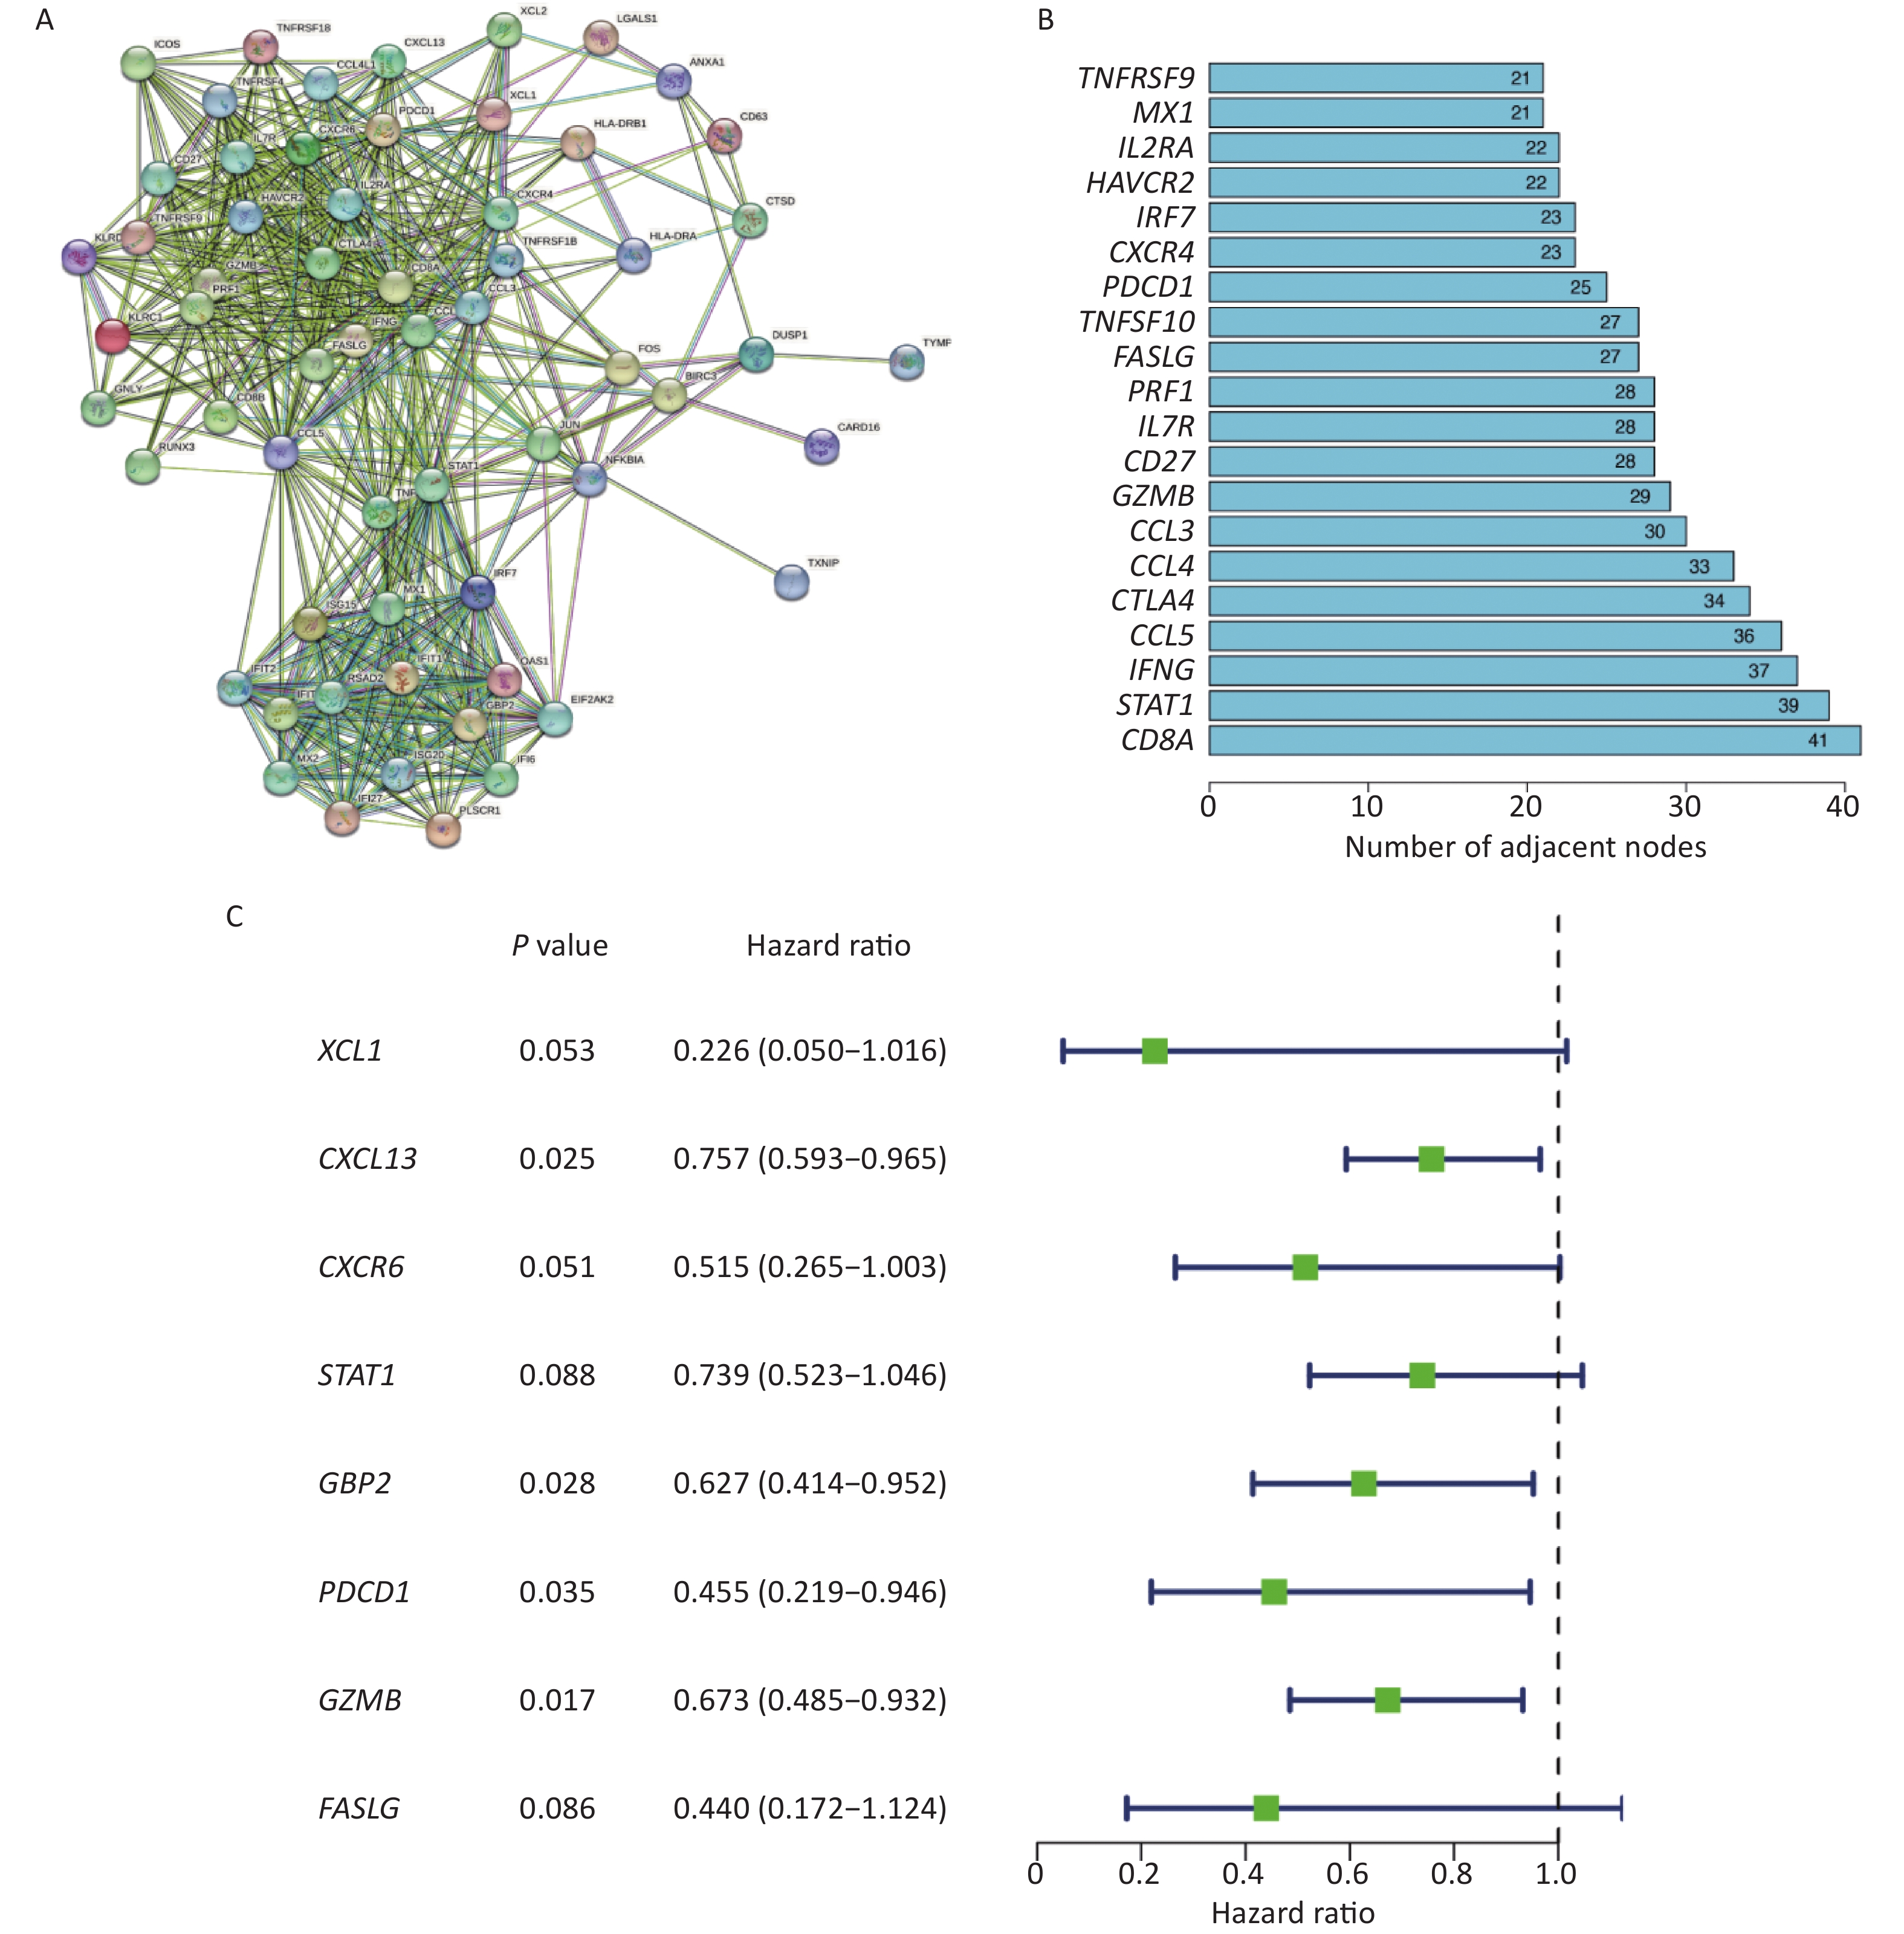
To obtain relevant core genes for further analysis, we constructed a PPI network comprising 67 genes using the STRING database (Figure 2A). The number of nodes for each gene was determined (Figure 2B). Notably, CD8A and STAT1 emerged as pivotal contributors within the network, with 41 and 39 nodes, respectively. To identify genes suitable for model construction, a comprehensive univariate analysis encompassing all genes was performed (Figure 2C), which led to the identification of eight key prognostic genes: XCL1, CXCL13, CXCR6, STAT1, GBP2, PDCD1, GZMB, and FASLG (P < 0.1).
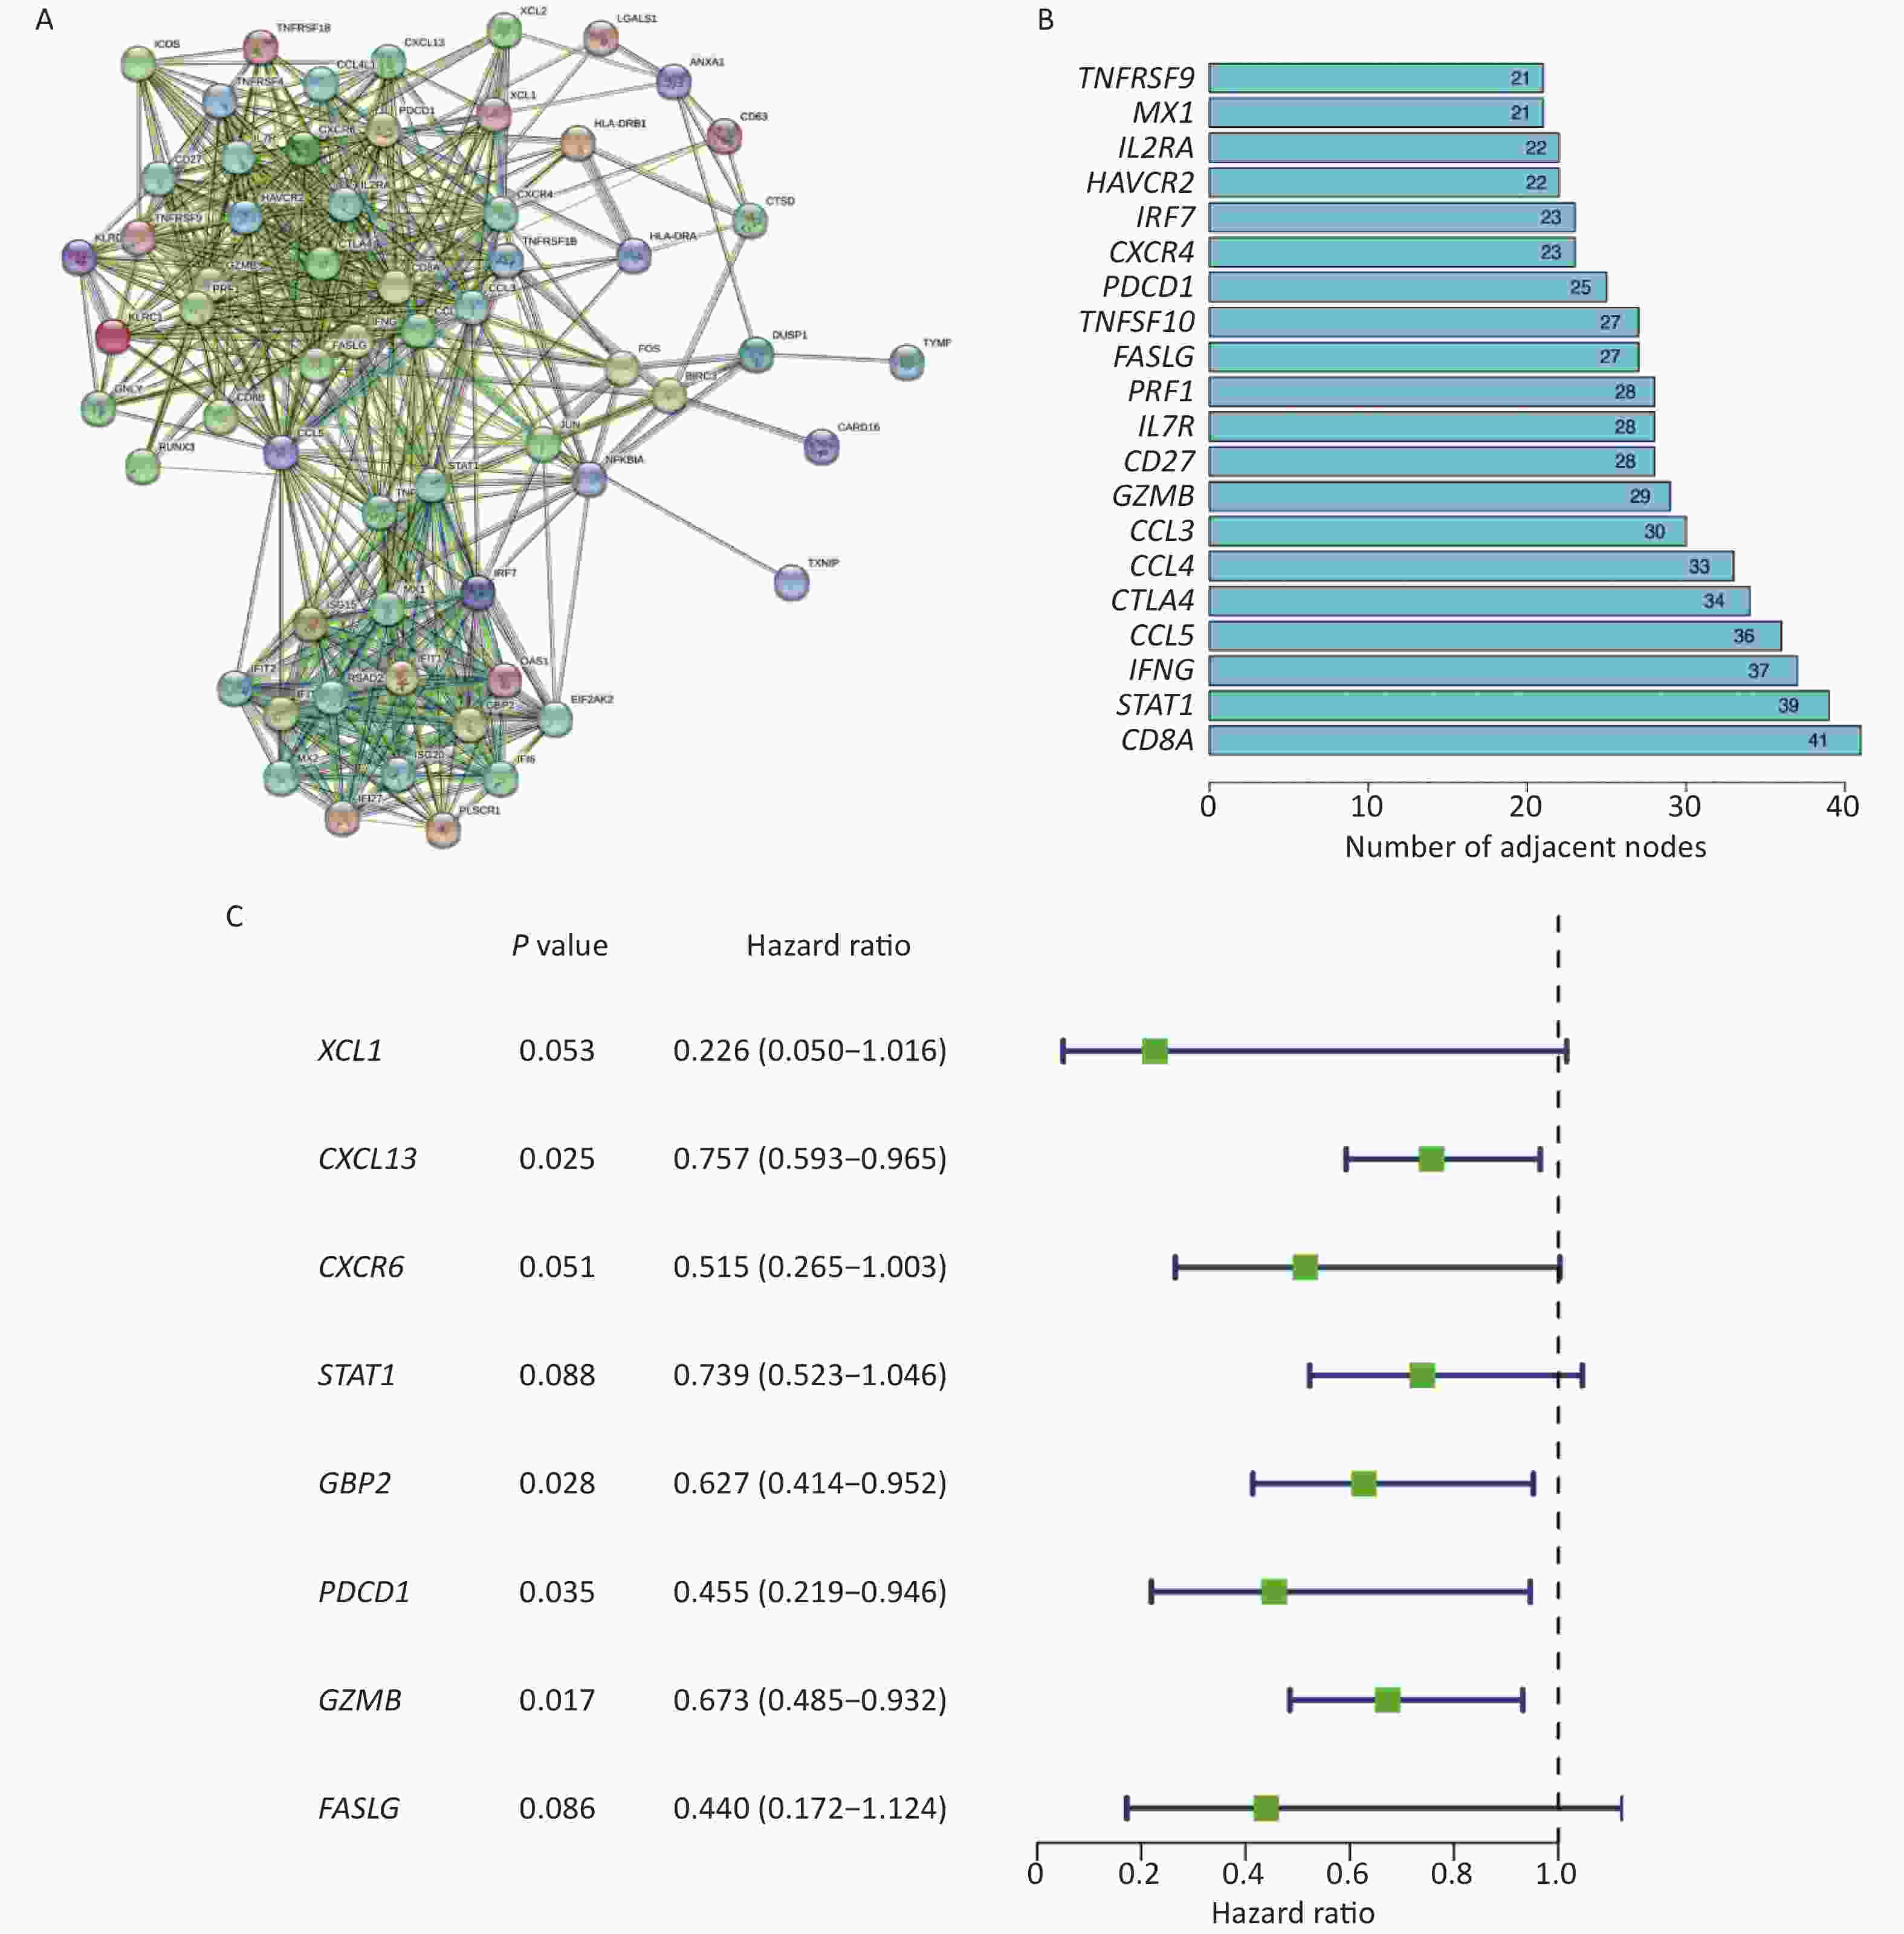
Figure 2. Construction of PPI network and acquisition of core genes. (A) Construction of PPI Network for Intersecting Genes. (B) Histogram showing the number of nodes of different genes in the network graph, the bigger the number means more genes associated with it. (C) Screening of 8 prognostic-related differentially expressed genes.
-
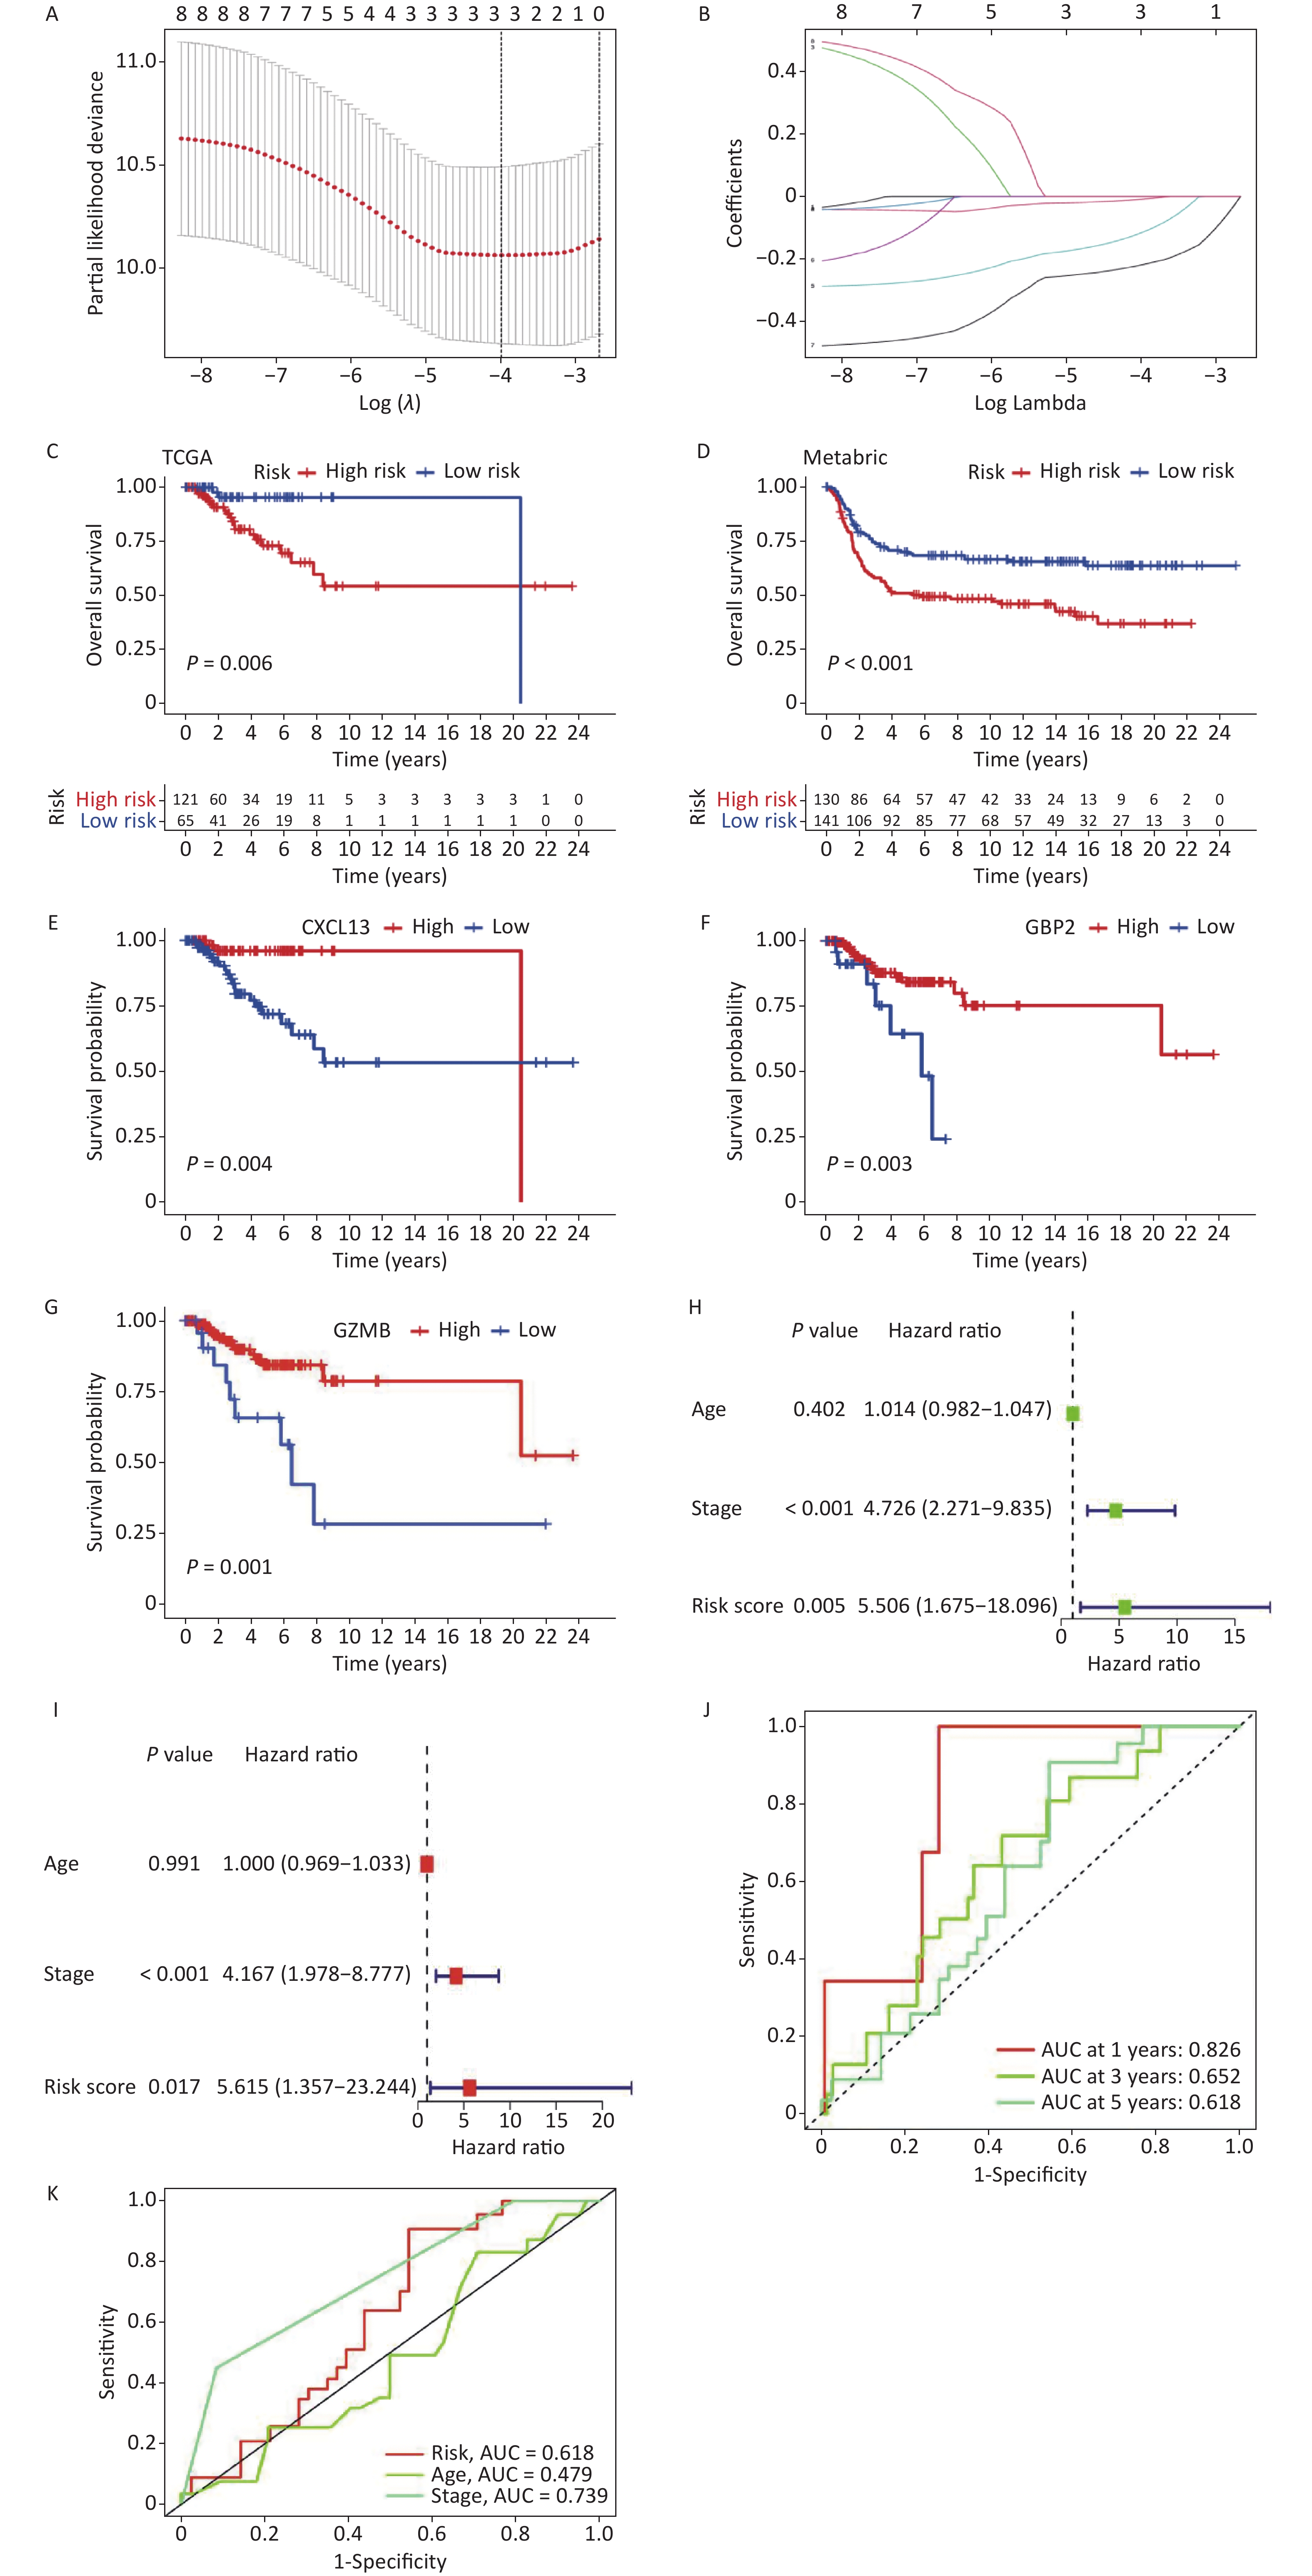
To mitigate the risk of overfitting the prognostic features, LASSO regression was performed on the genes. By setting the primary value of Log (λ) as the minimal deviation possibility, three genes associated with the prognosis of TNBC were extracted (Figure 3A–B). Subsequently, a risk scoring formula was developed as follows:
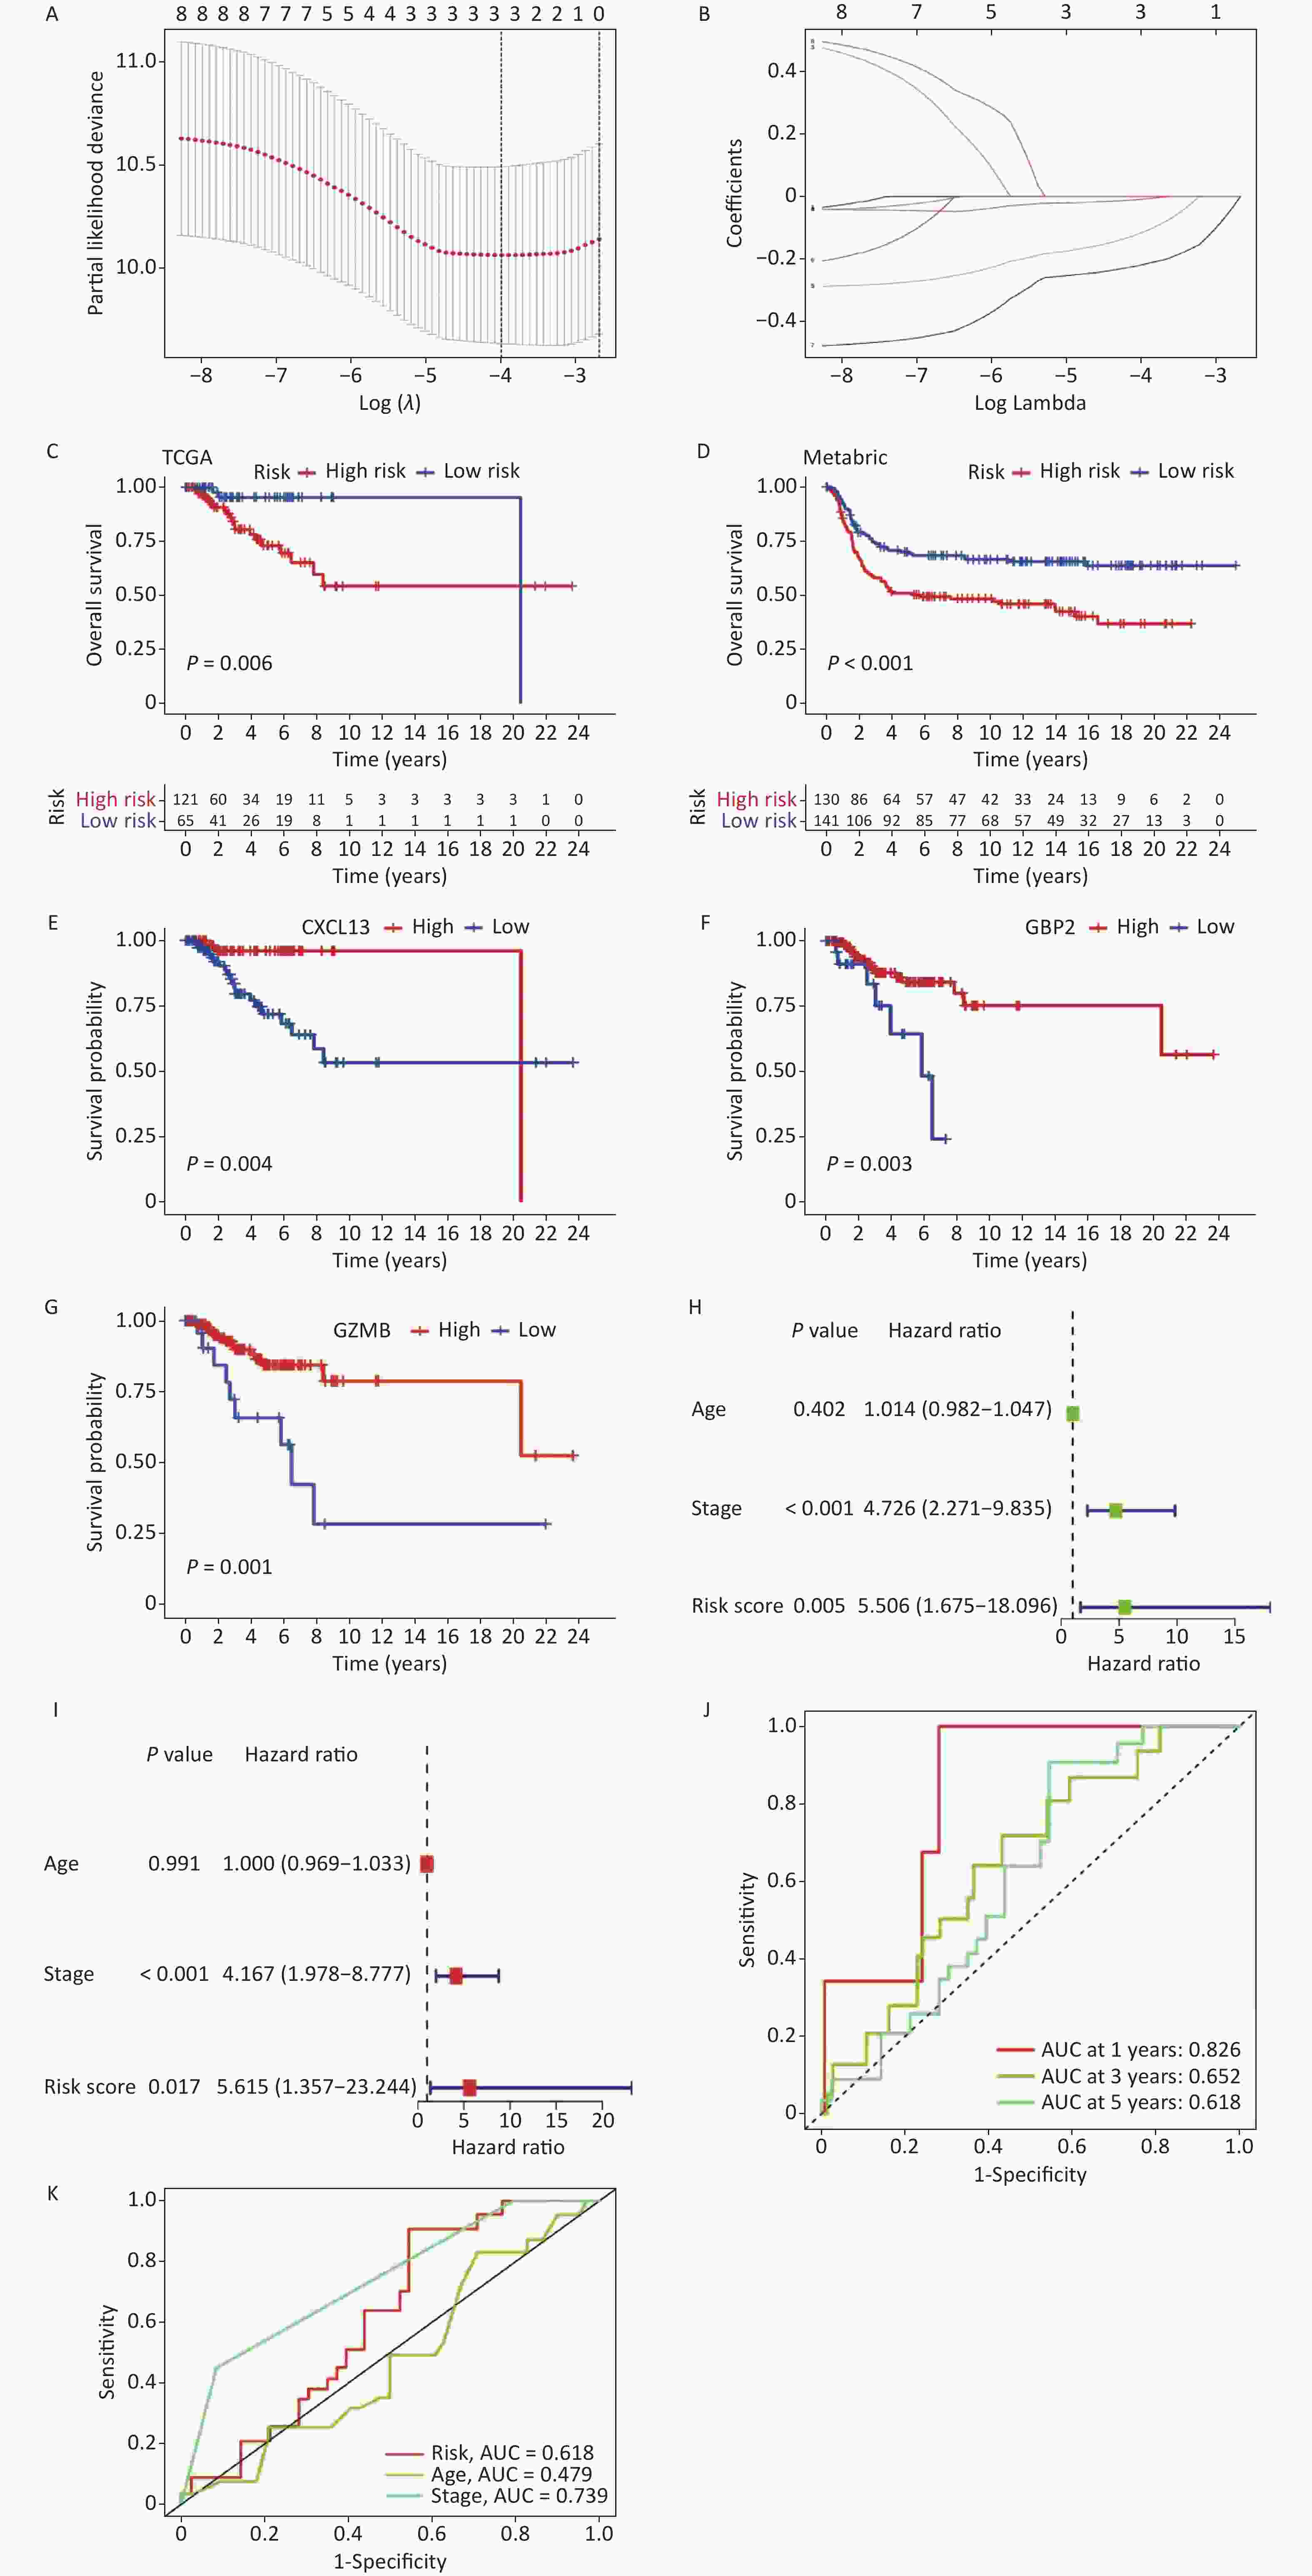
Figure 3. Construction and validation of a prognostic model. (A, B) LASSO regression to determine the optimal outcome λ Values. (C, D) To validate the model in TCGA and METABRIC samples respectively, both of the training set and validation set show significant differences (P < 0.05). (E–G) Prognostic analysis of the genes involved in constructing the model in high and low-risk groups. (H, I) Univariate and multivariate analyses of the model (J, K) To validate the predictive ability of the model.
$$ riskscore=\sum _{k=1}^{n}coef\left({gene}^{k}\right)\times expr\left({gene}^{k}\right) , $$ where "coef" represents the correlation coefficient of the gene and "expr" represents the expression level of the gene in each sample. The prognostic statuses of the high- and low-risk groups were compared using the risk scoring formula in TCGA and validated using the METABRIC sample (Figure 3C–D). The results demonstrated that the model effectively predicted patient prognosis (P < 0.1), with a cutoff value of 40%. Moreover, prognostic analysis was conducted on three genes (CXCL13, GBP2, and GZMB), which revealed significant differences (Figure 3E–G).
Univariate and multivariate analyses were performed to verify the predictive efficacy of this model for clinical traits (Figure 3H–I). The results indicated significant differences in grading and risk scores (< 0.05). Furthermore, the model prediction analysis demonstrated the model’s ability to effectively predict the 1-year, 3-year, and 5-year survival rates of patients (Figure 3J). Additionally, the AUC curve revealed that the model better predicted patient grading and risk scores, whereas its predictive performance based on age was less satisfactory (Figure 3K).
-
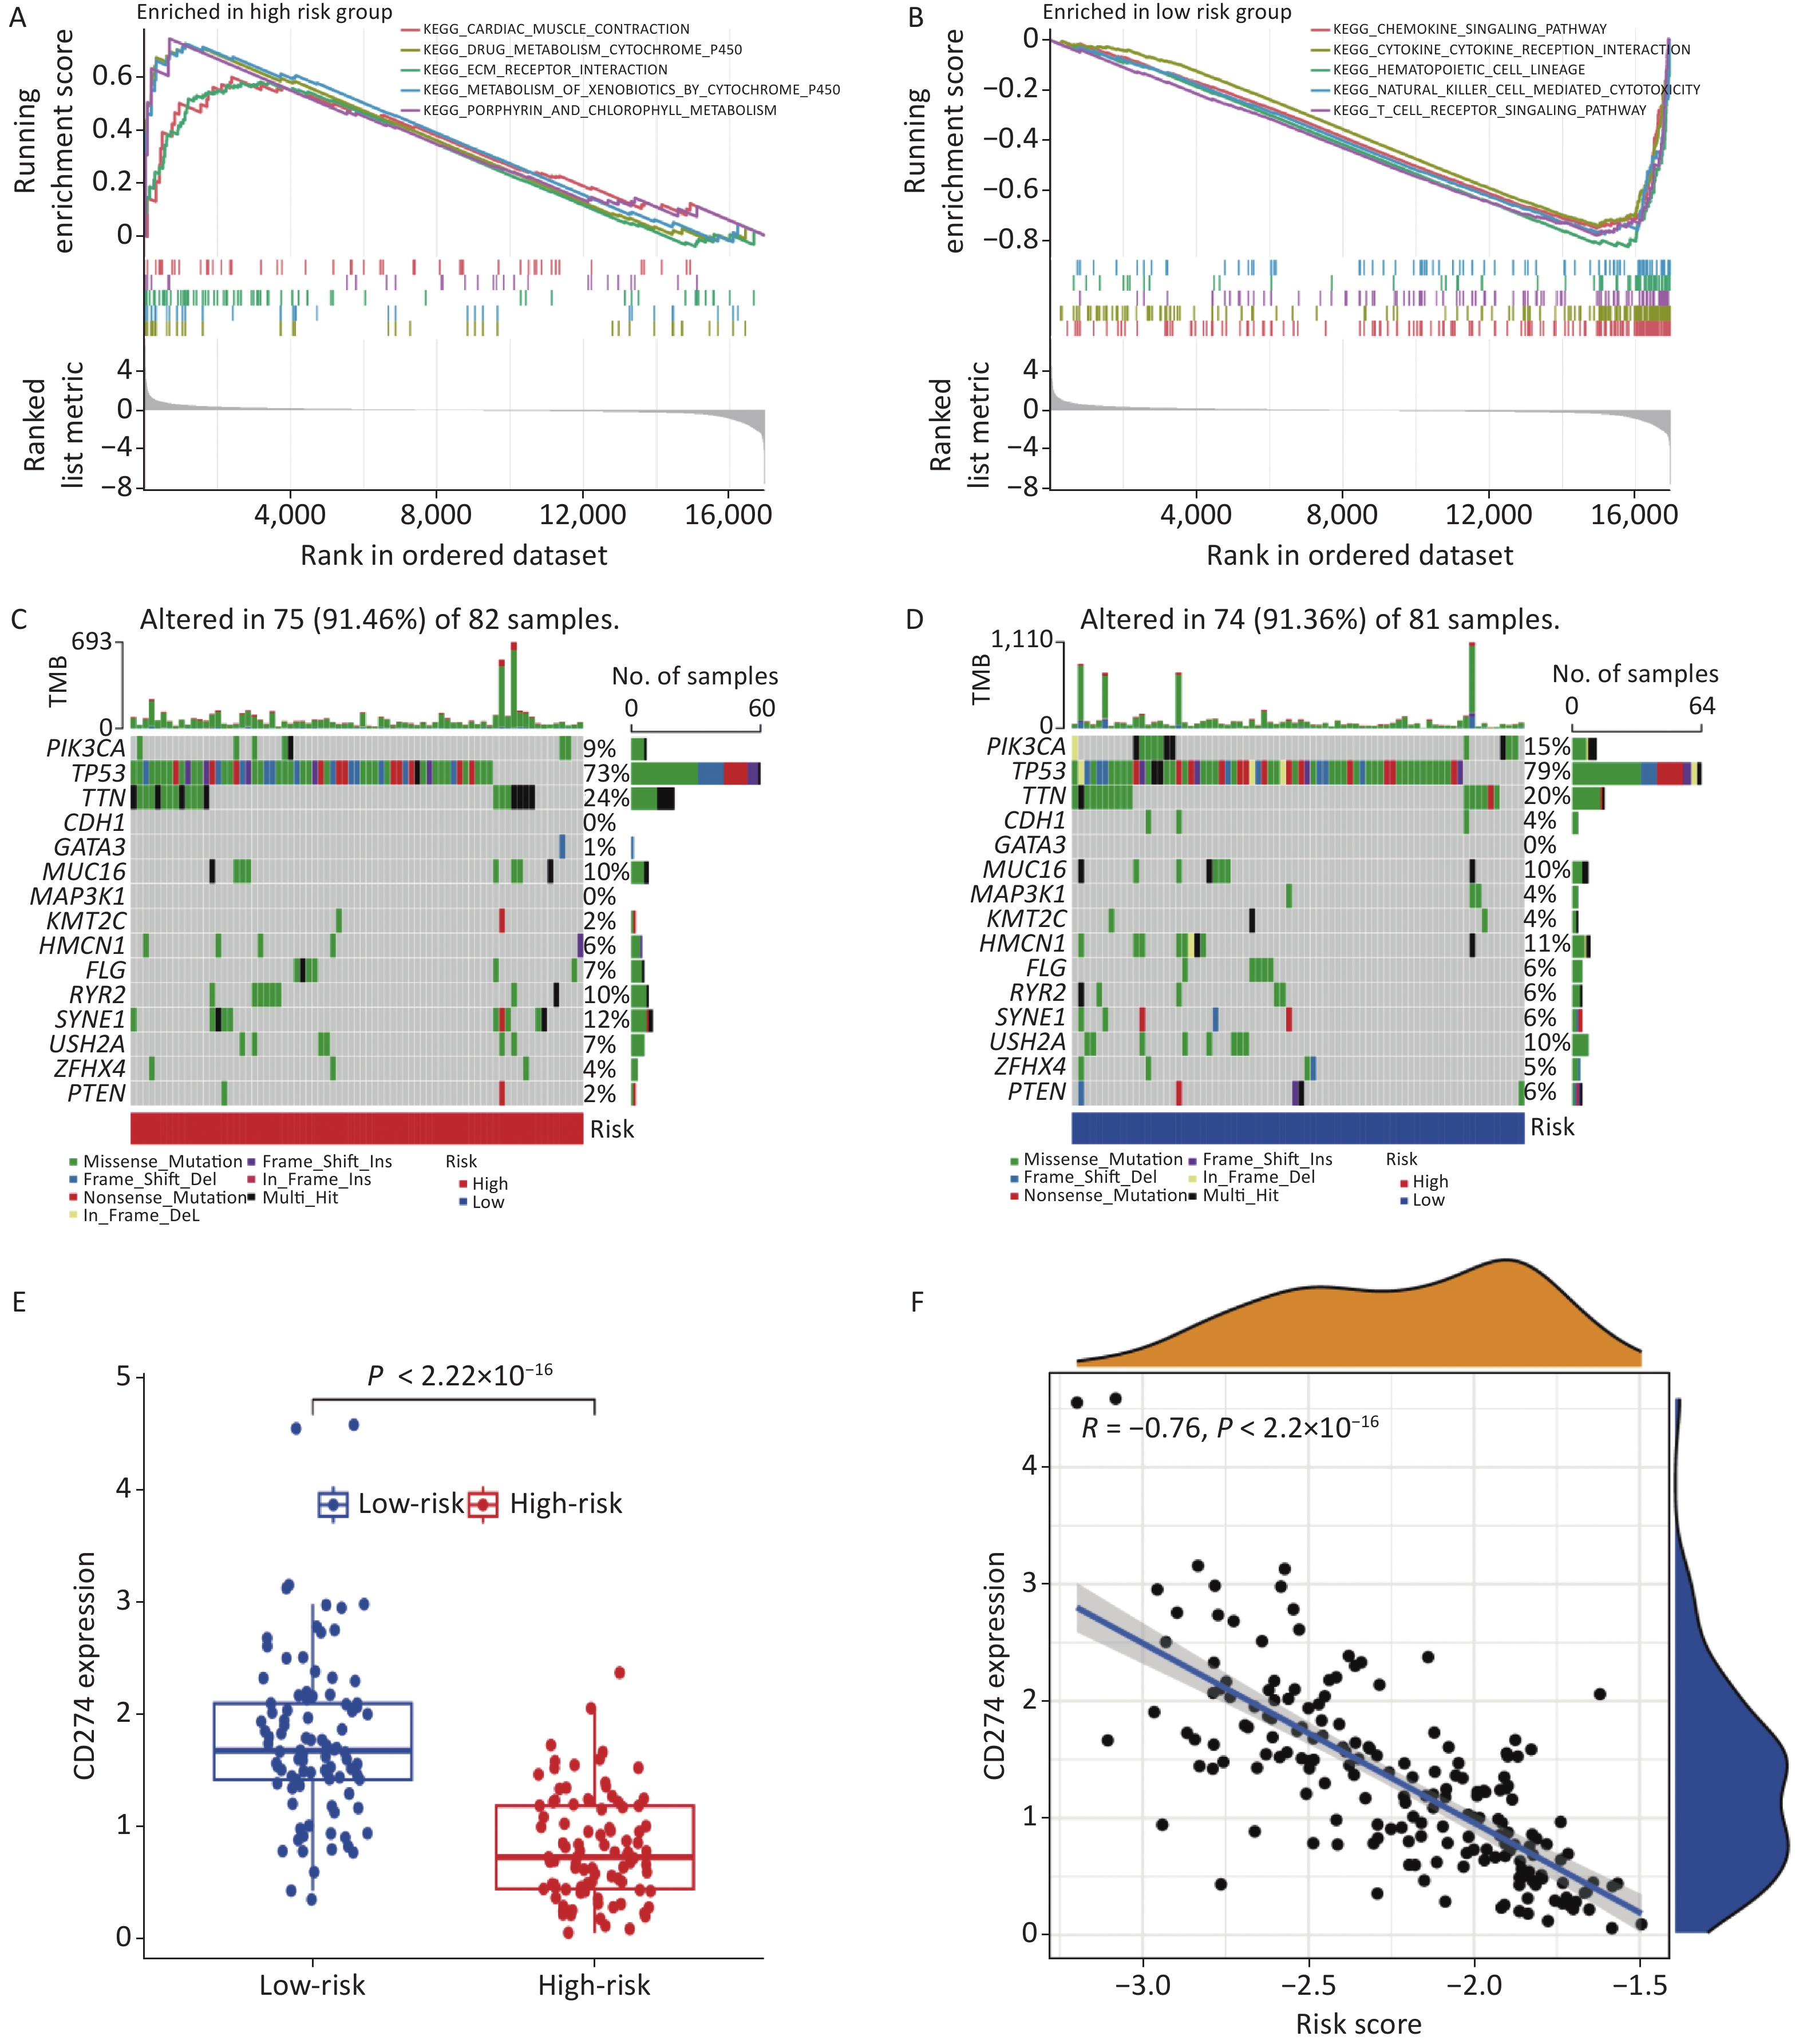
KEGG pathway analysis was conducted on samples from the high- and low-risk groups to explore the crucial biological functions and pathways associated with the identified core genes. The results revealed that the high-risk group primarily exhibited enrichment in cardiac muscle contraction, drug metabolism via cytochrome P450, extracellular matrix (ECM) receptor interaction, and xenobiotic metabolism via the cytochrome, porphyrin, and chlorophyll metabolism pathways. Conversely, the low-risk group demonstrated enrichment in the chemokine signaling pathway, cytokine receptor interaction, hematopoietic cell lineage, natural killer cell-mediated cytotoxicity, and T cell receptor signaling pathway (Figure 4A–B).
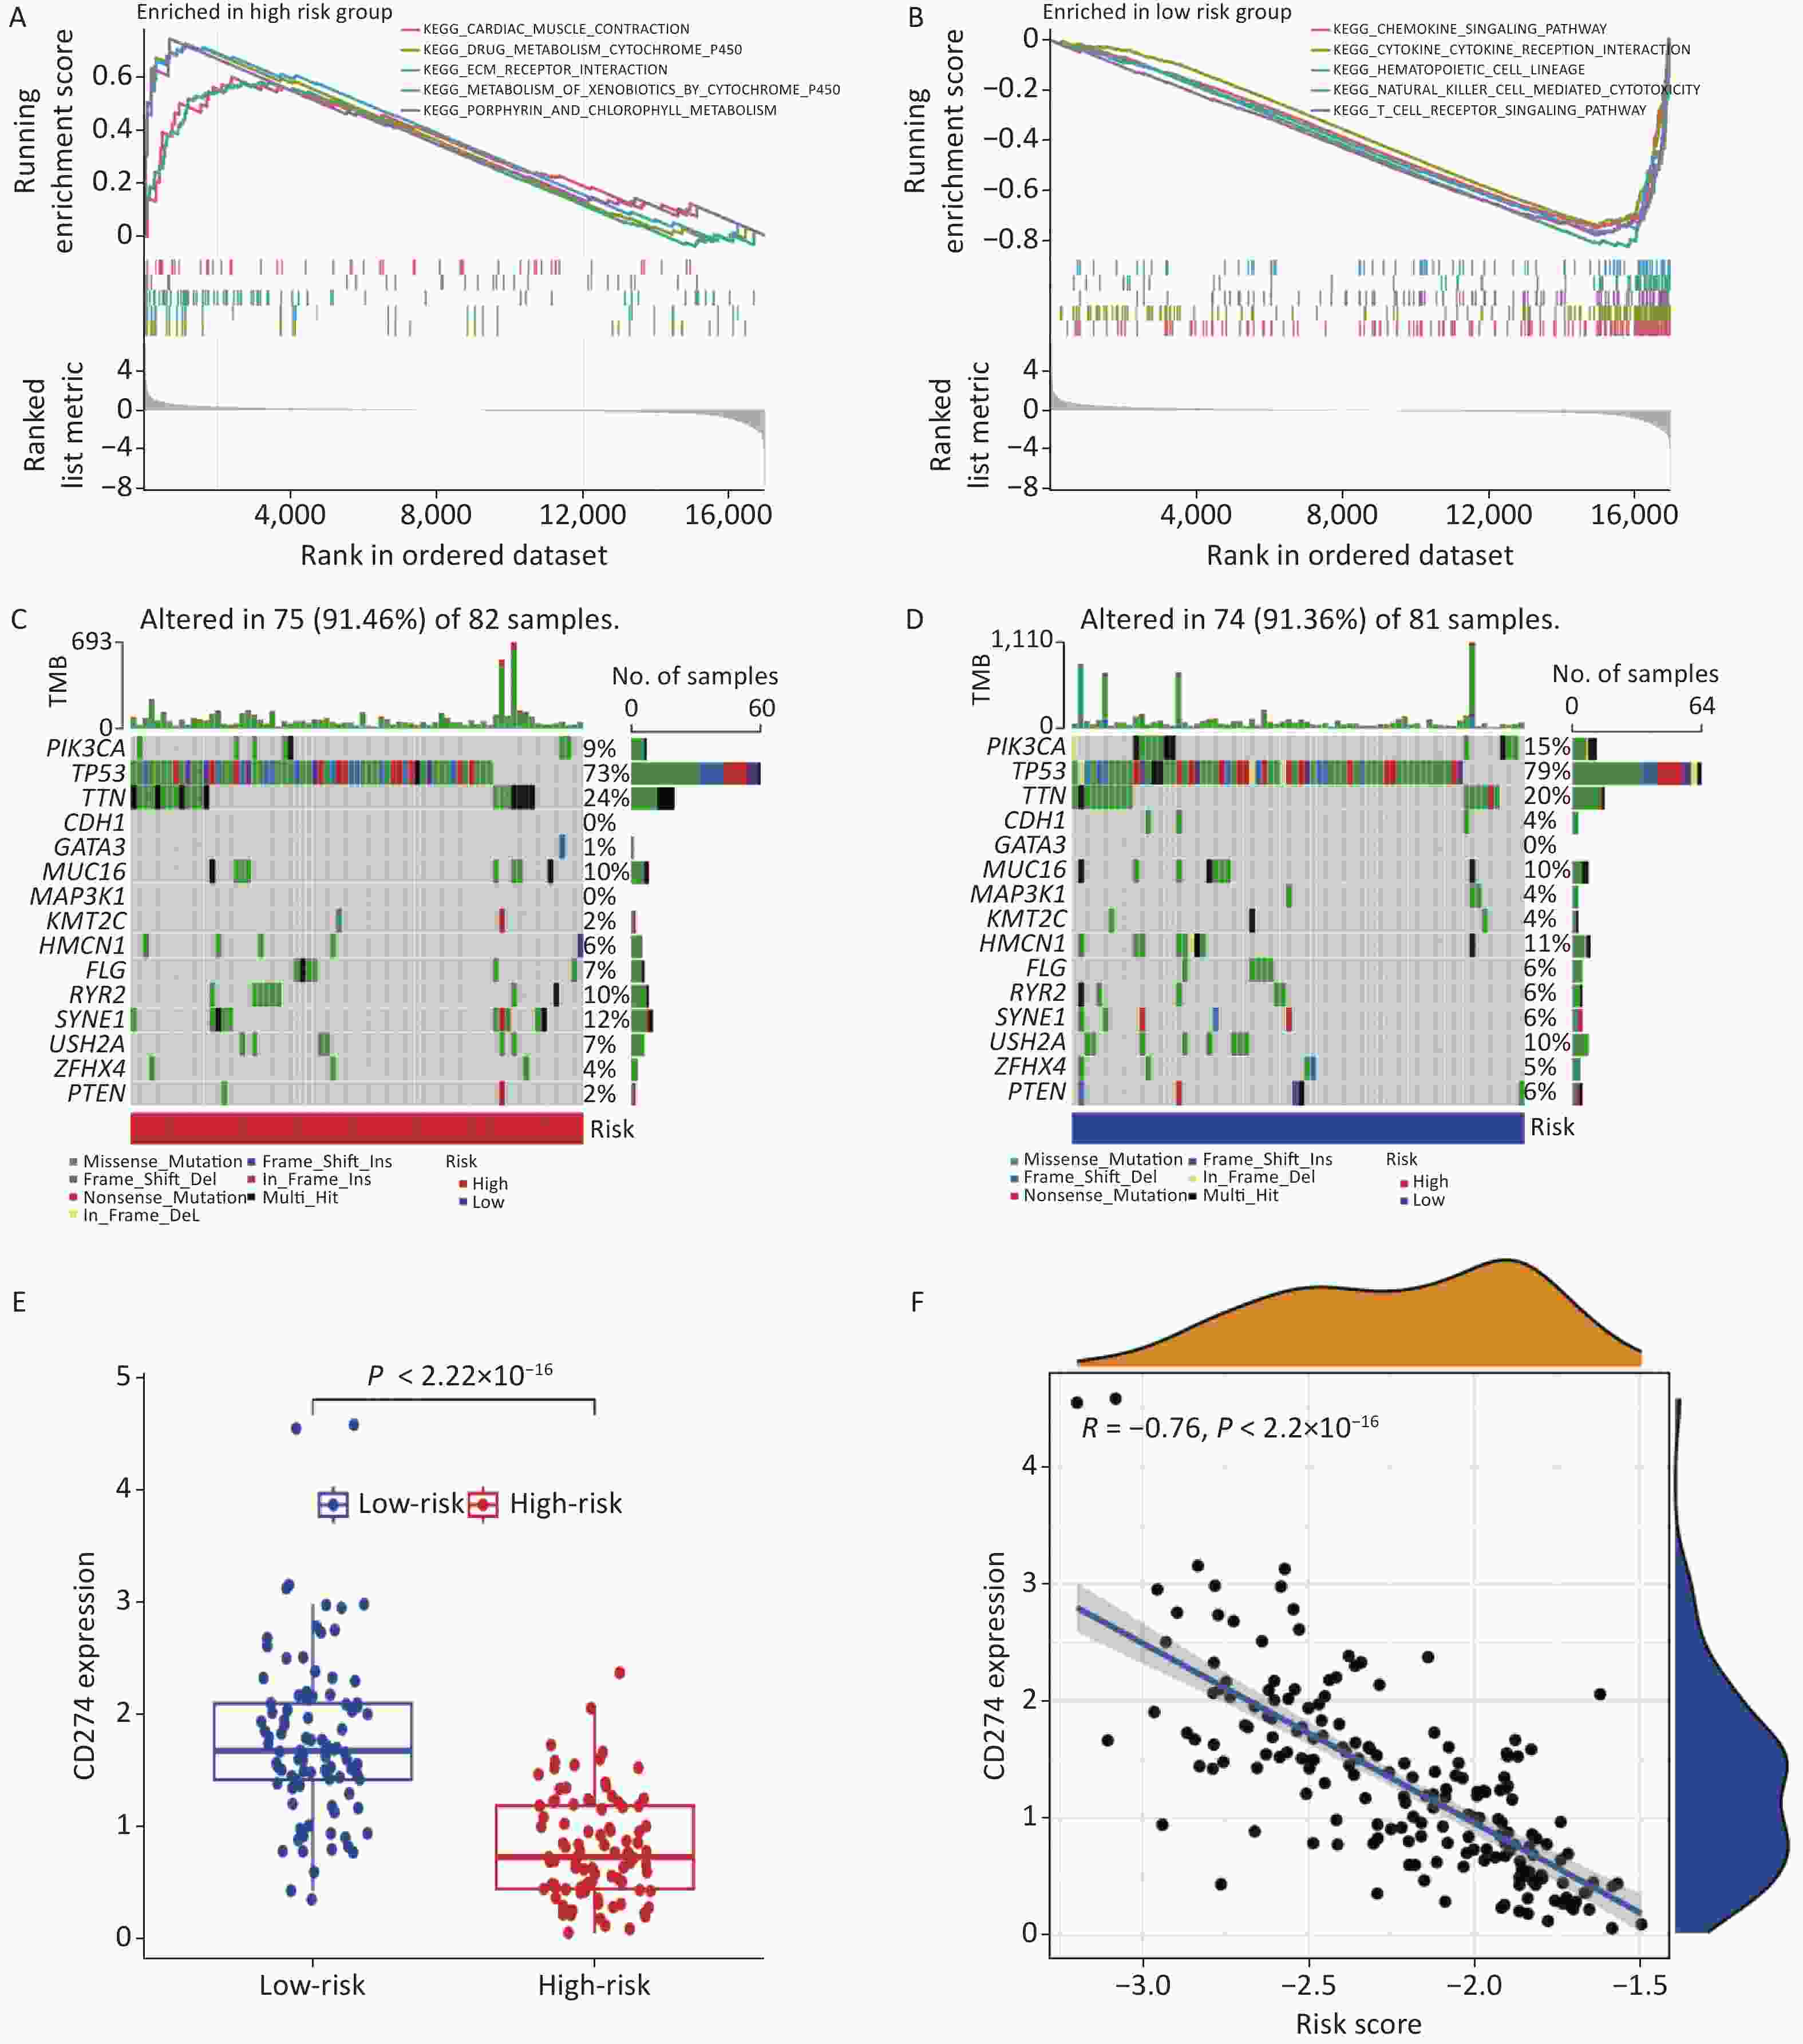
Figure 4. KEGG, mutation, and immune checkpoint analysis. (A–B) KEGG analysis in high- and low-risk groups. (C–D) Gene mutation frequency analysis in high and low risk groups. (E) Differential expression of CD274 in high and low risk groups. (F) Correlation analysis between CD274 and risk score.
Furthermore, gene mutation analysis was performed in both risk groups, identifying TP53 and TTN as the genes with the highest mutation frequencies (Figure 4C–D). Immunological checkpoint analysis revealed significant differences in CD274 expression between the high- and low-risk groups (Figure 4E), which exhibited a strong negative correlation with the risk score (Figure 4F).
-
Immune cells play crucial roles in the immune microenvironment. To gain an insight into the distribution of different immune cells in the high- and low-risk groups, we conducted immune cell infiltration (Figure 5A) and immune functional analyses (Figure 5B). Immune infiltration analysis revealed higher levels of immune infiltration by M0 and M2 cells in the high-risk group, whereas memory B cells, CD8+ T cells, M1 cells, and other cells exhibited higher expression in the low-risk group. Immune functional analysis indicated that the low-risk group exhibited higher scores for all immune pathways, which may account for the higher survival rates observed in this group.
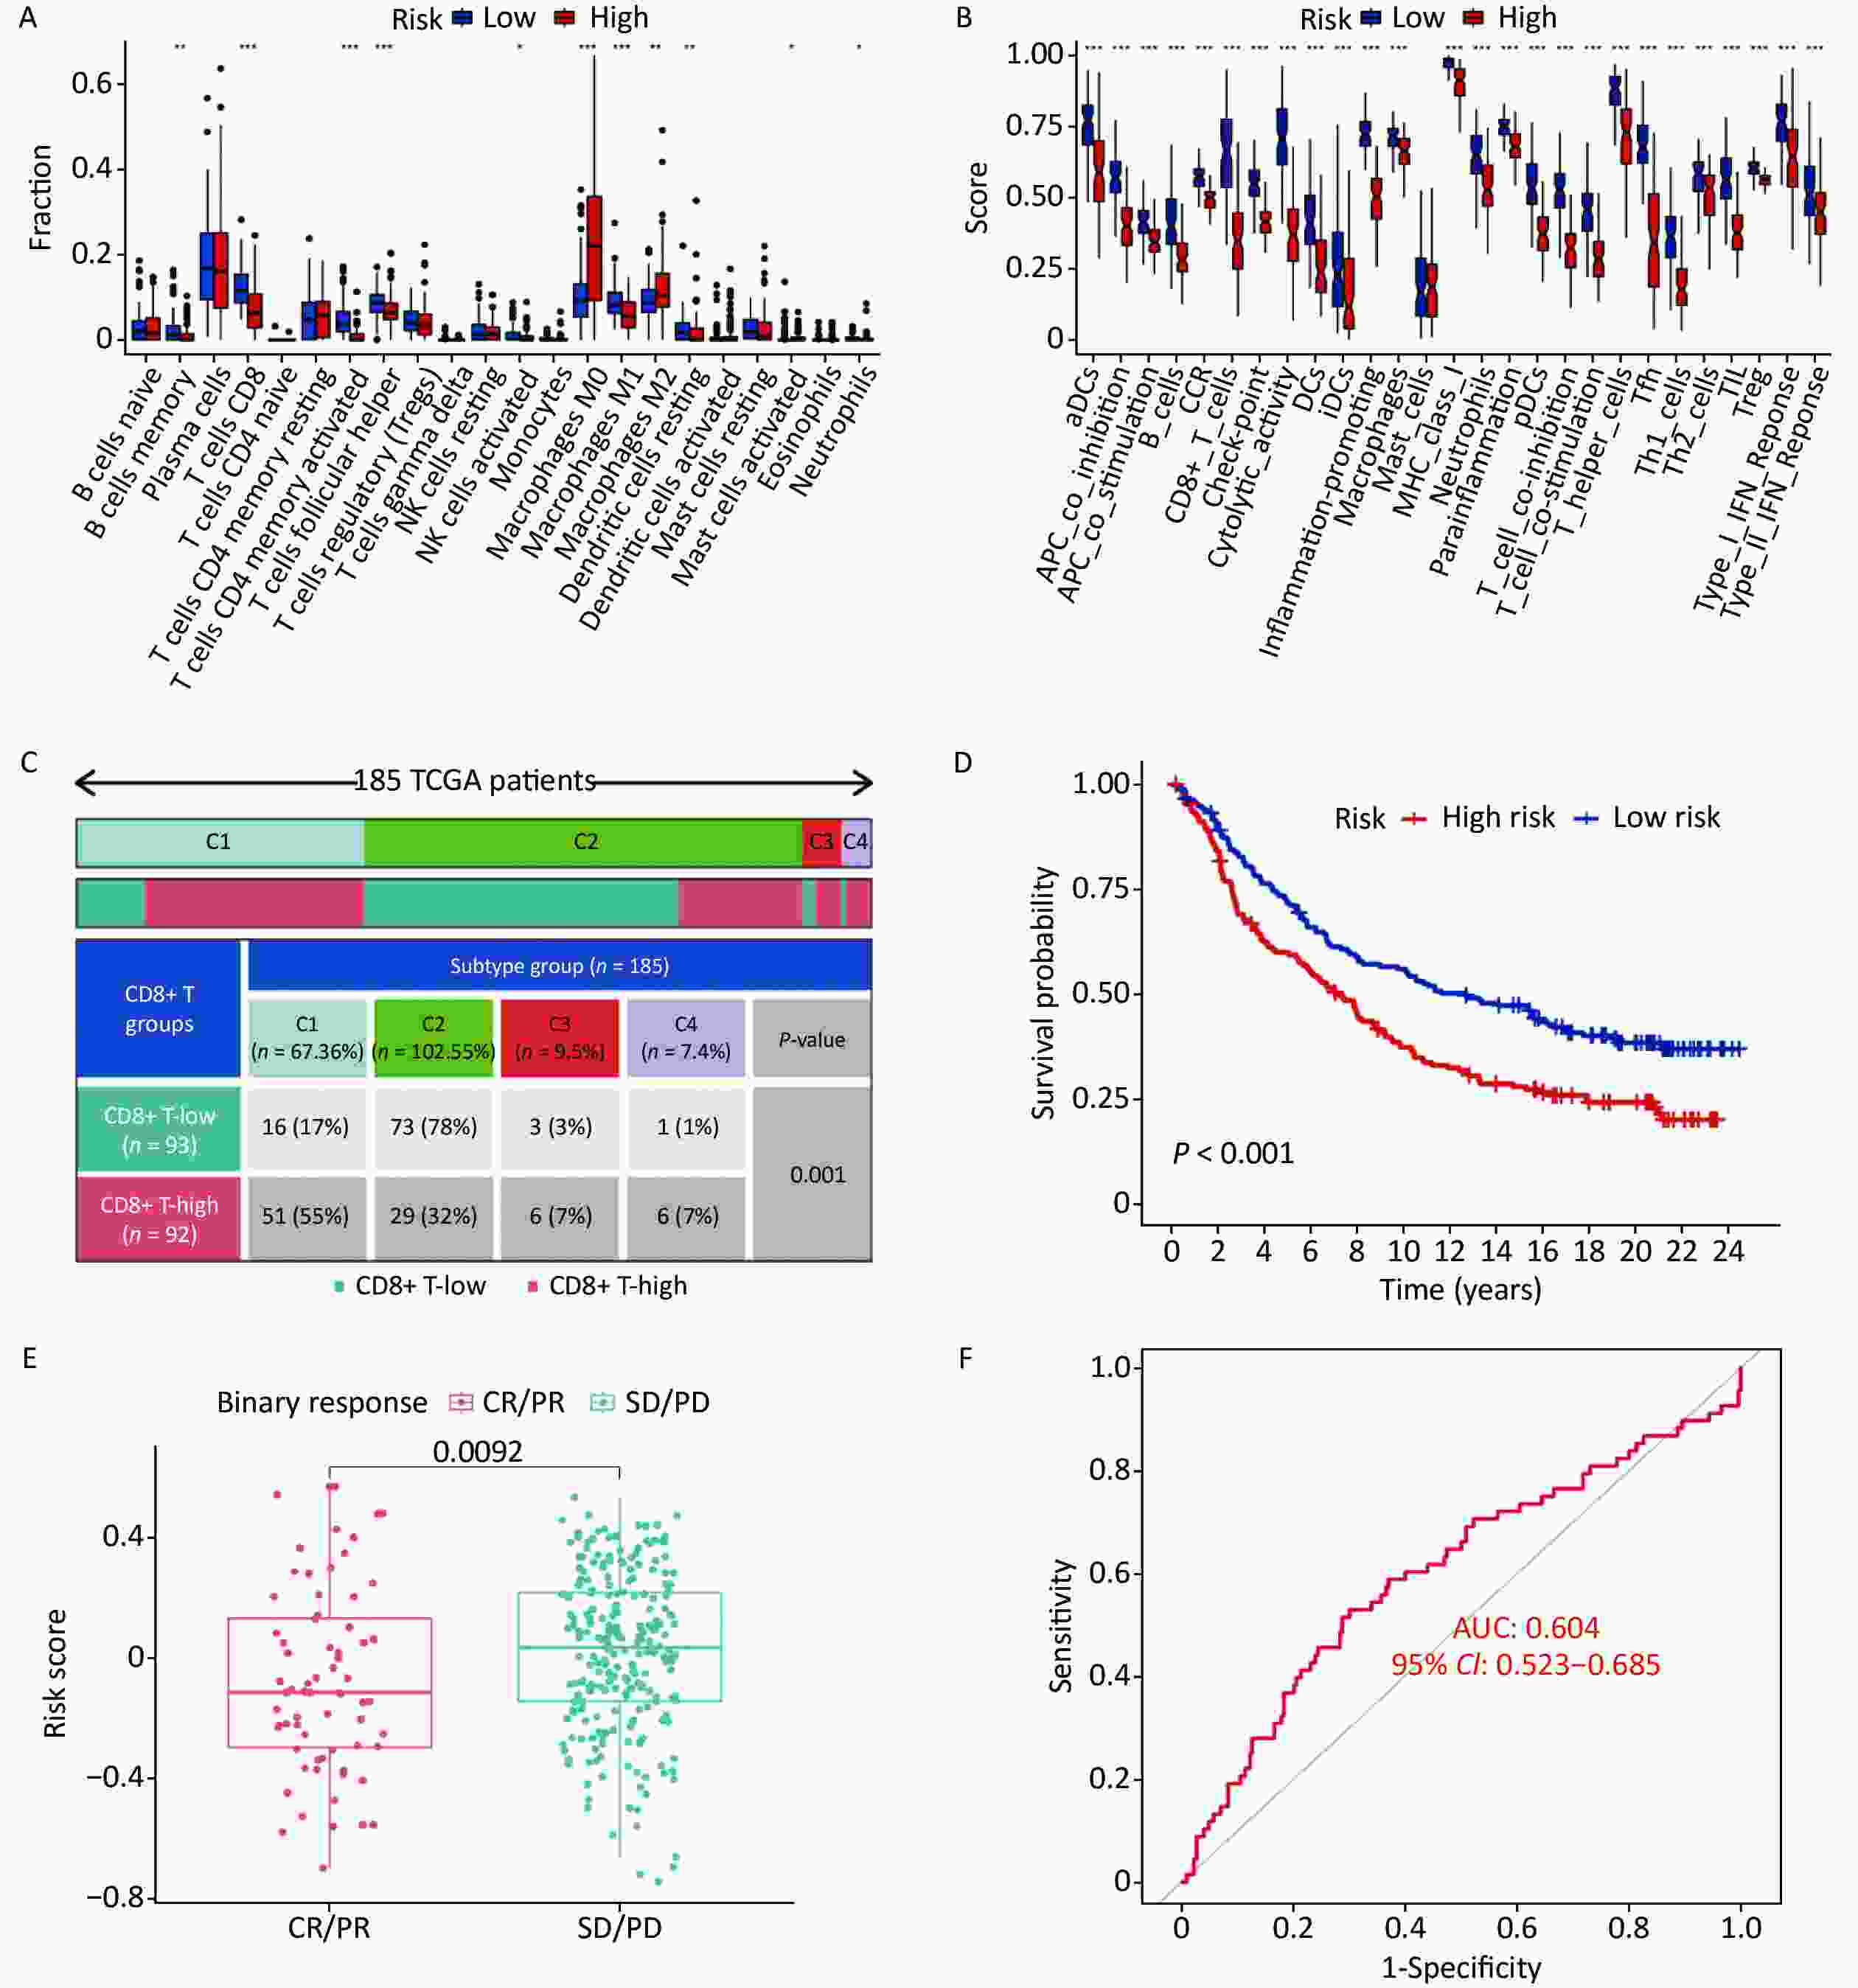
Figure 5. Immune landscape of high and low risk groups. (A) Immune infiltration analysis of high and low risk groups. (B) Immune functional analysis of high- and low-risk groups. (C) Difference of immune scores among different classifications, the expression of CD8+ T cell-related genes also showed significant differences in all subtypes. (D) Prognostic analysis of high- and low-risk groups. (E) Correlation between immune scores and immune treatment responses. (F) Area verification prediction accuracy under AUC curve.
To assess the applicability of this model across all samples, we divided the 185 TNBC samples into four subtypes based on the expression of immune genes; significant differences were observed among the four subtypes (Figure 5C). Immune subtype data were retrieved from the xenabrowser (https://xenabrowser.net/datapage). Additionally, significant differences were observed in survival status between the high- and low-risk groups (Figure 5D), further validating the reliability of this grouping.
Furthermore, to evaluate the significance of this grouping for clinical treatment, we analyzed the correlation between different immunotherapies and risk scores (Figure 5E). The results indicated differences in the immune treatment response between the two groups, with the group with lower scores displaying stronger responsiveness. The ROC curve exhibited an AUC of 0.604, indicating reliable prediction of the immunotherapeutic effect in patients through immune scoring (Figure 5F).
-
In this study, we identified differentially expressed genes associated with immunity in CD8+ T cells and constructed a PPI network. Through a meticulous screening process, we identified three genes, namely CXCL13, GBP2, and GZMB, which were used to construct a prognostic model. Using this model, we categorized the samples into high- and low-risk groups, and validated their efficacy in an independent validation group. The results demonstrated that this model exhibited a superior predictive ability for the clinical prognosis of patients.
To gain a deeper insight into the biological functional distinctions between the different risk groups, we conducted KEGG pathway and mutation analyses. Notably, we observed that groups with lower risk scores displayed greater sensitivity to immunotherapy and longer overall survival times. These findings highlight the potential of our model to guide personalized treatment decisions and improve patient outcomes.
Among the 67 intersecting genes analyzed, we identified four genes with prognostic significance, of which three were selected for further investigation. Notably, CXCL13 (Chemokine C-X-C motif ligand 13) has emerged as a prominent gene of interest[12]. It encodes a chemokine ligand that plays a crucial role in B cell recruitment and the formation of tertiary lymphatic structures by interacting with its receptor, CXCR5[13]. Studies had shown that the CXCL13/CXCR5 signaling pathway promotes BC progression and lymph node metastasis. Additionally, inhibition of CXCL13 effectively suppresses TNBC cell proliferation by promoting apoptosis[14]. Moreover, experimental evidence suggests that CXCL13 expression in the tumor microenvironment triggers long-term antitumor immunological memory in TNBC, facilitating effective antitumor immune responses through post-chemotherapy immune cell infiltration[15].
Another gene of interest was GBP2 (Guanylate Binding Protein 2). It encodes a guanine nucleotide-binding protein with antiviral activity against influenza viruses via innate immune responses. GBP2 has been investigated in various cancers, demonstrating its potential as a prognostic marker and intricate involvement in immune responses[16]. Notably, the expression of GBP2 mRNA in patients with BC was correlated with prognosis and recently established T cell characteristics, corroborating our results[17].
Granzyme B (GZMB) is an important gene. It is involved in the formation of cytolytic particles in NK cells, and plays a role in various pathological processes. GZMB expression serves as an indicator of NK cell cytotoxicity in different pathologies[18]. In the context of TNBC with an immune-responsive microenvironment, GZMB expression is associated with tumor infiltration of GZMB and CD8+ T cells, accompanied by increased expression of multiple immunosuppressive molecules, including PD-L1. The cytotoxic activity mediated by GZMB expression is closely linked to expanded T cell populations and may influence the response of patients with TNBC to immune checkpoint blockade therapy[19]. Understanding the significance of these genes in BC and their intricate involvement in immune responses provides valuable insights into their potential as prognostic markers and their impact on treatment strategies.
KEGG enrichment analysis revealed distinct functional differences between the high- and low-risk groups. Specifically, in the high-risk group, differentially expressed genes were predominantly enriched in metabolism-related pathways, including drug and chlorophyll metabolism. Cytochrome P450 (CYP) enzymes, a class of monooxygenases responsible for the metabolism of endogenous and exogenous substances including drugs and environmental compounds, play crucial roles in these pathways. It had been demonstrated that Inflammatory cytokines can modify CYP enzyme activity, potentially affecting chemotherapy exposure, treatment response, and patient survival rates in BC[20]. Another pathway that was enriched in the high-risk group was the ECM interaction pathway. The ECM is a structurally organized network of proteins and polysaccharides secreted by cells into the extracellular space. ECM1, for instance, had been shown to influence BC development and contribute to trastuzumab resistance through activation of the EGFR signaling pathway[21]. Conversely, the low-risk group exhibited enrichment of different cytokine pathways, such as chemokines and cytokines. Chemokines are small, secreted molecules that play crucial roles in cell survival, proliferation, and the guidance of migrating cells through G protein-coupled receptors. Several chemokines have been implicated in cancer occurrence and progression. For example, the CXCL12-CXCR4 axis is associated with tumor progression, angiogenesis, metastasis, and cell survival[22]. CCL3 has been linked to immune surveillance and drug resistance, and has emerged as a prognostic biomarker for various solid and hematologic malignancies[23]. Furthermore, CCR7 plays a significant role in promoting growth and metastasis of TNBC[24]. The enriched pathways identified in this analysis offer valuable insights into the functional disparities between high- and low-risk groups, shedding light on the potential mechanisms underlying their distinct prognostic outcomes.
TNBC is characterized by tumor heterogeneity and a lack of effective therapies beyond chemotherapy, making it the most challenging BC subtype. Advancements in omics technologies have allowed us to explore the intricate microenvironment of TNBC, considering it to be an ecosystem comprising both the intrinsic and extrinsic features of cancer cells[25]. The tumor microenvironment (TME) plays a crucial role in driving proliferation, angiogenesis, apoptosis inhibition, immune suppression, and drug resistance in TNBC. A comprehensive understanding of the different components within the TME can enhance clinical outcomes in patients with TNBC[26]. Histological analysis has been widely used to investigate the TNBC microenvironment[27]. In this study, we aimed to unravel the immune landscapes of high- and low-risk groups by conducting immune infiltration and immune functional analyses. M1 macrophages are generally considered antitumor, while M2 polarized macrophages are associated with promoting tumor growth and metastasis by regulating processes such as angiogenesis, immune suppression, hypoxia induction, and tumor cell proliferation[28]. The proportions of M1 and M2 macrophages were significantly higher in the high-risk group than those in the low-risk group. Tumor-associated macrophages (TAMs) in TNBC promote tumor growth and progression through various mechanisms, including the secretion of inhibitory cytokines, suppression of TIL effector function, and promotion of regulatory T cells (Tregs). TAMs had been shown to directly and indirectly regulate the expression of the immune checkpoint molecules PD-1/PD-L1 in the tumor microenvironment[29]. Notably, M0 cells exhibited the opposite trend, suggesting the presence of specific proteins or genes in the high-risk group that may promote macrophage polarization. Further experimental validation is required to confirm this hypothesis. In the high-risk group, the infiltration of various immune cells was relatively low, which may have contributed to higher mortality rates. Altered immune cell composition within the TME may contribute to immune evasion and diminished antitumor responses, thereby exacerbating the aggressive behavior of TNBC.
The approval of PD-1 blockade as a first-line treatment for stage II/III TNBC and metastatic TNBC patients with PD-L1 expression has provided significant advancement in treatment[30]. However, challenges remain, such as identifying predictive biomarkers to select patients who would benefit from PD-1 blockade, and achieving a balance between efficacy and long-term toxicity in individual patients. In this study, we investigated the relationship between CD274 (PD-L1) expression, and the risk scores derived from our prognostic model. We observed a significant negative correlation between CD274 expression and the risk score. CD274 is an immune checkpoint ligand that inhibits antitumor immune responses by interacting with the PDCD1 receptor on T lymphocytes in various tumor types[31]. TNBCs are generally considered to have low immunoreactivity. However, tumors expressing PD-L1 often show a higher response to immune checkpoint blockade. The elevated presence of PD-L1 in tumors has been associated with poor prognosis[32], which aligns with the findings of our analysis. Furthermore, in the correlation analysis of immunotherapy response, we identified significant differences in risk scores between the complete response and partial response groups as well as between the stable disease and progressive disease groups (P < 0.01). These results indicate substantial differences in immunotherapy responses among the different risk groups identified by our model. Taken together, our findings highlight the potential of our risk score model in predicting immunotherapy response and provide insights into the complex interplay between immune checkpoints, tumor immune microenvironment, and TNBC prognosis.
The prognostic risk model developed by us demonstrated its ability to effectively distinguish between high- and low-risk groups in terms of TNBC prognosis and predict patient response to immunotherapy. Our findings highlight the significance of CXCL13+ CD8+ T cells, which exhibit increased depletion labeling, reduced effector molecule expression, and enhanced proliferation capacity. The abundance of CXCL13+ CD8+ T cells negatively affects the overall immune function of CD8+ T cells and is associated with immune evasion environment[33]. Additionally, in gastric cancer, CXCL13+ CD8+ T cell infiltration has been linked to lower overall survival rates and a reduced response to chemotherapy. These cells are associated with an immunosuppressive environment characterized by Treg cell proliferation and dysfunctional cytotoxic T lymphocytes (CTLs). They may serve as independent prognostic and predictive markers in patients[34]. Although there are currently no specific data indicating the role of CXCL13 in TNBC, based on the aforementioned analyses, we hypothesized that CXCL13 may be a crucial factor influencing immunotherapy outcomes in TNBC. Further research is warranted to explore the potential impact of CXCL13 on TNBC immunotherapy and to elucidate the underlying mechanisms. Although the advancement of immune checkpoint blockers is an important achievement in TNBC treatment, the scope of PD-L1 overexpression in tumors remains limited. Therefore, there is an urgent need to develop immunotherapies targeting specific subtypes of breast tumors to achieve better therapeutic effects. We believe that analysis based on CD8+ T cell-related genes can provide assistance in finding specific therapeutic targets, which is also the significance of this article. In summary, this study has introduced several innovative aspects, including the development of a prognostic model, prediction of immunotherapy response, in-depth analysis of immune mechanisms, identification of potential targeted therapies, and exploration of the complexity of TNBC. These findings provide valuable insights into BC research and treatment.
It is important to acknowledge the limitations of this study. First, the data used in our study were obtained from public databases; although we employed various databases to augment our dataset, the sample size and available clinical information remained relatively limited for TNBC. Increasing the sample size and obtaining more comprehensive clinical information will strengthen the robustness of our findings. Second, although we validated our prognostic model using different methods and demonstrated its accuracy, further experimental validation under both in vitro and in vivo settings is required. Conducting experiments to validate the functional relevance of the identified genes and their effect on TNBC immunotherapy responses will enhance the translational significance of our findings. Finally, the precise mechanisms by which CD8+ T-cell-related immune genes influence the response of TNBC to immunotherapy remain largely unknown. Investigating these underlying mechanisms should be the focus of future research as it would provide valuable insights into the molecular pathways and signaling networks involved in the TNBC immunotherapy response. Addressing these limitations and conducting further studies will advance our understanding of TNBC prognosis and immunotherapy, ultimately leading to improved clinical outcomes.
-
In this study, we focused on identifying immune-related CD8+ T cell genes in TNBC samples and constructed a prognostic model based on CD8+ T cell-related immune genes. The model successfully classified the samples into high- and low-risk groups, demonstrating its effectiveness in predicting the prognosis. It is important to note that our findings require further validation, both in vitro and in vivo, to confirm the functional relevance of the identified genes and their potential impact on TNBC immunotherapy responses.
HTML
Obtaining Information on Triple-negative Breast Cancer Patients
Identification of Immune-Related CD8+ T Genes
Construction of PPI Network and Identification of Core Genes
Construction and Validation of Prognostic Models
Functional Enrichment Analysis and Mutation Analysis
Identification of CD8+ T Cell-Related Immune Genes
Construction of Protein-Protein Interaction (PPI) Network and Identification of Core Genes
Construction and Validation of Prognostic Models
KEGG Pathway, Mutation, and Immunological Checkpoint Analysis
Immune Landscape of High and Low Risk Groups
CONFLICT OF INTEREST The authors declare that this study was conducted in the absence of any commercial or financial relationships that could be construed as potential conflicts of interest.
&These authors contributed equally to this work.

 Quick Links
 DownLoad: