


-
Gastric cancer is the fifth most prevalent malignant neoplasm worldwide[1]. Over a million cases of gastric cancer are diagnosed annually, making it a global health concern[2]. In addition, gastric cancer is the third most common cause of cancer-related deaths, largely because it is typically diagnosed at an advanced stage[3]. The majority of newly reported cases of gastric cancer may be related to infection with various pathogens, such as Helicobacter pylori and Epstein Barr virus. In addition, factors such as smoking and family history may affect the development of gastric cancer[4,5]. Gastric cancer is diagnosed through endoscopic biopsy and pathological examination and staged based on the results of computed tomography, positron emission tomography, endoscopic ultrasound, and laparoscopy. Endoscopic resection is the primary treatment for early-stage gastric cancer, whereas surgery is indicated for non-early-stage gastric cancer amenable to surgical intervention[3]. The symptoms of gastric cancer are often inconspicuous during the early stages and tend to manifest predominantly in the advanced stage, resulting in a poor prognosis[6]. Therefore, there is an urgent need for new predictive markers to improve the prognosis of patients with gastric cancer.
Lysosomes are single-membrane cell organelles that primarily function during endocytosis/phagocytosis for the degradation of extracellular substances[7]. Lysosomes are crucial components of the cell membrane system and participate in various cellular processes, including antigen presentation, intracellular pathogen destruction, cell migration, intracellular transport, and apoptotic processes[8]. Previous studies have demonstrated the potential involvement of lysosomes in the onset and progression of cancer[9,10]. Lysosome-dependent cell death (LDCD) is the most common cell death pathway mediated by lysosomes. LDCD is classified as a form of programmed cell death characterized by lysosomal destabilization and subsequent lysosomal membrane permeabilization (LMP), leading to the release of lysosomal contents into the cytoplasm[11-13]. Several substances, including dibenzyl trisulfide, glucosylsphingosine, and naringin, have been implicated in LMP[13-15]. Jonathan et al. reported that dibenzyl trisulfide induces LMP of triple-negative breast cancer cells[14]. Kamilla et al. observed that galactosylsphingosine and glucosylsphingosine induce LMP in human breast cancer cells (MCF7) and primary fibroblasts[15]. Additionally, naringin has been reported to induce LMP and cell death in gastric cancer cells[13]. However, the underlying mechanisms of LDCD in gastric cancer remain unclear.
The tumor microenvironment (TME) includes a diverse array of immune cells, endothelial cells, pericytes, cancer-associated fibroblasts, and other cell types[16,17]. Initially, these cells were viewed as bystanders in tumor development. However, an increasing body of research has demonstrated that cells in the TME and their secreted molecules play pivotal roles in the pathogenesis of cancer, making them appealing targets for therapeutic interventions[18-21]. In addition, previous studies have shown that the TME plays a key regulatory role in the progression of gastric cancer[22,23]. In the TME, lysosomes are implicated in the mediation of various malignant phenotypes such as tumor initiation, invasion, drug resistance, radiotherapy resistance, as well as the modulatory behaviors of tumor-associated fibroblasts, macrophages, T cells, and dendritic cells[24]. Notably, most previous studies on LDCD and gastric cancer were focused on the effects of only one or two LDCD genes on gastric cancer. However, the pro-tumor effects of LDCD may be the results of interactions between many genes. Therefore, a comprehensive analysis of the expression patterns of multiple genes associated with LDCD in gastric cancer will not only enhance our knowledge of the biological mechanisms underlying the development of gastric cancer but also facilitate better prediction of the efficacy of immunotherapy.
Therefore, the objective of this study was to identify prognostic genes associated with LDCD in patients with gastric cancer using biological analytical techniques. In addition, we aimed to conduct single-cell and transcriptome sequencing analyses to further determine the effects of the LDCD genes on gastric cancer and propose new therapeutic strategies based on our findings.
-
A dataset containing the RNA-sequencing data and clinical information of patients with gastric cancer (The Cancer Genome Atlas - Stomach Adenocarcinoma [TCGA-STAD]), which served as the training set, was acquired from UCSC Xena database (https://xenabrowser.net/datapages). Additionally, the GSE15459 and GSE183904 datasets were acquired from the Gene Expression Omnibus database (https://www.ncbi.nlm.gov/geo/) and used for analysis. The validation set consisted of 192 gastric cancer tissue samples from GSE15459. In addition, single-cell RNA sequencing data from 31 gastric cancer samples were obtained from GSE183904. Furthermore, 220 lysosome-dependent cell death genes (LDCDGs) previously identified in an earlier study were included in the analysis[25].
-
Differentially expressed genes (DEGs) between the gastric cancer and normal samples in TCGA-STAD were identified using the DESeq2 package (v1.36.0) based on the following criteria: |log2FC|> 1 and adj. P < 0.05. The ggplot2 package (v3.3.6) was used to generate a volcano plot and heat map for the visualization of the DEGs. Additionally, the Gene Set Variation Analysis (GSVA) package (v1.44.2) was used to calculate the sample scores based on 220 literature-derived curated differential gene sets used as the background gene set in TCGA-STAD.
-
The most pertinent modules associated with the LDCDG score were identified through weighted correlation network analysis (WGCNA) of TCGA-STAD using the WGCNA package (v1.71) and designated as key module. First, sample clustering was performed to eliminate outliers. Subsequently, the soft threshold (β) was determined, and the co-expression matrix was established. Gene modules were identified and assigned distinct colors. Candidate genes were identified by overlapping the DEGs with key module genes. Gene ontology (GO) and Kyoto Encyclopedia of Genes and Genomes (KEGG) enrichment analyses were conducted using the ClusterProfiler package (v4.4.4).
-
Univariate Cox regression analysis was performed using the survminer package (v0.4.9) to identify survival-related genes among the candidate genes. Subsequently, the signature genes were identified through least absolute shrinkage and selection operator (LASSO) regression, which was performed using the glmnet package (v4.1-4). Finally, multivariate Cox regression analysis of the signature genes was performed to screen for the prognostic genes and construct the risk model. The formula used for calculating the risk score was as follows:
$$ Risk score= {\sum }_{\text{n=1}}^{\text{n}}\text{(coefi} \times {\mathrm{Xi}}) $$ (1) The risk score for each TCGA-STAD sample was calculated using this formula, and patients were stratified into high-risk and low-risk groups based on their median scores. Receiver operating characteristic (ROC) curves were plotted to assess the predictive performance of the risk model at 1, 3, 5, and 10 years. Kaplan–Meier survival analysis was conducted to compare the prognoses of the two risk groups. The ROC curves were generated using the Survival ROC software package (v1.0.3.1), whereas the Kaplan–Meier curves were plotted using the Survival software package (v3.5-3). Validation of the risk model was performed using GSE15459.
-
Survival and risk scores were compared between groups classified according to different clinical characteristics, including sex, age, M stage, N stage, T stage, and disease stage. We integrated these clinical features and risk scores into an independent prognostic analysis to assess the performance of the risk model as an independent prognostic tool. Univariate and multivariate cox regression analyses were performed to identify independent prognostic factors, and an alignment chart was constructed based on the independent prognostic factors identified in the analyses.
-
The background gene set in KEGG was assessed using the Molecular Signatures Database (MSigDB, https://www.gsea-msigdb.org/gsea/msigdb) to identify the differences in biological pathways among different groups. Thereafter, the limma package (v3.54.0) was used for differential analysis of the KEGG pathways identified in the two groups based on false discovery rate (FDR) < 0.05 and |log2FC|> 0.1. Finally, the relationships between risk score and the significant pathways were analyzed.
-
The CIBERSORT algorithm was used to calculate the abundance of 22 immune cells in the high- and low-risk groups to determine the differences in immune cell abundance between the two risk groups. The Wilcoxon test was used to determine whether there were differences in immune cell content across different groups. In addition, the ssGSEA algorithm was applied to analyze the differences in 28 immune cell scores among different groups. Furthermore, the matrix, immune, and ESTIMATE scores for each gastric cancer sample were calculated using the ESTIMATE package (v1.0.13), and Wilcoxon test was used to compare the differences in each score between the high- and low-risk groups. The sensitivities of different groups to immune checkpoints and immunotherapy were analyzed and their effects on the prognosis of gastric cancer was assessed.
-
Tumor mutation burden (TMB) represents the quantity of mutations that occur in a cancer cell. We conducted an analysis and visualization of the somatic mutation profiles of 342 patients with gastric cancer obtained from the TCGA database and the maftools R package (v2.12.0) to assess variations in TMB across different groups. Furthermore, the Wilcoxon test was used to analyze the difference in TMB among different groups, and Spearman correlation analysis was performed to evaluate the relationship between TMB and risk score. Data on 138 chemotherapeutic agents were obtained from the Genomics of Drug Sensitivity in Cancer database (https://www.cancerrxgene.org/), and the pRRophetic package (v0.5) was used to calculate the half maximal inhibitory concentration (IC50) of the agents. The Wilcoxon test was used to compare the IC50s of the chemotherapeutic agents between the two risk groups.
-
The Seurat package (v4.1.1) was used for data quality control and filtering to ensure retention of the data from GSE183904. The criteria used for filtering the cells were a minimum of three cells expressing each gene and at least 200 genes expressed in each cell. The mitochondrial percentage was calculated using the PercentageFeatureSet function to ensure that 200–10,000 genes were expressed per cell (nFeature), and that the mitochondrial content was less than 20% (percent.mito). Normalization was performed using the NormalizeData and FindVariableFeatures functions combined with the “vst” method to filter the top 2,000 highly mutated genes (parameter “vst”, nfeatures = 2,000) for feature selection to allow for subsequent identification of cell types. Eventually, the data were scaled using the ScaleData function in Seurat. Principal component analysis was conducted using the JackStrawPlot and ScoreJackStraw functions to reduce dimension. The percentage of information (percentage of variance) represented by each principal component was ranked, and the top 20 principal components were selected for subsequent analysis. Cell clustering was performed using UMAP (resolution = 1.2), whereas the SingleR package (v2.0.0) was used for annotation of cell types.
Cells that exhibited significant differences between groups were identified as critical cells at the single-cell level. 'H.A.v2022.1.hs.Symbols.gmt' was used as the background gene set to explore variations in enrichment pathways among different cell types in the tumor and control groups. The GSVA package (v1.44.2) was used to calculate GSVA scores for the hallmark and KEGG pathways, enabling the analysis of differences in pathways between the tumor and control groups. Cell communication analysis was conducted using the CellChat package (v1.6.1) to investigate interactions among critical cells. Additionally, the Monocle package (v2.26.0) was used to examine the cell differentiation trajectories of key cell clusters.
-
The GES-1, AGS, and MKN74 cell lines were purchased from Procell Life Science & Technology Co., Ltd. All cell lines were maintained in RPMI-1640 or F12K medium supplemented with 10% fetal bovine serum. The cells were cultured at 37 °C with 5% CO2.
-
OBiO Technology Corp., Ltd (Shanghai, China) provided the C19orf59 small interfering RNAs (siRNA-C19orf59) and non-target small interfering RNA (siRNA-NT) used in this study. The siRNA-C19orf59 and siRNA-NT were transfected into MKN74 cells using Lipofectamine 3000 transfection reagent (Vazyme, Nanjing, China) according to the manufacturer’s instructions. The sequence of siC19orf59 was 5’- CCUUCAUCAUGG UGAAGAATT-3’.
-
Total RNA was extracted from the GES-1, AGS, and MKN74 cells according to the manufacturer’s instructions. The primers used for the quantitative polymerase chain reaction (qPCR) assay of C19orf59 and GAPDH were synthesized by Sangon Biotech (Shanghai, China). Reverse transcription reaction was conducted following the guidelines provided by Vazyme Biotech Co., Ltd (Nanjing, China). Subsequently, cDNA obtained from the reverse transcription reaction served as a template for fluorescence quantitative PCR, which was performed using a SYBR Green kit from Vazyme Biotech Co., Ltd (Nanjing, China). The expression levels of mRNA were determined using quantitative real-time polymerase chain reaction (qRT-PCR) performed according to the manufacturer’s protocol. Target mRNA levels were calculated using the CT method. The primer sequences are listed in Supplementary Table S1.
-
The MKN74 cells were seeded into 96-well plates after transfecting them with siRNA-C19orf59 and siRNA-NC for 24 h. Subsequently, the cells were treated using the CCK8 reagent (Beyotime, Shanghai, China) according to the manufacturer’s instructions. The OD450 values of the MKN74 cells were measured after 24, 48, and 72 h using a microplate reader.
-
Cell migration was assessed using the wound healing assay. The MKN74 cells were seeded into six-well plates and transfected with siRNA-C19orf59 and siRNA-NC. Subsequently, an artificial “wound” was created using a yellow plastic pipette tip. Images were captured at 0 and 48 h.
-
The statistical analyses performed in this study were conducted using R software (v4.2.2). Differences between groups were analyzed using the Wilcoxon test and t-test. Statistical significance was set at P < 0.05. In the GSEA, the criteria for judgment were |NES| > 1 and P.adjust < 0.05.
-
We performed WGCNA to construct gene networks for the identification of significant gene modules and the key module genes associated with LDCDGs score. The selected optimal soft threshold was 6, and 12 modules were defined in TCGA-STAD based on this threshold (Figures 1A, B). Among the identified modules, the purple module (cor = 0.7, P = 2 × 10-61) showed the highest correlation with LDCDGs score and was designated as the key module. The purple module encompassed 505 genes (Figure 1C).

Figure 1. Identification and enrichment analysis of candidate genes. (A) Scale independence and mean connectivity in TCGA-STAD. (B) Cluster dendrogram of co-expressed genes in TCGA-STAD. (C) Heatmap of module–trait correlation in gastric cancer. (D) Volcano map showing DEGs in TCGA-STAD. (E) The intersection of the key module genes and DEGs in TCGA-STAD. (F) Circular plots showing the result of the enrichment analysis of candidate genes.
A total of 4,465 DEGs were filtered between the gastric cancer and normal samples (Figure 1D). After intersecting the DEGs with the key module genes, we obtained a list of 95 candidate genes for further analysis (Figure 1E). GO analysis revealed significant enrichment of these candidate genes in macrophage activation and regulation of phagocytosis, whereas KEGG pathway analysis indicated their association with lysosome function and their involvement in the B cell receptor signaling pathway (Figure 1F).
-
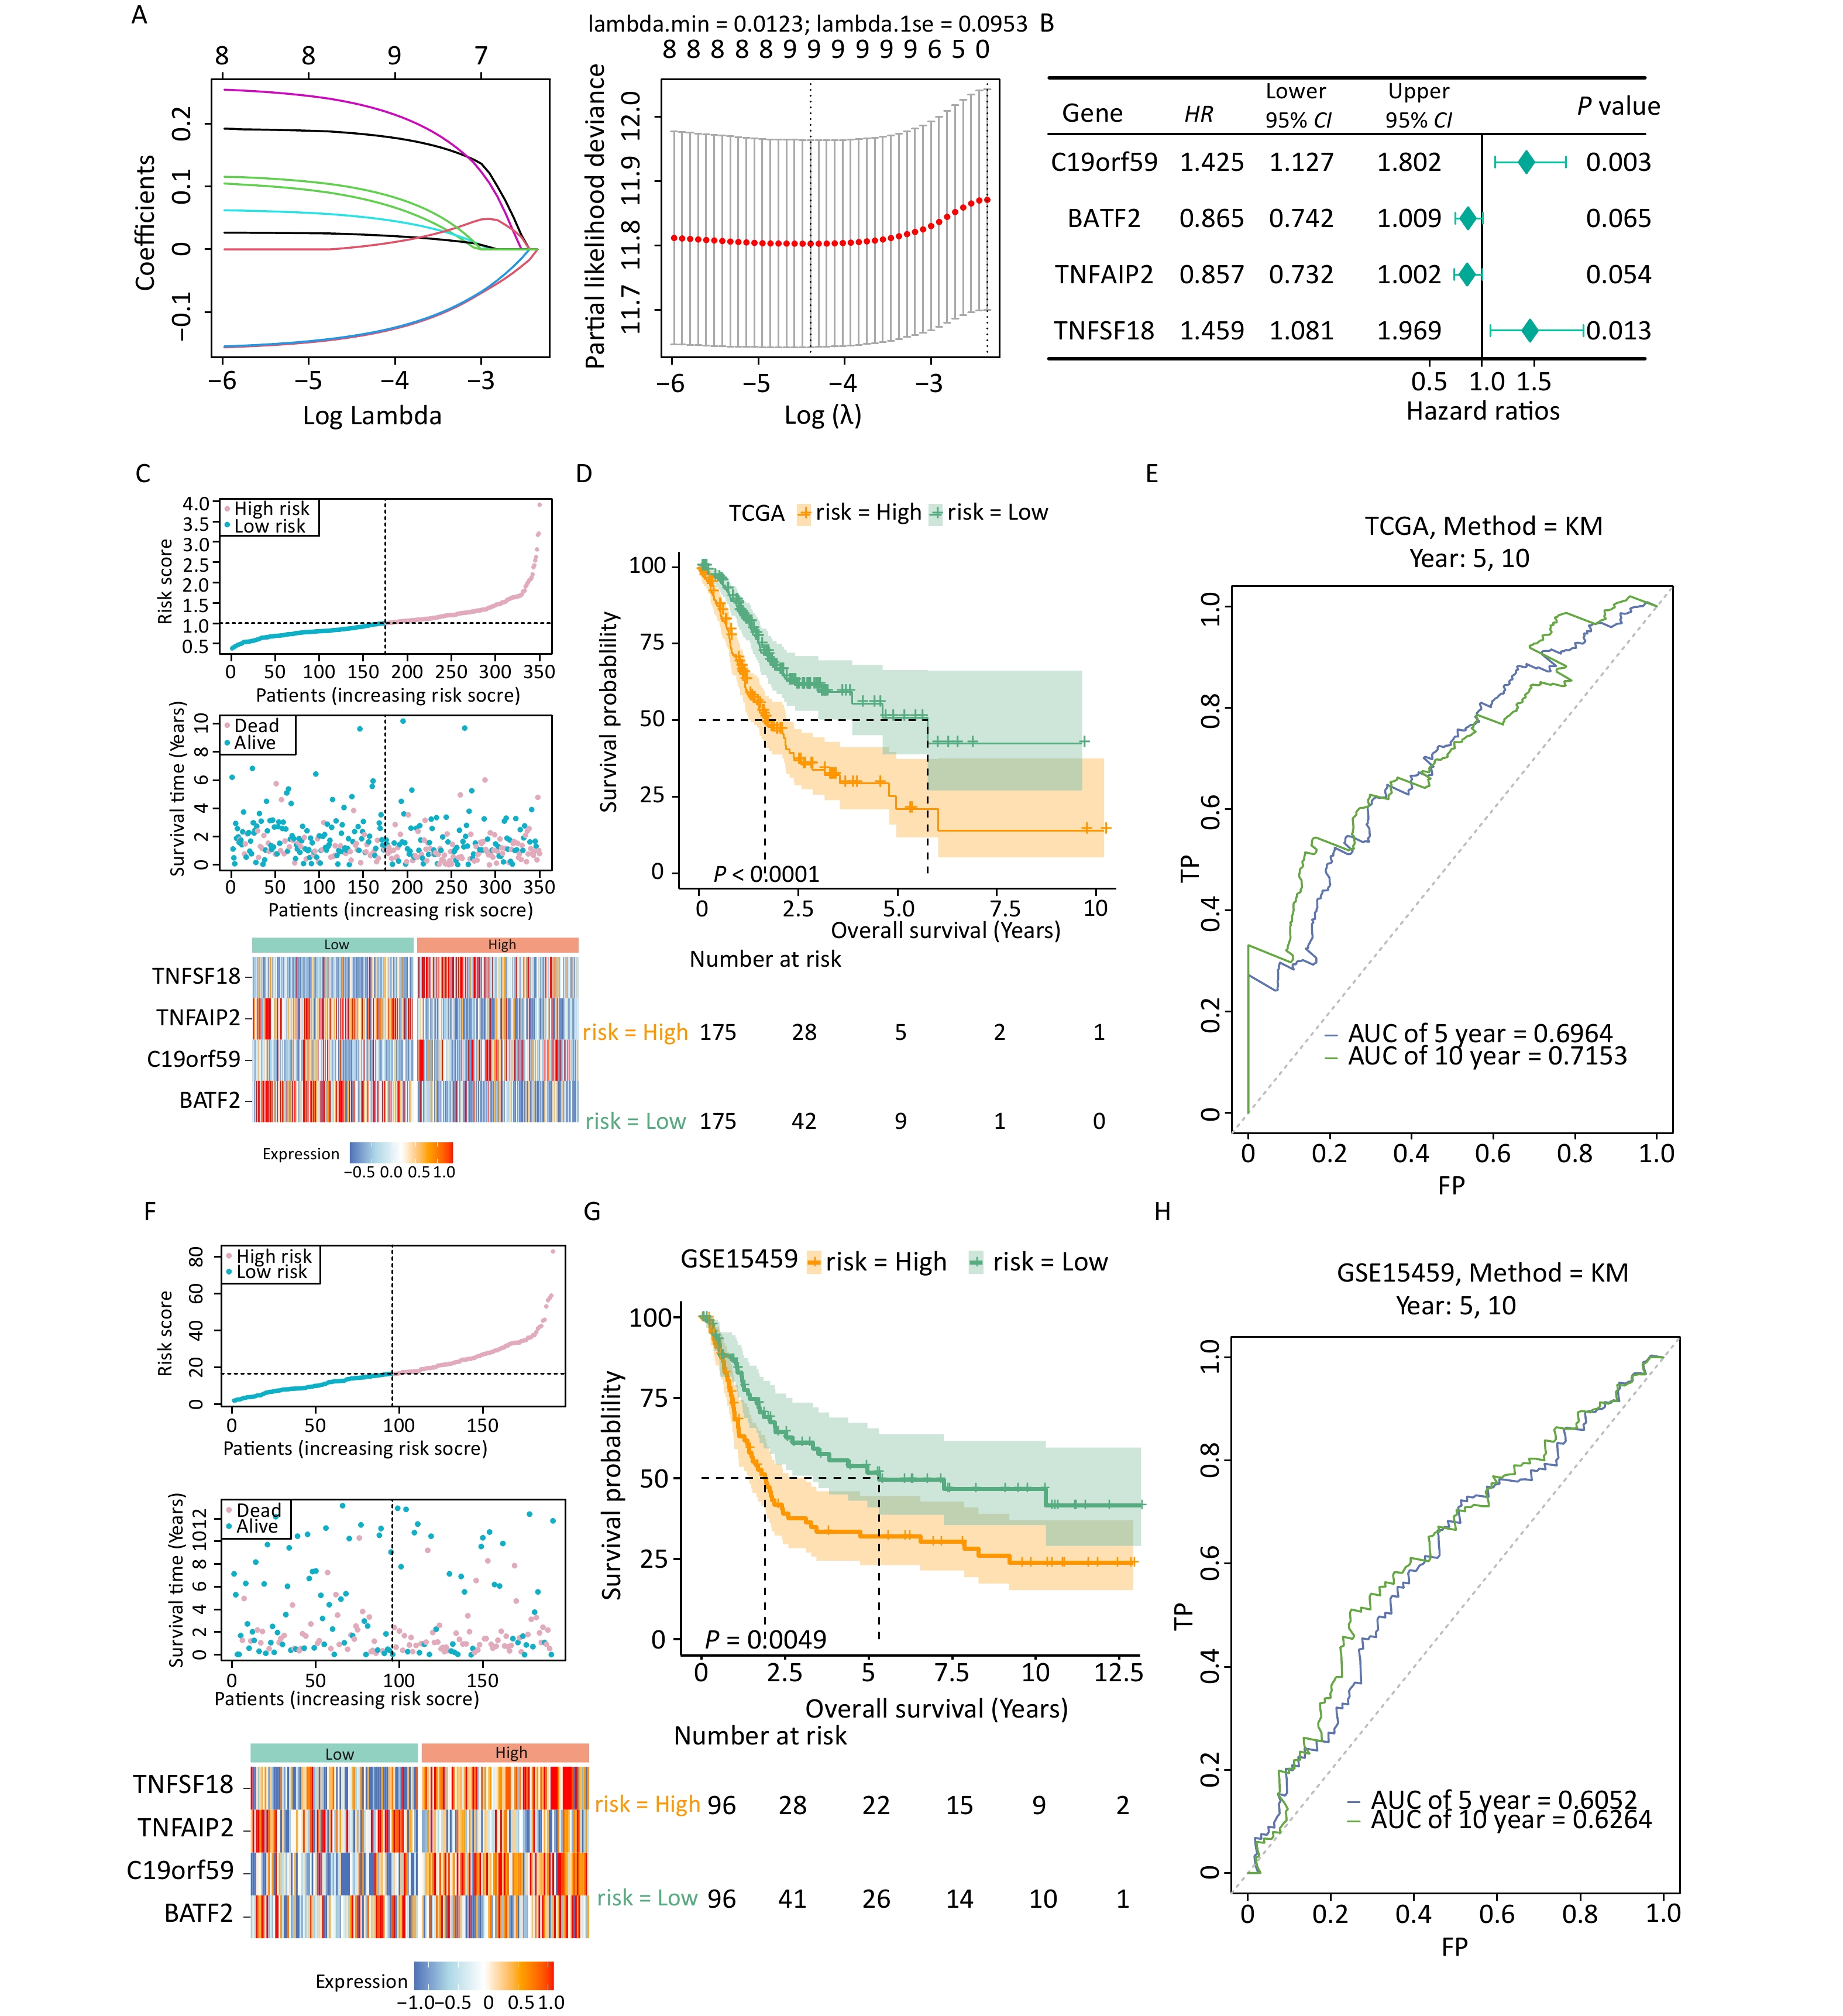
Univariate Cox regression analysis was performed to assess the effects of the 95 candidate genes on the survival rate of patients with gastric cancer. The analysis identified nine genes significantly associated with the survival of patients with gastric cancer (Supplementary Table S2). The identified genes were subjected to LASSO regression analysis, and the results indicated that all 9 genes passed the screening (Figure 2A). Finally, four prognostic genes including C19orf59, BATF2, TNFAIP2, and TNFSF18 were selected through multivariate Cox analysis and used for the construction of a risk model (Figure 2B).

Figure 2. Establishment and validation of the prognostic model. (A) Filtering variables using LASSO regression. (B) Forest map of the multivariate survival analysis. (C) Distribution of patients according to risk group and survival status. The heatmap of the expression of four signature genes in the low- and high-risk groups in the TCGA-STAD dataset is presented from top to bottom. (D) K-M survival curves of patients in the high- and low-risk groups in the TCGA-STAD dataset. (E) Validation of the ROC curves of the 5-year and 10-year of prognostic values of the gene signature in the TCGA-STAD dataset. (F) Distribution of patients according to risk group and survival status. The heatmap of the expression of four signature genes in the low- and high-risk groups in the GSE15459 dataset is presented from top to bottom. (G) K-M survival curves of patients in the high- and low-risk groups in the GSE15459 dataset. (H) Validation of the ROC curves of the 5-year and 10-year of prognostic values of the signature in the GSE15459 dataset.
The expression patterns of the prognostic genes were consistent in both TCGA-STAD and GSE15459 (Figures 2C, F). More deaths were recorded in the high-risk group than in the low-risk group. Additionally, the Kaplan–Meier survival curve demonstrated that the high-risk group had an unfavorable prognosis (Figure 2D). The ROC analysis demonstrated the strong predictive power of the constructed risk model at 10 years (area under the curve [AUC] = 0.715) (Figure 2E, Supplementary Figure S1). Similar results were observed in GSE15459 (Figures 2G, H), indicating the reliability and excellent predictive ability of the model.
-
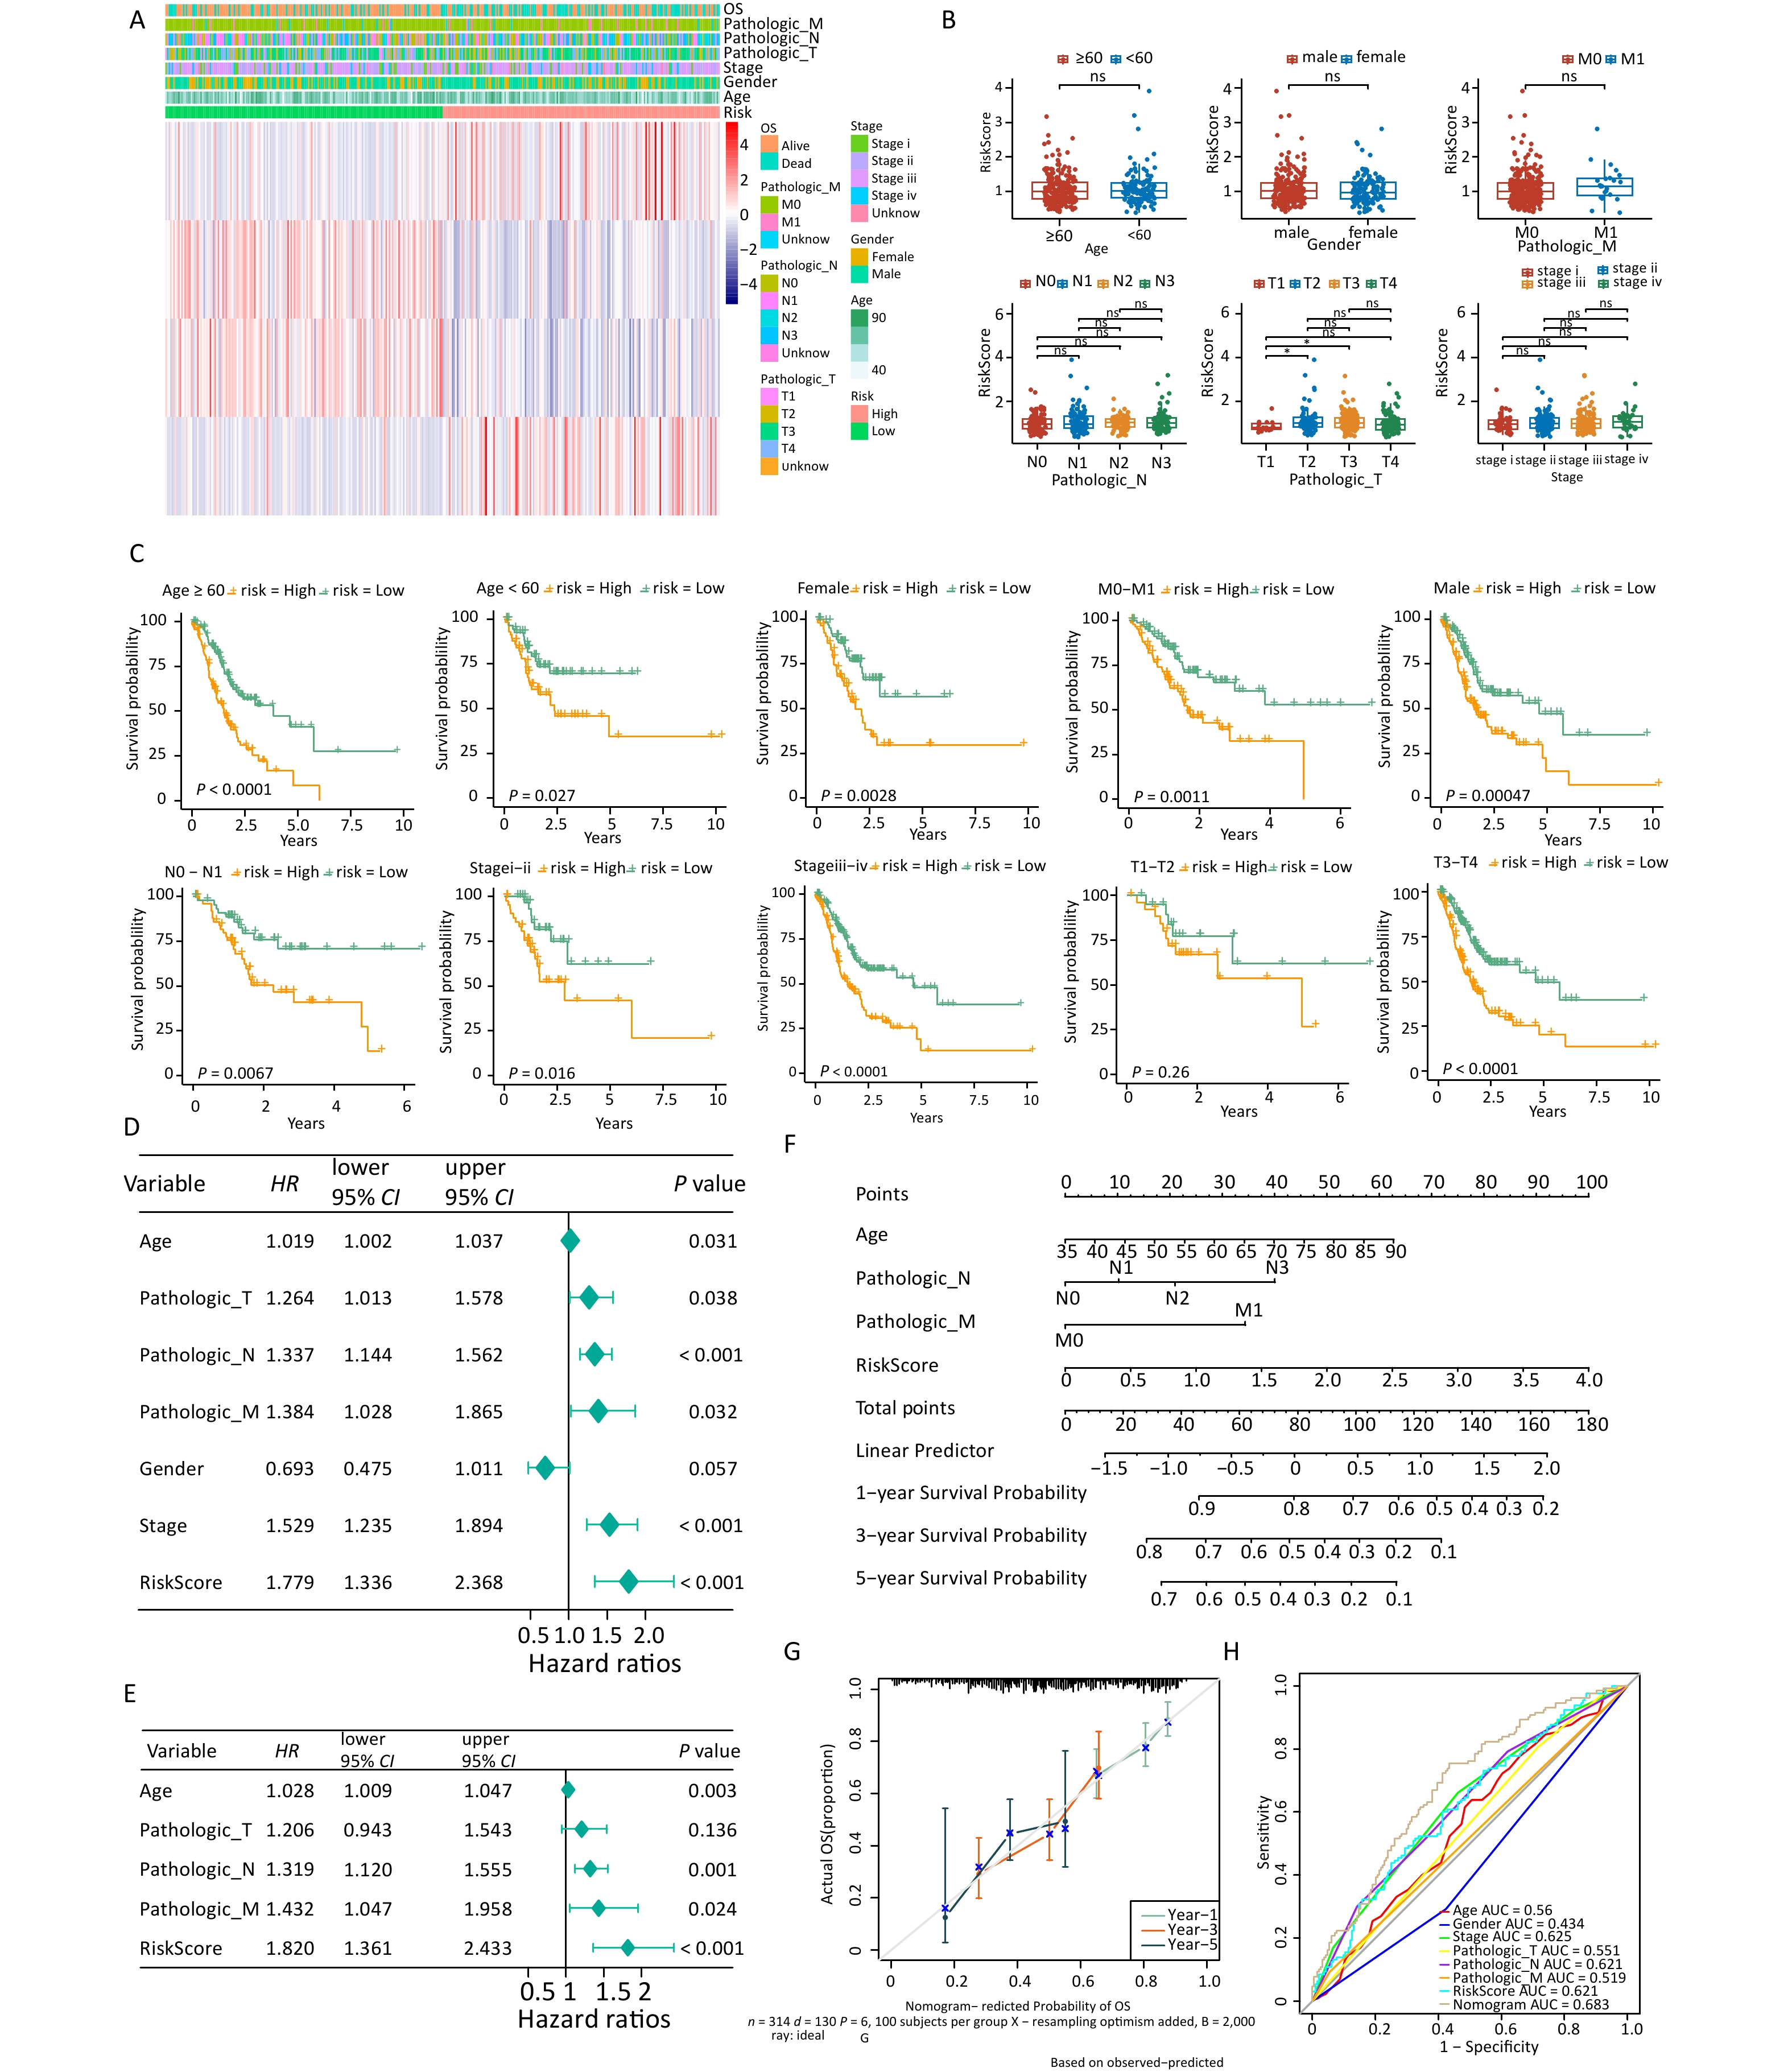
Analysis of the differences in clinical characteristics between different groups revealed differences in T stage between groups (Figures 3A, B), but no notable differences in age, sex, stage, N stage, M stage, and T3–T4 stages between two groups. Patients in the low-risk group who exhibited differences in age, sex, disease stage, and T3–T4 stages showed prolonged survival time (Figure 3C). Univariate and multivariate Cox independent prognosis analyses were conducted to further explore the clinicopathological features and prognostic ability of the risk model. The results indicated that the P values of risk score, age, and stage were less than 0.05 (Figures 3D, E), indicating that they were independent prognostic factors. An alignment chart based on these factors was constructed to predict patient survival rate at 1, 3, and 5 years according to the total scores (Figure 3F). Higher scores indicated lower survival rates. The C-index of the alignment chart was 0.683, and the calibration curve almost coincided with the ideal curve (Figure 3G). The AUC of the alignment chart was 0.683 (Figure 3H), indicating that the predictive ability of the nomogram was acceptable.
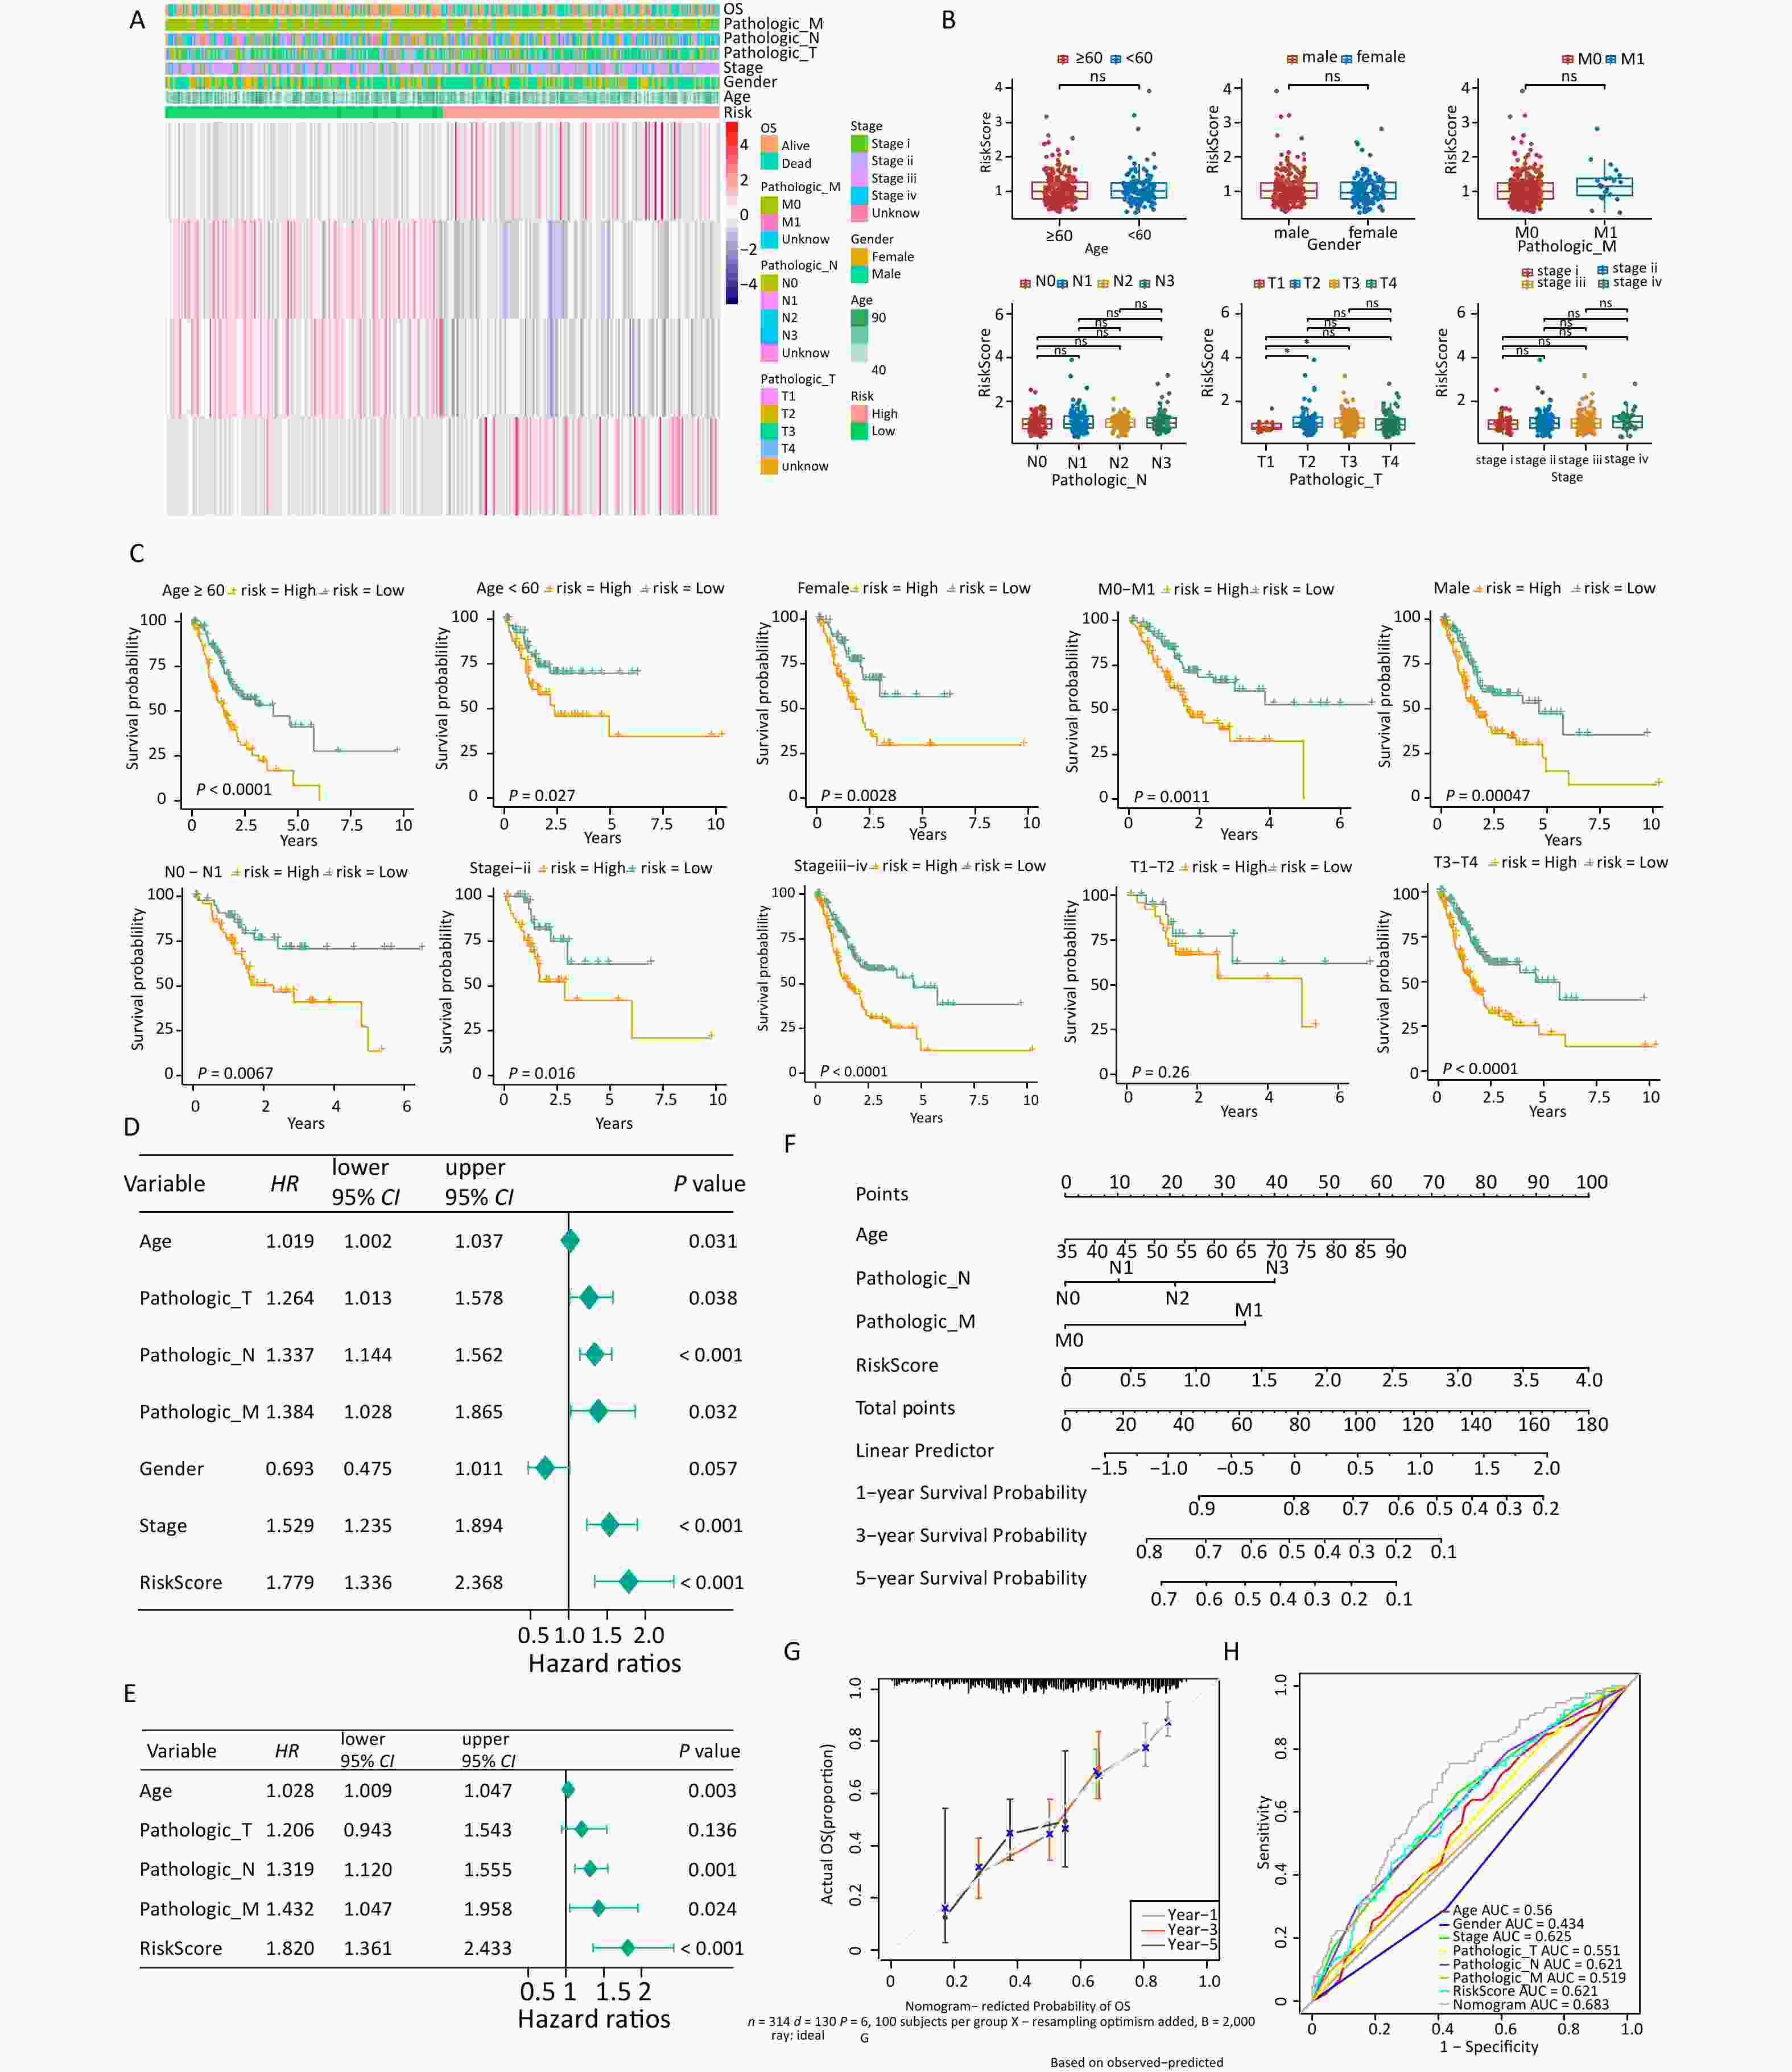
Figure 3. Analysis of clinical features in the high- and low-risk groups. (A) Expression of four signature genes and clinical characteristics in the low- and high-risk groups. (B) Differences in risk scores and clinical characteristics between different groups. (C) K-M survival stratification analyses of the high- and low-risk groups in the TCGA-STAD dataset. (D, E) Univariate and multivariate Cox regression analyses of clinicopathologic characteristics and risk scores using the TCGA-STAD dataset. The green square on the horizontal line represents HR, whereas the green line represents 95% CI. (F) Nomogram for evaluating the 1- to 5-year overall survival of patients with gastric cancer. (G) Calibration curve of nomogram created using the TCGA-STAD dataset. (H) ROC curves of the validity of the nomogram created using the TCGA-STAD dataset. TCGA-STAD, Cancer Genome Atlas - StomachAdenocarcinoma.
-
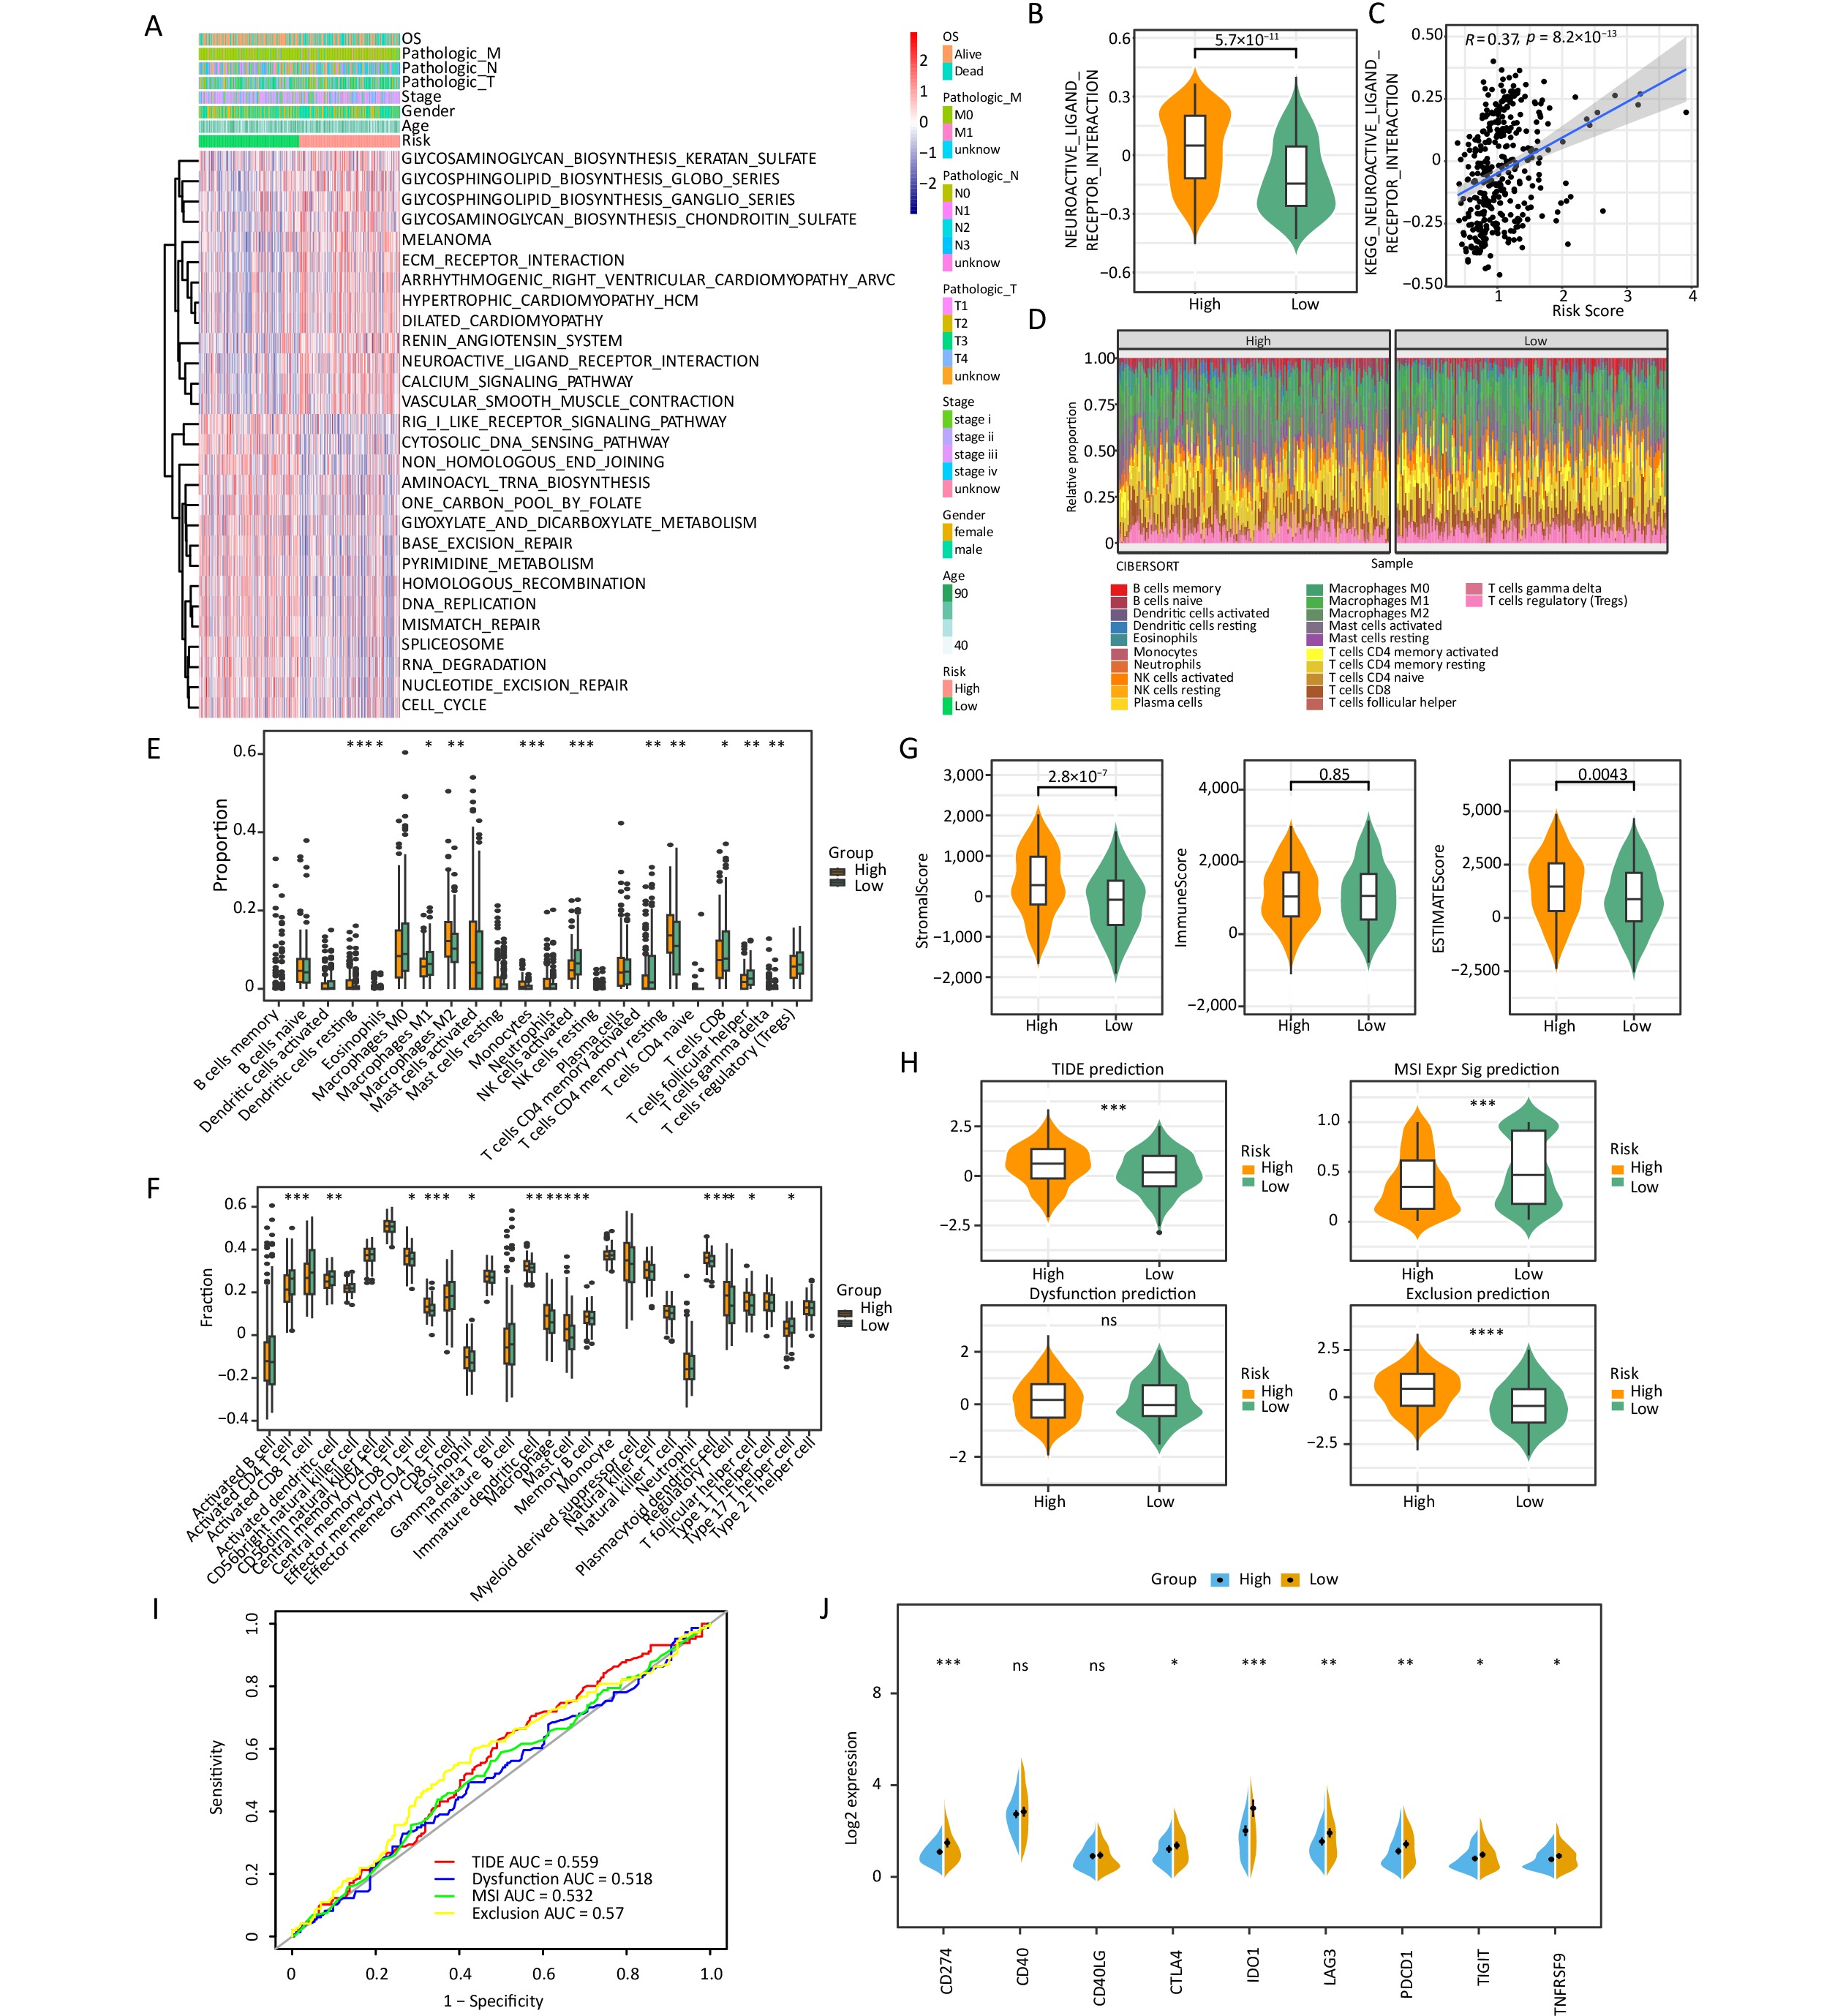
The differences in biological pathways between the two groups were assessed, and 28 KEGG pathways were identified. Of these, 13 pathways, including the glycosphingolipid biosynthesis ganglio series, were upregulated, whereas 15 pathways, including the cytosolic DNA sensing pathway, were downregulated (Figure 4A). Neuroactive ligand receptor interaction was found to be the most significant pathway and was upregulated in the high-risk group (Figure 4B), indicating a strong correlation between the pathway and risk score (Figure 4C).
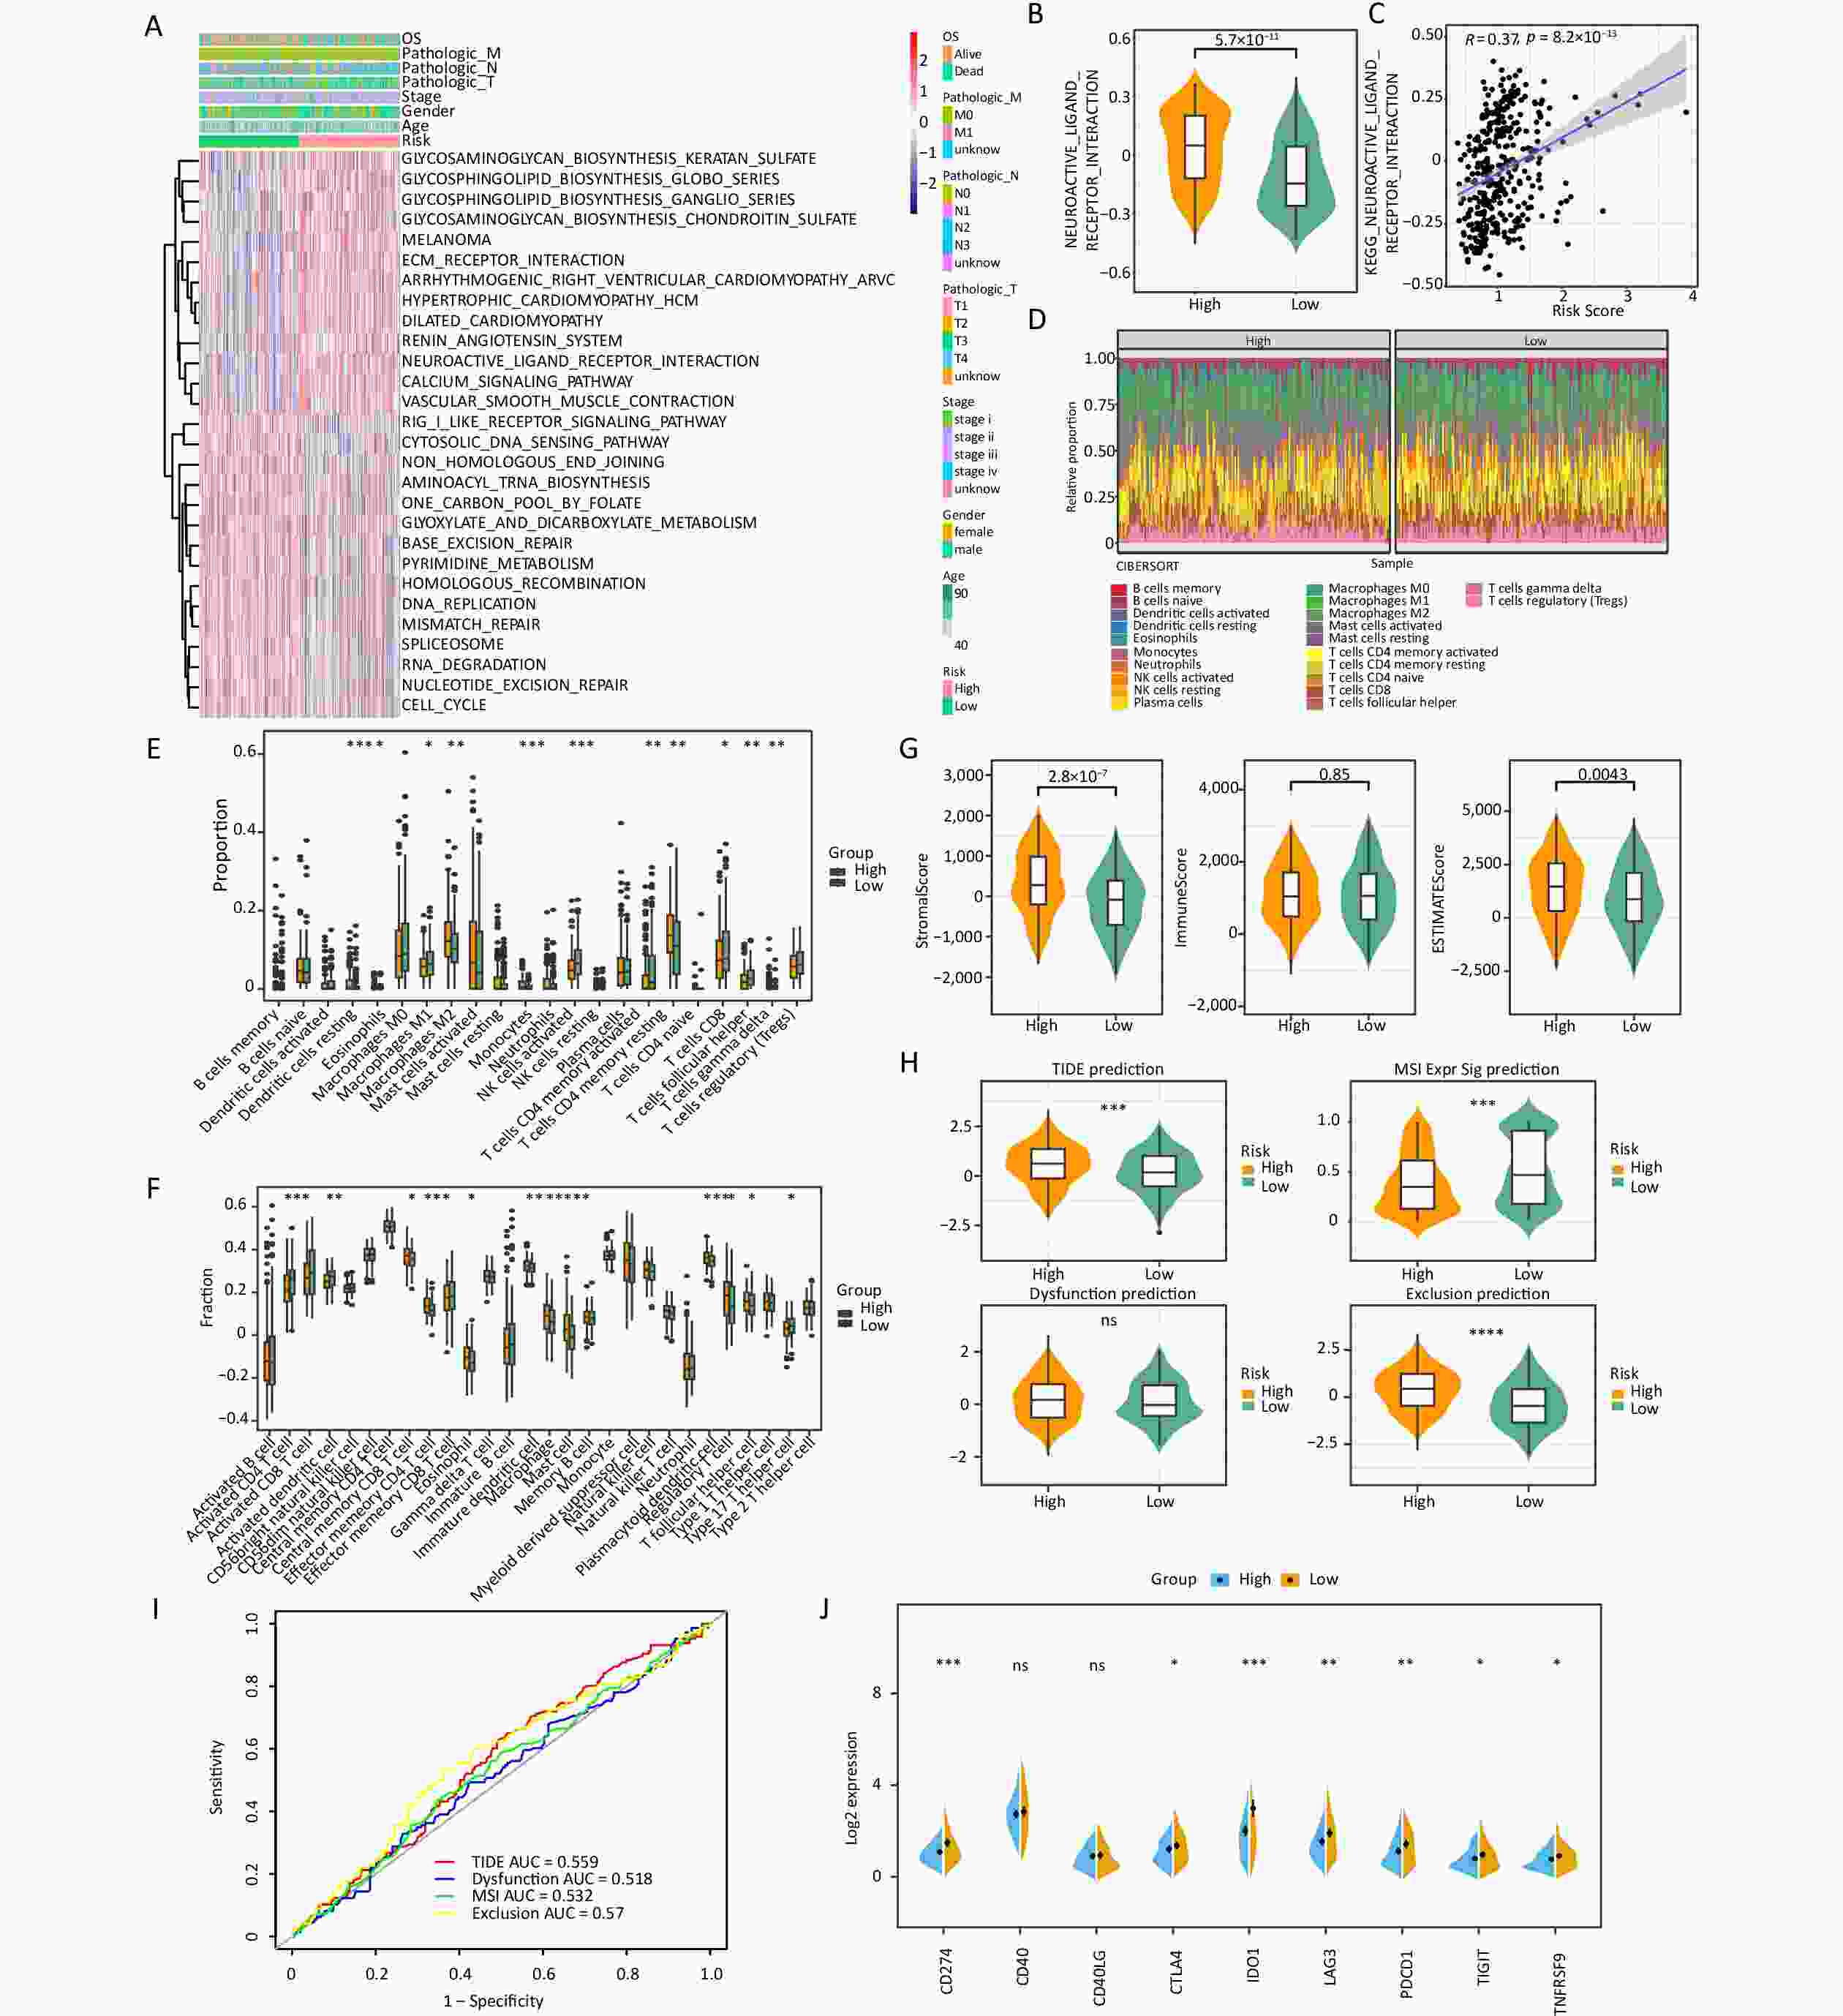
Figure 4. Risk score was related to infiltration of immune cells into the TIME. (A) The heatmap shows the KEGG pathways enriched in the low- and high-risk groups. (B) Expression of the neuroactive ligand–receptor interaction in the low- and high-risk groups. (C) The correlations between the neuroactive ligand–receptor and risk scores. (D) The proportions of 22 different kinds of immune cells in each sample. (E) Twenty-two cell types were annotated to the TCGA queue using the CIBERSORT algorithm (*P < 0.05, **P < 0.01, ***P < 0.001). (F) Twenty-eight cell types were annotated to the TCGA queue using the ssGSEA algorithm (*P < 0.05, **P < 0.01, ***P < 0.001).(G) The differences in stromal score, immune score, and ESTIMATE score between the two risk groups. (H) Comparison of the TIDE, T-cell dysfunction, prevention of T cell infiltration, and microsatellite instability (MSI) scores between the two risk groups (***P < 0.001, ****P < 0.0001). (I) The prognostic value of TIDE in the TCGA-STAD dataset. (J) Differences in immune checkpoint molecules between the low- and high-risk groups (*P < 0.05, **P < 0.01, ***P < 0.001).
The expression abundance of 22 types of immune cells was analyzed (Figure 4D). The results indicated that 11 immune cells, including resting dendritic cells, M2 macrophages, monocytes, and resting memory CD4 T cells, were significantly different between the two risk groups. Specifically, the high-risk group showed higher expression levels of these immune cells than the low-risk group (Figure 4E). In addition, the ssGSEA algorithm showed that the high-risk group showed significantly higher scores of 12 kinds of immune cells, including central memory CD8 T cells, effector memory CD4 T cells, eosinophils, immature dendritic cells, macrophages, mast cells, regulatory T cells, and follicular helper T cells, than the low-risk group (Figure 4F). In addition, the high-risk group showed higher stromal and ESTIMATE scores than the low-risk group (Figure 4G).
Sensitivity to immunotherapy was evaluated in the high- and low-risk groups, and the results revealed significant disparities in tumor immune dysfunction and exclusion (TIDE) prediction, MSI Expr Sig prediction and Exclusion prediction. The TIDE prediction and Exclusion prediction were markedly elevated in the high-risk group (Figure 4H); however, the ROC curve indicated that TIDE had little effect on the prognosis of gastric cancer (Figure 4I). Notably, an increasing body of evidence has indicated that targeting immune checkpoints such as CD274 could enhance the effectiveness of cancer treatments. Noteworthy differences in the expressions of CD274, CTLA4, IDO1, LAG3, PDCD1, TIGIT, and TNFRSF9 were observed between the high- and low-risk groups, with the high-risk group showing a downward trend (Figure 4J).
-
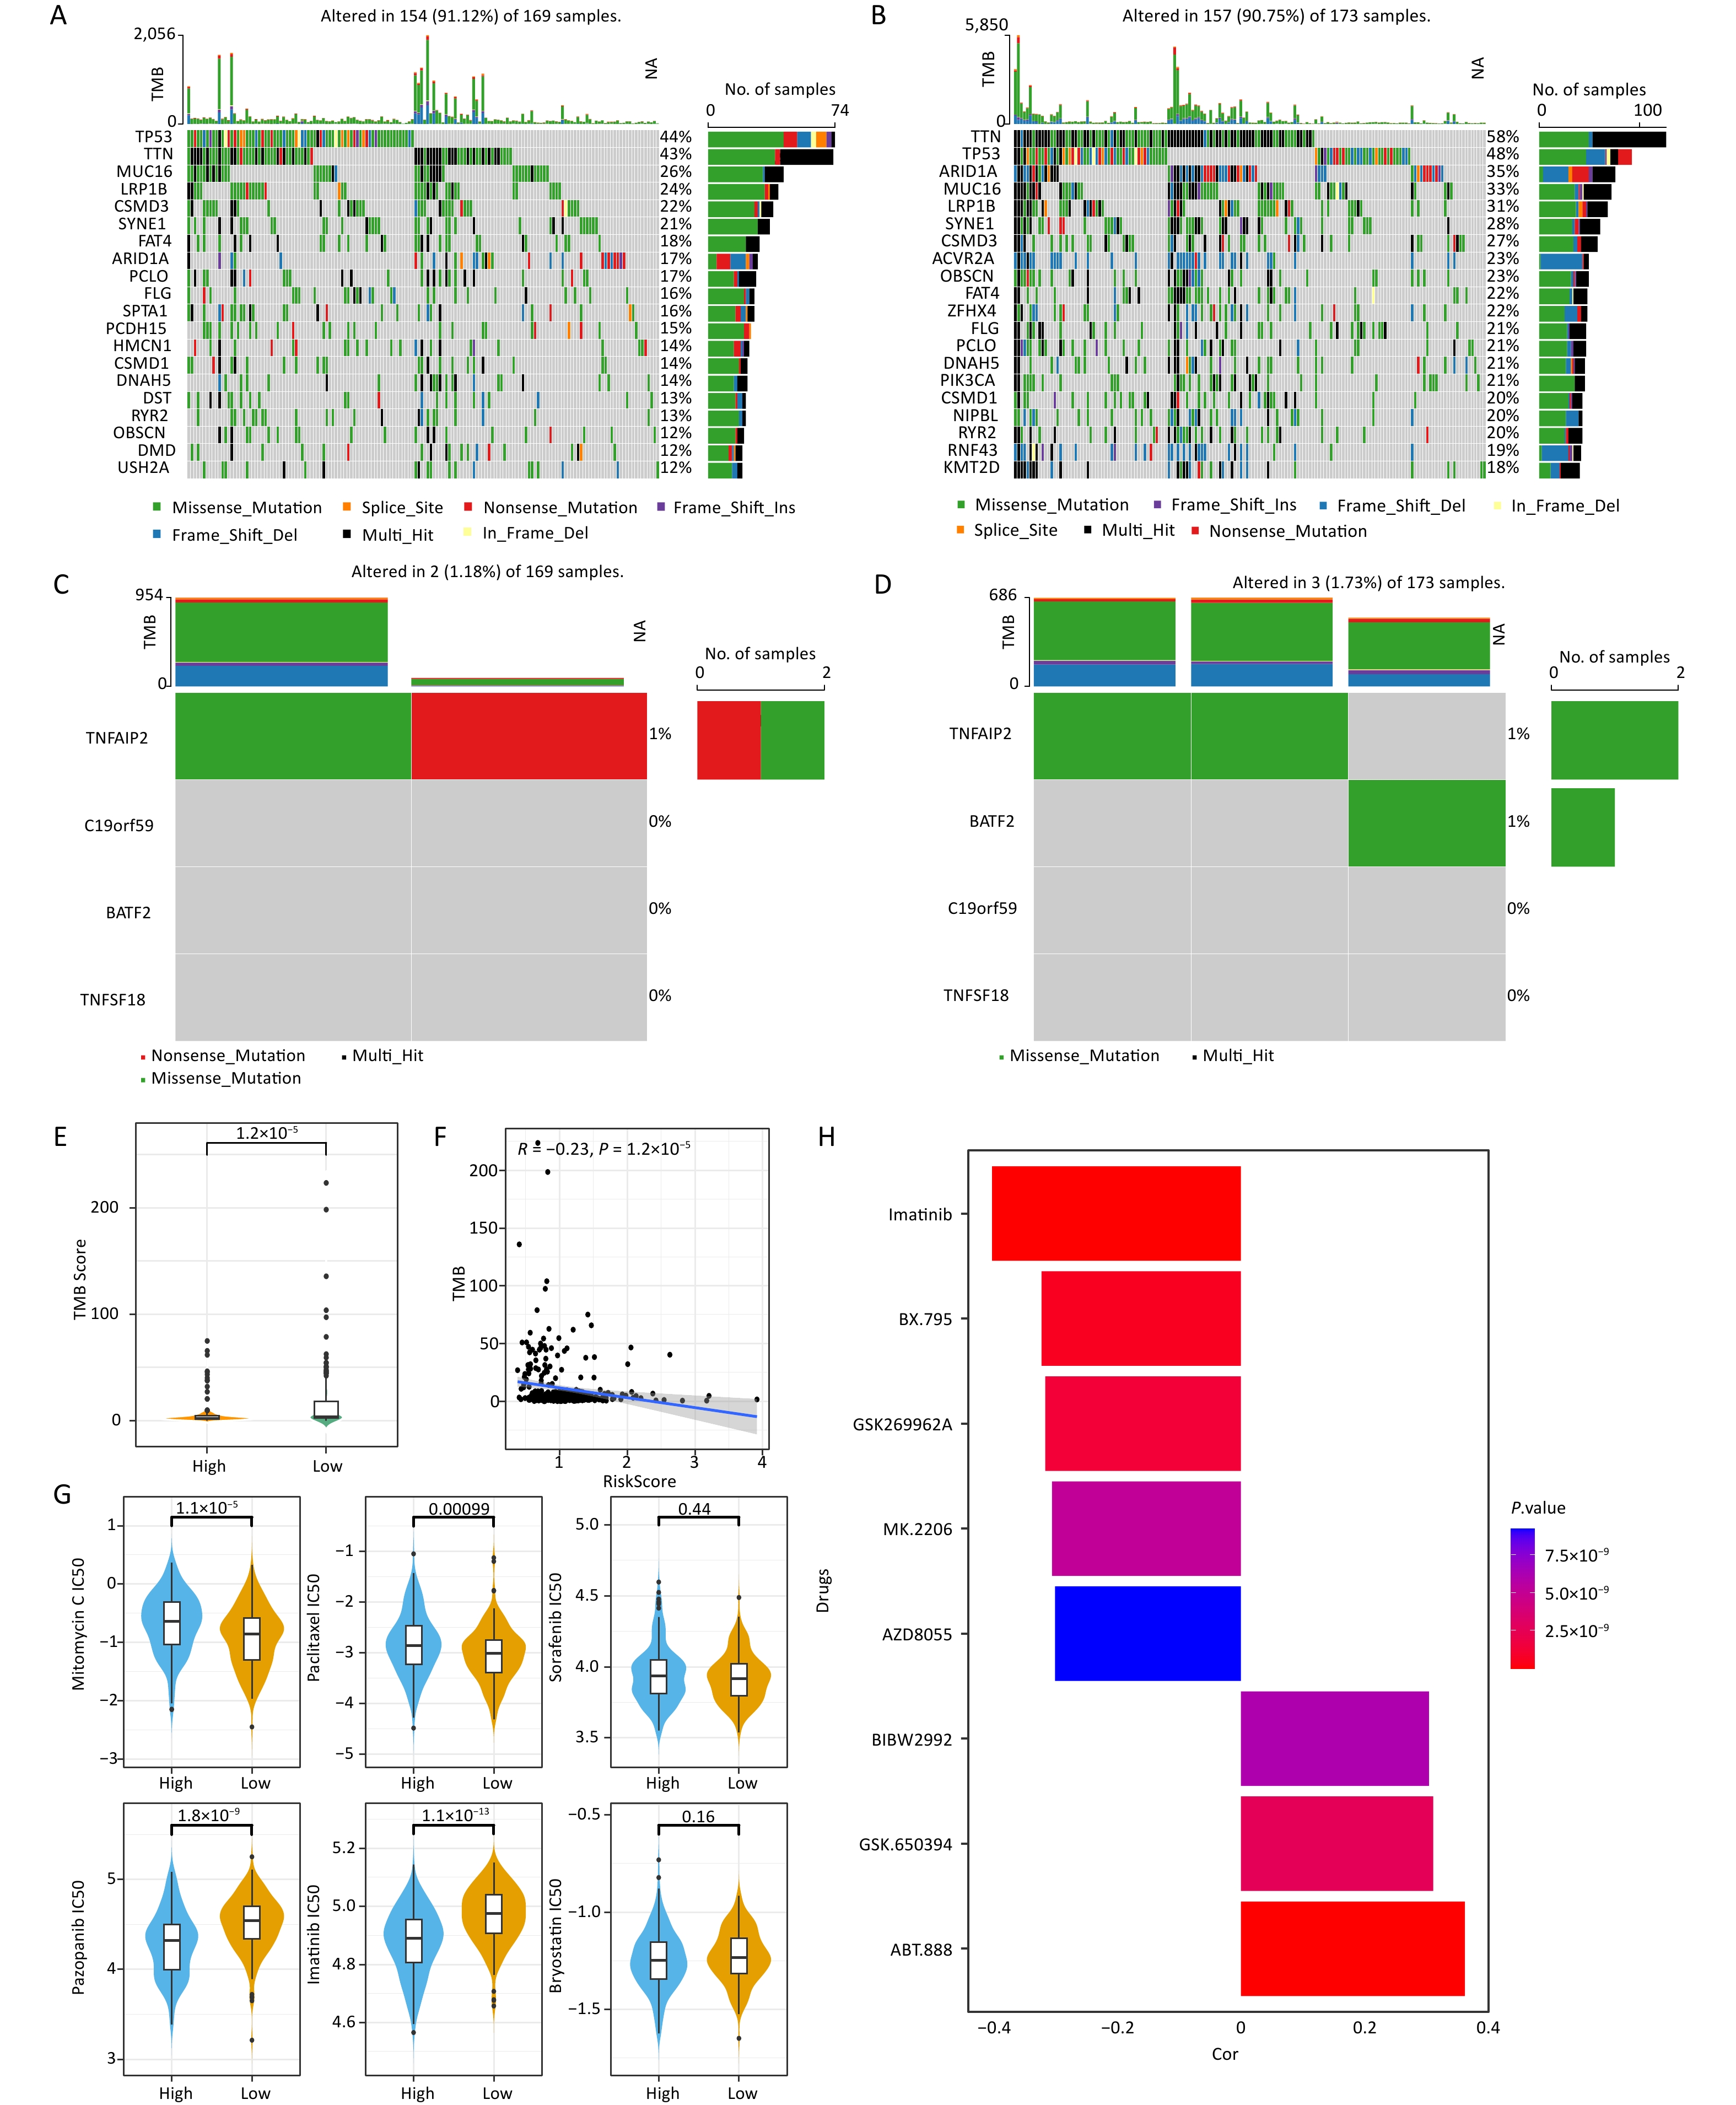
The mutation information for each sample was visualized using a waterfall plot, which was annotated with various colors to distinguish the mutation types. TP53 and TTN exhibited the highest mutation periodicity in the high-risk group (TTN, 43%; TP53, 44%) (Figure 5A) and the low-risk group (TP53, 48%; TTN, 58%) (Figure 5B). A tendency towards nonsense and missense TNFAIP2 mutations was observed in the high-risk group (Figure 5C), whereas the low-risk group tended to exhibit missense TNFAIP2 and BATF2 mutations (Figure 5D). Additionally, significant differences in TMB were observed between the two score groups (Figure 5E). Moreover, TMB demonstrated a strong negative correlation with risk score (cor = –0.23, P = 1.2 × 10⁻⁵) (Figure 5F). Eighty-three drugs exhibited significant correlations with risk score. Notably, mitomycin C and paclitaxel showed stronger correlations in the high-risk group than in the low-risk group, suggesting that they may be viable treatment options for patients with high-risk gastric cancer (Figure 5G, Supplementary Table S3). Imatinib showed the strongest negative correlation, whereas ABT-888 had the strongest positive correlation with risk score (Figure 5H).
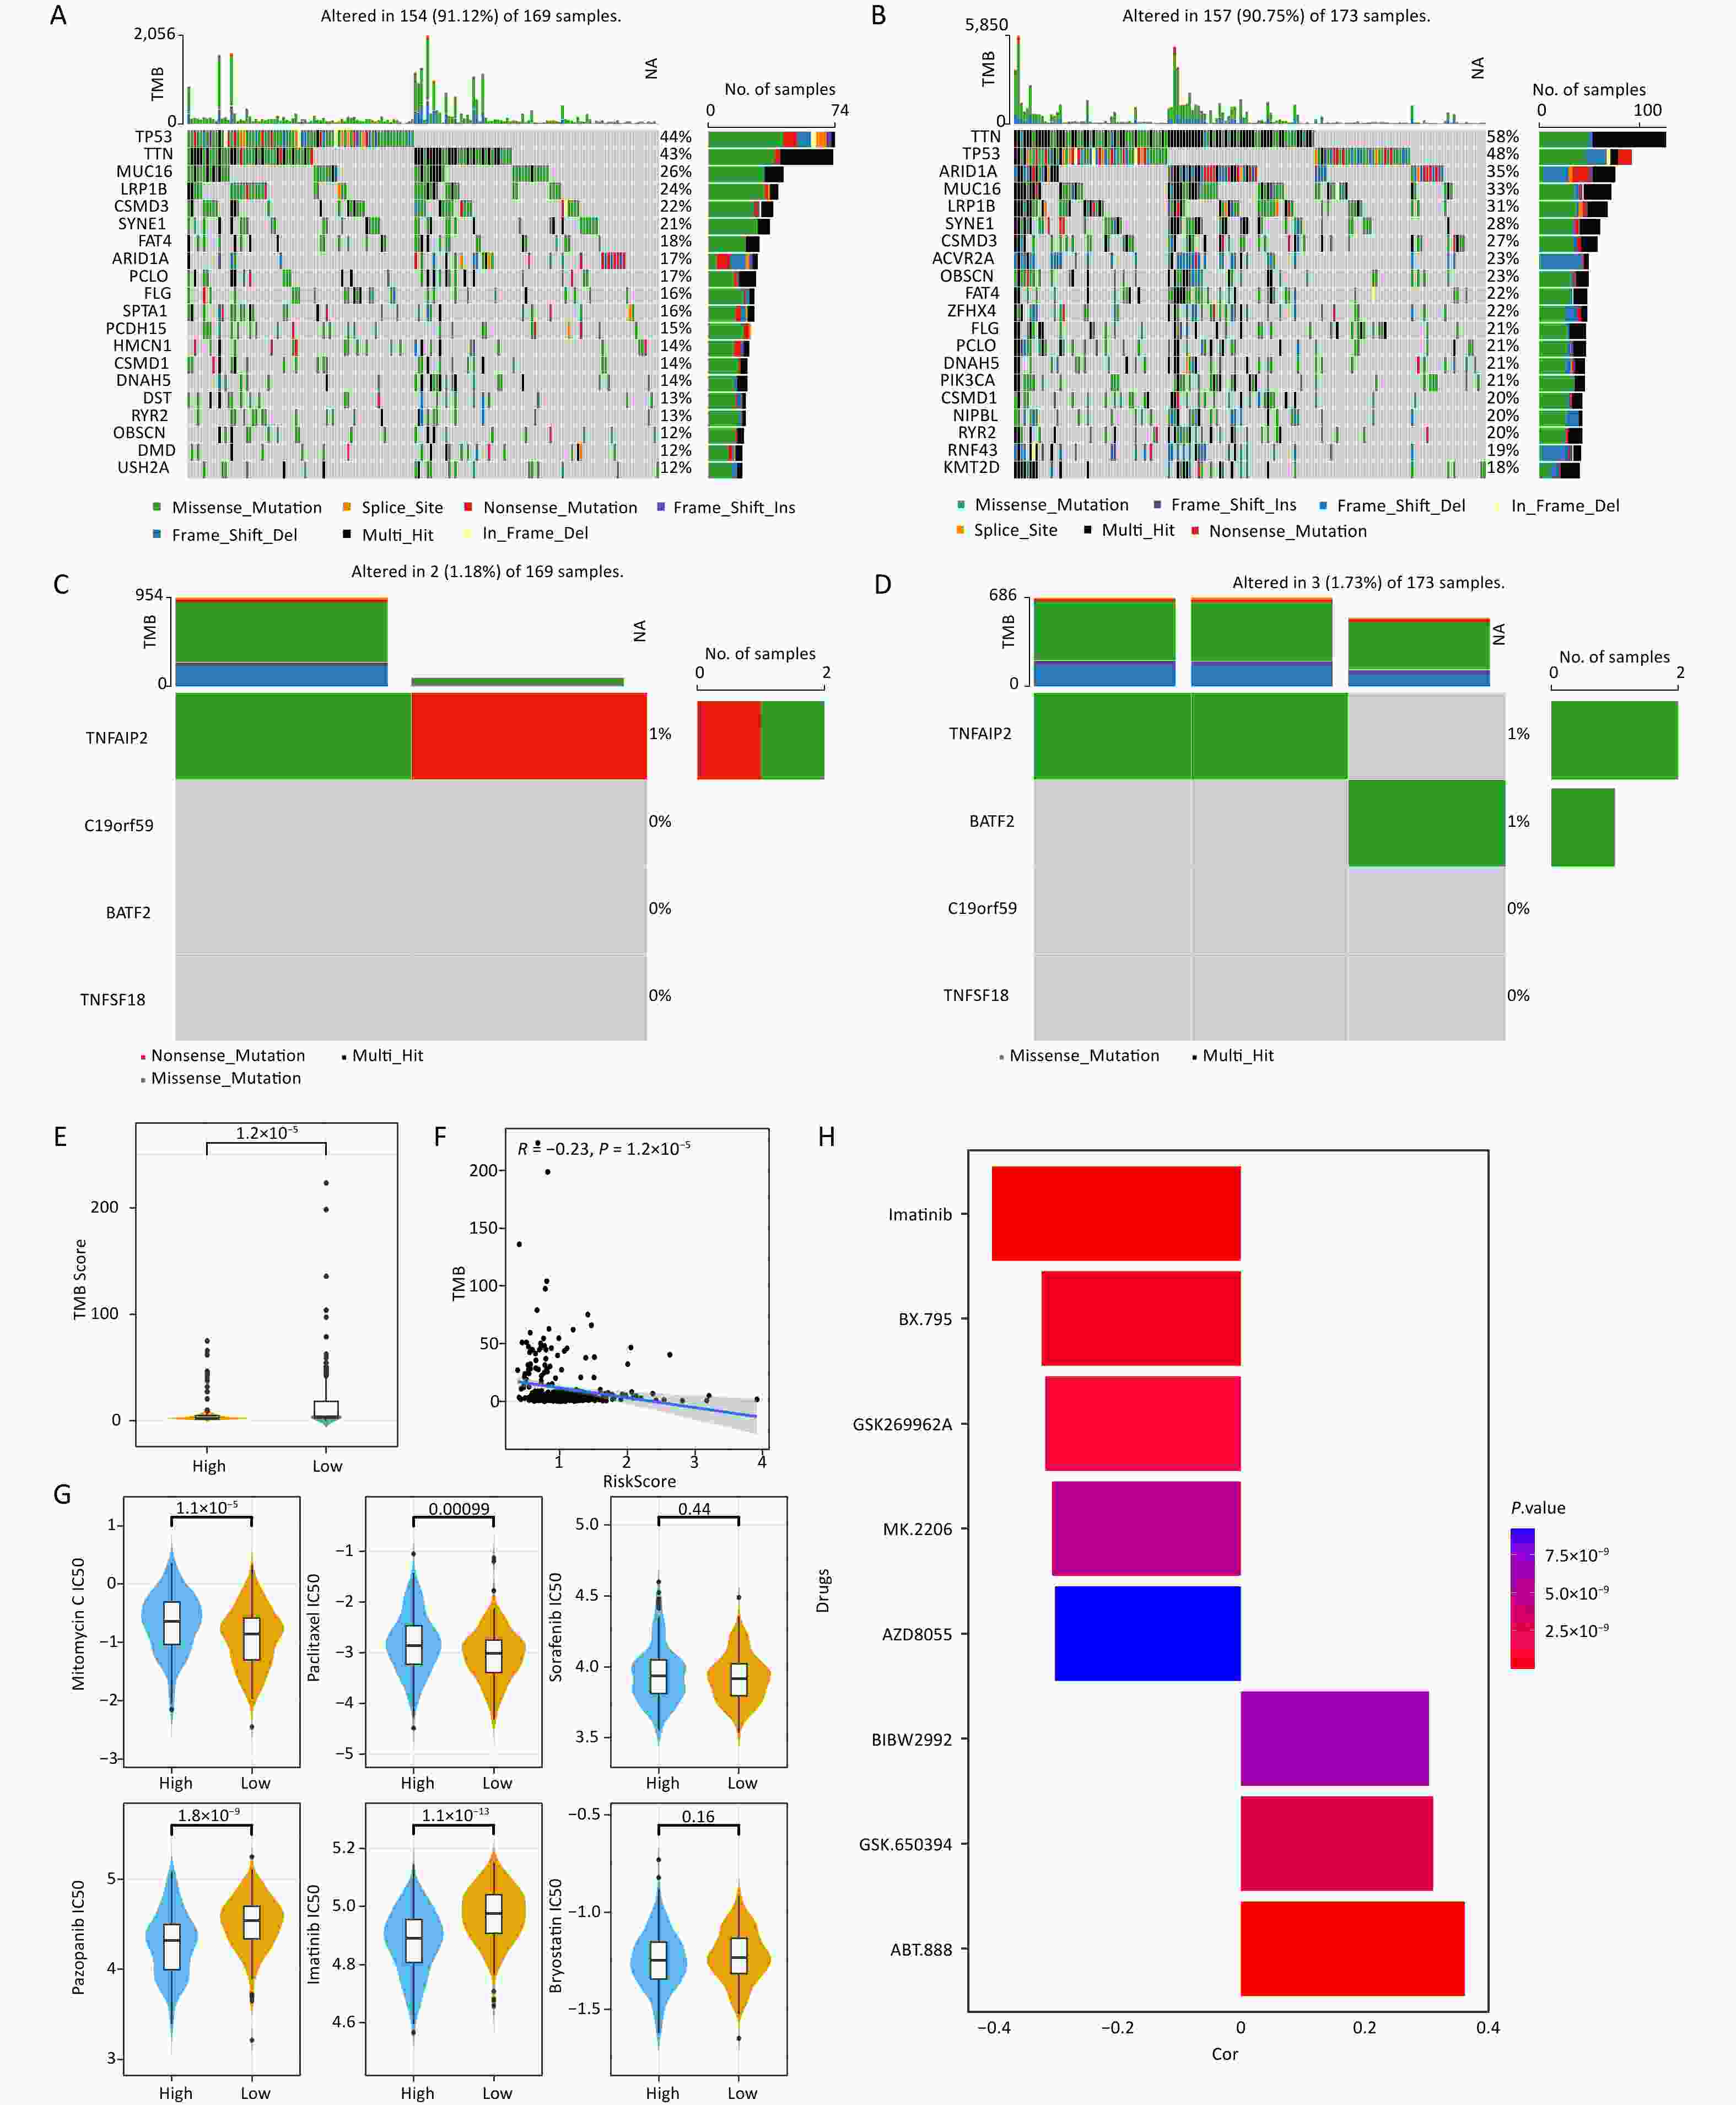
Figure 5. Characteristics of somatic mutations and drug predictions. (A, B) The oncoplot shows the somatic mutation profiles of the high- and low-risk groups. Genes are ranked according to mutation frequency. (C, D) Types of mutations of prognostic genes in the high- and low-risk groups. (E) Differences in TMB between the low- and high-risk groups. (F) Correlation between TMB score and risk score. (G) Comparisons of the IC50 values of mitomycin C, paclitaxel, sorafenib, pazopanib, imatinib, and bryostatin between the low-risk and high-risk groups. (H) Correlation between the drugs and risk score.
-
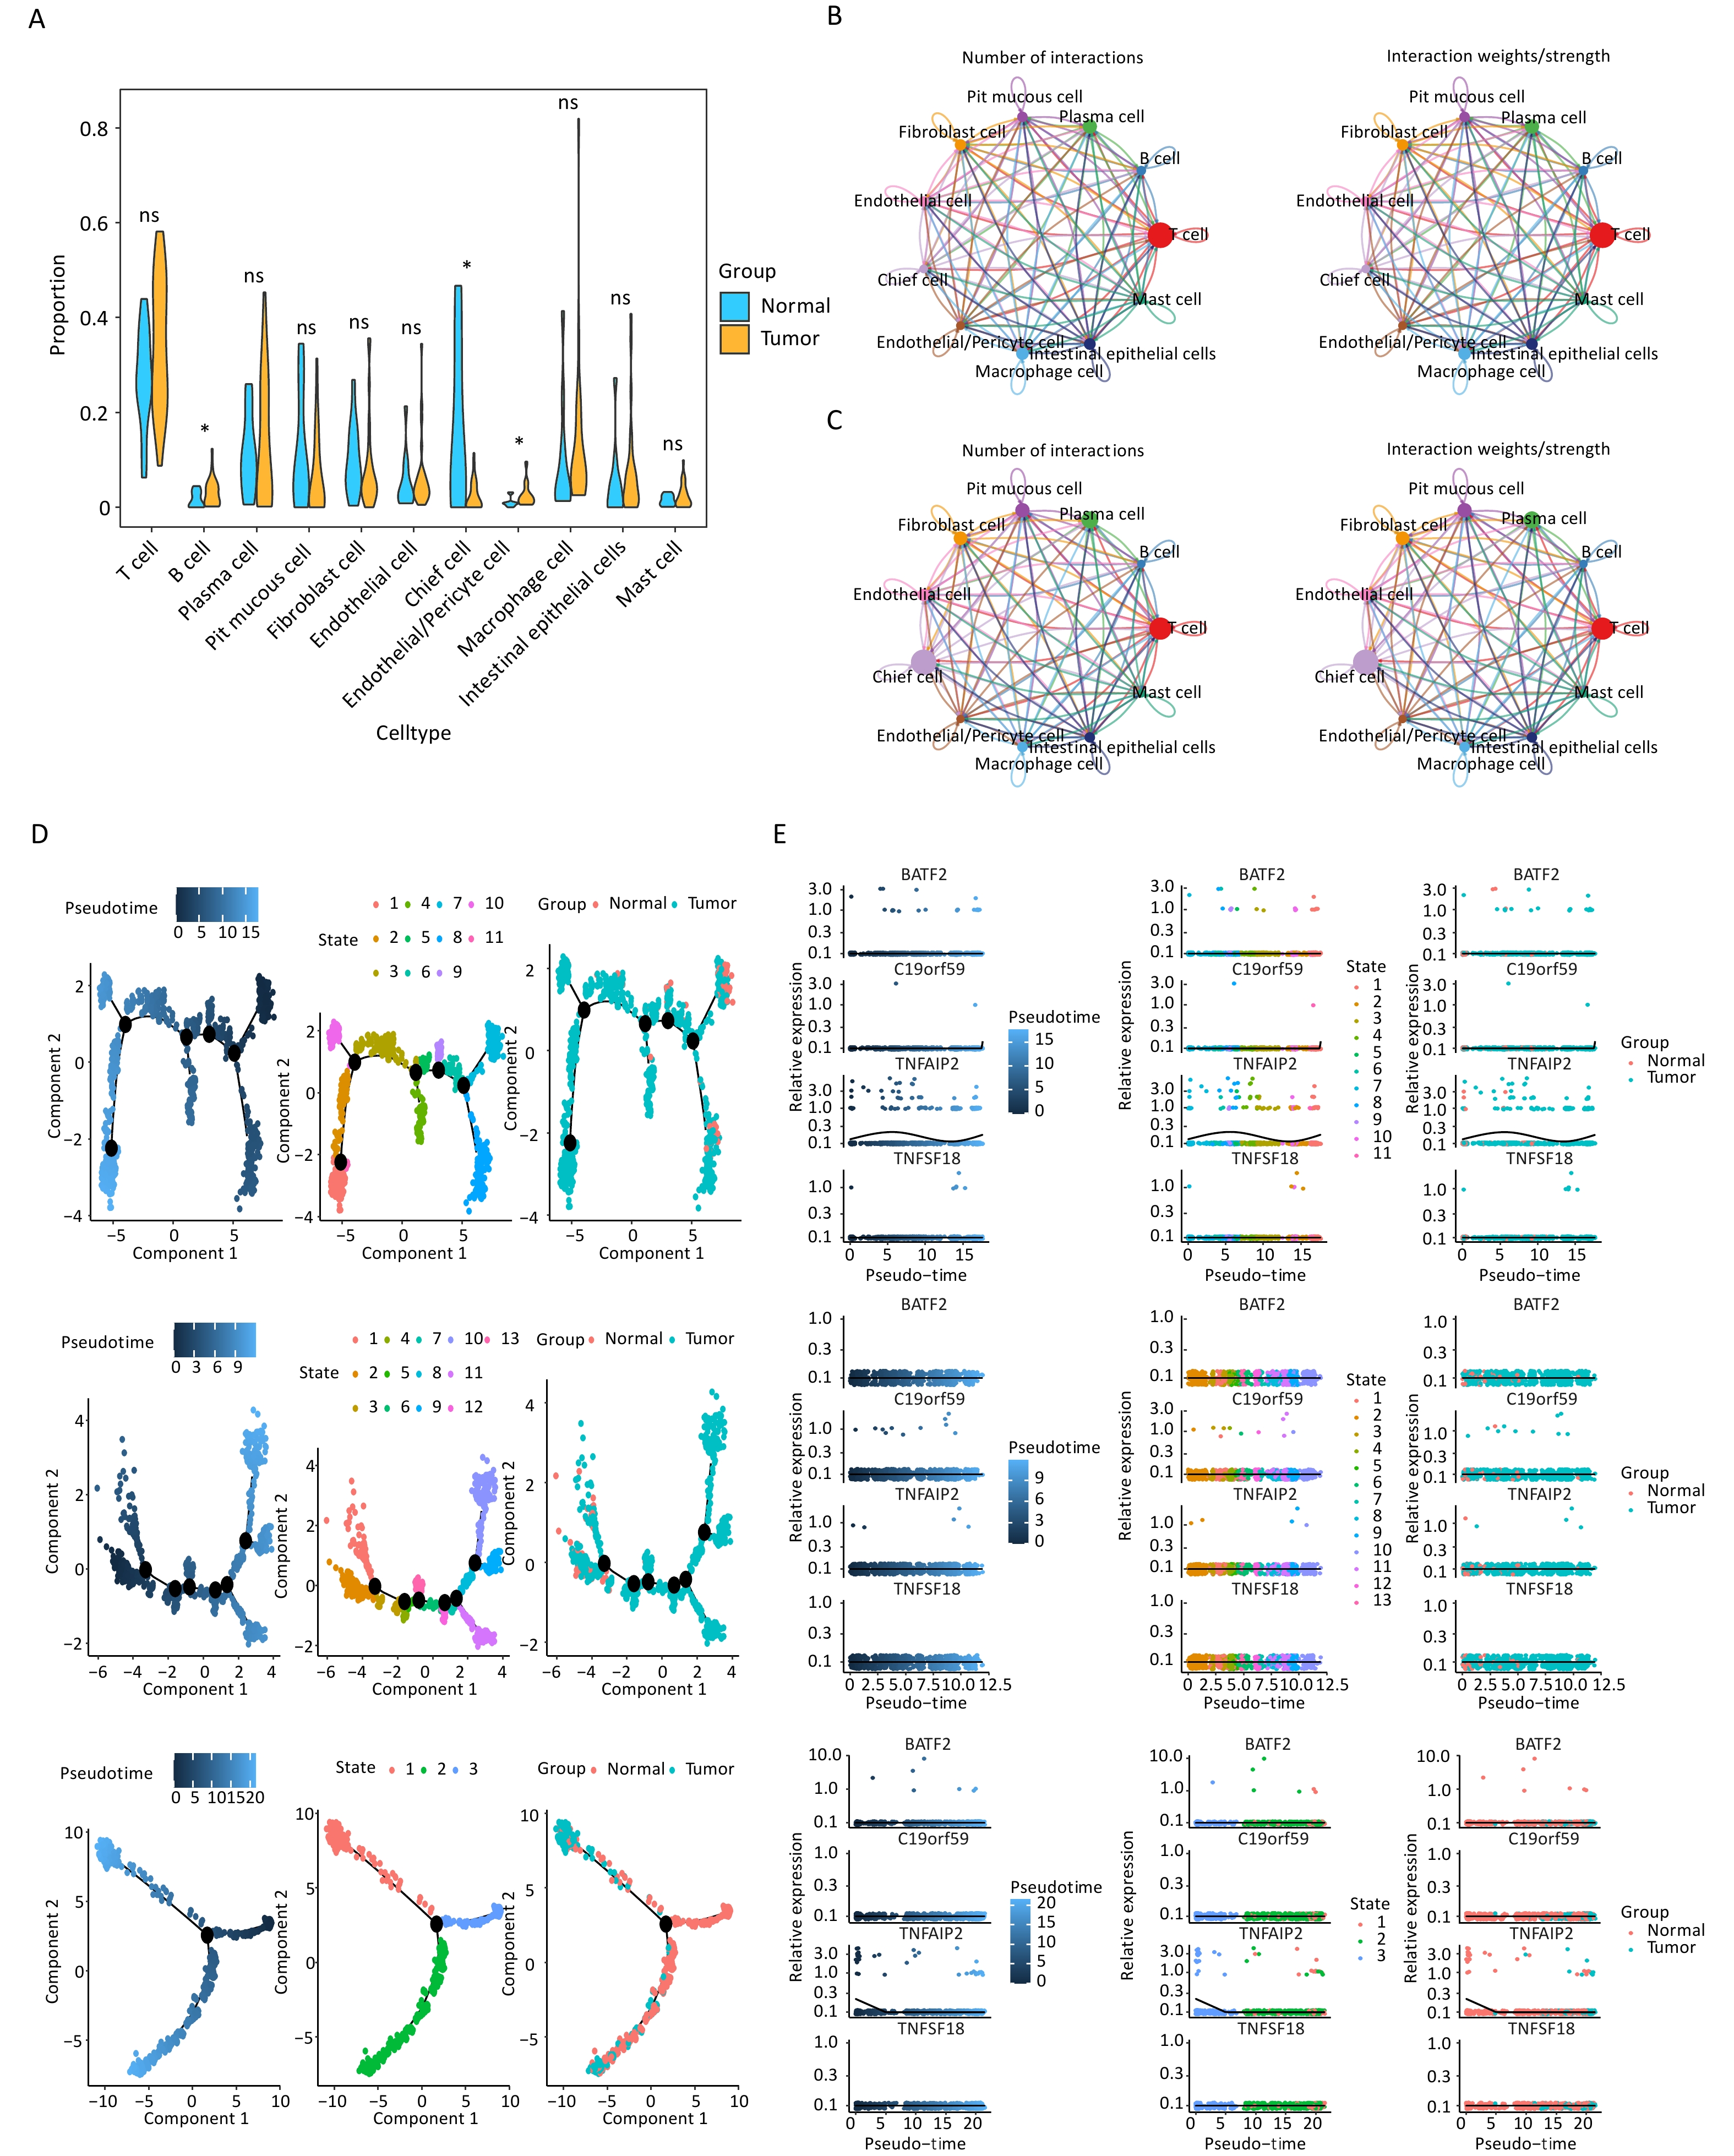
After quality control, the filtered cells were clustered and 11 distinct cell subtypes were annotated: T cells, B cells, plasma cells, pit mucous cells, fibroblast cells, endothelial cells, chief cells, endothelial/pericyte cells, macrophage cells, intestinal epithelial cells, and mast cells (Supplementary Figure S2A). The marker genes associated with each identified cellular subtype were visualized using bubble plots (Supplementary Figure S3). Among these cell subtypes, the proportions of B cells, chief cells, and endothelial/pericyte cells were significantly different between groups; therefore, the cells were defined as key cells (Figure 6A, Supplementary Figure S2B). The differences in enriched pathways observed in the DEGs from the disease and control samples are shown in Figures S2C and S2D. Fibroblast cells, intestinal epithelial cells, and endothelial/pericyte cells demonstrated strong intercellular interactions within the disease group (Figure 6B), whereas T cells showed robust interactions with fibroblast cells and endothelial/pericyte cells within the normal group (Figure 6C). Endothelial/pericyte cells were found to differentiate into five distinct states (Figure 6D), B cells showed six possible stages of differentiation (Figure 6D), and the chief cells differentiated only once (Figure 6D). Moreover, prognostic gene expression exhibited temporal changes, with the expression of TNFAIP2 in endothelial/pericyte and chief cells changing with the evolution of time (Figure 6E).
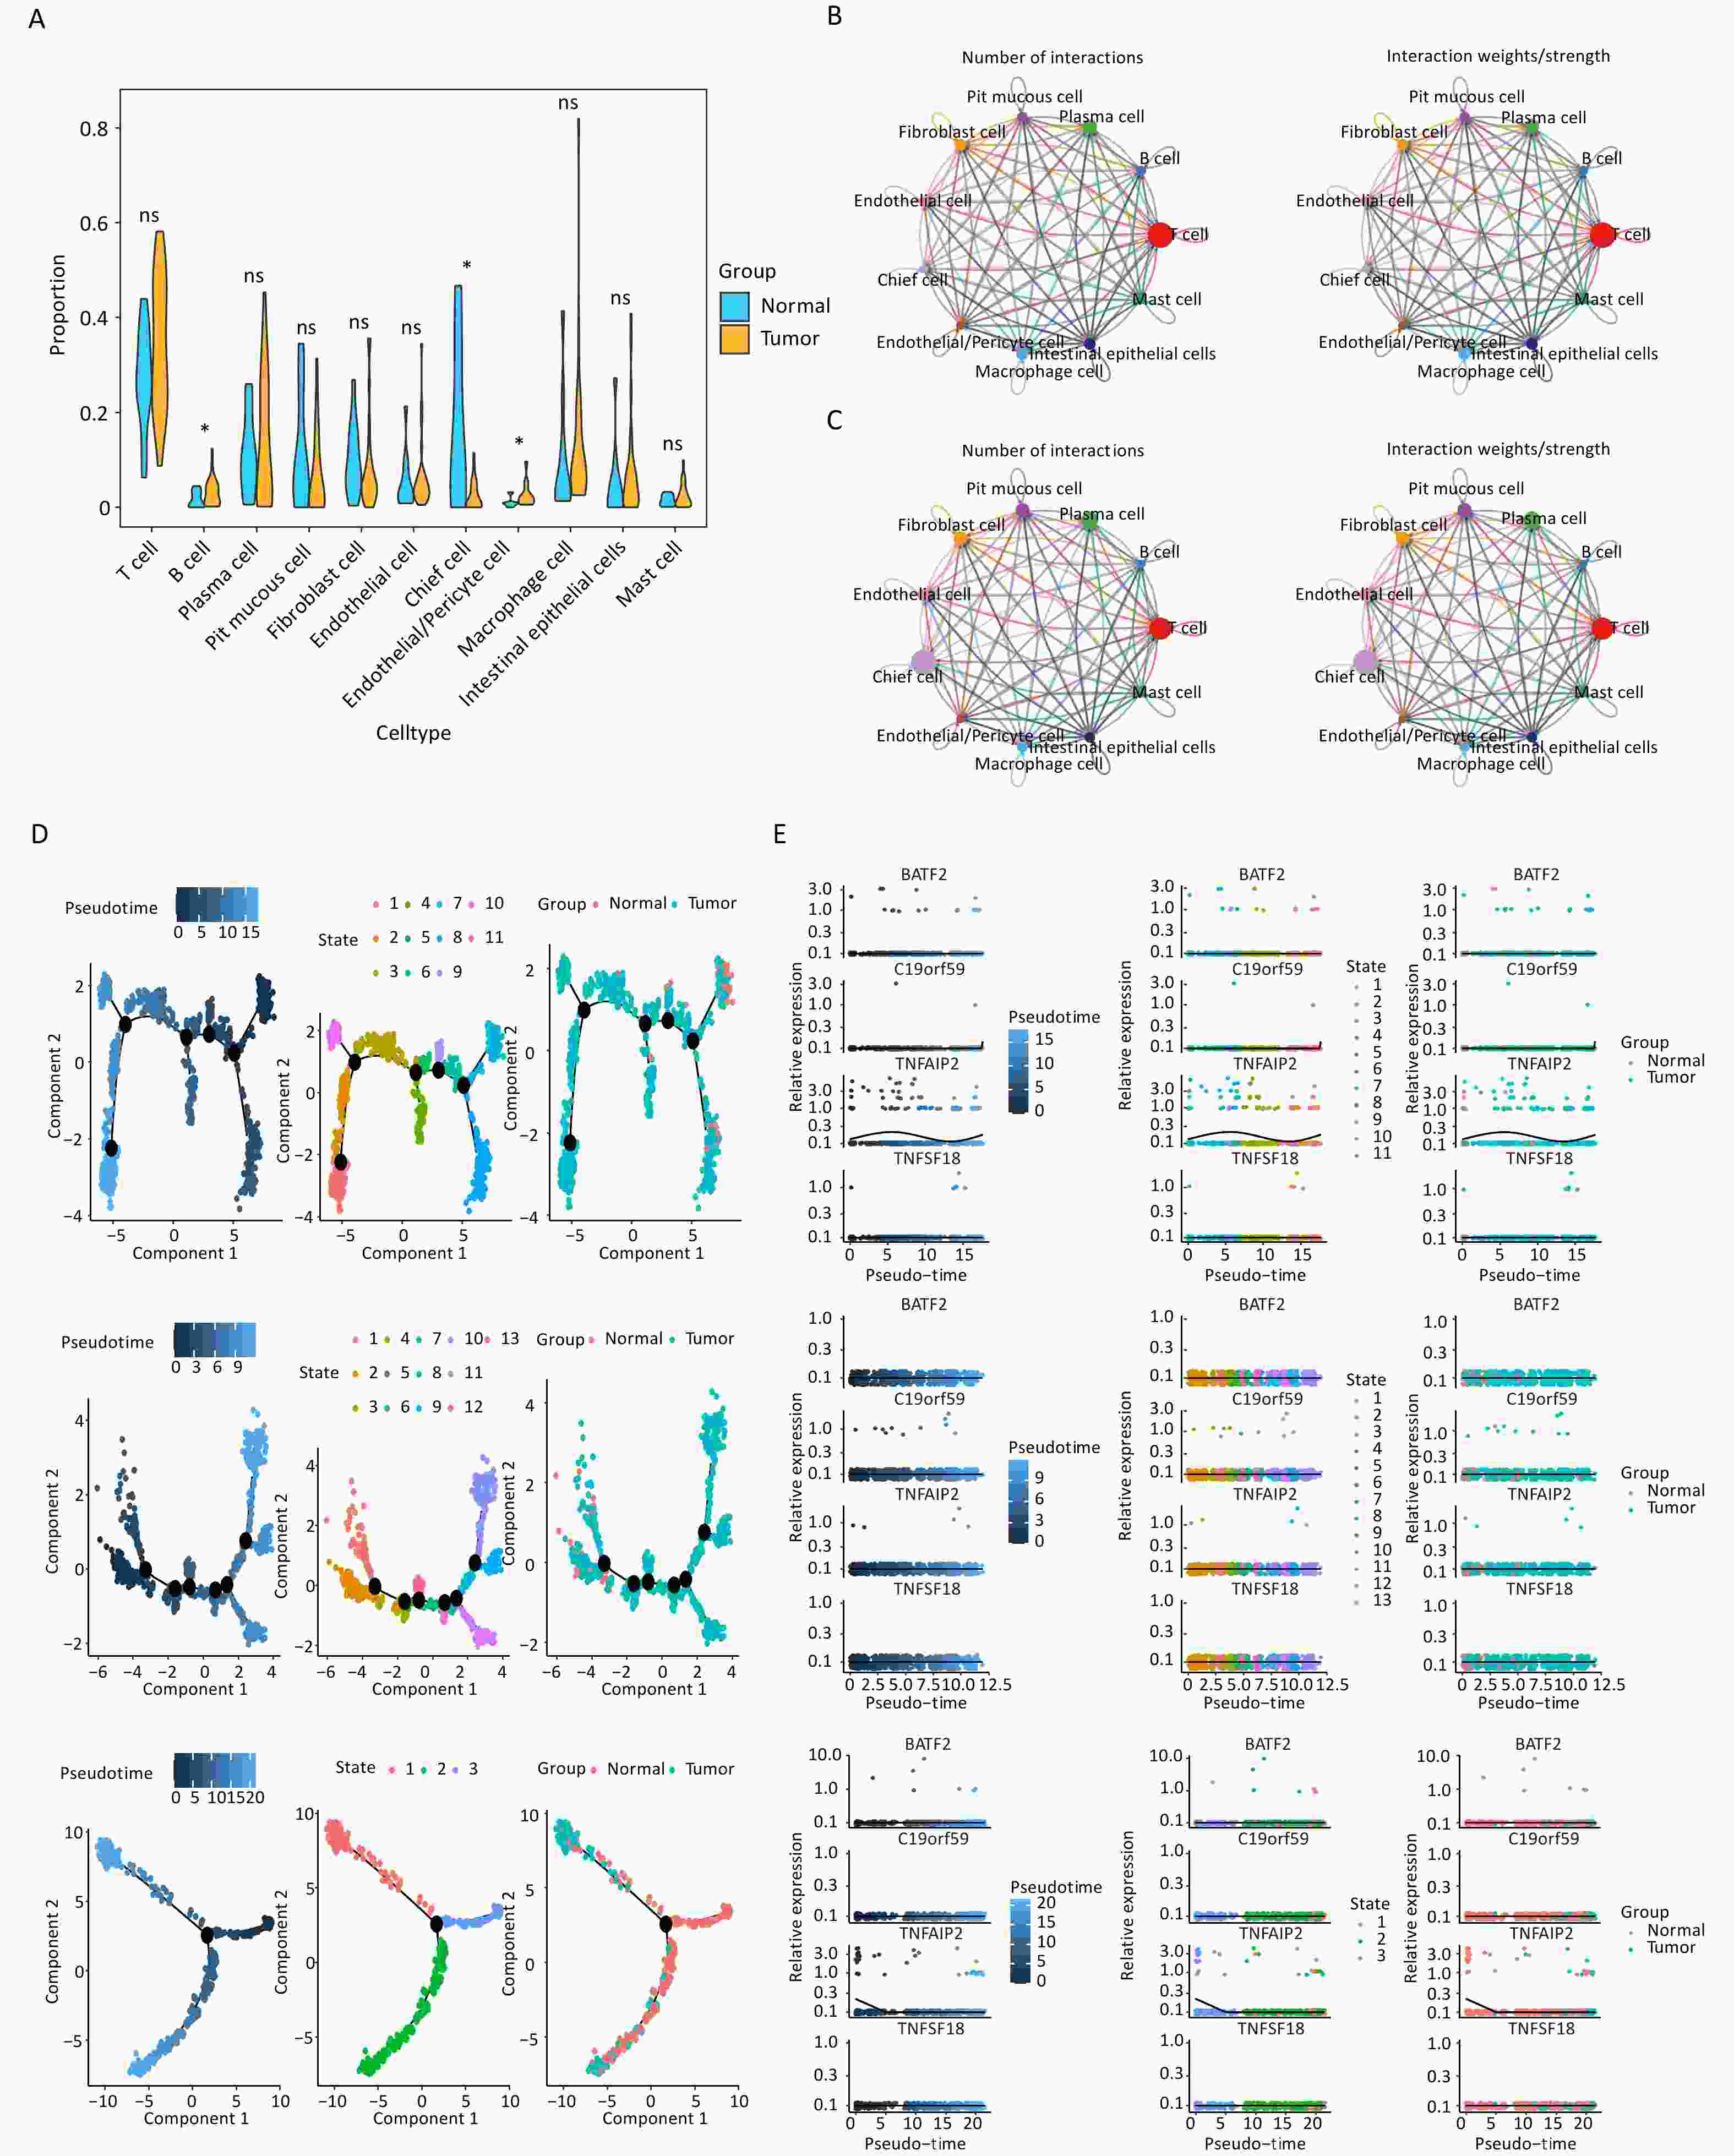
Figure 6. Key cell types identified in gastric cancer samples through single-cell analysis. (A) The proportions of 11 cell types in the tumor and normal groups (*P < 0.05). (B) Overall intercellular communication profiles of the cell types in the tumor group. The thickness of the line indicates the number or interaction weights of ligand–receptor pairs. (C) Overall intercellular communication profiles of the cell types in the normal group. (D) Cell trajectory and pseudo-time analysis in endothelial/pericyte cells, B cells, and chief cells are presented from top to bottom. (E) The pseudo-time expression levels of four signature genes in endothelial/pericyte cells, B cells, and chief cells are presented from top to bottom.
-
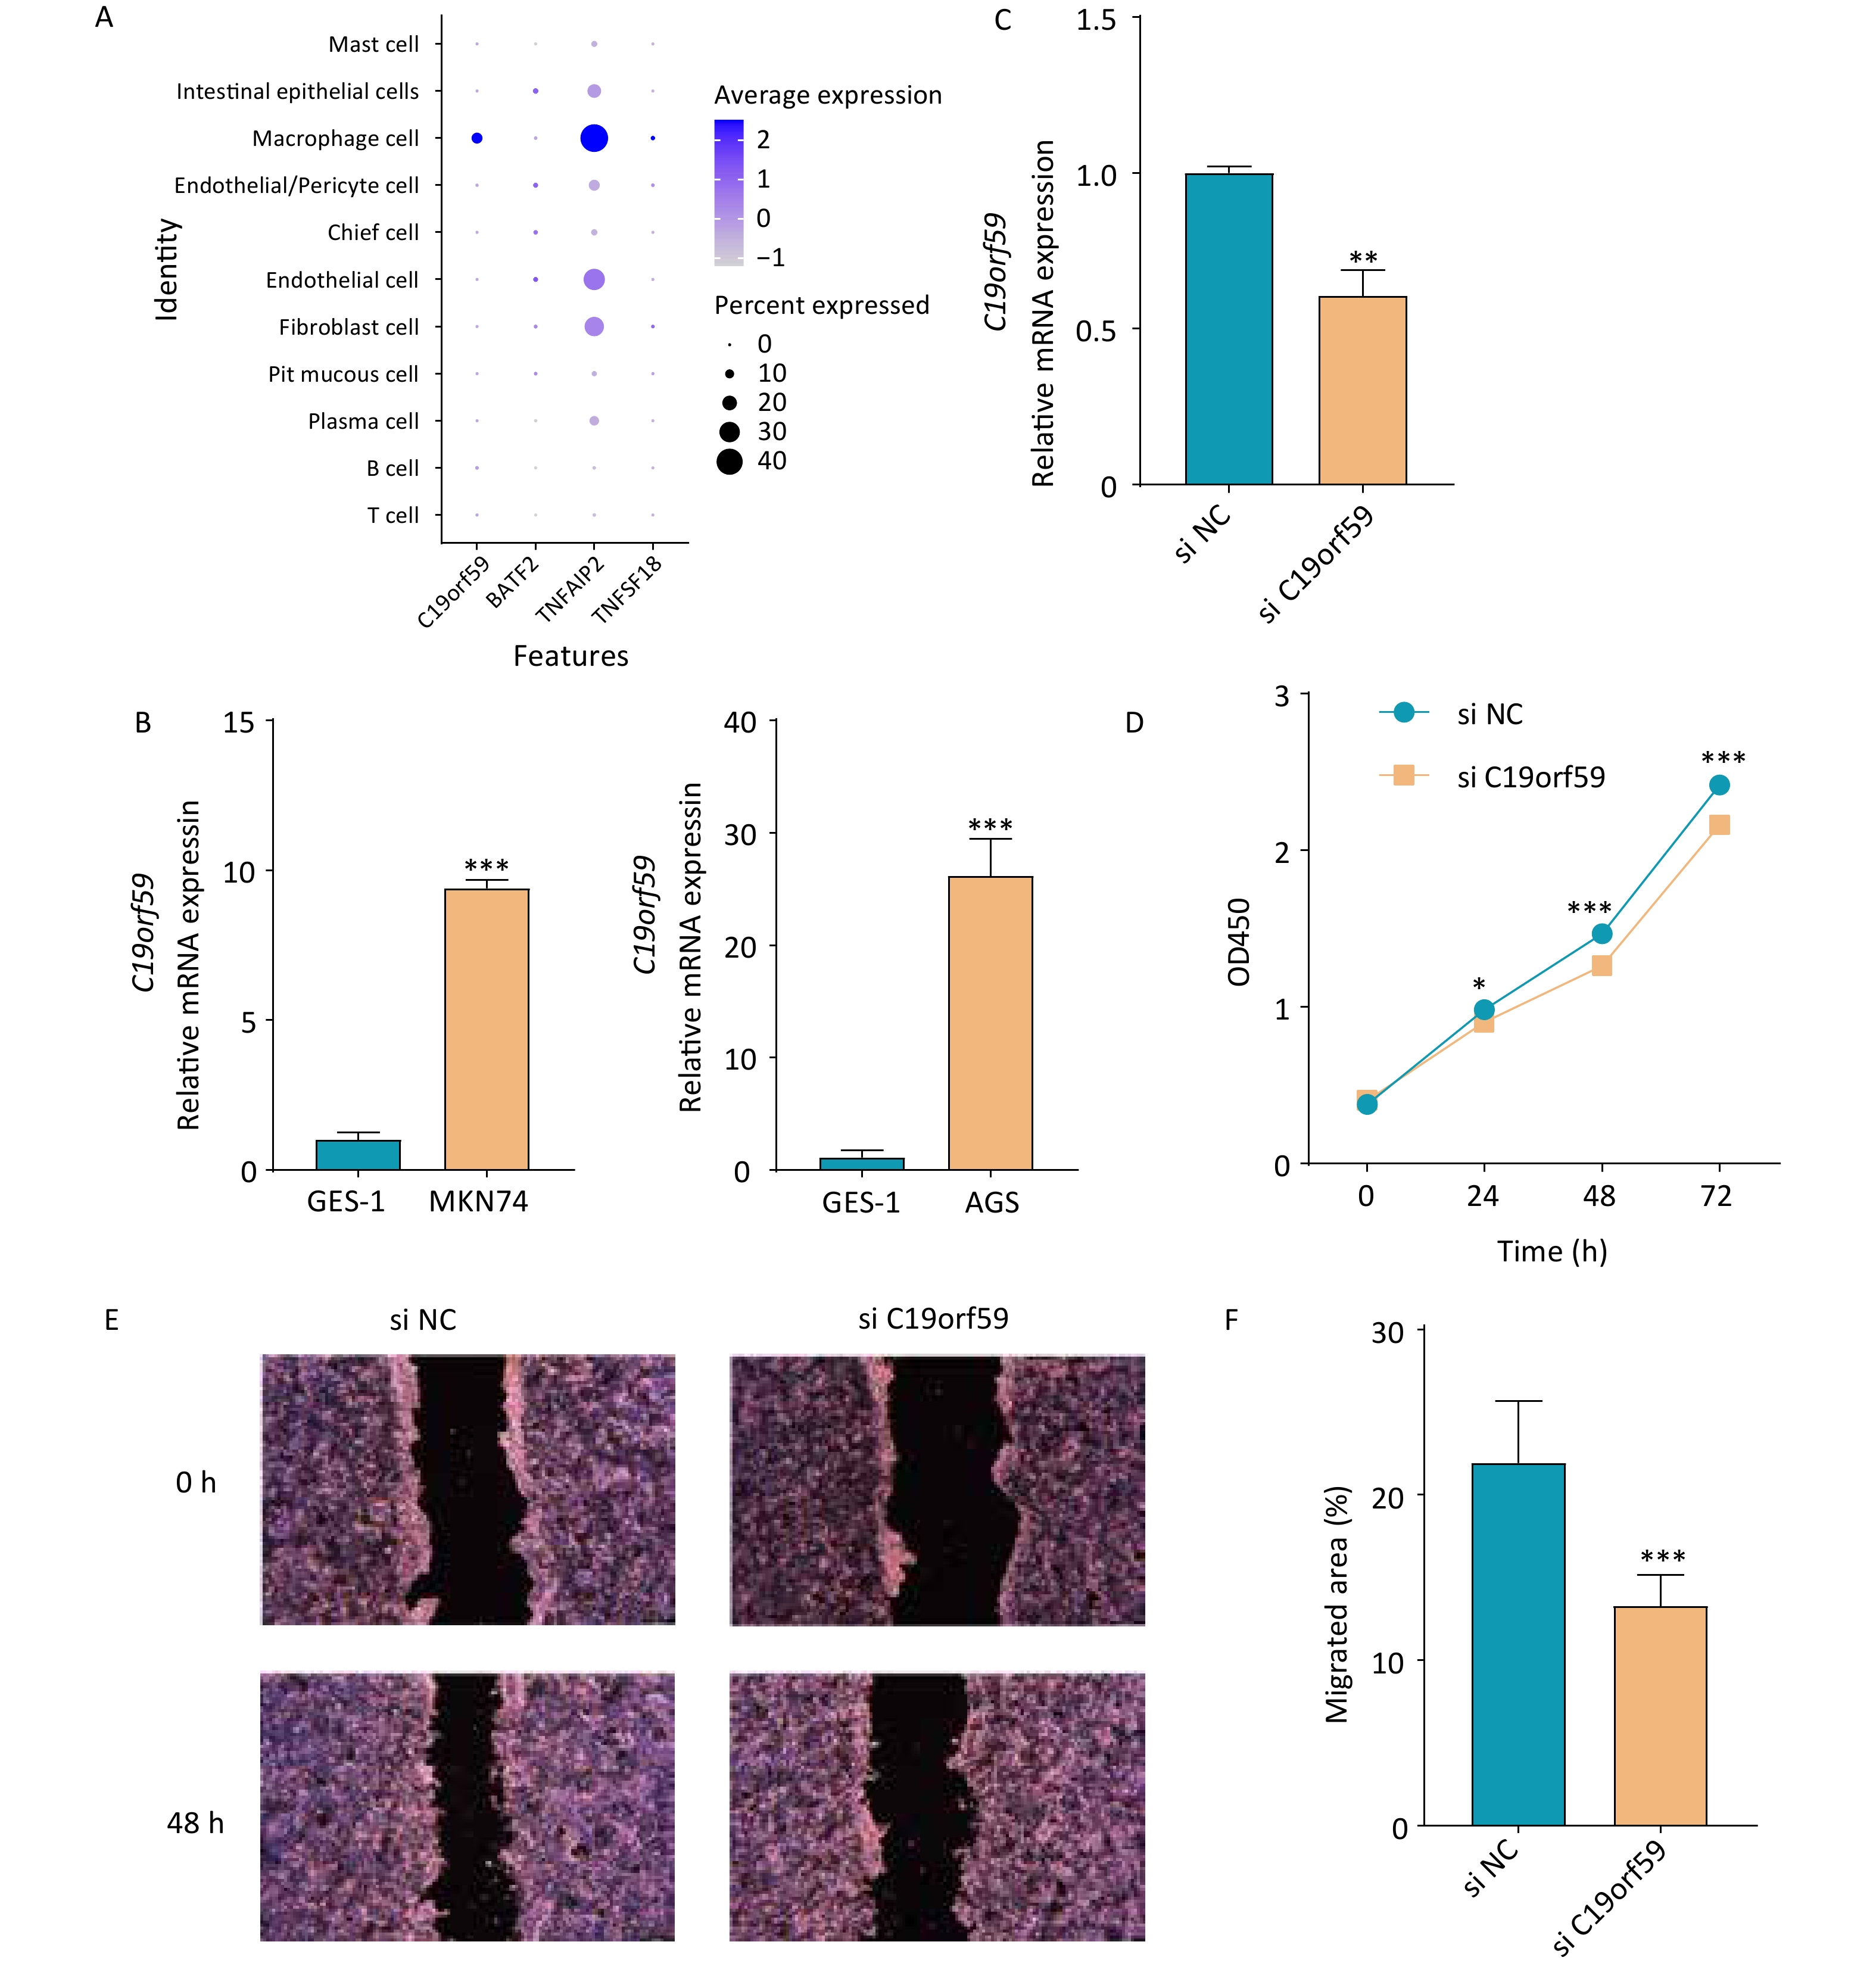
C19orf59 and TNFAIP2 were predominantly expressed in macrophage species at the single-cell level (Figure 7A). In addition, qPCR was conducted to assess the mRNA expression levels of C19orf59 in various cell lines. Notably, both gastric cancer cell lines exhibited significantly elevated expression of C19orf59 compared to the GES-1 cell line (Figure 7B). To further explore the biological role of C19orf59 in gastric cancer cells, we transfected siRNA targeting C19orf59 (si C19orf59) or negative control siRNA (si NC) into MKN74 cells. The transfection efficiency was validated using qPCR (Figure 7C). Subsequently, the results of the CCK-8 assay demonstrated that downregulation of C19orf59 markedly inhibited the proliferation ability of the MKN74 cells (Figure 7D). Moreover, the wound healing assay revealed an enhanced migration capacity of gastric cancer cells (Figures 7E, F). Taken together, these findings indicate that C19orf59 plays a crucial role in promoting the proliferation and migration of gastric cancer cells.
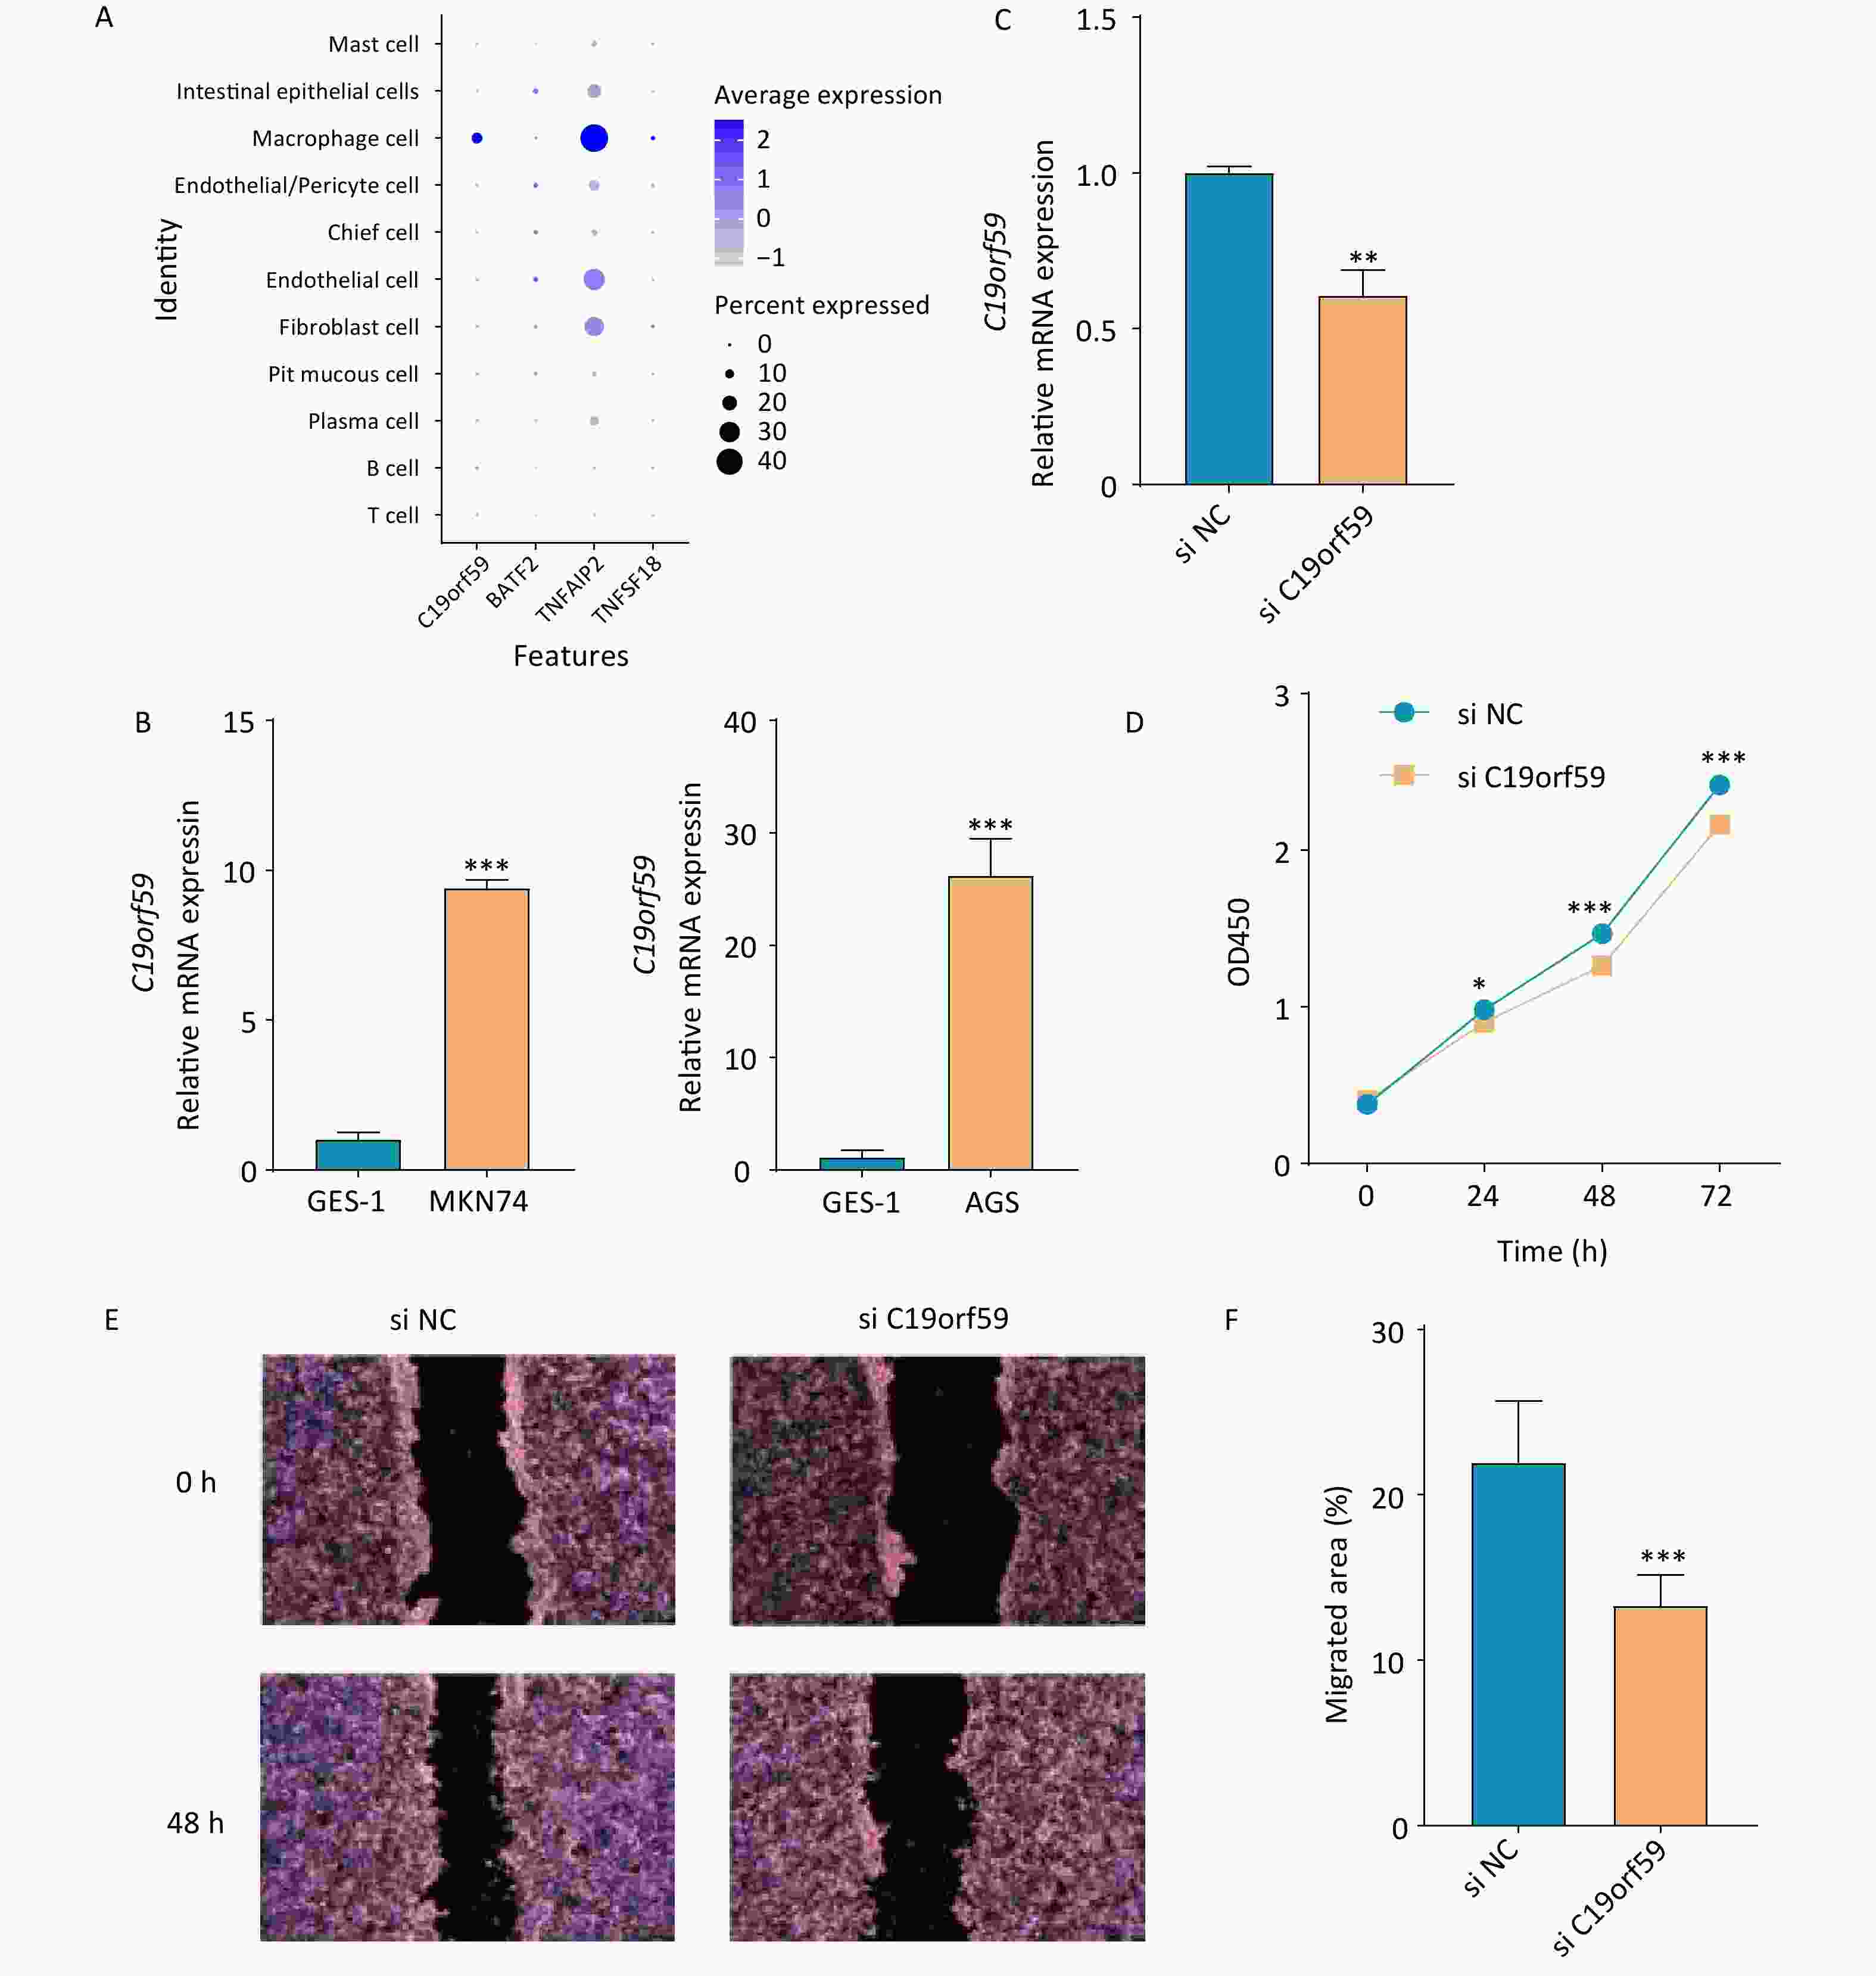
Figure 7. Verification of the expression of prognostic genes and the tumor-promoting role of the C19orf59 gene in gastric cancer cells. (A) The expression levels of the four prognostic signature genes in 11 cell types. (B) Relative mRNA expression of C19orf59 in cell lines identified using RT-qPCR (***P < 0.001). (C) C19orf59 small-interfering RNA (siRNA) transfection efficiency in MKN74 cells was assessed using qRT-PCR (**P < 0.01). (D) The results of CCK-8 assays suggested that knockdown of C19orf59 inhibits cells proliferation in MKN74 cells (*P < 0.05, ***P < 0.001). (E, F) The results of the wound-healing assays indicated that C19orf59 reduces cell migration in MKN74 cells (***P < 0.001).
-
Gastric cancer is typically diagnosed at an advanced stage and is associated with a poor prognosis, making it a significant contributor to global cancer mortality statistics. Identification of prognostic markers is crucial for timely diagnosis and treatment of gastric cancer[26]. To the best of our knowledge, this study is the first in which the expression patterns of genes associated with LDCD in patients with gastric cancer were analyzed and a unique risk model was constructed based on the findings. We constructed the prognostic model by incorporating four genes, including TNFSF18, TNFAIP2, C19orf59, and BATF2, and validated its excellent performance using an external cohort. The expressions and functions of these genes in patients with gastric cancer significantly affect prognosis and play important roles in tumorigenesis. The prognostic model showed good predictive performance, indicating that the model has strong predictive ability. Notably, we examined prognostic gene expression at the single-cell level.
TNFSF18 plays a crucial role in the occurrence and development of various tumors, including prostate cancer and esophageal cancer[27,28]. Ni et al. reported that the expression of TNFSF18 in gastric cancer is related to immune cell infiltration[29]. In addition, some previous studies have demonstrated the prognostic significance of TNFSF18 expression in patients with cancer. In the present study, analysis of data from TCGA and GEO revealed a strong correlation between TNFSF18 expression levels and the prognosis of gastric cancer. This finding provides new evidence of the potential of TNFSF18 as a prognostic marker for gastric cancer. TNFAIP2 is localized to 14q32.32 and produces a protein that comprises 654 amino acids[30]. Activation of TNFAIP2 is induced by certain cytokines such as TNF-α, IL-lβ, and interferon-γ, enabling participation in diverse physiological processes, including inflammation, cell differentiation, and proliferation[30]. TNFAIP2 is abnormally expressed in various cancers, such as lung cancer, and head and neck squamous carcinoma[31,32]. Li et al. reported that TNFAIP2 is highly expressed in gastric cancer and is associated with poor prognosis[33]. However, little is known about the effects of TNFAIP2 on gastric cancer. The present study showed that the expression level of TNFAIP2 is correlated with the prognosis of gastric cancer; however, the specific pathogenic mechanism underlying this correlation needs to be studied and confirmed in future research.
BATF2, a member of the basic leucine zipper transcription factor family, is associated with various cancers, including lung cancer, hepatocellular carcinoma, and colorectal carcinoma[34-36]. BATF2 promotes epithelial-mesenchymal transition and may serve as a prognostic biomarker and potential therapeutic target for lung adenocarcinoma metastasis[34]. Ma et al. indicated that low levels of BATF2 expression may be significantly correlated to an unfavorable prognosis in patients with hepatocellular carcinoma[35]. Expression of BATF2 is downregulated in patients with colorectal cancer, and its overexpression can accelerate cell apoptosis[36]. Xie et al. demonstrated that BATF2 is downregulated in gastric cancer tissues, and that elevated BATF2 expression can effectively inhibit the growth and metastasis of gastric cancer in vivo and in vitro[37]. These findings indicate that BATF2 may serve as a prognostic marker and a potential therapeutic target in gastric cancer. Consistent with these findings, the present study revealed an association between BATF2 expression and prognosis in patients with gastric cancer. C19orf59 is a protein that spans the entire length of the cell membrane and is expressed by mast cells and macrophages[38]. Although some studies on C19orf59 have been conducted, the exact function of C19orf59 has not been determined to date. Some of these previous studies demonstrated that downregulation of C19orf59 can inhibit monocyte proliferation, promote apoptosis, and suppress inflammation[39]. In addition, some studies have indicated that C19orf59 is highly expressed in gastric cancer tissues, and that the expression level is related to the prognosis of gastric cancer and may be a potential therapeutic target[40,41]. Consistent with these previous reports, the present study revealed that C19orf59 is correlated with the prognosis of patients with gastric cancer[41]. These findings suggest that C19orf59 may serve as a potential therapeutic biomarker for gastric cancer.
The TME is complex and continuously evolving. The TME includes tumor cells, immune cells, inflammatory cells, endothelial cells, mesenchymal stem cells, and tumor-associated fibroblasts, which play different roles in the proliferation, treatment resistance, and metastasis of tumor cells[42]. In the present study, risk score demonstrated significant correlations with TIME, immune cells, and immune checkpoint molecules. Immune infiltration and TIME are pivotal in the development of various tumors and can predict immune response to immunotherapy[43-45]. Our findings revealed that the high-risk group exhibited higher proportions of M2 macrophages and resting memory CD4+ T cells than the low-risk group. Tumor-associated macrophages with the M2 phenotype promote tumor proliferation, promote angiogenesis, and suppress adaptive immunity[46,47]. Several studies have indicated that the density of M2 macrophages is associated with poor prognosis in some cancers, such as renal cell carcinoma, glioma, and gastric cancer[48-50]. Li et al. demonstrated that M2 macrophages promote the migration and invasion of gastric cancer cells, whereas mesenchymal cells derived from gastric cancer induce the polarization of M2 macrophages[50]. In the present study, we observed high M2 macrophage infiltration in the high-risk group, consistent with the findings of previous research. Regarding T cells, memory CD4+ T cell is an important component of the TME and can affect the development of tumors. Ning et al. reported that patients with gastric cancer who show high numbers of resting memory CD4+ T cells have a poorer prognosis, a finding that is consistent with our results[51].
The results of this study indicate that patients with varying risk scores may exhibit different sensitivities to mitomycin C and paclitaxel therapy. Mitomycin C, a member of the mitomycins, was initially isolated from a fermentation culture of Streptomyces caespitosus[52,53]. Mitomycin C is an antitumor agent with applications in the treatment of gastric cancer, breast cancer, cervical cancer, prostate cancer, bladder cancer, and other malignancies[54,55]. Paclitaxel, a tricyclic diterpene compound, is one of the most effective and widely used natural anticancer drugs, largely due to its unique mechanism of action. Paclitaxel functions by preventing microtubule dissociation, inhibits mitosis, blocks cell cycle progression, and suppresses cancer cell growth[56,57]. Therefore, the findings of the present study regarding the correlation between risk score and mitomycin and paclitaxel have high clinical value.
The interaction between macrophages and tumor cells plays a key role in promoting tumor invasion and metastasis. Hanna et al. reported that membrane-based actin tunnel nanotubes, a novel intercellular communication mechanism between macrophages and tumor cells, can promote macrophage-dependent tumor cell invasion. In addition, TNFAIP2 in macrophages is associated with the extension and invasion ability of tumor cells[58]. The findings of the present study indicate that TNFAIP2 is predominantly expressed in macrophages; however, whether TNFAIP2 promotes the interaction between macrophages and tumor cells still needs to be verified in future studies.
This study has several limitations. First, our prognostic model was constructed and validated using retrospective data from public datasets. Therefore, evidence from future prospective studies is required to confirm the clinical value of our findings. Second, many important prognostic genes associated with gastric cancer may have been overlooked in this study because the inherent drawbacks of constructing a prognostic model based solely on signature genes were unavoidable. Third, we did not comprehensively investigate the combined effects of environmental factors, lifestyle, and family history on the onset of gastric cancer. Furthermore, the results of this study were not validated in vivo.
-
In conclusion, this study demonstrated that LDCD-related signature genes and risk score can predict prognosis in patients with gastric cancer. Moreover, the results of this study indicated that risk score is correlated with TIME and may be useful in immunotherapy and chemotherapy for gastric cancer.
HTML
Data Source
Differential Analysis and Gene Set Variation Analysis
Weighted Correlation Network Analysis and Enrichment Analysis
Construction and Validation of the Risk Model
Clinical Features and Independent Prognostic Analysis
Pathways Enrichment Analysis
Assessment of the TME and Immune Infiltration Analysis
Tumor Mutation Burden and Drug Sensitivity Analysis
Single-cell Sequencing Analysis
Cell Culture
RNA Interference
RNA Extraction, Reverse Transcription, and Quantitative Real-time Polymerase Chain Reaction
CCK8 Assay
Wound Healing Assay
Statistical Analysis
Identification and Enrichment Analysis of 95 Candidate Genes
Establishment and Evaluation of the Risk Model
Risk Score, Age, and TNM Stage as Independent Prognostic Factors for Gastric Cancer
Correlation between Risk Score and 28 KEGG Differential Pathways and Tumor Immune Microenvironment
Evaluation of the Mutation Profiles of Prognostic Genes and Drug Predictions
Identification of Three Key Cells from Single-Cell Sequencing Data Analysis
Verification of the Expression of Prognostic Genes at Different Levels
Competing Interests The authors declare that they have no conflict of interest.
Ethics Not applicable.
 24285+Supplementary Materials.pdf
|

|

 Quick Links
 DownLoad: