

 下载:
下载:


-
Nontuberculous mycobacteria (NTM) are widely distributed in soil, water, and animals[1-3]. Recently, the high emergence of NTM diseases in humans has attracted increased attention worldwide. Previous epidemiological data show that the prevalence of NTM infections has been increasing in several countries[4-6]. National surveys in China have reported that the proportion of NTM infections has increased from 11.1% in 1990 to 22.9% in 2010, indicating that the prevalence of NTM infections is a serious public health concern in this high-tuberculosis-burden country[7-8].
Mycobacterium avium complex (MAC), which predominantly consists of Mycobacterium avium (M. avium) and Mycobacterium intracellulare (M. intracellulare), is classified as slow-growing mycobacteria and is the most common pathogen causing human and animal NTM diseases[9-10]. As a member of MAC, M. avium is frequently isolated from patients with acquired immunodeficiency syndrome (AIDS), whereas M. intracellulare appears more likely to infect non-AIDS patients[11]. Moreover, patients infected with M. intracellulare show a more severe clinical presentation and a worse prognosis than patients infected with M. avium[12].
Drug susceptibility testing is essential for appropriate and effective treatment[13]. However, for the majority of the drugs being administered for MAC treatment, there is no susceptibility testing method recommended by the American Thoracic Society/Infectious Diseases Society of America (ATS/IDSA)[14]. Furthermore, there are limited data available on the differences in drug susceptibility profiles between M. avium and M. intracellulare[4].
Patients with MAC disease can be either infected with a given strain and relapse due to reactivation or reinfected by a different strain after cure[15]. In addition, the source of infection in humans has not yet been clearly identified. Therefore, a reliable technique for the epidemiological investigation and genotyping of MAC is of great importance. Multilocus variable number of tandem repeat (VNTR) analysis (MLVA) is considered as a gold standard for genotyping Mycobacterium tuberculosis (M. tuberculosis) isolates. Similar to genotying M. tuberculosis, the VNTR method has also been introduced to differentiate other mycobacterial species. Recently, two candidate locus sets were developed for genotyping M. avium and M. intracellulare isolates, respectively[15-16].
In this study, nucleotide sequencing was performed to differentiate M. avium and M. intracellulare, and broth microdilution method was used to test the drug susceptibility of clinical MAC strains collected from Shanghai Pulmonary Disease Hospital located in Shanghai against 20 antibiotics. In addition, VNTR typing was conducted to genotype these strains to evaluate the potential association between VNTR genotypes and drug resistance phenotypes and to provide guideline for the instruction of empirical clinical medication.
-
Patients diagnosed with an NTM lung disease were enrolled in this study between 2012 and 2014 from Shanghai Pulmonary Disease Hospital. All the strains isolated from sputum samples of these patients were identified as NTM using paranitrobenzoic acid and thiophene-2-carboxylic acid hydrazide (TCH) in solid media[17]. Sequencing of partial genes, including 16S rRNA, hsp65, rpoB, and the 16S-23S rRNA internal transcribed spacer, was performed to identify the strains at species level according to previous reports[18-19]. The protocols used in this study were approved by the Ethics Committee of the Chinese Center for Disease Control and Prevention. Informed consent was obtained from all patients whose sputum specimens were used in studies.
-
Antimicrobial susceptibility testing was performed at the National Tuberculosis Reference Laboratory against 20 antimicrobial agents, including clarithromycin (CLA), amikacin (AMK), moxifloxacin (MOX), linezolid (LZD), rifampin (RIF), rifabutin (RFB), ethambutol (EMB), tobramycin (TOB), meropenem (MEM), imipenem (IMP), cefoxitin (CFX), capreomycin (CAP), azithromycin (AZM), levofloxacin (LFX), gatifloxacin (GAT), minocycline (MIN), tigecycline (TIG), sulfamethoxazole (SFX), streptomycin (SM), and clofazimine (CFM). All the above mentioned agents were purchased from Sigma-Aldrich.
The minimal inhibitory concentration (MIC) of the antimicrobial agents was determined by broth microdilution method according to the guidelines of the Clinical and Laboratory Standards Institute (CLSI). The bacteria on the solid culture media were transferred to cation-adjusted Mueller-Hinton broth (CAMHB) containing 0.02% Tween 80. The suspension was mixed vigorously using a vortexmixer until the bacterial colonies were dispersed homogeneously. After keeping undisturbed for 15 min, the suspension was diluted to the density of a 0.5-McFarland standard using saline. The CAMHB medium (pH 7.3-7.4) supplemented with 5% OADC (oleic acid, albumin, dextrose, and catalase medium) was used to prepare the final inoculum (with an organism density of approximately 5 × 10⁵ CFU/mL), and then 100 μL bacterial suspension was added to the 96-well microtiter plates containing successive two-fold dilutions of the antimicrobial agents. The breakpoints for the following antimicrobial agents were recommended by the CLSI: clarithromycin ≥ 32 μg/mL, moxifloxacin ≥ 4 μg/mL, and linezolid ≥ 32 μg/mL. The breakpoints for some other antimicrobial agents were in accordance with previous studies as follows: rifampicin ≥ 8 μg/mL[20], ethambutol ≥ 8 μg/mL[21], amikacin ≥ 32 μg/mL[22], and capreomycin ≥ 16 μg/mL[23]. For other drugs, the breakpoints were according to Zhang[24]. M. avium ATCC700898 was used as quality control. The drug concentrations required to inhibit the growth of 50% and 90% of the tested strains were expressed as MIC50 and MIC90, respectively.
-
The primers and method recommended by Kenji et al. were used to genotype the M. avium and M. intracellulare isolates, respectively[15-16]. PCR mixtures were prepared using 2.5 μL genomic DNA, 2.5 µL 10 × PCR buffer, and 12.5 µmol/L of each primer, and then sterilized purified water was added to a total volume of 25 mL. The PCR conditions were as follows: initial denaturation at 95 ℃ for 10 min, 38 cycles of denaturation at 94 ℃ for 30 s, 60 ℃ for 30 s, and 72 ℃ for 1 min, followed by 7 min at 72 ℃ for final extension. The PCR products were subjected to 2% agar gel to determine their size. The allelic diversity was calculated according to Selander's formula[25], and the discriminatory powers of different VNTR loci typing were calculated by the Hunter-Gaston Discriminatory Index (HGDI)[26]. The VNTR data were analyzed using BioNumerics software. In addition, cluster analysis was performed in BioNumerics using the UPGMA coefficient.
-
SPSS v.14.0 (SPSS Inc.) was used to perform χ2 analysis, and P < 0.05 was defined as statistically significant.
-
A total of 393 NTM isolates were identified at species level using multilocus sequence analysis. M. intracellulare (132, 33.6%) was the most abundant organism, followed by the M. abscessus group (100, 25.4%), M. kansasii (82, 20.9%), M. avium (41, 10.4%), M. gordonae (26, 6.6%), and M. fortuitum (12, 3.1%). In total, 173 MAC isolates were used for further study, including 132 M. intracellulare and 41 M. avium isolates.
-
Antimicrobial susceptibility testing was performed on M. avium and M. intracellulare isolates. The range of MICs of each antimicrobial agent for M. avium and M. intracellulare is shown in Table 1. Clarithromycin and amikacin were the two most effective agents against both M. avium (97.6% and 97.6%, respectively) and M. intracellulare isolates (96.2% and 94.7%, respectively), with no significant difference between the species (P < 0.05). Compared with M. intracellulare isolates, lower rates of drug resistance to LZD, RIF, MEM, IMP, CFX, GAT, and SFX were observed in M. avium isolates (48.8% vs. 63.2%, P = 0.018 for LZD; 41.5% vs. 78.7%, P < 0.001 for RIF; 75.6% vs. 97.7%, P < 0.001 for MEM; 78.0% vs. 99.2%, P = 0.005 for IMP; 73.0% vs. 99.2%, P = 0.007 for CFX; 41.5% vs. 74.2%, P < 0.001 for GAT, and 48.8% vs. 87.1%, P < 0.001 for SFX), with a significant difference between these two species (P < 0.05). In addition, MOX (34.1% vs. 33.1%), AZM (70.7% vs. 60.6%), and RFB (36.6% vs. 26.5%) exhibited higher activity against M. intracellulare than against M. avium isolates, but there was no statistical difference between these two species (P > 0.05).
Table 1. In Vitro Antibiotic Susceptibility of 41 M. avium and 132 M. intracellulare Isolates by Broth Microdilution Method
Antimicrobial Agent M. avium (n = 41) M. intracellulare (n = 132) χ2 P MIC50a (μg/mL) MIC90a (μg/mL) %Resistant Strainsb MIC50a (μg/mL) MIC90a (μg/mL) %Resistant Strainsb CLA 2 16 2.4 1 16 3.8 0.096 0.756 AMK 16 32 2.4 16 32 5.3 0.673 0.412 MOX 2 4 34.1 2 4 33.1 1.186 0.276 LZD 16 64 48.8 32 64 63.2 5.570 0.018 RIF 4 64 41.5 8 64 78.7 29.360 0.000 EMB 4 64 36.6 4 16 45.6 1.668 0.196 CAP 4 32 39.0 4 64 50.0 1.511 0.219 TOB 4 16 36.6 4 32 41.7 0.655 0.418 MEM 64 256 75.6 256 256 97.7 15.111 0.000 IMP 256 256 78.0 256 256 99.2 7.800 0.005 CFX 256 256 73.0 256 256 99.2 7.352 0.007 AZM 32 64 70.7 32 64 60.6 1.376 0.241 LFX 16 32 82.9 16 32 90.9 1.182 0.277 GAT 2 8 41.5 4 8 74.2 12.623 0.000 MIN 8 16 73.1 16 32 82.6 1.808 0.179 TIG 64 64 97.6 64 64 99.2 0.774 0.379 SFX 32 256 48.8 128 256 87.1 26.829 0.000 SM 16 64 90.2 16 64 92.4 0.095 0.758 CFM 1 16 39.0 1 32 43.2 0.222 0.638 RFB 0.125 32 36.6 0.25 32 26.5 1.544 0.214 Note. aMIC50 represents the concentration required to inhibit the growth of 50% of the strains; MIC90 represents the concentration required to inhibit the growth of 90% of the strains. bThe breakpoints to establish susceptibility and resistance were followed as recommended by the Clinical and Laboratory Standards Institute (CLSI-M24-A2). -
A total of 41 M. avium strains were genotyped by 13 M. avium tandem repeat (MATR) loci combinations recommended by Kenji, except MATR-9 and MATR-12, which cannot be amplified for most DNA extracts, even when different conditions were attempted, and these two loci were excluded for further analysis. Using this method, the 41 isolates were differentiated into six clusters (two isolates per cluster) and 29 unique genotypes. As shown in Figure 1, of the 13 MATR loci, six loci (MATR-2, -3, -4, -6, -7, and -8) had a high diversity index (h ≥ 0.5); five loci (MATR-1, -5, -11, -13, and -16) achieved a medium diversity index (0.5 > h ≥ 0.1); and MATR-14 and -15 had a low diversity index (h < 0.1). The cumulative cluster rate was 14.6%, and the HGDI value for the VNTR typing of M. avium isolates was 0.993 as shown in Table 2, indicating that the VNTR analysis was capable of high discriminatory power.
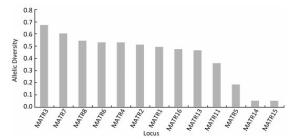
Figure 1. VNTR allelic distribution in 41 M. avium clinical isolates.
Table 2. Discriminatory Index and Clustering Rate of VNTR Applied to MAC Strains
Organism Total Isolates (n) Clustered Isolates (n) Isolates in Each Cluster (n) Clustering Rate/% HGDIa M. avium 41 12 2 14.6 0.993 M. intracellulare 132 48 2-5 22.0 0.995 Note. aHGDI = Hunter-Gaston Discriminatory Index. The 132 M. intracellulare isolates were classified into 88 genotypes by 16-locus MIRU-VNTR as recommended by Kenji, including 48 isolates from 19 clusters (2-5 isolates per cluster) and 84 isolates with unique patterns; the cumulative cluster rate was 22.0%, and the HGDI value was 0.995 as shown in Table 2. As shown in Figure 2, of the 16 VNTR loci, VNTR-7 and VNTR-11 were classified as lowly discriminating (h < 0.1), and the remaining 14 loci were defined as highly discriminating (h ≥ 0.5).
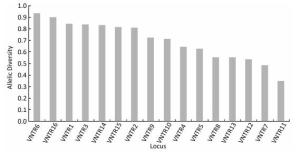
Figure 2. VNTR allelic distribution in 132 M. intracellulare clinical isolates.
-
As shown in Table 3, of the 12 clustered and 29 unclustered isolates of M. avium, the proportion of isolates resistant to CAP (41.7% vs. 37.9%), AZM (75.0% vs. 69.0%), LFX (100.0% vs. 75.9%), SM (91.7% vs. 62.1%), MEM (83.3% vs. 72.4%), and CFX (75.0% vs. 72.4%) was higher than that of unclustered isolates, but there was no significant difference (P > 0.05). The resistance rate of other drugs in unclustered isolates was higher than that in clustered isolates, and the difference was not significant (P > 0.05).
Table 3. Drug Susceptibility Profiles of Clustered and Unclustered Strains of M. avium
Drug Clustered (12 isolates) Unclustered (29 isolates) χ2 P No.(%) of Sensitive Strains No.(%) of Resistant Strains No.(%) of Sensitive Strains No.(%) of Resistant Strains CLA 10 (83.3) 0 (0.0) 23 (79.3) 1 (3.4) 0.429 0.512 AMK 10 (83.3) 0 (0.0) 26 (89.7) 1 (3.4) 0.381 0.537 MOX 4 (33.3) 3 (25.0) 10 (34.5) 11 (37.9) 0.190 0.663 LZD 4 (33.3) 4 (33.3) 9 (31.0) 16 (55.2) 0.498 0.481 CAP 7 (58.3) 5 (41.7) 18 (62.1) 11 (37.9) 0.050 0.823 AZM 3 (25.0) 9 (75.0) 9 (31.0) 20 (69.0) 0.149 0.699 LFX 0 (0.0) 12 (100.0) 4 (33.3) 22 (75.9) 2.063 0.151 GAT 4 (33.3) 4 (33.3) 10 (34.5) 13 (44.8) 0.102 0.750 SM 1 (8.3) 11 (91.7) 11 (37.9) 18 (62.1) 3.592 0.058 CFM 9 (75.0) 3 (25.0) 16 (55.2) 13 (44.8) 1.402 0.236 TOB 6 (50.0) 4 (33.3) 10 (34.5) 11 (37.9) 0.416 0.519 MEM 0 (0.0) 10 (83.3) 4 (33.3) 21 (72.4) 1.806 0.179 IMP 1 (8.3) 6 (50.0) 1 (3.4) 26 (89.7) 1.124 0.289 CFX 3 (25.0) 9 (75.0) 8 (27.6) 21 (72.4) 0.029 0.865 MIN 0 (0.0) 8 (66.7) 2 (6.9) 22 (75.9) 0.711 0.399 RFB 8 (66.7) 4 (33.3) 18 (62.1) 11 (37.9) 0.077 0.781 SFX 9 (75.0) 3 (25.0) 12 (41.4) 17 (58.6) 3.840 0.050 RIF 8 (66.7) 4 (33.3) 16 (55.2) 13 (44.8) 0.462 0.497 EMB 8 (66.7) 4 (33.3) 18 (62.1) 11 (37.9) 0.077 0.781 As shown in Table 4, among the 48 clustered and 84 unclustered strains of M. intracellulare, CLA (4.2% vs. 3.6%), LZD (75.0% vs. 57.1%), GAT (77.1% vs. 72.6%), SM (95.8% vs. 90.5%), and CFM (50.0% vs. 39.3%) showed higher resistance rates in clustered isolates than that in unclustered isolates, with no significant difference (P > 0.05). Statistical analysis revealed that the percentage of LFX-resistant isolates was significantly higher in unclustered isolates than that in clustered isolates (P = 0.004).
Table 4. Drug Susceptibility Profiles of Clustered and Unclustered Strains of M. intracellulare
Drug Clustered (48 isolates) Unclustered (84 isolates) χ 2 P No.(%) of Sensitive Strains No.(%) of Resistant Strains No.(%) of Sensitive Strains No.(%) of Resistant Strains CLA 45 (93.8) 2 (4.2) 77 (91.7) 3 (3.6) 0.020 0.888 AMK 40 (83.3) 1 (2.1) 66 (78.6) 6 (7.1) 1.562 0.211 MOX 9 (18.8) 15 (31.3) 18 (21.4) 29 (34.5) 0.004 0.948 LZD 4 (8.3) 36 (75.0) 16 (19.0) 48 (57.1) 3.566 0.059 CAP 29 (60.4) 19 (39.6) 37 (44.0) 47 (56.0) 3.274 0.070 AZM 21 (43.8) 27 (56.3) 31 (36.9) 53 (63.1) 0.599 0.439 LFX 6 (12.5) 39 (81.3) 1 (1.2) 81 (96.4) 8.187 0.004 GAT 6 (12.5) 37 (77.1) 12 (14.3) 61 (72.6) 0.127 0.721 SM 2 (4.2) 46 (95.8) 8 (9.5) 76 (90.5) 1.252 0.263 CFM 24 (50.0) 24 (50.0) 51 (60.7) 33 (39.3) 1.429 0.232 TOB 15 (31.3) 20 (41.7) 27 (32.1) 35 (41.7) 0.004 0.947 CFX 0 (0.0) 48 (100.0) 1 (1.2) 83 (98.8) 0.576 0.448 MIN 0 (0.0) 42 (87.5) 2 (2.4) 67 (80.0) 1.240 0.266 RFB 35 (72.9) 13 (27.1) 62 (73.8) 22 (26.2) 0.012 0.911 SFX 6 (12.5) 42 (87.5) 11 (13.1) 73 (86.9) 0.010 0.922 RIF 14 (29.2) 34 (70.8) 13 (15.5) 71 (84.5) 3.519 0.061 EMB 28 (58.3) 20 (41.7) 42 (50.0) 42 (50.0) 0.852 0.356 -
MAC, the most frequently isolated NTM in clinical samples, serves as the major pathogen for chronic obstructive pulmonary disease, cystic fibrosis, and immunodeficiency diseases[27]. In the USA, Japan, and South Korea, MAC was reported to be the most common pathogen associated with NTM lung diseases[5, 28-29]. According to a series of studies, MAC was also the most common cause of NTM lung diseases in China[30]. The overall rate of NTM isolated from mycobacterial culture-positive patients in Shanghai showed a significantly increasing trend from 3.0% in 2008 to 8.5% in 2012, and the second frequently identified organism was M. intracellulare[31]. The treatment failure rate of MAC was as high as 20%-40%[32], which may be attributed to the low level of response to conventional antimicrobial agents. Therefore, antimicrobial susceptibility testing is essential for effective treatment of nontuberculosis diseases. In this study, we performed the drug susceptibility testing of clinical MAC isolates against 20 antimicrobial agents and evaluated the potential association between VNTR genotypes and drug susceptibility profiles.
The results of our study provided new information on the candidate antimicrobial agents against MAC. As the major therapeutic agent for the treatment of MAC lung diseases, the macrolides have shown excellent in vitro activity against MAC isolates[33-34]. Consistent with previous studies[33-34], clarithromycin showed better in vitro activity against MAC. Of the three quinolones tested in this study, moxifloxacin exhibited better antimicrobial activity against MAC than the other drugs. This finding is in agreement with several other investigations regarding the stronger activity of moxifloxacin[35]. Regarding the antimicrobial activity of three injectable agents, we found that amikacin had better antimicrobial activity than those of capreomycin and streptomycin against MAC, which is also in line with previous research[36]. Clarithromycin, combined with ethambutol and rifampicin, is the treatment regimen for MAC diseases as recommended by the ATS/IDSA[37]. In our study, the percentages of ethambutol-resistant and rifampicin-resistant strains among M. avium were lower than those among M. intracellulare, in accordance with the study of Zhang et al.[38]. However, Guthertz's study showed that M. intracellulare was more susceptible than M. avium to ethambutol and rifampicin[39]. The different observations may be due to the test methods or the applied breakpoint concentrations. Moreover, our study demonstrated that rifabutin was more active than rifampicin against MAC, which was similar to a previous research[38], indicating that MAC-infected patients may achieve a more effective therapeutic result by replacing rifampicin with rifabutin during the treatment.
Our study showed that the 13-loci VNTR typing of M. avium and the 16-loci VNTR analysis of M. intracellulare had a high discriminatory power with HGDI values of 0.993 and 0.995, respectively, exceeding those previously observed in Japanese isolates (HGDI = 0.990 and 0.994, respectively). The allelic diversity for most loci of M. avium was similar to that in a previous report[15-16]; however, the discriminatory indexes of MATR-4 and -14 were different, with diversity indexes of 0.096 and 0.48 in Japan versus 0.532 and 0.049 in China, respectively. Except for VNTR-4, -7, and -11, the remaining loci had a higher discriminatory power in China than that in Japan. One possible explanation was that the strains were incongruent in different regions, and the distinguishing ability was different for some loci.
To our knowledge, there are fewer reports from China comparing the association between the genotypes and drug resistance phenotypes for M. avium and M. intracellulare strains with such a large sample size. We observed that LFX resistance was more common among the unclustered strains than among the clustered strains of M. intracellulare. In a previous study, Wei et al. reported that rifampicin resistance was more common among the unclustered strains than among the clustered strains of M. avium[14]. Although NTM are regarded as opportunistic bacteria that cause infections in immunocompromised or immunocompetent people with some predisposing factors[40], the resistance to LFX may be related to the pathogenicity and host preference for M. intracellulare isolates, leading to the bias distribution of LFX resistance in M. intracellulare isolates.
This study has several limitations. First, as the number of the isolates was relatively small, it may be not sufficient to detect the differences between clusters. Second, the synergy effect among different drugs was not tested in this study. Third, the relationship between specific single nucleotide polymorphisms and drug resistance of MAC was not analyzed.
In conclusion, the results of the present study illustrated that M. intracellulare was the most common NTM species in China. Clarithromycin and amikacin had high antimicrobial activities against MAC, and resistance to LZD, RIF, MEM, IMP, FOX, GAT, and SFX was more common among M. intracellulare than among M. avium isolates. In addition, the 13-loci and 16-loci VNTR typing of M. avium and M. intracellulare revealed a high discriminatory power with HGDI values of 0.993 and 0.995, respectively. LFX resistance was more common among the unclustered strains than among the clustered strains of M. intracellulare. The large variations in the drug resistance spectrum within the MAC isolates to currently available antimicrobial agents imply that a differentiation of subspecies should be performed to optimize the empirical treatment.
-
We thank Dr. CHEN Jin (Shanghai Pulmonary Disease Hospital) for providing M. avium complex clinical strains. We also thank all the staff of the National Tuberculosis Reference Laboratory of China for their technical assistance.
doi: 10.3967/bes2017.068
Comparing the Genotype and Drug Susceptibilities between Mycobacterium avium and Mycobacterium intracellulare in China
-
Abstract:
Objective Mycobacterium avium(M.avium) and Mycobacterium intracellulare(M.intracellulare) are the major causative agents of nontuberculous mycobacteria (NTM)-related pulmonary infections.However, little is known about the differences in drug susceptibility profiles between these two species. Methods A total of 393 NTM isolates were collected from Shanghai Pulmonary Disease Hospital.Sequencing of partial genes was performed to identify the strains at species level.The minimum inhibitory concentration (MIC) was used to evaluate the drug susceptibility against 20 antimicrobial agents.Variable number of tandem repeat (VNTR) typing was conducted to genotype these two species. Results A total of 173(44.0%)M.avium complex (MAC) isolates were identified, including 41(10.4%)M.avium isolates and 132(33.6%)M.intracellulare isolates.Clarithromycin and amikacin were the two most effective agents against MAC isolates.The Hunter-Gaston Discriminatory Index (HGDI) values for VNTR typing of M.avium and M.intracellulare isolates were 0.993 and 0.995, respectively.Levofloxacin resistance was more common among the unclustered strains than among the clustered strains of M.intracellulare. Conclusion M.intracellulare was the most common NTM species in China.Clarithromycin and amikacin had high antimicrobial activities against MAC.VNTR typing of MAC isolates revealed a high discriminatory power.Levofloxacin resistance was associated with unclustered strains of M.intracellulare. -
Key words:
- Nontuberculous mycobacterium /
- Phenotype /
- Genotype /
- Susceptibility /
- Resistance
-
Table 1. In Vitro Antibiotic Susceptibility of 41 M. avium and 132 M. intracellulare Isolates by Broth Microdilution Method
Antimicrobial Agent M. avium (n = 41) M. intracellulare (n = 132) χ2 P MIC50a (μg/mL) MIC90a (μg/mL) %Resistant Strainsb MIC50a (μg/mL) MIC90a (μg/mL) %Resistant Strainsb CLA 2 16 2.4 1 16 3.8 0.096 0.756 AMK 16 32 2.4 16 32 5.3 0.673 0.412 MOX 2 4 34.1 2 4 33.1 1.186 0.276 LZD 16 64 48.8 32 64 63.2 5.570 0.018 RIF 4 64 41.5 8 64 78.7 29.360 0.000 EMB 4 64 36.6 4 16 45.6 1.668 0.196 CAP 4 32 39.0 4 64 50.0 1.511 0.219 TOB 4 16 36.6 4 32 41.7 0.655 0.418 MEM 64 256 75.6 256 256 97.7 15.111 0.000 IMP 256 256 78.0 256 256 99.2 7.800 0.005 CFX 256 256 73.0 256 256 99.2 7.352 0.007 AZM 32 64 70.7 32 64 60.6 1.376 0.241 LFX 16 32 82.9 16 32 90.9 1.182 0.277 GAT 2 8 41.5 4 8 74.2 12.623 0.000 MIN 8 16 73.1 16 32 82.6 1.808 0.179 TIG 64 64 97.6 64 64 99.2 0.774 0.379 SFX 32 256 48.8 128 256 87.1 26.829 0.000 SM 16 64 90.2 16 64 92.4 0.095 0.758 CFM 1 16 39.0 1 32 43.2 0.222 0.638 RFB 0.125 32 36.6 0.25 32 26.5 1.544 0.214 Note. aMIC50 represents the concentration required to inhibit the growth of 50% of the strains; MIC90 represents the concentration required to inhibit the growth of 90% of the strains. bThe breakpoints to establish susceptibility and resistance were followed as recommended by the Clinical and Laboratory Standards Institute (CLSI-M24-A2).  下载: 导出CSV
Table 2. Discriminatory Index and Clustering Rate of VNTR Applied to MAC Strains
Organism Total Isolates (n) Clustered Isolates (n) Isolates in Each Cluster (n) Clustering Rate/% HGDIa M. avium 41 12 2 14.6 0.993 M. intracellulare 132 48 2-5 22.0 0.995 Note. aHGDI = Hunter-Gaston Discriminatory Index.
下载: 导出CSV
Table 3. Drug Susceptibility Profiles of Clustered and Unclustered Strains of M. avium
Drug Clustered (12 isolates) Unclustered (29 isolates) χ2 P No.(%) of Sensitive Strains No.(%) of Resistant Strains No.(%) of Sensitive Strains No.(%) of Resistant Strains CLA 10 (83.3) 0 (0.0) 23 (79.3) 1 (3.4) 0.429 0.512 AMK 10 (83.3) 0 (0.0) 26 (89.7) 1 (3.4) 0.381 0.537 MOX 4 (33.3) 3 (25.0) 10 (34.5) 11 (37.9) 0.190 0.663 LZD 4 (33.3) 4 (33.3) 9 (31.0) 16 (55.2) 0.498 0.481 CAP 7 (58.3) 5 (41.7) 18 (62.1) 11 (37.9) 0.050 0.823 AZM 3 (25.0) 9 (75.0) 9 (31.0) 20 (69.0) 0.149 0.699 LFX 0 (0.0) 12 (100.0) 4 (33.3) 22 (75.9) 2.063 0.151 GAT 4 (33.3) 4 (33.3) 10 (34.5) 13 (44.8) 0.102 0.750 SM 1 (8.3) 11 (91.7) 11 (37.9) 18 (62.1) 3.592 0.058 CFM 9 (75.0) 3 (25.0) 16 (55.2) 13 (44.8) 1.402 0.236 TOB 6 (50.0) 4 (33.3) 10 (34.5) 11 (37.9) 0.416 0.519 MEM 0 (0.0) 10 (83.3) 4 (33.3) 21 (72.4) 1.806 0.179 IMP 1 (8.3) 6 (50.0) 1 (3.4) 26 (89.7) 1.124 0.289 CFX 3 (25.0) 9 (75.0) 8 (27.6) 21 (72.4) 0.029 0.865 MIN 0 (0.0) 8 (66.7) 2 (6.9) 22 (75.9) 0.711 0.399 RFB 8 (66.7) 4 (33.3) 18 (62.1) 11 (37.9) 0.077 0.781 SFX 9 (75.0) 3 (25.0) 12 (41.4) 17 (58.6) 3.840 0.050 RIF 8 (66.7) 4 (33.3) 16 (55.2) 13 (44.8) 0.462 0.497 EMB 8 (66.7) 4 (33.3) 18 (62.1) 11 (37.9) 0.077 0.781
下载: 导出CSV
Table 4. Drug Susceptibility Profiles of Clustered and Unclustered Strains of M. intracellulare
Drug Clustered (48 isolates) Unclustered (84 isolates) χ 2 P No.(%) of Sensitive Strains No.(%) of Resistant Strains No.(%) of Sensitive Strains No.(%) of Resistant Strains CLA 45 (93.8) 2 (4.2) 77 (91.7) 3 (3.6) 0.020 0.888 AMK 40 (83.3) 1 (2.1) 66 (78.6) 6 (7.1) 1.562 0.211 MOX 9 (18.8) 15 (31.3) 18 (21.4) 29 (34.5) 0.004 0.948 LZD 4 (8.3) 36 (75.0) 16 (19.0) 48 (57.1) 3.566 0.059 CAP 29 (60.4) 19 (39.6) 37 (44.0) 47 (56.0) 3.274 0.070 AZM 21 (43.8) 27 (56.3) 31 (36.9) 53 (63.1) 0.599 0.439 LFX 6 (12.5) 39 (81.3) 1 (1.2) 81 (96.4) 8.187 0.004 GAT 6 (12.5) 37 (77.1) 12 (14.3) 61 (72.6) 0.127 0.721 SM 2 (4.2) 46 (95.8) 8 (9.5) 76 (90.5) 1.252 0.263 CFM 24 (50.0) 24 (50.0) 51 (60.7) 33 (39.3) 1.429 0.232 TOB 15 (31.3) 20 (41.7) 27 (32.1) 35 (41.7) 0.004 0.947 CFX 0 (0.0) 48 (100.0) 1 (1.2) 83 (98.8) 0.576 0.448 MIN 0 (0.0) 42 (87.5) 2 (2.4) 67 (80.0) 1.240 0.266 RFB 35 (72.9) 13 (27.1) 62 (73.8) 22 (26.2) 0.012 0.911 SFX 6 (12.5) 42 (87.5) 11 (13.1) 73 (86.9) 0.010 0.922 RIF 14 (29.2) 34 (70.8) 13 (15.5) 71 (84.5) 3.519 0.061 EMB 28 (58.3) 20 (41.7) 42 (50.0) 42 (50.0) 0.852 0.356
下载: 导出CSV
-
[1] Bauer J, Andersen AB, Askgaard D, et al. Typing of clinical Mycobacterium avium complex strains cultured during a 2-year period in Denmark by using IS1245. J Clin Microbiol, 1999; 37, 600-5. http://jcm.asm.org/content/37/3/600.short?related-urls=yes&legid=jcm;37/3/600&cited-by=yes&legid=jcm;37/3/600 [2] Dvorska L, Bartos M, Ostadal O, et al. IS1311 and IS1245 restriction fragment length polymorphism analyses, serotypes, and drug susceptibilities of Mycobacterium avium complex isolates obtained from a human immunodeficiency virus-negative patient. J Clin Microbiol, 2002; 40, 3712-9. doi: 10.1128/JCM.40.10.3712-3719.2002 [3] De Groote MA, Pace NR, Fulton K, et al. Relationships between Mycobacterium isolates from patients with pulmonary mycobacterial infection and potting soils. Appl Environ Microbiol, 2006; 72, 7602-6. doi: 10.1128/AEM.00930-06 [4] Daley CL, Griffith DE. Pulmonary non-tuberculous mycobacterial infections. Int J Tuberc Lung Dis, 2010; 14, 665-71. https://www.ncbi.nlm.nih.gov/pubmed/20487602 [5] Simons S, van Ingen J, Hsueh PR, et al. Nontuberculous mycobacteria in respiratory tract infections, eastern Asia. Emerg Infect Dis, 2011; 17, 343-9. doi: 10.3201/eid170310060 [6] Kim SY, Lee ST, Jeong BH, et al. Genotyping of Mycobacterium intracellulare isolates and clinical characteristics of lung disease. Int J Tuberc Lung Dis, 2013; 17, 669-75. doi: 10.5588/ijtld.12.0575 [7] Xu HB, Jiang RH, Li L. Treatment outcomes for Mycobacterium avium complex: a systematic review and meta-analysis. Eur J Clin Microbiol Infect Dis, 2014; 33, 347-58. doi: 10.1007/s10096-013-1962-1 [8] Wang L, Zhang H, Ruan Y, et al. Tuberculosis prevalence in China, 1990-2010; a longitudinal analysis of national survey data. Lancet, 2014; 383, 2057-64. doi: 10.1016/S0140-6736(13)62639-2 [9] Maekura R, Okuda Y, Hirotani A, et al. Clinical and prognostic importance of serotyping Mycobacterium avium-Mycobacterium intracellulare complex isolates in human immunodeficiency virus-negative patients. J Clin Microbiol, 2005; 43, 3150-8. doi: 10.1128/JCM.43.7.3150-3158.2005 [10] Marras TK, Daley CL. Epidemiology of human pulmonary infection with nontuberculous mycobacteria. Clin Chest Med, 2002; 23, 553-67. doi: 10.1016/S0272-5231(02)00019-9 [11] Han XY, Tarrand JJ, Infante R, et al. Clinical significance and epidemiologic analyses of Mycobacterium avium and Mycobacterium intracellulare among patients without AIDS. J Clin Microbiol, 2005; 43, 4407-12. doi: 10.1128/JCM.43.9.4407-4412.2005 [12] Koh WJ, Jeong BH, Jeon K, et al. Clinical significance of the differentiation between Mycobacterium avium and Mycobacterium intracellulare in M avium complex lung disease. Chest, 2012; 142, 1482-8. doi: 10.1378/chest.12-0494 [13] Glassroth J. Pulmonary disease due to nontuberculous mycobacteria. Chest, 2008; 133, 243-51. doi: 10.1378/chest.07-0358 [14] Wei G, Huang M, Wang G, et al. Antimicrobial susceptibility testing and genotyping of Mycobacterium avium isolates of two tertiary tuberculosis designated hospital, China. Infect Genet Evol, 2015; 36, 141-6. doi: 10.1016/j.meegid.2015.09.015 [15] Ichikawa K, Yagi T, Inagaki T, et al. Molecular typing of Mycobacterium intracellulare using multilocus variable-number of tandem-repeat analysis: identification of loci and analysis of clinical isolates. Microbiology, 2010; 156, 496-504. doi: 10.1099/mic.0.030684-0 [16] Inagaki T, Nishimori K, Yagi T, et al. Comparison of a variable-number tandem-repeat (VNTR) method for typing Mycobacterium avium with mycobacterial interspersed repetitive-unit-VNTR and IS1245 restriction fragment length polymorphism typing. J Clin Microbiol, 2009; 47, 2156-64. doi: 10.1128/JCM.02373-08 [17] Pang Y, Zhou Y, Zhao B, et al. Spoligotyping and drug resistance analysis of Mycobacterium tuberculosis strains from national survey in China. PLoS One, 2012; 7, e32976. doi: 10.1371/journal.pone.0032976 [18] Adekambi T, Drancourt M. Dissection of phylogenetic relationships among 19 rapidly growing Mycobacterium species by 16S rRNA, hsp65, sodA, recA and rpoB gene sequencing. Int J Syst Evo Micr, 2004; 54, 2095-105. doi: 10.1099/ijs.0.63094-0 [19] Park H, Jang H, Kim C, et al. Detection and identification of mycobacteria by amplification of the internal transcribed spacer regions with genus-and species-specific PCR primers. J Clin Microbiol, 2000; 38, 4080-5. https://www.cabdirect.org/cabdirect/abstract/20013105463 [20] Rakoff-Nahoum S, Kuebler PJ, Heymann JJ, et al. Detection of T lymphocytes specific for human endogenous retrovirus K (HERV-K) in patients with seminoma. AIDS Res Hum Retroviruses, 2006; 22, 52-6. doi: 10.1089/aid.2006.22.52 [21] Kobashi Y, Yoshida K, Miyashita N, et al. Relationship between clinical efficacy of treatment of pulmonary Mycobacterium avium complex disease and drug-sensitivity testing of Mycobacterium avium complex isolates. J Infect Chemother, 2006; 12, 195-202. doi: 10.1007/s10156-006-0457-8 [22] Brown-Elliott BA, Iakhiaeva E, Griffith DE, et al. In vitro activity of amikacin against isolates of Mycobacterium avium complex with proposed MIC breakpoints and finding of a 16S rRNA gene mutation in treated isolates. J Clin Microbiol, 2013; 51, 3389-94. doi: 10.1128/JCM.01612-13 [23] Heifets L. MIC as a quantitative measurement of the susceptibility of Mycobacterium avium strains to seven antituberculosis drugs. Antimicrob Agents Ch, 1988; 32, 1131-6. doi: 10.1128/AAC.32.8.1131 [24] Zhang Z. Drug susceptibility testing and molecular mechanism of resistance to clarithromycin in Mycobacterium abscessus complex. Medical school of Chinese People's Liberation Army, 2015. (In Chinese) [25] Selander RK, Caugant DA, Ochman H, et al. Methods of multilocus enzyme electrophoresis for bacterial population genetics and systematics. Appl Environ Microbiol, 1986; 51, 873-84. http://citeseerx.ist.psu.edu/viewdoc/summary?doi=10.1.1.327.4297 [26] Hunter PR, Gaston MA. Numerical index of the discriminatory ability of typing systems: an application of Simpson's index of diversity. J Clin Microbiol, 1988; 26, 2465-6. https://www.researchgate.net/profile/Paul_Hunter/publication/239530556_Numerical_IndexoftheDiscriminatory_Ability_ofTypingSystems_an_Application_ofSimpson's_IndexofDiversity/links/0f31752f5684a5f83c000000.pdf?disableCoverPage=true [27] Dailloux M, Abalain ML, Laurain C, et al. Respiratory infections associated with nontuberculous mycobacteria in non-HIV patients. Eur Respir J, 2006; 28, 1211-5. doi: 10.1183/09031936.00063806 [28] Alvarez-Uria G. Lung disease caused by nontuberculous mycobacteria. Curr Opin Pulm Med, 2010; 16, 251-6. http://www.researchgate.net/profile/Gerardo_Alvarez-Uria/publication/41429018_Lung_disease_caused_by_nontuberculous_mycobacteria/links/0deec527b284a11924000000.pdf?disableCoverPage=true [29] Satta G, McHugh TD, Mountford J, et al. Managing pulmonary nontuberculous mycobacterial infection. time for a patient-centered approach. Ann Am Thorac Soc, 2014; 11, 117-21. doi: 10.1513/AnnalsATS.201308-278OT [30] Xu K, Bi S, Ji Z, et al. Distinguishing nontuberculous mycobacteria from multidrug-resistant Mycobacterium tuberculosis, China. Emerg Infect Dis, 2014; 20, 1060-2. doi: 10.3201/eid2006.130700 [31] Wu J, Zhang Y, Li J, et al. Increase in nontuberculous mycobacteria isolated in Shanghai, China: results from a population-based study. PLoS One, 2014; 9, e109736. doi: 10.1371/journal.pone.0109736 [32] Zheng C, Fanta CH. Non-tuberculous mycobacterial pulmonary infection in the immunocompetent host. QJM, 2013; 106, 307-15. doi: 10.1093/qjmed/hct022 [33] Brown-Elliott BA, Nash KA, Wallace RJ Jr. Antimicrobial susceptibility testing, drug resistance mechanisms, and therapy of infections with nontuberculous mycobacteria. Clin Microbiol Rev, 2012; 25, 545-82. doi: 10.1128/CMR.05030-11 [34] Griffith DE, Brown BA, Cegielski P, et al. Early results (at 6 months) with intermittent clarithromycin-including regimens for lung disease due to Mycobacterium avium complex. Clin Infect Dis, 2000; 30, 288-92. doi: 10.1086/313644 [35] Kohno Y, Ohno H, Miyazaki Y, et al. In vitro and in vivo activities of novel fluoroquinolones alone and in combination with clarithromycin against clinically isolated Mycobacterium avium complex strains in Japan. Antimicrob Agents Ch, 2007; 51, 4071-6. doi: 10.1128/AAC.00410-07 [36] Heifets L, Lindholm-Levy P. Comparison of bactericidal activities of streptomycin, amikacin, kanamycin, and capreomycin against Mycobacterium avium and M. tuberculosis. Antimicrob Agents Ch, 1989; 33, 1298-301. doi: 10.1128/AAC.33.8.1298 [37] McGrath EE, Anderson PB. The therapeutic approach to non-tuberculous mycobacterial infection of the lung. Pulm Pharmacol Ther, 2010; 23, 389-96. doi: 10.1016/j.pupt.2010.06.002 [38] Zhang Z, Pang Y, Wang Y, et al. Differences in risk factors and drug susceptibility between Mycobacterium avium and Mycobacterium intracellulare lung diseases in China. Int J Antimicrob Agents, 2015; 45, 491-5. doi: 10.1016/j.ijantimicag.2015.01.012 [39] Guthertz LS, Damsker B, Bottone EJ, et al. Mycobacterium avium and Mycobacterium intracellulare infections in patients with and without AIDS. J Infect Dis, 1989; 160, 1037-41. doi: 10.1093/infdis/160.6.1037 [40] van Ingen J, Boeree MJ, Dekhuijzen PN, et al. Environmental sources of rapid growing nontuberculous mycobacteria causing disease in humans. Clin Microbiol Infect, 2009; 15, 888-93. doi: 10.1111/j.1469-0691.2009.03013.x -

 点击查看大图

图(2) / 表ll (4)
计量
- 文章访问数: 1301
- HTML全文浏览量: 456
- PDF下载量: 80
- 被引次数: 0

 Quick Links