

 下载:
下载:

-
S afety concerns about phthalates are on the rise due to their iniquitousness and association with a variety of health outcomes[1-2], including allergies, obesity, atherosclerosis, and asthma[3-6]. Phthalates, which are diesters of 1, 2-benzenedicarboxylic acid, belong to a class of synthetic compounds used in multiple consumer and industrial products[7], such as automotive plastics, cosmetics, personal care and cleaning products, and food packaging[8-10]. Phthalates are not chemically bound to the raw materials of these products [e.g., polyvinyl chloride (PVC)] and can easily leach from the products into food, air, and other environmental media[10-11].
Diet is considered as significant exposure pathway for phthalates[12-19], especially di-(2-ethylhexyl) phthalate (DEHP), which is present in several food items such as poultry, meat, cream, eggs, and fish[19]. A few cross-sectional studies performed in the United States have reported that di-ethyl-phthalate metabolites are associated with vegetable consumption, while high-molecular-weight phthalate metabolites and DEHP are positively associated with meat and poultry intake[12, 20]. Even though diet is a major exposure source for phthalates, the exact mechanism by which phthalates enter the food chain is not clear[11]. One possible mechanism is that food contact materials (FCMs) (e.g., plastic containers, lids, can linings, dishware utensils) used in the manufacturing, processing, storage, and transportation of foods contain phthalates[21]. Human exposure to phthalates migrated from FCMs have been paid much attention recently. Many countries, such as the United States, European countries, Japan, and China, set a maximum level for some phthalates migrated from FCMs[22]. Although FCMs were identified as one source, whether or how FCMs lead to increased exposure of phthalates remains unclear. Several studies have attempted to lower phthalate exposure through carefully designed dietary interventions (limited usage of FCMs), although the results were inconsistent[23-24].
Phthalates are mainly used as plasticizers to increase the flexibility of plastics. Phthalates account for 90% of plasticizer consumption in China ( > 0.87 million per year)[25]. Plastics are the main raw materials of most FCMs. China has banned the use of PVC in FCMs by recommending the replacement of PVC with polypropylene (PP), polyethylene (PE), and polyethylene terephthalate (PET)[26]. Although phthalates are predominantly used in PVC, their potential use or contamination in other polymers has been previously suggested. Shen (2005) looked into a variety of polymers, including PVC, Polystyrene (PS), PE, and cellulose-based polymers and PE laminates, and identified phthalates in 24 out of the 25 plastic samples[27]. It is possible that the plastic FCMs may release phthalates into the foods no matter what polymers the FCMs were made of.
Despite the well-known suspect of plastic FCMs to the dietary exposure of phthalates, there is lack of study discussing whether and how FCMs contribute to the phthalate exposure. Generally, people do not know what types of polymer are in the plastic FCMs, but can try to limit their use of FCMs. Since the 2011 Taiwan food scandal[28], great concern on phthalates has been raised in China. Some people have limited the use of plastic products in their daily life. Yet such behavior does cause an inconvenience. A better choice is to understand the phthalate exposure coming from which scenarios and which products (e.g., plastic containers). By avoiding such scenarios, people may reduce their phthalate exposure without disturbing their daily life.
In this study, we tried to link the use habits of plastic containers (one type of FCMs) in human daily life with urinary concentrations of phthalate metabolites. The hypothesis is that if certain types of plastic containers are contaminated with phthalates, then in the scenarios in which people frequently use such containers in their daily life, the phthalate excretions in urine will increase. The characteristics of the containers will help us understand how phthalate exposure occurs through the use of FCMs.
-
The study participants were from the Shanghai Food Consumption Survey (SHFCS), which was conducted from September 2012 through August 2014. The SHFCS has been described in detail in a previous report[29]. In the first interview (autumn 2012) of the SHFCS, participants from 22 communities (the SHFCS contained 25 communities) were required to complete a questionnaire on the use frequency of plastic containers by trained investigators, and provided one spot urine sample during the investigation. Among the 3, 322 participants of the SHFCS, 3, 082 provided spot urine samples. After the exclusion of 278 participants for lacking data on the use of plastic containers, 89 participants for lacking weight or height information, 326 without enough volume of the urine sample for detecting phthalate metabolites, 25 for unreasonable creatinine concentration ( < 20 μmol/L or > 30, 000 μmol/L), and 224 aged ≤ 18 years, 2, 140 participants with ages > 18 years had complete information of use of plastic containers and phthalate metabolites. All participants provided informed consent before their participation in the SHFCS.
-
We designed a questionnaire to assess the use of plastic containers. In the present study, plastic containers referred to routine plastic products that were used to package or store food, including plastic tableware (e.g., bowl, dish, spoon), plastic cups, plastic bottles, plastic bags and boxes, and wrapping films. The questionnaire consisted of two types of questions. The first type of questions investigated the frequency (e.g., daily, weekly) of using plastic containers in different scenarios in the previous year. The second type of questions investigated whether the user had consumed certain items of plastic-packaged food in the previous three days. The list of questions is shown in Table 1. These questions represent the most frequent scenarios of using plastic containers in the daily life of Chinese people.
Table 1. Question List Investigating the Usage of Plastic Containers
Questions Usage of Plastic Containers Ⅰ. Frequency of using plastic containers in different scenarios in the previous year Daily Weekly Others 1 Using plastic tableware (bowl, dish, spoon, etc.) 47 (2.2) 837 (39.1) 1, 256 (58.7) 2 Heating plastic-contained food in microwave oven 38 (1.8) 160 (7.5) 1, 942 (90.7) 3 Drinking from plastic cup 78 (3.6) 156 (7.3) 1, 906 (89.1) 4 Drinking plastic-bottled water 152 (7.1) 197 (9.2) 1, 791 (83.7) 5 Drinking plastic-bottled beverage (soft drinks or sweet drinks) 43 (2.0) 153 (7.1) 1, 944 (90.8) Ⅱ. Consumption of plastic-packaged food in the previous three days Yes No 1 Plastic-packaged breakfast 494 (23.1) 1, 646 (76.9) 2 Plastic-packaged lunch 146 (6.8) 1, 994 (93.2) 3 Plastic-packaged processed food 327 (15.3) 1, 813 (84.7) 4 Plastic-bottled milk or yogurt 513 (24.0) 1, 627 (76.0) 5 Plastic-bottled beverage (soft drinks or sweet drinks) 445 (20.8) 1, 695 (79.2) 6 Plastic-bottled hot coffee or milk tea 129 (6.0) 2, 011 (94.0) Note. Data shown as number (percentage, %). -
We assessed dietary intake using a 24 h dietary recall questionnaire in a face-to-face interview. The 24 h dietary recall questionnaire gathered information on the types and servings of foods consumed in the 24 h before the spot urine collection. Based on the questionnaire, 312 different types of foods were consumed. The 24 h dietary recall data were used to calculate total food intake.
-
Phthalate metabolites in urine were analyzed by liquid chromatography tandem mass spectrometry (API 4000, LC-MS/MS, Shimadzu, USA) according to Tranfo et al.[30]. Urine collection and metabolite measurement have been previously described[29]: 'Briefly, 1 mL of urine sample was incubated with β-glucuronidase (Helix pomatia; Sigma, Louis, MO, USA; Type HP-2, aqueous solution, ≥ 100, 000 units/mL) at 37 ℃ for 120 min. The sample was subsequently acidified with 1 mL of aqueous 2% (v/v) acetic acid, mixed with 100 μL of internal standard (100 μg/L), and loaded into a PLS column (Dikma, China; 60 mg/3 mL) previously activated with 2 mL methanol and 2 mL of aqueous 0.5% (v/v) acetic acid. After sample loading, the column was washed with 2 mL of aqueous 0.5% (v/v) acetic acid and eluted with 1 mL of methanol. The eluate was passed through a 0.2 μm filter and analyzed (10 μL) by LC-MS/MS (Shimadzu, USA; API 4000 LC/MS/MS system) coupled to an AQUASIL C18 column (150 × 4.6 mm; Thermo Fisher Scientific, Inc, USA)'. The mobile phases consisted of acetonitrile (mobile phase A) and ultrapure water (mobile phase B), both phases containing 0.1% (v/v) acetic acid. The gradient profile was as follows: maintained at 30% in the first 2 min, followed with 90% in the next 13 min, and returned to the initial conditions in the last 3 min. The flow rate and the injection volume were 0.6 mL/min and 10 µL, respectively. The MS was operated in negative electrospray ionization (ESI) mode. The operation parameters were as follows: Capillary voltage: 3.7 kV; Ion source temperature: 120 ℃; Solvent gas temperature: 300 ℃; Cone hole Gas flow: 50 L/h; Gas flow: 600 L/h; Collision gas: argon.
Ten phthalate metabolites were measured in this study, including monomethyl phthalate (MMP), monoethylphthalate (MEP), mono-n-butylphthalate (MnBP), monoisobutylphthalate (MiBP), monobenzylphthalate (MBzP), mono-2-ethylhexylphthalate (MEHP), mono-2-ethyl-5-oxohexyphthalate (MEOHP), mono-2-ethyl-5-hydroxyhexylphthalate (MEHHP), mono-2-ethyl-5-carboxypentylphthalate (MECPP), and mono-2-carboxymethyl-hexyl phthalate (MCMHP). The method had a limit of detection of 0.02, 0.20, 0.04, 0.04, 0.20, 0.60, 0.10, 0.20, 0.03, 0.50 μg/L for MMP, MEP, MnBP, MiBP, MBzP, MEHP, MEOHP, MECPP, MEHHP, and MCMHP, respectively. Two micromolar sums (µmol/L) were also calculated to assess the phthalate exposure, namely the sum of DBP metabolites (ΣDBP, including MiBP, and MnBP) and the sum of DEHP metabolites (ΣDEHP, including MEHP, MEOHP, MECPP, MEHHP, and MCMHP). The concentrations of 10 phthalate metabolites and 2 micromolar sums were adjusted by creatinine for correcting urine dilution.
-
Data were analyzed using SPSS version 21.0. Urinary phthalate metabolite concentrations were natural log-transformed for normality. Two-side P-values < 0.05 were considered to be statistically significant. We used multiple linear regression analyses to estimate the association between each exposure biomarker (phthalate metabolites or calculated index) and plastic use. The potential covariates used in the regression models and covariance analyses were total food intake, sex (male, female), age, education level (≤ primary school, high school/technical secondary school, college or greater), marriage (married, others), smoking status (never, current/past smokers), and body mass index (BMI). The estimated regression coefficient (β) and standard error (SE) of each regression model were used to calculate the percent difference in urinary concentrations of phthalate parameters following each step of the frequency of plastic usage. The percent difference was calculated by the equation [e(β)-1] × 100%, and 95% confidence intervals (CIs) were calculated by the equation [e(β ± critical value × SE)-1] × 100%. In this study, we observed a similar trend between the consumption of plastic-packaged breakfast/processed food items and phthalate exposure. To identify possible synergistic effects, we created a new variate that was classified into three consumption categories (none, either, or both item of food) and performed univariate analyses. The P-value for trend represented whether the consumption of plastic-packaged breakfast or plastic-packaged processed food items had synergistic effects on phthalate exposure.
-
All subjects submitted written informed consent before their participation in the survey. The study was approved by the local authorities and the Ethics Committee of School of Public Health at Fudan University (IRB#2011-03-0264).
-
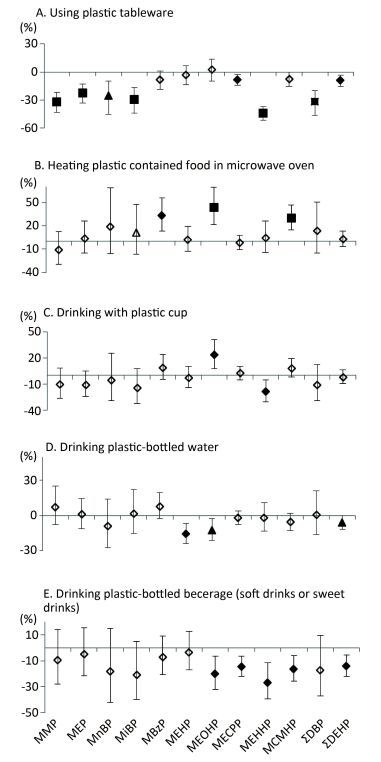
Table 2 presented the parent phthalates, their metabolites and the detection rates of measured metabolites. Among 10 metabolites, 5 of them (MECPP, MEHHP, MEHP, MCMHP, and MEOHP) were from the same parent phthalates and had higher detection rates than metabolites from other phthalates. Table 3 showed the baseline characteristics of the study participants (n = 2, 140). The median age was 53 years. We did not observe urinary metabolites of phthalates significantly increased following the increase of the behavior frequency of using plastic containers in different scenarios (Figure 1), except the high frequency of drinking from plastic cups in association with higher levels of MEOHP, and the high frequency of heating plastic-contained food in a microwave in association with higher levels of MBzP, MEOHP, and MCMHP. In contrast, we observed negative associations in more scenarios and more metabolites, especially in the question of using plastic tableware, drinking plastic bottled water, and drinking plastic-bottled beverage (soft drinks or sweet drinks).
Table 2. Parent Phthalates, Their Metabolites, and the Detection Rates
Parent Phthalate Phthalate Metabolite (μg/g) n > LOD (%) Dimethyl phthalate, (DMP) Monomethyl phthalate, (MMP) 1, 907 (89.1) Diethyl phthalate, (DEP) Monoethyl phthalate, (MEP) 1, 941 (90.7) Di-n-butylphthalate, (DnBP) Mono-n-butyl phthalate, (MnBP) 1, 590 (74.3) Diisobutyl phthalate, (DiBP) Butyl-benzyl phthalate, (BBP) Monoisobutyl phthalate, (MiBP) 1, 755 (82.2) Mono-benzyl phthalate, (MBzP) 1, 504 (70.3) Di-2-ethylhexyl phthalate, (DEHP) Mono-2-ethylhexyl phthalate, (MEHP) 2, 072 (96.8) Mono-2-ethyl-5-oxohexyl phthalate, (MEOHP) 1, 962 (91.7) Mono-2-ethyl-5-hydroxyhexyl phthalate, (MEHHP) 2, 136 (99.8) Mono-2-ethyl-5-carboxypentyl phthalate, (MECPP) 2, 133 (99.7) Mono-2-carboxymethyl-hexyl phthalate, (MCMHP) 2, 067 (96.6) Note. LOD, limit of detection. Table 3. Characteristics of the Study Participants (n = 2, 140)
Characteristic Category Result Age, median (IQR), y - 53 (41, 64) Sex, n (%) Male 1, 018 (47.6) Female 1, 122 (52.4) Nationality, n (%) Han 2, 120 (99.1) Others 20 (0.9) Education level, n (%) ≤ Primary school 501 (23.7) High school/technical Secondary school 1, 264 (59.9) ≥ College graduate 345 (16.4) Marriage, n (%) Married 1, 785 (86.0) Other 291 (14.0) Smoking status, n (%) Never smoked 1, 593 (71.9) Current/Past smoker 537 (28.1) Total food intake, median (IQR), g - 1, 271 (902, 1, 510) Height, median (IQR), m - 1.65 (1.59, 1.70) Weight, median (IQR), kg - 64.0 (56.0, 70.0) BMI, median (IQR), kg/m2 - 23.6 (21.3, 25.6) - - 83.0 (76.6, 89.9) Note. BMI: body mass index; IQR: interquartile range. 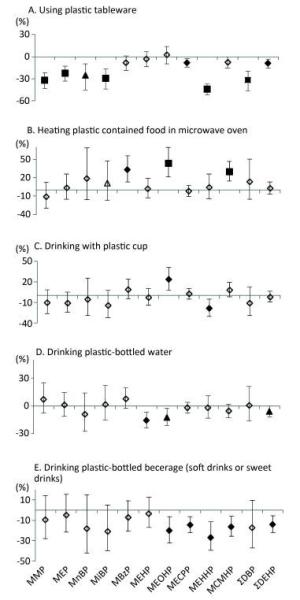
Figure 1. Associations between urinary concentrations of phthalate indexes and the frequency of using plastic containers in different scenarios in the previous year. Data were adjusted for age, sex, education level, smoking status, marriage, BMI and total food intake. The y-axis represents the percent increase or decrease in phthalate exposure following the increased frequency of usage (never, occasionally, or regularly). ◇, P value > 0.05; ▲, P value < 0.05; ◆, P value < 0.01; ■, P value < 0.001.
-
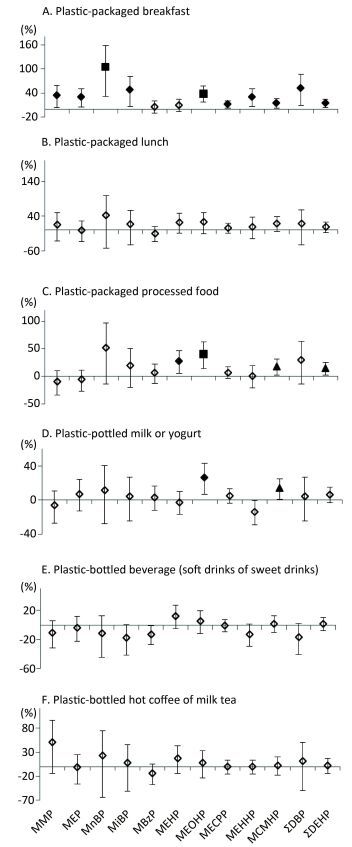
The consumption of plastic-packaged lunch was not associated with phthalate metabolites. However, the consumption of plastic-packaged breakfast and plastic-packaged processed food had positive associations with most urinary metabolite concentrations (Figure 2). Compared to non-consumption, consumption of plastic-packaged breakfast had 34.17%, 29.73%, 104.61%, 48.71%, 39.12%, 12.22%, 30.56%, 15.13%, 52.71%, and 14.81% higher levels of urinary MMP, MEP, MnBP, MiBP, MEOHP, MECPP, MEHHP, MCMHP, ΣDBP, ΣDEHP, respectively. Consumption of plastic-packaged processed food had 51.53%, 27.38%, 40.40%, 17.55%, and 13.95% higher levels of urinary MnBP, MEHP, MEOHP, MCMHP, and ΣDEHP than non-consumption, respectively. Consumption of plastic-bottled milk or yogurt had 26.1% and 13.52% higher levels of urinary MEOHP and MCMHP, respectively, than non-consumption.
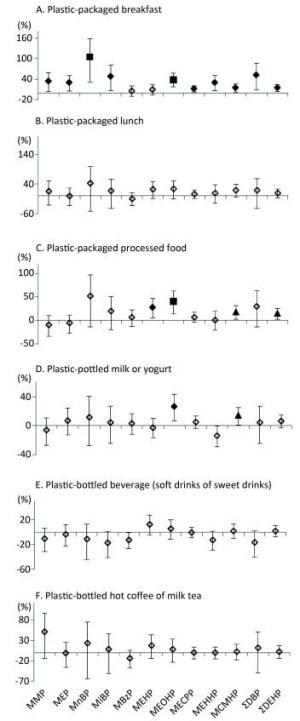
Figure 2. Associations between urinary concentrations of phthalate indexes and the consumption of plastic-packaged foods in the previous three days. Data were adjusted for age, sex, education level, smoking status, marriage, BMI and total food intake. The y-axis represents the percent increase or decrease in phthalate exposure comparing between 'yes' consumption and 'no' consumption. ◇, P value > 0.05; ▲, P value < 0.05; ◆, P value < 0.01; ■, P value < 0.001.
-
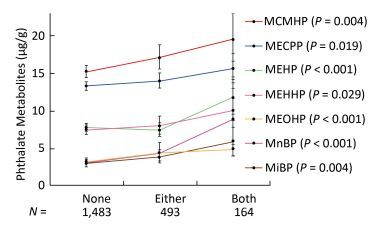
Since the consumption of both plastic-packaged breakfast and plastic-packaged processed food had positive associations with some phthalate metabolites, we generated a new variate to explore the synergistic effects of these two questions. The variate was classified into three categories (none, either, or both consumption of these two items of food). Consumption of these two items had strong synergistic effects on increasing urinary concentrations of phthalate indexes, including MnBP, MiBP, MEHP, MEOHP, MECPP, MEHHP, and MCMHP (Figure 3), especially for MnBP, MEHP, and MEOHP, with the P-value for trend less than 0.001.
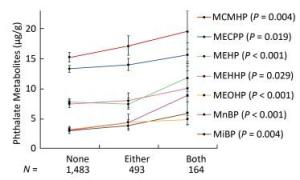
Figure 3. Univariate analysis of phthalate exposure in association with both consumption of plastic-packaged breakfast and plastic-packaged processed food. The consumption of plastic-packaged breakfast or plastic-packaged processed food: none, consumed none of them; either, consumed one of them; both, consumed both of them.Significance across the three levels (none, either, both) based on univariate analyses after adjusting for age, sex, education level, smoking status, marriage, BMI and total food intake. Geometric mean (95% CI) were presented. P means the P-value for trend across the none consumption of these two items of food to both consumption of these two items of food.
-
Given the strong evidence that diet was a major exposure source for phthalates[8], it is likely that plastic containers contributed to phthalate contamination of foods. To the best of our knowledge, this is the first study that assessed the association between urinary phthalate metabolites and the use of plastic containers. Our study findings emphasized that plastic containers contributed to phthalate exposure via the diet. While most studies have focused on the consumption of canned goods and processed food[11, 23, 31], few have focused on plastic containers.
In this study, we mainly found the consumption of plastic-packaged breakfast and plastic-packaged processed food items had positive associations with most urinary metabolites. The processed food in this study referred to the foods that had already been cooked or half-cooked and were ready to be consumed. The consumption of these two food items had strong synergistic effects on increasing all detected urinary metabolite concentrations except MMP and MEP. Except these two questions, positive associations with phthalate exposure were only sporadically shown in other items. The scenario frequency of using plastic tableware or drinking plastic-bottled beverage (soft drinks or sweet drinks) even had negative associations with phthalate exposure. Such a phenomenon should be of concern because it may uncover some key points in the risk assessment of phthalate exposure.
Certain plastic containers may contribute to phthalate contamination of foods. Studies have reported that the phthalate contamination was linked to plastic use[21, 32-35]. Plastic products, including plastic containers are typically made of PVC, PE, PP, or PET. These materials are used in the production of FCMs. To improve their flexibility, some plastic materials such as PVC require the use of phthalates as plasticizers. As a result of the wide use of phthalates, PVC has been banned in FCMs in China[26]. For the production of FCMs, PVC has been replaced with PE, PP, and PET, which do not require the use of phthalates[36-37]. However, some studies have detected phthalates in these materials[38-41]. Researchers have demonstrated that PET was able to release phthalates[38-40] and that recycled PET was contaminated with phthalates[41]. Phthalate migration from plastic FCMs may be attributed to the following: 1) FCMs are made of PVC, 2) FCMs, labeled as PE, PP, or PET, contain small amounts of PVC, or 3) FCMs are made of phthalate-containing PE, PP, or PET. One the other hand, with regard to which types of phthalates were potentially contained in plastic FCMs, DEHP may serve as the major one. Researchers have reported that DEHP accounted for approximately 50% of all plasticizers used in PVC[42]. Our data conformed to the previous report since DEHP metabolites were the most frequently detected in urine. Our previous study[43]also found that DEHP was able to migrate from plastic containers (bottles, bags, films, and wrappers) at the concentrations of exceeding the specific migration limit set by European Union (1.5 mg/kg) when undergoing the circumstances of long storage time, heating process or packaging high fat food. The specific migration limit is a maximum permitted amount of a substance in food. It should be ensured by the manufacturer that materials not yet in contact with food will respect the limits when brought into contact with food under the worst foreseeable contact conditions.
In this study, one possible reason is that the FCMs used in plastic-packaged breakfast or plastic-packaged processed food items were different from the FCMs used in other scenarios. When no associations or negative associations were obtained in other scenarios in our data, foods in these scenarios were usually placed in rigid plastic containers. In contrast, breakfast and processed food items were usually packaged in flexible plastic bags or wrapping films. In China, roadside grocery stores, fast food outlets, and stall-keepers are common and convenient to consumers. Foods sold from these places are usually packaged in plastic bags or wrapping films. The plastic-packaged breakfasts in China are usually purchased from one of the above places. The processed food items are also easy to be found in these places. In addition, the processed food can be purchased from supermarkets, where the processed food is usually packed in a plastic form tray covering with wrapping films.
Could flexible plastic containers contribute to more phthalates contamination than rigid plastic containers? Plasticizers are substances added to plastics to increase their flexibility, transparency, durability, and longevity. Phthalates are frequently used as plasticizers. Since the PVC ban, non-plasticized PET and PP have been used to produce rigid plastic containers. It is noteworthy that plastic containers made of PET do not require the use of phthalates as plasticizers[36-37]. These rigid plastics are usually not disposable, and have improved durability and heat resistance, and are convenient for preserving foods. The use of rigid plastics might explain the negative associations or lack of associations between urinary phthalates and other question items instead of plastic-packaged breakfast and processed food in our data.
Unlike rigid plastic containers, flexible plastic containers (either plastic bags or wrapping films) are disposable, cheaper, and more frequently used in roadside fast-food outlets and stall-keepers. Flexible plastics, however, require plasticizers. Flexible plastic bags and wrapping films are made of plasticized PVC, PE, or PET. Even though China has banned the use of PVC in FCMs[26], it is unclear whether PVC is still being used in FCMs, especially because PVC is cheaper than PE and PET. For example, PVC-polyvinylidene chloride (PVDC) food wrapping film (cling film) is commonly used to wrap meat, fish, poultry, and other foods in Canada[44]. FCMs labeled as PE or PET might contain small amounts of PVC or phthalates as reported by previous studies[28, 40]. Overall, our findings emphasized the importance of risk assessment and regulation of flexible plastic containers.
Other factors may explain the positive associations obtained between urinary phthalates and the consumption of plastic-packaged breakfast or processed food items. Both of these items are high-fat foods because roadside foods in China are cooked in high amounts of oil. Due to their lipophilic nature, phthalates tend to concentrate in high fat foods[8, 45]. Moreover, phthalates migration increases with increasing storage time and temperature[46]. Breakfast and processed food items purchased from roadside stores may have more time in contact with plastics.
Our study has two major limitations. The main weakness is the cross-sectional design. Phthalate exposure assessed by one single spot urine sample was not sufficient. Ideally, urine samples should be collected from multiple time points. In addition, except the dietary sources, people may be exposed to phthalates through the air, dust, personal care products, etc. However, this study did not investigate the potential exposure of phthalates through these sources.
-
Phthalate exposure was positively associated with the recent consumption of plastic-packaged breakfast and plastic-packaged processed food, but not other scenarios of using plastic containers. Our data may be explained by the different effects of rigid versus flexible plastic containers on phthalate exposure. The findings are valuable for understanding phthalate contamination in foods and for establishing optimum regulatory practices in FCM production. Risk assessment is urgently needed in the production and application of flexible plastic containers.
-
No confict of intrest to declare.
doi: 10.3967/bes2017.098
Association between Phthalate Exposure and the Use of Plastic Containers in Shanghai Adults
-
Abstract:
Objective Consuming phthalates may be due to the presence of food contact materials, such as plastic containers. In this study, we investigated the association between plastic container use and phthalate exposure in 2, 140 Shanghai adults. Methods Participants completed a questionnaire on the frequency of using plastic containers in different scenarios in the previous year (e.g., daily, weekly) and on the consumption of plastic-packaged foods in the previous three days (yes or no). Urinary phthalate metabolites were used to assess the association between phthalate exposure and the use of plastic containers. Results The metabolites of di-(2-ethylhexyl) phthalate (DEHP) were the most frequently detected in urine. The results revealed that phthalate exposure was associated with consumption of plastic-packaged breakfast or processed food items in the previous three days. The consumption of these two food items had strong synergistic effects on increasing urinary concentrations of most phthalate metabolites. Conclusion Our results of plastic-packaged breakfast and processed food may be explained by the use of flexible plastic containers, indicating the importance of risk assessment for the application of flexible plastic containers. -
Figure 1. Associations between urinary concentrations of phthalate indexes and the frequency of using plastic containers in different scenarios in the previous year. Data were adjusted for age, sex, education level, smoking status, marriage, BMI and total food intake. The y-axis represents the percent increase or decrease in phthalate exposure following the increased frequency of usage (never, occasionally, or regularly). ◇, P value > 0.05; ▲, P value < 0.05; ◆, P value < 0.01; ■, P value < 0.001.
Figure 2. Associations between urinary concentrations of phthalate indexes and the consumption of plastic-packaged foods in the previous three days. Data were adjusted for age, sex, education level, smoking status, marriage, BMI and total food intake. The y-axis represents the percent increase or decrease in phthalate exposure comparing between 'yes' consumption and 'no' consumption. ◇, P value > 0.05; ▲, P value < 0.05; ◆, P value < 0.01; ■, P value < 0.001.
Figure 3. Univariate analysis of phthalate exposure in association with both consumption of plastic-packaged breakfast and plastic-packaged processed food. The consumption of plastic-packaged breakfast or plastic-packaged processed food: none, consumed none of them; either, consumed one of them; both, consumed both of them.Significance across the three levels (none, either, both) based on univariate analyses after adjusting for age, sex, education level, smoking status, marriage, BMI and total food intake. Geometric mean (95% CI) were presented. P means the P-value for trend across the none consumption of these two items of food to both consumption of these two items of food.
Table 1. Question List Investigating the Usage of Plastic Containers
Questions Usage of Plastic Containers Ⅰ. Frequency of using plastic containers in different scenarios in the previous year Daily Weekly Others 1 Using plastic tableware (bowl, dish, spoon, etc.) 47 (2.2) 837 (39.1) 1, 256 (58.7) 2 Heating plastic-contained food in microwave oven 38 (1.8) 160 (7.5) 1, 942 (90.7) 3 Drinking from plastic cup 78 (3.6) 156 (7.3) 1, 906 (89.1) 4 Drinking plastic-bottled water 152 (7.1) 197 (9.2) 1, 791 (83.7) 5 Drinking plastic-bottled beverage (soft drinks or sweet drinks) 43 (2.0) 153 (7.1) 1, 944 (90.8) Ⅱ. Consumption of plastic-packaged food in the previous three days Yes No 1 Plastic-packaged breakfast 494 (23.1) 1, 646 (76.9) 2 Plastic-packaged lunch 146 (6.8) 1, 994 (93.2) 3 Plastic-packaged processed food 327 (15.3) 1, 813 (84.7) 4 Plastic-bottled milk or yogurt 513 (24.0) 1, 627 (76.0) 5 Plastic-bottled beverage (soft drinks or sweet drinks) 445 (20.8) 1, 695 (79.2) 6 Plastic-bottled hot coffee or milk tea 129 (6.0) 2, 011 (94.0) Note. Data shown as number (percentage, %).  下载: 导出CSV
Table 2. Parent Phthalates, Their Metabolites, and the Detection Rates
Parent Phthalate Phthalate Metabolite (μg/g) n > LOD (%) Dimethyl phthalate, (DMP) Monomethyl phthalate, (MMP) 1, 907 (89.1) Diethyl phthalate, (DEP) Monoethyl phthalate, (MEP) 1, 941 (90.7) Di-n-butylphthalate, (DnBP) Mono-n-butyl phthalate, (MnBP) 1, 590 (74.3) Diisobutyl phthalate, (DiBP) Butyl-benzyl phthalate, (BBP) Monoisobutyl phthalate, (MiBP) 1, 755 (82.2) Mono-benzyl phthalate, (MBzP) 1, 504 (70.3) Di-2-ethylhexyl phthalate, (DEHP) Mono-2-ethylhexyl phthalate, (MEHP) 2, 072 (96.8) Mono-2-ethyl-5-oxohexyl phthalate, (MEOHP) 1, 962 (91.7) Mono-2-ethyl-5-hydroxyhexyl phthalate, (MEHHP) 2, 136 (99.8) Mono-2-ethyl-5-carboxypentyl phthalate, (MECPP) 2, 133 (99.7) Mono-2-carboxymethyl-hexyl phthalate, (MCMHP) 2, 067 (96.6) Note. LOD, limit of detection.
下载: 导出CSV
Table 3. Characteristics of the Study Participants (n = 2, 140)
Characteristic Category Result Age, median (IQR), y - 53 (41, 64) Sex, n (%) Male 1, 018 (47.6) Female 1, 122 (52.4) Nationality, n (%) Han 2, 120 (99.1) Others 20 (0.9) Education level, n (%) ≤ Primary school 501 (23.7) High school/technical Secondary school 1, 264 (59.9) ≥ College graduate 345 (16.4) Marriage, n (%) Married 1, 785 (86.0) Other 291 (14.0) Smoking status, n (%) Never smoked 1, 593 (71.9) Current/Past smoker 537 (28.1) Total food intake, median (IQR), g - 1, 271 (902, 1, 510) Height, median (IQR), m - 1.65 (1.59, 1.70) Weight, median (IQR), kg - 64.0 (56.0, 70.0) BMI, median (IQR), kg/m2 - 23.6 (21.3, 25.6) - - 83.0 (76.6, 89.9) Note. BMI: body mass index; IQR: interquartile range.
下载: 导出CSV
-
[1] Singh S, SS Li. Epigenetic effects of environmental chemicals bisphenol a and phthalates. Int J Mol Sci, 2012; 13, 10143-53. doi: 10.3390/ijms130810143 [2] Caldwell JC. DEHP:genotoxicity and potential carcinogenic mechanisms-a review. Mutat Res, 2012; 751, 82-157. doi: 10.1016/j.mrrev.2012.03.001 [3] Lind PM, L Lind. Circulating levels of bisphenol A and phthalates are related to carotid atherosclerosis in the elderly. Atherosclerosis, 2011; 218, 207-13. doi: 10.1016/j.atherosclerosis.2011.05.001 [4] Martino-Andrade AJ, I Chahoud. Reproductive toxicity of phthalate esters. Mol Nutr Food Res, 2010; 54, 148-57. doi: 10.1002/(ISSN)1613-4133 [5] Hatch EE, JW Nelson, MM Qureshi, et al. Association of urinary phthalate metabolite concentrations with body mass index and waist circumference:a cross-sectional study of NHANES data, 1999-2002. Environ Health, 2008; 7, 27. doi: 10.1186/1476-069X-7-27 [6] Shu H, BA Jonsson, M Larsson, et al. PVC flooring at home and development of asthma among young children in Sweden, a 10-year follow-up. Indoor Air, 2013. https://www.sciencedaily.com/releases/2013/10/131024102044.htm [7] Wittassek M, HM Koch, J Angerer, et al. Assessing exposure to phthalates-the human biomonitoring approach. Mol Nutr Food Res, 2011; 55, 7-31. doi: 10.1002/mnfr.v55.1 [8] Serrano SE, J Braun, L Trasande, et al. Phthalates and diet:a review of the food monitoring and epidemiology data. Environ Health, 2014; 13, 43. doi: 10.1186/1476-069X-13-43 [9] Wittassek M, HM Koch, J Angerer, et al. Assessing exposure to phthalates-The human biomonitoring approach. Molecular Nutrition & Food Research, 2011; 55, 7-31. https://hero.epa.gov/hero/index.cfm/reference/details/reference_id/809854 [10] Wormuth M, M Scheringer, M Vollenweider, et al. What are the sources of exposure to eight frequently used phthalic acid esters in Europeans? Risk Anal, 2006; 26, 803-24. doi: 10.1111/risk.2006.26.issue-3 [11] Sathyanarayana S, G Alcedo, BE Saelens, et al. Unexpected results in a randomized dietary trial to reduce phthalate and bisphenol A exposures. J Expo Sci Environ Epidemiol, 2013; 23, 378-84. doi: 10.1038/jes.2013.9 [12] Colacino JA, TR Harris, A Schecter. Dietary intake is associated with phthalate body burden in a nationally representative sample. Environ Health Perspect, 2010; 118, 998-1003. doi: 10.1289/ehp.0901712 [13] Fromme H, L Gruber, M Schlummer, et al. Intake of phthalates and di(2-ethylhexyl)adipate:results of the Integrated Exposure Assessment Survey based on duplicate diet samples and biomonitoring data. Environ Int, 2007; 33, 1012-20. doi: 10.1016/j.envint.2007.05.006 [14] Schettler T. Human exposure to phthalates via consumer products. Int J Androl, 2006; 29, 134-9; discussion 181-5. doi: 10.1111/ija.2006.29.issue-1 [15] Schecter A, M Lorber, Y Guo, et al. Phthalate concentrations and dietary exposure from food purchased in New York State. Environ Health Perspect, 2013; 473-94, 494e1-4. [16] Martine B, T Marie-Jeanne, D Cendrine, et al. Assessment of adult human exposure to phthalate esters in the urban centre of Paris (France). Bull Environ Contam Toxicol, 2013; 90, 91-6. doi: 10.1007/s00128-012-0859-5 [17] Bradley EL, RA Burden, I Leon, et al. Determination of phthalate diesters in foods. Food Addit Contam Part A Chem Anal Control Expo Risk Assess, 2013; 30, 722-34. doi: 10.1080/19440049.2013.781683 [18] Sioen I, T Fierens, M Van Holderbeke, et al. Phthalates dietary exposure and food sources for Belgian preschool children and adults. Environ Int, 2012; 48, 102-8. doi: 10.1016/j.envint.2012.07.004 [19] Petersen JH, T Breindahl. Plasticizers in total diet samples, baby food and infant formulae. Food Addit Contam, 2000; 17, 133-41. doi: 10.1080/026520300283487 [20] Trasande L, S Sathyanarayana, M Jo Messito, et al. Phthalates and the diets of U.S. children and adolescents. Environ Res, 2013; 126, 84-90. doi: 10.1016/j.envres.2013.07.007 [21] Petersen JH, LK Jensen. Phthalates and food-contact materials:enforcing the 2008 European Union plastics legislation. Food Addit Contam Part A Chem Anal Control Expo Risk Assess, 2010; 27, 1608-16. doi: 10.1080/19440049.2010.501825 [22] Li X, W Xiong, H Lin, et al. Analysis of 16 phthalic acid esters in food simulants from plastic food contact materials by LC-ESI-MS/MS. J Sep Sci, 2013; 36, 477-84. doi: 10.1002/jssc.v36.3 [23] Rudel RA, JM Gray, CL Engel, et al. Food packaging and bisphenol A and bis(2-ethyhexyl) phthalate exposure:findings from a dietary intervention. Environ Health Perspect, 2011; 119, 914-20. doi: 10.1289/ehp.1003170 [24] Barrett ES, M Velez, X Qiu, et al. Reducing Prenatal Phthalate Exposure Through Maternal Dietary Changes:Results from a Pilot Study. Matern Child Health J, 2015; 19, 1936-42. doi: 10.1007/s10995-015-1707-0 [25] He LZ, G Gielen, NS Bolan, et al. Contamination and remediation of phthalic acid esters in agricultural soils in China:a review. Agronomy for Sustainable Development, 2015; 35, 519-34. doi: 10.1007/s13593-014-0270-1 [26] Zhou JH, XY Cao, HL Lin, et al. Safety and effectiveness evaluation of a domestic peritoneal dialysis fluid packed in non-PVC bags:study protocol for a randomized controlled trial. Trials, 2015; 16. doi: 10.1186%2Fs13063-015-1131-1.pdf [27] Shen HY. Simultaneous screening and determination eight phthalates in plastic products for food use by sonication-assisted extraction/GC-MS methods. Talanta, 2005; 66, 734-9. doi: 10.1016/j.talanta.2004.12.021 [28] Yang J, R Hauser, RH Goldman. Taiwan food scandal:the illegal use of phthalates as a clouding agent and their contribution to maternal exposure. Food Chem Toxicol, 2013; 58, 362-8. doi: 10.1016/j.fct.2013.05.010 [29] Ruihua Dong, Tong Zhou, Shanzhen Zhao, et al. Food consumption survey of Shanghai adults in 2012 and its associations with phthalate metabolites in urine. Environ Int, 2017; 101, 80-8. doi: 10.1016/j.envint.2017.01.008 [30] Tranfo G, B Papaleo, L Caporossi, et al. Urinary metabolite concentrations of phthalate metabolites in Central Italy healthy volunteers determined by a validated HPLC/MS/MS analytical method. Int J Hyg Environ Health, 2013; 216, 481-5. doi: 10.1016/j.ijheh.2012.11.003 [31] Ji K, Y Lim Kho, Y Park, et al. Influence of a five-day vegetarian diet on urinary levels of antibiotics and phthalate metabolites:a pilot study with "Temple Stay" participants. Environ Res, 2010; 110, 375-82. doi: 10.1016/j.envres.2010.02.008 [32] Sharman, M, WA Read, L Castle, et al. Levels of di-(2-ethylhexyl)phthalate and total phthalate esters in milk, cream, butter and cheese. Food Addit Contam, 1994; 11, 375-85. doi: 10.1080/02652039409374236 [33] Tsumura Y, S Ishimitsu, I Saito, et al. Eleven phthalate esters and di(2-ethylhexyl) adipate in one-week duplicate diet samples obtained from hospitals and their estimated daily intake. Food Addit Contam, 2001; 18, 449-60. doi: 10.1080/02652030117484 [34] Pedersen GA, LK Jensen, A Fankhauser, et al. Migration of epoxidized soybean oil (ESBO) and phthalates from twist closures into food and enforcement of the overall migration limit. Food Addit Contam Part A Chem Anal Control Expo Risk Assess, 2008; 25, 503-10. doi: 10.1080/02652030701519088 [35] Fankhauser-Noti A, S Biedermann-Brem, K Grob. PVC plasticizers/additives migrating from the gaskets of metal closures into oily food:Swiss market survey June 2005. European Food Research and Technology, 2006; 223, 447-53. doi: 10.1007/s00217-005-0223-7 [36] Enneking PA. Phthalates not in plastic food packaging. Environ Health Perspect, 2006; 114, A89-90. doi: 10.1289/ehp.114-a89 [37] Guart A, F Bono-Blay, A Borrell, et al. Migration of plasticizers phthalates, bisphenol A and alkylphenols from plastic containers and evaluation of risk. Food Addit Contam Part A Chem Anal Control Expo Risk Assess, 2011; 28, 676-85. doi: 10.1080/19440049.2011.555845 [38] Farhoodi M, Z Emam-Djomeh, MR Ehsani, et al. Effect of Environmental Conditions on the Migration of Di(2-Ethylhexyl)Pthalate from Pet Bottles into Yogurt Drinks:Influence of Time, Temperature, and Food Simulant. Arabian Journal for Science and Engineering, 2008; 33, 279-87. doi: 10.1007/698_2016_121 [39] Montuori P, E Jover, M Morgantini, et al. Assessing human exposure to phthalic acid and phthalate esters from mineral water stored in polyethylene terephthalate and glass bottles. Food Addit Contam Part A Chem Anal Control Expo Risk Assess, 2008; 25, 511-8. doi: 10.1080/02652030701551800 [40] Schmid P, M Kohler, R Meierhofer, et al. Does the reuse of PET bottles during solar water disinfection pose a health risk due to the migration of plasticisers and other chemicals into the water? Water Res, 2008; 42, 5054-60. doi: 10.1016/j.watres.2008.09.025 [41] Sax L. Polyethylene Terephthalate May Yield Endocrine Disruptors. Environ Health Perspect, 2010; 118, 445-8. https://ehp.niehs.nih.gov/1001986/ [42] Erythropel HC, M Maric, JA Nicell, et al. Leaching of the plasticizer di(2-ethylhexyl)phthalate (DEHP) from plastic containers and the question of human exposure. Appl Microbiol Biotechnol, 2014; 98, 9967-81. doi: 10.1007/s00253-014-6183-8 [43] Han Z, MR Zhang, WU Ming, et al. Influence factors of phthalates migration from food packaging materials. Chin J Health Lab Tec, 2015; 25. http://123foodscience.com/food_packaging/Factors_affecting_packaged_product_quality_and_shelf_life.pdf [44] Cao XL, W Zhao, R Churchill, et al. Occurrence of Di-(2-ethylhexyl) adipate and phthalate plasticizers in samples of meat, fish, and cheese and their packaging films. J Food Prot, 2014; 77, 610-20. doi: 10.4315/0362-028X.JFP-13-380 [45] Cao XL. Phthalate Esters in Foods:Sources, Occurrence, and Analytical Methods. Comprehensive Reviews in Food Science and Food Safety, 2010; 9, 21-43. doi: 10.1111/crfs.2010.9.issue-1 [46] Cirillo T, E Fasano, F Esposito, et al. Study on the influence of temperature, storage time and packaging type on di-n-butylphthalate and di(2-ethylhexyl)phthalate release into packed meals. Food Addit Contam Part A Chem Anal Control Expo Risk Assess, 2013; 30, 403-11. doi: 10.1080/19440049.2012.745198 -

 点击查看大图
计量
- 文章访问数: 1578
- HTML全文浏览量: 528
- PDF下载量: 132
- 被引次数: 0

 Quick Links