

 下载:
下载:

-
Metabolic syndrome (MetS) is a group of clinical syndromes characterized by aggregation of multiple risk factors such as obesity, hypertension, hyperlipidemia, and impaired glucose regulation[1]. MetS is associated with the incidence of diabetes and cardiovascular and kidney diseases as well as an increased risk for cardiovascular disease mortality and all-cause mortality[2-5]. According to the China Noncommunicable Disease Surveillance Group, MetS has become a serious public health problem. For example, in 2010 the prevalence of MetS in China was 33.9% (men: 31.0%; women: 36.8%), affecting nearly 454 million people[6].
Risk prediction indicators and assessment models can be used to effectively predict MetS, and some investigators have examined biochemical parameters as predictors of the risk of MetS, such as insulin resistance indexes, apolipoprotein B/apolipoprotein A1 ratio, high-sensitivity C-reactive protein levels, serum leptin levels, and white blood cell count[7-11]. However, as these indicators can involve complex and invasive tests and are expensive, researchers have begun exploring the predictive ability of anthropometric indicators such as body mass index (BMI), waist circumference, body fat percentage, waist-to-height ratio, and waist-to-hip ratio in identifying MetS[12-14]. However, these indicators are not without limitations. For example, BMI does not reflect the fat content and distribution across the entire body, and waist circumference measurement requires repeated training and has great variability[15]. Furthermore, these indicators only consider the effect of fat on metabolism, yet ignore skeletal muscle, another important tissue.
Skeletal muscle is the body's largest non-fat component and can contribute up to 40% of the body weight of an adult[16]. It plays important roles in glucose metabolism, and synthesizes and secretes many biological signaling molecules that participate in energy metabolism[17, 18]. Studies have reported that a low muscle mass is associated with an increased risk for insulin resistance[19] and cardiovascular disease[20]. The phenomenon by which muscle mass reduces with the accumulation of adipose tissue is known as sarcopenic obesity, which is associated with MetS, and is more closely associated with MetS than with sarcopenia or obesity alone[21-23]. The muscle/fat ratio is also clinically useful for evaluating the presence of insulin resistance[24].
We explored the predictive value of the fat-to-muscle ratio (FMR) in diagnosing MetS, and hypothesized that the FMR is a good predictive indicator of MetS.
-
This study is part of the China National Health Survey project, a nationwide representative and population-based cross-sectional survey being conducted in several provinces of China. From October to December 2012, a multi-level, stratified, and cluster sampling method was used to conduct a cross-sectional survey of both Han and Bouyei people in Guizhou Province. In the first stage, the prefecture-level cities and autonomous counties with dwellers being mostly ethnic minorities were selected. Three Han and Bouyei areas with different economic situations and high population densities were selected in the province, namely Qiannan prefecture, Anshun City, and Guiyang City (provincial capital). These areas represent the developing, underdeveloped, and developed areas of the province, respectively. In the second stage, Longli County in Qiannan prefecture, Zhenning County in Anshun City, and two administrative districts in Guiyang were selected. The cities' communities or rural towns were randomly selected in the third stage. In the fourth stage, sub-districts were randomly selected from the corresponding communities, and villages were randomly selected from the rural towns. People aged 20-80 years old of both Han and Bouyei ethnicities who had been locally settled for more than 1 year were randomly selected according to age-sex-ethnicity distribution. A total of 5, 777 participants were included, and 5, 619 of them completed the questionnaire. MetS analysis was limited only to individuals with complete anthropometric measurements, laboratory tests, and questionnaire information, totaling 4, 553 people. The study was approved by the Bioethical Committee of the Institute of Basic Medical Sciences, the Chinese Academy of Medical Sciences, Beijing, China (approval No. 028-2013).
Written informed consent was obtained from all subjects before data collection.
-
Data collection was performed at the residence of each participant. For the questionnaire, local staff of the Centers for Disease Control trained in the survey program were employed for face-to-face interviews in the Bouyei language, the local dialect, and Mandarin. Questionnaire information included age, sex, ethnicity, education, occupation, and household income. Disease history included the diagnosis and treatment of diseases such as hypertension, diabetes, cancer, and infectious diseases. The authors had access to information that could identify individual participants during or after data collection.
-
Blood pressure was measured accurately with an electronic sphygmomanometer (HEM-907; Omron Healthcare, Kyoto, Japan). After resting for 5 min, each participant set their right arm at heart level and had their blood pressure taken three times, with an interval of 1 min between measurements, to determine the mean value. When measuring height, the participants removed their shoes and were measured three times to determine the mean (± 0.1 cm). When measuring body weight, fat mass, and muscle mass, the participants were in light clothing and stood barefoot. Measurements were taken using a body composition instrument (BC-420; Tanita, Tokyo, Japan) that used bioelectrical impedance analysis, with an accuracy of 0.01 kg. The bioelectrical impedance method used in this study is easy to perform, portable, and cost effectives, and the accuracy of its body composition analysis has been confirmed[25, 26]. However, as the accuracy of this measurement method may be affected by the amount of water a person has drunk or by physical activity, we asked participants to undergo the examination following a morning fast and not to undergo other examinations before the completion of this study's assessments. A new variable, FMR (ratio of fat mass to muscle mass, both in kilograms) was created. Waist circumference was measured midway between the iliac crest and lowermost margin of the ribs[27]. Hip circumference was the maximum circumference around the hips. Both waist and hip circumferences were measured three times to determine means.
-
A 10 mL of blood sample after overnight fasting was collected from the antecubital vein. It was then centrifuged for 10 min at 3, 000 rpm; separation and aliquot of serum was completed within 4 h. After completion of separate loadings, the serum was delivered to the local community health service center or the Centers for Disease Control, for storage at -20 ℃. After completion of the entire survey, a cold chain box was used to transport the serum to Peking Union Medical College Hospital, where it was stored at -80 ℃ before being analyzed. Blood glucose was measured using a modified hexokinase method, while total cholesterol, triglycerides, and very low-density lipoprotein cholesterol were measured using the enzymatic method, and high-density lipoprotein cholesterol (HDL-C) was measured using the chemical precipitation method. An automatic biochemical analyzer (AU5800 ll; Beckman Coulter, Brea, CA) was used for all measurements.
-
According to the 2005 criteria of the International Diabetes Federation (IDF)[28], MetS was defined as: (1) central obesity (Chinese men with a waist circumference ≥ 90 cm and women with a waist circumference ≥ 80 cm) and (2) combinations of any two of the following four indicators: (i) increased triglycerides: ≥ 1.7 mmol/L (150 mg/dL), or on drug therapy for elevated triglycerides; (ii) decreased HDL-C level: men < 1.03 mmol/L (40 mg/dL) and women < 1.29 mmol/L (50 mg/dL), or on drug therapy for low HDL; (iii) increased blood pressure: systolic blood pressure ≥ 130 or diastolic blood pressure ≥ 85 mmHg, or on drug therapy for elevated blood pressure, or had been previously diagnosed with hypertension; and (iv) increased fasting blood-glucose: fasting blood-glucose ≥ 100 mg/dL (5.6 mmol/L), or the participant had been previously diagnosed with type 2 diabetes, or on drug therapy for elevated glucose.
-
A database was established using EpiData (ver. 3.1) software. Data were entered by two people independently, and consistency testing was performed to ensure data accuracy. The Statistical Program for Social Sciences (IBM SPSS Statistics for Windows, ver. 19.0., Armonk, NY: IBM Corp) was used to analyze data. Measurement data are expressed as mean ± SD and/or numbers and percentages, as appropriate. Measurement data means were evaluated for normality by the Kolmogorov-Smirnov test and compared using the t-test. Count data were compared using the χ2 test. Age-standardized prevalence was calculated according to the 2010 population census of China[29]. A receiver operating characteristic curve (ROC) was drawn to calculate area under the curve (AUC) and the best cut-off value of the FMR for MetS was determined using the maximum Youden's index. Youden's index is defined as: J = [sensitivity + specificity-1]; the critical threshold value is the point at which the sensitivity and specificity is maximized. Multivariate logistic regression analysis was used to comprehensively analyze risk factors for MetS. A P-value < 0.05 was considered statistically significant.
-
There were 4, 553 participants who completed the questionnaire, and the biochemical and body composition examinations as well; 2, 344 of them were Han and 2, 209 were Bouyei. There were significant differences in the basic characteristics of the indicators between the Han and Bouyei groups (P < 0.05) (Table 1). Compared with the Han group, the Bouyei group was older, mostly from rural areas (85.29%), with a lower educational level, and exercised less frequently; however, more people in the Bouyei group were involved in heavy physical labor work and had smoking and drinking habits.
Table 1. General Characteristics of Participants from Han and Bouyei Populations from Guizhou, Southwest China
Variables Total Men Women Han Bouyei P Han Bouyei P Han Bouyei P Number of Cases 2.344 2.209 997 1.077 1.347 1.132 Age (y) 48.43 ± 14.08 49.80 ± 13.69 < 0.01 48.77 ± 13.72 49.88 ± 13.94 0.69 48.2 ± 14.35 49.72 ± 13.44 0.01 Regions < 0.01 < 0.01 < 0.01 Cities 1.464 (62.46) 321 (14.53) 637 (63.89) 138 (12.81) 827 (61.39) 183 (16.17) Villages 874 (37.29) 1.884 (85.29) 361 (36.21) 939 (87.19) 514 (38.16) 948 (83.75) Educational level < 0.01 < 0.01 < 0.01 Junior high school or below 1.331 (56.78) 1.718 (77.77) 500 (50.15) 786 (72.98) 831 (61.69) 932 (82.33) High school and above 1.003 (42.79) 479 (21.68) 492 (49.35) 288 (26.74) 511 (37.94) 191 (16.87) Manual labor < 0.01 < 0.01 < 0.01 Mild 1.654 (70.56) 842 (38.12) 616 (61.79) 353 (32.78) 1.038 (77.06) 489 (43.20) Moderate 227 (9.68) 131 (5.93) 149 (14.94) 81 (7.52) 78 (5.79) 50 (4.42) Heavy 461 (19.67) 1.231 (55.73) 231 (23.17) 640 (59.42) 230 (17.07) 591 (52.21) Exercise (day/week) < 0.01 < 0.01 < 0.01 0 1.339 (57.12) 1.904 (86.19) 572 (57.37) 903 (83.84) 767 (56.94) 1.001 (88.42) Monthly < 3 136 (5.80) 39 (1.77) 58 (5.82) 26 (2.41) 78 (5.79) 13 (1.15) 1-2 192 (8.19) 73 (3.3) 80 (8.02) 43 (3.99) 112 (8.31) 30 (2.65) 3-4 155 (6.61) 53 (2.40) 71 (7.12) 25 (2.32) 84 (6.24) 28 (2.47) 5-7 504 (21.50) 121 (5.40) 209 (20.96) 67 (6.22) 295 (21.90) 54 (4.77) Drinking < 0.01 0.03 < 0.01 Yes 868 (37.03) 982 (44.45) 682 (68.41) 783 (72.70) 186 (13.81) 199 (17.58) No 1.470 (62.71) 1.223 (55.36) 313 (31.39) 290 (26.93) 1.157 (85.89) 933 (82.42) Smoking < 0.01 0.14 0.10 Yes 675 (28.80) 752 (34.04) 648 (64.99) 733 (68.06) 27 (2.00) 19 (1.68) No 1.663 (70.95) 1.456 (65.91) 348 (34.90) 343 (31.85) 1.315 (97.62) 1.113 (98.32) Height (cm) 157.35 ± 8.32 155.36 ± 8.01 < 0.01 164.02 ± 6.29 161.01 ± 6.13 < 0.01 152.42 ± 5.82 149.98 ± 5.49 < 0.01 Weight (kg) 58.10 ± 10.84 53.24 ± 10.05 < 0.01 63.72 ± 10.42 57.38 ± 10.13 < 0.01 53.94 ± 9.13 43.30 ± 8.22 < 0.01 BMI 23.39 ± 3.49 21.96 ± 3.19 < 0.01 23.64 ± 3.34 22.05 ± 3.12 < 0.01 23.21 ± 3.59 21.88 ± 3.24 < 0.01 Body fat percentage (%) 27.78 ± 7.98 24.56 ± 8.05 < 0.01 21.45 ± 5.46 18.69 ± 5.42 < 0.01 32.51 ± 6.07 30.15 ± 5.86 < 0.01 Muscle mass (kg) 39.50 ± 7.77 37.85 ± 7.27 < 0.01 47.0 ± 5.39 43.79 ± 5.39 < 0.01 33.95 ± 3.33 32.20 ± 3.14 < 0.01 Body fat quantity (kg) 16.36 ± 6.16 13.27 ± 5.61 < 0.01 14.13 ± 5.43 11.17 ± 5.09 < 0.01 18.00 ± 6.15 15.27 ± 5.35 < 0.01 Grip strength (kg) 28.91 ± 9.36 28.50 ± 9.50 0.15 36.66 ± 7.92 34.71 ± 8.58 < 0.01 23.18 ± 5.37 22.60 ± 5.90 0.01 WC (cm) 79.10 ± 10.59 74.10 ± 9.80 < 0.01 81.60 ± 10.23 75.48 ± 10.03 < 0.01 77.25 ± 10.48 72.80 ± 9.39 < 0.01 Hip circumference (cm) 86.94 ± 6.59 83.17 ± 5.99 < 0.01 87.29 ± 6.22 83.27 ± 6.03 < 0.01 86.67 ± 6.83 83.07 ± 5.95 < 0.01 FBG (mmol/L) 5.19 ± 1.28 5.04 + 0.91 < 0.01 5.29 ± 1.35 5.17 ± 1.13 0.02 5.11 ± 1.22 4.92 ± 0.63 < 0.01 HDL (mmol/dL) 1.44 ± 0.33 1.60 ± 0.40 < 0.01 1.37 ± 0.34 1.58 ± 0.44 < 0.01 1.50 ± 0.32 1.62 ± 0.36 < 0.01 SBP (mmHg) 130.26 ± 20.81 133.66 ± 22.26 < 0.01 133.28 ± 19.19 136.76 ± 21.99 < 0.01 128.02 ± 21.66 130.71 ± 22.14 < 0.01 DBP (mmHg) 78.38 ± 11.92 78.98 ± 12.45 0.10 81.05 ± 11.84 81.53 ± 12.67 0.28 76.40 ± 11.59 76.45 ± 11.70 0.91 TG (mmol/dL) 1.74 ± 1.51 1.50 ± 1.47 < 0.01 1.99 ± 1.75 1.59 ± 1.85 < 0.01 1.55 ± 1.26 1.32 ± 0.93 < 0.01 Note. Continuous variables are expressed as mean ± SD and were compared using the t-test. Categorical variables are expressed as n (%) and were compared using the χ2 test. BMI: body mass index; WC: waist circumference; FBG: Fasting blood glucose; HDL: high-density lipoprotein; SBP: systolic blood pressure; DBP: diastolic blood pressure; TG: triglycerides. Regarding clinical features, there were no significant differences in grip strength and diastolic blood pressure. However, HDL-C and systolic blood pressure of the Bouyei group were significantly higher than that of the Han group. All other indicators were lower in the Bouyei group than in the Han group.
Sex-specific analysis showed no differences in smoking habits and diastolic blood pressure levels between the two ethnic groups. Women in the Bouyei group were older than women in the Han group. All other indicators were higher in the Han group compared with the Bouyei group.
-
Table 2 presents the crude prevalence rates for MetS and its components according to of the IDF's definition of MetS. Regardless of the overall or sex-specific situation, the prevalence of MetS and its components in the Han group were significantly higher than those in the Bouyei group (P < 0.01). Compared with other components, central obesity was the most prevalent component of MetS in the population from Guizhou. Comparisons between men and women showed no significant differences for high triglyceride levels (P = 0.18) and fasting blood glucose increases (or use of hypoglycemic drugs) (P = 0.10) between the sex; however, the prevalence of MetS, central obesity, low HDL-C, and hypertension (or use of antihypertensive drugs) for women were significantly higher than men.
Table 2. Crude Prevalence of Metabolic Syndrome and Its Components for Han and Bouyei Ethnicities
Crude Prewalence Total Men Women P (Men vs. Women) Han Bouyei P Han Bouyei P Han Bouyei P Han Bouyei MetS 448 (19.11) 192 (8.69) < 0.01 155 (15.55) 77 (7.15) < 0.01 293 (21.75) 115 (10.16) < 0.01 < 0.01 0.01 Central obesity 722 (30.81) 349 (15.80) < 0.01 216 (21.66) 109 (10.12) < 0.01 506 (37.56) 240 (21.20) < 0.01 < 0.01 < 0.01 High TG 388 (16.55) 187 (8.47) < 0.01 153 (15.35) 85 (7.89) < 0.01 235 (17.44) 102 (9.01) < 0.01 0.18 0.35 Low HDL 247 (10.54) 83 (3.76) < 0.01 55 (5.52) 15 (1.39) < 0.01 192 (14.25) 68 (6.01) < 0.01 < 0.01 < 0.01 Hypertension 500 (21.33) 238 (10.77) < 0.01 151 (15.15) 81 (7.52) < 0.01 349 (25.91) 157 (13.87) < 0.01 < 0.01 < 0.01 Hyperglycemia 207 (8.83) 89 (4.03) < 0.01 77 (7.72) 42 (3.89) < 0.01 130 (9.65) 47 (4.15) < 0.01 0.10 0.76 Note. Data are presented as n (%) and compared using the χ2 test. MetS, metabolic syndrome; TG: triglycerides; HDL: high-density lipoprotein; P: P-value. The age-standardized prevalence was calculated based on the calculated crude prevalence rate and the 2010 census data of Guizhou province (Table 3). The age-standardized prevalence of MetS was 11.38% (men: 9.76%; women 12.72%) for the Han group, and 4.78% (men: 4.43%; women: 5.30%) for the Bouyei group. Both Han and Bouyei groups were 40-49 years old when the prevalence peaked, and decreased with age.
Table 3. Age-standardized Prevalence of Metabolic Syndrome Based on the Criteria of the International Diabetes Federation
Age-group (years) Total Han Bouyei Han Bouyei Men Women Men Women 20-29 5 (0.26) 2 (0.15) 87 (0.44) 2 (0.17) 2 (0.28) 0 (0) 30-39 61 (2.30) 30 (1.02) 188 (2.63) 31 (2.04) 20 (1.51) 10 (0.62) 40-49 123 (3.46) 62 (1.59) 259 (3.69) 64 (3.26) 30 (1.58) 32 (1.61) 50-59 123 (2.58) 55 (1.19) 209 (1.74) 87 (3.23) 19 (0.85) 36 (1.51) 60-69 98 (1.74) 33 (0.58) 183 (0.77) 79 (2.52) 4 (0.13) 29 (1.09) 70-80 38 (1.04) 10 (0.25) 71 (0.49) 30 (1.50) 2 (0.08) 8 (0.47) Age-standardized (%) 11.38 4.78 9.76 12.72 4.43 5.30 Note. Data are presented as n (%). -
Table 4 presents the MetS types defined by the IDF standards. MetS types consist of central obesity along with other metabolic indicators. In the central obesity type combined with two components, hypertriglyceridemia plus hypertension (or use of antihypertensive drugs) was the most common regardless of sex or ethnicity. In the central obesity combined with three components, high triglycerides plus low HDL-C plus hypertension (or use of antihypertensive drugs) was the most common type for the Han group. Hypertension (or use of antihypertensive drugs) plus fasting hyperglycemia (or use of hypoglycemic drugs) plus high triglycerides was the most common type for the Bouyei group. High triglycerides plus hypertension (or use of antihypertensive drugs) plus fasting hyperglycemia (or use of hypoglycemic drugs) was the most common type for men. High triglycerides plus hypertension (or use of antihypertensive drugs) plus fasting hyperglycemia (or use of hypoglycemic drugs) was the most common type for women.
Table 4. Characteristics of Metabolic Syndrome
Characteristics of Metabolic Syndrome Total Men Women P (Men vs. Women) Han Bouvei P Han Bouyei P Han Bouyei P Han Bouyei WC+TG+HDL 167 (7.12) 61 (2.76) < 0.01 43 (4.31) 14 (1.30) < 0.01 124 (9.21) 47 (4.15) < 0.01 < 0.01 < 0.01 WC+TG+BP 282 (12.03) 144 (6.52) < 0.01 103 (10.33) 66 (6.13) < 0.01 179 (13.30) 78 (6.89) < 0.01 0.03 0.47 WC+TG+FBG 133 (5.67) 62 (2.81) < 0.01 56 (5.62) 37 (3.44) 0.02 77 (5.72) 25 (2.21) < 0.01 0.92 0.08 WC+HDL+BP 165 (7.04) 59 (2.67) < 0.01 32 (3.21) 11 (1.02) < 0.01 133 (9.87) 48 (4.24) < 0.01 < 0.01 < 0.01 WC+HDL+FBG 67 (2.86) 26 (1.18) < 0.01 17 (1.71) 7 (0.65) 0.03 50 (3.71) 19 (1.68) < 0.01 < 0.01 < 0.01 WC+BP+FBG 163 (6.95) 71 (3.21) < 0.01 57 (5.72) 35 (3.25) 0.01 106 (7.87) 36 (3.18) < 0.01 0.04 0.93 WC+TG+HDL+BP 118 (5.03) 47 (2.13) < 0.01 23 (2.31) 10 (0.93) 0.01 95 (7.05) 37 (3.27) < 0.01 < 0.01 < 0.01 WC+TG+HDL+FBG 57 (2.43) 22 (1.00) < 0.01 16 (1.60) 7 (0.65) 0.04 41 (3.04) 15 (1.33) < 0.01 0.03 0.11 WC+HDL+BP+FBG 52 (2.21) 20 (0.91) < 0.01 11 (1.10) 5 (0.46) 0.10 41 (3.04) 15 (1.33) < 0.01 < 0.01 0.03 WC+BP+FBG+TG 108 (4.61) 52 (2.35) < 0.01 43 (4.31) 32 (3.00) 0.10 65 (4.83) 20 (1.77) < 0.01 0.56 0.06 WC+TG+HDL+BP+FBG 47 (2.01) 17 (0.77) < 0.01 11 (1.10) 5 (0.46) 0.10 36 (2.67) 12 (1.06) < 0.01 0.01 0.11 Note. Data are presented as n (%). WC: Waist circumference; HDL: high-density lipoprotein; TG: triglycerides; BP: blood pressure; FBG: Fasting blood glucose. -
The FMR cut-off point for MetS was determined using the maximum Youden's index and the area under the ROC curve. For men, the FMR cut-off point was 0.34, and the area under the ROC curve was 0.95, while the sensitivity and specificity were 0.94 and 0.85, respectively. For women, the FMR cut-off point was 0.55, and the area under the ROC curve was 0.91, while the sensitivity and specificity were 0.93 and 0.79, respectively (Table 5, Figure 1).
Table 5. Receiver Operating Characteristic Curve Analysis of Fat-to-muscle Ratio for Diagnostic Prediction of Metabolic Syndrome
Sex Positive Numbers Negative Numbers FMR Cut-off Point Sensitivity Specificity PPV NPV AUC 95% CI P Value Men 232 1, 842 0.34 0.94 0.85 0.44 0.99 0.95 0.94-0.96 < 0.01 Women 408 2, 071 0.55 0.93 0.79 0.46 0.98 0.91 0.90-0.93 < 0.01 Note. FMR: fat-to-muscle ratio; PPV: positive predictive value; NPV: negative predictive value; AUC: area under the curve; CI: confidence interval. 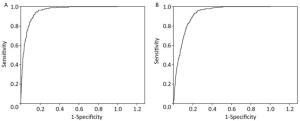
Figure 1. Receiver operating characteristic curve analysis of fat-to-muscle ratio for diagnostic prediction of metabolic syndrome (A for men, B for women).
-
Participants were grouped by sex and risk factors for MetS were analyzed using multivariate logistic regression analysis with MetS as a dependent variable. Independent variables included age, ethnicity, region, BMI, hip circumference, grip strength, FMR (divided into two groups according to the cut-off points), history of hypertension, history of diabetes, exercise, manual labor, smoking or not, and drinking or not. The factors finally included in the model were age, hip circumference, history of diabetes, history of hypertension, BMI, and FMR (Table 6). Hip circumference, history of diabetes, BMI, and FMR were independent risk factors, regardless of sex or ethnicity. Compared with the FMR value below the cut-off point, people above the cut-off point had a much higher risk for MetS (men odds ratio: 6.90, 95% confidence interval: 3.09-15.39; women odds ratio: 10.44, 95% confidence interval: 5.65-19.28.
Table 6. Multivariate Logistic Regression Analysis of Metabolic Syndrome
Sex Men Women OR (95% CI) P OR (95% CI) P Age 1.00 (0.98, 1.03) 0.86 1.05 (1.03, 1.06) < 0.01 Ethnicity 0.94 (1.13, 1.59) 0.82 0.92 (0.60, 1.41) 0.70 Region 0.93 (0.50, 1.72) 0.82 1.00 (0.60, 1.41) 0.92 BMI 1.34 (1.13, 1.59) < 0.01 1.28 (1.26, 1.41) < 0.01 Hip circumference 1.16 (1.08, 1.25) 0.00 1.00 (0.97, 1.04) 0.89 Grip strength 1.00 (0.96, 1.03) 0.93 1.03 (1.00, 1.07) 0.10 History of hypertension 1.24 (0.68, 2.24) 0.49 1.55 (1.00, 2.40) 0.05 History of diabetes 4.27 (1.53, 11.97) < 0.01 3.21 (1.39, 7.39) 0.01 Smoking 0.21 0.69 No 1.00 1.00 Yes 1.37 (0.84, 2.21) 0.75 (0.19, 2.97) Drinking 0.28 0.14 No 1.00 1.00 Yes 1.35 (0.78, 2.33) 1.46 (0.88, 2.40) Exercise (days/week) 0.91 0.75 0 1.00 1.00 Monthly < 3 0.75 (0.37, 1.52) 1.06 (0.65, 1.72) 1-2 0.71 (0.31, 1.64) 1.63 (0.79, 3.36) 3-4 0.89 (0.39, 2.08) 1.03 (0.47, 2.27) 5-7 0.96 (0.37, 2.51) 1.23 (0.52, 2.95) Manual labor 0.47 0.55 Mild 1.00 1.00 Moderate 0.94 (0.48, 1.85) 0.95 (0.50, 1.80) Heavy 0.61 (0.28, 1.34) 0.76 (0.46, 1.25) FMR 6.90 (3.09, 15.39) < 0.01 10.44 (5.65, 19.28) < 0.01 Note. OR: odds ratio; CI: confidence interval; FMR: fat-to-muscle-ratio (divided into two groups according to the cut-off points). -
The prevalence of MetS and its components in two major ethnic groups (Han and Bouyei) in Guizhou Province was determined for the first time using a stratified cluster sampling method. FMR was found to have diagnostic value for MetS for these populations in Guizhou Province, and is an independent risk factor.
In China, the prevalence of MetS has been monitored in many regions, namely the northeast (27.4%), Beijing (32.3%), Guangdong (26.7%), and Jiangsu (29.5%)[30-33]. There are, however, few reports covering the southwest provinces.
In the current study, the prevalence of MetS in the Han and Bouyei ethnic populations in Guizhou province is reported for the first time. Based on diagnostic criteria defined in the 2005 IDF standards, the prevalence of MetS was 19.11% (men: 15.55%; women: 21.75%) for the Han and 8.69% (men: 7.15%; women: 10.16%) for the Bouyei populations. The prevalence of MetS in the Han group was higher than that in the Bouyei group and the prevalence for women was higher than that of men in Guizhou province.
According to the 2010 population census of China, the age-standardized prevalence of MetS is 11.38% (men: 9.76%; women: 12.72%) for Han, which is lower than the national prevalence of 18.2% (men: 16.2%; women: 20.0%) as reported in the China Health and Nutrition Survey[34]. This may be associated with factors such as the location (southwest China), the underdeveloped economy, and the different climate, geography, and lifestyle habits in Guizhou province as compared with other regions of China.
We found that the most common component of MetS was central obesity for the Han (30.81%) and Bouyei (15.80%) groups in Guizhou province, which is consistent with the results of a meta-analysis of 35 related studies[35]. Among those diagnosed with MetS, central obesity plus high triglycerides and hypertension was the most common type (12.03% for Han and 6.52% for Bouyei). This may be related to the Guizhou diet, characterized by high content of oil and salt.
Although the prevalence of MetS in Guizhou province is lower than the national average, it is believed that the prevalence of MetS is expected to increase with ongoing urbanization and economic development. Therefore, targeted early prevention and diagnosis based on the characteristics of MetS in Guizhou province will help reduce social, economic, and health burdens and costs.
In addition to the relationship between fat and metabolism, muscle has also been found in recent years to play an important role in metabolism. Skeletal muscle is responsible for controlling 70%-90% of insulin-mediated glucose metabolism[36, 37]. Skeletal muscle also expresses, synthesizes, and secretes many biological signaling molecules. The regulation of skeletal muscle's functions, including growth and metabolism, are through paracrine or autocrine processes. Skeletal muscle can also regulate other tissues of the body through endocrine processes. Therefore, skeletal muscle is considered an important endocrine organ.
As people grow older, their mass and strength of skeletal muscle declines. Janssen et al.[16] suggested that skeletal muscle mass decreases significantly in men and women after the age of 45, a finding consistent with the highest prevalence of MetS in the 40-49 age group in the current study.
A new phenomenon called sarcopenic obesity has been identified, which is characterized by the decrease in muscle mass and the increase in fat tissue[38]. Ferrara et al.[39] reported that the relative fat-free mass-reduction group was more prone to impaired glucose tolerance than the normal fat-free mass group in a study of patients who were overweight or had obesity. Chung et al.[40] reported that, in 2, 943 patients over 60 years of age, the risk for insulin resistance or MetS with sarcopenic obesity was higher than that seen in simple sarcopenia, simple obesity, and a normal population. It is currently thought that sarcopenic obesity increases the risk for MetS, and that the increase in fat tissue is associated with insulin resistance caused by a reduction of insulin-targeted tissue arising from the decrease in muscle mass. It is therefore suggested that the amount of fat and muscle in the diagnosis of MetS should be considered, and as FMR considers both, it may be a good indicator for predicting MetS.
This study found for the first time that FMR showed a relatively high value for predicting MetS. Furthermore, the multivariate logistic regression analysis showed that FMR is an independent risk factor for MetS in both men and women. The risk for MetS in men with a FMR above 0.34 was 6.9 times higher than that in the group with a FMR below 0.34, and 10.44 times for women with a FMR above 0.55. Muscle strength (grip strength) was not an impact factor.
This study has several limitations. First, its cross-sectional study design excludes consideration of the sequence of occurrence of exposure and outcome, and cannot elucidate the causal link between exposure and outcome. Second, the study only used the diagnostic standard of the IDF for MetS, and it is not certain whether it also has predictive significance with other diagnostic standards. Third, the study was limited to a population of Guizhou province, and whether the results are applicable to other populations requires further study and verification.
-
A large-scale cross-sectional survey was conducted in Guizhou province in southwestern China. The prevalence and main types of MetS for Han and Bouyei ethnicities in Guizhou province are reported for the first time. The prevalence of MetS in Guizhou province is lower than the national average. We also investigated the possible factors influencing MetS. We found that hip circumference, history of diabetes, BMI, and FMR were independent risk factors, regardless of sex or ethnicity. Thus, we provide a scientific basis for possible prevention and control measures for related populations. FMR showed a high predictive value for MetS in this population, and the measurement method is simple, easy to calculate, and suitable for population screening. The method could be used as an important reference indicator for the early identification of MetS, and may play a role in the prevention and reduction of cardiovascular and cerebrovascular diseases.
-
We thank all the staff and researchers in the CNHS Study for their long-term commitment to the study. We also thank Zhenning CDC and Nanming district CDC for their assistance.
doi: 10.3967/bes2018.034
Fat-to-muscle Ratio: A New Anthropometric Indicator for Predicting Metabolic Syndrome in the Han and Bouyei Populations from Guizhou Province, China
-
Abstract:
Objective To investigate the prevalence and possible factors influencing metabolic syndrome in people from Guizhou Province and to explore the predictive value of the fat-to-muscle ratio in diagnosing metabolic syndrome. Methods A multistage stratified sampling method was used in this cross-sectional study of 20-80 years old Han and Bouyei populations from Guizhou Province, southwestern China, from October-December 2012. The study included 4, 553 cases of metabolic syndrome, that was defined according to 2005 International Diabetes Federation criteria. The receiver operating characteristic curve was used for determining the sensitivity, specificity, and predictive ability of the fat-to-muscle ratio for the diagnosis of metabolic syndrome. Results The age-standardized prevalence of metabolic syndrome was 11.38% (men:9.76%; women:12.72%) for Han and 4.78% (men:4.43%; women:5.30%) for Bouyei populations. In Guizhou Province, the cut-off value for the men fat-to-muscle ratio was 0.34, the area under the curve was 0.95, and the sensitivity and specificity were 0.94 and 0.85, respectively. The cut-off value for the women fat-to-muscle ratio was 0.55, the area under the curve was 0.91, and the sensitivity and specificity were 0.93 and 0.79, respectively. Conclusion The fat-to-muscle ratio is highly predictive of metabolic syndrome in Guizhou Province, and a useful reference indicator. -
Key words:
- Metabolic syndrome /
- Anthropometric indicator /
- Muscle /
- Fat /
- Fat-to-muscle ratio
-
Figure 1. Receiver operating characteristic curve analysis of fat-to-muscle ratio for diagnostic prediction of metabolic syndrome (A for men, B for women).
Table 1. General Characteristics of Participants from Han and Bouyei Populations from Guizhou, Southwest China
Variables Total Men Women Han Bouyei P Han Bouyei P Han Bouyei P Number of Cases 2.344 2.209 997 1.077 1.347 1.132 Age (y) 48.43 ± 14.08 49.80 ± 13.69 < 0.01 48.77 ± 13.72 49.88 ± 13.94 0.69 48.2 ± 14.35 49.72 ± 13.44 0.01 Regions < 0.01 < 0.01 < 0.01 Cities 1.464 (62.46) 321 (14.53) 637 (63.89) 138 (12.81) 827 (61.39) 183 (16.17) Villages 874 (37.29) 1.884 (85.29) 361 (36.21) 939 (87.19) 514 (38.16) 948 (83.75) Educational level < 0.01 < 0.01 < 0.01 Junior high school or below 1.331 (56.78) 1.718 (77.77) 500 (50.15) 786 (72.98) 831 (61.69) 932 (82.33) High school and above 1.003 (42.79) 479 (21.68) 492 (49.35) 288 (26.74) 511 (37.94) 191 (16.87) Manual labor < 0.01 < 0.01 < 0.01 Mild 1.654 (70.56) 842 (38.12) 616 (61.79) 353 (32.78) 1.038 (77.06) 489 (43.20) Moderate 227 (9.68) 131 (5.93) 149 (14.94) 81 (7.52) 78 (5.79) 50 (4.42) Heavy 461 (19.67) 1.231 (55.73) 231 (23.17) 640 (59.42) 230 (17.07) 591 (52.21) Exercise (day/week) < 0.01 < 0.01 < 0.01 0 1.339 (57.12) 1.904 (86.19) 572 (57.37) 903 (83.84) 767 (56.94) 1.001 (88.42) Monthly < 3 136 (5.80) 39 (1.77) 58 (5.82) 26 (2.41) 78 (5.79) 13 (1.15) 1-2 192 (8.19) 73 (3.3) 80 (8.02) 43 (3.99) 112 (8.31) 30 (2.65) 3-4 155 (6.61) 53 (2.40) 71 (7.12) 25 (2.32) 84 (6.24) 28 (2.47) 5-7 504 (21.50) 121 (5.40) 209 (20.96) 67 (6.22) 295 (21.90) 54 (4.77) Drinking < 0.01 0.03 < 0.01 Yes 868 (37.03) 982 (44.45) 682 (68.41) 783 (72.70) 186 (13.81) 199 (17.58) No 1.470 (62.71) 1.223 (55.36) 313 (31.39) 290 (26.93) 1.157 (85.89) 933 (82.42) Smoking < 0.01 0.14 0.10 Yes 675 (28.80) 752 (34.04) 648 (64.99) 733 (68.06) 27 (2.00) 19 (1.68) No 1.663 (70.95) 1.456 (65.91) 348 (34.90) 343 (31.85) 1.315 (97.62) 1.113 (98.32) Height (cm) 157.35 ± 8.32 155.36 ± 8.01 < 0.01 164.02 ± 6.29 161.01 ± 6.13 < 0.01 152.42 ± 5.82 149.98 ± 5.49 < 0.01 Weight (kg) 58.10 ± 10.84 53.24 ± 10.05 < 0.01 63.72 ± 10.42 57.38 ± 10.13 < 0.01 53.94 ± 9.13 43.30 ± 8.22 < 0.01 BMI 23.39 ± 3.49 21.96 ± 3.19 < 0.01 23.64 ± 3.34 22.05 ± 3.12 < 0.01 23.21 ± 3.59 21.88 ± 3.24 < 0.01 Body fat percentage (%) 27.78 ± 7.98 24.56 ± 8.05 < 0.01 21.45 ± 5.46 18.69 ± 5.42 < 0.01 32.51 ± 6.07 30.15 ± 5.86 < 0.01 Muscle mass (kg) 39.50 ± 7.77 37.85 ± 7.27 < 0.01 47.0 ± 5.39 43.79 ± 5.39 < 0.01 33.95 ± 3.33 32.20 ± 3.14 < 0.01 Body fat quantity (kg) 16.36 ± 6.16 13.27 ± 5.61 < 0.01 14.13 ± 5.43 11.17 ± 5.09 < 0.01 18.00 ± 6.15 15.27 ± 5.35 < 0.01 Grip strength (kg) 28.91 ± 9.36 28.50 ± 9.50 0.15 36.66 ± 7.92 34.71 ± 8.58 < 0.01 23.18 ± 5.37 22.60 ± 5.90 0.01 WC (cm) 79.10 ± 10.59 74.10 ± 9.80 < 0.01 81.60 ± 10.23 75.48 ± 10.03 < 0.01 77.25 ± 10.48 72.80 ± 9.39 < 0.01 Hip circumference (cm) 86.94 ± 6.59 83.17 ± 5.99 < 0.01 87.29 ± 6.22 83.27 ± 6.03 < 0.01 86.67 ± 6.83 83.07 ± 5.95 < 0.01 FBG (mmol/L) 5.19 ± 1.28 5.04 + 0.91 < 0.01 5.29 ± 1.35 5.17 ± 1.13 0.02 5.11 ± 1.22 4.92 ± 0.63 < 0.01 HDL (mmol/dL) 1.44 ± 0.33 1.60 ± 0.40 < 0.01 1.37 ± 0.34 1.58 ± 0.44 < 0.01 1.50 ± 0.32 1.62 ± 0.36 < 0.01 SBP (mmHg) 130.26 ± 20.81 133.66 ± 22.26 < 0.01 133.28 ± 19.19 136.76 ± 21.99 < 0.01 128.02 ± 21.66 130.71 ± 22.14 < 0.01 DBP (mmHg) 78.38 ± 11.92 78.98 ± 12.45 0.10 81.05 ± 11.84 81.53 ± 12.67 0.28 76.40 ± 11.59 76.45 ± 11.70 0.91 TG (mmol/dL) 1.74 ± 1.51 1.50 ± 1.47 < 0.01 1.99 ± 1.75 1.59 ± 1.85 < 0.01 1.55 ± 1.26 1.32 ± 0.93 < 0.01 Note. Continuous variables are expressed as mean ± SD and were compared using the t-test. Categorical variables are expressed as n (%) and were compared using the χ2 test. BMI: body mass index; WC: waist circumference; FBG: Fasting blood glucose; HDL: high-density lipoprotein; SBP: systolic blood pressure; DBP: diastolic blood pressure; TG: triglycerides.  下载: 导出CSV
Table 2. Crude Prevalence of Metabolic Syndrome and Its Components for Han and Bouyei Ethnicities
Crude Prewalence Total Men Women P (Men vs. Women) Han Bouyei P Han Bouyei P Han Bouyei P Han Bouyei MetS 448 (19.11) 192 (8.69) < 0.01 155 (15.55) 77 (7.15) < 0.01 293 (21.75) 115 (10.16) < 0.01 < 0.01 0.01 Central obesity 722 (30.81) 349 (15.80) < 0.01 216 (21.66) 109 (10.12) < 0.01 506 (37.56) 240 (21.20) < 0.01 < 0.01 < 0.01 High TG 388 (16.55) 187 (8.47) < 0.01 153 (15.35) 85 (7.89) < 0.01 235 (17.44) 102 (9.01) < 0.01 0.18 0.35 Low HDL 247 (10.54) 83 (3.76) < 0.01 55 (5.52) 15 (1.39) < 0.01 192 (14.25) 68 (6.01) < 0.01 < 0.01 < 0.01 Hypertension 500 (21.33) 238 (10.77) < 0.01 151 (15.15) 81 (7.52) < 0.01 349 (25.91) 157 (13.87) < 0.01 < 0.01 < 0.01 Hyperglycemia 207 (8.83) 89 (4.03) < 0.01 77 (7.72) 42 (3.89) < 0.01 130 (9.65) 47 (4.15) < 0.01 0.10 0.76 Note. Data are presented as n (%) and compared using the χ2 test. MetS, metabolic syndrome; TG: triglycerides; HDL: high-density lipoprotein; P: P-value.
下载: 导出CSV
Table 3. Age-standardized Prevalence of Metabolic Syndrome Based on the Criteria of the International Diabetes Federation
Age-group (years) Total Han Bouyei Han Bouyei Men Women Men Women 20-29 5 (0.26) 2 (0.15) 87 (0.44) 2 (0.17) 2 (0.28) 0 (0) 30-39 61 (2.30) 30 (1.02) 188 (2.63) 31 (2.04) 20 (1.51) 10 (0.62) 40-49 123 (3.46) 62 (1.59) 259 (3.69) 64 (3.26) 30 (1.58) 32 (1.61) 50-59 123 (2.58) 55 (1.19) 209 (1.74) 87 (3.23) 19 (0.85) 36 (1.51) 60-69 98 (1.74) 33 (0.58) 183 (0.77) 79 (2.52) 4 (0.13) 29 (1.09) 70-80 38 (1.04) 10 (0.25) 71 (0.49) 30 (1.50) 2 (0.08) 8 (0.47) Age-standardized (%) 11.38 4.78 9.76 12.72 4.43 5.30 Note. Data are presented as n (%).
下载: 导出CSV
Table 4. Characteristics of Metabolic Syndrome
Characteristics of Metabolic Syndrome Total Men Women P (Men vs. Women) Han Bouvei P Han Bouyei P Han Bouyei P Han Bouyei WC+TG+HDL 167 (7.12) 61 (2.76) < 0.01 43 (4.31) 14 (1.30) < 0.01 124 (9.21) 47 (4.15) < 0.01 < 0.01 < 0.01 WC+TG+BP 282 (12.03) 144 (6.52) < 0.01 103 (10.33) 66 (6.13) < 0.01 179 (13.30) 78 (6.89) < 0.01 0.03 0.47 WC+TG+FBG 133 (5.67) 62 (2.81) < 0.01 56 (5.62) 37 (3.44) 0.02 77 (5.72) 25 (2.21) < 0.01 0.92 0.08 WC+HDL+BP 165 (7.04) 59 (2.67) < 0.01 32 (3.21) 11 (1.02) < 0.01 133 (9.87) 48 (4.24) < 0.01 < 0.01 < 0.01 WC+HDL+FBG 67 (2.86) 26 (1.18) < 0.01 17 (1.71) 7 (0.65) 0.03 50 (3.71) 19 (1.68) < 0.01 < 0.01 < 0.01 WC+BP+FBG 163 (6.95) 71 (3.21) < 0.01 57 (5.72) 35 (3.25) 0.01 106 (7.87) 36 (3.18) < 0.01 0.04 0.93 WC+TG+HDL+BP 118 (5.03) 47 (2.13) < 0.01 23 (2.31) 10 (0.93) 0.01 95 (7.05) 37 (3.27) < 0.01 < 0.01 < 0.01 WC+TG+HDL+FBG 57 (2.43) 22 (1.00) < 0.01 16 (1.60) 7 (0.65) 0.04 41 (3.04) 15 (1.33) < 0.01 0.03 0.11 WC+HDL+BP+FBG 52 (2.21) 20 (0.91) < 0.01 11 (1.10) 5 (0.46) 0.10 41 (3.04) 15 (1.33) < 0.01 < 0.01 0.03 WC+BP+FBG+TG 108 (4.61) 52 (2.35) < 0.01 43 (4.31) 32 (3.00) 0.10 65 (4.83) 20 (1.77) < 0.01 0.56 0.06 WC+TG+HDL+BP+FBG 47 (2.01) 17 (0.77) < 0.01 11 (1.10) 5 (0.46) 0.10 36 (2.67) 12 (1.06) < 0.01 0.01 0.11 Note. Data are presented as n (%). WC: Waist circumference; HDL: high-density lipoprotein; TG: triglycerides; BP: blood pressure; FBG: Fasting blood glucose.
下载: 导出CSV
Table 5. Receiver Operating Characteristic Curve Analysis of Fat-to-muscle Ratio for Diagnostic Prediction of Metabolic Syndrome
Sex Positive Numbers Negative Numbers FMR Cut-off Point Sensitivity Specificity PPV NPV AUC 95% CI P Value Men 232 1, 842 0.34 0.94 0.85 0.44 0.99 0.95 0.94-0.96 < 0.01 Women 408 2, 071 0.55 0.93 0.79 0.46 0.98 0.91 0.90-0.93 < 0.01 Note. FMR: fat-to-muscle ratio; PPV: positive predictive value; NPV: negative predictive value; AUC: area under the curve; CI: confidence interval.
下载: 导出CSV
Table 6. Multivariate Logistic Regression Analysis of Metabolic Syndrome
Sex Men Women OR (95% CI) P OR (95% CI) P Age 1.00 (0.98, 1.03) 0.86 1.05 (1.03, 1.06) < 0.01 Ethnicity 0.94 (1.13, 1.59) 0.82 0.92 (0.60, 1.41) 0.70 Region 0.93 (0.50, 1.72) 0.82 1.00 (0.60, 1.41) 0.92 BMI 1.34 (1.13, 1.59) < 0.01 1.28 (1.26, 1.41) < 0.01 Hip circumference 1.16 (1.08, 1.25) 0.00 1.00 (0.97, 1.04) 0.89 Grip strength 1.00 (0.96, 1.03) 0.93 1.03 (1.00, 1.07) 0.10 History of hypertension 1.24 (0.68, 2.24) 0.49 1.55 (1.00, 2.40) 0.05 History of diabetes 4.27 (1.53, 11.97) < 0.01 3.21 (1.39, 7.39) 0.01 Smoking 0.21 0.69 No 1.00 1.00 Yes 1.37 (0.84, 2.21) 0.75 (0.19, 2.97) Drinking 0.28 0.14 No 1.00 1.00 Yes 1.35 (0.78, 2.33) 1.46 (0.88, 2.40) Exercise (days/week) 0.91 0.75 0 1.00 1.00 Monthly < 3 0.75 (0.37, 1.52) 1.06 (0.65, 1.72) 1-2 0.71 (0.31, 1.64) 1.63 (0.79, 3.36) 3-4 0.89 (0.39, 2.08) 1.03 (0.47, 2.27) 5-7 0.96 (0.37, 2.51) 1.23 (0.52, 2.95) Manual labor 0.47 0.55 Mild 1.00 1.00 Moderate 0.94 (0.48, 1.85) 0.95 (0.50, 1.80) Heavy 0.61 (0.28, 1.34) 0.76 (0.46, 1.25) FMR 6.90 (3.09, 15.39) < 0.01 10.44 (5.65, 19.28) < 0.01 Note. OR: odds ratio; CI: confidence interval; FMR: fat-to-muscle-ratio (divided into two groups according to the cut-off points).
下载: 导出CSV
-
[1] Eckel RH, Grundy SM, Zimmet PZ. The metabolic syndrome. Lancet, 2005; 365, 1415-28. doi: 10.1016/S0140-6736(05)66378-7 [2] M Trevisan, J Liu, FB Bahsas, et al. Syndrome X and mortality: a population-based study. Risk Factor and Life Expectancy Research Group. Am J Epidemiol, 1998; 148, 958-66. doi: 10.1093/oxfordjournals.aje.a009572 [3] Alberti KG, Zimmet P, Shaw J, et al. The metabolic syndrome-a new worldwide definition. Lancet, 2005; 366, 1059-62. doi: 10.1016/S0140-6736(05)67402-8 [4] Mottillo S, Filion KB, Genest J, et al. The metabolic syndrome and cardiovascular risk a systematic review and meta-analysis. J Am CollCardiol, 2010; 56, 1113-32. doi: 10.1016/j.jacc.2010.05.034 [5] Saito I. Epidemiological evidence of type 2 diabetes mellitus, metabolic syndrome, and cardiovasculardisease in Japan. Circ J, 2012; 76, 1066-73. doi: 10.1253/circj.CJ-11-1519 [6] Lu J, Wang L, Li M, et al. Metabolic Syndrome Among Adults in China: The 2010 China Noncommunicable Disease Surveillance. J Clin Endocrinol Metab, 2017; 102, 507-15. https://academic.oup.com/jcem/article/102/2/507/2972061 [7] Gobato AO, Vasques AC, Zambon MP, et al. Metabolic syndrome and insulin resistance in obese adolescents. Rev Paul Pediatr, 2014; 32, 55-62. doi: 10.1590/S0103-05822014000100010 [8] Zhong L, Li Q, Jiang Y, et al. The ApoB/ApoA1 ratio is associated with metabolic syndrome and its components in a Chinese population. Inflammation, 2010; 33, 353-8. doi: 10.1007/s10753-010-9193-4 [9] Voils SA, Cooper-DeHoff RM. Association between high sensitivity C-reactive protein and metabolic syndrome in subjects completing the National Health and Nutrition Examination Survey (NHANES) 2009-10. Diabetes Metab Syndr, 2014; 8, 88-90. doi: 10.1016/j.dsx.2014.04.021 [10] Galletti F, Barbato A, VersieroM, et al. Circulating leptin levels predict the development of metabolic syndrome in middle-aged men: an 8-year follow-up study. J Hypertens, 2007; 25, 1671-7. doi: 10.1097/HJH.0b013e3281afa09e [11] Kim DJ, Noh JH, Lee BW, et al. The associations of total and differential white blood cell counts with obesity, hypertension, dyslipidemia and glucose intolerance in a Korean population. J Korean Med Sci, 2008; 23, 193-8. doi: 10.3346/jkms.2008.23.2.193 [12] Hiremath R, Ibrahim J, Prasanthi K, et al. Comparative Study of Ultrasonographic and Anthropometric Measurements of Regional Adiposity in Metabolic Syndrome. J Clin Diagn Res, 2017; 11, TC01-05. https://www.researchgate.net/publication/319245241_Comparative_Study_of_Ultrasonographic_and_Anthropometric_Measurements_of_Regional_Adiposity_in_Metabolic_Syndrome [13] Wicklow BA, Becker A, Chateau D, et al. Comparison of anthropometric measurements in children to predict metabolic syndrome in adolescence: analysis of prospective cohort data. Int J Obes (Lond), 2015; 39, 1070-8. doi: 10.1038/ijo.2015.55 [14] Ramírez-Vélez R, Correa-Bautista JE, Sanders-Tordecilla A, et al. Percentage of Body Fat and Fat Mass Index as a Screening Tool for Metabolic Syndrome Prediction in Colombian University Students. Nutrients, 2017; 9. http://www.mdpi.com/2072-6643/9/9/1009/pdf [15] Cornier MA, Després JP, Davis N, et al. Assessing adiposity: a scientific statement from the American Heart Association. Circulation, 2011; 124, 1996-2019. doi: 10.1161/CIR.0b013e318233bc6a [16] Janssen I, Heymsfield SB, Wang ZM, et al. Skeletal muscle mass and distribution in 468 men and women aged 18-88 yr. J Appl Physiol, (1985) 2000; 89, 81-8. https://www.researchgate.net/profile/Ian_Janssen/publication/306150258_Skeletal_muscle_mass_and_distribution_in_468_men_and_women_aged_18-88_yr/links/57ea97fe08aed3a3e08aae16.pdf?origin=publication_detail [17] Friedrichsen M, Mortensen B, Pehmoller C, et al. Exercise-induced AMPK activity in skeletal muscle: role in glucose uptake and insulin sensitivity. Mol Cell Endocrinol, 2013; 366, 204-14. doi: 10.1016/j.mce.2012.06.013 [18] Febbraio MA, Pedersen BK. Contraction-induced myokine production and release:is skeletal muscle an endocrine organ? Exerc Sport Sci Rev, 2005; 33, 114-9. doi: 10.1097/00003677-200507000-00003 [19] Srikanthan P, Karlamangla AS. Relative muscle mass is inversely associated with insulin resistance and prediabetes Findings from the third National Health and Nutrition Examination Survey. J Clin Endocrinol Metab, 2011; 96, 2898-903. doi: 10.1210/jc.2011-0435 [20] Kim Y, Han BD, Han K, et al. Optimal cutoffs for low skeletal muscle mass related to cardiovascular risk in adults: The Korea National Health and Nutrition Examination Survey 2009-2010. Endocrine, 2015; 50, 424-33. doi: 10.1007/s12020-015-0577-y [21] Kim TN, Choi KM. The implications of sarcopenia and sarcopenic obesity on cardiometabolic disease. J Cell Biochem, 2015; 116, 1171-8. doi: 10.1002/jcb.v116.7 [22] Lu CW, Yang KC, Chang HH, et al. Sarcopenic obesity is closely associated with metabolic syndrome. Obes Res Clin Pract, 2013; 7, e301-7. doi: 10.1016/j.orcp.2012.02.003 [23] Lim S, Kim JH, Yoon JW, et al. Sarcopenic obesity: prevalence and association with metabolic syndrome in the Korean Longitudinal Study on Health and Aging (KLoSHA). Diabetes Care, 2010; 33, 1652-4. doi: 10.2337/dc10-0107 [24] Kurinami N, Sugiyama S, Yoshida A, et al. Correlation of body muscle/fat ratio with insulin sensitivity using hyperinsulinemic-euglycemic clamp in treatment-naïve type 2 diabetes mellitus. Diabetes Res Clin Pract, 2016; 120, 65-72. doi: 10.1016/j.diabres.2016.07.018 [25] Thomson R, Brinkworth GD, Buckley JD, et al. Good agreement between bioelectrical impedance and dual-energy X-ray absorptiometry for estimating changes in body composition during weight loss in overweight young women. Clin Nutr, 2007; 26, 771-7. doi: 10.1016/j.clnu.2007.08.003 [26] Jaffrin MY, Kieffer R, Moreno MV. Evaluation of a foot-to-foot impedance meter measuring extracellular fluid volume in addition to fat-free mass and fat tissue mass. Nutrition, 2005; 21, 815-24. doi: 10.1016/j.nut.2004.11.016 [27] World Health Organization. Obesity: Preventing and Managing the Global Epidemic. Report of a WHO consultation on obesity. World Health Organ Tech Rep Ser, 2000; 894: i-xii, 1-253. https://www.ncbi.nlm.nih.gov/pubmed/11234459 [28] Zimmet P, M M Alberti KG, Serrano Ríos M. A new international dia-betes federation worldwide definition of the metabolic syndrome: the rationale and the results. Rev Esp Cardiol, 2005; 58, 1371-6. doi: 10.1016/S0300-8932(05)74065-3 [29] National Bureau of Statistics of China (NBS). Tabulation on the 2010 Population Census of People's Republic of China; China Statistics Press: Beijing, China, 2012. [30] Song QB, Zhao Y, Liu YQ, et al. Sex difference in the prevalence of metabolic syndrome and cardiovascular-related risk factors in urban adults from 33 communities of China: The CHPSNE study. Diab Vasc Dis Res, 2015; 12, 189-98. doi: 10.1177/1479164114562410 [31] Zhang YH, Dai HQ, Wu JJ, et al. Investigation on prevalence of themajor chronic diseases and its related risk factors among adult residents inDaxing district of Beijing city. Chin J Prey Contr Chron Dis, 2014; 4, 423-8. http://en.cnki.com.cn/Article_en/CJFDTotal-ZMXB201404014.htm [32] Li JB, Wang X, Zhang JX, et al. Metabolicsyndrome: prevalence and risk factors in southern China. J Int Med Res, 2010; 38, 1142-8. doi: 10.1177/147323001003800343 [33] Tao R, Wu M, Qin Y, et al. Epidemiological characteristics of metabolic syndrome and comparison between its different diagnostic criteria in adults of Jiangsu Province. J Jilin Univ, 2015; 41, 181-9. doi: 10.1186/s12889-016-2870-y [34] Xi B, He D, Hu Y, et al. Prevalence of metabolic syndrome and its influencing factors among the Chinese adults: the China Health and Nutrition Survey in 2009. Prev Med, 2013; 57, 867-71. doi: 10.1016/j.ypmed.2013.09.023 [35] Li R, Li W, Lun Z, et al. Prevalence of metabolic syndrome in Mainland China: a meta-analysis of published studies. BMC Public Health, 2016; 16, 296. doi: 10.1186/s12889-016-2870-y [36] Srikanthan P, Hevener AL, Karlamangla AS. Sarcopenia exacerbates obesity-associated insulin resistance and dysglycemia: findings from the National Health and Nutrition Examination Survey Ⅲ. PLoS One, 2010; 5, e10805. doi: 10.1371/journal.pone.0010805 [37] Guillet C, Boirie Y. Insulin resistance: a contributing factor to age-related muscle mass loss? Diabetes Metab, 2005; 31, 5S20-6. http://www.diabet-metabolism.com/article/S1262-3636 (05)73648-X/pdf [38] Zamboni M, Mazzali G, Fantin F, et al. Sarcopenicobesity: A new category of obesity in the elderly. Nutr Metab Cardiovasc Dis, 2008; 18, 388-95. doi: 10.1016/j.numecd.2007.10.002 [39] Ferrara LA, Capaldo B, MancusiC, et al. Cardiometabolic risk in overweight subjects with or without relative fat-free mass deficiency: the Strong Heart Study. Nutr Metab Cardiovasc Dis, 2014; 24, 271-6. doi: 10.1016/j.numecd.2013.08.009 [40] Chung JY, Kang HT, Lee DC, et al. Body composition and its association with cardiometabolic risk factors in the elderly: a focus on sarcopenic obesity. Arch GerontolGeriatr, 2013; 56, 270-8. http://europepmc.org/abstract/med/23079031 -

 点击查看大图

计量
- 文章访问数: 2123
- HTML全文浏览量: 671
- PDF下载量: 132
- 被引次数: 0

 Quick Links