

 下载:
下载:

-
Lipoprotein(a) [Lp(a)], a low-density lipoprotein (LDL)-like particle with a large glycoprotein, apolipoprotein(a) [Apo(a)], is covalently bound to apolipoprotein B 100 by a disulfide bridge[1]. Apo(a) genotype determines both the synthetic rate and size of the Apo(a) moiety of Lp(a)[2, 3]. Due to being determined mostly by genetics, serum Lp(a) level is slightly influenced by diet or lipid lowering medications[4]. High Lp(a) level was previously considered a risk factor for thrombosis and might have the additive effects on atherosclerosis in certain pathological conditions[5].
High Lp(a) level is known to increase the risk of atherosclerotic events such as cerebrovascular and cardiovascular disease (CVD)[6]. Metabolic syndrome (MetS) has recently been considered as a risk factor for atherosclerosis and CVD[7, 8]. Given its key function in the pathophysiologic mechanism of CVD, MetS has been the object of various investigations focused on the study of associations between MetS and novel risk factors. In this regard, alterations linked to serum lipoprotein levels, especially those such as Lp(a), which involves low-density lipoprotein-cholesterol (LDL-C) that was considered notable for genetic implications and the risk of MetS[9, 10], may present a potential target for the analysis of novel risk factors.
However, the association between serum Lp(a) levels and the risk of MetS remains controversial[10-15]. Several prospective cohort studies reported that individuals with MetS have significantly lower Lp(a) levels compared with those without MetS[11, 12], even in menopausal women[13]. A study from Austria found that the median Lp(a) level was significantly lower in patients with MetS than in subjects without MetS[12]. Likewise, a similar inverse association was observed between Lp(a) level and MetS components in South Korean population[14]. On the contrary, there are conflicting reports stating that participants with MetS had significantly higher Lp(a) levels compared with those without MetS[10, 15]. A cross-sectional study from Venezuela reported that the association between MetS and the classification of Lp(a) levels was statistically significant, with greater levels in subjects with MetS diagnosis[10]. Since epidemiologic data regarding the relationship between serum Lp(a) levels and MetS, especially in the Asian population, is rather limited, further research is warranted to elucidate the association between Lp(a) levels and MetS in Asian population.
To fill this gap, the current study was aimed at examining the association between serum Lp(a) levels and the risk of prevalent MetS in a middle-aged and elderly Chinese cohort.
-
The subjects of the cross-sectional study are from a population-based survey performed in Jiading District, Shanghai, China, during March to August, 2010. The study design and methods have been reported in detail elsewhere[16, 17]. During the recruitment phase, a total of 10, 569 participants aged ≥ 40 years were invited by telephone or by door-to-door visits. Among them, 10, 375 individuals signed informed consent and were enrolled into the survey, with a participation rate of 98.2%. In the current study, we excluded 16 participants with missing data for Lp(a) and 23 participants with missing data for MetS. Following these exclusions, 10, 336 participants were included in the analyses of MetS risk.
The study protocol was approved by the Institutional Review Board of Ruijin Hospital, Shanghai Jiao-Tong University School of Medicine. Moreover, the study was conducted according to the Helsinki Declaration[18]. All study participants provided written informed consent.
-
By using the standard questionnaire, trained physicians collected detailed information about demographic characteristics, medical history, family history, and lifestyle factors, as previously described[19, 20]. Body mass index (BMI) was calculated as weight in kilograms divided by the square of height in meters. Waist circumference (WC) was measured at the level of umbilicus in a standing position. Systolic blood pressure (SBP) and diastolic blood pressure (DBP) measurements were obtained with individuals in a seated position after five minutes of quiet rest, using an automated electronic device (OMRON Model HEM-752 FUZZY, Dalian, China). Current smokers were defined as subjects who smoked at least one cigarette per day or seven cigarettes per week regularly during the past 6 months. Current drinkers were defined as subjects who consumed alcohol at least once per week regularly in the past 6 months. Physical activity during leisure time was evaluated by using the International Physical Activity Questionnaire (IPAQ-SF)[21]. Moderate and vigorous physical activity was defined as ≥ 150 minutes/week of moderate-intensity physical activity, or 75 minutes/week of vigorous-intensity aerobic physical activity, or an equivalent combination of moderate- and vigorous-intensity aerobic activities.
All participants underwent a 75-g oral glucose tolerance test (OGTT) after more than 10 hours overnight fast. Fasting plasma glucose (FPG), 2-h post-load plasma glucose (2-h PG), triglycerides (TG), total cholesterol (TC), high-density lipoprotein-cholesterol (HDL-C), and LDL-C were measured using an autoanalyser (ADVIA-1650 Chemistry System, Bayer Corporation, Germany). Serum Lp(a) levels were measured by Latex enhanced immune transmission turbidimetry using murine monoclonal antibody (20-037, S0710-1; Jiemen BIO-TECH, Shanghai, China).
MetS was defined based on the National Cholesterol Education Program Adult Treatment Panel Ⅲ (NCEP-ATP Ⅲ) criteria[22] with a modification in waist circumference cutoff to be more appropriate for an Asian population[23]. MetS was diagnosed as the presence of at least three or more of the following factors: (1) WC ≥ 90 cm in men or ≥ 80 cm in women; (2) TG ≥ 1.69 mmol/L; (3) HDL-C < 1.03 mmol/L in men or < 1.29 mmol/L in women; (4) SBP/DBP ≥ 130/85 mmHg or under antihypertensive medication; (5) FPG ≥ 6.1 mmol/L or previously diagnosed type 2 diabetes mellitus. Diabetes was defined as the following: FPG ≥ 7.0 mmol/L, or 2-h PG ≥ 11.1 mmol/L, or self-reported previous diagnosis of diabetes by physicians and the usage of anti-diabetic medication. Impaired glucose regulation (IGR) was defined as FPG levels between 6.1 mmol/L and 7.0 mmol/L, and 2-h PG levels between 7.8 mmol/L and 11.1 mmol/L. Normal glucose regulation (NGR) was defined as FPG < 6.1 mmol/L and 2-h PG < 7.8 mmol/L[24]. Hypertension was diagnosed as SBP ≥ 140 mmHg, or DBP ≥ 90 mmHg, or self-reported previous diagnosis of hypertension by physicians and under antihypertensive medication. Dyslipidemia was diagnosed according to the modified National Cholesterol Education Program-Adult Treatment Panel Ⅲ (NCEP/ATP Ⅲ) as: hypercholesterolemia, TC ≥ 6.2 mmol/L, hypertriglyceridemia, TG ≥ 2.26 mmol/L, LDL-C ≥ 4.14 mmol/L, and HDL-C < 1.04 mmol/L[25].
-
Statistical analyses were performed with SAS 9.4 (SAS Institute, Cary, NC). Serum Lp(a) levels were categorized by quartiles of ≤ 8, 9-18, 19-29, or ≥ 30 mg/mL. Data are presented as mean ± standard deviation (SD) or median (interquartile) for continuous variables and comparisons of means and medians were tested for statistical significance with the one-way analysis of variance. For categorical variables, data are presented as proportions and differences in proportions were tested for statistical significance with the χ2 test.
To investigate the associations of Lp(a) levels with prevalent MetS and MetS components, multivariate logistic regression analyses were used by determining the odds ratios (ORs) and the corresponding 95% confidence intervals (CIs). The ORs were adjusted first for age and sex; then for BMI, smoking status (current, former, never), drinking status (current, former, never), education (high school or above versus no school), and physical activity. The models were finally adjusted for LDL-C. Relationship between Lp(a) and MetS was also explored in stratified analysis by age (40-49, 50-59, ≥ 60 years), sex (male and female), BMI (< 24, ≥ 24 kg/m2), current smoking (yes/no), current drinking (yes/no), glycemic status (NGR, IGR, diabetes), hypertension (yes/no), and dyslipidemia (yes/no). The statistical tests were 2-sided and P < 0.05 was considered statistically significant.
-
The participants were categorized into four groups according to Lp(a) quartiles. Clinical and biochemical characteristics of the study population are shown in Table 1. Overall, 3, 876 (37.5%) of the participants were diagnosed with MetS. Levels of TC, HDL-C, and LDL-C increased with Lp(a) quartiles, while levels of BMI, WC, 2-h PG, TG, TG/HDL-C, and proportions of diabetes and liver steatosis decreased with Lp(a) quartiles (Ps < 0.0001). However, there was no significant difference among the four groups for physical activity, family history of CVD, use of lipid-lowering medications, antihypertensive medications, and antidiabetic medications.
Table 1. Baseline Characteristics of the Study Population by Lp(a) Level Quartiles
Characteristics Lp(a) Level Quartiles P for Trend Quartile 1
(n = 2, 506)Quartile 2
(n = 2, 747)Quartile 3
(n = 2, 598)Quartile 4
(n = 2, 485)Lp(a), mg/mL, median (range) 5 (≤ 8) 13 (9-18) 25 (19-29) 35 (≥ 30) Age, y 57.6 ± 9.6 58.5 ± 9.6 59.1 ± 9.8 59.0 ± 9.8 < 0.0001 Male, n (%) 1, 097 (43.8) 1, 061 (38.6) 952 (36.6) 834 (33.6) < 0.0001 BMI, kg/m2 25.6 ± 3.3 25.1 ± 3.3 25.0 ± 3.3 24.9 ± 3.2 < 0.0001 WC, cm 84.2 ± 9.2 82.8 ± 8.9 82.3 ± 9.1 81.5 ± 8.8 < 0.0001 Current smoker, n (%) 597 (23.8) 560 (20.4) 498 (19.2) 435 (17.5) < 0.0001 Current drinker, n (%) 325 (13.3) 268 (10.1) 242 (9.6) 203 (8.5) < 0.0001 Physical activity (moderate to vigorous), n (%) 361 (14.4) 380 (13.8) 376 (14.5) 383 (15.4) 0.24 Education status (high school or above), n (%) 594 (23.8) 603 (22.1) 528 (20.5) 493 (19.9) 0.0004 Family history of CVD 313 (24.7) 342 (26.9) 311 (24.5) 304 (23.9) 0.67 SBP, mmHg 142.1 ± 20.4 141.1 ± 19.8 140.2 ± 19.8 141.2 ± 20.3 0.01 DBP, mmHg 83.5 ± 10.4 82.5 ± 10.4 82.3 ± 10.1 82.7 ± 10.4 < 0.0001 FPG, mmol/L 5.68 ± 1.67 5.54 ± 1.53 5.48 ± 1.42 5.49 ± 1.36 < 0.0001 2-h PG, mmol/L 8.69 ± 4.61 8.25 ± 4.31 8.11 ± 4.15 7.99 ± 4.10 < 0.0001 TG, mmol/L 1.57 (1.05-2.39) 1.41 (0.98-1.95) 1.30 (0.95-1.79) 1.30 (0.95-1.79) < 0.0001 TC, mmol/L 5.14 ± 1.06 5.25 ± 0.94 5.37 ± 0.99 5.62 ± 1.01 < 0.0001 HDL-C, mmol/L 1.27 ± 0.33 1.31 ± 0.31 1.35 ± 0.31 1.38 ± 0.31 < 0.0001 LDL-C, mmol/L 2.92 ± 0.82 3.14 ± 0.81 3.25 ± 0.84 3.46 ± 0.90 < 0.0001 TG/HDL-C 1.30 (0.77-2.23) 1.11 (0.69-1.72) 0.98 (0.65-1.51) 0.96 (0.64-1.45) < 0.0001 Hypertension 1, 574 (62.8) 1, 667 (60.7) 1, 539 (59.2) 1, 479 (59.5) 0.009 Diabetes 546 (21.8) 500 (18.2) 446 (17.2) 398 (16.0) < 0.0001 Liver steatosis 250 (10.0) 230 (8.4) 191 (7.4) 173 (7.0) < 0.0001 Lipid-lowing medications 6 (0.24) 10 (0.36) 7 (0.27) 7 (0.28) 0.96 Antihypertensive medications 771 (30.8) 799 (29.1) 750 (28.9) 727 (29.3) 0.25 Antidiabetic medications 192 (7.7) 203 (7.4) 156 (6.0) 172 (6.9) 0.11 Note. Data are mean ± standard deviation (SD) or median (interquartile) for the continuous variables, or percentages for categorical variables. Medications include lipid-lowering medications, antihypertensive medications, and antidiabetic medications. Abbreviations: Lp(a), lipoprotein (a); BMI, body mass index; WC, waist circumference; CVD, cardiovascular disease; SBP, systolic blood pressure; DBP, diastolic blood pressure; FPG, fasting plasma glucose; 2-h PG, 2-h post-load plasma glucose; TG, triglycerides; TC, total cholesterol; HDL-C, high-density lipoprotein-cholesterol; LDL-C, low-density lipoprotein-cholesterol. The prevalence of MetS significantly decreased with the increment of Lp(a) level (46.9%, 38.2%, 34.1%, and 30.9%, for the lowest to the highest quartile group, respectively, P for trend < 0.0001). The multivariate-adjusted OR (95% CI) was estimated to evaluate the association of Lp(a) levels with prevalent MetS (Table 2). In the age- and sex-adjusted model, the highest quartile of Lp(a) level was associated with a lower risk of MetS, when compared with the lowest quartile (OR 0.51, 95% CI 0.45-0.57). Further adjustments for BMI, smoking status, drinking status, education, and physical activity didn't significantly change the risk estimate (OR 0.48, 95% CI 0.42-0.55). Although further adjustment for LDL-C significantly attenuated the association of Lp(a) levels with prevalent MetS, the risk estimate remained significant (OR 0.45, 95% CI 0.39-0.51). The tests for the trend in the multivariable analyses were all significant (Ps for trend < 0.0001).
Table 2. Odds Ratios (ORs) and 95% Confidence Intervals (CIs) for Risk of Prevalent MetS by Lp(a) Level Quartiles
Items Lp(a) Level Quartiles P for Trend Quartile 1 Quartile 2 Quartile 3 Quartile 4 Cases/n 1, 174/2, 506 1, 049/2, 747 885/2, 598 768/2, 485 Prevalence, % 46.9 38.2 34.1 30.9 < 0.0001 Model 1 1.00 0.70 (0.63-0.78)* 0.59 (0.52-0.66)* 0.51 (0.45-0.57)* < 0.0001 Model 2 1.00 0.70 (0.62-0.80)* 0.56 (0.49-0.64)* 0.48 (0.42-0.55)* < 0.0001 Model 3 1.00 0.68 (0.60-0.77)* 0.54 (0.47-0.61)* 0.45 (0.39-0.51)* < 0.0001 Note. Model 1: adjusted for age and sex; Model 2: further adjusted for BMI, smoking status, drinking status, education, and physical activity; Model 3: further adjusted for LDL-C. *P < 0.05. MetS, metabolic syndrome; Lp(a), lipoprotein (a); BMI, body mass index; LDL-C, low-density lipoprotein-cholesterol. The associations between Lp(a) levels and the components of MetS are shown in Table 3. Prevalence of central obesity, high triglycerides, and low HDL cholesterol significantly decreased with the increment of Lp(a) levels (Ps for trend < 0.0001). Compared with individuals in the lowest quartile, those in the highest quartile of Lp(a) level had a decreased risk of central obesity, high fasting glucose, high triglycerides, and low HDL cholesterol, but not high blood pressure. The multivariate-adjusted ORs (95% CIs) for central obesity, high fasting glucose, high triglycerides, and low HDL cholesterol were 0.63 (0.53-0.75), 0.70 (0.60-0.81), 0.43 (0.38-0.49), and 0.66 (0.58-0.75), respectively (Ps for trend < 0.0001). The number of the components of MetS also decreased along with serum Lp(a) level quartiles in participants that had three or more components (Figure 1, P < 0.0001).
Table 3. Odds Ratios (ORs) and 95% Confidence Intervals (CIs) of Each Component of MetS According to Lp(a) Level Quartiles
Items Lp(a) Level Quartiles P for Trend Quartile 1 Quartile 2 Quartile 3 Quartile 4 Central obesity Cases, n (%) 1, 275 (50.9) 1, 265 (46.1) 1, 174 (45.2) 1, 072 (43.1) < 0.0001 OR (95% CI) 1.00 0.78 (0.67-0.92)* 0.79 (0.67-0.94)* 0.63 (0.53-0.75)* < 0.0001 High blood pressure Cases, n (%) 1, 896 (75.7) 2, 051 (74.7) 1, 885 (72.6) 1, 860 (74.9) 0.23 OR (95% CI) 1.00 0.92 (0.80-1.06) 0.80 (0.69-0.92)* 0.91 (0.78-1.05) 0.06 High triglycerides Cases, n (%) 1, 128 (45.0) 954 (34.7) 759 (29.2) 708 (28.5) < 0.0001 OR (95% CI) 1.00 0.63 (0.56-0.71)* 0.46 (0.41-0.52)* 0.43 (0.38-0.49)* < 0.0001 High fasting glucose Cases, n (%) 566 (22.6) 506 (18.4) 456 (17.6) 439 (17.7) < 0.0001 OR (95% CI) 1.00 0.76 (0.66-0.88)* 0.71 (0.61-0.82)* 0.70 (0.60-0.81)* < 0.0001 Low HDL cholesterol Cases, n (%) 1, 041 (41.5) 1, 009 (36.7) 821 (31.6) 733 (29.5) < 0.0001 OR (95% CI) 1.00 0.87 (0.77-0.98)* 0.69 (0.61-0.78)* 0.66 (0.58-0.75)* < 0.0001 Note. The Model was adjusted for age, sex, BMI, smoking status, drinking status, education, physical activity, and LDL-C. *P < 0.05. MetS, metabolic syndrome; Lp(a), lipoprotein (a); HDL, high-density lipoprotein; LDL-C, low-density lipoprotein-cholesterol. 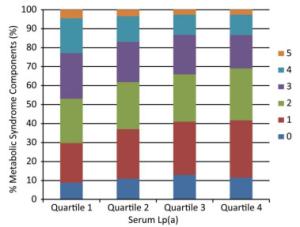
Figure 1. Number of components of MetS according to serum Lp(a) level quartiles. Median (interquartile range) Lp(a) levels for the quartiles are as follows (mg/mL): Quartile 1, 5 (4-7); Quartile 2, 13 (10-15); Quartile 3, 25 (22-27); Quartile 4, 35 (30-45). MetS, metabolic syndrome; Lp(a), lipoprotein (a).
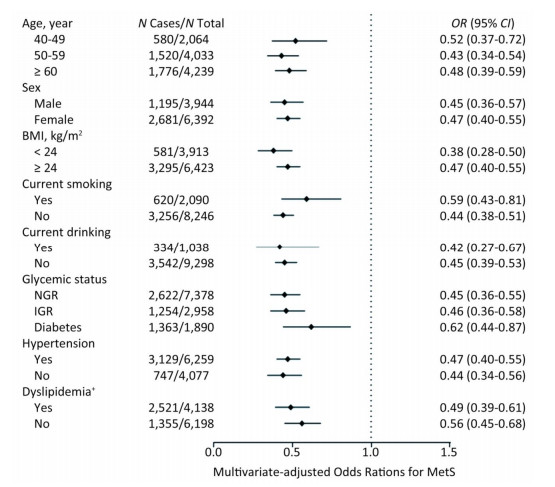
We further investigated the association of Lp (a) levels with MetS in subgroups according to strata variables (Figure 2). A higher prevalence of MetS was found in participants of ≥ 60 years of age, female, BMI ≥ 24 kg/m2, non-smokers, non-drinkers, with diabetes, hypertension or dyslipidemia, compared with their counterparts. Notably, increased levels of Lp(a) was associated with decreased risk of MetS in all the subgroups.
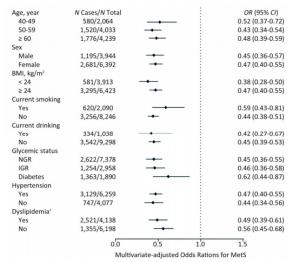
Figure 2. Multivariate-adjusted odds ratio (OR) and 95% confidence interval (CI) for risk of MetS among subgroups. The Model was adjusted for age, sex, BMI, smoking status, drinking status, education, physical activity, and LDL-C. †The Model was adjusted for age, sex, BMI, smoking status, drinking status, education, and physical activity. MetS, metabolic syndrome; BMI, body mass index; LDL-C, low-density lipoprotein-cholesterol.
-
In this cross-sectional analysis of 10, 336 middle- aged, elderly Chinese individuals, we observed a strong inverse association between serum Lp(a) levels and prevalent MetS as well as its components. The association of Lp(a) level with MetS persisted after adjustment for traditional risk factors among all the subgroups. To our knowledge, this is the advanced study to demonstrate the association between Lp(a) levels and MetS in a large Chinese population.
Our finding that MetS was inversely related to Lp(a) levels is consistent with Sung et al.[14], who reported that participants in the lowest Lp(a) level quartile had higher prevalence of MetS with 25.8%, while the prevalence of MetS was 16.1% in the highest quartile. Several previous findings stating that patients with MetS had significantly lower Lp(a) levels compared with patients without MetS could partially support our findings[11-13]. Moreover, the inverse association of Lp(a) levels with MetS observed in our study concurs with the results of Vaverková H et al.[26], who performed a cross-sectional study among asymptomatic dyslipidemia subjects. However, Bermúdez et al.[10] reported that subjects with MetS showed higher levels of Lp(a) than healthy subjects, which is similar to the results of Bozbas et al.[15]. These differences between studies might be due to diverse ethnic groups and limited sample sizes. Our population-based study extends the research to association between Lp(a) levels and MetS in a general population of middle-aged and elderly Chinese adults.
Another finding from the current analysis was that the levels of MetS component factors, such as glucose, WC, and TG were decreased in the highest Lp(a) level quartile, compared with the lowest quartile. Previous evidence suggested that WC and hypertriglyceridemia appeared to reveal a greater propensity for micro-inflammatory response amongst the various components of MetS[27, 28]. Thus, the micro-inflammatory response in MetS might be attenuated by decreased levels of WC and TG possibly induced by elevated Lp(a) levels. Additionally, studies evaluating the relationship between Lp(a) levels and various MetS components are limited, and few investigations include all diagnostic criteria[29, 30]. In our current analysis, a strong inverse association of Lp(a) level with risks of central obesity, high fasting glucose, and dyslipidemia was observed, but no association with high blood pressure was noted. Furthermore, when assessing the possible combinations of MetS components with elevated serum Lp(a) levels, the number of the components decreased in participants with more than three diagnostic criteria. However, in the Maracaibo City Metabolic Syndrome Prevalence Study[10], subjects with each of the separate diagnostic criteria showed higher serum Lp(a) levels except for hyperglycemia, and subjects with three or more alterations had the greatest levels of Lp(a). Determination of the exact relationship between Lp(a) levels and MetS components in different ethnic groups needs further investigation.
Interestingly, a prospective study from Austria reported that the Lp(a) level proved to be significantly associated with cardiovascular events in patients without MetS, compared with those with MetS[12]. The result suggested that the presence of MetS significantly affects the association of Lp(a) level with the risk of CVD, and supporting the assumption that Lp(a) may be a strong predictor of CVD risk in non-MetS subjects. In the current study, we observed that serum Lp(a) levels were inversely associated with the risk of prevalent MetS. Survival bias could be a possible explanation for these findings. Because both serum Lp(a) levels and MetS increased the risk of CVD, subjects who present with both the risk factors may have increased risk of mortality at younger ages. Thus, the proportion of individuals with low levels of Lp(a) among older survivors with MetS would increase. Specially, the current stratified analysis showed that elevated levels of Lp(a) decreased the risk of prevalent MetS in all the subgroups, suggesting that these strata variables have limited influence on the association of Lp(a) level with MetS.
As known from previous evidence, plasma levels of Lp(a) are largely determined by the rates of hepatic synthesis and expression of Lp(a). Since hepatic secretion rates are lower for large isoforms of apo(a), the smallest isoform in plasma is more typically prominent. Although the molecular structure of Lp(a) contains apo(a), the primary catabolic pathways of apo(a) including hepatic and renal metabolic routes do not seem to control the plasma Lp(a) level[31]. At present, the nature of these factors or the mechanism explaining lower Lp(a) level in people with MetS is uncertain. As a component of MetS, dyslipidemia represents one of the fundamental causes in ethiopathogenics, consisting of a series of molecular disturbances including the increase of the serum levels of apolipoprotein B, LDL-C, and very low-density lipoprotein (VLDL) cholesterol[32]. In general, these disorders were translated into common indicators such as elevated TG and low HDL-C, and these alterations were associated with a micro-inflammatory state that is considered as an essential mechanism of both MetS and CVD[33, 34]. Recently, the relationship between Lp(a) levels and other lipoproteins at high and normal levels of serum TGs has been investigated. At high TG levels, Lp(a) is very strongly correlated primarily with HDL₂-C/HDL₃-C and TG-related variables, providing evidence of shared metabolic mechanisms for Lp(a), HDL, TG, and VLDL at high serum TG[30]. Specially, it is of note that high TG level and low HDL-C level were inversely associated with Lp(a) level, implying that high level of Lp(a) may reduce the risk of dyslipidemia. Therefore, future studies should focus on the association of Lp(a) levels with different types of dyslipidemia. In addition, the levels of LDL-C increased with the elevation of Lp(a). After adjustment for LDL-C, the risk estimates substantially attenuated, but remained significant, suggesting that LDL-C is likely to contribute to, but does not fully explain, the risk of MetS associated with increased Lp(a) levels. The precise molecular mechanisms between Lp(a) and MetS related factors need to be further studied.
There are some limitations in this study. First, given that our investigation is an observational cross-sectional study, we were unable to obtain a causal association between serum Lp(a) levels and the risk of MetS. Second, our research is limited to one ethnic group and the distribution of risk factors and the relationship between Lp(a) levels and MetS may differ between ethnic groups. Third, our study was restricted to individuals aged 40 years or older, and whether the findings were applicable to the younger population need to be further investigated.
In our large population-based study, Lp(a) level was identified to be a strong biomarker for MetS, which may have a significant implication for clinical practice such that Lp(a) may be a therapeutic target for MetS. Whether increasing Lp(a) level can decrease the incident MetS risk and the optimal concentration range of Lp(a) that is the most beneficial for individuals who are at high metabolic risk need to be investigated in future studies.
In conclusion, our findings confirmed an inverse association between serum Lp(a) levels and the risk of prevalent MetS in a middle-aged and elderly Chinese cohort. Our findings complement current knowledge about the association of Lp(a) levels with MetS as well as its components.
-
The authors report no relationships that could be construed as a conflict of interest.
-
The authors thank the fieldwork staff for their contribution to the study and the participants for their cooperation. The authors had full access to the data and take responsibility for their integrity. All authors read and agreed to the article as written. LU Jie Li was supported by grants from the Ministry of Science and Technology of the People's Republic of China [2016YFC1305202]. CHEN Yu Hong was supported by grants from the National Natural Science Foundation of China [81870604], National Science and Technology Major Project [2016YFC1304904], and Shenkang Project [16CR4020A]. LIN Lin was supported by grants from Shanghai Sailing Program [18YF1419900].
doi: 10.3967/bes2019.065
Association between Lipoprotein (a) Levels and Metabolic Syndrome in a Middle-aged and Elderly Chinese Cohort
-
Abstract:
Objective The association between lipoprotein (a)[Lp(a)] levels and metabolic syndrome (MetS) remains uncertain, especially in the Asian population. The purpose of this study was to demonstrate the association between Lp(a) levels and MetS in a middle-aged and elderly Chinese cohort. Methods A cross-sectional study of 10, 336 Chinese adults aged 40 years or older was conducted in Jiading District, Shanghai, China. Logistic regression analysis was used to evaluate the association between serum Lp(a) levels and MetS. Results In the overall population, 37.5% of participants had MetS. Compared with individuals in the lowest quartile of serum Lp(a) levels, those in the highest quartile had a lower prevalence of MetS (30.9% vs. 46.9%, P for trend < 0.0001). Multivariate logistic regression analyses showed that compared with participants in the bottom quartile of serum Lp(a) levels, those in the top quartile had decreased odds ratio (OR) for prevalent MetS[multivariate-adjusted OR 0.45 (95% confidence interval 0.39-0.51); P < 0.0001]. Additionally, Lp(a) level was conversely associated with the risk of central obesity, high fasting glucose, high triglycerides, and low HDL cholesterol, but not with hypertension. Stratified analyses suggested that increasing levels of Lp(a) was associated with decreased risk of MetS in all the subgroups. Conclusion Serum Lp(a) level was inversely associated with the risk of prevalent MetS in a middle-aged and elderly Chinese cohort. -
Key words:
- Cardiovascular risk factor /
- Lipoprotein (a) /
- Metabolic syndrome
-
Figure 1. Number of components of MetS according to serum Lp(a) level quartiles. Median (interquartile range) Lp(a) levels for the quartiles are as follows (mg/mL): Quartile 1, 5 (4-7); Quartile 2, 13 (10-15); Quartile 3, 25 (22-27); Quartile 4, 35 (30-45). MetS, metabolic syndrome; Lp(a), lipoprotein (a).
Figure 2. Multivariate-adjusted odds ratio (OR) and 95% confidence interval (CI) for risk of MetS among subgroups. The Model was adjusted for age, sex, BMI, smoking status, drinking status, education, physical activity, and LDL-C. †The Model was adjusted for age, sex, BMI, smoking status, drinking status, education, and physical activity. MetS, metabolic syndrome; BMI, body mass index; LDL-C, low-density lipoprotein-cholesterol.
Table 1. Baseline Characteristics of the Study Population by Lp(a) Level Quartiles
Characteristics Lp(a) Level Quartiles P for Trend Quartile 1
(n = 2, 506)Quartile 2
(n = 2, 747)Quartile 3
(n = 2, 598)Quartile 4
(n = 2, 485)Lp(a), mg/mL, median (range) 5 (≤ 8) 13 (9-18) 25 (19-29) 35 (≥ 30) Age, y 57.6 ± 9.6 58.5 ± 9.6 59.1 ± 9.8 59.0 ± 9.8 < 0.0001 Male, n (%) 1, 097 (43.8) 1, 061 (38.6) 952 (36.6) 834 (33.6) < 0.0001 BMI, kg/m2 25.6 ± 3.3 25.1 ± 3.3 25.0 ± 3.3 24.9 ± 3.2 < 0.0001 WC, cm 84.2 ± 9.2 82.8 ± 8.9 82.3 ± 9.1 81.5 ± 8.8 < 0.0001 Current smoker, n (%) 597 (23.8) 560 (20.4) 498 (19.2) 435 (17.5) < 0.0001 Current drinker, n (%) 325 (13.3) 268 (10.1) 242 (9.6) 203 (8.5) < 0.0001 Physical activity (moderate to vigorous), n (%) 361 (14.4) 380 (13.8) 376 (14.5) 383 (15.4) 0.24 Education status (high school or above), n (%) 594 (23.8) 603 (22.1) 528 (20.5) 493 (19.9) 0.0004 Family history of CVD 313 (24.7) 342 (26.9) 311 (24.5) 304 (23.9) 0.67 SBP, mmHg 142.1 ± 20.4 141.1 ± 19.8 140.2 ± 19.8 141.2 ± 20.3 0.01 DBP, mmHg 83.5 ± 10.4 82.5 ± 10.4 82.3 ± 10.1 82.7 ± 10.4 < 0.0001 FPG, mmol/L 5.68 ± 1.67 5.54 ± 1.53 5.48 ± 1.42 5.49 ± 1.36 < 0.0001 2-h PG, mmol/L 8.69 ± 4.61 8.25 ± 4.31 8.11 ± 4.15 7.99 ± 4.10 < 0.0001 TG, mmol/L 1.57 (1.05-2.39) 1.41 (0.98-1.95) 1.30 (0.95-1.79) 1.30 (0.95-1.79) < 0.0001 TC, mmol/L 5.14 ± 1.06 5.25 ± 0.94 5.37 ± 0.99 5.62 ± 1.01 < 0.0001 HDL-C, mmol/L 1.27 ± 0.33 1.31 ± 0.31 1.35 ± 0.31 1.38 ± 0.31 < 0.0001 LDL-C, mmol/L 2.92 ± 0.82 3.14 ± 0.81 3.25 ± 0.84 3.46 ± 0.90 < 0.0001 TG/HDL-C 1.30 (0.77-2.23) 1.11 (0.69-1.72) 0.98 (0.65-1.51) 0.96 (0.64-1.45) < 0.0001 Hypertension 1, 574 (62.8) 1, 667 (60.7) 1, 539 (59.2) 1, 479 (59.5) 0.009 Diabetes 546 (21.8) 500 (18.2) 446 (17.2) 398 (16.0) < 0.0001 Liver steatosis 250 (10.0) 230 (8.4) 191 (7.4) 173 (7.0) < 0.0001 Lipid-lowing medications 6 (0.24) 10 (0.36) 7 (0.27) 7 (0.28) 0.96 Antihypertensive medications 771 (30.8) 799 (29.1) 750 (28.9) 727 (29.3) 0.25 Antidiabetic medications 192 (7.7) 203 (7.4) 156 (6.0) 172 (6.9) 0.11 Note. Data are mean ± standard deviation (SD) or median (interquartile) for the continuous variables, or percentages for categorical variables. Medications include lipid-lowering medications, antihypertensive medications, and antidiabetic medications. Abbreviations: Lp(a), lipoprotein (a); BMI, body mass index; WC, waist circumference; CVD, cardiovascular disease; SBP, systolic blood pressure; DBP, diastolic blood pressure; FPG, fasting plasma glucose; 2-h PG, 2-h post-load plasma glucose; TG, triglycerides; TC, total cholesterol; HDL-C, high-density lipoprotein-cholesterol; LDL-C, low-density lipoprotein-cholesterol.  下载: 导出CSV
Table 2. Odds Ratios (ORs) and 95% Confidence Intervals (CIs) for Risk of Prevalent MetS by Lp(a) Level Quartiles
Items Lp(a) Level Quartiles P for Trend Quartile 1 Quartile 2 Quartile 3 Quartile 4 Cases/n 1, 174/2, 506 1, 049/2, 747 885/2, 598 768/2, 485 Prevalence, % 46.9 38.2 34.1 30.9 < 0.0001 Model 1 1.00 0.70 (0.63-0.78)* 0.59 (0.52-0.66)* 0.51 (0.45-0.57)* < 0.0001 Model 2 1.00 0.70 (0.62-0.80)* 0.56 (0.49-0.64)* 0.48 (0.42-0.55)* < 0.0001 Model 3 1.00 0.68 (0.60-0.77)* 0.54 (0.47-0.61)* 0.45 (0.39-0.51)* < 0.0001 Note. Model 1: adjusted for age and sex; Model 2: further adjusted for BMI, smoking status, drinking status, education, and physical activity; Model 3: further adjusted for LDL-C. *P < 0.05. MetS, metabolic syndrome; Lp(a), lipoprotein (a); BMI, body mass index; LDL-C, low-density lipoprotein-cholesterol.
下载: 导出CSV
Table 3. Odds Ratios (ORs) and 95% Confidence Intervals (CIs) of Each Component of MetS According to Lp(a) Level Quartiles
Items Lp(a) Level Quartiles P for Trend Quartile 1 Quartile 2 Quartile 3 Quartile 4 Central obesity Cases, n (%) 1, 275 (50.9) 1, 265 (46.1) 1, 174 (45.2) 1, 072 (43.1) < 0.0001 OR (95% CI) 1.00 0.78 (0.67-0.92)* 0.79 (0.67-0.94)* 0.63 (0.53-0.75)* < 0.0001 High blood pressure Cases, n (%) 1, 896 (75.7) 2, 051 (74.7) 1, 885 (72.6) 1, 860 (74.9) 0.23 OR (95% CI) 1.00 0.92 (0.80-1.06) 0.80 (0.69-0.92)* 0.91 (0.78-1.05) 0.06 High triglycerides Cases, n (%) 1, 128 (45.0) 954 (34.7) 759 (29.2) 708 (28.5) < 0.0001 OR (95% CI) 1.00 0.63 (0.56-0.71)* 0.46 (0.41-0.52)* 0.43 (0.38-0.49)* < 0.0001 High fasting glucose Cases, n (%) 566 (22.6) 506 (18.4) 456 (17.6) 439 (17.7) < 0.0001 OR (95% CI) 1.00 0.76 (0.66-0.88)* 0.71 (0.61-0.82)* 0.70 (0.60-0.81)* < 0.0001 Low HDL cholesterol Cases, n (%) 1, 041 (41.5) 1, 009 (36.7) 821 (31.6) 733 (29.5) < 0.0001 OR (95% CI) 1.00 0.87 (0.77-0.98)* 0.69 (0.61-0.78)* 0.66 (0.58-0.75)* < 0.0001 Note. The Model was adjusted for age, sex, BMI, smoking status, drinking status, education, physical activity, and LDL-C. *P < 0.05. MetS, metabolic syndrome; Lp(a), lipoprotein (a); HDL, high-density lipoprotein; LDL-C, low-density lipoprotein-cholesterol.
下载: 导出CSV
-
[1] Berg K. A new serum type system in man-the LP system. Acta Pathol Microbiol Scand, 1963; 59, 369-82. http://cn.bing.com/academic/profile?id=9c3ddb8dc6b085cd9c0927baaf65f19c&encoded=0&v=paper_preview&mkt=zh-cn [2] Koschinsky ML, Marcovina SM. Structure-function relationships in apolipoprotein(a):insights into lipoprotein(a) assembly and pathogenicity. Curr Opin Lipidol, 2004; 15, 167-74. doi: 10.1097/00041433-200404000-00009 [3] Marcovina SM, Koschinsky ML, Albers JJ, et al. Report of the National Heart, Lung, and Blood Institute Workshop on Lipoprotein(a) and Cardiovascular Disease:recent advances and future directions. Clin Chem, 2003; 49, 1785-96. doi: 10.1373/clinchem.2003.023689 [4] Eckel RH, Cornier MA. Update on the NCEP ATP-Ⅲ emerging cardiometabolic risk factors. BMC Med, 2014; 12, 115. doi: 10.1186/1741-7015-12-115 [5] Tadin-Strapps M, Robinson M, Le Voci L, et al. Development of lipoprotein(a) siRNAs for mechanism of action studies in non-human primate models of atherosclerosis. J Cardiovasc Transl Res, 2015; 8, 44-53. doi: 10.1007/s12265-014-9605-1 [6] Ariyo AA, Thach C, Tracy R. Lp(a) lipoprotein, vascular disease, and mortality in the elderly. N Engl J Med, 2003; 349, 2108-15. doi: 10.1056/NEJMoa001066 [7] Galassi A, Reynolds K, He J. Metabolic syndrome and risk of cardiovascular disease:a meta-analysis. Am J Med, 2006; 119, 812-9. doi: 10.1016/j.amjmed.2006.02.031 [8] Lu J, Wang L, Li M, et al. Metabolic Syndrome Among Adults in China:The 2010 China Noncommunicable Disease Surveillance. J Clin Endocrinol Metab, 2017; 102, 507-15. http://cn.bing.com/academic/profile?id=5b00b46a9064fb8f621a665752ac5224&encoded=0&v=paper_preview&mkt=zh-cn [9] Lerman RH, Minich DM, Darland G, et al. Subjects with elevated LDL cholesterol and metabolic syndrome benefit from supplementation with soy protein, phytosterols, hops rho iso-alpha acids, and Acacia nilotica proanthocyanidins. J Clin Lipidol, 2010; 4, 59-68. doi: 10.1016/j.jacl.2009.11.002 [10] Bermudez V, Rojas J, Salazar J, et al. Variations of lipoprotein(a) levels in the metabolic syndrome:a report from the Maracaibo City Metabolic Syndrome Prevalence Study. J Diabetes Res, 2013; 2013, 416451. http://cn.bing.com/academic/profile?id=750c91db64e9f46705874e863575d586&encoded=0&v=paper_preview&mkt=zh-cn [11] Onat A, Can G, Coban N, et al. Lipoprotein(a) level and MIF gene variant predict incident metabolic syndrome and mortality. J Investig Med, 2016; 64, 392-9. doi: 10.1136/jim-2015-000003 [12] Vonbank A, Saely CH, Rein P, et al. Lipoprotein (a), the Metabolic Syndrome and Vascular Risk in Angiographied Coronary Patients. J Clin Endocrinol Metab, 2016; 101, 3199-203. doi: 10.1210/jc.2016-1400 [13] Gentile M, Iannuzzo G, Mattiello A, et al. Association between Lp (a) and atherosclerosis in menopausal women without metabolic syndrome. Biomark Med, 2016; 10, 397-402. doi: 10.2217/bmm.16.4 [14] Sung KC, Wild SH, Byrne CD. Lipoprotein (a), metabolic syndrome and coronary calcium score in a large occupational cohort. Nutr Metab Cardiovasc Dis, 2013; 23, 1239-46. doi: 10.1016/j.numecd.2013.02.009 [15] Bozbas H, Yildirir A, Pirat B, et al. Increased lipoprotein(a) in metabolic syndrome:is it a contributing factor to premature atherosclerosis? Anadolu Kardiyol Derg, 2008; 8, 111-5. http://cn.bing.com/academic/profile?id=1e2c5aa72c04292eba7e364d28dfa21f&encoded=0&v=paper_preview&mkt=zh-cn [16] Lu J, Zhang J, Du R, et al. Age at menarche is associated with the prevalence of non-alcoholic fatty liver disease later in life. J Diabetes, 2017; 9, 53-60. doi: 10.1111/1753-0407.12379 [17] Chen Y, Lu J, Huang Y, et al. Association of previous schistosome infection with diabetes and metabolic syndrome:a cross-sectional study in rural China. J Clin Endocrinol Metab, 2013; 98, E283-7. doi: 10.1210/jc.2012-2517 [18] Goodyear MD, Krleza-Jeric K, Lemmens T. The Declaration of Helsinki. Bmj, 2007; 335, 624-5. doi: 10.1136/bmj.39339.610000.BE [19] Sun J, Zhang Y, Xu B, et al. Autonomic dysfunction assessed by EZSCAN and subclinical atherosclerosis. J Diabetes, 2014; 6, 409-16. doi: 10.1111/jdb.2014.6.issue-5 [20] Du R, Cheng D, Lin L, et al. Association between serum CA 19-9 and metabolic syndrome:A cross-sectional study. J Diabetes, 2017; 9, 1040-7. doi: 10.1111/1753-0407.12523 [21] Lee PH, Macfarlane DJ, Lam TH, et al. Validity of the International Physical Activity Questionnaire Short Form (IPAQ-SF):a systematic review. Int J Behav Nutr Phys Act, 2011; 8, 115. doi: 10.1186/1479-5868-8-115 [22] Executive Summary of The Third Report of The National Cholesterol Education Program (NCEP) Expert Panel on Detection, Evaluation, And Treatment of High Blood Cholesterol In Adults (Adult Treatment Panel Ⅲ). JAMA, 2001; 285, 2486-97. [23] Alberti KG, Zimmet P, Shaw J. The metabolic syndrome——a new worldwide definition. Lancet (London, England), 2005; 366, 1059-62. doi: 10.1016/S0140-6736(05)67402-8 [24] World Health Organization. Definition and diagnosis of diabetes mellitus and intermediate hyperglycemia. Geneva: World Health Organization, 2006. [25] Lu J, Bi Y, Wang T, et al. The relationship between insulin-sensitive obesity and cardiovascular diseases in a Chinese population:results of the REACTION study. Int J Cardiol, 2014; 172, 388-94. doi: 10.1016/j.ijcard.2014.01.073 [26] Vaverkova H, Karasek D, Halenka M, et al. Inverse association of lipoprotein (a) with markers of insulin resistance in dyslipidemic subjects. Physiol Res, 2017; 66, S113-s20. https://www.ncbi.nlm.nih.gov/pubmed/28379036 [27] Rogowski O, Shapira I, Bassat OK, et al. Waist circumference as the predominant contributor to the micro-inflammatory response in the metabolic syndrome:a cross sectional study. J Inflamm (Lond), 2010; 7, 35. doi: 10.1186/1476-9255-7-35 [28] Wang YI, Schulze J, Raymond N, et al. Endothelial inflammation correlates with subject triglycerides and waist size after a high-fat meal. Am J Physiol Heart Circ Physiol, 2011; 300, H784-91. doi: 10.1152/ajpheart.01036.2010 [29] Ogbera AO, Azenabor AO. Lipoprotein (a), C-reactive protein and some metabolic cardiovascular risk factors in type 2 diabetes. Diabetol metab syndr, 2010; 2, 51. doi: 10.1186/1758-5996-2-51 [30] Konerman M, Kulkarni K, Toth PP, et al. Evidence of dependence of lipoprotein(a) on triglyceride and high-density lipoprotein metabolism. J Clin Lipidol, 2012; 6, 27-32. doi: 10.1016/j.jacl.2011.08.004 [31] Nordestgaard BG, Chapman MJ, Ray K, et al. Lipoprotein(a) as a cardiovascular risk factor:current status. Eur Heart J, 2010; 31, 2844-53. doi: 10.1093/eurheartj/ehq386 [32] Kolovou GD, Anagnostopoulou KK, Cokkinos DV. Pathophysiology of dyslipidaemia in the metabolic syndrome. Postgrad Med J, 2005; 81, 358-66. doi: 10.1136/pgmj.2004.025601 [33] Ginsberg HN, Zhang YL, Hernandez-Ono A. Metabolic syndrome:focus on dyslipidemia. Obesity (Silver Spring), 2006; 14, 41s-9s. doi: 10.1038/oby.2006.281 [34] Esteve E, Ricart W, Fernández-Real JM. Dyslipidemia and inflammation:an evolutionary conserved mechanism. Clin Nutr, 2005; 24, 16-31. doi: 10.1016/j.clnu.2004.08.004 -

 点击查看大图

计量
- 文章访问数: 6261
- HTML全文浏览量: 1698
- PDF下载量: 253
- 被引次数: 0

 Quick Links