

 下载:
下载:


-
Particulate matter with diameter equal to or less than 2.5 µm (PM2.5) in polluted air tends to penetrate deep into alveoli of the lung and deposit onto the surface of lung epithelial cells (LECs). Alveolar epithelium and pulmonary macrophages are able to ingest inhaled PM2.5[1]. Exposure to PM2.5 increases the risk of respiratory diseases, including nasal obstruction, cough, asthma, respiratory infection, chronic obstructive pulmonary disease (COPD) and lung cancer[2-4].
LECs are the first cells to contact inhaled PM2.5, which may induce cellular responses, including oxidative stress and alteration of protein expression profiles, through complicated molecular mechanisms. Previous studies have shown that cytotoxicity produced by PM2.5 is frequently attributed to oxidative stress due to intracellular reactive oxygen species (ROS), thereby inducing DNA and mitochondrial damage[5-7]. PM2.5 may also alter gene expression profiles[8], such as upregulation of tumor growth factor-β (TGF-β) and ligands for epidermal growth factor receptor (EGFR)[9,10].
Inhaled PM2.5 deposited on the surface of lung epithelium can be phagocytosed by LECs through pattern recognition receptors (PRRs) or other phagocytic receptors to exert cytotoxicity or inflammation[11]. Soluble PM2.5 components as well as the particles themselves may interact with epithelial cell surface receptors to trigger pro-inflammatory responses. Over time, LECs may adapt to air pollution by up- or down-regulating cell surface receptors. Systematic profiling of ligand-receptor interactions on the surface of LECs will provide in-depth understanding of how PM2.5 induces lung toxicity and LECs adaptively respond to air pollution.
Ligand-receptor interactions are traditionally characterized one ligand at a time. An innovative technology of quantitative ligandomics was recently developed to globally identify cell-wide ligands and simultaneously quantify their binding activities[12]. This approach successfully identified several novel ligands with different functions[12-14]. However, this new omics approach has never been applied to environmental biology. In this study, we applied quantitative ligandomics to globally map cellular ligands for human LECs with or without exposure to PM2.5 and to simultaneously quantify their binding activities. Quantitative comparison of the entire ligandome profiles systematically identified ligands with increased or decreased binding to PM2.5-exposed LECs. These results suggest that comparative ligandomics is a valuable approach to environmental medicine research.
-
An open reading frame phage display (OPD) cDNA library prepared from mouse embryos at Day 18 (E18) was obtained as previously described[15]. The human A549 lung alveolar epithelial cell line (carcinoma) was purchased from the ATCC (Manassas, VA, Cat. # CCL-185). F12/K culture medium and fetal bovine serum were obtained from Thermo Fisher (Waltham, MA). Human rhinovirus (HRV) 3C protease and BLT5616 bacteria were purchased from Sigma (St. Louis, MO).
-
PM2.5 samples were collected as reported previously[16]. Briefly, PM2.5 particles were collected onto quartz microfiber filters (20.3 cm × 25.4 cm, PALL, USA) using a PM2.5 high-volume air sampler (KC-1000, Laoshan Mountain Electronic Instrument Factory Company, Qingdao, China) for 14 days in October 2014 in Zhengzhou, the capital city of Henan Province, located in central China. The sampling apparatus was located about 14 meters above ground level. In the surrounding areas, a variety of small- and medium-size factories, including machineries, chemical manufacturing companies, boiler facilities and power plants, were present, and the samples represented typical and important ambient air quality situations in a mixed pollutant area. Airborne PM2.5 was sampled daily (24-h samples) with an airflow of 1.13 m3/min on preconditioned (48 h at 20–25 ℃ and 40%–45% relative humidity) and preweighed TE-6070DX-2.5-HVS filters (Tisch Environmental, Village of Cleves, OH) using a microbalance (Mettler Toledo XS205, Switzerland). After particle collection, filters were reconditioned for another 48 h. Particles were extracted from the filter by vortexing in 2 mL sterile distilled water for 10 min followed by 30-s sonication. The PM2.5 suspension was stored at -80 °C, and then put in a vacuum freeze-drying instrument for 15 h to remove water. Before and after extraction, each preconditioned filter was weighed twice, and the difference of the values was less than or equal to 0.03 mg. The mass of the extracted PM2.5 was calculated based on the difference in filter weight before and after extraction. Quartz filters have structural stability, which was minimally removed during PM2.5 extraction. Although the use of quartz filter may sometimes result in the loss of particle mass, the choice of filters is unable to influence the responses of lung epithelial cells[17-19]. Dried PM2.5 was suspended in sterile nanopure water to create a PM2.5 stock solution for the following cell exposure studies.
-
A549 cells, a human lung alveolar epithelial cell line, were cultured in F12/K medium supplemented with 10% fetal bovine serum (FBS), 1X GlutaMax and 1X penicillin/streptomycin (10,000 units and 10 mg/mL) at 37 ℃ with 5% CO2. We chose the A549 cell line for this study because it is one of the most studied cell lines used to determine adverse effects of PM2.5, including particle uptake/phagocytosis by cells and induced signaling pathways[20,21].
-
PM2.5 was diluted into phosphate-buffered saline (PBS). A549 cells were treated with PM2.5 (50 µg/mL) or PBS for 24 h. The OPD cDNA library was amplified in BLT5616 bacteria, precipitated, resuspended, and incubated with A549 cells (≥ 90% confluence) for 1 h at 4 ℃ in 6-well plates [≥ 1012 plaque forming units (pfu)/well][15,22,23]. After washing, cell-bound phages were eluted with HRV 3C protease (10 units in 500 μL) at 4 ℃ (overnight for the 1st round; 4 h for the 2nd and 3rd rounds). After centrifugation (2,000 ×g for 5 min), eluted phages in the supernatant were quantified by plaque assay, amplified in BLT5615 bacteria and used as input for the next round of selection[22,23]. Three rounds of cell-based binding selection were performed.
-
The cDNA inserts of all enriched clones were amplified by PCR using upstream and downstream primers annealing to the phage backbone sequences flanking the cDNA library inserts, as previously described[23]. After resolved on an agarose gel, PCR products between 400–1,500 bp were purified and subjected to next generation DNA sequencing (NGS) analysis by the DNA Sequencing Core Facility at Baylor College of Medicine[12].
-
All sequence reads were aligned against the NCBI CCDS database. All identified ligands are listed in an Excel spreadsheet with their copy numbers. Ligandome data are normalized against the total number of their sequence reads identified by NGS[24]. Quantitative comparisons of the entire ligand profiles for PM2.5-treated and untreated cells were performed using Chi-square (χ2) tests to systematically identify PM2.5-regulated epithelial ligands[24]. Only those with statistically significant difference (P < 0.001) were defined as PM2.5-related epithelial ligands. Additional criteria to filter out false positives included PM2.5/control binding activity ratio ≥ 10 or ≤ 0.1, and copy number in treated or untreated LECs ≥ 10[24]. The binding activity ratio was calculated as (PM2.5 counts + 1)/(control counts + 1). A binding activity plot (PM2.5-treated vs. untreated) was generated to assess the global changes of ligand binding activity to PM2.5-treated cells, and a Pearson correlation coefficient was calculated[24].
-
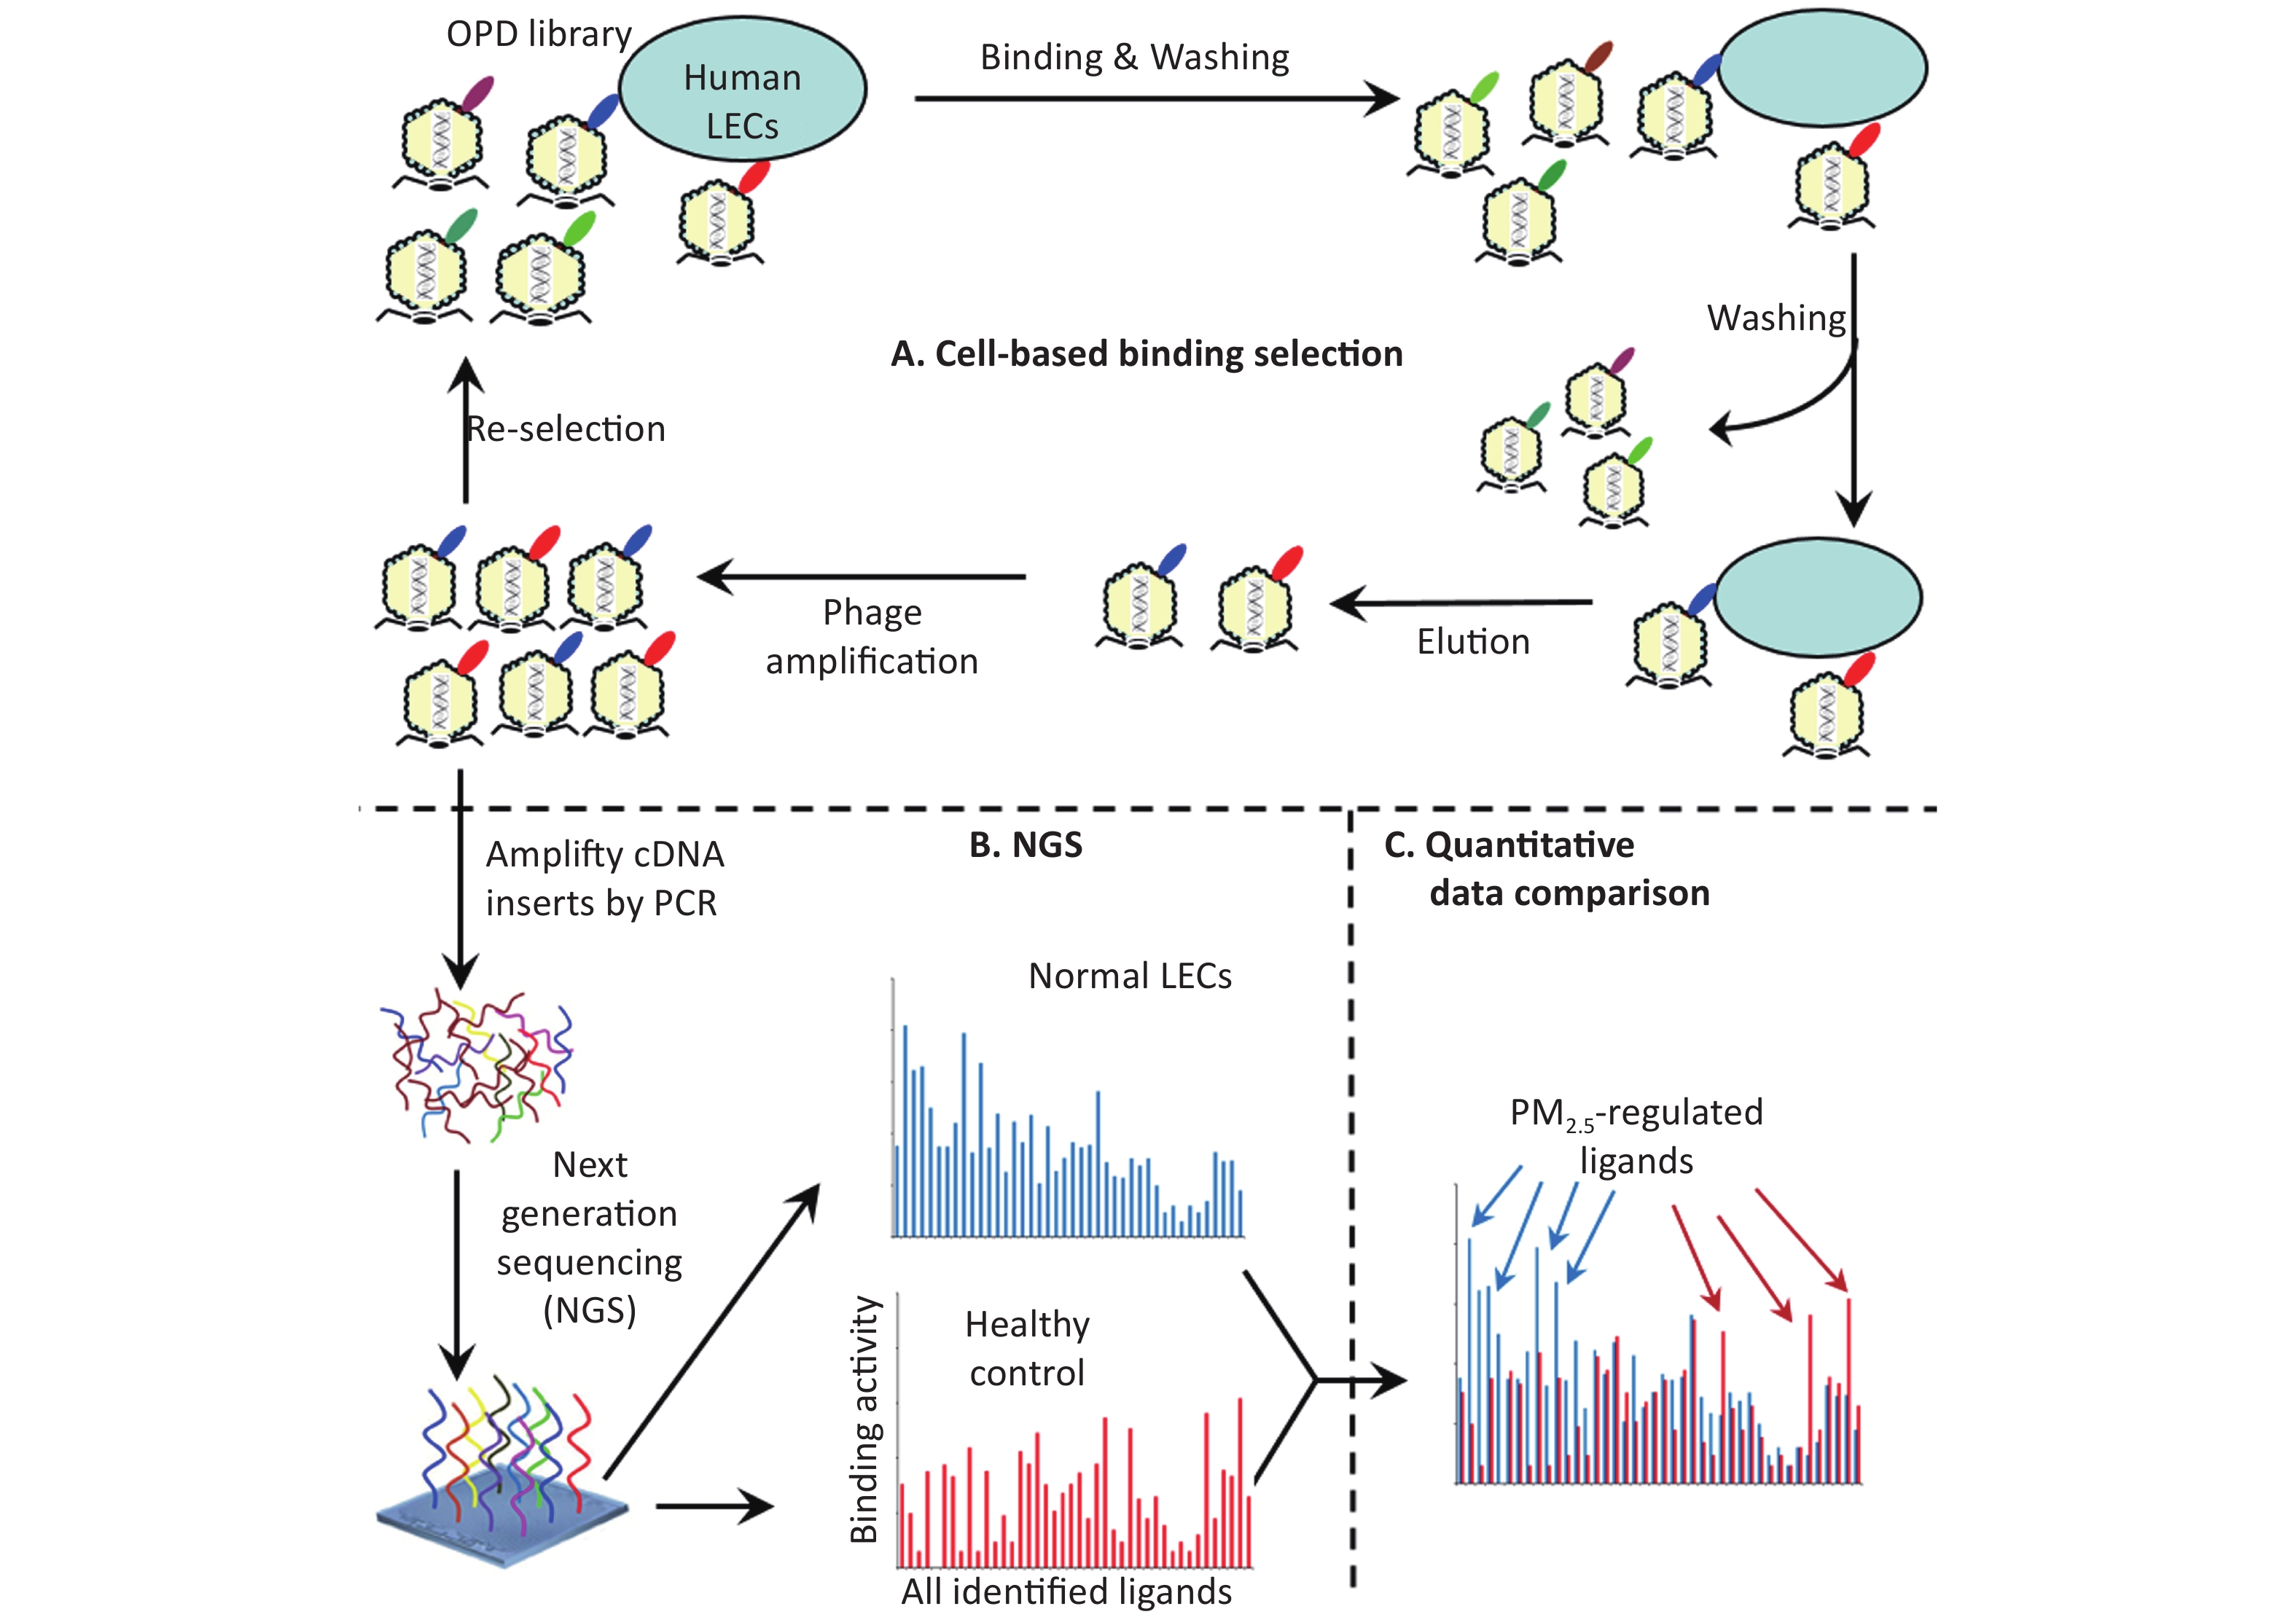
Ligandomics was recently developed as the only technology to globally map cell-wide ligands with simultaneous binding or functional activity quantification in the absence of receptor information. Here we applied this new approach to globally profile LEC ligands by performing three rounds of cell-based binding selection in PM2.5-treated or control cells (Figure 1A). After three rounds of selection, enriched phages showed ≥ 30-fold increase in cell-binding activity (Figure 2).
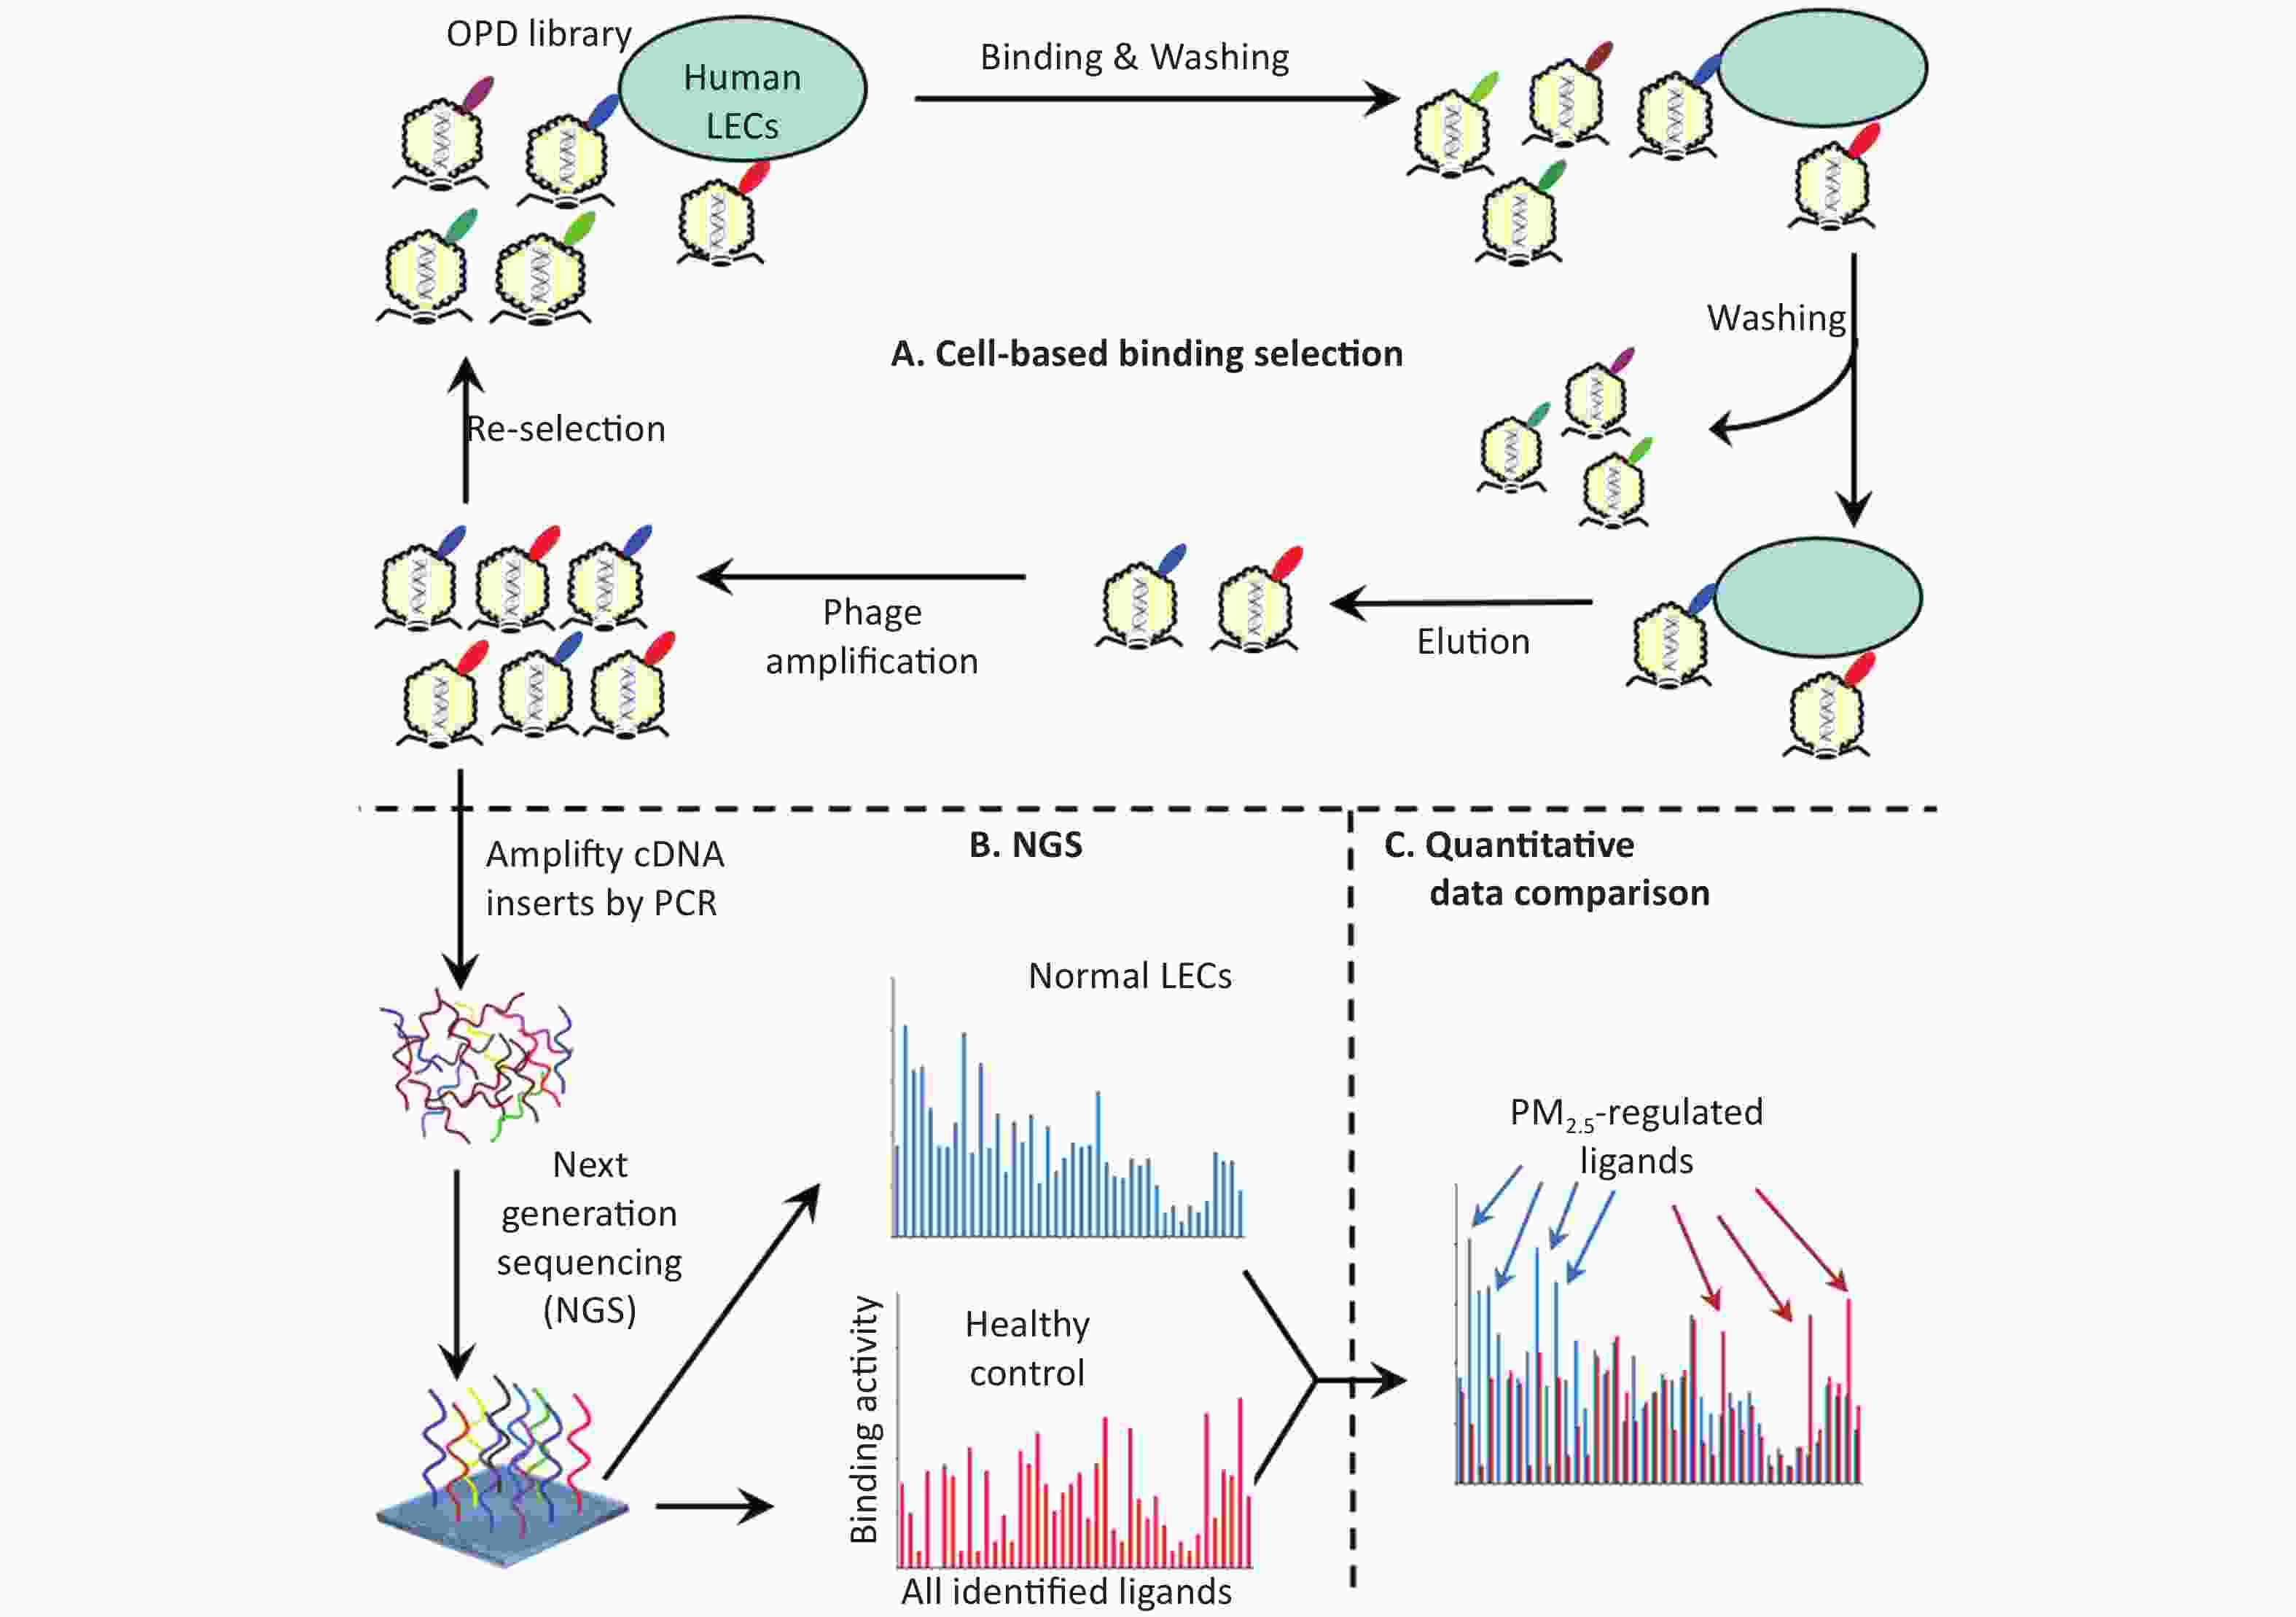
Figure 1. Schematics of comparative ligandomics to globally identify PM2.5-selective cellular ligands. (A) Open reading frame phage display (OPD) selection. OPD cDNA library was incubated with human lung epithelial cells (LECs) pretreated with or without PM2.5 for multiple rounds of binding selection to enrich clones displaying cellular ligands. (B) Global identification of all enriched ligands by NGS. The cDNA inserts of enriched clones were amplified by PCR and identified by NGS. The copy number of the cDNA inserts is the equivalent of their clone numbers or the binding activity of the displayed ligands. (C) Comparative ligandomics data analysis. Quantitative comparison of the entire ligandome profiles for PM2.5-treated vs. untreated LECs systematically identified PM2.5-selective ligands.
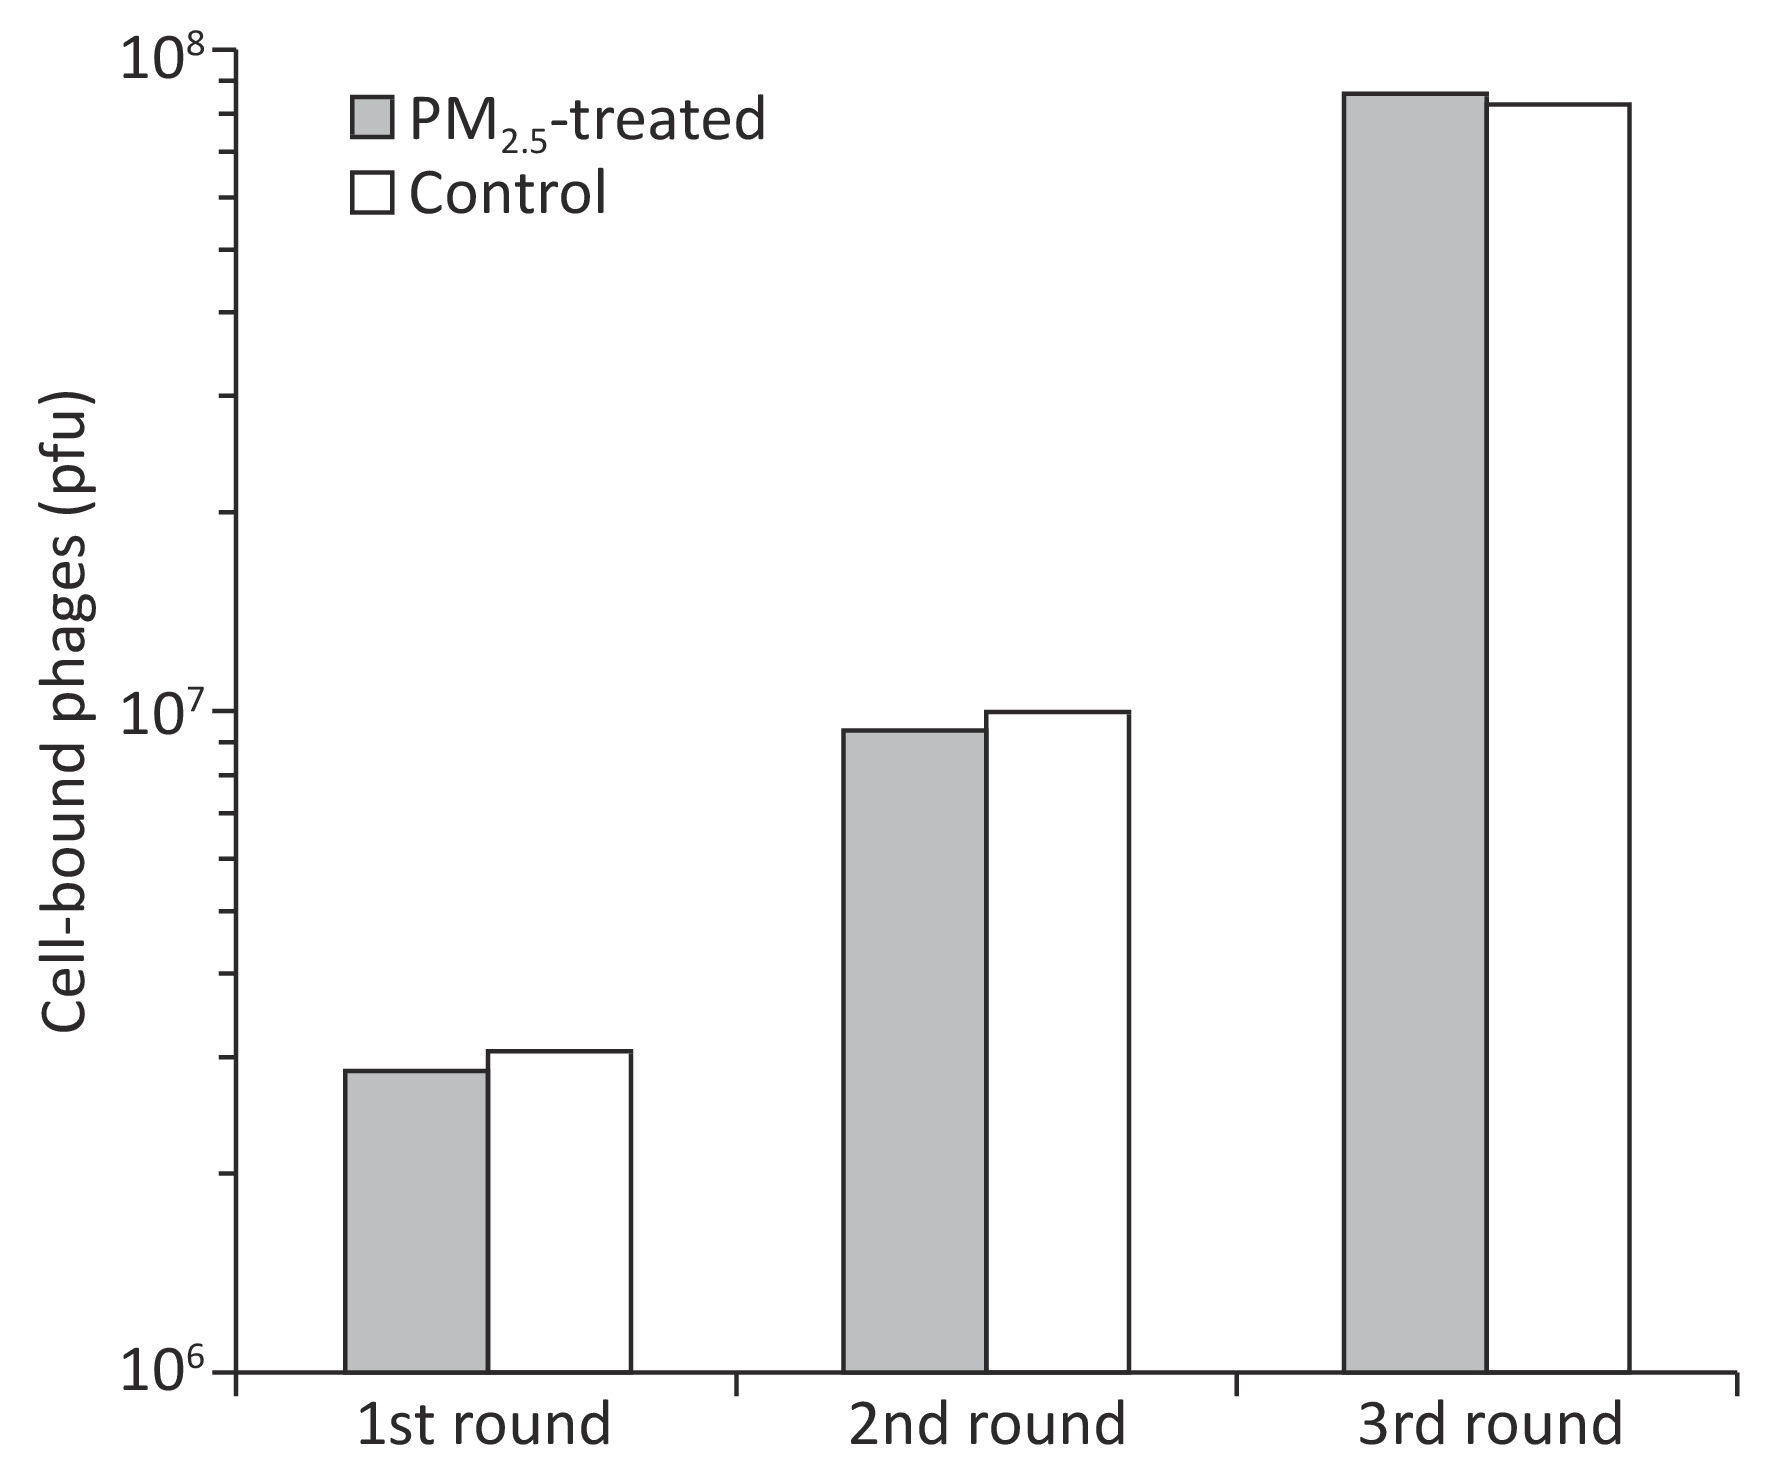
Figure 2. Enrichment of LEC-binding phages by cell-based phage binding selection. The library was incubated with A549 cells with or without PM2.5 treatment in 6-well plates. After washing, bound phages were eluted by 3C protease cleavage. Eluted phages were quantified by plaque assay.
Instead of performing a labor-intensive manual screening of enriched clones individually, the cDNA inserts of all enriched clones were analyzed by NGS. A total of 975,632 and 1,132,564 valid sequence reads for PM2.5-treated and control cells, respectively, were identified. Identified sequences were aligned to 4,140 (PM2.5-treated cells) and 4,091 (control cells) proteins in the NCBI CCDS database (Figure 3A and 3B).
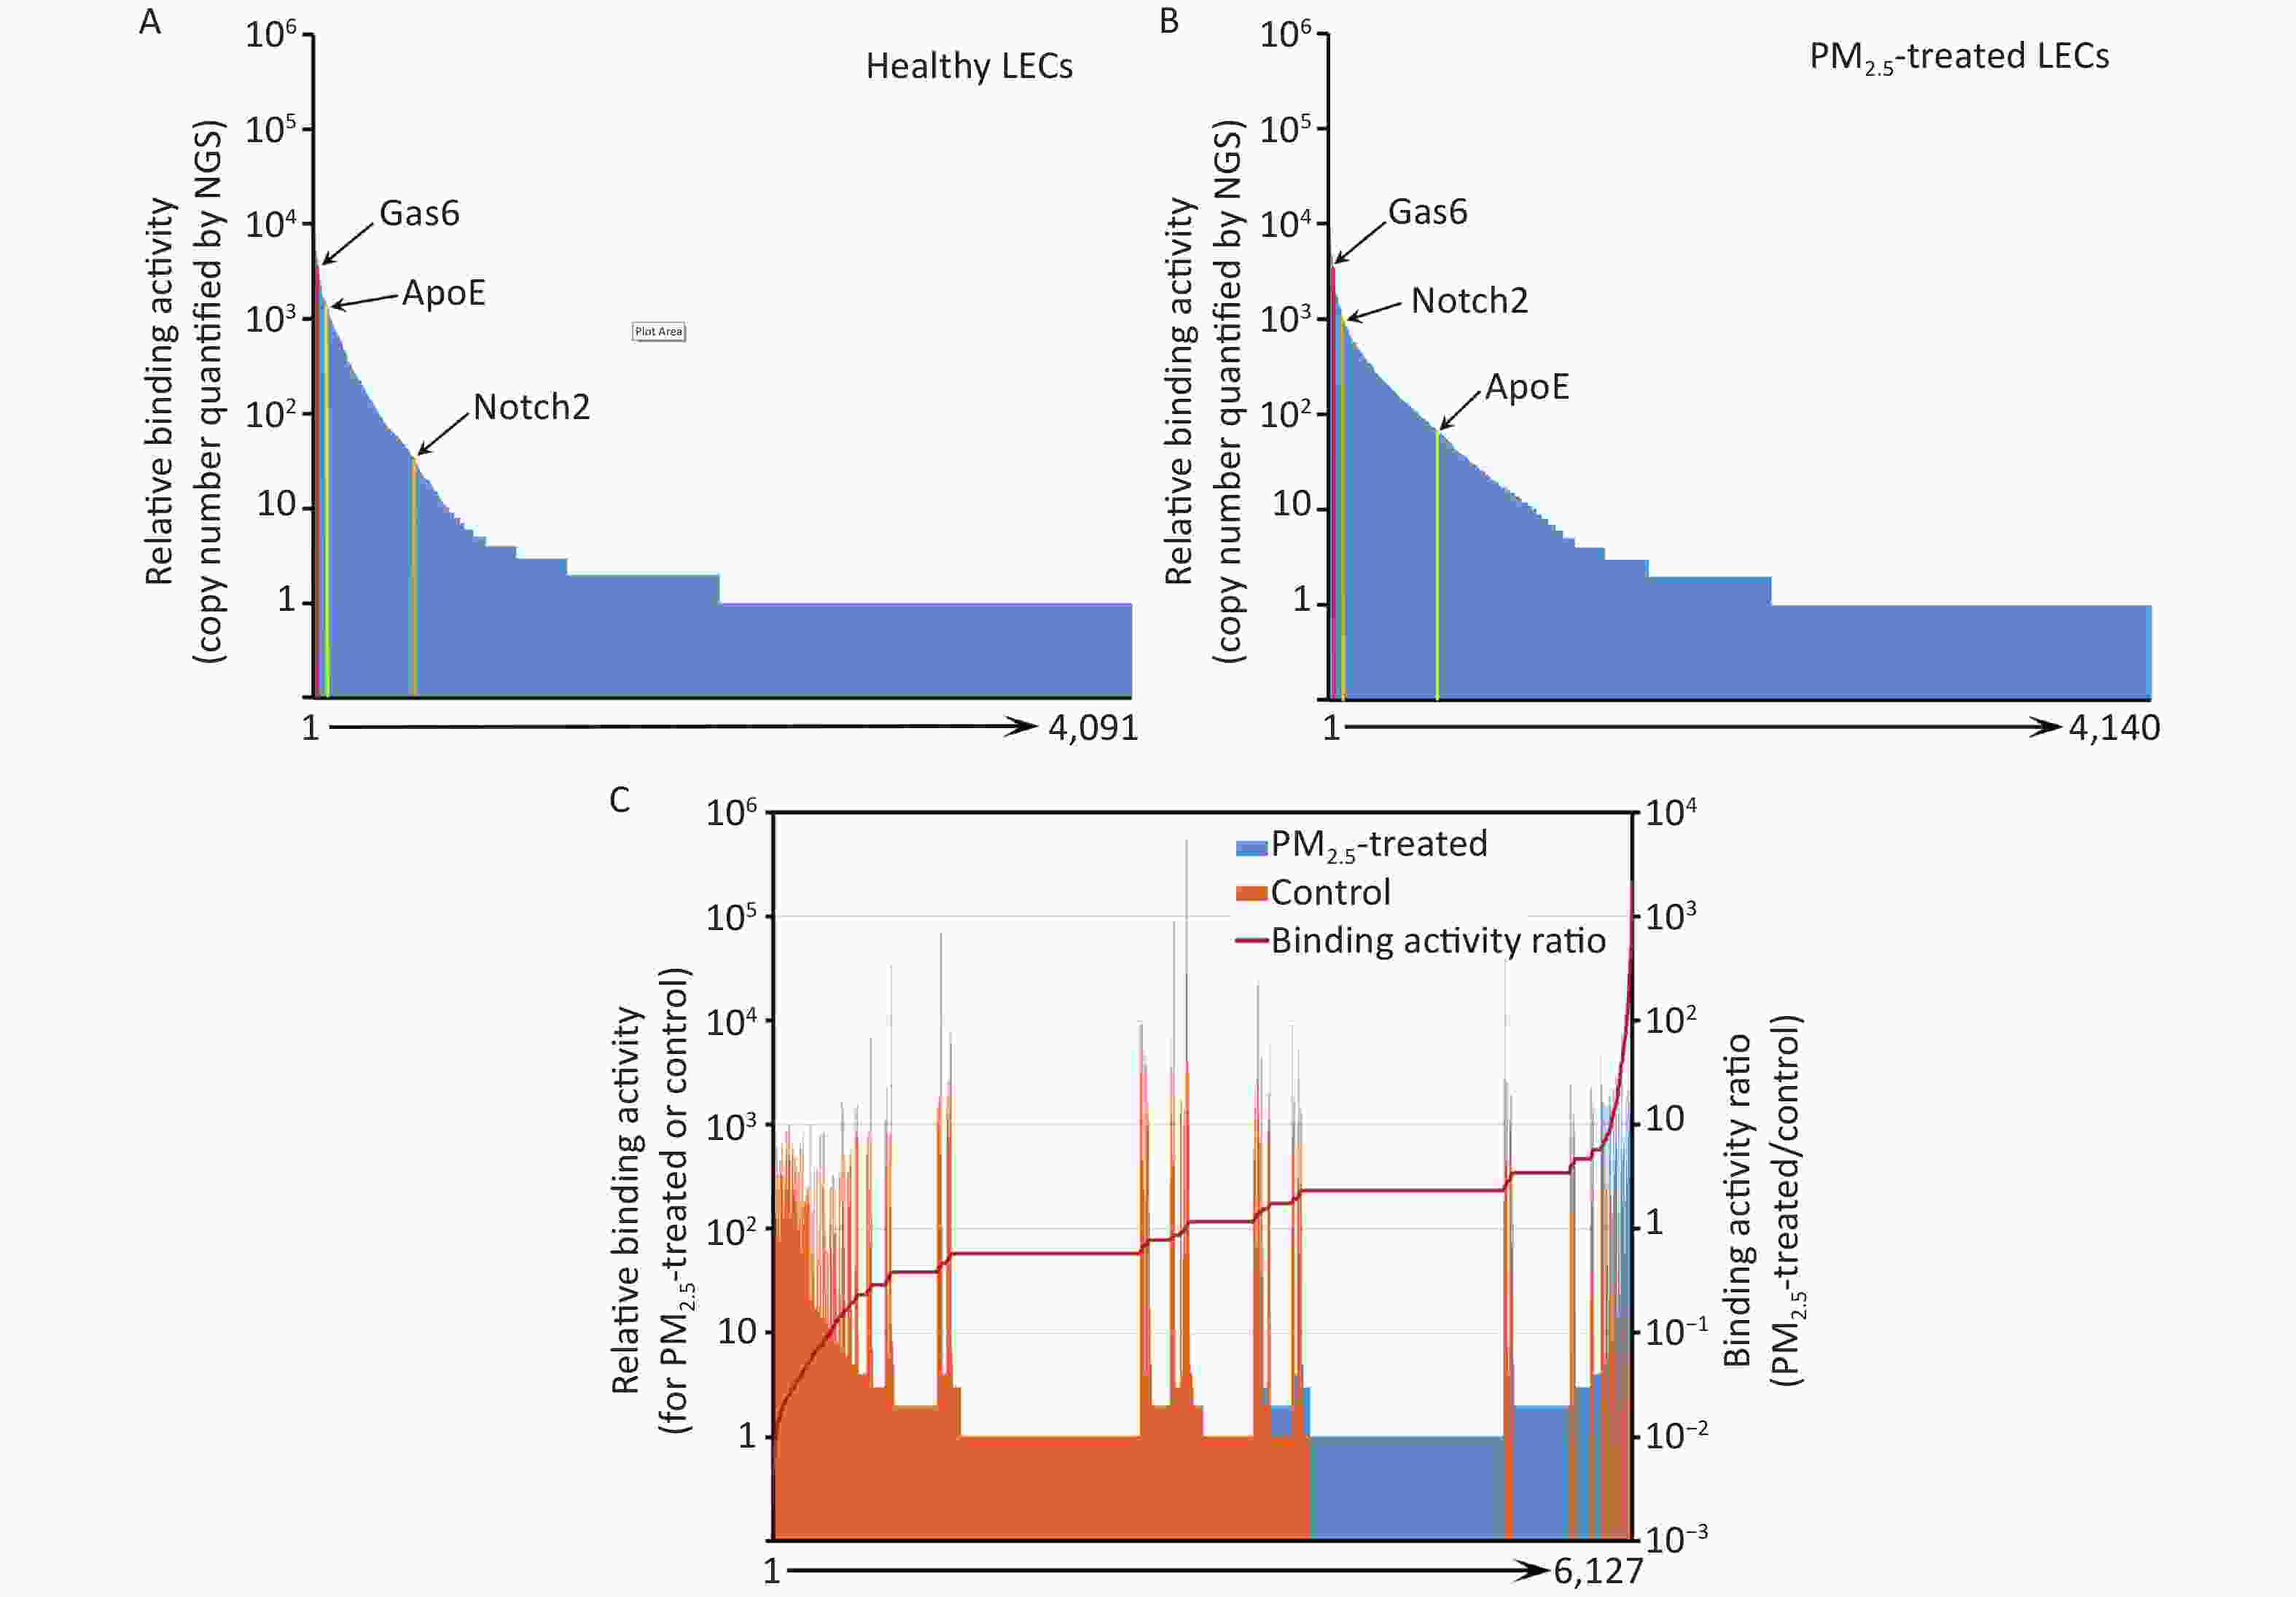
Figure 3. Ligandome profile. (A) Binding activity profile of the entire ligandome for control A549 human LECs. (B) Binding activity profile of the entire ligandome for PM2.5-treated A549 cells. (C) Binding activity ratio of the entire ligandomes for PM2.5-treated vs. control cells.
The copy numbers of cDNA inserts quantified by NGS represent the relative binding activity of the identified ligands (see Discussion), most of which had background binding activity with less than 10 copies of detected cDNAs. Only 1,034 and 686 ligands had ≥ 10 copies that bound to control and PM2.5-treated LECs, respectively (Figure 3A and 3B). Quantitative comparison of the entire ligandome profiles for PM2.5-treated vs. control A549 LECs by Chi-square test systematically identified 143 ligands with increased binding (PM2.5-high) to PM2.5-exposed A549 LECs and 404 ligands with decreased binding (PM2.5-low) (Figure 3C, Table 1).
Table 1. PM2.5-related LEC ligands identified by comparative ligandomics
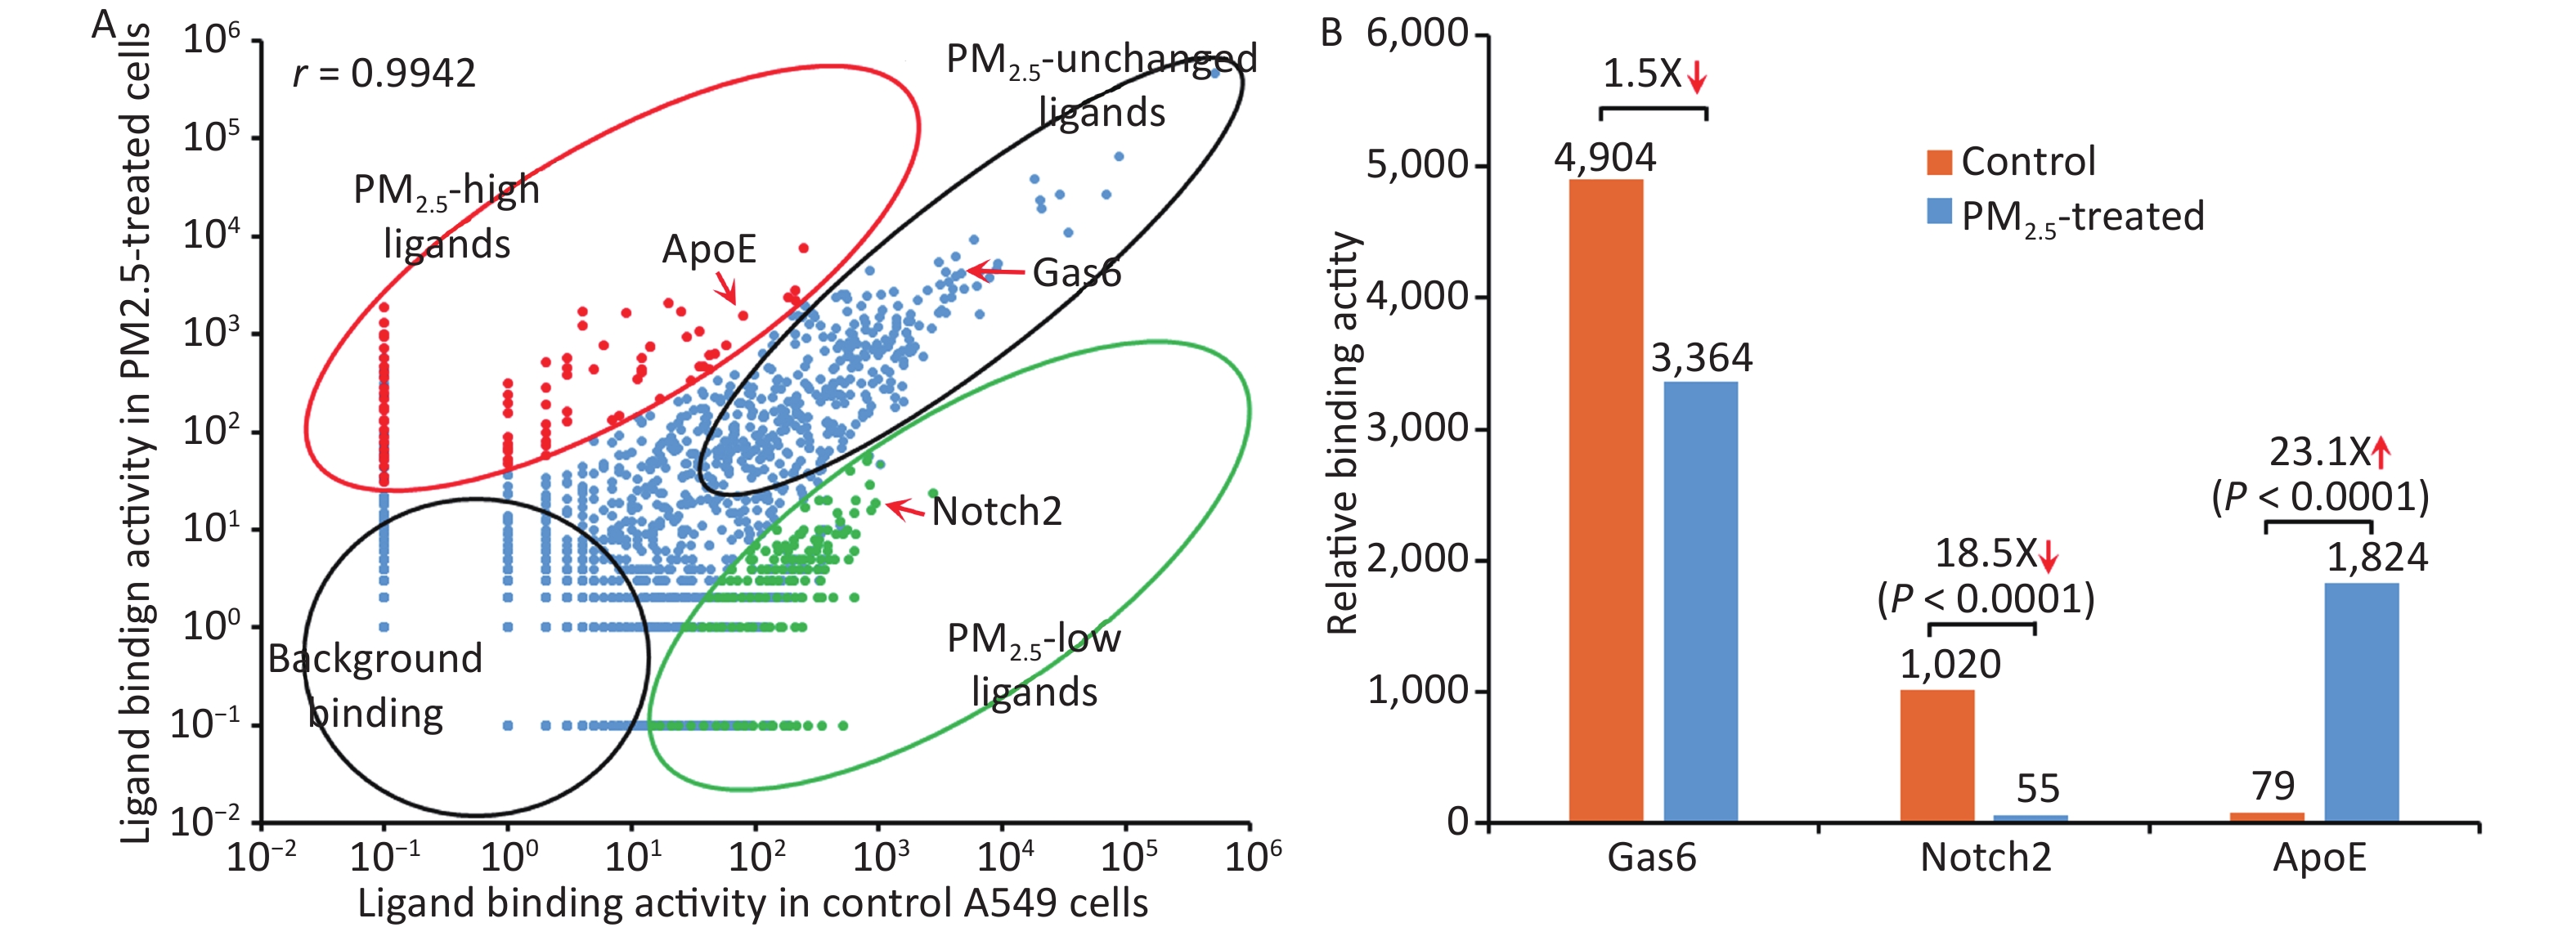
CCDS_ID Protein Binding activity Activity ratio Control PM2.5 CCDS40232 Gas6 4,904 3,364 1.5X ↓ CCDS16777 Notch2* 1,020 55 18.5X ↓ CCDS20912 ApoE* 79 1,824 23.1X ↑ CCDS28578 Tulp1 20,012 27,450 1.3X ↑ CCDS28713 Abcf1 3,658 3,957 1.1X ↑ Total identified sequences 1,132,564 975,632 Total identified ligandsa 1,034 686 PM2.5-related ligands* 404 ↓ 143 ↑ Note. *P < 0.001, control vs. PM2.5, χ2 test. a, bound ligand count ≥ 10. The binding activity of the entire ligandome profile for PM2.5-treated vs. untreated A549 LECs is plotted in Figure 4A. Ligands represented by green dots within the bottom-right circle have decreased binding activity to PM2.5-treated cells, whereas ligands represented by red dots within the upper-left circle have increased binding activity. Ligands represented by blue dots around the diagonal line have minimal change in binding activity. Proteins represented by bottom-left circles have low background binding activity to A549 cells and indicate non-specific binding. The Pearson correlation coefficient for the entire ligandomes of PM2.5-treated and control LECs in the binding activity plot was calculated as r = 0.9942 (Figure 4A).
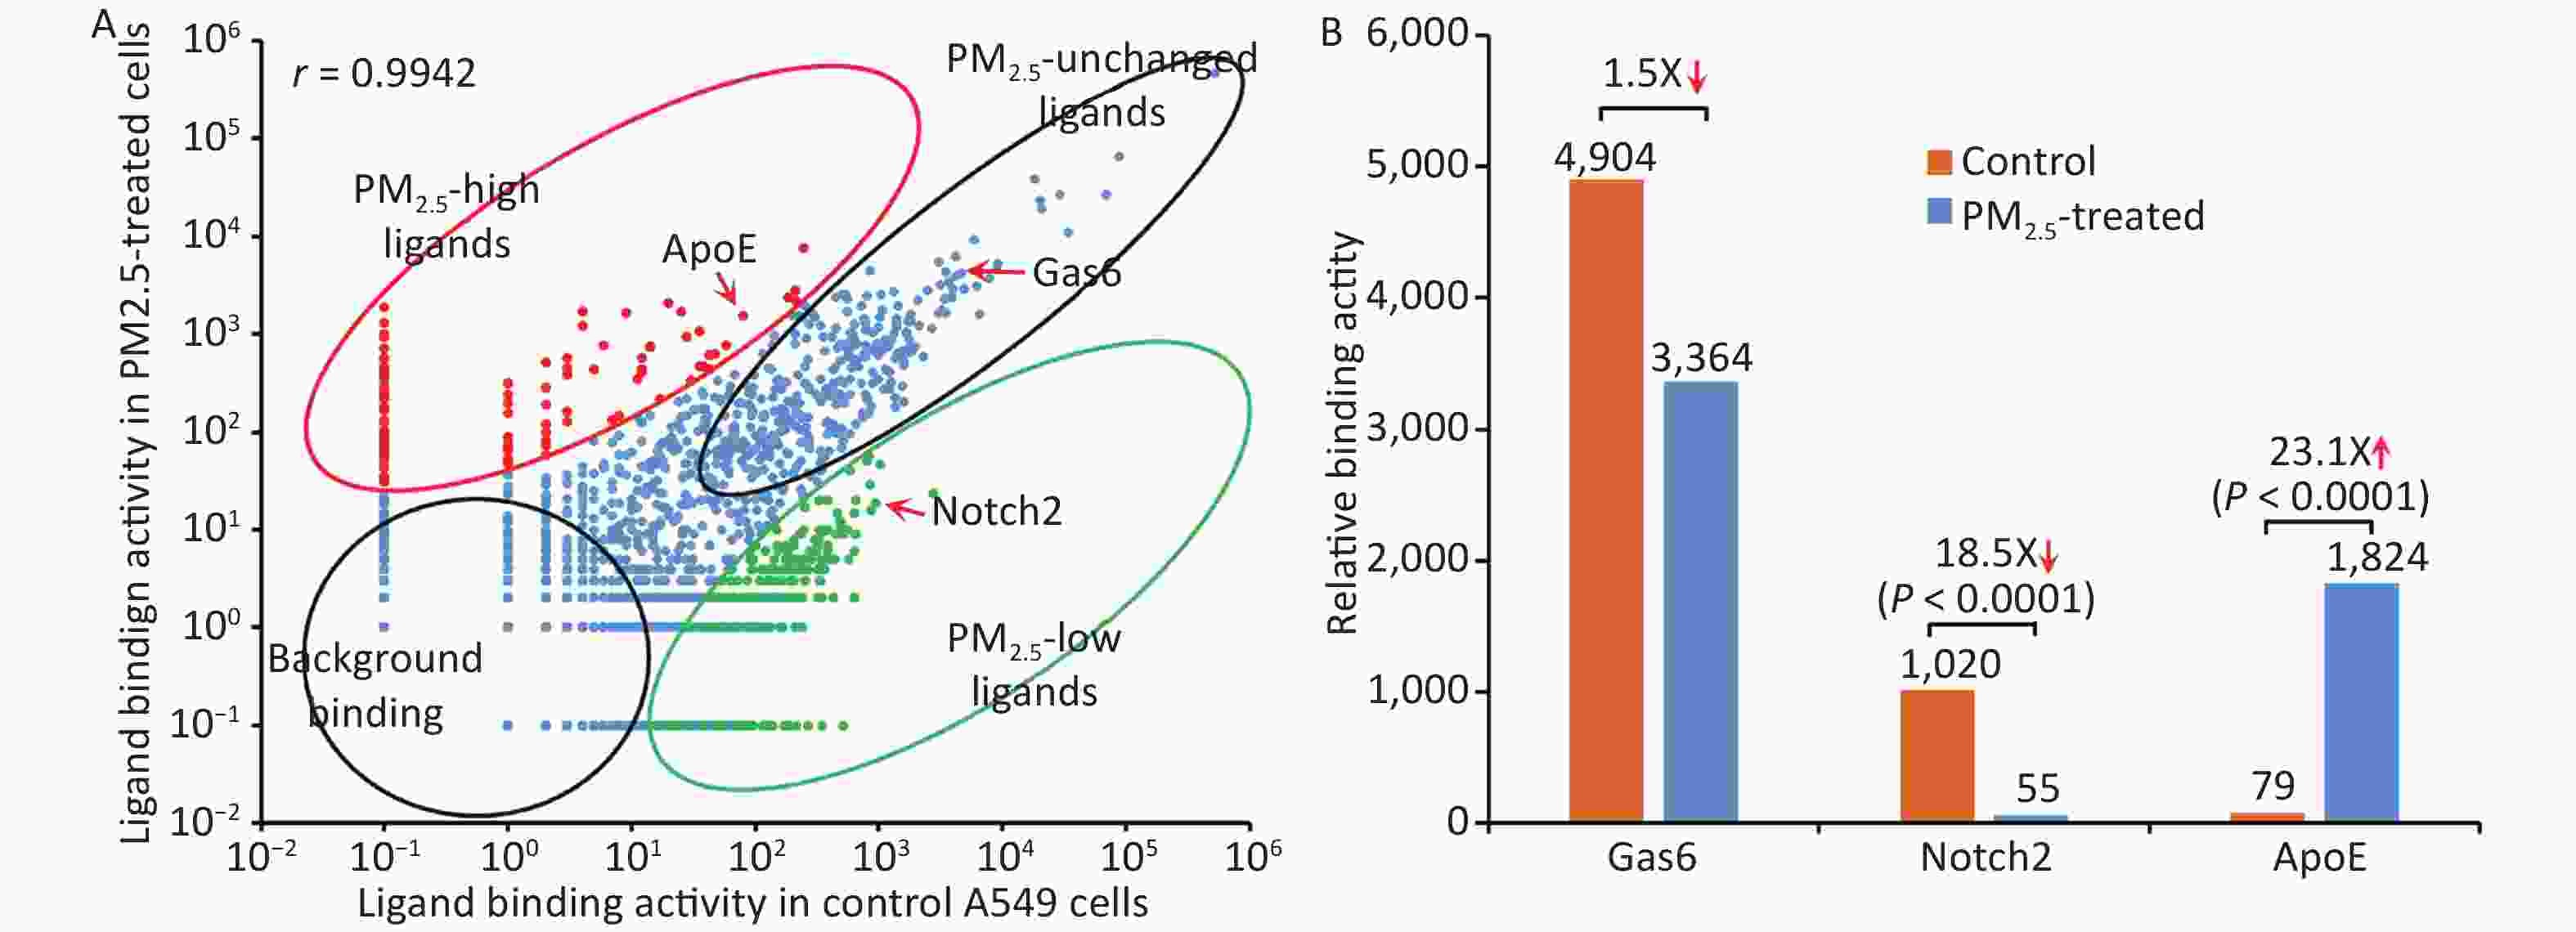
Figure 4. Global mapping of PM2.5-specific cellular ligands by comparative ligandomics. (A) Binding activity plot for PM2.5-treated vs. untreated A549 cells. Ligands with increased or decreased binding to PM2.5-treated cells are classified as PM2.5-high or PM2.5-low, respectively. PM2.5-unchanged ligands and background binding showed similar binding activities in both conditions. PM2.5-high ApoE, PM2.5-low Notch2 and unchanged Gas6 are indicated. The Pearson correlation coefficient was calculated as r = 0.9942. (B) PM2.5 treatment altered ligand binding activity. ApoE preferentially bound to PM2.5-treated LECs (1,824:79 for PM2.5-treated vs. control cells). Notch2 binding to LECs was reduced in PM2.5-treated cells (55:1,020). Gas6 had minimal binding activity changes to PM2.5-treated cells (3,364:4,904).
-
The up- and down-regulation of ligandome binding activity profiles to PM2.5-treated cells implied that the particles could alter the expression of cell surface receptors to modulate various cellular responses. One of the important biological responses of the lung epithelium is phagocytosis or engulfment of PM2.5 as a part of innate defense mechanisms for debris clearance[1,20]. Phagocytosis is mediated through cell surface phagocytic receptors[25], whose altered expression can be detected by comparative ligandomics.
Apolipoprotein E (ApoE), a well-known phagocytosis ligand[26,27], was uncovered with up-regulated binding activity. Comparative ligandomics analysis revealed that ApoE binding to PM2.5-treated cells increased by 23.1-fold (P < 0.001) (Figure 4B, Table 1). However, not all phagocytosis ligands showed increased binding activity. For example, growth arrest-specific 6 (Gas6), a well-characterized phagocytosis ligand, had a 1.5-fold decrease in binding to PM2.5-exposed cells (Figure 4B, Table 1). Other phagocytosis ligands, such as Tubby-like protein 1 (Tulp1) and ATP-binding cassette subfamily F member 1 (Abcf1), showed negligible binding activity changes in PM2.5-treated cells (1.3- and 1.1-fold increase, respectively) (Figure 4B, Table 1). However, neurogenic locus notch homolog protein 2 (Notch2), with a potential to regulate phagocytosis, had an 18.5-fold increase in binding to particle-exposed cells (Figure 4B, Table 1). These data suggested that PM2.5 differentially promoted the induction of some phagocytic receptors but not others on human LECs.
-
Plasma membrane receptors are the most valuable drug targets, as highlighted by the fact that one third of all FDA-approved drugs target G protein-coupled receptors (GPCRs)[28]. Other receptors, such as receptor tyrosine kinases and integrins, are also important therapeutic targets. We assume that cell surface ligands with a similar capacity to regulate diverse cellular functions would be equally valuable as drug targets, such as insulin to treat diabetes and inhibitors of vascular endothelial growth factor (VEGF) to ameliorate pathological angiogenesis[29]. Surprisingly, however, only a limited number of drugs have been successfully developed by targeting cellular ligands[28]. Part of the reason is technical difficulties in the identification of unknown cellular ligands, whereas all plasma membrane receptors can be readily identified based on their transmembrane domains and cell surface expression[30]. Current technologies of functional proteomics are mainly developed to map intracellular protein-protein interactions but not cell surface ligand-receptor communications[31].
To tackle these challenges, we recently developed ligandomics technology to globally map cell-wide ligands and comparative ligandomics to systematically identify disease-selective ligands as drug targets[32]. An example for comparative ligandomics to facilitate development of novel drug therapies is the discovery of secretogranin III (Scg3) for the treatment of diabetic retinopathy[24]. We applied comparative ligandomics to diabetic and control retina in live mice for systematic profiling of disease-selective endothelial ligands[24]. Scg3 was discovered as the first diabetes-selective or restricted angiogenic and vascular leakage factor. Among thousands of identified endothelial ligands, Scg3 had the highest binding activity ratio (1,731:0) to diabetic vs. control vessels and the lowest background binding to control vasculature[24]. We developed a Scg3-neutralizing antibody and demonstrated its high efficacy to alleviate retinal vascular leakage in mice with diabetic retinopathy[24]. We further proposed that therapies targeting disease-selective ligands have the safety advantage of minimal side effects on healthy cells or vessels with wide therapeutic windows[32]. Indeed, compared to conventional anti-angiogenic therapy, disease-selective anti-Scg3 mAb showed an improved safety profile[33]. These results suggest that comparative ligandomics is a powerful tool to discover disease-restricted extracellular ligands as high-quality drug targets for novel ligand-guided targeted therapies[24,32].
This study applied comparative ligandomics to A549 cells and identified ApoE with increased binding activity to PM2.5-treated cells, Notch2 with decreased binding, and Gas6, Tulp1, and Abcf1 with minimal binding activity changes (Figure 4, Table 1). ApoE and its low-density lipoprotein receptor (LDLR) have been extensively studied. ApoE is a well-known phagocytosis ligand[6,27], and LDLR and LDLR-related proteins are cell surface phagocytic receptors[34-36]. The increased binding activity of ApoE to PM2.5-treated A549 cells indicated the upregulation of its phagocytic receptors. Gas6 is also a well-characterized phagocytosis ligand interacting with the MerTK phagocytic receptor[25], and Tulp1 and Abcf1 were recently reported as phagocytosis ligands[13,37]. These data implied that PM2.5 exposure may selectively upregulate some, but not all, phagocytic receptors on the lung epithelium. Notch and its receptor, Jag1, regulate M1 polarization and phagocytosis of macrophages[38]. Notch2 also regulates cell growth and other cellular functions, such as marginal zone B-cell growth and immunological function, vascular smooth muscle cell differentiation and proliferation, and vascular endothelial cell survival[39]. Furthermore, Notch2 functions as a tumor suppressor[40]. Notch2 binds to DDL1 (Delta-link protein 1), GSK3B, Jag1, and Jag2[41]. The precise role of Notch2 in the regulation of lung epithelium phagocytosis has yet to be established.
The current challenge is how to validate the therapeutic potential for a large number of disease-selective ligands identified by comparative ligandomics. We recently proposed function-first and therapy-first approaches to verify functional activity, disease selectivity, pathological role, and therapeutic potentials of identified ligands[42]. In these approaches, disease-selective ligands or cognate inhibitors will be independently characterized for their activity to exacerbate or alleviate disease pathogenesis in animal models, followed by drug development[24,42]. The barrier to verify the disease-selective ligands identified in this study was how to develop appropriate in vitro or in vivo models and independently assess their potential for PM2.5 intervention.
The binding activity of identified ligands is a relative value, which reflects not only ligand-receptor binding affinity but also the expression level of the cognate receptors on the surface of A549 cells. Some ligands may bind to multiple receptors. Given that different ligands may have distinct functional roles, variable binding affinities, multiple receptors, and alterable receptor expression, it is inappropriate to compare different ligands by their binding activity. However, the same ligand has the same panel of receptors and binding affinities[24,32]. Thus, quantitative comparison of the same ligands of PM2.5-treated vs. untreated cells could reveal air pollution-induced upregulation or downregulation of their binding activity to the A549 cell surface; this reflects the altered expression of receptors.
The Pearson correlation coefficient of the binding activity plot for the entire ligandome unravels the global dysregulation of cell surface receptors. The correlation coefficient for PM2.5-exposed vs. control LECs was calculated as r = 0.9942 (Figure 4A). Our previous study of comparative ligandomics in streptozotocin-treated 4-month-diabetic and control mice calculated a Pearson correlation coefficient (r = 0.498) for all identified retinal endothelial ligands[24]. Comparison of these two coefficients suggested that global ligandome alterations on A549 cells pretreated with PM2.5 for only 24 h were not as severe as those on the retinal endothelium of streptozotocin-induced 4-month-diabetic mice. It is possible that long-term exposure of the lung to PM2.5 may induce more diverse global alterations of the entire ligandome profile.
Ligandomics is an OPD-based technology and may not be able to display some proteins appropriately due to protein misfolding or posttranslational modifications[24]. We estimate that ligandomics may miss a small percentage of cellular ligands as false negatives due to these technical limitations[24]. These technical problems could be solved by mammalian display systems, such as retrovirus display[43]. Nonetheless, OPD is presently the most robust display system for ligandomics analysis. To our knowledge, our ligandomics is the only technology to globally map cell-wide ligands, and comparative ligandomics is the only approach to systematically profile disease-restricted cellular ligands as high-quality drug targets[32]. Application of comparative ligandomics to environmental medicine will globally map pollution-induced alteration of ligandome profiles, thereby unraveling molecular toxicological mechanisms and potential targets for novel therapies.
-
Quantitative ligandomics globally mapped cell-wide ligands for PM2.5-treated and control human LECs with simultaneous quantification of their binding activities. Comparative ligandomic analysis for these two cells systematically identified ligands with increased or decreased binding activity to PM2.5-exposed cells. Global mapping of PM2.5-restricted cellular ligands could help delineate molecular mechanisms of the cellular response to pollution and identify potential targets for the development of novel therapies. These findings suggest that comparative ligandomics is a valuable approach for environmental medicine research.
-
LW is the inventor of a patent related to ligandomics technology. LW is a shareholder of LigandomicsRx, LLC.
doi: 10.3967/bes2020.023
-
Abstract:
Objective To investigate whether exposure to particulate matter of diameter equal to or less than 2.5 μm (PM2.5) alters the response of lung epithelial cells to extrinsic regulation by globally profiling cell surface ligands and quantifying their binding activity. Methods Human A549 lung epithelial cells (LECs) were treated with or without PM2.5. Ligandomic profiling was applied to these cells for the global identification of LEC-binding ligands with simultaneous quantification of binding activity. Quantitative comparisons of the entire ligandome profiles systematically identified ligands with increased or decreased binding to PM2.5-treated LECs. Results We found 143 ligands with increased binding to PM2.5-treated LECs and 404 ligands with decreased binding. Many other ligands showed no change in binding activity. For example, apolipoprotein E (ApoE), Notch2, and growth arrest-specific 6 (Gas6) represent ligands with increased, decreased, or unchanged binding activity, respectively. Both ApoE and Gas6 are phagocytosis ligands, suggesting that phagocytic receptors on LECs after stimulation with PM2.5 were differentially upregulated by PM2.5. Conclusion These results suggest that the newly-developed ligandomics is a valuable approach to globally profile the response of LECs to PM2.5 in terms of regulating the expression of cell surface receptors, as quantified by ligand binding activity. This quantitative ligandome profiling will provide in-depth understanding of the LEC molecular response on the cell surface to particulate matter air pollution. -
Key words:
- PM2.5 /
- Ligandomics /
- Lung epithelial cell /
- Comparative ligandomics /
- Ligand
-
Figure 1. Schematics of comparative ligandomics to globally identify PM2.5-selective cellular ligands. (A) Open reading frame phage display (OPD) selection. OPD cDNA library was incubated with human lung epithelial cells (LECs) pretreated with or without PM2.5 for multiple rounds of binding selection to enrich clones displaying cellular ligands. (B) Global identification of all enriched ligands by NGS. The cDNA inserts of enriched clones were amplified by PCR and identified by NGS. The copy number of the cDNA inserts is the equivalent of their clone numbers or the binding activity of the displayed ligands. (C) Comparative ligandomics data analysis. Quantitative comparison of the entire ligandome profiles for PM2.5-treated vs. untreated LECs systematically identified PM2.5-selective ligands.
Figure 2. Enrichment of LEC-binding phages by cell-based phage binding selection. The library was incubated with A549 cells with or without PM2.5 treatment in 6-well plates. After washing, bound phages were eluted by 3C protease cleavage. Eluted phages were quantified by plaque assay.
Figure 3. Ligandome profile. (A) Binding activity profile of the entire ligandome for control A549 human LECs. (B) Binding activity profile of the entire ligandome for PM2.5-treated A549 cells. (C) Binding activity ratio of the entire ligandomes for PM2.5-treated vs. control cells.
Figure 4. Global mapping of PM2.5-specific cellular ligands by comparative ligandomics. (A) Binding activity plot for PM2.5-treated vs. untreated A549 cells. Ligands with increased or decreased binding to PM2.5-treated cells are classified as PM2.5-high or PM2.5-low, respectively. PM2.5-unchanged ligands and background binding showed similar binding activities in both conditions. PM2.5-high ApoE, PM2.5-low Notch2 and unchanged Gas6 are indicated. The Pearson correlation coefficient was calculated as r = 0.9942. (B) PM2.5 treatment altered ligand binding activity. ApoE preferentially bound to PM2.5-treated LECs (1,824:79 for PM2.5-treated vs. control cells). Notch2 binding to LECs was reduced in PM2.5-treated cells (55:1,020). Gas6 had minimal binding activity changes to PM2.5-treated cells (3,364:4,904).
Table 1. PM2.5-related LEC ligands identified by comparative ligandomics
CCDS_ID Protein Binding activity Activity ratio Control PM2.5 CCDS40232 Gas6 4,904 3,364 1.5X ↓ CCDS16777 Notch2* 1,020 55 18.5X ↓ CCDS20912 ApoE* 79 1,824 23.1X ↑ CCDS28578 Tulp1 20,012 27,450 1.3X ↑ CCDS28713 Abcf1 3,658 3,957 1.1X ↑ Total identified sequences 1,132,564 975,632 Total identified ligandsa 1,034 686 PM2.5-related ligands* 404 ↓ 143 ↑ Note. *P < 0.001, control vs. PM2.5, χ2 test. a, bound ligand count ≥ 10.  下载: 导出CSV
-
[1] Stearns RC, Paulauskis JD, Godleski JJ. Endocytosis of ultrafine particles by A549 cells. Am J Respir Cell Mol Biol, 2001; 24, 108−15. doi: 10.1165/ajrcmb.24.2.4081 [2] Fu J, Jiang D, Lin G, et al. An ecological analysis of PM2.5 concentrations and lung cancer mortality rates in China. BMJ Open, 2015; 5, e009452. doi: 10.1136/bmjopen-2015-009452 [3] Fan J, Li S, Fan C, et al. The impact of PM2.5 on asthma emergency department visits: a systematic review and meta-analysis. Environ Sci Pollut Res Int, 2016; 23, 843−50. doi: 10.1007/s11356-015-5321-x [4] Li R, Zhou R, Zhang J. Function of PM2.5 in the pathogenesis of lung cancer and chronic airway inflammatory diseases. Oncol Lett, 2018; 15, 7506−14. [5] Wu W, Muller R, Berhane K, et al. Inflammatory response of monocytes to ambient particles varies by highway proximity. Am J Respir Cell Mol Biol, 2014; 51, 802−9. doi: 10.1165/rcmb.2013-0265OC [6] Moller P, Danielsen PH, Karottki DG, et al. Oxidative stress and inflammation generated DNA damage by exposure to air pollution particles. Mutat Res Rev Mutat Res, 2014; 762C, 133−66. [7] Mazzoli-Rocha F, Fernandes S, Einicker-Lamas M, et al. Roles of oxidative stress in signaling and inflammation induced by particulate matter. Cell Biol Toxicol, 2010; 26, 481−98. doi: 10.1007/s10565-010-9158-2 [8] Zhou Z, Liu Y, Duan F, et al. Transcriptomic Analyses of the Biological Effects of Airborne PM2.5 Exposure on Human Bronchial Epithelial Cells. PLoS One, 2015; 10, e0138267. doi: 10.1371/journal.pone.0138267 [9] Rumelhard M, Ramgolam K, Hamel R, et al. Expression and role of EGFR ligands induced in airway cells by PM2.5 and its components. Eur Respir J, 2007; 30, 1064−73. doi: 10.1183/09031936.00085907 [10] Dysart MM, Galvis BR, Russell AG, et al. Environmental particulate (PM2.5) augments stiffness-induced alveolar epithelial cell mechanoactivation of transforming growth factor beta. PLoS One, 2014; 9, e106821. doi: 10.1371/journal.pone.0106821 [11] He M, Ichinose T, Yoshida Y, et al. Urban PM2.5 exacerbates allergic inflammation in the murine lung via a TLR2/TLR4/MyD88-signaling pathway. Sci Rep, 2017; 7, 11027. doi: 10.1038/s41598-017-11471-y [12] LeBlanc ME, Wang W, Caberoy NB, et al. Hepatoma-derived growth factor-related protein-3 is a novel angiogenic factor. PLoS One, 2015; 10, e0127904. doi: 10.1371/journal.pone.0127904 [13] Guo F, Ding Y, Caberoy N, et al. ABCF1 extrinsically regulates retinal pigment epithelial cell phagocytosis. Mol Biol Cell, 2015; 26, 2311−20. doi: 10.1091/mbc.E14-09-1343 [14] Ding Y, Caberoy NB, Guo F, et al. Reticulocalbin-1 facilitates microglial phagocytosis. PLoS One, 2015; 10, e0126993. doi: 10.1371/journal.pone.0126993 [15] Caberoy NB, Zhou Y, Alvarado G, et al. Efficient identification of phosphatidylserine-binding proteins by ORF phage display. Biochem Biophys Res Commun, 2009; 386, 197−201. doi: 10.1016/j.bbrc.2009.06.010 [16] Zhao Y, Xu G, Wang S, et al. Chitosan oligosaccharides alleviate PM2.5-induced lung inflammation in rats. Environ Sci Pollut Res Int, 2018; 25, 34221−7. doi: 10.1007/s11356-018-3365-4 [17] Liu Q, Baumgartner J, Schauer JJ. Source Apportionment of Fine-Particle, Water-Soluble Organic Nitrogen and Its Association with the Inflammatory Potential of Lung Epithelial Cells. Environ Sci Technol, 2019; 53, 9845−54. doi: 10.1021/acs.est.9b02523 [18] Liu Q, Baumgartner J, Zhang Y, et al. Oxidative potential and inflammatory impacts of source apportioned ambient air pollution in Beijing. Environ Sci Technol, 2014; 48, 12920−9. doi: 10.1021/es5029876 [19] Liu Q, Lu Z, Xiong Y, et al. Oxidative potential of ambient PM2.5 in Wuhan and its comparisons with eight areas of China. Sci Total Environ, 2020; 701, 134844. doi: 10.1016/j.scitotenv.2019.134844 [20] Corsini E, Budello S, Marabini L, et al. Comparison of wood smoke PM2.5 obtained from the combustion of FIR and beech pellets on inflammation and DNA damage in A549 and THP-1 human cell lines. Arch Toxicol, 2013; 87, 2187−99. doi: 10.1007/s00204-013-1071-z [21] Wang Y, Zhong Y, Hou T, et al. PM2.5 induces EMT and promotes CSC properties by activating Notch pathway in vivo and vitro. Ecotoxicol Environ Saf, 2019; 178, 159−67. doi: 10.1016/j.ecoenv.2019.03.086 [22] Caberoy NB, Maiguel D, Kim Y, et al. Identification of tubby and tubby-like protein 1 as eat-me signals by phage display. Exp Cell Res, 2010; 316, 245−57. doi: 10.1016/j.yexcr.2009.10.008 [23] Caberoy NB, Zhou Y, Jiang X, et al. Efficient identification of tubby-binding proteins by an improved system of T7 phage display. J Mol Recognit, 2010; 23, 74−83. [24] LeBlanc ME, Wang W, Chen X, et al. Secretogranin III as a disease-associated ligand for antiangiogenic therapy of diabetic retinopathy. J Exp Med, 2017; 214, 1029−47. doi: 10.1084/jem.20161802 [25] Li W. Eat-me signals: Keys to molecular phagocyte biology and "Appetite" control. J Cell Physiol, 2012; 227, 1291−7. doi: 10.1002/jcp.22815 [26] Atagi Y, Liu CC, Painter MM, et al. Apolipoprotein E Is a Ligand for Triggering Receptor Expressed on Myeloid Cells 2(TREM2). J Biol Chem, 2015; 290, 26043−50. doi: 10.1074/jbc.M115.679043 [27] Grainger DJ, Reckless J, McKilligin E. Apolipoprotein E modulates clearance of apoptotic bodies in vitro and in vivo, resulting in a systemic proinflammatory state in apolipoprotein E-deficient mice. J Immunol, 2004; 173, 6366−75. doi: 10.4049/jimmunol.173.10.6366 [28] Santos R, Ursu O, Gaulton A, et al. A comprehensive map of molecular drug targets. Nat Rev Drug Discov, 2017; 16, 19−34. doi: 10.1038/nrd.2016.230 [29] Kim LA, D'Amore PA. A brief history of anti-VEGF for the treatment of ocular angiogenesis. Am J Pathol, 2012; 181, 376−9. doi: 10.1016/j.ajpath.2012.06.006 [30] Ben-Shlomo I, Yu Hsu S, Rauch R, et al. Signaling receptome: a genomic and evolutionary perspective of plasma membrane receptors involved in signal transduction. Sci STKE, 2003; 2003, RE9. [31] Meyer K, Selbach M. Quantitative affinity purification mass spectrometry: a versatile technology to study protein-protein interactions. Front Genet, 2015; 6, 237. [32] Li W, Pang IH, Pacheco MTF, et al. Ligandomics: a paradigm shift in biological drug discovery. Drug Discov Today, 2018; 23, 636−43. doi: 10.1016/j.drudis.2018.01.013 [33] Tang F, LeBlanc ME, Wang W, et al. Anti-secretogranin III therapy of oxygen-induced retinopathy with optimal safety. Angiogenesis, 2019; 22, 369−82. doi: 10.1007/s10456-019-09662-4 [34] Gaultier A, Wu X, Le Moan N, et al. Low-density lipoprotein receptor-related protein 1 is an essential receptor for myelin phagocytosis. J Cell Sci, 2009; 122, 1155−62. doi: 10.1242/jcs.040717 [35] Sokolowski JD, Mandell JW. Phagocytic clearance in neurodegeneration. Am J Pathol, 2011; 178, 1416−28. doi: 10.1016/j.ajpath.2010.12.051 [36] Gardai SJ, McPhillips KA, Frasch SC, et al. Cell-surface calreticulin initiates clearance of viable or apoptotic cells through trans-activation of LRP on the phagocyte. Cell, 2005; 123, 321−34. doi: 10.1016/j.cell.2005.08.032 [37] Caberoy NB, Zhou Y, Li W. Tubby and tubby-like protein 1 are new MerTK ligands for phagocytosis. EMBO J, 2010; 29, 3898−910. doi: 10.1038/emboj.2010.265 [38] Lin Y, Zhao JL, Zheng QJ, et al. Notch Signaling Modulates Macrophage Polarization and Phagocytosis Through Direct Suppression of Signal Regulatory Protein alpha Expression. Front Immunol, 2018; 9, 1744. doi: 10.3389/fimmu.2018.01744 [39] Siebel C, Lendahl U. Notch Signaling in Development, Tissue Homeostasis, and Disease. Physiol Rev, 2017; 97, 1235−94. doi: 10.1152/physrev.00005.2017 [40] Nowell CS, Radtke F. Notch as a tumour suppressor. Nat Rev Cancer, 2017; 17, 145−59. doi: 10.1038/nrc.2016.145 [41] Shimizu K, Chiba S, Hosoya N, et al. Binding of Delta1, Jagged1, and Jagged2 to Notch2 rapidly induces cleavage, nuclear translocation, and hyperphosphorylation of Notch2. Mol Cell Biol, 2000; 20, 6913−22. doi: 10.1128/MCB.20.18.6913-6922.2000 [42] Rong X, Tian H, Yang L, et al. Function-first ligandomics for ocular vascular research and drug target discovery. Exp Eye Res, 2019; 182, 57−64. doi: 10.1016/j.exer.2019.03.009 [43] Buchholz CJ, Duerner LJ, Funke S, et al. Retroviral display and high throughput screening. Comb Chem High Throughput Screen, 2008; 11, 99−110. doi: 10.2174/138620708783744543 -

 点击查看大图
计量
- 文章访问数: 1583
- HTML全文浏览量: 515
- PDF下载量: 59
- 被引次数: 0

 Quick Links