

 下载:
下载:

-
The term ‘paraben’ is the abbreviated form of parahydroxybenzoic acid[1]. Common parabens (PBs) consist of methylparaben (MePB), ethylparaben (EtPB), propylparaben (PrPB), butylparaben (BuPB), and benzylparaben (BzPB)[2]. Generally, one or more PB forms are detected in foodstuffs (fruits, cooking oils, fast-food), personal care products (cosmetics, shampoos, toothpastes, shaving creams), and pharmaceutical products[3]. Human exposure to parabens through pharmaceutical products is different because fluctuation in paraben concentration in liquid, syrup, or cream samples is up to 2,000 mg/g, while that in solid and soft gel is 1.10 mg/g[4].
Human exposure to parabens occurs through ingestion, inhalation, and dermal absorption. Parabens are usually distributed in human biological samples, such as urine, serum, breastmilk, placental tissue, umbilical cord blood, amniotic fluid, and reproductive hormones[5-11]
The lipophilicity and bioaccumulation of parabens could imply the importance of their environmental exposure[12]. Owing to this feature, paraben occurrence can be observed in almost all adipose samples and breast tissues of women[13].
Parabens are absorbed through the skin and remain intact in many tissues[14]. It is estimated that the average daily total paraben exposure for a person is 76 ng/g [1.3 mg/(kg·d) for a person weighing 70 kg][15].
Although parabens have been detected in various human specimens, our knowledge of their side effects on human health is limited. These compounds are potentially dangerous for the endocrine system[9,11]. During pregnancy, parabens are associated with dysfunction in reproductive and thyroid hormone levels. They increase oxidative stress and inflammation biomarker levels[16,17]. This increase can disrupt normal cellular signaling and trigger different diseases, such as cancer, cardiovascular disease, and infertility[18].
Parabens, similar to other endocrine disrupting chemicals (EDCs), mimic the properties of the main natural estrogen when bound to estrogen receptors (ERs)[19]. Routledge et al. (1998) were the first to report that the effect of the estrogenic activity of parabens is inhibited by 4-hydroxy tamoxifen[20].
Because paraben compounds show estrogenic activity and interfere with ERs, researchers Darbre et al. (2004) and Barr et al. (2012) measured parabens in breast cancer tissues[21,22]. Moreover, Byford et al. (2002) revealed the estrogenic effects of the four parabens (MePB, EtPB, n-PrPB, n-BuPB) in estrogen-dependent MCF7 human breast cancer cells. At specific concentrations, parabens can increase the expression of both transfected (ERE-CAT reporter gene) and endogenous (pS2) estrogen-regulated genes in these cells[23]. Lillo et al. (2017) found that MePB, the most common paraben, increases the size of breast cancer with ER+[24].
In recent years, breast cancer shows an increasing trend in Iran, especially in the young and middle-aged groups[25]. The reason for this high incidence of breast cancer is not well known, and data on the exposure of women with breast cancer to known or potential EDCs, such as paraben, in Asian countries, such as Iran, are rare. This unexpected breast cancer incidence may occur through accumulation of estrogenic compounds and other carcinogens in normal breast tissues during adolescence and throughout life. To assess the role of parabens in this phenomenon, the paraben content of adjacent normal-malignant breast tissues was measured in women with breast cancer living in Isfahan Province, Iran.
-
This cross-sectional study was conducted among women living in Isfahan Province, Iran. Isfahan Province, with a population of 5,120,850 according to the 2016 census, is the third-most crowded province in Iran after Tehran and Mashhad Provinces.
Paired samples (n = 106) of malignant and normal tissues (adjacent to tumor tissues) were obtained from women with breast cancer (n = 53).
A researcher designed a questionnaire consisting of information on gender, age, body mass index (BMI), physical activity, breastfeeding duration, educational status, breast cancer and other family history of cancers, hormone therapy history, reasons to say yes to hormone therapy, age at first pregnancy, age at menarche, age at menopause, employment, status, deodorant, fast food and cosmetic consumption, and smoking. Based on the diagnosis, other information regarding the tumor, such as estrogen receptor/progesterone receptor/human epidermal receptor 2 (ER/PR/HER2) factors, were also obtained.
Breast tissues (malignant and normal) samples were obtained from Hojati and Khanavadeh Hospitals, and the procedure was subject to approval from the ethics committee of the Isfahan University of Medical Sciences. Participants signed the consent documents after the study procedure was explained by an environmental health researcher.
Samples were transported to the Poursina-Hakim Laboratory to be diagnosed and separated into normal and malignant tissues by a pathologist. The samples were kept in formalin at 4 °C until extraction.
All chemicals, solvents, and analytes, including MePB, EtPB, PrPB, and BuPB (with purity > 99%), were purchased from Sigma-Aldrich. Parabens stock solutions were prepared by dissolving 10 mg of each paraben in 1 mL of methanol, and then stored at 4 °C. The standard series were prepared in 10–100 ng/mL range to draw the calibration curves.
-
Several previous methods[26-30] were assessed in designing the method adopted here. In this design, first, 1 to 5 g of breast tissue sample was grinded, followed by addition of 5 mL methanol. Next, the mixture was exposed to ultrasonic waves for 15 min to lyse the breast cells, and parabens were released from the breast tissue. The mixture was then centrifuged at 5,000 rpm for 5 min. The obtained supernatant was diluted by deionized water to 50 mL. Subsequently, 10 mL of the diluted solution was filtered through a 0.45 μm filter. Finally, based on the dispersive liquid-liquid micro-extraction (DLLME) method, 500 μL acetone and 30 μL chlorobenzene were rapidly injected into a 5 mL sample solution placed in a 10 mL conical centrifuge tube to form a cloudy suspension, which was then centrifuged at 5,000 rpm for 5 min[28].
Addition of these solvents to the tissue supernatant and the subsequent centrifugation allowed low-density insoluble compounds, such as lipids, to be dissolved with the assistance of acetone in the aqueous phase in the Falcon tube. In addition, owing to its high density and insolubility, chlorobenzene contributes in the separation of insoluble compounds, such as paraben, in the droplet on the bottom of the Falcon tube. This droplet was collected, dried by a mild flow of nitrogen, and derivatized with 10 μL N-methyl-N-(trimethylsilyl) trifluoroacetamide (MSTFA). The yield substance was analyzed through gas chromatography (GC) with an MS detector (Agilent 19091S-433MS column with 0.25 mm thickness, 30.0 m length, and 0.32 mm diameter)[31].
-
Matrix (breast tissue) effects were evaluated using a spike recovery approach, and the results of the obtained calibration curve was modified for malignant and normal tissues by applying the relative recovery (RR%) obtained from Equation (1)[30]. For this reason, during sample preparation, the standards (130 ng/g) were spiked with sample, and matrix effects were evaluated by RR%.
$$ {\text{RR\%}} = \frac{{{n_{found}} - {n_{real}}}}{{{n_{added}}}} \times 100 $$ (1) Where, nfound is the amount of paraben detected in the real sample spiked with a known amount of paraben (130 ng/g). nreal is the amount of paraben detected in the non-spiked real sample and nadded is the amount of paraben added to the real sample[30].
To decrease background paraben contamination, all glassware were washed with deionized water and then placed at 250 °C for 24 h, all instrument operators avoided using products containing parabens to reduce sample contamination, and all solvent stocks were checked daily for contamination control[32]. In addition, a calibration standard (at a concentration range of 10–50 ng/mL) and a pure solvent (methanol) were injected after every 20 samples to check for changes in instrumental sensitivity and carry-over of parabens between samples, respectively[13].
Method validity was examined by analytical factors such as regression equation, linearity, limit of detection (LOD), limit of quantification (LOQ), retention time, and relative recovery (RR%). Correlation coefficients are equal or higher than 0.9976. The RR of these analytes was 88% for MePB and 133% for EtPB. The LOD was 0.28 ng/g for PrPB and 0.85 ng/g for BuPB. The LOQ was 0.88 ng/g for BuPB and 1.98 ng/g for MePB. Typical chromatograms of MePB, EtPB, PrPB, and BuPB are presented in Figure 1.
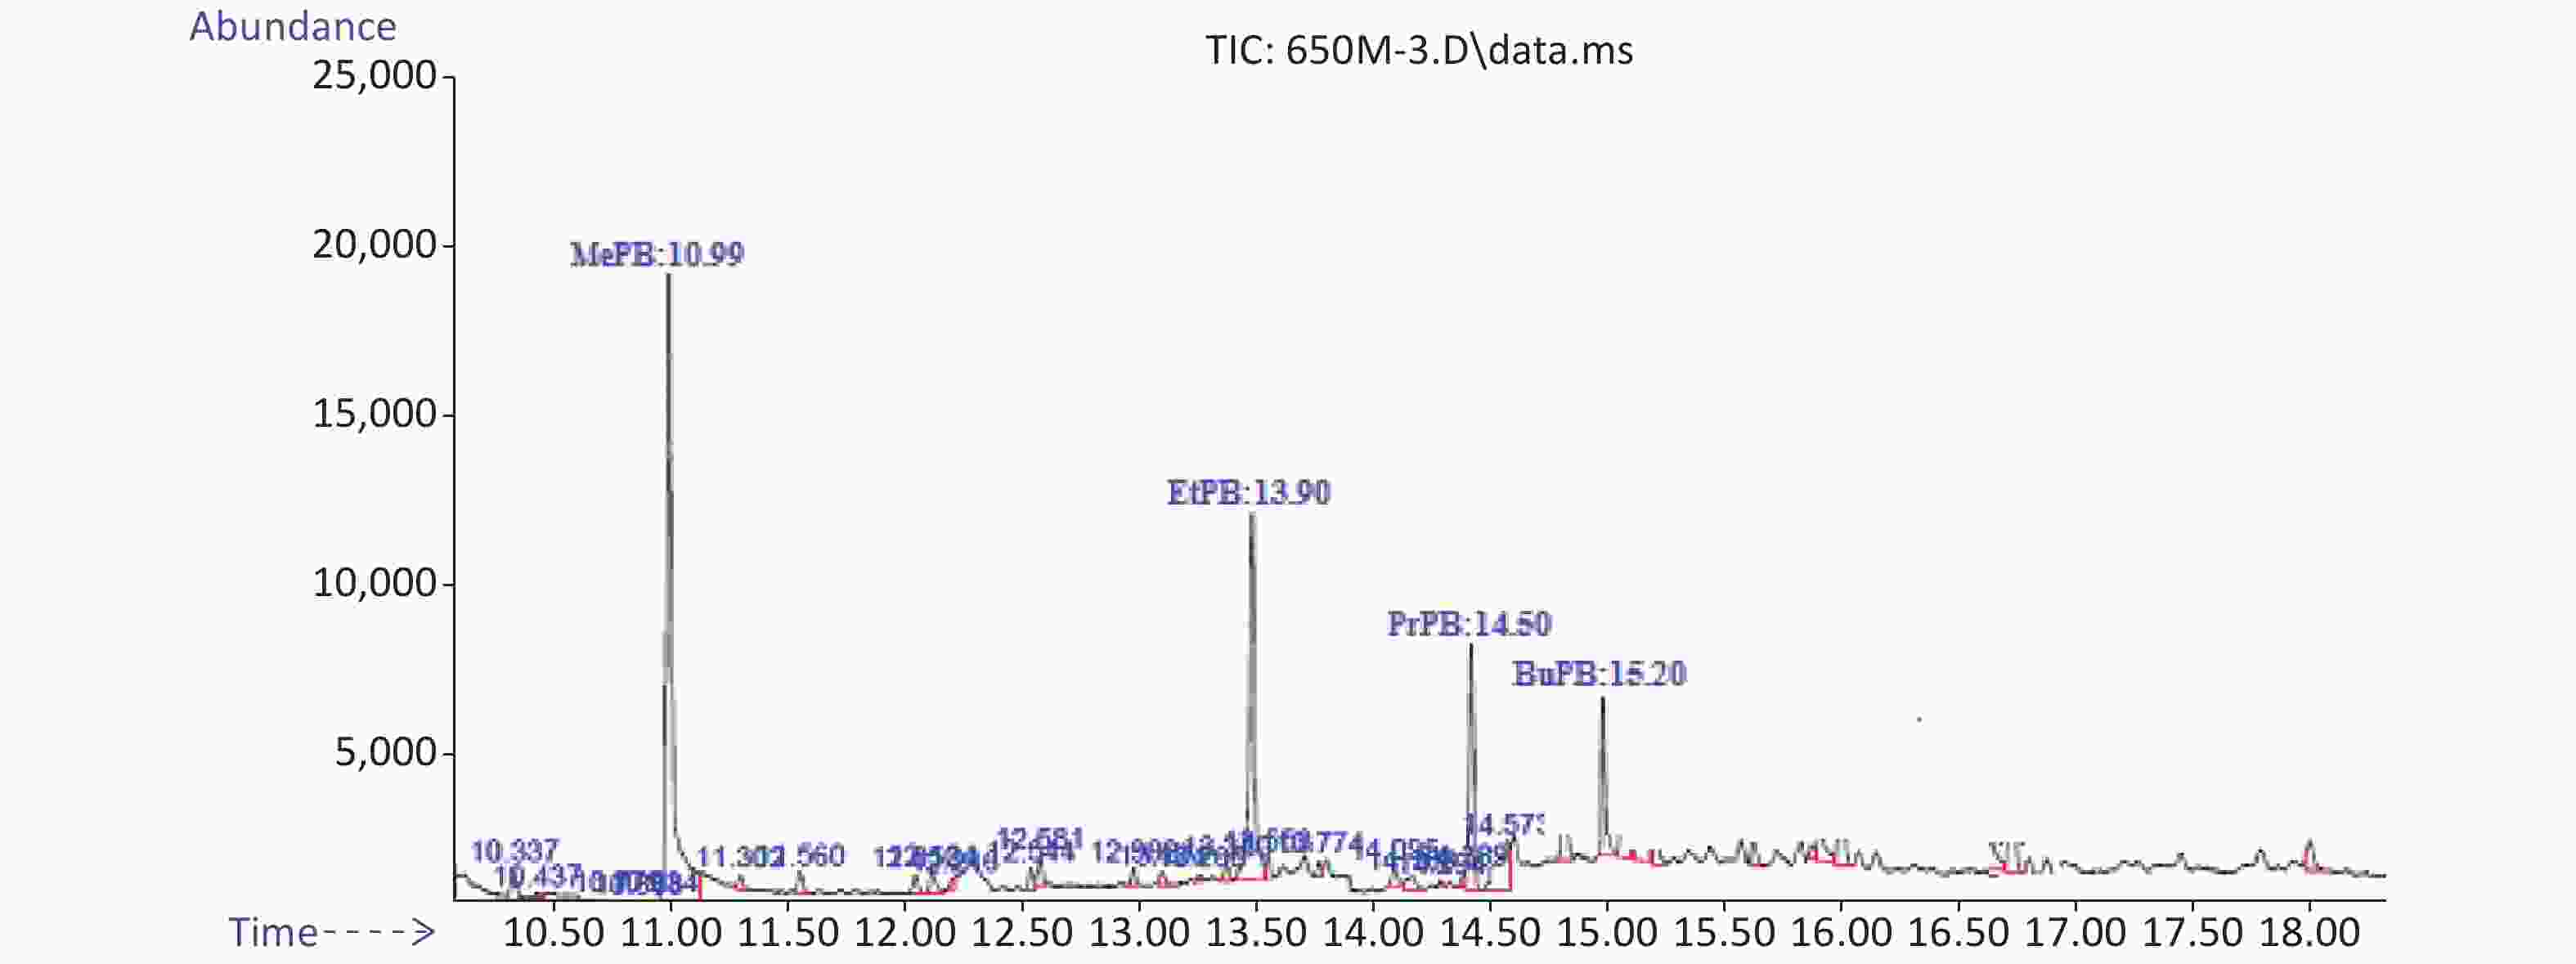
Figure 1. GC/MS chromatograms of MePB (RT: 10.99), EtPB (13.90), PrPB (RT: 14.50), and BuPB (RT: 15.20) in human breast cancer extract.
-
Data were analyzed in SPSS (IBM SPSS Statistics 25). The paired sample t-test was used to compare the means of paraben concentration, and Spearman correlation coefficients were applied to determine the correlation between parabens in adjacent normal-malignant tissues. The association between paraben concentrations with traditional risk factors of breast cancer was assessed using the generalized estimating equations (GEE) model. All tests were conducted at a 5% error level. Total paraben concentration was calculated using Equation (2):
$$ \sum \text{PB}\text{s} = \text{MePB} + \text{EtPB} + \text{PrPB} + \text{BuPB} $$ (2) Estrogen equivalency (EEQ) factor of parabens was calculated using Equation (3)[33].
$$\begin{aligned} \text{EEQ}\;(\text{parabens}) =& \; (\text{MePB} \times 1) + (\text{PrPB} \times 83.3) \\ & + (\text{BuPB} \times 250)\\ \end{aligned}$$ (3) In Equations (2) and (3), the concentration of each paraben was expressed as ng/g and mol/g, respectively.
-
The socio demographic characteristics of the subjects are shown in Table 1. Most subjects were aged 40–49 years (42.3%), followed by 30–39 years (19.2%). The obtained data indicated that 36.5%, 32.7%, 25.0%, and 5.8% of women were considered obese, normal, overweight, and underweight, respectively. Only 17.3% of the subjects were with menarche at age < 12 years and 61.5% were at age > 12 years. Based on the obtained results, 5.8% and 25.0% of women were considered as postmenopausal and premenopausal, respectively. Most participants were unemployed (83.0%); thus, they were more willing to complete and return the questionnaires than the participants who were employed. The most frequent highest education was < high school (53.8%) (Table 1).
Table 1. The socio-demographic and behavioral characteristics of the study population (N = 53)
Demographic variables Grouping variables N (%) Age (years) ≤ 30 4 (7.7) 30−39 10 (19.2) 40−49 22 (42.3) 50−59 8 (15.4) ≥ 60 8 (15.4) Body mass index (BMI) ≤ 18.5 (underweight) 3 (5.8) 18.5−24.9 (normal weight) 17 (32.7) 25−29.9 (over weight) 13 (25.0) ≥ 30 (obesity) 19 (36.5) Physical activity Regular 7 (13.5) Irregular 29 (55.8) Passive 16 (30.7) Breast feeding duration Without children 8 (15.1) < 6 months 6 (11.3) 6−24 months 39 (73.6) Educational status < High school 28 (53.8) High school 11 (21.2) > High school 13 (25.0) Degree of family history
of breast cancerNone 29 (54.7) First or second degree 24 (45.3) Degree of family history
of other cancerNone 35 (66.0) First or second degree 18 (34.0) Hormone therapy history Yes 23 (41.8) No 32 (58.2) Reasons to say yes to hormone therapy Birth control 20 (87.0) Infertility 3 (13.0) Age at first pregnancy (years) < 30 43 (87.8) 30 3 (6.1) > 30 3 (6.1) Employment status Employed 9 (17.0) Unemployed 44 (83.0) Age at menarche (years) < 12 9 (17.3) 12 11 (21.2) > 12 32 (61.5) Age at menopause
(years)Non-menopausal 36 (69.2) < 55 13 (25.0) > 55 3 (5.8) -
In both tissues, 100% of samples contained MePB, EtPB, PrPB, and BuPB. According to the results obtained from paired sample t-test, no significant difference in all the measured paraben metabolites (MePB, EtPB, PrPB, and BuPB) was observed between these two tissues (P > 0.05) (Table 2). In both tissues, the order of paraben concentration was as follows: MePB > EtPB > PrPB > BuPB.
Table 2. Comparison of the mean and median of paraben metabolite (ng/g) distribution between malignant and normal tissues
Paraben metabolites (ng/g wet w.) Tissue Mean Median SD IQR Min Max t df P-value MePB Malignant 178.47 148.36 107.10 110 22.36 529.23 0.798 52 0.429 Normal 164.86 135.49 114.92 169 7.72 547.42 EtPB Malignant 136.69 131.37 84.90 132 11.77 369.98 −0.581 52 0.564 Normal 144.11 112.83 120.01 126 11.68 547.42 PrPB Malignant 99.89 84.48 63.87 76 23.50 266.19 0.202 52 0.840 Normal 97.44 68.82 95.72 91 5.89 422.18 BuPB Malignant 87.88 61.93 80.38 112 7.56 310.28 −1.019 52 0.313 Normal 107.53 45.44 138.82 122 4.76 769.06 ∑PBs Malignant 497.02 507.31 242.29 356 99.35 1114.70 −0.252 52 0.802 Normal 507.81 432.20 325.43 411 30.05 1522.65 In this study, the EEQ or estrogenic body burden of parabens for malignant and normal tissues were 7.97 and 6.15 mol/g, respectively. The results indicated that the estrogenic effect of parabens in malignant tissues was 1.3 (7.97:6.15) times higher than that in normal tissues.
-
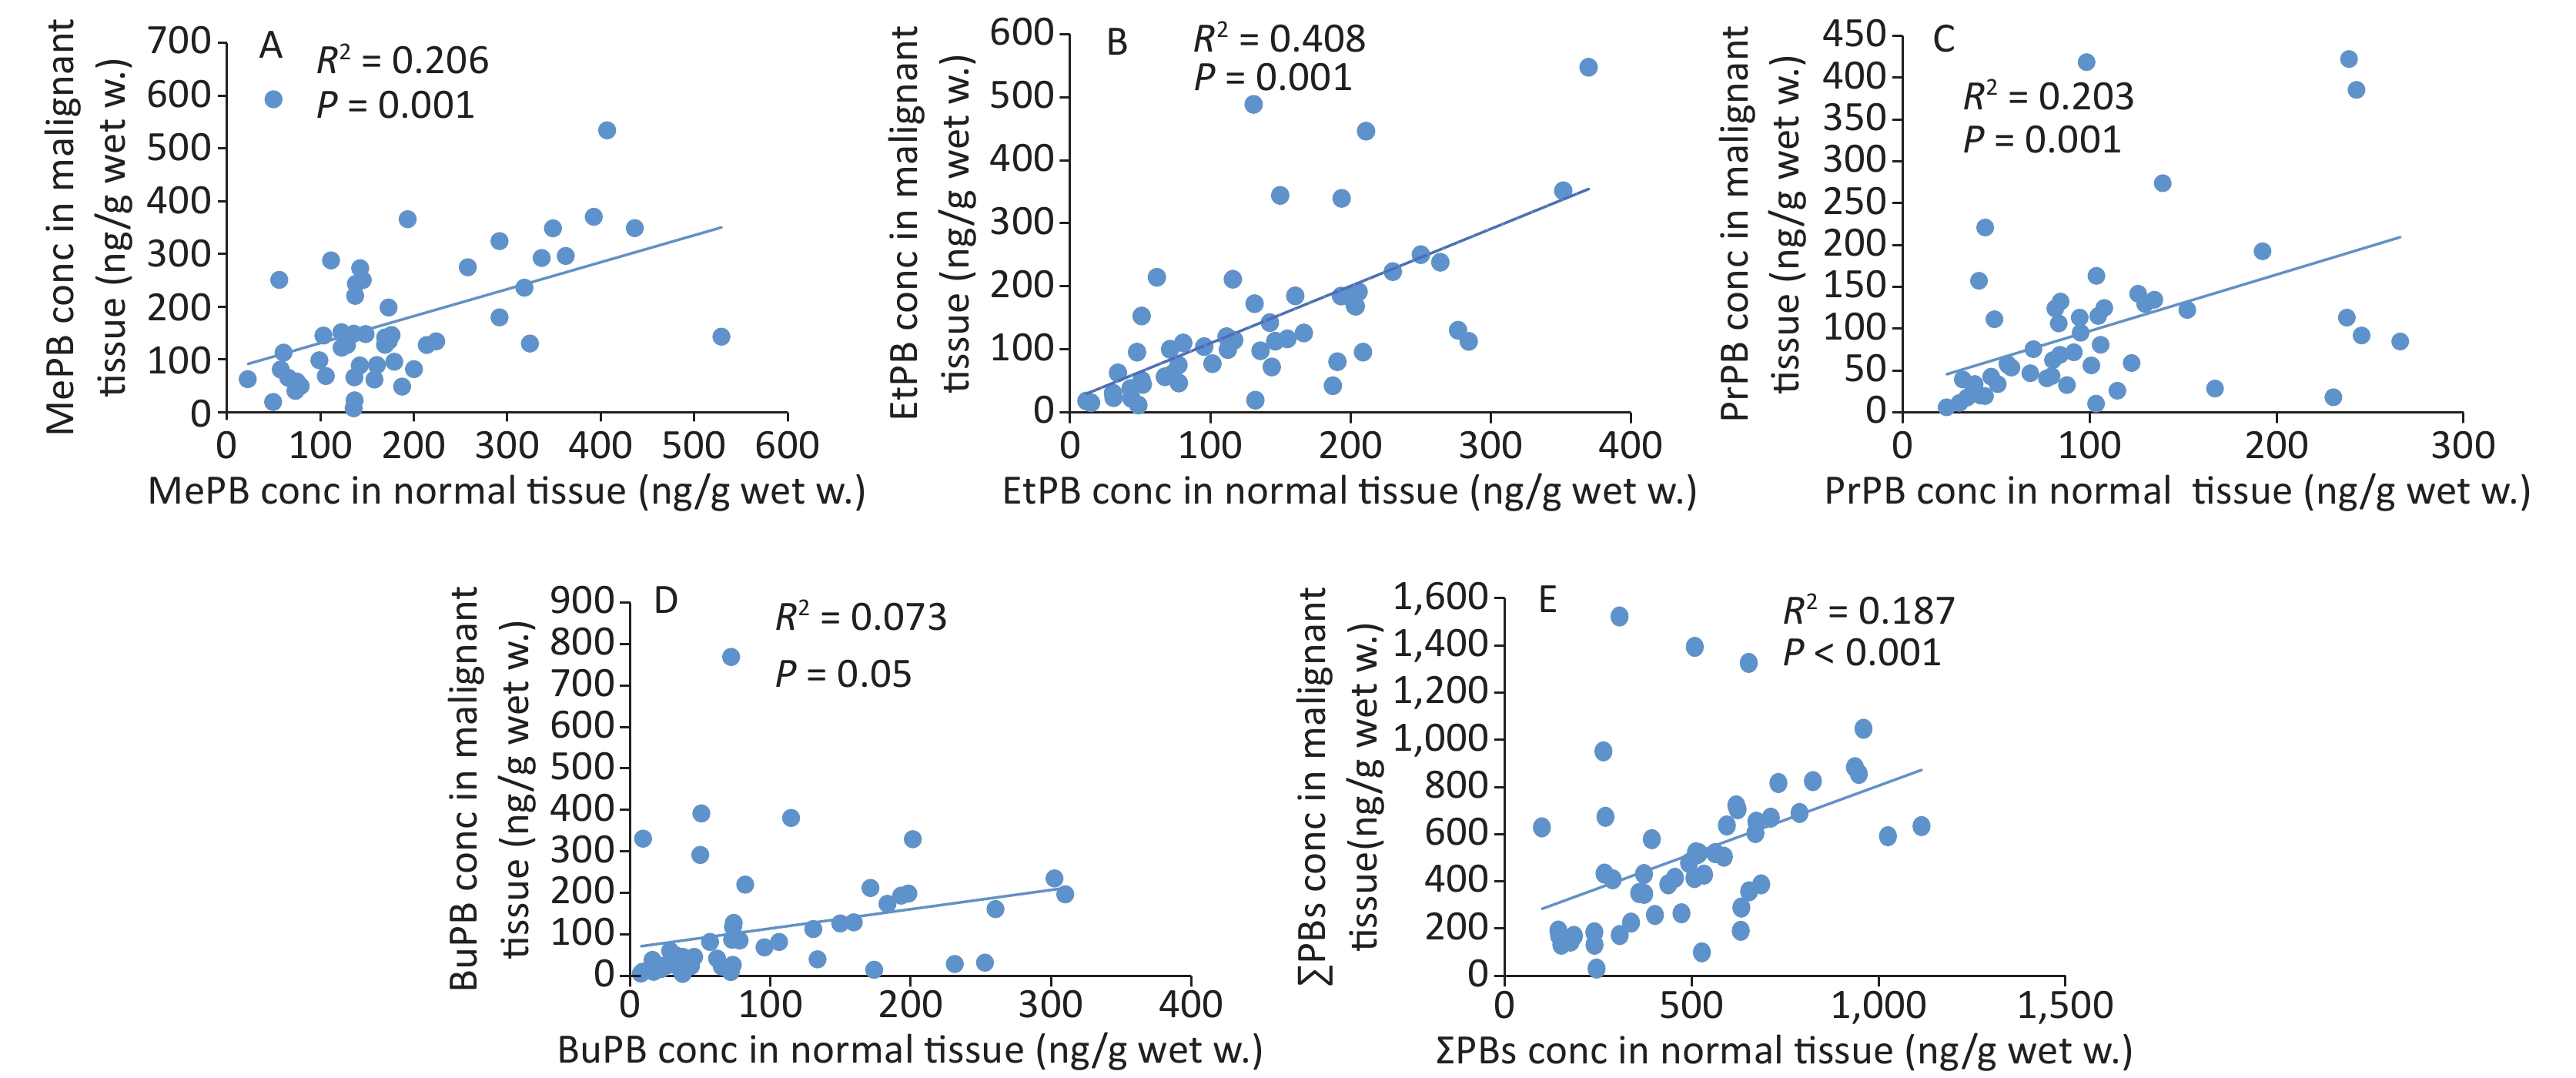
The correlation coefficients of all parabens (MePB, EtPB, PrPB, and BuPB) were compared between malignant and normal tissues by Spearman correlation coefficients (Figure 2). The individual paired samples revealed positive correlations between malignant and normal tissues for all paraben concentrations. According to the Spearman correlation coefficients, all parabens were correlated with each other at P < 0.01, except for BuPB (P = 0.05).
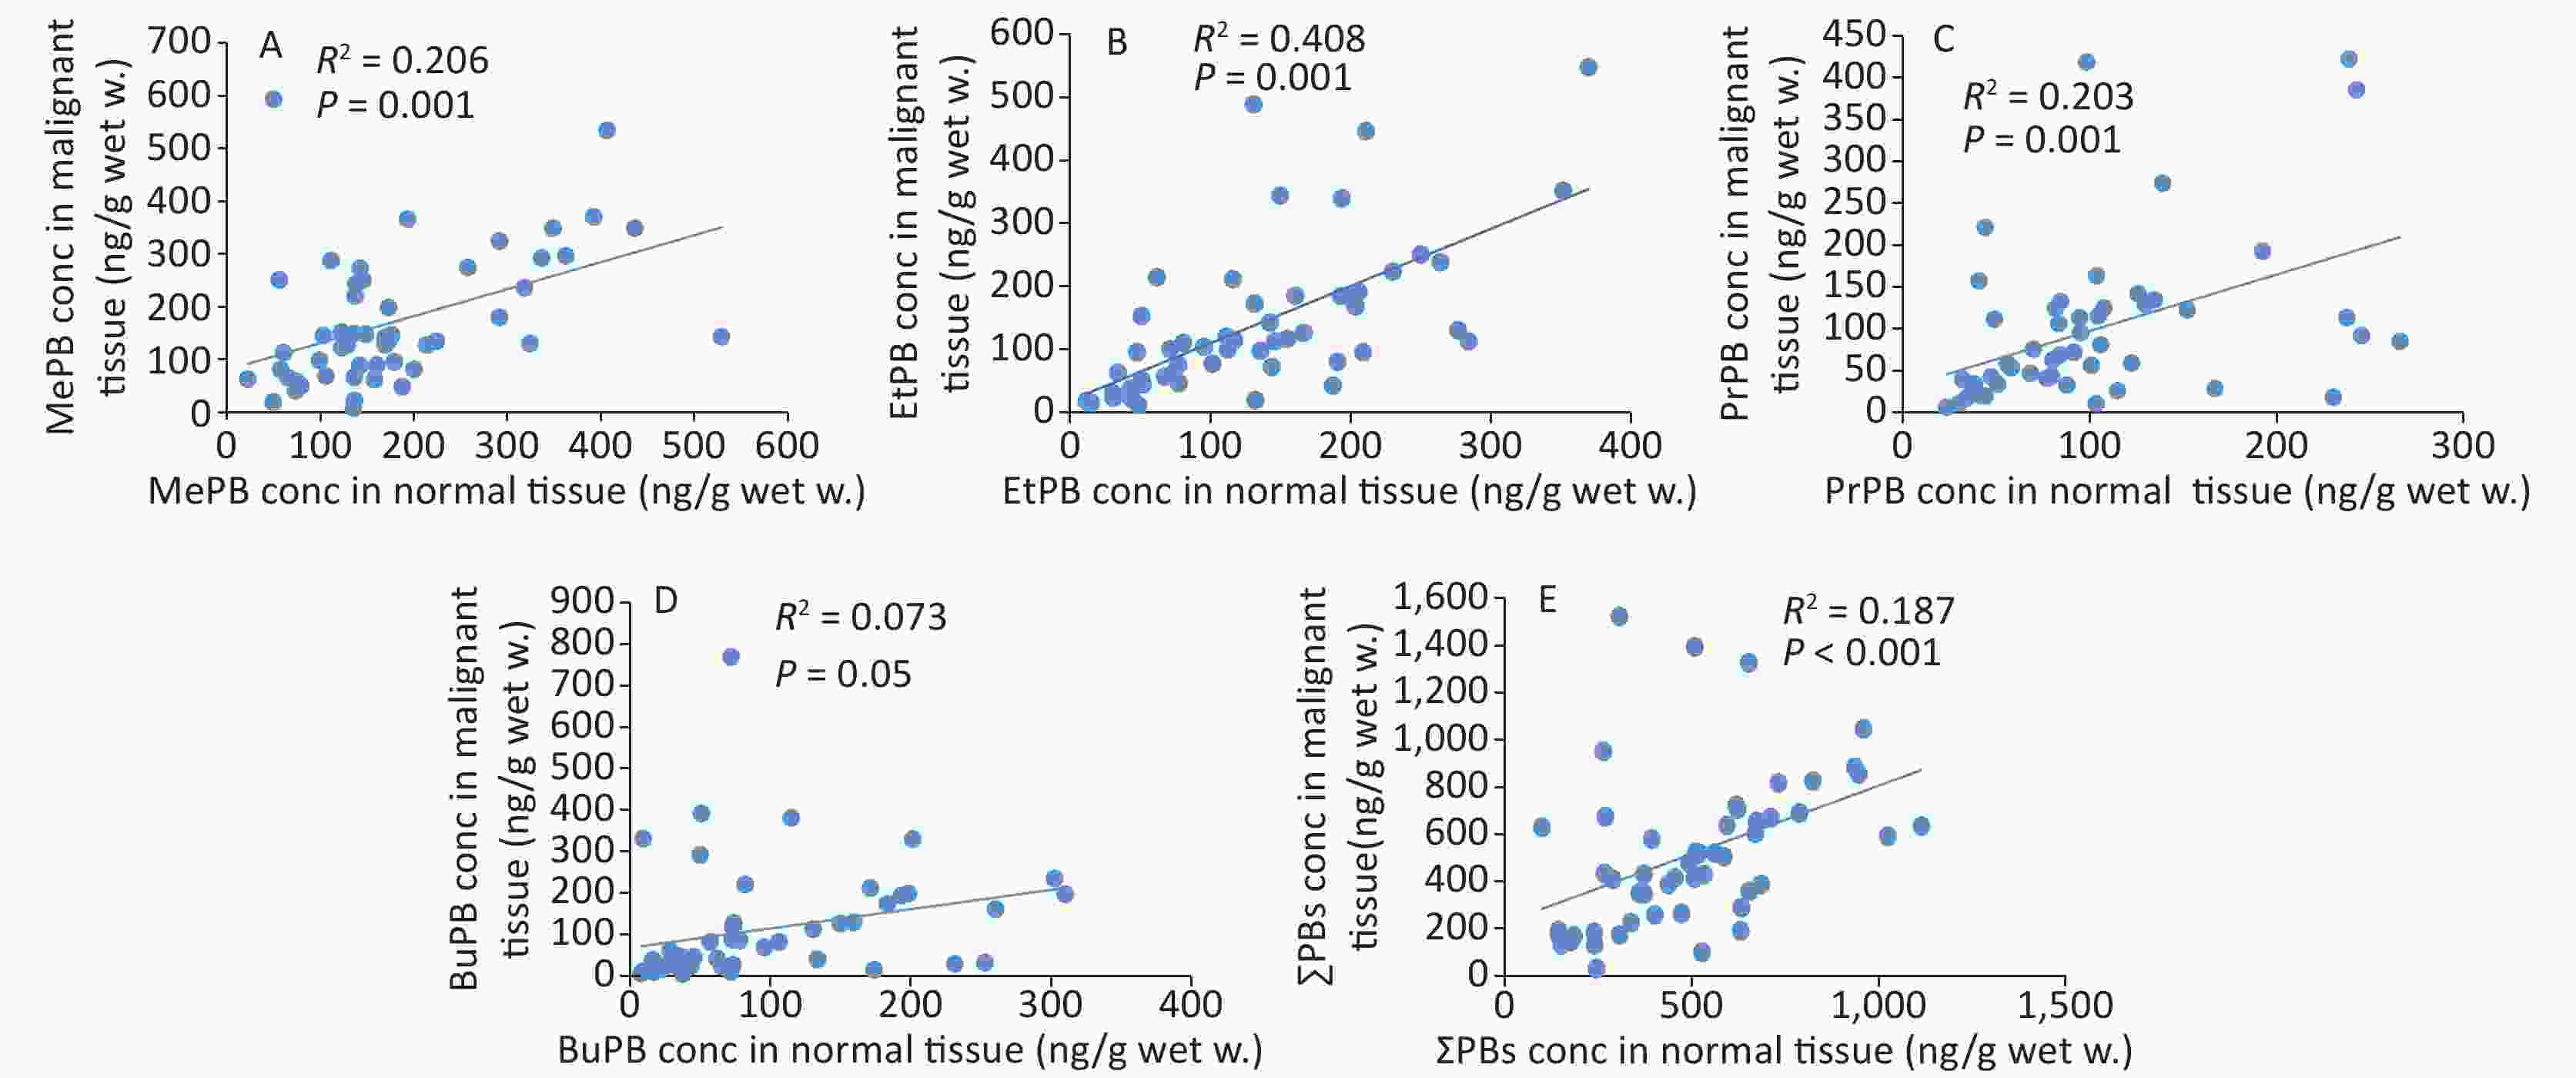
Figure 2. Comparison of correlation coefficients of paraben concentration (Conc) between malignant and normal tissues (A: MePB, B: EtPB, C: PrPB, D: BuPB, E: ∑PBs).
-
Table 3 shows the association between paraben concentrations with breast cancer risk factors, as analyzed using the GEE model. Analysis of the effects of ER/PR/HER2 on paraben exposure revealed a significant association between the dose-response pattern of MePB [OR = 98.34 (11.43, 185.2), P = 0.027] for both ER+ and PR+ women and the dose-response pattern of MePB [OR = 164.3 (CI: 112.3, 216.3), P < 0.001] for HER2+ women, compared with those women for the receptors- negative (Table 3).
Table 3. Association between parabens concentrations with breast cancer risk factors, analyzed using the generalized estimating equations (GEE) model
Risk factors of breast cancer MePB EtPB PrPB BuPB ∑PBs B (CI 95%) P B (CI 95%) P B (CI 95%) P B (CI 95%) P B (CI 95%) P ER
(Ref. = negative.)Positive 98.34
(11.43, 185.2)0.027 11.32
(−83.24, 105.8)0.814 −47.89
(−186.1, 90.32)0.497 −21.49
(−192.8, 149.8)0.806 16.97
(−372.8, 406.8)0.932 PR
(Ref. = negative.)Positive 98.34
(11.43, 185.2)0.027 11.32
(−83.24, 105.8)0.814 −47.89
(−186.1, 90.32)0.497 −21.49
(−192.8, 149.8)0.806 16.97
(−372.8, 406.8)0.932 HER2
(Ref. = negative.)Positive 164.3
(112.3, 216.3)< 0.001 −17.49
(−69.16, 34.17)0.507 −66.74
(−140.6, 7.12)0.077 −23.18
(−111.8, 65.49)0.608 46.21
(−144.8, 237.2)0.635 Tumor location in breast
(Ref. = outer)Inter 22.07
(−53.59, 97.74)0.567 17.33
(−41.17, 75.83)0.561 −5.66
(−51.52, 40.20)0.809 1.08
(−51.26, 53.42)0.968 50.19
(−121.4, 221.8)0.567 Upper −27.76
(−92.17, 36.63)0.398 55.33
(−63.88, 174.5)0.363 −10.48
(−109.9, 88.97)0.836 −10.42
(−109.6, 88.78)0.837 23.35
(−257.0, 303.7)0.870 Education status
(Ref. ≥ high school)< High school −3.52
(−48.95, 41.90)0.879 −43.19
(−120.5, 34.13)0.274 −11.82
(−45.12, 21.48)0.487 −11.52
(−61.80, 38.75)0.653 −106.1
(−284.6, 72.6)0.245 High school 20.80
(−7.20, 48.81)0.146 −50.27
(−135.5, 34.9)0.248 40.43
(−28.65, 109.5)0.251 19.59
(−66.27, 105.4)0.655 −9.26
(−244.3, 225.8)0.938 Activity
(Ref. = passive)Regular −72.58
(−149.7, 4.53)0.065 40.10
(−79.03, 159.2)0.509 9.57
(−75.21, 94.36)0.825 −32.30
(−88.76, 24.16)0.262 −52.31
(−290.7, 186.1)0.667 Irregular 5.44
(−72.57, 83.46)0.891 46.32
(2.59, 90.05)0.538 −3.15
(−44.34, 38.04)0.881 19.18
(−40.19, 78.57)0.527 34.04
(−104.2, 172.2)0.629 Breast feeding duration
(Ref. = without children)< 6 month −41.85
(−124.5, 40.82)0.321 −69.52
(−170.2, 31.16)0.176 −83.02
(−144.8, −21.2)0.008 −67.48
(−148.4, 13.47)0.102 −225.3
(−463.5, 12.93)0.064 > 6 month −32.38
(−85.26, 20.80)0.230 −57.89
(−145.9, 30.19)0.198 −62.68
(−123.5, −1.85)0.043 −44.80
(−115.2, 25.64)0.213 −164.2
(−336.2, 7.75)0.061 Age at menarche
(Ref > 12 years)< 12 years −45.37
(−126.5, 35.83)0.273 7.152
(−62.80, 77.10)0.841 −37.11
(−74.07, −0.150)0.05 2.75
(−66.44, 71.95)0.938 −100.3
(−271.3, 70.55)0.250 = 12 years −20.42
(−107.1, 66.27)0.644 −69.95
(−120.1, −18.32)0.008 −44.79
(−83.14, −6.43)0.022 −2.74
(−56.66, 51.16)0.920 −132.9
(−276.8, 10.90)0.070 Age at first pregnancy
(Ref ≥ 30)< 30 years −5.88
(−40.6, 28.86)0.740 32.91
(−13.59, 79.43)0.165 −1.96
(−73.08, 69.15)0.957 53.17
(10.27, 96.07)0.015 77.29
(−65.43, 220.1)0.288 = 30 years 92.09
(−18.15, 202.3)0.102 166.2
(110.4, 222.1)< 0.001 13.84
(−57.23, 84.91)0.703 136.40
(66.89, 205.9)0.001 329.5
(77.48, 581.6)0.010 Age at menopause
(Ref ≥ 55 years)None menopause −19.68
(−134.3, 94.94)0.736 41.54
(−43.83, 126.9)0.340 36.24
(10.21, 62.28)0.006 3.95
(−55.39, 63.29)0.896 63.49
(−174.3, 301.3)0.601 ≤ 55 years −15.75
(−134.7, 103.2)0.795 45.89
(−35.02, 144.86)0.231 32.41
(3.52, 61.30)0.028 39.95
(−29.40, 109.3)0.259 81.61
(−159.3, 322.5)0.507 Illicit drug consumption
(Ref. = none)Yes 22.73
(−80.18, 125, 6)0.665 −71.79
(−131.8, −11.77)0.119 −12.33
(−73.30, 48.63)0.692 −32.39
(−89.06, 24.28)0.263 −86.75
(−342.4, 168.9)0.506 Smoking consumption
(Ref. = none)Yes −5.09
(−69.40, 59.22)0.877 −33.04
(−88.97, 22.88)0.247 −22.55
(−60.65, 15.55)0.246 −49.03
(−92.21, −5.85)0.026 −93.58
(−242.4, 55.32)0.218 Fast food consumption
(Ref. = none)Yes 3.505
(−46.31, 53.32)0.890 25.35
(−21.71, 72.42)0.291 −11.08
(−50.06, 27.89)0.577 −8.42
(−58.33, 41.48)0.741 −9.27
(−138.8, 120.2)0.888 Cosmetic consumption
(Ref. = none)Yes 30.53
(−23.64, 84.72)0.269 20.14
(−36.94, 77.22)0.489 −25.85
(−61.20, 9.48)0.152 −27.08
(−72.90, 18.70)0.246 5.58
(−133.1, 144.2)0.937 Deodorant consumption
(Ref. = none)Yes 18.34
(−34.70, 71.38)0.498 0.786
(−50.65, 52.23)0.976 −42.22
(−75.32, −9.11)0.062 −17.94
(−65.96, 30.08)0.464 −30.29
(−164.1, 103.6)0.657 History of breast cancer
(Ref. = first degree)None −95.89
(−157.9, −33.88)0.002 −61.04
(−132.5, 10.40)0.094 −4.96
(−42.83, 32.90)0.797 −15.52
(−71.56, 40.51)0.587 −164.3
(−308.5, −20.13)0.026 Second −47.79
(−128.9, 33.34)0.248 −73.83
(−150.3, 2.68)0.059 −31.49
(−70.60, 7.61)0.114 −11.35
(−76.79, 54.07)0.734 −147.3
(−333.9, 39.23)0.122 History of other cancers
(Ref. = first degree)None −23.22
(−96.87, 50.42)0.537 −41.29
(−131.6, 49.05)0.370 9.59
(−35.64, 54.84)0.678 −43.60
(−112.9, 25.73)0.218 −76.07
(−258.0, 105.8)0.413 Second −7.12
(−112.1, 97.76)0.894 −37.74
(−141.5, 66.04)0.476 3.52
(−64.99, 72.04)0.920 −59.91
(−132.6, 12.80)0.106 −75.43
(−326.3, 175.4)0.556 Hormone therapy
(Ref. = none)Yes −49.80
(−95.81, −3.79)0.054 −6.94
(−59.26, 45.37)0.795 −22.26
(−57.64, 13.10)0.217 −13.14
(−59.91, 33.61)0.582 −83.84
(−213.6, 45.96)0.206 Reasons to say yes to hormone therapy
(Ref. = infertility)Birth control −61.39
(−127.9, 5.12)0.070 −155.6
(−317.9, 6.59)0.060 −73.60
(−168.7, 21.57)0.130 −44.81
(−148.2, 58.61)0.396 −320.4
(−635.9, −4.81)0.047 Age
(Re ≥ 60)< 30 −40.27
(−126.9, 46.43)0.363 −101.6
(−141.6, −61.51)< 0.001 −38.97
(−106.4, 28.53)0.258 −98.75
(−144.5, −52.97)< 0.001 −250.2
(−403.3, −97.2)0.001 30−39 29.32
(−55.39, 114.1)0.498 49.22
(−49.35, 147.8)0.328 13.96
(−45.28, 73.20)0.644 5.13
(−79.44, 89.72)0.905 131.6
(−83.21, 346.4)0.230 40−49 5.83
(−53.18, 64.84)0.846 −2.60
(−48.77, 43.57)0.912 10.65
(−31.46, 52.77)0.620 −21.31
(−80.46, 37.84)0.480 15.66
(−86.98, 118.3)0.765 50−59 −1.71
(−73.98, 70.56)0.963 1.99
(−74.68, 78.66)0.959 −20.53
(−64.46, 23.39)0.360 −61.84
(−119.1, −4.54)0.064 −51.99
(−195.7, 91.81)0.479 BMI
(Ref. = obesity)Under weight 46.05
(−30.49, 122.5)0.238 102.3
(−189.5, 394.3)0.492 32.55
(8.28, 56.82)0.009 −24.75
(−80.86, 31.36)0.387 134.8
(−260.8, 530.5)0.504 Normal weight −14.81
(−76.87, 47.24)0.640 −28.83
(−83.48, 25.80)0.301 28.96
(−13.61, 71.54)0.182 24.70
(−34.14, 83.55)0.411 6.19
(−150.5, 162.9)0.938 Over weight −6.41
(−71.68, 58.85)0.847 −5.66
(−61.10, 49.76)0.841 31.12
(−19.34, 81.59)0.227 30.27
(−31.58, 92.13)0.337 32.15
(−134.5, 198.8)0.705 Breastfeeding duration showed a significant negative association with the response-dose of PrPB [OR = −83.02 (CI: −144.8, −21.2), P = 0.008] and PrPB [OR = −62.68 (CI: −123.5, −1.85), P = 0.043] in women with breastfeeding duration of < 6 months and > 6 months, compared with those in women with no children, respectively (Table 3).
These results indicated that the response-dose of EtPB [OR = −69.95 (CI: −120.1, −18.32), P = 0.008] and PrPB [OR = −44.79 (CI: −83.14, −6.43), P = 0.022] decreased by 69 and 44-fold among women with age at menarche of 12 years, compared to that in women with age at menarche of > 12 years, respectively (Table 3). We also observed that age at first pregnancy had a significant association with increased doses of EtPB [OR = 166.2 (CI: 110.4, 222.1), P < 0.001], BuPB [OR = 136.4 (CI: 66.89, 205.9), P = 0.001], and ∑PBs [OR = 329.5 (CI: 77.48, 581.6), P = 0.01] in women with age at first pregnancy of 30 years, compared with the reference. Moreover, the dose response of BuPB [OR = 53.17 (CI: 10.27, 96.07), P = 0.015] for age at first pregnancy of < 30 years was significant (Table 3).
A 36-fold increase was recorded in PrPB dose [OR = 36.24 (CI: 10.21, 62.28), P = 0.006] among women with no menopause compared with the reference, and a 32-fold increase was recorded in PrPB dose [OR = 32.41 (CI: 32.52, 61.30), P = 0.028] among women with menopause at < 55 years compared with the reference (Table 3).
The 95-fold decrease in MePB dose [OR = −95.89 (CI: −157.9, −33.88), P = 0.002] and the 164-fold decrease in ∑PBs dose [OR = −164.3 (CI: −308.5, −20.13), P = 0.026] were significant in women with no family history of breast cancer compared to those in the reference (first-degree relatives with breast cancer) (Table 3).
Compared with women using hormone therapy for infertility treatment, ∑PBs dose [OR= −320.4 (CI = −635.9, −4.81), P = 0.047] was 320-fold lower among women using hormone therapy for birth control (Table 3).
Stratification of data by age revealed a significant association with the response-dose of EtPB [OR = −101.6 (CI: −141.6, −61.51) P < 0.001], BuPB [OR = −98.75 (CI: −144.5, −52.97), P < 0.001], and ∑PBs [OR = −250.2 (CI: −403.3, −97.2), P = 0.001] among women aged < 30 years compared with women aged ≥ 60 years (Table 3).
Statistical analyses revealed that PrPB dose [OR = 32.55 (CI: 8.28, 56.82), P = 0.009] increased by 32-fold among underweight women compared with that among obese women (Table 3).
-
The proposed method herein is an appropriate technique for determining paraben content in breast tissues and providing acceptable recovery and good sensitivity to analyze real samples. Owing to its high chromatographic resolution capacity, GC-MS greatly contributes in quantifying organic volatile compounds. The derivatization process before GC analysis improves the identification of organic compounds[34]. The LOQs obtained through the developed GC-MS method was similar to that of LC-MS/MS[35].
To the best of our knowledge, this was the first study to assess paraben content in adjacent normal-malignant breast tissues. No significant difference in paraben concentration (P < 0.05) was observed between malignant and normal tissues, which may be caused by the high burden of parabens in different tissues of women. In a study by Darbre et al. the mean concentration of parabens in 20 women with breast cancer was (20.6 ± 4.2) ng/g tissue. Comparison of individual paraben concentrations revealed MePB was the paraben with the highest concentration (with a mean concentration of (12.8 ±2.2 ng/g)[21]. In another study, paraben concentration was reported in a range of 20–100 ng/g tissue[11]. Compared with these previous results, in this study, the mean paraben concentrations ranged from 87.88 for BuPB to 178.48 ng/g for MePB in malignant breast tissues (Table 2). In this study, among the parabens, MePB was detected at the highest amount, which can be due to the high MePB content of consumer products. BuPB was detected at the lowest concentration, which may be attributed to its low content in consumer products. Taken together, we concluded that paraben residue in both malignant and normal tissues can be used as indicators to determine human accumulative exposure to these pollutants. According to published findings, parabens at concentrations of 10−6 molar or higher increase the expression of cancer-related genes[23].
In this study, comparison of the positive correlation coefficients of paraben concentrations, except for that of BuPB, between malignant and normal tissues indicated that source exposure to paraben was common for malignant and normal tissues. This correlation coefficient indicated that breast tissues were completely exposed to the effects of parabens. It has been established that exposure to MePB induces disorders, such as cell cycle, in human breast epithelial cells. In addition, exposure to MePB and BuPB has been known to increase DNA damage as well as chromosomal and gene abnormalities associated with stimulation of the estrogen receptors[36].
ER, PR, and HER2 are important molecular biomarkers for breast cancer. It was revealed in this study that MePB concentration significantly increased among ER+, PR+, and HER2 + participants, compared with that among women negative for ER, PR, and HER2. It is assumed that MePB stimulated the ER+, PR+, and HER2 + receptors in these women. The relationship between MePB and the risk factor ER+ in this study is consistent with previous results that E+ breast cancer models exhibiting MePB had an increase in the gene expression of mammary stem cells, resulting in cancer cell resistance to chemotherapy[24,37,38]. In addition to the interaction of parabens with ER and PR receptors[19], Pan et al found that HER ligands increase the potency of BuPB to stimulate oncogene expression and breast cancer cell proliferation in vitro by ERα[39].
A significant negative association between breastfeeding duration and the response-dose of PrPB (OR = −83.02) and PrPB (OR = −62.68) was observed in women with breastfeeding duration of < 6 months and > 6 months, respectively, compared with that in women with no children.
These results may be consistent with the fact that breast milk hormones protect a mother against weight gain as well as breast and endometrial cancers[40]. It is possible that breastfeeding contributes in detoxifying parabens in breast tissues. However, as far as we know, this topic has not been studied.
The findings in this study indicated that EtPB [OR = −69.95 (CI: −120.1, −18.32), P = 0.008] and PrPB [OR = −44.79 (CI: −83.14, −6.43), P = 0.022] had a significant negative association with age at menarche of 12 years compared with reference. These results suggested that exposure to parabens probably had occurred since the subjects were at a much younger age. The obtained results were in agreement with the high urinary EtPB concentration observed in a previous study involving a Korean population aged 0−18 years[41]. Furthermore, our findings are consistent with the inverse association between EtPB and BuPB concentrations and the menstrual cycle length found among female Japanese university students[42]. Previous studies have confirmed that parabens have many side effects on menstruation. Exposure to high doses of PrPB and BuPB increases the number of primordial follicles, while decreasing the number of early primary follicles during menarche. Moreover, regarding ovarian dysfunction, exposure to PrPB and BuPB disrupts the expression of some uterine genes, whereas exposure to high doses of BuPB significantly increases uterine weight[43].
In this study, a 32-fold increase in PrPB concentration was recorded among women with age at menopause of < 55 years. This result suggested that exposure to parabens had occurred among young and middle-aged women of reproductive age. This was confirmed by the findings of Lee et al, in which exposure to paraben induces premature ovarian failure (POF), which is similar to menopause, before the age of 40 years[44].
In this study, there was a significant association between EtPB (OR = 166) and BuPB (OR = 53) exposures and age at pregnancy of < 30 and 30 years, respectively. This study revealed that exposure to EtPB and BuPB had occurred among women aged ≤ 30 years. In study of Jain (2016), it is interesting that BuPB, EtPB, and MePB concentrations have increased with pregnancy progression[45].
Infertility and hormonal fertility treatments are related to breast cancer[46]. In this study, a 320-fold increase in ∑PBs concentration was observed among women who used hormone therapy for infertility treatment. Another study reported that exposure to PrPB leads to diminished ovarian reserve and contributes to ovarian aging among women[33].
In this study, there was a significant positive association between breast cancer gene in women with first-degree relatives and MePB (OR = 95, P = 0.002) and ∑PBs (OR = 164, P = 0.026) concentrations. This finding can be confirmed by environmental effects on the stimulation of breast cancer gene expression[47]. However, as far as we know, this topic has not been studied.
Our results also revealed a negative association between EtPB, BuPB, and ∑PBs doses and women aged < 30 years, compared with women aged ≥ 60 years. These results are similar to those reported by Engel et al. (2014)[48]. The authors found that PrPB concentration is higher among participants aged ≤ 50 years. This difference in paraben concentration among age groups is related to lifestyle factors and paraben metabolism[48].
Most endocrine disruptors are related to BMI[49,50]. In this study, an inverse relationship was observed between PrPB concentration and BMI. This observation is in agreement with the results reported by Jain (2016). Jain reported that MePB, EtPB, PrPB, and BuPB doses decreased among pregnancy women as BMI increased (P ≤ 0.001)[45]. Koeppe et al. (2014) have indicated that BMI is inversely associated with paraben concentration (P < 0.05)[51]. Moreover, another inverse association has been observed between the concentrations of MePB, PrPB, and BuPB and BMI (Spearman r = −0.15 and −0.17; P < 0.05)[52]. Larger surface area to body weight ratio (< BMI), high dermal absorption, and inhalation by the lung surface can lead to an increase in paraben accumulation among an underweight population[53,54] The above findings may be due to pharmacokinetic differences among underweight and obese people[48].
In conclusion, exposure to paraben metabolites was widespread among women with breast cancer in Isfahan Province, Iran. No significant difference in paraben concentration was observed between malignant and normal tissues, which may indicate high body burden of parabens in the different tissues of women in this population. The results of this study revealed that paraben accumulation in breast tissues had significant association with breast cancer risk factors, such as ER/PR/HER2 status, degree of family history of breast cancer, age at menarche, age at first pregnancy, age at menopause, and BMI. Most breast cancer risk factors can be stimulated by paraben exposure among young and middle-aged women. These results can advance future epidemiology studies and strategies to improve women’s lifestyle and promote consumption of paraben-free products. The limitations of this study included its relatively small sample size, especially when stratified by intervention variables.
-
The authors extend their appreciations to Ziba Pirestani and Shirin Bina in Poursina Hakim Laboratory and Shabnam Pirestani for their efforts and supports.
-
The authors declare that they have no conflict of interest.
doi: 10.3967/bes2019.112
Paraben Content in Adjacent Normal-malignant Breast Tissues from Women with Breast Cancer
-
Abstract:
Objective Accumulation of estrogenic compounds and other carcinogens in normal breast tissues contributes to unpredictable breast cancer incidence during adolescence and throughout life. To assess the role of parabens in this phenomenon, the paraben content of adjacent normal-malignant breast tissues is measured in women with breast cancer living in Isfahan Province, Iran. Methods Adjacent normal-malignant breast tissue samples were obtained from 53 subjects. The parabens including methyl-paraben (MePB), ethyl-paraben (EtPB), propyl-paraben (PrPB), and butyl-paraben (BuPB) were extracted from the sample supernatant and then subjected to gas chromatography analysis. Results Some risk factors for breast cancer were stimulated by parabens in adjacent malignant-normal breast tissues among young and middle-aged women with breast cancer. We observed a significant association for dose-response pattern of MePB [OR = 98.34 (11.43–185.2), P = 0.027] for both ER+ and PR+ women and MePB [OR = 164.3 (CI: 112.3–216.3), P < 0.001] for HER2+ women than women with negative receptors. The risk of 95-fold increase in MePB dose and 164-fold increase in ∑PBs dose were significant for women with hereditary breast cancer in first-degree relatives. Conclusions These results may promote future epidemiology studies and strategies to improve women’s lifestyle and consume paraben-free products. -
Key words:
- Paraben /
- Breast cancer /
- Malignant tissues /
- Normal tissues /
- Demography /
- Risk factors
-
Figure 1. GC/MS chromatograms of MePB (RT: 10.99), EtPB (13.90), PrPB (RT: 14.50), and BuPB (RT: 15.20) in human breast cancer extract.
Figure 2. Comparison of correlation coefficients of paraben concentration (Conc) between malignant and normal tissues (A: MePB, B: EtPB, C: PrPB, D: BuPB, E: ∑PBs).
Table 1. The socio-demographic and behavioral characteristics of the study population (N = 53)
Demographic variables Grouping variables N (%) Age (years) ≤ 30 4 (7.7) 30−39 10 (19.2) 40−49 22 (42.3) 50−59 8 (15.4) ≥ 60 8 (15.4) Body mass index (BMI) ≤ 18.5 (underweight) 3 (5.8) 18.5−24.9 (normal weight) 17 (32.7) 25−29.9 (over weight) 13 (25.0) ≥ 30 (obesity) 19 (36.5) Physical activity Regular 7 (13.5) Irregular 29 (55.8) Passive 16 (30.7) Breast feeding duration Without children 8 (15.1) < 6 months 6 (11.3) 6−24 months 39 (73.6) Educational status < High school 28 (53.8) High school 11 (21.2) > High school 13 (25.0) Degree of family history
of breast cancerNone 29 (54.7) First or second degree 24 (45.3) Degree of family history
of other cancerNone 35 (66.0) First or second degree 18 (34.0) Hormone therapy history Yes 23 (41.8) No 32 (58.2) Reasons to say yes to hormone therapy Birth control 20 (87.0) Infertility 3 (13.0) Age at first pregnancy (years) < 30 43 (87.8) 30 3 (6.1) > 30 3 (6.1) Employment status Employed 9 (17.0) Unemployed 44 (83.0) Age at menarche (years) < 12 9 (17.3) 12 11 (21.2) > 12 32 (61.5) Age at menopause
(years)Non-menopausal 36 (69.2) < 55 13 (25.0) > 55 3 (5.8)  下载: 导出CSV
Table 2. Comparison of the mean and median of paraben metabolite (ng/g) distribution between malignant and normal tissues
Paraben metabolites (ng/g wet w.) Tissue Mean Median SD IQR Min Max t df P-value MePB Malignant 178.47 148.36 107.10 110 22.36 529.23 0.798 52 0.429 Normal 164.86 135.49 114.92 169 7.72 547.42 EtPB Malignant 136.69 131.37 84.90 132 11.77 369.98 −0.581 52 0.564 Normal 144.11 112.83 120.01 126 11.68 547.42 PrPB Malignant 99.89 84.48 63.87 76 23.50 266.19 0.202 52 0.840 Normal 97.44 68.82 95.72 91 5.89 422.18 BuPB Malignant 87.88 61.93 80.38 112 7.56 310.28 −1.019 52 0.313 Normal 107.53 45.44 138.82 122 4.76 769.06 ∑PBs Malignant 497.02 507.31 242.29 356 99.35 1114.70 −0.252 52 0.802 Normal 507.81 432.20 325.43 411 30.05 1522.65
下载: 导出CSV
Table 3. Association between parabens concentrations with breast cancer risk factors, analyzed using the generalized estimating equations (GEE) model
Risk factors of breast cancer MePB EtPB PrPB BuPB ∑PBs B (CI 95%) P B (CI 95%) P B (CI 95%) P B (CI 95%) P B (CI 95%) P ER
(Ref. = negative.)Positive 98.34
(11.43, 185.2)0.027 11.32
(−83.24, 105.8)0.814 −47.89
(−186.1, 90.32)0.497 −21.49
(−192.8, 149.8)0.806 16.97
(−372.8, 406.8)0.932 PR
(Ref. = negative.)Positive 98.34
(11.43, 185.2)0.027 11.32
(−83.24, 105.8)0.814 −47.89
(−186.1, 90.32)0.497 −21.49
(−192.8, 149.8)0.806 16.97
(−372.8, 406.8)0.932 HER2
(Ref. = negative.)Positive 164.3
(112.3, 216.3)< 0.001 −17.49
(−69.16, 34.17)0.507 −66.74
(−140.6, 7.12)0.077 −23.18
(−111.8, 65.49)0.608 46.21
(−144.8, 237.2)0.635 Tumor location in breast
(Ref. = outer)Inter 22.07
(−53.59, 97.74)0.567 17.33
(−41.17, 75.83)0.561 −5.66
(−51.52, 40.20)0.809 1.08
(−51.26, 53.42)0.968 50.19
(−121.4, 221.8)0.567 Upper −27.76
(−92.17, 36.63)0.398 55.33
(−63.88, 174.5)0.363 −10.48
(−109.9, 88.97)0.836 −10.42
(−109.6, 88.78)0.837 23.35
(−257.0, 303.7)0.870 Education status
(Ref. ≥ high school)< High school −3.52
(−48.95, 41.90)0.879 −43.19
(−120.5, 34.13)0.274 −11.82
(−45.12, 21.48)0.487 −11.52
(−61.80, 38.75)0.653 −106.1
(−284.6, 72.6)0.245 High school 20.80
(−7.20, 48.81)0.146 −50.27
(−135.5, 34.9)0.248 40.43
(−28.65, 109.5)0.251 19.59
(−66.27, 105.4)0.655 −9.26
(−244.3, 225.8)0.938 Activity
(Ref. = passive)Regular −72.58
(−149.7, 4.53)0.065 40.10
(−79.03, 159.2)0.509 9.57
(−75.21, 94.36)0.825 −32.30
(−88.76, 24.16)0.262 −52.31
(−290.7, 186.1)0.667 Irregular 5.44
(−72.57, 83.46)0.891 46.32
(2.59, 90.05)0.538 −3.15
(−44.34, 38.04)0.881 19.18
(−40.19, 78.57)0.527 34.04
(−104.2, 172.2)0.629 Breast feeding duration
(Ref. = without children)< 6 month −41.85
(−124.5, 40.82)0.321 −69.52
(−170.2, 31.16)0.176 −83.02
(−144.8, −21.2)0.008 −67.48
(−148.4, 13.47)0.102 −225.3
(−463.5, 12.93)0.064 > 6 month −32.38
(−85.26, 20.80)0.230 −57.89
(−145.9, 30.19)0.198 −62.68
(−123.5, −1.85)0.043 −44.80
(−115.2, 25.64)0.213 −164.2
(−336.2, 7.75)0.061 Age at menarche
(Ref > 12 years)< 12 years −45.37
(−126.5, 35.83)0.273 7.152
(−62.80, 77.10)0.841 −37.11
(−74.07, −0.150)0.05 2.75
(−66.44, 71.95)0.938 −100.3
(−271.3, 70.55)0.250 = 12 years −20.42
(−107.1, 66.27)0.644 −69.95
(−120.1, −18.32)0.008 −44.79
(−83.14, −6.43)0.022 −2.74
(−56.66, 51.16)0.920 −132.9
(−276.8, 10.90)0.070 Age at first pregnancy
(Ref ≥ 30)< 30 years −5.88
(−40.6, 28.86)0.740 32.91
(−13.59, 79.43)0.165 −1.96
(−73.08, 69.15)0.957 53.17
(10.27, 96.07)0.015 77.29
(−65.43, 220.1)0.288 = 30 years 92.09
(−18.15, 202.3)0.102 166.2
(110.4, 222.1)< 0.001 13.84
(−57.23, 84.91)0.703 136.40
(66.89, 205.9)0.001 329.5
(77.48, 581.6)0.010 Age at menopause
(Ref ≥ 55 years)None menopause −19.68
(−134.3, 94.94)0.736 41.54
(−43.83, 126.9)0.340 36.24
(10.21, 62.28)0.006 3.95
(−55.39, 63.29)0.896 63.49
(−174.3, 301.3)0.601 ≤ 55 years −15.75
(−134.7, 103.2)0.795 45.89
(−35.02, 144.86)0.231 32.41
(3.52, 61.30)0.028 39.95
(−29.40, 109.3)0.259 81.61
(−159.3, 322.5)0.507 Illicit drug consumption
(Ref. = none)Yes 22.73
(−80.18, 125, 6)0.665 −71.79
(−131.8, −11.77)0.119 −12.33
(−73.30, 48.63)0.692 −32.39
(−89.06, 24.28)0.263 −86.75
(−342.4, 168.9)0.506 Smoking consumption
(Ref. = none)Yes −5.09
(−69.40, 59.22)0.877 −33.04
(−88.97, 22.88)0.247 −22.55
(−60.65, 15.55)0.246 −49.03
(−92.21, −5.85)0.026 −93.58
(−242.4, 55.32)0.218 Fast food consumption
(Ref. = none)Yes 3.505
(−46.31, 53.32)0.890 25.35
(−21.71, 72.42)0.291 −11.08
(−50.06, 27.89)0.577 −8.42
(−58.33, 41.48)0.741 −9.27
(−138.8, 120.2)0.888 Cosmetic consumption
(Ref. = none)Yes 30.53
(−23.64, 84.72)0.269 20.14
(−36.94, 77.22)0.489 −25.85
(−61.20, 9.48)0.152 −27.08
(−72.90, 18.70)0.246 5.58
(−133.1, 144.2)0.937 Deodorant consumption
(Ref. = none)Yes 18.34
(−34.70, 71.38)0.498 0.786
(−50.65, 52.23)0.976 −42.22
(−75.32, −9.11)0.062 −17.94
(−65.96, 30.08)0.464 −30.29
(−164.1, 103.6)0.657 History of breast cancer
(Ref. = first degree)None −95.89
(−157.9, −33.88)0.002 −61.04
(−132.5, 10.40)0.094 −4.96
(−42.83, 32.90)0.797 −15.52
(−71.56, 40.51)0.587 −164.3
(−308.5, −20.13)0.026 Second −47.79
(−128.9, 33.34)0.248 −73.83
(−150.3, 2.68)0.059 −31.49
(−70.60, 7.61)0.114 −11.35
(−76.79, 54.07)0.734 −147.3
(−333.9, 39.23)0.122 History of other cancers
(Ref. = first degree)None −23.22
(−96.87, 50.42)0.537 −41.29
(−131.6, 49.05)0.370 9.59
(−35.64, 54.84)0.678 −43.60
(−112.9, 25.73)0.218 −76.07
(−258.0, 105.8)0.413 Second −7.12
(−112.1, 97.76)0.894 −37.74
(−141.5, 66.04)0.476 3.52
(−64.99, 72.04)0.920 −59.91
(−132.6, 12.80)0.106 −75.43
(−326.3, 175.4)0.556 Hormone therapy
(Ref. = none)Yes −49.80
(−95.81, −3.79)0.054 −6.94
(−59.26, 45.37)0.795 −22.26
(−57.64, 13.10)0.217 −13.14
(−59.91, 33.61)0.582 −83.84
(−213.6, 45.96)0.206 Reasons to say yes to hormone therapy
(Ref. = infertility)Birth control −61.39
(−127.9, 5.12)0.070 −155.6
(−317.9, 6.59)0.060 −73.60
(−168.7, 21.57)0.130 −44.81
(−148.2, 58.61)0.396 −320.4
(−635.9, −4.81)0.047 Age
(Re ≥ 60)< 30 −40.27
(−126.9, 46.43)0.363 −101.6
(−141.6, −61.51)< 0.001 −38.97
(−106.4, 28.53)0.258 −98.75
(−144.5, −52.97)< 0.001 −250.2
(−403.3, −97.2)0.001 30−39 29.32
(−55.39, 114.1)0.498 49.22
(−49.35, 147.8)0.328 13.96
(−45.28, 73.20)0.644 5.13
(−79.44, 89.72)0.905 131.6
(−83.21, 346.4)0.230 40−49 5.83
(−53.18, 64.84)0.846 −2.60
(−48.77, 43.57)0.912 10.65
(−31.46, 52.77)0.620 −21.31
(−80.46, 37.84)0.480 15.66
(−86.98, 118.3)0.765 50−59 −1.71
(−73.98, 70.56)0.963 1.99
(−74.68, 78.66)0.959 −20.53
(−64.46, 23.39)0.360 −61.84
(−119.1, −4.54)0.064 −51.99
(−195.7, 91.81)0.479 BMI
(Ref. = obesity)Under weight 46.05
(−30.49, 122.5)0.238 102.3
(−189.5, 394.3)0.492 32.55
(8.28, 56.82)0.009 −24.75
(−80.86, 31.36)0.387 134.8
(−260.8, 530.5)0.504 Normal weight −14.81
(−76.87, 47.24)0.640 −28.83
(−83.48, 25.80)0.301 28.96
(−13.61, 71.54)0.182 24.70
(−34.14, 83.55)0.411 6.19
(−150.5, 162.9)0.938 Over weight −6.41
(−71.68, 58.85)0.847 −5.66
(−61.10, 49.76)0.841 31.12
(−19.34, 81.59)0.227 30.27
(−31.58, 92.13)0.337 32.15
(−134.5, 198.8)0.705
下载: 导出CSV
-
[1] Panicker L. Effect of propyl paraben on the dipalmitoyl phosphatidic acid vesicles. J Colloid Interface Sci, 2007; 311, 407−16. doi: 10.1016/j.jcis.2007.03.052 [2] Grecco CF, Souza ID, Queiroz MEC. Recent development of chromatographic methods to determine parabens in breast milk samples: A review. J Chromatogr B, 2018; 1093–94, 82−90. doi: 10.1016/j.jchromb.2018.06.059 [3] Liao C, Liu F, Kannan K. Occurrence of and dietary exposure to parabens in foodstuffs from the United States. Environ Sci Technol, 2013; 47, 3918−25. doi: 10.1021/es400724s [4] Moreta C, Tena M, Kannan K. Analytical method for the determination and a survey of parabens and their derivatives in pharmaceuticals. Environ Res, 2015; 142, 452−60. doi: 10.1016/j.envres.2015.07.014 [5] Honda M, Robinson M, Kannan K. Parabens in human urine from several Asian countries, Greece, and the United States. Chemosphere, 2018; 201, 13−9. doi: 10.1016/j.chemosphere.2018.02.165 [6] Smarr MM, Sundaram R, Honda M, et al. Urinary concentrations of parabens and other antimicrobial chemicals and their association with couples' fecundity. Environ Health Perspect, 2017; 125, 730−36. doi: 10.1289/EHP189 [7] Garcí a-Espiñ eira M, Tejeda-Bení tez L, Olivero-Verbel J. Toxic effects of bisphenol A, propyl paraben, and triclosan on caenorhabditis elegans. Int J Environ Res Public Health, 2018; 15, 684. doi: 10.3390/ijerph15040684 [8] Guo Y, Wang L, Kannan K. Phthalates and parabens in personal care products from China: Concentrations and human exposure. Arch Environ Contam Toxicol, 2014; 66, 113−9. doi: 10.1007/s00244-013-9937-x [9] Pollock T, Weaver RE, Ghasemi R, et al. Butyl paraben and propyl paraben modulate bisphenol A and estradiol concentrations in female and male mice. Toxicol Appl Pharmacol, 2017; 325, 18−24. doi: 10.1016/j.taap.2017.04.001 [10] Xue J, Wu Q, Sakthivel S, et al. Urinary levels of endocrine-disrupting chemicals, including bisphenols, bisphenol A diglycidyl ethers, benzophenones, parabens, and triclosan in obese and non-obese Indian children. Environ Res, 2015; 137, 120−8. doi: 10.1016/j.envres.2014.12.007 [11] Jamal A, Rastkari N, Dehghaniathar R, et al. Prenatal exposure to parabens and anthropometric birth outcomes: A systematic review. Environ Res, 2019; 173, 419−31. doi: 10.1016/j.envres.2019.02.044 [12] Guo J, Wu C, Lu D, et al. Urinary paraben concentrations and their associations with anthropometric measures of children aged 3 years. Environ Pollut, 2017; 222, 307−14. doi: 10.1016/j.envpol.2016.12.040 [13] Wang L, Asimakopoulos A, Kannan K. Accumulation of 19 environmental phenolic and xenobiotic heterocyclic aromatic compounds in human adipose tissue. Environ Int, 2015; 78, 45−50. doi: 10.1016/j.envint.2015.02.015 [14] Crinnion W. Toxic effects of the easily avoidable phthalates and parabens. Altern Med Rev, 2010; 15, 190−6. [15] Oishi S. Effects of propyl paraben on the male reproductive system. Food Chem Toxicol, 2002; 40, 1807−13. doi: 10.1016/S0278-6915(02)00204-1 [16] Watkins D, Ferguson K, Anzalota Del Toro L, et. al. Associations between urinary phenol and paraben concentrations and markers of oxidative stress and inflammation among pregnant women in Puerto Rico. Int J Hyg Environ Health, 2015; 218, 212−9. [17] Kang S, Kim S, Park J, et al. Urinary paraben concentrations among pregnant women and their matching newborn infants of Korea, and the association with oxidative stress biomarkers. Sci Total Environ, 2013; 461-462, 214−21. doi: 10.1016/j.scitotenv.2013.04.097 [18] Rocha B, Asimakopoulos A, Honda M, et al. Advanced data mining approaches in the assessment of urinary concentrations of bisphenols, chlorophenols, parabens and benzophenones in Brazilian children and their association to DNA damage. Environ Int, 2018; 116, 269−77. doi: 10.1016/j.envint.2018.04.023 [19] Okubo T, Yokoyama Y, Kano K, et al. ER-dependent estrogenic activity of parabens assessed by proliferation of human breast cancer MCF-7 cells and expression of ER alpha and PR. Food Chem Toxicol, 2001; 39, 1225−32. doi: 10.1016/S0278-6915(01)00073-4 [20] Routledge EJ, Parker J, Odum J, et al. Some alkyl hydroxy benzoate preservatives (Parabens) are estrogenic. Toxicol Appl Pharmacol, 1998; 153, 12−9. doi: 10.1006/taap.1998.8544 [21] Darbre PD, Aljarrah A, Miller WR, et al. Concentrations of parabens in human breast tumours. J Appl Toxicol, 2004; 24, 5−13. doi: 10.1002/jat.958 [22] Barr L, Metaxas G, Harbach CA, et al. Measurement of paraben concentrations in human breast tissue at serial locations across the breast from axilla to sternum. J Appl Toxicol, 2012; 32, 219−32. doi: 10.1002/jat.1786 [23] Byford JR, Shaw LE, Drewb MGB, et al. Oestrogenic activity of parabens in MCF7 human breast cancer cells. J Steroid Biochem Mol Biol, 2002; 80, 49−60. doi: 10.1016/S0960-0760(01)00174-1 [24] Lillo MA, Nichols C, Perry C, et al. Methylparaben stimulates tumor initiating cells in ER+ breast cancr models. J Appl Toxicol, 2017; 37, 417−25. doi: 10.1002/jat.3374 [25] Bidgoli SA, Ahmadi R, Zavarhei MD. Role of hormonal and environmental factors on early incidence of breast cancer in Iran. Sci Total Environ, 2010; 408, 4056−61. doi: 10.1016/j.scitotenv.2010.05.018 [26] Aran D, Camarda R, Odegaard J, et al. Comprehensive analysis of normal adjacent to tumor transcriptomes. Nat Commun, 2017; 1077, 1−14. [27] Shanmugam G, Ramaswamy B, Radhakrishnan V, et al. GC-MS method for the determination of paraben preservatives in the human breast cancerous tissue. Microchem J, 2010; 96, 391−6. doi: 10.1016/j.microc.2010.07.005 [28] Han Y, Jia X, Liu X, et al. DLLME combined with GC-MS for the determination of methylparaben, ethylparaben, propylparaben and butylparaben in beverage samples. Chromatographia, 2010; 72, 351−5. doi: 10.1365/s10337-010-1646-2 [29] Kamankesh M, Mohammadi A, Hosseini H, et al. Rapid determination of polycyclic aromatic hydrocarbons in grilled meat using microwave-assisted extraction and dispersive liquid-liquid microextraction coupled to gas chromatography-mass spectrometry. Meat Sci, 2015; 103, 61−7. doi: 10.1016/j.meatsci.2015.01.001 [30] Yang J, Li Y, Gong W, et. al. Simultaneous determination of six parabens in foods by matrix liquid-phase dispersion extraction combined with high-performance liquid chromatography. Food Anal Methods, 2014; 7, 1693−702. doi: 10.1007/s12161-014-9807-9 [31] Amin MM, Hashemi M, Ebrahimpour K, et al. Determination of parabens in wastewater and sludge in a municipal wastewater treatment plant using microwave-assisted dispersive liquid-liquid microextraction coupled to gas chromatography-mass spectrometry. Environ Health Eng Manag, 2019; 6, 215−24. doi: 10.15171/EHEM.2019.24 [32] Pycke B, Geer L, Dalloul M, et al. Maternal and fetal exposure to parabens in a multiethnic urban U. S. population. Environ Int, 2015; 84, 193−200. doi: 10.1016/j.envint.2015.08.012 [33] Smith K, Souter I, Dimitriadis I, et al. Urinary paraben concentrations and ovarian aging among women from a fertility center. Environ Health Perspect, 2013; 121, 1299−305. doi: 10.1289/ehp.1205350 [34] Djatmika R, Ding W, Sulistyarti H. Determination of parabens by injection-port derivatization coupled with gas-chromatography-mass spectrometry and matrix solid phase dispersion. IOP Conf Ser Mater Sci Eng, 2018; 299, 012005. doi: 10.1088/1757-899X/299/1/012005 [35] Pé rez R, Albero B, Miguel E, et al. Determination of parabens and endocrine-disrupting alkylphenols in soil by gas chromatography - mass spectrometry following matrix solid-phase dispersion or in-column microwave-assisted extraction: a comparative study. Anal Bioanal Chem, 2012; 402, 2347−57. doi: 10.1007/s00216-011-5248-0 [36] Delgado-Ló pez F, Zamora-Leó n S. Breast cancer and environmental contamination: A real connection? Cogent Med, 2018; 5, 1520470. [37] Phillips TM, McBride WH, Pajonk F. The response of CD24−/low /CD44+ breast cancer-initiating cells to radiation. J Natl Cancer Inst, 2006; 98, 1777−85. doi: 10.1093/jnci/djj495 [38] Li X, Lewis MT, Huang J, et al. Intrinsic resistance of tumorigenic breast cancer cells to chemotherapy. J Natl Cancer Inst, 2008; 100, 672−9. doi: 10.1093/jnci/djn123 [39] Pan S, Yuan C, Tagmount A, et al. Parabens and human epidermal growth factor receptor ligand cross-talk in breast cancer cells. Environ Health Perspect, 2016; 124, 563−9. doi: 10.1289/ehp.1409200 [40] Savino F, Fissore M, Liguori S, et al. Can hormones contained in mothers' milk account for the beneficial effect of breast-feeding on obesity in children. Clin Endocrinol, 2009; 71, 757−65. doi: 10.1111/j.1365-2265.2009.03585.x [41] Kim S, Lee S, Shin C, et al. Urinary parabens and triclosan concentrations and associated exposure characteristics in a Korean population-A comparison between night-time and first-morning urine. Int J Hyg Environ Health, 2018; 221, 632−41. doi: 10.1016/j.ijheh.2018.03.009 [42] Nishihama Y, Yoshinaga J, Iida A, et al. Association between paraben exposure and menstrual cycle in female university students in Japan. Reprod Toxicol, 2016; 63, 107−13. doi: 10.1016/j.reprotox.2016.05.010 [43] Ahn H, An B, Jung E, et al. Parabens inhibit the early phase of folliculogenesis and steroidogenesis in the ovaries of neonatal rats. Mol Reprod Dev, 2012; 79, 626−36. doi: 10.1002/mrd.22070 [44] Lee J, Lee M, Ahn C, et. al. Parabens accelerate ovarian dysfunction in a 4-vinylcyclohexene diepoxide-induced ovarian failure model. Int J Environ Res Public Health, 2017; 14, 161. doi: 10.3390/ijerph14020161 [45] Jain R. Impact of pregnancy on the levels of parabens and bisphenol A: data from NHANES 2005-2010. J Chem, 2016; 2016, 1−8. [46] Brinton L, Sahasrabuddhe V, Scoccia B. Fertility drugs and the risk of breast and gynecologic cancers. Semin. Reprod Med, 2012; 30, 131−45. doi: 10.1055/s-0032-1307421 [47] Jaffee S, psychiatry T. Gene - environment correlations: a review of the evidence andimplications for prevention of mental illness. Mol Psychiatr, 2007; 12, 432−42. doi: 10.1038/sj.mp.4001950 [48] Engel LS, Buckley JP, Yang G, et al. Predictors and variability of repeat measurements of urinary phenols and parabens in a cohort of Shanghai women and men. Environ Health Perspect, 2014; 122, 733−40. doi: 10.1289/ehp.1306830 [49] Hatch EE, Nelson JW, Stahlhut RW, et al. Association of endocrine disruptors and obesity: perspectives from epidemiological studies. Int J Androl, 2010; 33, 324−32. doi: 10.1111/j.1365-2605.2009.01035.x [50] Amin MM, Ebrahimpour K, Parastar S, et al. Association of urinary concentrations of phthalate metabolites with cardiometabolic risk factors and obesity in children and adolescents. Chemosphere, 2018; 211, 547−56. doi: 10.1016/j.chemosphere.2018.07.172 [51] Koeppe ES, Ferguson KK, Colacino JA, et al. Relationship between urinary triclosan and paraben concentrations and serum thyroid measures in NHANES 2007-2008. Sci Total Environ, 2013; 299−305. [52] Meeker JD, Yang T, Ye X, et al. Urinary concentrations of parabens and serum hormone levels, semen quality parameters, and sperm DNA damage. Environ Health Perspect, 2011; 119, 252−7. doi: 10.1289/ehp.1002238 [53] Cohen Hubal E, Sheldon LS, Burke JM, et al. Children’s exposure assessment: a review of factors influencing children’s exposure, and the data available to characterize and assess that exposure. Environ Health Perspect, 2000; 108, 475−86. [54] Sly PD, Flack F. Susceptibility of children to environmental pollutants. Ann N Y Acad Sci, 2008; 1140, 163−83. doi: 10.1196/annals.1454.017 -

 点击查看大图

计量
- 文章访问数: 4101
- HTML全文浏览量: 1379
- PDF下载量: 303
- 被引次数: 0


 Quick Links