

 下载:
下载:


-
The prevalence of depression, one of the most common psychiatric disorders, has increased due to socio-economic improvements and incidences of mental stress. The clinical manifestations include emotional instability, lack of interest in activities, thinking or cognitive disorders, lack of self-control, and sleep disorders[1,2]. Some severe cases manifest as self-mutilation and suicide[3,4]. Depression affects subjects of all ages and social strata and is the leading cause of human disability and death worldwide. In addition, it causes enormous economic losses and social burdens[5,6].
The pathogenesis of depression is complex, and no effective treatment has been discovered. Several recent studies have been conducted to identify the risk factors, a crucial step toward decreasing the incidence of depression. Depression is often associated with sleep disturbances, such as insomnia or hypersomnia[7], yet chronic sleep disturbances cause metabolic abnormalities and increase the risk of obesity and diabetes. Depression is more common in diabetic individuals and may be a risk factor for developing type 2 diabetes[8,9]. However, the associations between risk factors and depression have not been fully explored since observational studies lack clear demarcations between causality and false correlation due to confusion and reverse causality. Therefore, this study used the two-sample Mendelian randomization (2SMR) method to identify depression factors and major depressive disorders (MDD) from metabolites, diseases, and risk factors. The 2SMR has several advantages over traditional observational studies, which are limited by confounders.
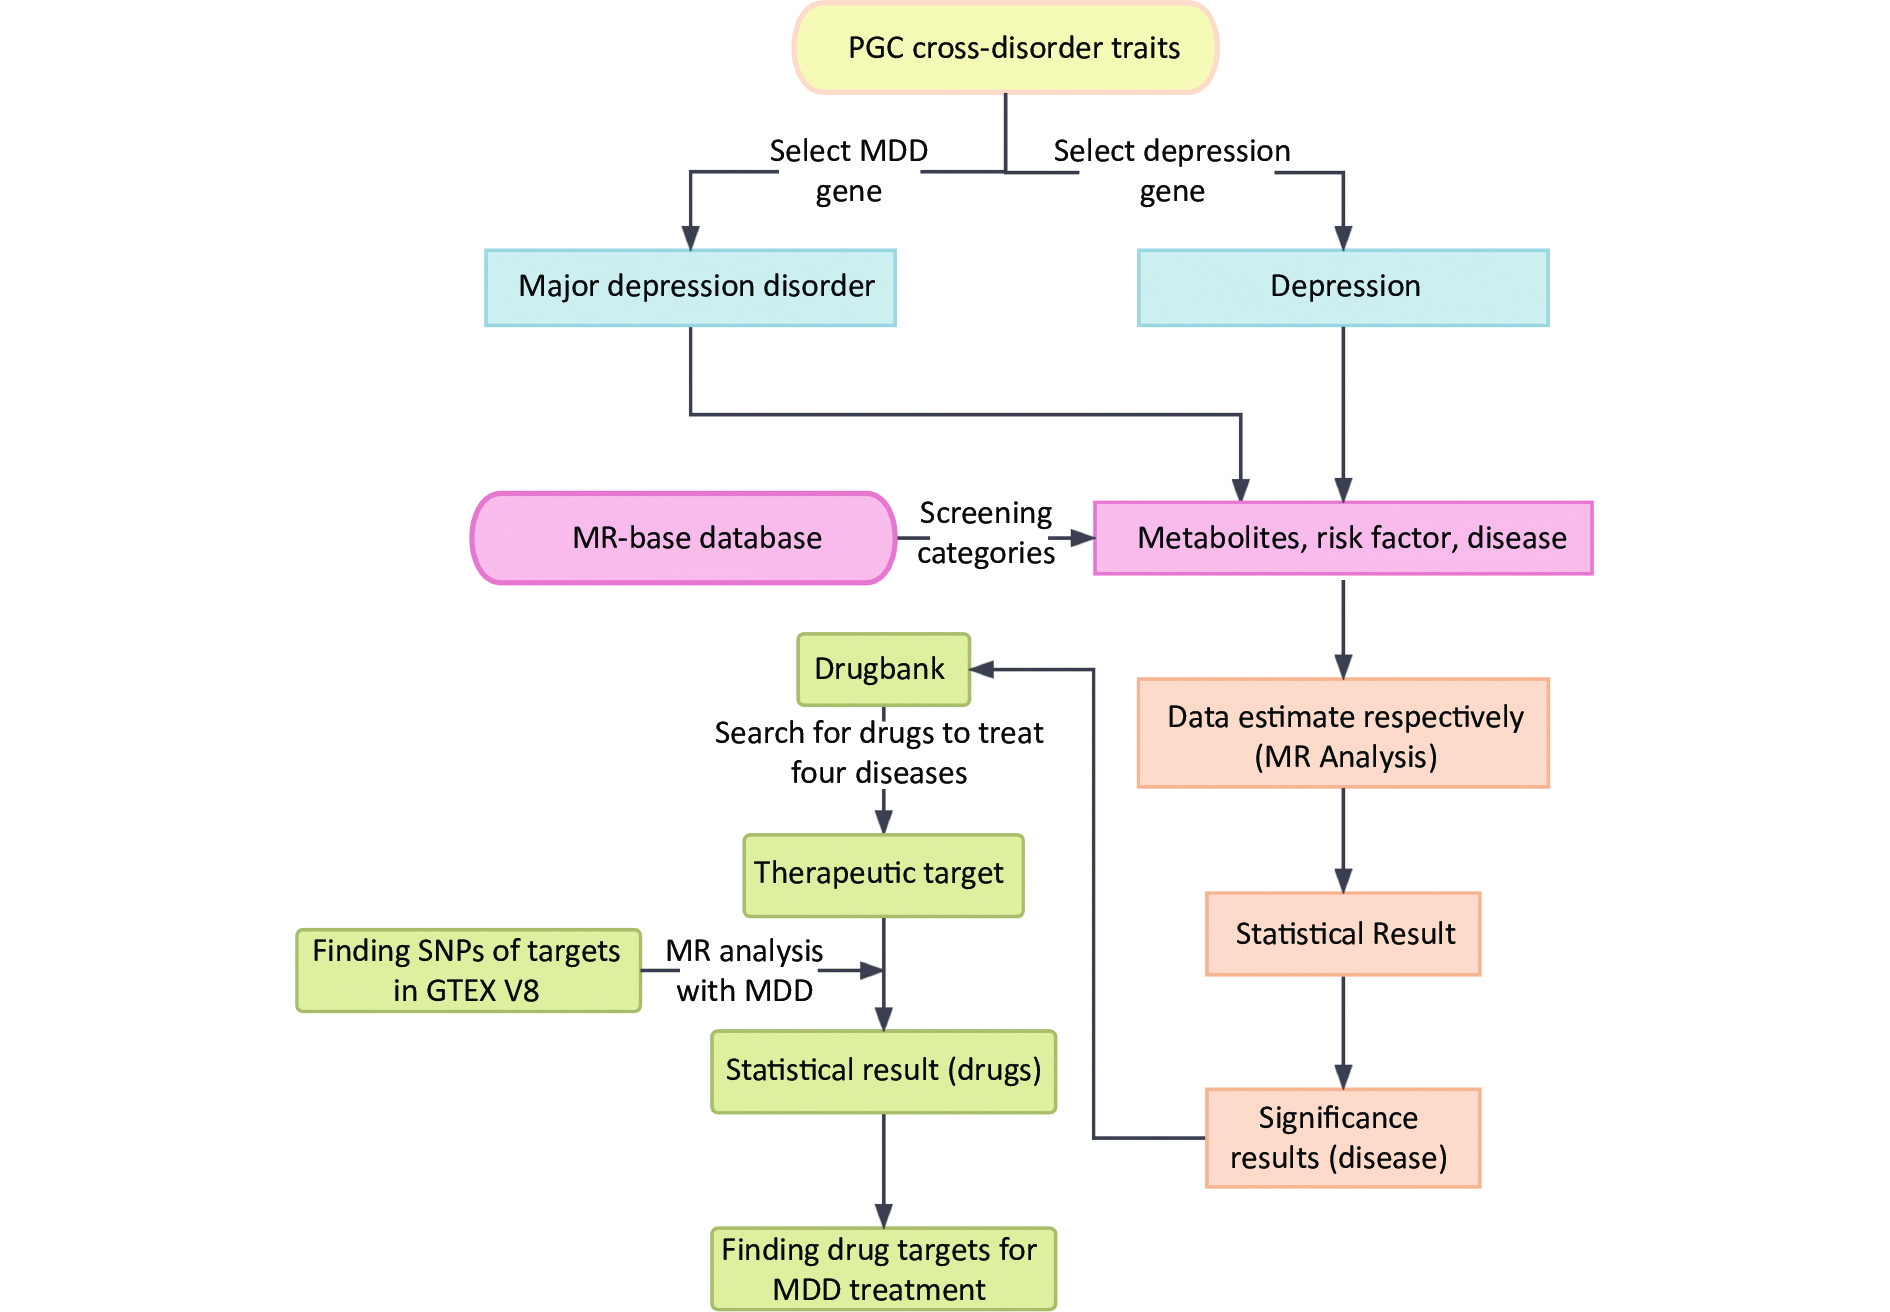
Moreover, 2SMR is widely used to estimate the causal relationships between risk factors and various diseases[10]. Further analysis was conducted for the significant MDD-associated diseases to explore the relationship between their drug targets and MDD[11]. A schematic representation of the study design is shown in Figure 1.
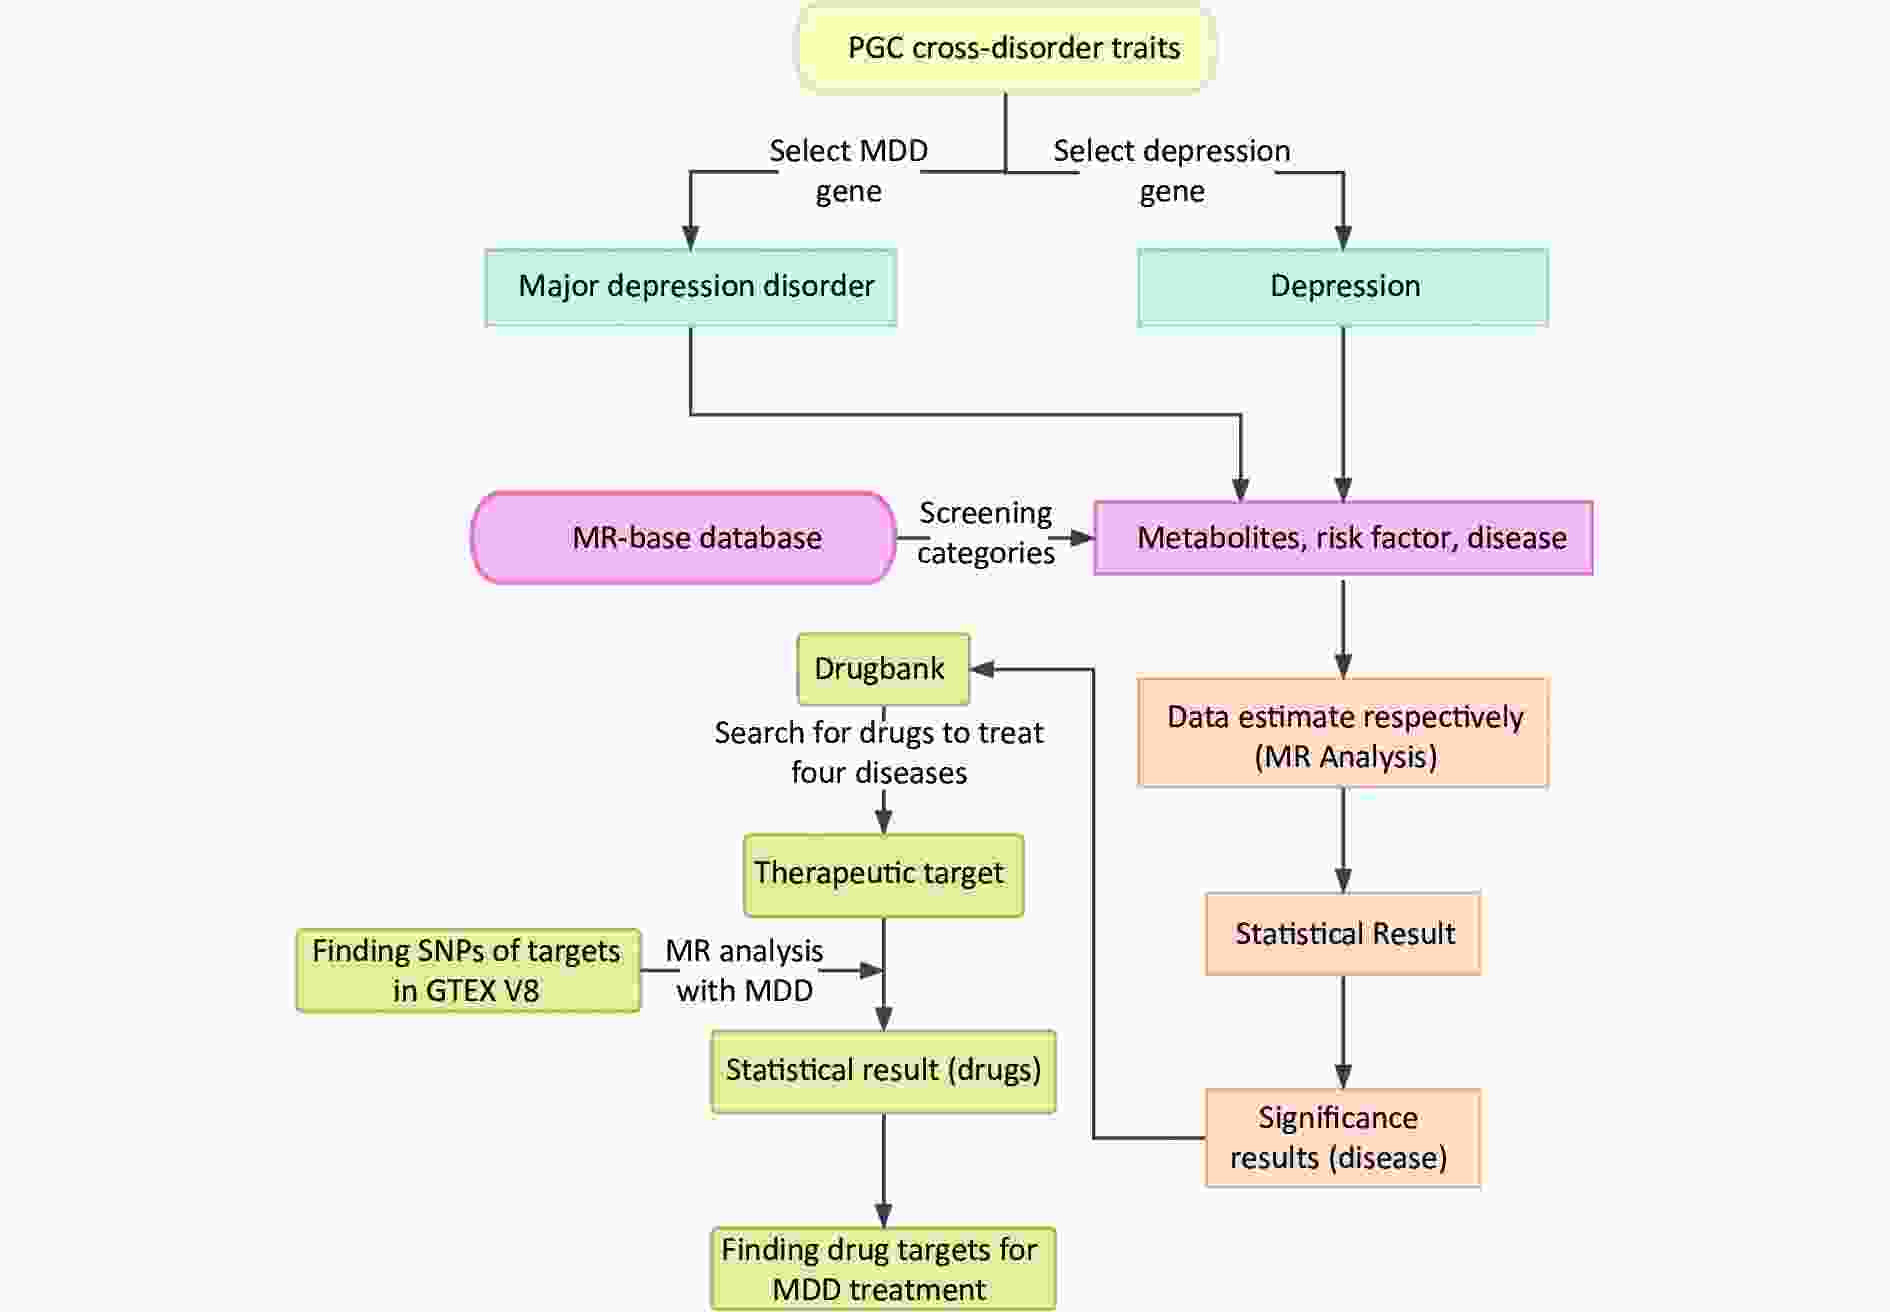
Figure 1. Summarization of analytic design to screen risk factors for depression and MDD. The overall data statistics were performed in three processes: a) finding relevant representative depression modifiable factors and environmental risk factors through MR-base database; b) compiling the data computationally and visualizing the results through two-sample MR calculation method; c) finding depression-related protein targets in DrugBank online database, and the SNP corresponding to each drug target was obtained in GTEX V8 with the found depression-related factors for calculation to identify relevant important drug targets. MDD, major depressive disorder; MR, Mendelian randomization; SNP, single nucleotide polymorphism; PGC, psychiatric genomics consortium.
-
The MR-Base platform is a repository for approximately 11 billion single nucleotide polymorphisms (SNPs) and the associated traits. The tool is used for systematic analysis of the causal relationship between risk factors and human phenotypes. Briefly, the database comprises i) data on 144 sets of disease factors classified into 9 subcategories and results on 55 different diseases; ii) data on 292 metabolic factors grouped into 13 subcategories and results on 256 different metabolites; and iii) data on 134 sets of risk factors classified into 19 subcategories and results on 62 different risk factors[12].
Exposure factor category columns for metabolites, diseases, and risk factors selected from MR-Base included several outcome factors. The outcome factors for depression included 7,624,934 SNPs in 113,769 patients with extensive depression and possible MDD and data on 208,811 healthy controls of European ancestry in 2018[13]. The other dataset was selected for major depression in 59,851 patients and 113,154 health controls of European ancestry, including data for 13,554,550 SNPs in 2018[14]. The genetic variations of depression and MDD come from the psychiatric genomics consortium (PGC)[15]. A systematic search was performed in the MR-Base database for all factors up to May 2022.
-
The genome-wide significance (P < 5 × 10⁻⁸) and independent inheritance (r2 < 0.001) associated with depression and MDD [without any linkage disequilibrium (LD)] were evaluated from the MR-base database. A search for proxy SNPs was conducted at R2 = 0.8 minimum LD and if it has no SNPs for a particular request from GWAS, summary statistics for the outcome. Four 2SMR methods, including inverse variance weighted (IVW), Mendelian randomization (MR-Egger), weighted median, and weighted mode, were used for the data analysis[16]. In addition, heterogeneity, multiple validity, and leave-one-out sensitivity analysis tests were performed. In the heterogeneity test, whenever risk factors were < 0.05 Q_pval, a random effects model was used to estimate the MR effect size and determine whether the risk factors were causally related to depression. In the pleiotropy test, horizontal pleiotropy between multiple valid instrumental variables (IVs) was tested using the MR-Egger intercept term to indicate if the intercept term is significantly different from zero (0 indicates the presence of horizontal pleiotropy). Finally, leave-one-out sensitivity analysis was used to test for the presence of SNPs that have a disproportionate effect on MR estimation. The IVW value was the main analytic parameter for all the analyses conducted using the 2SMR package in R (version 4.2.1; the R Foundation for Statistical Computing)[12].
-
The protein targets of the drugs for the significant diseases associated with MDD were selected for subsequent analyses. The genetic variants associated with the exposure measures were used as indicators to assess the causal effect based on the outcome factors selected from the MR-Base platform. We searched the DrugBank database with the term retrieve drugs and target genes for depression[11] to select the exposure factors. The search details included the drug name, DrugBank ID, target gene, target type, and the corresponding SNPs selected from the GTEx V8 catalog[17]. Data analysis was conducted using the 2SMR package in R software. The fixed-effect inverse variance weighted (FE-IVW) was selected as the main analysis method because it is the most reliable with IVs[15].
Additionally, the weighted median, weighted mode, and MR-Egger methods were used to improve the reliability of the causal inference. A P-value < 0.05 was selected as the discriminant criterion for statistical significance. Heterogeneity and pleiotropy tests were selected in the 2SMR package for subsequent analyses. Cochran’s Q statistics were calculated to explore the data heterogeneity, and the intercepted term of the MR-Egger was used to determine the presence of pleiotropy.
-
Data from 1,001 factors retrieved from the MR-base database were analyzed. The metabolites, disease, and risk factors were selected and collated to form 38 subcategories. The results contained 459 factors, 17,826 SNPs, and 15 subcategories of depression. The subcategories that were significantly (P-value < 0.05) associated with depression included amino acid, anthropometric, autoimmune/inflammatory, behavioral, diabetes, education, fatty acid, glycemic, lipid, nucleotide, peptide, personality, protein, psychiatric/neurological, and sleeping (Supplementary Table S1, available in www.besjournal.com). Additionally, the results contained 424 factors, 18,211 SNPs, and 7 MDD subcategories. The subcategories that were significantly (P-value < 0.05) associated with MDD included anthropometric, behavioral, education, glycemic, personality, psychiatric/neurological, and sleeping (Supplementary Table S2, available in www.besjournal.com).
-
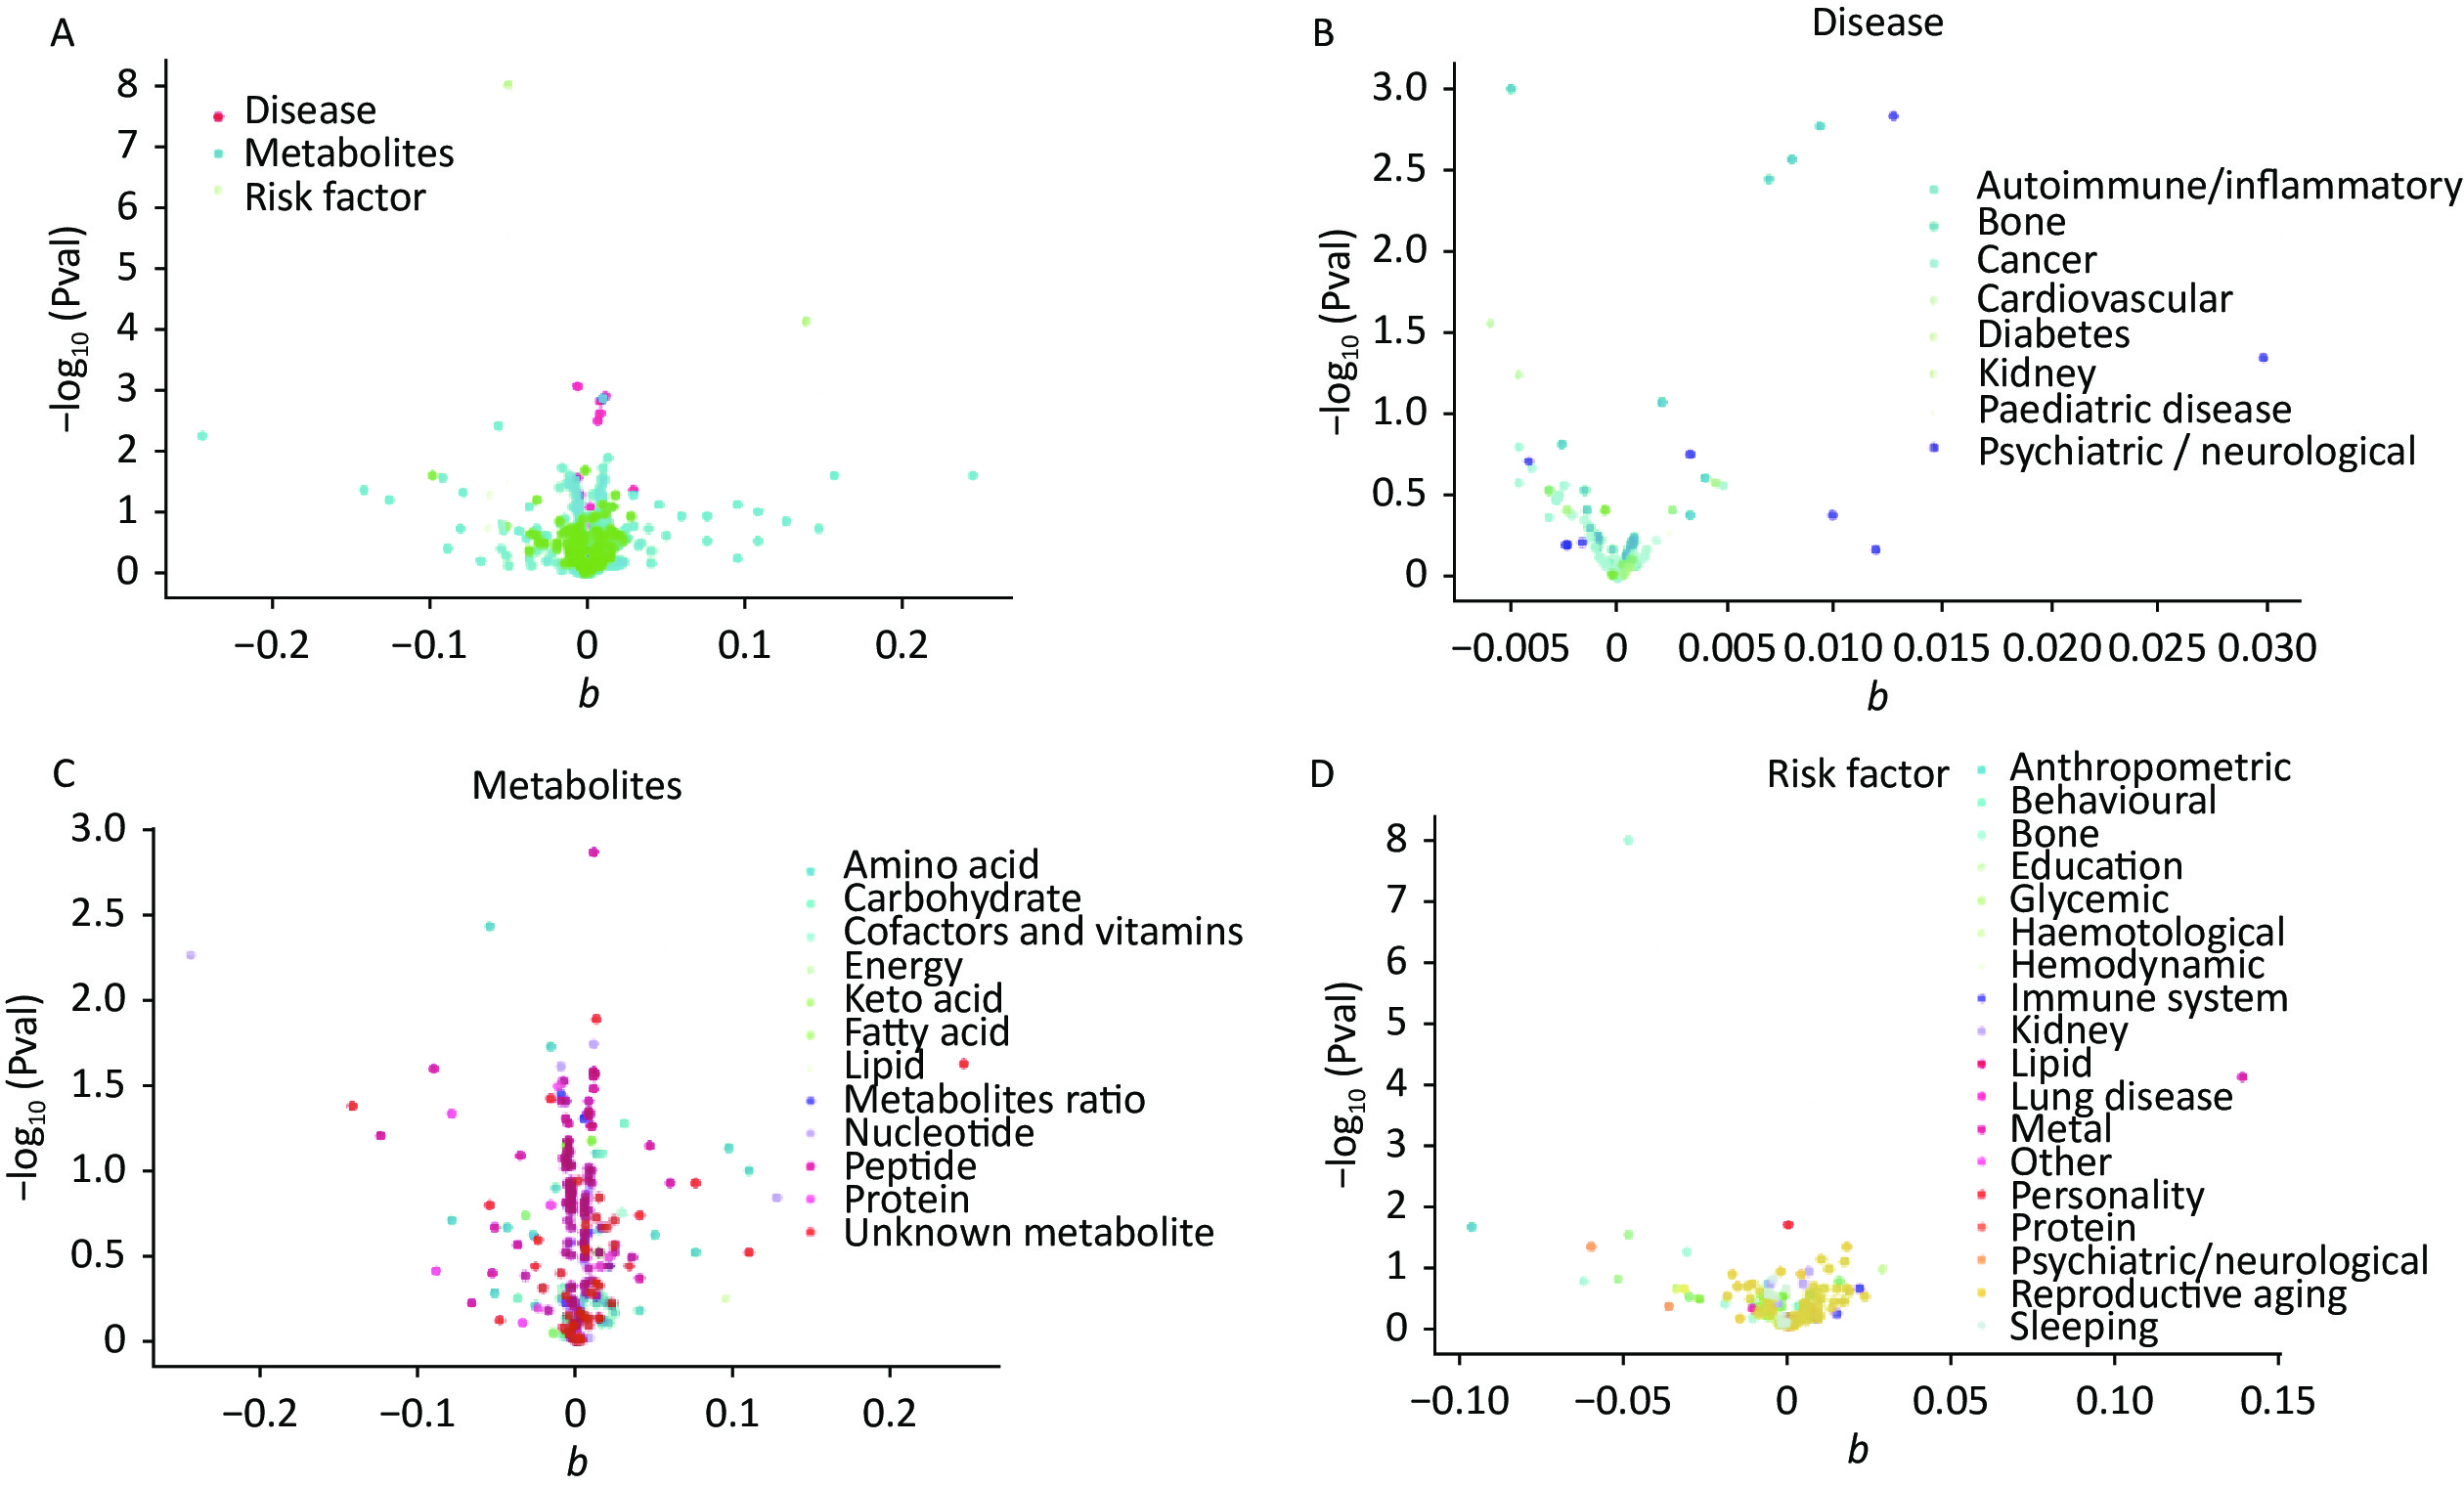
The IVW calculations for exposure factors, depression, and MDD were visualized in the MR-Base database. The x-axis represented the log change or the change caused by a decrease in each SD for the 459 and 424 selected traits, respectively. In contrast, the y-axis represented the reference evidence indicating a causal relationship between a single environmental factor and depression with -log10 (Pval) > 1.3 (P-value < 0.05). The three colors in the figure represent disease, metabolites, and risk factors, respectively. The overall distribution was symmetrical, but the levels of the three environmental factors were significantly different. Metabolic factors were predominant, followed by risk factors and diseases (Figure 2A). Psychiatric/neurological and autoimmune/inflammatory diseases were significantly associated with depression (Figure 2B). Moreover, amino acids, fatty acids, and peptides were the representative metabolites associated with the risk of depression (Figure 2C). Among the risk factors, education, behaviors, and anthropometrics were significantly associated with depression (Figure 2D). The overall distribution was symmetrical, showing that the risk factors were positively distributed (Figure 3A). Psychiatric/neurological and autoimmune/inflammatory diseases were significantly associated with the subcategories of depression (Figure 3B). Fatty acid, metabolite ratio, and lipid are significantly correlated with the risk of depression (Figure 3C). The risk factors significantly correlated with depression were education, anthropometrics, and lipid (Figure 3D).
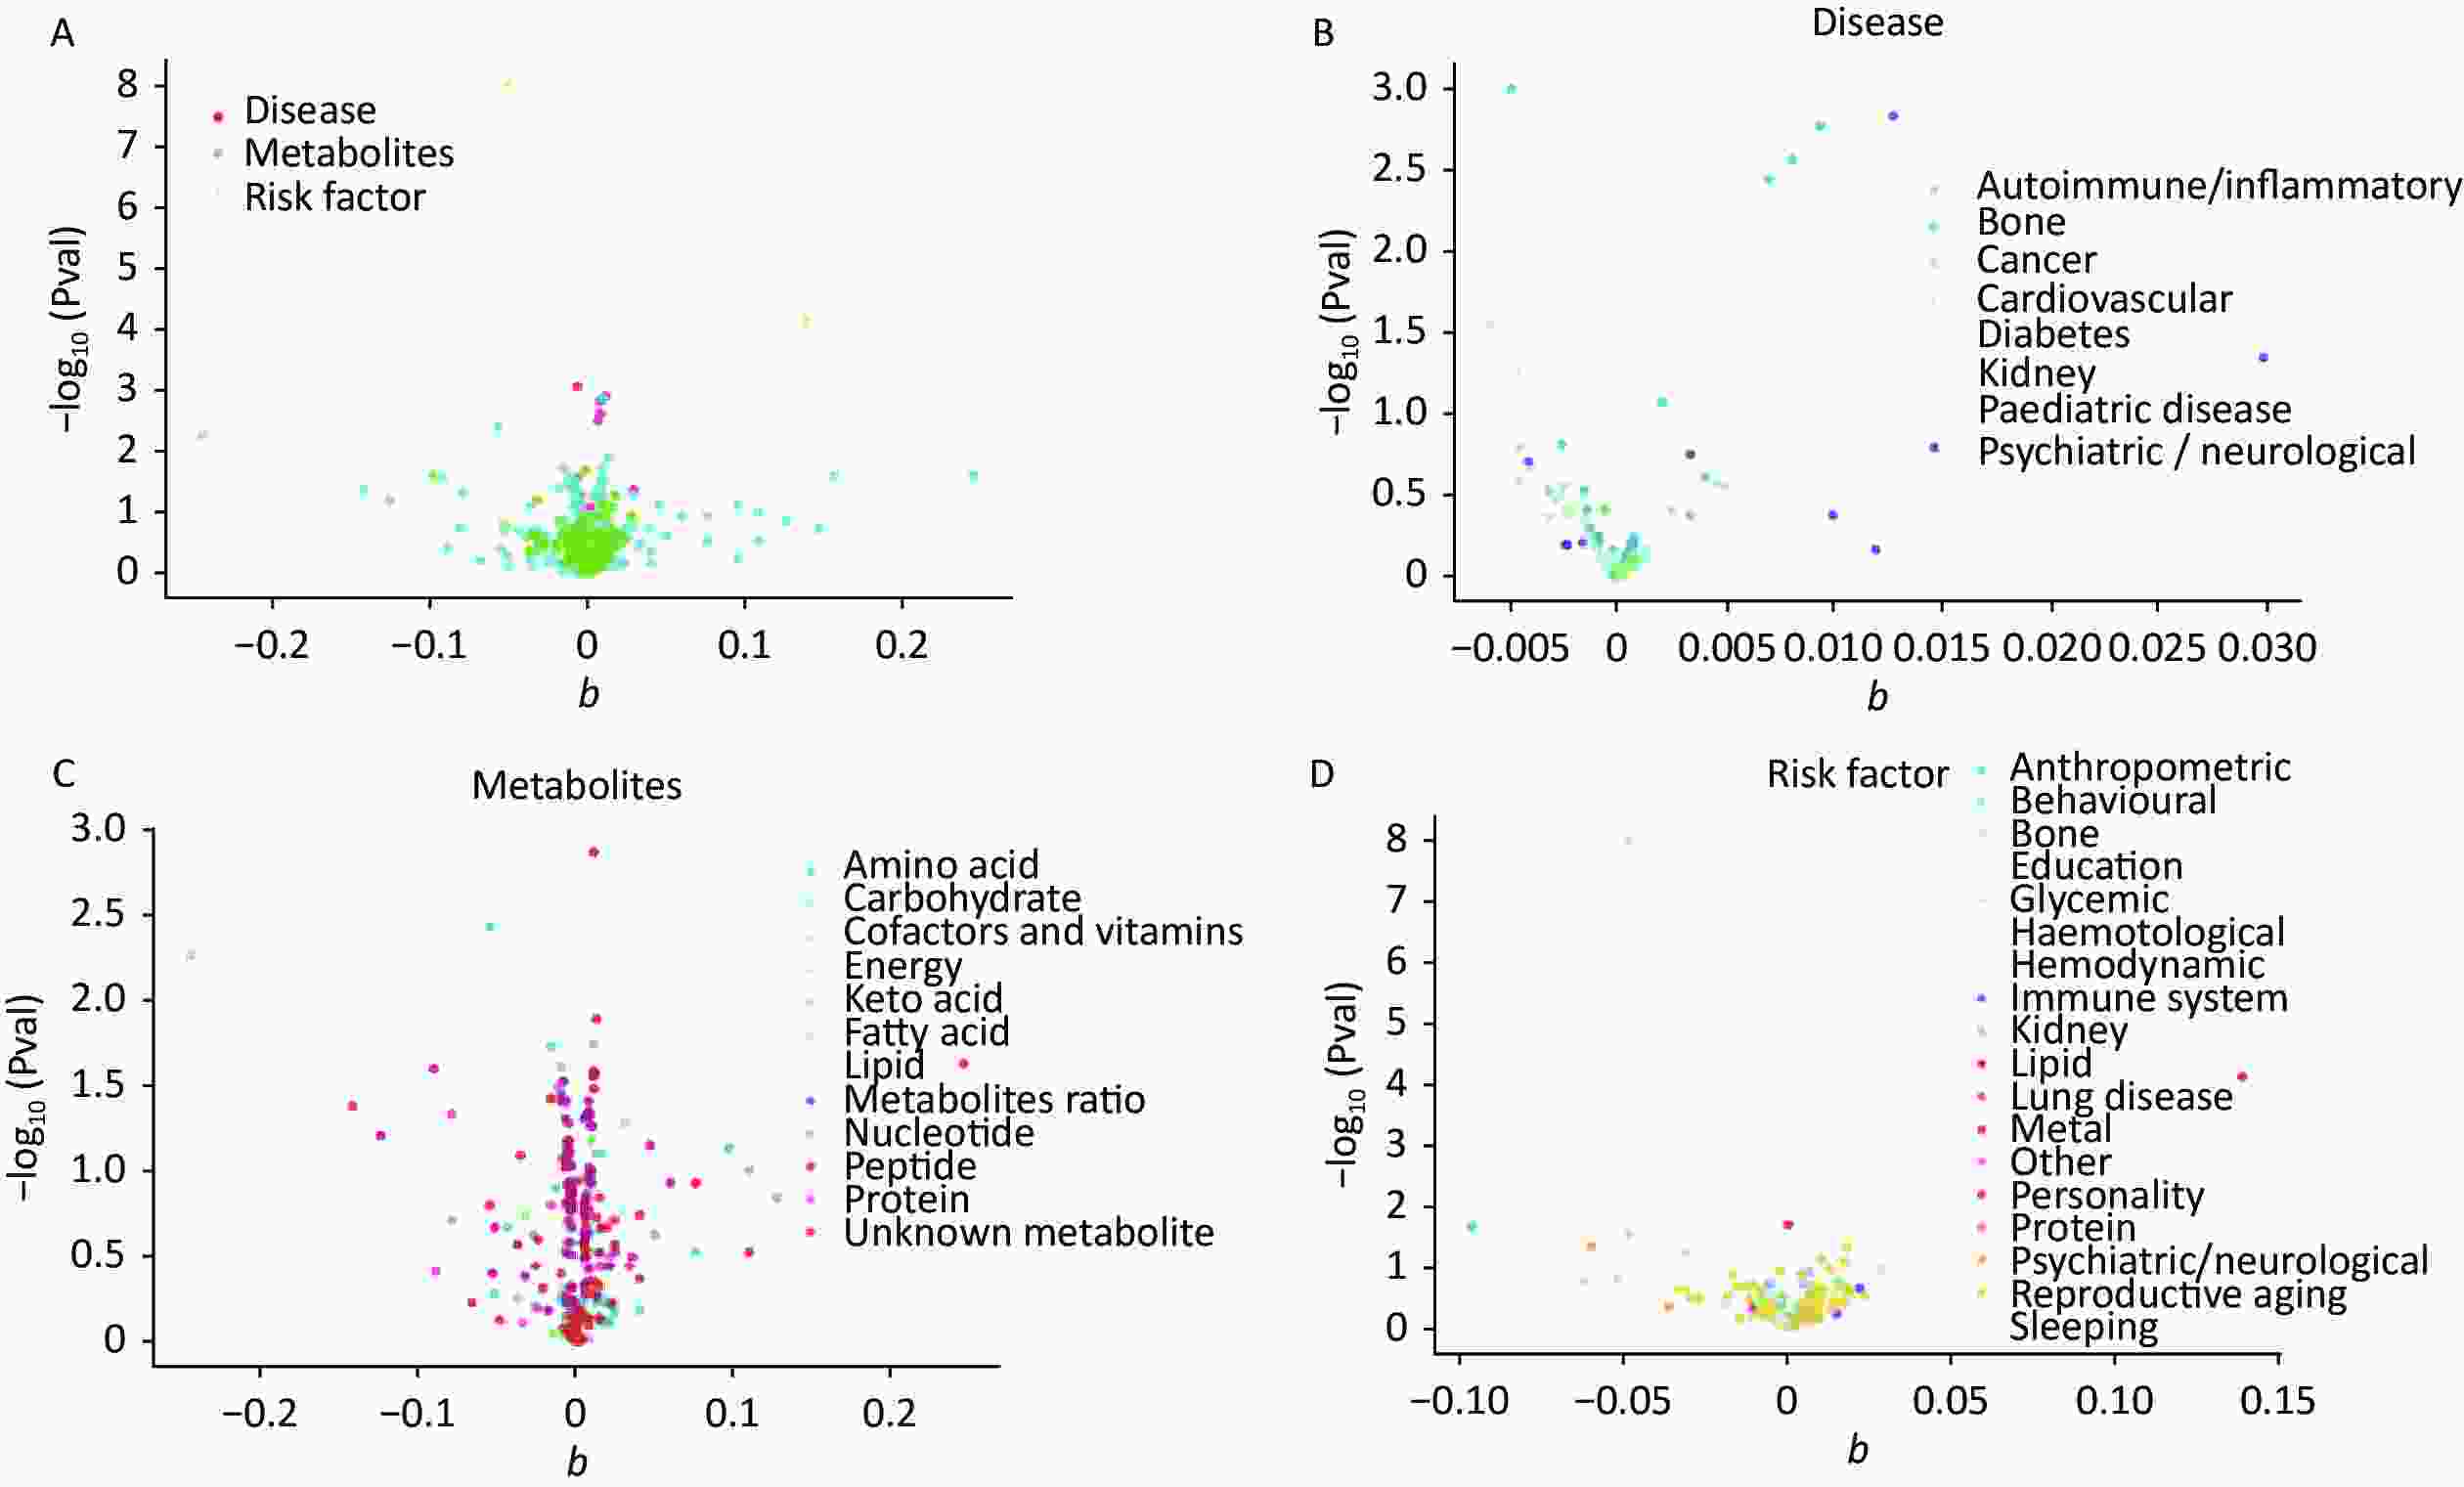
Figure 2. The x-axis shows the change of log OR caused by the decrease of each SD in 459 traits, and the y-axis displays the relevant P-value. Setting -log10 (Pval) > 1.3 (i.e. P-value < 0.05). (A) Effect of 459 traits on depression; (B) Effect of disease on depression; (C) Effect of metabolites on depression; (D) Effect of risk factor traits on depression. OR, odds ratio; SD, standard deviation
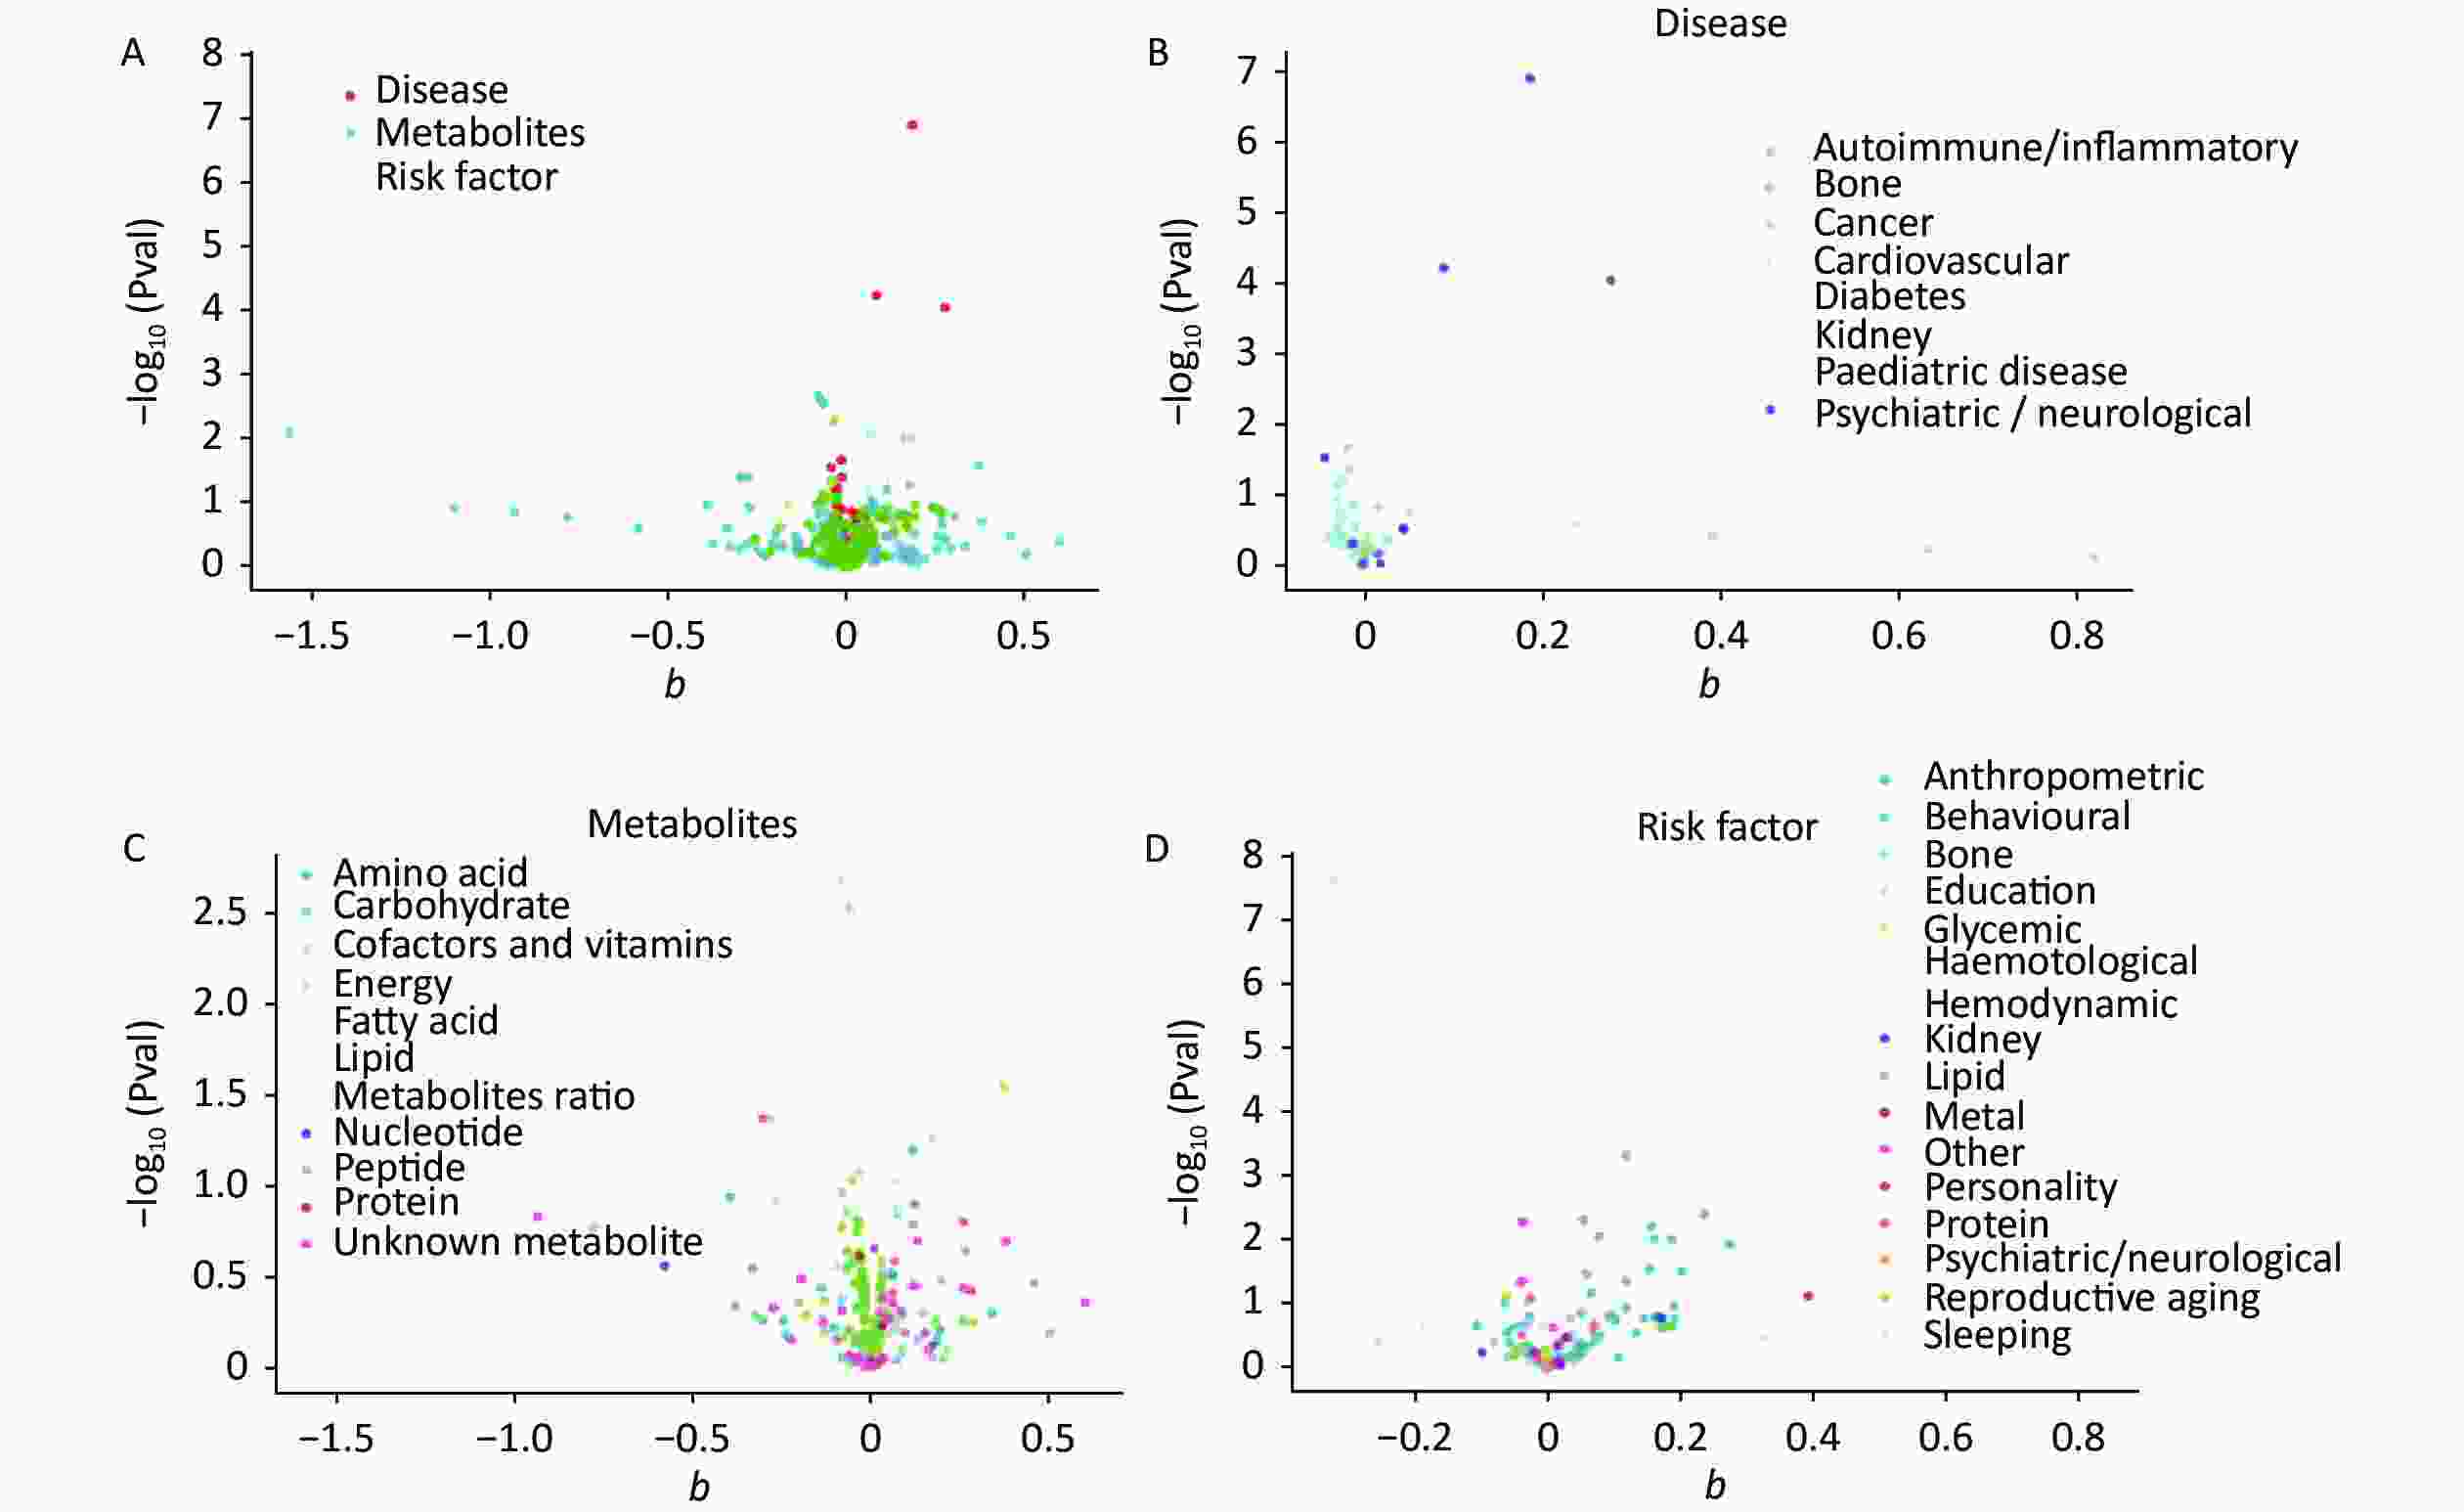
Figure 3. The x-axis shows the change of log OR caused by the decrease of each SD in 424 traits, and the y-axis displays the relevant P-value. Setting -log10 (Pval) > 1.3 (i.e. P-value < 0.05). (A) Effect of 459 traits on MDD; (B) Effect of disease on MDD; (C) Effect of metabolites on MDD; (D) Effect of risk factor traits on MDD. MDD, major depressive disorder; OR, odds ratio; SD, standard deviation.
-
The 1,001 environmental risk factors collected from the MR-Base database included 459 for depression and 43 factors with P < 0.05 (Supplementary Table S3, available in www.besjournal.com) (Figure 4). Laurate (IVW, OR = 0.78, 95% CI: 0.66–0.93, P = 0.01), alcohol consumption (IVW, OR = 0.91, 95% CI: 0.84–0.99, P = 0.02), 3-dehydrocarnitine (IVW, OR = 0.91, 95% CI: 0.84–0.99, P = 0.02), and chronotype (IVW, OR = 0.94, 95% CI: 0.98–1.00, P = 0.05) were significantly associated with decreased risk of depression. However, uridine (IVW, OR = 1.17, 95% CI: 1.02–1.34, P = 0.02) and neuroticism (IVW, OR = 1.15, 95% CI: 1.07–1.23, P < 0.01) (Table 1) were significantly associated with increased risk depression.
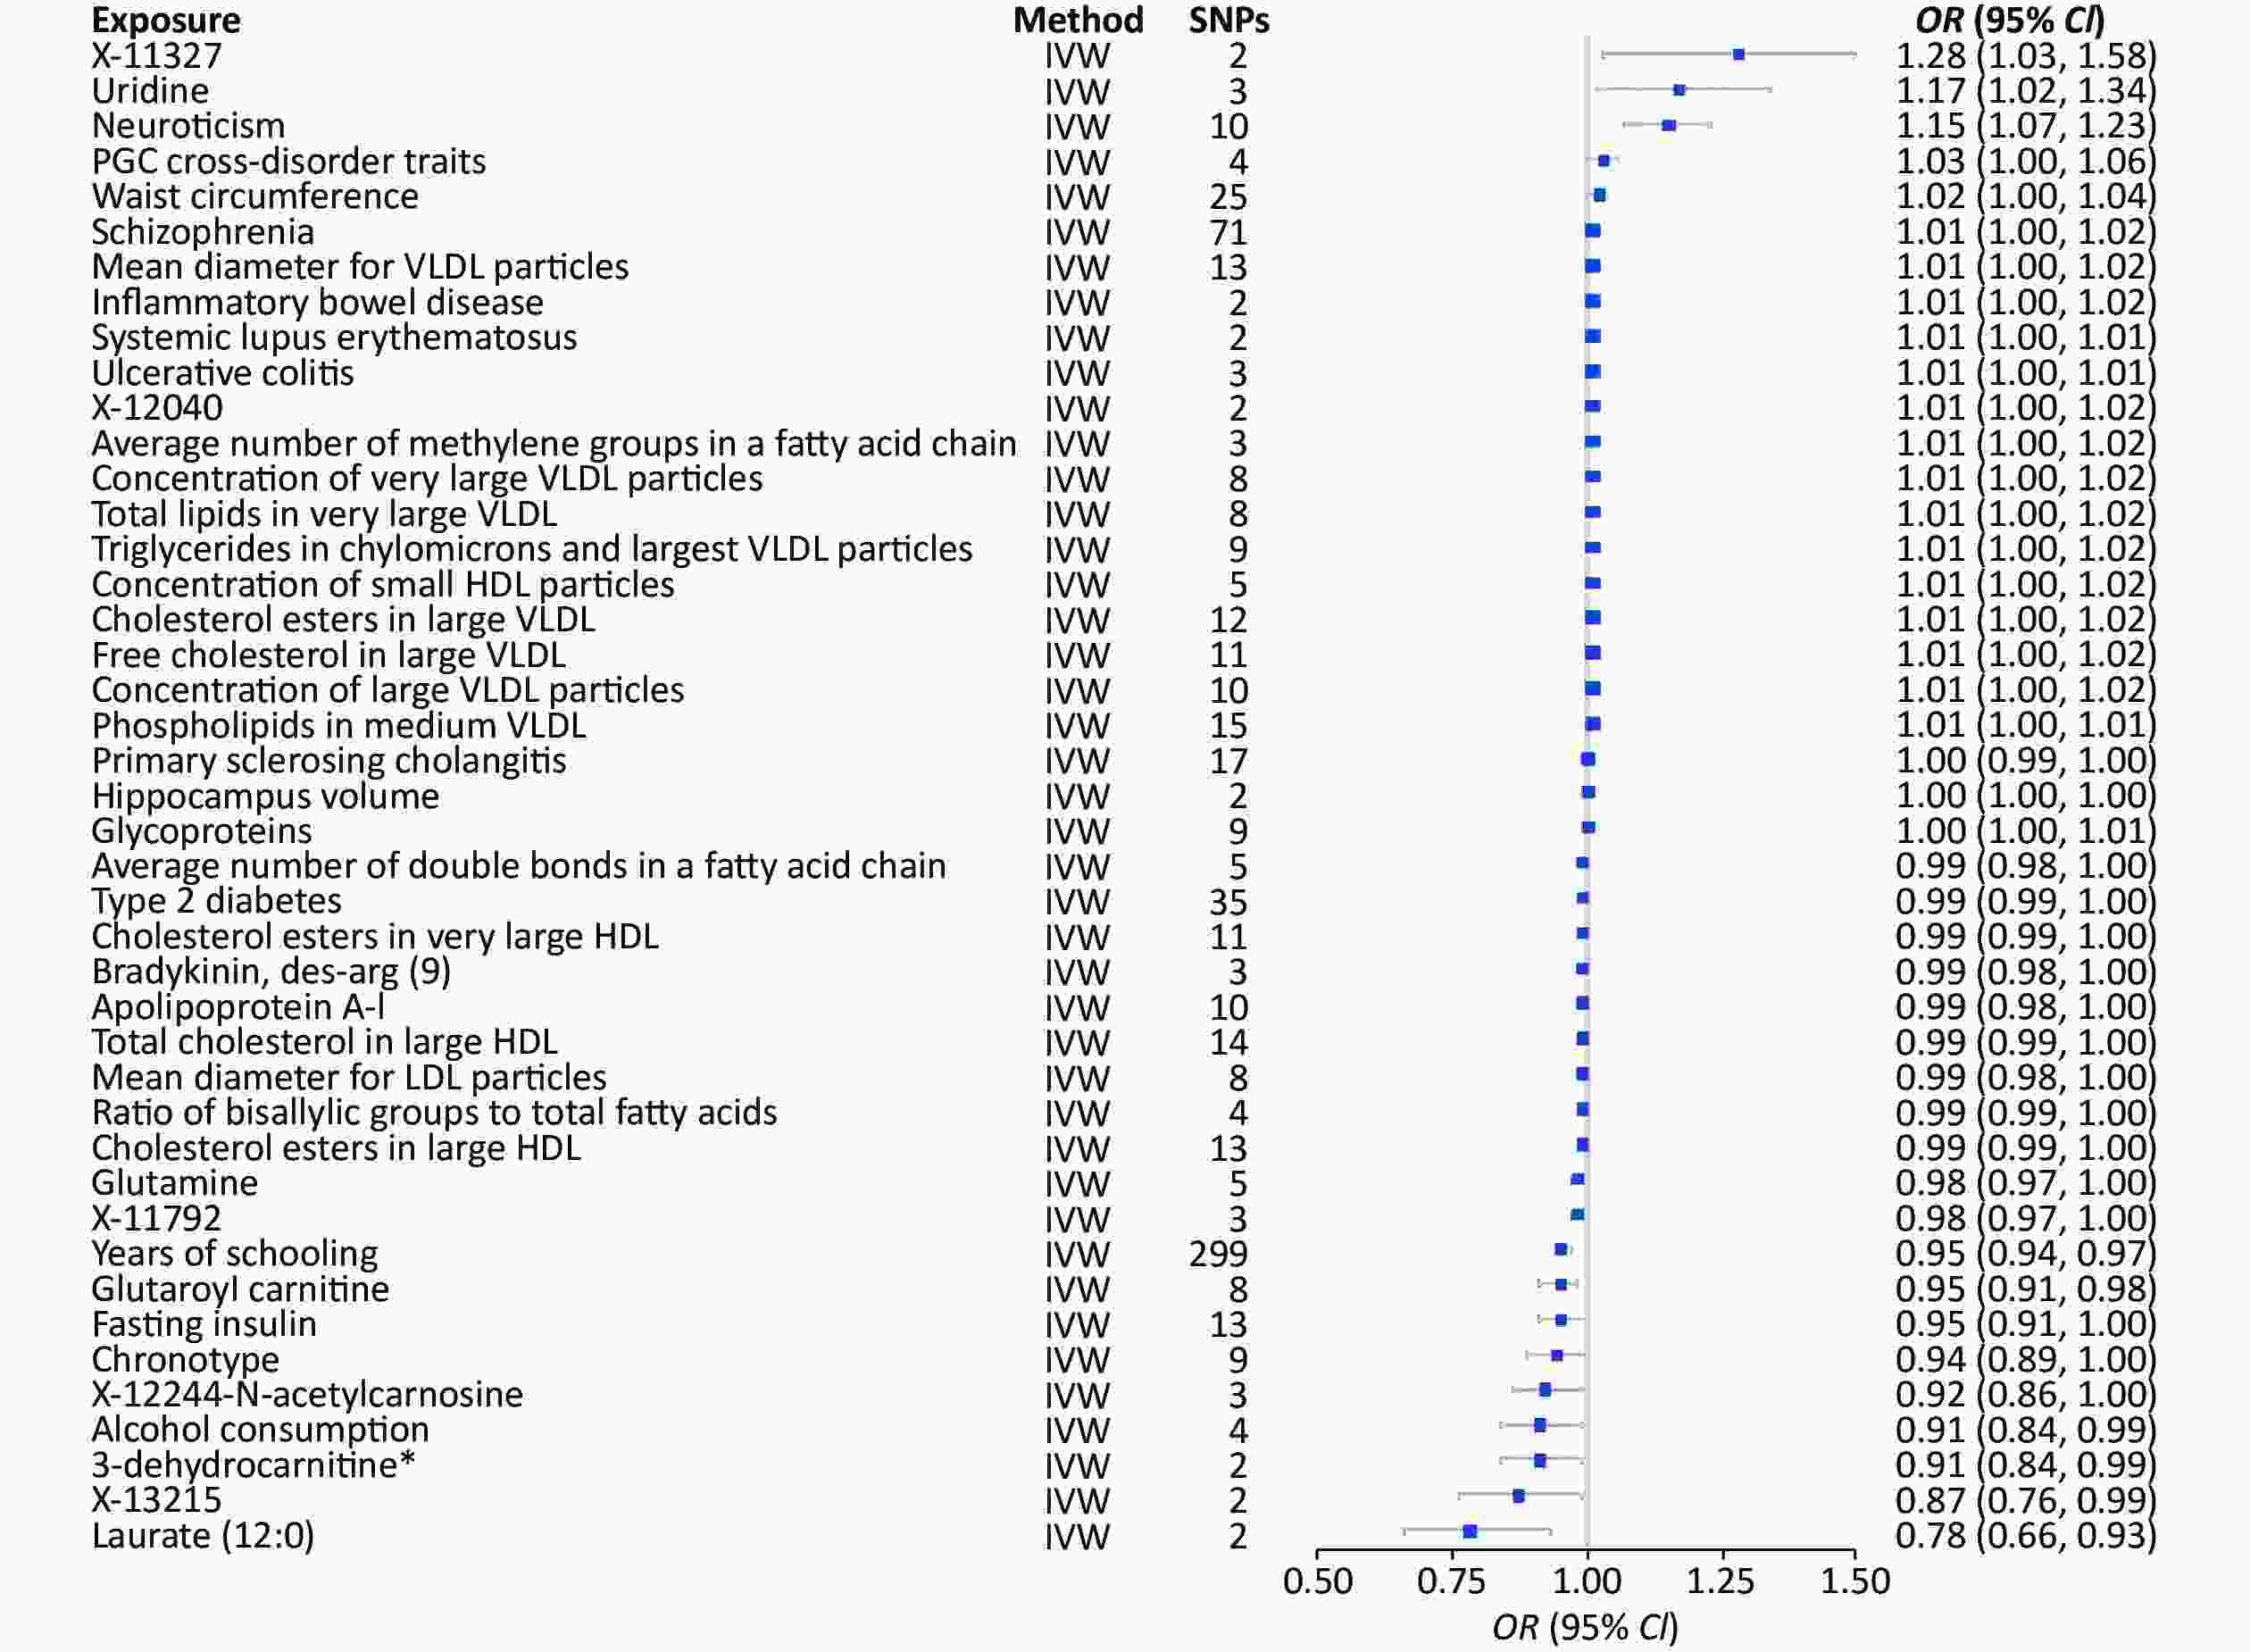
Figure 4. MR analysis of factors associated significantly with risk of depression. There are 43 different types of risk factors exposures on depression per unit of exposure. IVW: Inverse variance weighted; SNP: single nucleotide polymorphisms; MR, Mendelian randomization; OR: odds ratio; SD, standard deviation.
Table 1. 2SMR estimates of the significant results in depression
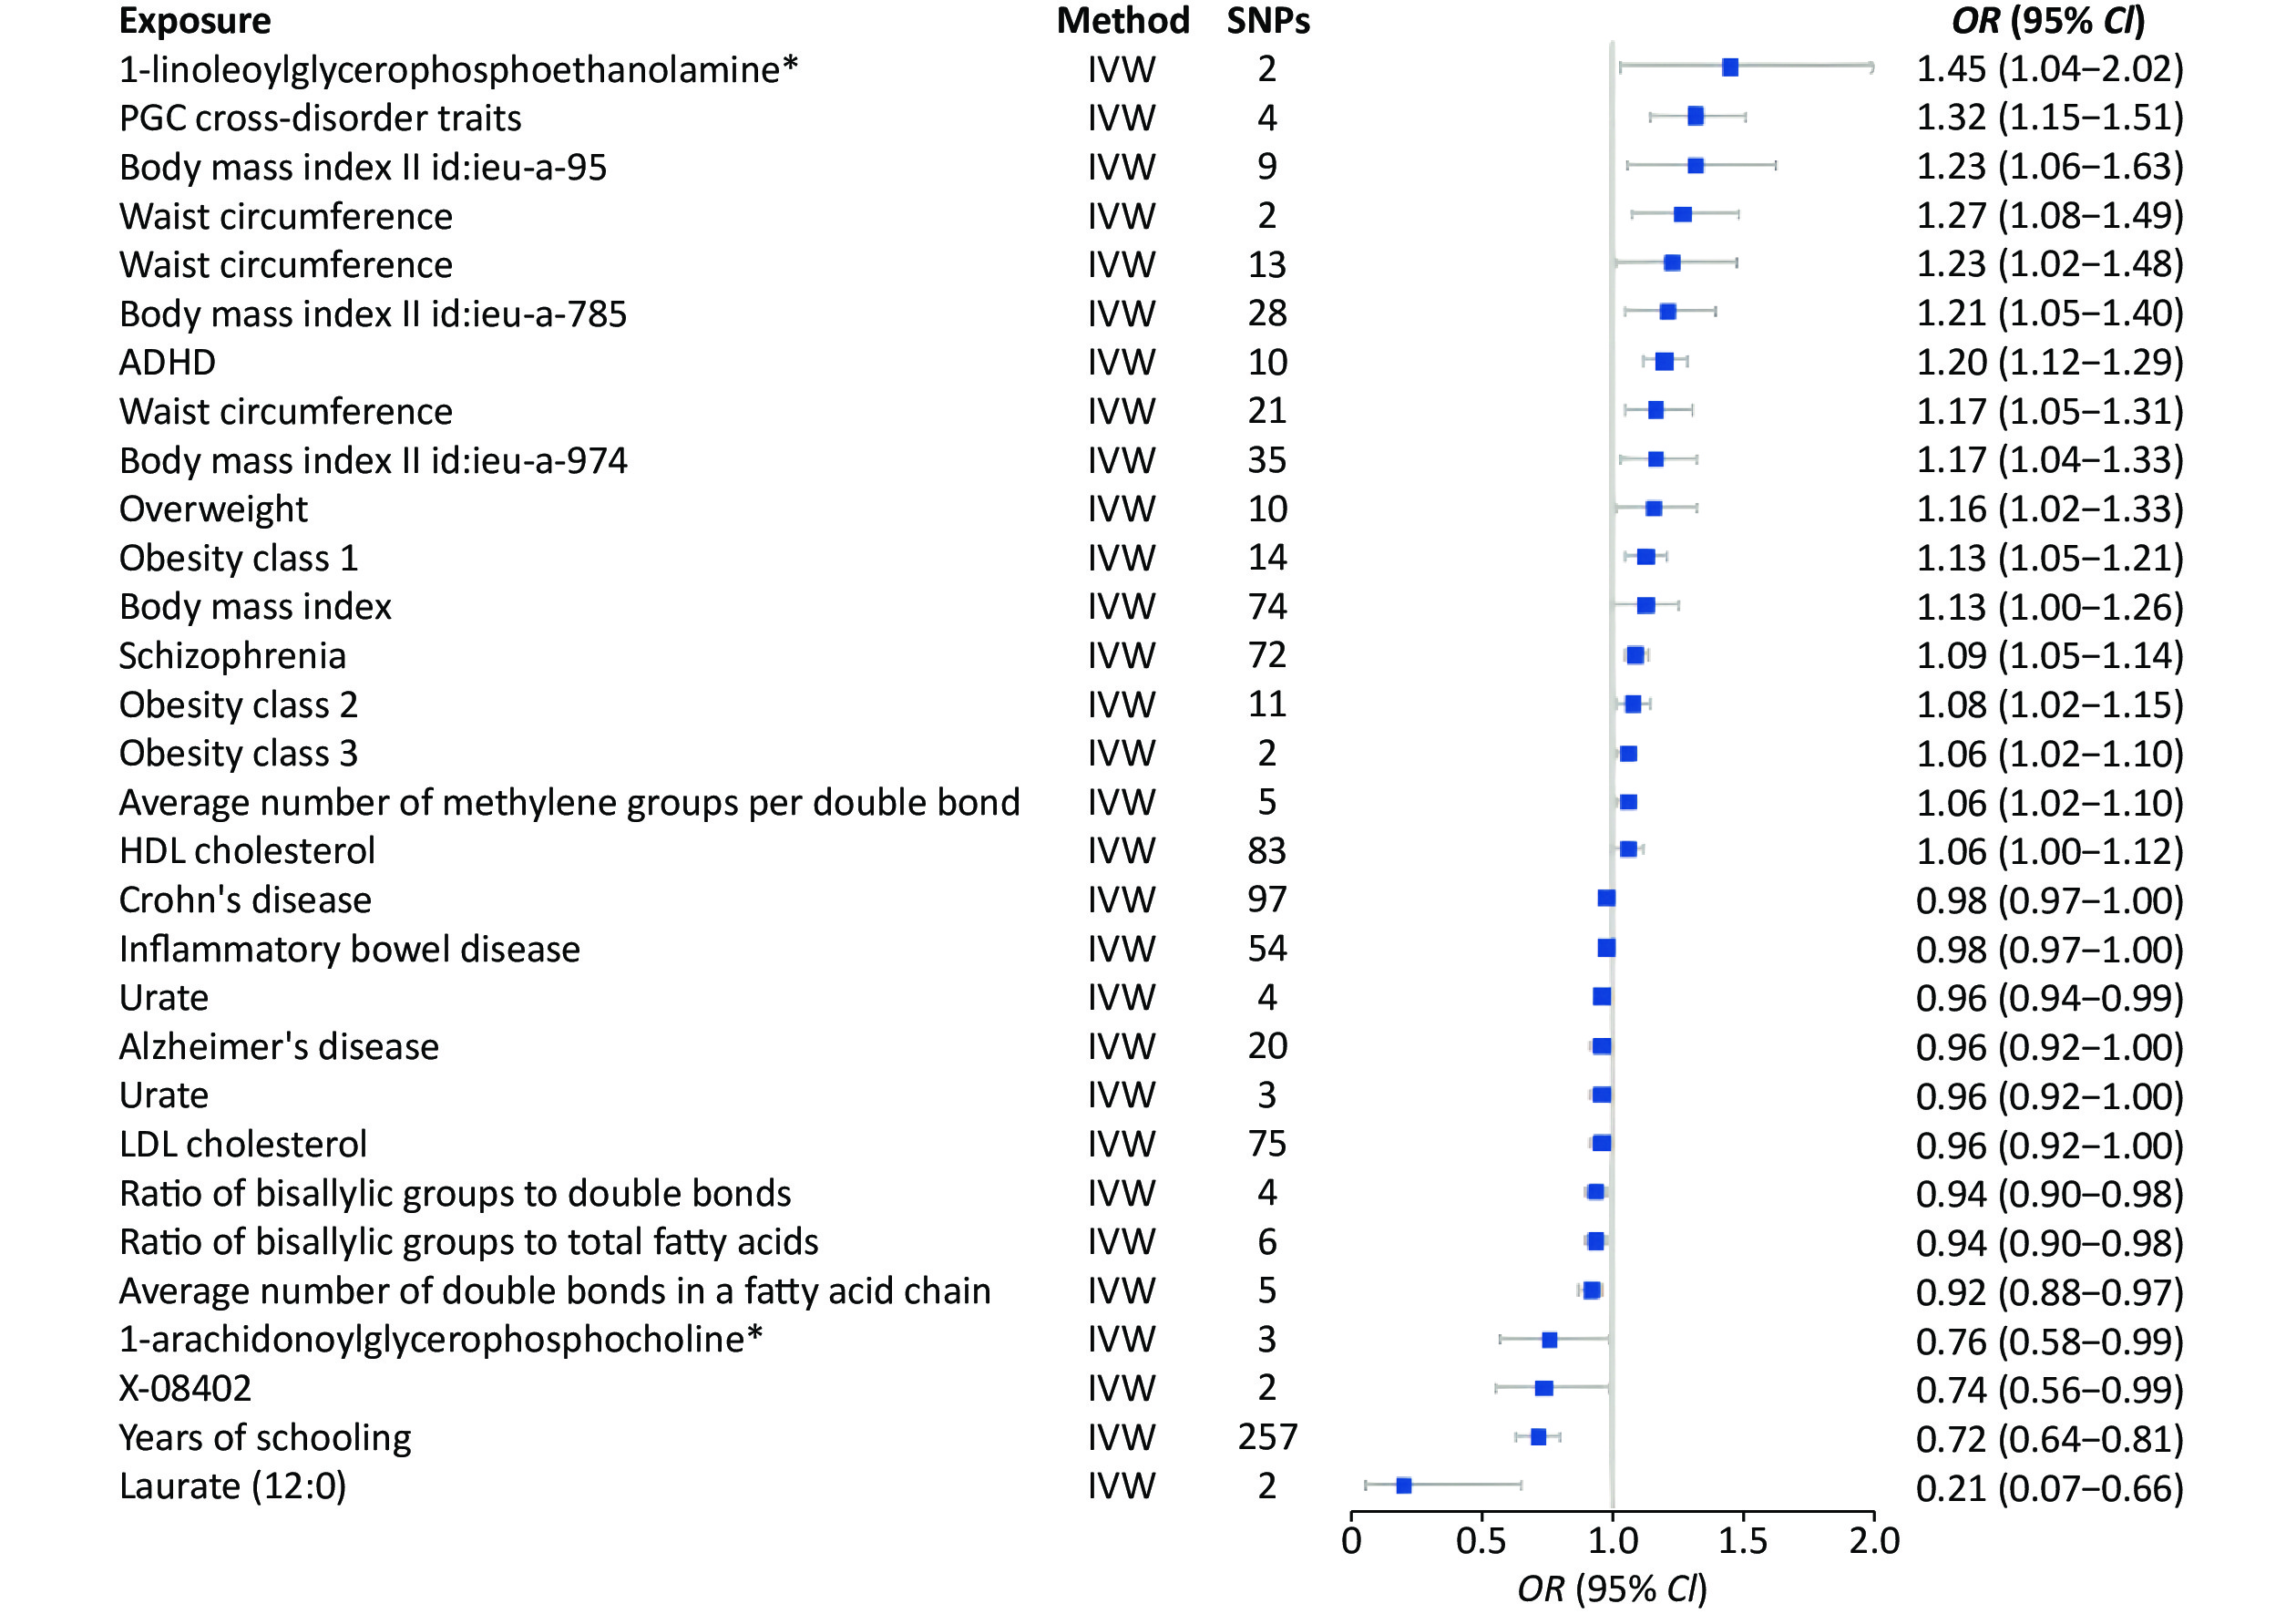
Study Method SNP (n) OR 95% CI P-value Years of schooling || id: ieu-a-1239 Inverse variance weighted 299 0.95 0.94−0.97 9.62 × 10⁻⁹ Neuroticism || id: ieu-a-1007 Inverse variance weighted 10 1.15 1.07−1.23 7.39 × 10⁻⁵ Primary sclerosing cholangitis || id: ieu-a-1112 Inverse variance weighted 17 1.00 0.99−1.00 8.47 × 10⁻⁴ Schizophrenia || id: ieu-a-22 Inverse variance weighted 71 1.01 1.00−1.02 1.21 × 10⁻³ Mean diameter for VLDL particles || id: met-c-941 Inverse variance weighted 13 1.01 1.00−1.02 1.36 × 10⁻³ Inflammatory bowel disease || id: ieu-a-295 Inverse variance weighted 2 1.01 1.00−1.02 1.41 × 10⁻³ Systemic lupus erythematosus || id: ieu-a-815 Inverse variance weighted 2 1.01 1.00−1.01 2.37 × 10⁻³ Ulcerative colitis || id: ieu-a-971 Inverse variance weighted 3 1.01 1.00−1.01 3.13 × 10⁻³ Glutaroyl carnitine || id: met-a-699 Inverse variance weighted 8 0.95 0.91−0.98 3.66 × 10⁻³ Laurate (12:0) || id: met-a-350 Inverse variance weighted 2 0.78 0.66−0.93 0.01 X-12040 || id: met-a-568 Inverse variance weighted 2 1.01 1.00−1.02 0.01 Average number of methylene groups in a fatty acid chain || id: met-c-848 Inverse variance weighted 3 1.01 1.00−1.02 0.02 Glutamine || id: met-c-860 Inverse variance weighted 5 0.98 0.97−1.00 0.02 Hippocampus volume || id: ieu-a-1045 Inverse variance weighted 2 1.00 1.00 0.02 Alcohol consumption || id: ieu-a-1283 Inverse variance weighted 4 0.91 0.84−0.99 0.02 X-11327 || id: met-a-498 Inverse variance weighted 2 1.28 1.03−1.58 0.02 Uridine || id: met-a-316 Inverse variance weighted 3 1.17 1.02−1.34 0.02 Average number of double bonds in a fatty acid chain || id: met-c-851 Inverse variance weighted 5 0.99 0.98−1.00 0.02 Type 2 diabetes || id: Ieu-a-24 Inverse variance weighted 35 0.99 0.99−1.00 0.03 3-dehydrocarnitine* || id: met-a-500 Inverse variance weighted 2 0.91 0.84−0.99 0.03 Concentration of very large VLDL particles || id: met-c-950 Inverse variance weighted 8 1.01 1.00−1.02 0.03 Total lipids in very large VLDL || id: met-c-949 Inverse variance weighted 8 1.01 1.00−1.02 0.03 Triglycerides in chylomicrons and largest VLDL particles || id: met-c-960 Inverse variance weighted 9 1.01 1.00−1.02 0.03 Cholesterol esters in very large HDL || id: met-c-943 Inverse variance weighted 11 0.99 0.99−1.00 0.03 Fasting insulin || id: ieu-b-116 Inverse variance weighted 13 0.95 0.91−1.00 0.03 Bradykinin, des-arg (9) || id: met-a-656 Inverse variance weighted 3 0.99 0.98−1.00 0.03 Concentration of small HDL particles || id: met-c-922 Inverse variance weighted 5 1.01 1.00−1.02 0.03 Apolipoprotein A-I || id: met-c-842 Inverse variance weighted 10 0.99 0.98−1.00 0.04 X-11792 || id: met-a-542 Inverse variance weighted 3 0.98 0.97−1.00 0.04 Total cholesterol in large HDL || id: met-c-874 Inverse variance weighted 14 0.99 0.99−1.00 0.04 Mean diameter for LDL particles || id: met-c-896 Inverse variance weighted 8 0.99 0.98−1.00 0.04 Cholesterol esters in large VLDL || id: met-c-887 Inverse variance weighted 12 1.01 1.00−1.02 0.04 Ratio of bisallylic groups to total fatty acids || id: met-c-845 Inverse variance weighted 4 0.99 0.99−1.00 0.04 X-13215 || id: met-a-675 Inverse variance weighted 2 0.87 0.76−0.99 0.04 PGC cross-disorder traits || id: ieu-a-803 Inverse variance weighted 4 1.03 1.00−1.06 0.04 Free cholesterol in large VLDL || id: met-c-888 Inverse variance weighted 11 1.01 1.00−1.02 0.05 X-12244--N-acetylcarnosine || id: met-a-596 Inverse variance weighted 3 0.92 0.86−1.00 0.05 Concentration of large VLDL particles || id: met-c-890 Inverse variance weighted 10 1.01 1.00−1.02 0.05 Phospholipids in medium VLDL || id: met-c-914 Inverse variance weighted 15 1.01 1.00−1.01 0.05 Waist circumference || id: ieu-a-68 Inverse variance weighted 25 1.02 1.00−1.04 0.05 Chronotype || id: ieu-a-1087 Inverse variance weighted 9 0.94 0.89−1.00 0.05 Cholesterol esters in large HDL || id: met-c-875 Inverse variance weighted 13 0.99 0.99−1.00 0.05 Note. 2SMR, two-sample mendelian randomization; SNP, single nucleotide polymorphism. Furthermore, the 1,001 environmental risk factors collected from the MR-Base database included 424 results for MDD, and MDD was considered an outcome factor (Supplementary Table S4, available in www.besjournal.com). Thirty environmental risk factors were associated with MDD (Figure 5). Laurate (IVW, OR = 0.21, 95% CI: 0.07−0.66, P < 0.01), years of education (IVW, OR = 0.72, 95% CI: 0.64−0.81, P < 0.01), and the ratio of bisallylic groups to double bonds (IVW, OR = 0.94, 95% CI: 0.90−0.98, P < 0.01) were significantly associated with the decreased risk of MDD. The risk factors significantly correlated with increased risk factors included PGC cross-disorder traits (IVW, OR = 1.32, 95% CI: 1.15−1.51, P < 0.01), attention deficit hyperactivity disorder (ADHD) (IVW, OR = 1.20, 95% CI: 1.12−1.29, P < 0.01), and obesity class 1 (IVW, OR = 1.13, 95% CI: 1.05−1.21, P < 0.01) (Table 2).
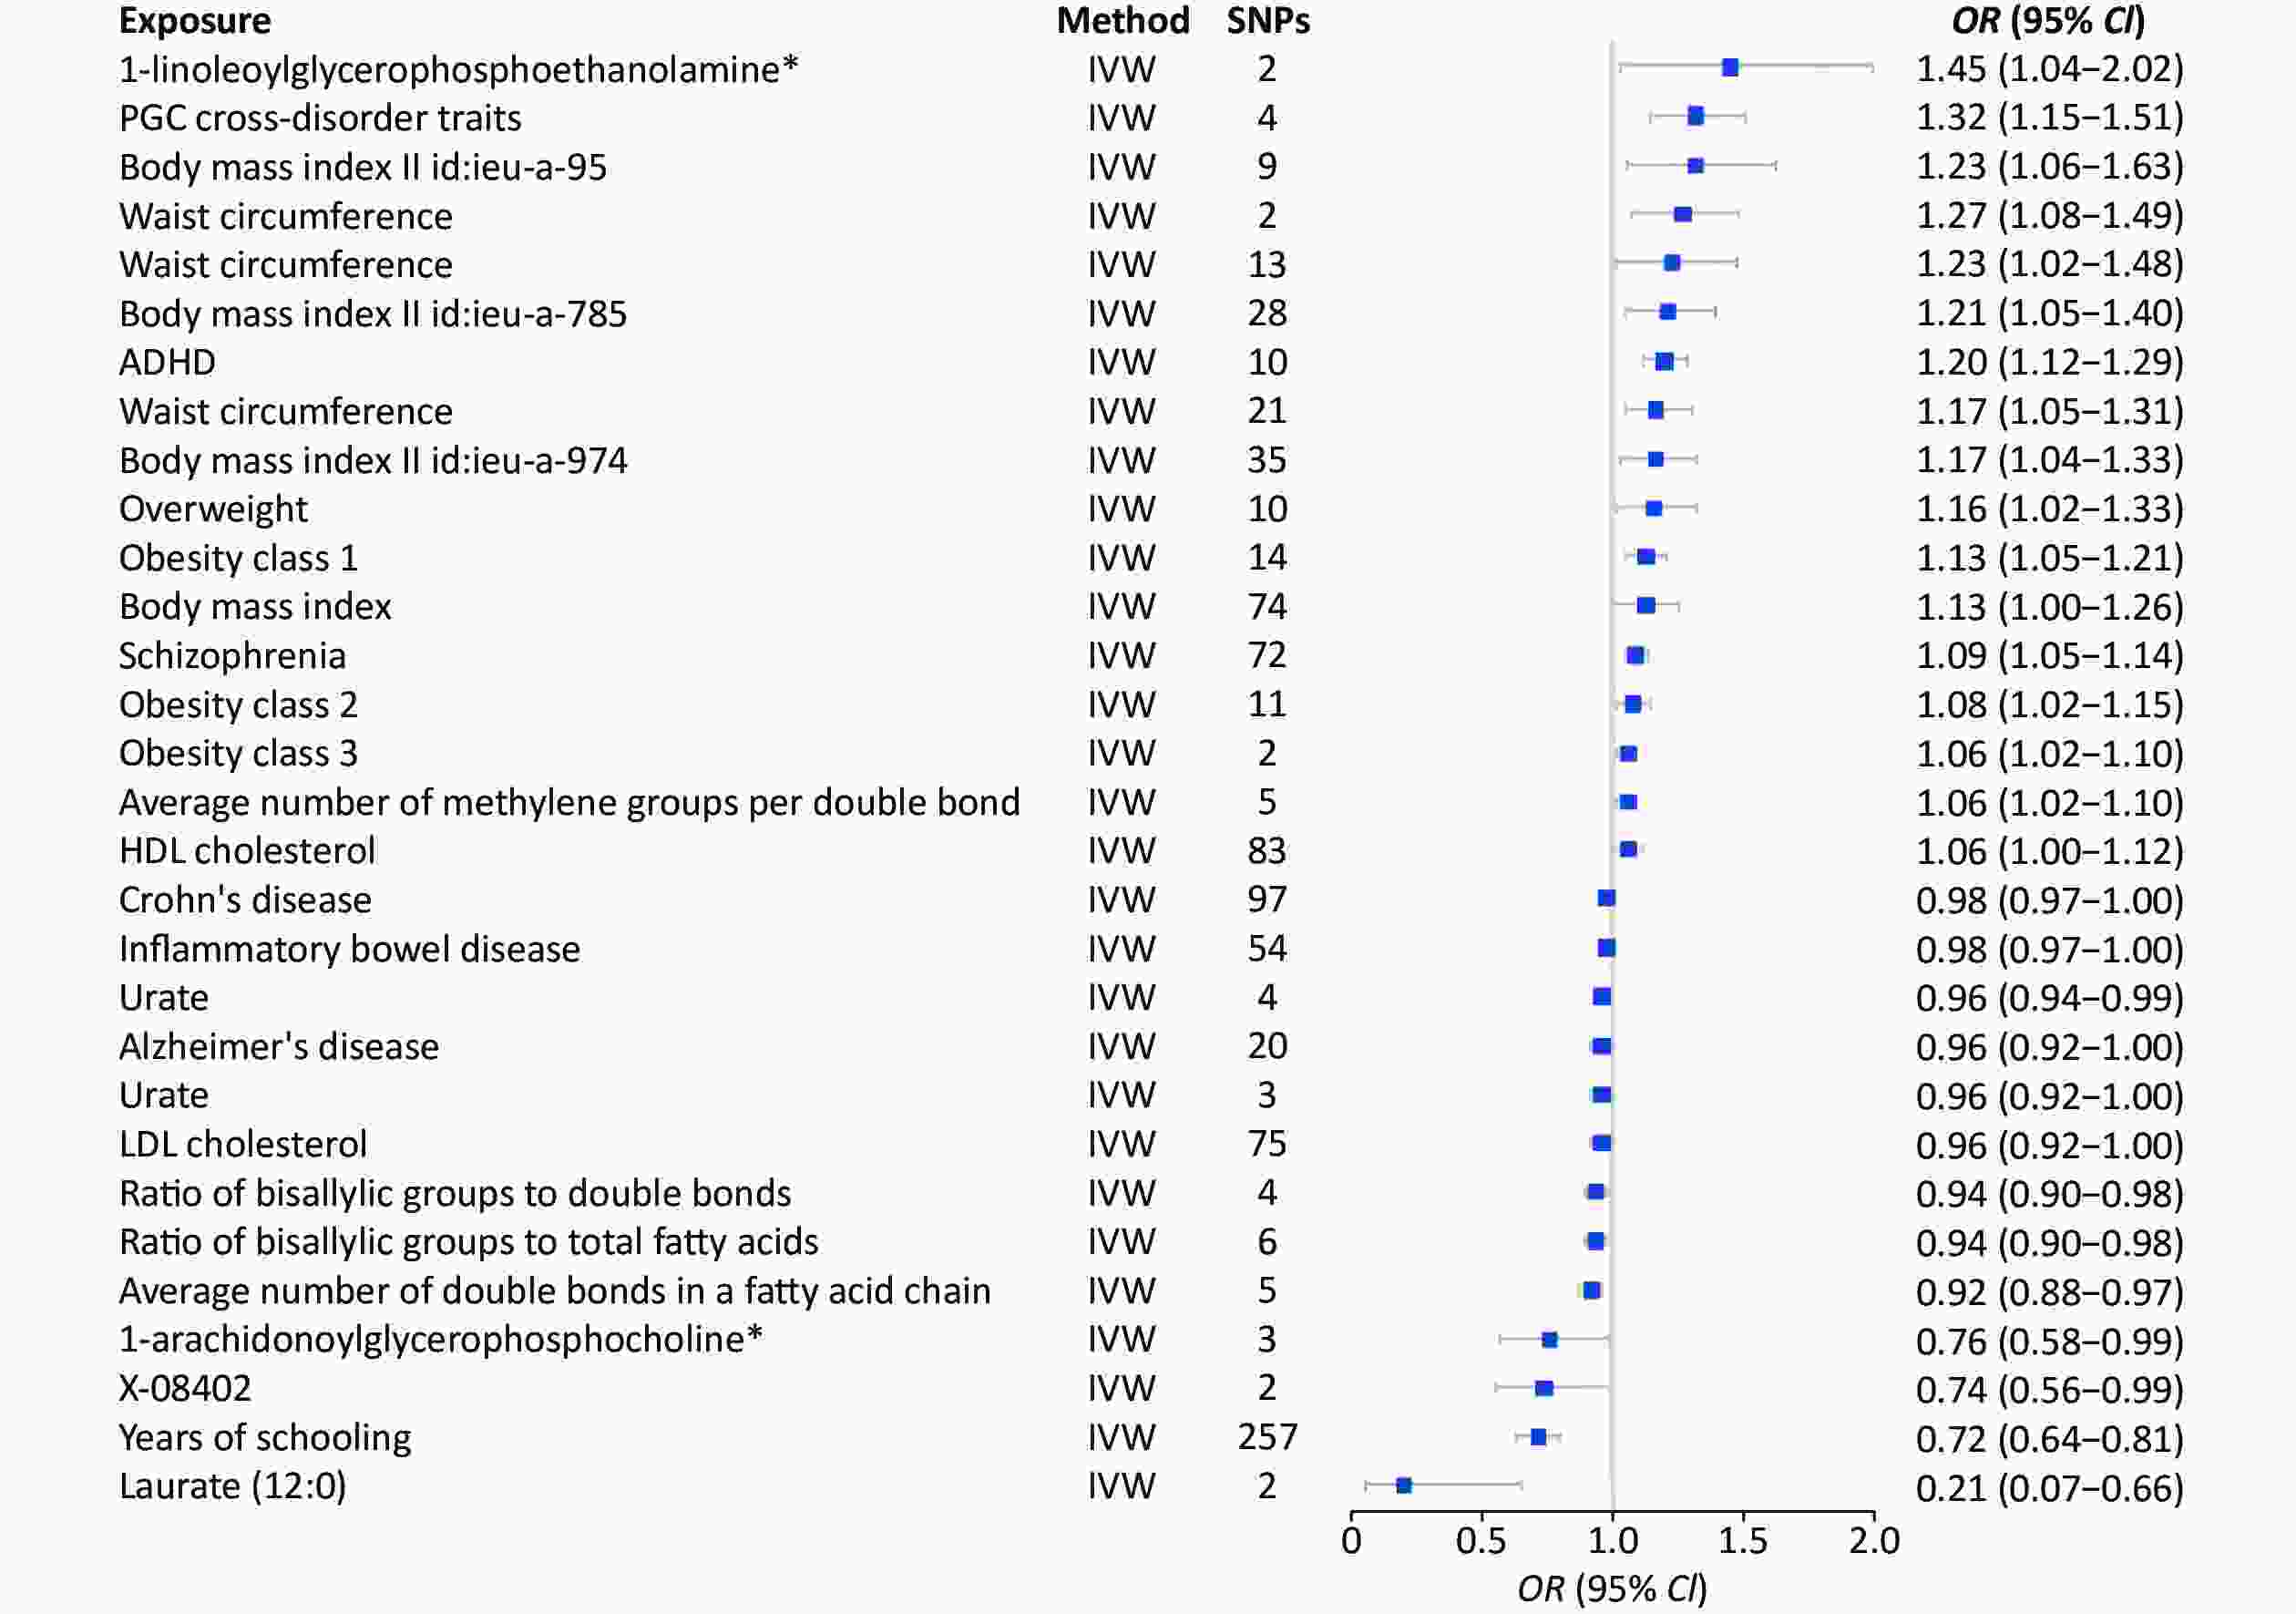
Figure 5. MR analysis of factors associated significantly with risk of MDD. There are 30 different types of risk factors exposures on MDD per unit of exposure. IVW: Inverse variance weighted; SNP: single nucleotide polymorphisms; MDD, major depressive disorder; MR, Mendelian randomization; OR: odds ratio.
Table 2. 2SMR estimates of the significant results in MDD
Study Method SNP (n) OR 95% CI P-value Years of schooling || id: ieu-a-1239 Inverse variance weighted 257 0.72 0.64−0.81 2.31 × 10⁻⁸ ADHD || id: ieu-a-1183 Inverse variance weighted 10 1.2 1.12−1.29 1.20 × 10⁻⁷ Schizophrenia || id: ieu-a-22 Inverse variance weighted 72 1.09 1.05-1.14 5.68 × 10⁻⁵ PGC cross-disorder traits || id: ieu-a-803 Inverse variance weighted 4 1.32 1.15−1.51 8.52 × 10⁻⁵ Obesity class 1 || id: ieu-a-90 Inverse variance weighted 14 1.13 1.05−1.21 4.90 × 10⁻⁴ Average number of double bonds in a fatty acid chain || id: met-c-851 Inverse variance weighted 5 0.92 0.88-0.97 2.01 × 10⁻³ Ratio of bisallylic groups to double bonds || id: met-c-844 Inverse variance weighted 4 0.94 0.90−0.98 2.80 × 10⁻³ Ratio of bisallylic groups to total fatty acids || id: met-c-845 Inverse variance weighted 6 0.94 0.9-0.98 2.88 × 10⁻³ Waist circumference || id: ieu-a-102 Inverse variance weighted 2 1.27 1.08−1.49 4.10 × 10⁻³ Obesity class 3 || id: ieu-a-92 Inverse variance weighted 2 1.06 1.02−1.1 4.96 × 10⁻³ Urate || id: ieu-a-789 Inverse variance weighted 4 0.96 0.94−0.99 0.01 Waist circumference || id: ieu-a-69 Inverse variance weighted 21 1.17 1.05−1.31 0.01 Laurate (12:0) || id: met-a-350 Inverse variance weighted 2 0.21 0.07−0.66 0.01 Average number of methylene groups per double bond || id: met-c-847 Inverse variance weighted 5 1.06 1.02−1.1 0.01 Obesity class 2 || id: ieu-a-91 Inverse variance weighted 11 1.08 1.02−1.15 0.01 Body mass index || id: ieu-a-974 Inverse variance weighted 35 1.17 1.04−1.33 0.01 Body mass index || id: ieu-a-785 Inverse variance weighted 28 1.21 1.05−1.4 0.01 Body mass index || id: ieu-a-95 Inverse variance weighted 9 1.32 1.06−1.63 0.01 Crohn's disease || id: ieu-a-10 Inverse variance weighted 97 0.98 0.97−1 0.02 1-linoleoylglycerophosphoethanolamine* || id: met-a-497 Inverse variance weighted 2 1.45 1.04−2.02 0.03 Overweight || id: ieu-a-93 Inverse variance weighted 10 1.16 1.02−1.33 0.03 Alzheimer's disease || id: ieu-a-298 Inverse variance weighted 20 0.96 0.92−1 0.03 Waist circumference || id: ieu-a-65 Inverse variance weighted 13 1.23 1.02−1.48 0.03 HDL cholesterol || id: ieu-a-299 Inverse variance weighted 83 1.06 1−1.12 0.04 X-08402 || id: met-a-426 Inverse variance weighted 2 0.74 0.56−0.99 0.04 1-arachidonoylglycerophosphocholine* || id: met-a-558 Inverse variance weighted 3 0.76 0.58−0.99 0.04 Inflammatory bowel disease || id: ieu-a-31 Inverse variance weighted 54 0.98 0.97−1 0.04 Body mass index || id: ieu-a-2 Inverse variance weighted 74 1.13 1−1.26 0.04 Urate || id: ieu-a-797 Inverse variance weighted 3 0.96 0.92−1 0.04 LDL cholesterol || id: ieu-a-300 Inverse variance weighted 75 0.96 0.92−1 0.05 Note. MDD, major depressive disorder; MR, Mendelian randomization; SNP, single nucleotide polymorphism. We performed heterogeneity tests, multiple validity tests, and leave-one-out sensitivity analyses for each significant outcome. The heterogeneity analysis generated 16 results with < 0.05 Q_pval. Thus, we used a random effects model to estimate the MR effect size, which confirmed that the outcomes were causally related to depression (Pval < 0.05). Besides, the multiplicity test showed that each significant outcome (Pval > 0.05) lacked horizontal multiplicity. The leave-one-out sensitivity analyses of each significant outcome showed that no specific SNPs influenced the results (Supplementary Table S5 and Supplementary Figures, available in www.besjournal.com).
-
The conditions with significant risk factors, including primary sclerosing cholangitis (PSC), were confirmed through tests. The purpose was to prove the reliability of the results. Patients with chronic diseases have a higher rate of depression than the normal population[18], but PSC (IVW, OR = 1.00, 95% CI: 0.99−1.00, P < 0.01) does not increase the risk of depression. Research trials showed that depression is less prevalent in PSC than in the general population. Schizophrenia (SCZ) (IVW, OR = 1.01, 95% CI: 1.00−1.02, P < 0.01) and MDD are two psychiatric disorders with overlapping symptoms and risk factors[19]. However, patients with SCZ have an increased risk of MDD. Approximately 50% of SCZ patients also experience a major depressive episode at some point, with higher risks of hospitalization, suicide attempts, and poorer treatment outcomes than those who never suffered depression[20,21]. Thus, this evidence suggests an association between the two diseases.
Systemic lupus erythematosus (SLE) was another significant (IVW, OR = 1.01, 95% CI: 1.00−1.01, P < 0.01) risk factor for depression[22]. This autoimmune disease causes inflammation and damages various organs and tissues in the body. Although SLE primarily affects the physical health of an individual, there is growing evidence that it can also affect mental health, including an increased risk of developing MDD[23]. The prevalence of depression in SLE patients is approximately three times higher than in the general population[24]. Moreover, SLE patients with a history of depression had worse disease outcomes and quality of life than patients without depression[25]. Therefore, the MR results are consistent with the trial findings, confirming the reliability of the MR calculations.
-
Genetically variant SNPs of the therapeutic target genes were selected to identify potential therapeutic drugs for depression using ADHD, SCZ, Inflammatory bowel disease (IBD) (IVW, OR = 0.98, 95% CI: 0.97−1.00, P = 0.04), Alzheimer’s disease (AD) (IVW, OR = 0.96, 95% CI: 0.92−1.00, P = 0.03) as instrumental exposure variables. Major depressive disorder was used as the outcome variable for 2SMR analysis. The DrugBank database search retrieved 16 drugs for ADHD, corresponding to 135 drug targets; 35 drugs for SCZ, corresponding to 452 drug targets; 12 drugs for IBD, corresponding to 24 drug targets; and 8 drugs for AD, corresponding to 95 drug targets (Supplementary Table S5). Crohn’s disease was among IBD diseases, but PGC cross-disorder traits could not be calculated as independent diseases; thus, only ADHD, SCZ, IBD, and AD were evaluated.
The top nine targets selected through MR analysis included sodium-dependent noradrenaline transporter (SLC6A4), glutathione S-transferase P (GSTP1), glutamate receptor ionotropic NMDA 2C (GRIN2C), neuronal acetylcholine receptor subunit alpha-3 (CHRNA3), glutamate receptor ionotropic NMDA 2A (GRIN2A), gamma-aminobutyric acid receptor subunit gamma-2 (GABRG2), sodium channel protein type 10 subunit alpha (SCN10A), 5-hydroxytryptamine receptor 3A (HTR3A), and interleukin-1 beta (IL1B). The findings showed that SLC6A4 (IVW, OR = 1.03, 95% CI: 1.00−1.06, P = 0.05), GRIN2A (IVW, OR = 1.04, 95% CI: 1.01−1.06, P < 0.01), GRIN2C (IVW, OR = 1.02, 95% CI: 1.01−1.04, P < 0.01), SCN10A (IVW, OR = 1.08, 95% CI: 1.01–1.16, P = 0.03), and IL1B (IVW, OR = 1.03, 95% CI: 1.01−1.06, P = 0.01) are positively correlated with the risk of MDD. Thus, high expression of SLC6A4, GRIN2A, GRIN2C, CHRNA3, SCN10A, and IL1B may increase the risk of MDD. Additionally, CHRNA3 (IVW, OR = 0.95, 95% CI: 0.92−0.98, P < 0.01), GSTP1 (IVW, OR = 0.84, 95% CI: 0.73−0.98, P = 0.02), HTR3A (IVW, OR = 0.96, 95% CI: 0.92−1.00, P = 0.04), GRIN2A (IVW, OR = 0.84, 95% CI: 0.73−0.92, P = 0.02) with high expression may reduce the risk of MDD (Supplementary Table S6, available in www.besjournal.com).
-
In this study, a 2SMR assessment identified several risk factors for depression. The disease risk factors showed that SCZ, AD, inflammatory bowel disease and PGC cross-disorder traits were significantly associated with the risk of depression and MDD. Further analysis indicated that high expression of SLC6A4, SCN10A, GRIN2A, GRIN2C, and IL1B are correlated with the increased risk of MDD. In contrast, up-regulating CHRNA3, HTR3A, GSTP1, and GABRG2 reduces the risk of MDD.
Sodium-dependent noradrenaline transporter is a serotonin transporter that removes serotonin from the synapse. A decline in SLC6A4 expression up-regulates the expression of pentraxin proteins[26]. Moreover, methylation of the SLC6A4 gene drives the action of selective serotonin reuptake inhibitors (SSRIs). The SSRIs increase methylation of CpG-3, CpG-11, and CpG-12[27]. Decreased methylation of CpG-3 and CpG-5 exacerbates the symptoms of depression; thus, increasing CpG-3 methylation alleviates the clinical symptoms of depression[28,29]. These findings indicate that SLC6A4 is a potential risk factor for depression.
Further, GRIN2A, a receptor for N-methyl-d-aspartate (NR2A), is implicated in several synaptic plasticity-related regulatory processes associated with MDD pathogenesis[30,31]. Overexpressing GRIN2A may enhance MDD susceptibility by up-regulating NMDA receptor-dependent glutamatergic neo-signatures. Functional inactivation of NR2A in knock-out mice models caused reduced anxiety and depression-related behaviors[31,32]. Ketamine is an NMDA receptor antagonist used as a rapid antidepressant agent for depressed patients. Previous findings indicate that ketamine acts by up-regulating synaptogenesis and synaptic plasticity in the hippocampus (HIP) and prefrontal cortex (PFC)[33,34]. These findings indicate that regulating GRIN2A expression treats depression indirectly. Additionally, GRIN2C alleviates MDD symptoms by up-regulating NR2A expression[35].
However, some genes implicated in Gamma amino butyric acid (GABA) metabolism affect suicidal behavior in patients with depression. For instance, expressing Genotype AA of the rs424740 SNP in GABRG2 is correlated with suicidal behavior[36,37]. Down-regulating the RNA isoform GABRG2-003 (the largest GABEG2 protein-coding RNA isoform) promotes suicidal behavior and is associated with GABAergic dysfunction[38,39].
This study identified several factors as potential risks or protective factors for MDD. For example, SLC6A4, GRIN2A, and GRIN2C expression are correlated with an increased risk of MDD, whereas GABRG2 expression is correlated with decreased risk of MDD. Further studies should explore the potential of regulating the expression of these genes to prevent or treat MDD. In addition, further studies should evaluate the potential of ADRB1, CHRNA3, HTR3A, GSTP1, SCN10A, and IL1B as therapeutic targets for treating MDD and their mechanisms of action.
Depression is a class of diseases that significantly impact human health, yet it lacks psychotropic targeted drugs. This study identified significant associations between nine targets (SLC6A4, SCN10A, GRIN2A, GRIN2C, IL1B, CHRNA3, HTR3A, GSTP1, and GABRG2) and depression. This discovery is very important for developing precise targeted drugs for depression. However, these targets still need further validation using experimental methods.
-
Several factors limited this study. First, only three categories, including metabolites, disease, and risk factors, were selected as exposure factors for MR analysis, ignoring other factors that may affect depression. Second, the GWAS data on depression was utilized, and not data from individuals with or without clinical symptoms of depression. Third, the assessment of depression was based on an extensive investigation methodology, which may not reproduce a clinical diagnostic approach.
-
This study explored factors causally associated with the risk of depression through 2SMR analysis owing to the increased prevalence of depression globally. The findings showed that several risk factors are associated with increased/decreased risk of depression and MDD. A significant relationship was observed between various diseases and depression. The 2SMR analysis used protein targets retrieved from DrugBank as exposure factors that identified the risk or protective targets. Integrating various therapeutic targets can increase the number of treatment modalities for depression. Several drug targets, including SLC6A4, GRIN2A, GRIN2C, SCN10A, and IL1B genes (associated with increased risk of depression) and ADRB1, CHRNA3, HTR3A, GSTP1, and GABRG2 genes (associated with decreased risk of depression) were identified. These findings provide a pharmacological basis for conducting further studies to explore effective treatment strategies for depression.
-
WANG Han Lin: searched the literature, designed the study, collected the data, checked and analyzed data, and drafted the article. XUE Yan Feng: analysis of results and discussion. CUI Bao Qiu: collected the data. LIU Hong and SHEN Xin Xin: designed the study, and revised the article.
doi: 10.3967/bes2024.007
Risk Factors of Depression Screened by Two-Sample Mendelian Randomization Analysis: A Systematic Review
-
Abstract:
Objective This study explored the potentially modifiable factors for depression and major depressive disorder (MDD) from the MR-Base database and further evaluated the associations between drug targets with MDD. Methods We analyzed two-sample of Mendelian randomization (2SMR) using genetic variant depression (n = 113,154) and MDD (n = 208,811) from Genome-Wide Association Studies (GWAS). Separate calculations were performed with modifiable risk factors from MR-Base for 1,001 genomes. The MR analysis was performed by screening drug targets with MDD in the DrugBank database to explore the therapeutic targets for MDD. Inverse variance weighted (IVW), fixed-effect inverse variance weighted (FE-IVW), MR-Egger, weighted median, and weighted mode were used for complementary calculation. Results The potential causal relationship between modifiable risk factors and depression contained 459 results for depression and 424 for MDD. Also, the associations between drug targets and MDD showed that SLC6A4, GRIN2A, GRIN2C, SCN10A, and IL1B expression are associated with an increased risk of depression. In contrast, ADRB1, CHRNA3, HTR3A, GSTP1, and GABRG2 genes are candidate protective factors against depression. Conclusion This study identified the risk factors causally associated with depression and MDD, and estimated 10 drug targets with significant impact on MDD, providing essential information for formulating strategies to prevent and treat depression. -
Key words:
- Risk factors /
- Drug targets /
- Depression /
- Major depressive disorder /
- Two-sample Mendelian randomization
注释:1) CONFLICTS OF INTEREST: -
Figure 1. Summarization of analytic design to screen risk factors for depression and MDD. The overall data statistics were performed in three processes: a) finding relevant representative depression modifiable factors and environmental risk factors through MR-base database; b) compiling the data computationally and visualizing the results through two-sample MR calculation method; c) finding depression-related protein targets in DrugBank online database, and the SNP corresponding to each drug target was obtained in GTEX V8 with the found depression-related factors for calculation to identify relevant important drug targets. MDD, major depressive disorder; MR, Mendelian randomization; SNP, single nucleotide polymorphism; PGC, psychiatric genomics consortium.
Figure 2. The x-axis shows the change of log OR caused by the decrease of each SD in 459 traits, and the y-axis displays the relevant P-value. Setting -log10 (Pval) > 1.3 (i.e. P-value < 0.05). (A) Effect of 459 traits on depression; (B) Effect of disease on depression; (C) Effect of metabolites on depression; (D) Effect of risk factor traits on depression. OR, odds ratio; SD, standard deviation
Figure 3. The x-axis shows the change of log OR caused by the decrease of each SD in 424 traits, and the y-axis displays the relevant P-value. Setting -log10 (Pval) > 1.3 (i.e. P-value < 0.05). (A) Effect of 459 traits on MDD; (B) Effect of disease on MDD; (C) Effect of metabolites on MDD; (D) Effect of risk factor traits on MDD. MDD, major depressive disorder; OR, odds ratio; SD, standard deviation.
Figure 4. MR analysis of factors associated significantly with risk of depression. There are 43 different types of risk factors exposures on depression per unit of exposure. IVW: Inverse variance weighted; SNP: single nucleotide polymorphisms; MR, Mendelian randomization; OR: odds ratio; SD, standard deviation.
Figure 5. MR analysis of factors associated significantly with risk of MDD. There are 30 different types of risk factors exposures on MDD per unit of exposure. IVW: Inverse variance weighted; SNP: single nucleotide polymorphisms; MDD, major depressive disorder; MR, Mendelian randomization; OR: odds ratio.
Table 1. 2SMR estimates of the significant results in depression
Study Method SNP (n) OR 95% CI P-value Years of schooling || id: ieu-a-1239 Inverse variance weighted 299 0.95 0.94−0.97 9.62 × 10⁻⁹ Neuroticism || id: ieu-a-1007 Inverse variance weighted 10 1.15 1.07−1.23 7.39 × 10⁻⁵ Primary sclerosing cholangitis || id: ieu-a-1112 Inverse variance weighted 17 1.00 0.99−1.00 8.47 × 10⁻⁴ Schizophrenia || id: ieu-a-22 Inverse variance weighted 71 1.01 1.00−1.02 1.21 × 10⁻³ Mean diameter for VLDL particles || id: met-c-941 Inverse variance weighted 13 1.01 1.00−1.02 1.36 × 10⁻³ Inflammatory bowel disease || id: ieu-a-295 Inverse variance weighted 2 1.01 1.00−1.02 1.41 × 10⁻³ Systemic lupus erythematosus || id: ieu-a-815 Inverse variance weighted 2 1.01 1.00−1.01 2.37 × 10⁻³ Ulcerative colitis || id: ieu-a-971 Inverse variance weighted 3 1.01 1.00−1.01 3.13 × 10⁻³ Glutaroyl carnitine || id: met-a-699 Inverse variance weighted 8 0.95 0.91−0.98 3.66 × 10⁻³ Laurate (12:0) || id: met-a-350 Inverse variance weighted 2 0.78 0.66−0.93 0.01 X-12040 || id: met-a-568 Inverse variance weighted 2 1.01 1.00−1.02 0.01 Average number of methylene groups in a fatty acid chain || id: met-c-848 Inverse variance weighted 3 1.01 1.00−1.02 0.02 Glutamine || id: met-c-860 Inverse variance weighted 5 0.98 0.97−1.00 0.02 Hippocampus volume || id: ieu-a-1045 Inverse variance weighted 2 1.00 1.00 0.02 Alcohol consumption || id: ieu-a-1283 Inverse variance weighted 4 0.91 0.84−0.99 0.02 X-11327 || id: met-a-498 Inverse variance weighted 2 1.28 1.03−1.58 0.02 Uridine || id: met-a-316 Inverse variance weighted 3 1.17 1.02−1.34 0.02 Average number of double bonds in a fatty acid chain || id: met-c-851 Inverse variance weighted 5 0.99 0.98−1.00 0.02 Type 2 diabetes || id: Ieu-a-24 Inverse variance weighted 35 0.99 0.99−1.00 0.03 3-dehydrocarnitine* || id: met-a-500 Inverse variance weighted 2 0.91 0.84−0.99 0.03 Concentration of very large VLDL particles || id: met-c-950 Inverse variance weighted 8 1.01 1.00−1.02 0.03 Total lipids in very large VLDL || id: met-c-949 Inverse variance weighted 8 1.01 1.00−1.02 0.03 Triglycerides in chylomicrons and largest VLDL particles || id: met-c-960 Inverse variance weighted 9 1.01 1.00−1.02 0.03 Cholesterol esters in very large HDL || id: met-c-943 Inverse variance weighted 11 0.99 0.99−1.00 0.03 Fasting insulin || id: ieu-b-116 Inverse variance weighted 13 0.95 0.91−1.00 0.03 Bradykinin, des-arg (9) || id: met-a-656 Inverse variance weighted 3 0.99 0.98−1.00 0.03 Concentration of small HDL particles || id: met-c-922 Inverse variance weighted 5 1.01 1.00−1.02 0.03 Apolipoprotein A-I || id: met-c-842 Inverse variance weighted 10 0.99 0.98−1.00 0.04 X-11792 || id: met-a-542 Inverse variance weighted 3 0.98 0.97−1.00 0.04 Total cholesterol in large HDL || id: met-c-874 Inverse variance weighted 14 0.99 0.99−1.00 0.04 Mean diameter for LDL particles || id: met-c-896 Inverse variance weighted 8 0.99 0.98−1.00 0.04 Cholesterol esters in large VLDL || id: met-c-887 Inverse variance weighted 12 1.01 1.00−1.02 0.04 Ratio of bisallylic groups to total fatty acids || id: met-c-845 Inverse variance weighted 4 0.99 0.99−1.00 0.04 X-13215 || id: met-a-675 Inverse variance weighted 2 0.87 0.76−0.99 0.04 PGC cross-disorder traits || id: ieu-a-803 Inverse variance weighted 4 1.03 1.00−1.06 0.04 Free cholesterol in large VLDL || id: met-c-888 Inverse variance weighted 11 1.01 1.00−1.02 0.05 X-12244--N-acetylcarnosine || id: met-a-596 Inverse variance weighted 3 0.92 0.86−1.00 0.05 Concentration of large VLDL particles || id: met-c-890 Inverse variance weighted 10 1.01 1.00−1.02 0.05 Phospholipids in medium VLDL || id: met-c-914 Inverse variance weighted 15 1.01 1.00−1.01 0.05 Waist circumference || id: ieu-a-68 Inverse variance weighted 25 1.02 1.00−1.04 0.05 Chronotype || id: ieu-a-1087 Inverse variance weighted 9 0.94 0.89−1.00 0.05 Cholesterol esters in large HDL || id: met-c-875 Inverse variance weighted 13 0.99 0.99−1.00 0.05 Note. 2SMR, two-sample mendelian randomization; SNP, single nucleotide polymorphism.  下载: 导出CSV
Table 2. 2SMR estimates of the significant results in MDD
Study Method SNP (n) OR 95% CI P-value Years of schooling || id: ieu-a-1239 Inverse variance weighted 257 0.72 0.64−0.81 2.31 × 10⁻⁸ ADHD || id: ieu-a-1183 Inverse variance weighted 10 1.2 1.12−1.29 1.20 × 10⁻⁷ Schizophrenia || id: ieu-a-22 Inverse variance weighted 72 1.09 1.05-1.14 5.68 × 10⁻⁵ PGC cross-disorder traits || id: ieu-a-803 Inverse variance weighted 4 1.32 1.15−1.51 8.52 × 10⁻⁵ Obesity class 1 || id: ieu-a-90 Inverse variance weighted 14 1.13 1.05−1.21 4.90 × 10⁻⁴ Average number of double bonds in a fatty acid chain || id: met-c-851 Inverse variance weighted 5 0.92 0.88-0.97 2.01 × 10⁻³ Ratio of bisallylic groups to double bonds || id: met-c-844 Inverse variance weighted 4 0.94 0.90−0.98 2.80 × 10⁻³ Ratio of bisallylic groups to total fatty acids || id: met-c-845 Inverse variance weighted 6 0.94 0.9-0.98 2.88 × 10⁻³ Waist circumference || id: ieu-a-102 Inverse variance weighted 2 1.27 1.08−1.49 4.10 × 10⁻³ Obesity class 3 || id: ieu-a-92 Inverse variance weighted 2 1.06 1.02−1.1 4.96 × 10⁻³ Urate || id: ieu-a-789 Inverse variance weighted 4 0.96 0.94−0.99 0.01 Waist circumference || id: ieu-a-69 Inverse variance weighted 21 1.17 1.05−1.31 0.01 Laurate (12:0) || id: met-a-350 Inverse variance weighted 2 0.21 0.07−0.66 0.01 Average number of methylene groups per double bond || id: met-c-847 Inverse variance weighted 5 1.06 1.02−1.1 0.01 Obesity class 2 || id: ieu-a-91 Inverse variance weighted 11 1.08 1.02−1.15 0.01 Body mass index || id: ieu-a-974 Inverse variance weighted 35 1.17 1.04−1.33 0.01 Body mass index || id: ieu-a-785 Inverse variance weighted 28 1.21 1.05−1.4 0.01 Body mass index || id: ieu-a-95 Inverse variance weighted 9 1.32 1.06−1.63 0.01 Crohn's disease || id: ieu-a-10 Inverse variance weighted 97 0.98 0.97−1 0.02 1-linoleoylglycerophosphoethanolamine* || id: met-a-497 Inverse variance weighted 2 1.45 1.04−2.02 0.03 Overweight || id: ieu-a-93 Inverse variance weighted 10 1.16 1.02−1.33 0.03 Alzheimer's disease || id: ieu-a-298 Inverse variance weighted 20 0.96 0.92−1 0.03 Waist circumference || id: ieu-a-65 Inverse variance weighted 13 1.23 1.02−1.48 0.03 HDL cholesterol || id: ieu-a-299 Inverse variance weighted 83 1.06 1−1.12 0.04 X-08402 || id: met-a-426 Inverse variance weighted 2 0.74 0.56−0.99 0.04 1-arachidonoylglycerophosphocholine* || id: met-a-558 Inverse variance weighted 3 0.76 0.58−0.99 0.04 Inflammatory bowel disease || id: ieu-a-31 Inverse variance weighted 54 0.98 0.97−1 0.04 Body mass index || id: ieu-a-2 Inverse variance weighted 74 1.13 1−1.26 0.04 Urate || id: ieu-a-797 Inverse variance weighted 3 0.96 0.92−1 0.04 LDL cholesterol || id: ieu-a-300 Inverse variance weighted 75 0.96 0.92−1 0.05 Note. MDD, major depressive disorder; MR, Mendelian randomization; SNP, single nucleotide polymorphism.
下载: 导出CSV
-
[1] The WHO World Mental Health Survey Consortium. Prevalence, severity, and unmet need for treatment of mental disorders in the World Health Organization World Mental Health Surveys. JAMA, 2004; 291, 2581−90. doi: 10.1001/jama.291.21.2581 [2] Alexopoulos GS. Depression in the elderly. Lancet, 2005; 365, 1961−70. doi: 10.1016/S0140-6736(05)66665-2 [3] Otte C, Gold SM, Penninx BW, et al. Major depressive disorder. Nat Rev Dis Primers, 2016; 2, 16065. doi: 10.1038/nrdp.2016.65 [4] Asarnow JR, Porta G, Spirito A, et al. Suicide attempts and nonsuicidal self-injury in the treatment of resistant depression in adolescents: findings from the TORDIA study. J Am Acad Child Adolesc Psychiatry, 2011; 50, 772−81. doi: 10.1016/j.jaac.2011.04.003 [5] Choi KW, Stein MB, Nishimi KM, et al. An exposure-wide and Mendelian randomization approach to identifying modifiable factors for the prevention of depression. Am J Psychiatry, 2020; 177, 944−54. doi: 10.1176/appi.ajp.2020.19111158 [6] Campbell D, Green MJ, Davies N, et al. Effects of depression on employment and social outcomes: a Mendelian randomisation study. J Epidemiol Community Health, 2022; 76, 563−71. doi: 10.1136/jech-2021-218074 [7] Plante DT. The evolving nexus of sleep and depression. Am J Psychiatry, 2021; 178, 896−902. doi: 10.1176/appi.ajp.2021.21080821 [8] de Ornelas Maia ACC, de Azevedo Braga A, Paes F, et al. Comorbidity of depression and anxiety: association with poor quality of life in type 1 and 2 diabetic patients. Clin Pract Epidemiol Ment Health, 2013; 9, 136−41. doi: 10.2174/1745017901309010136 [9] Wang HQ, Wang ZZ, Chen NH. The receptor hypothesis and the pathogenesis of depression: genetic bases and biological correlates. Pharmacol Res, 2021; 167, 105542. doi: 10.1016/j.phrs.2021.105542 [10] Pierce BL, Burgess S. Efficient design for Mendelian randomization studies: subsample and 2-sample instrumental variable estimators. Am J Epidemiol, 2013; 178, 1177−84. doi: 10.1093/aje/kwt084 [11] Wishart DS, Knox C, Guo AC, et al. DrugBank: a comprehensive resource for in silico drug discovery and exploration. Nucleic Acids Res, 2006; 34, D668−72. doi: 10.1093/nar/gkj067 [12] Hemani G, Zheng J, Elsworth B, et al. The MR-Base platform supports systematic causal inference across the human phenome. eLife, 2018; 7, e34408. doi: 10.7554/eLife.34408 [13] Howard DM, Adams MJ, Shirali M, et al. Genome-wide association study of depression phenotypes in UK Biobank identifies variants in excitatory synaptic pathways. Nat Commun, 2018; 9, 1470. doi: 10.1038/s41467-018-03819-3 [14] Wray NR, Ripke S, Mattheisen M, et al. Genome-wide association analyses identify 44 risk variants and refine the genetic architecture of major depression. Nat Genet, 2018; 50, 668−81. doi: 10.1038/s41588-018-0090-3 [15] Cross-Disorder Group of the Psychiatric Genomics Consortium. Identification of risk loci with shared effects on five major psychiatric disorders: a genome-wide analysis. Lancet, 2013; 381, 1371−9. doi: 10.1016/S0140-6736(12)62129-1 [16] Lin ZT, Deng YQ, Pan W. Combining the strengths of inverse-variance weighting and Egger regression in Mendelian randomization using a mixture of regressions model. PLoS Genet, 2021; 17, e1009922. doi: 10.1371/journal.pgen.1009922 [17] Oliva M, Muñoz-Aguirre M, Kim-Hellmuth S, et al. The impact of sex on gene expression across human tissues. Science, 2020; 369, eaba3066. doi: 10.1126/science.aba3066 [18] van Os E, van den Broek WW, Mulder PGH, et al. Depression in patients with primary biliary cirrhosis and primary sclerosing cholangitis. J Hepatol, 2007; 46, 1099−103. doi: 10.1016/j.jhep.2007.01.036 [19] Krynicki CR, Upthegrove R, Deakin JFW, et al. The relationship between negative symptoms and depression in schizophrenia: a systematic review. Acta Psychiatr Scand, 2018; 137, 380−90. doi: 10.1111/acps.12873 [20] Bhui K, Puffet A, Herriot P. A survey of sexual problems amongst psychiatric inpatients. Soc Psychiatry Psychiatr Epidemiol, 1995; 30, 73−7. doi: 10.1007/BF00794946 [21] Lyu JC, Zhang J, Hennessy DA. Characteristics and risk factors for suicide in people with schizophrenia in comparison to those without schizophrenia. Psychiatry Res, 2021; 304, 114166. doi: 10.1016/j.psychres.2021.114166 [22] Kiriakidou M, Ching CL. Systemic lupus erythematosus. Ann Intern Med, 2020; 172, ITC81−96. doi: 10.7326/AITC202006020 [23] Parperis K, Psarelis S, Chatzittofis A, et al. Association of clinical characteristics, disease activity and health-related quality of life in SLE patients with major depressive disorder. Rheumatology, 2021; 60, 5369−78. doi: 10.1093/rheumatology/keab123 [24] Al-Homood IA, Omran NE, Alwahibi AS, et al. Depression in patients with systemic lupus erythematosus: a multicenter study. Saudi J Med Med Sci, 2017; 5, 248−53. doi: 10.4103/sjmms.sjmms_79_16 [25] Cojocaru DC, Costin M, Bădeanu LE, et al. Depression-A fellow traveler with systemic lupus erythematosus. Rev Med Chir Soc Med Nat Iasi, 2015; 119, 974−81. [26] Gelernter J. SLC6A4 polymorphism, population genetics, and psychiatric traits. Hum Genet, 2014; 133, 459−61. doi: 10.1007/s00439-013-1412-2 [27] Booij L, Szyf M, Carballedo A, et al. DNA methylation of the serotonin transporter gene in peripheral cells and stress-related changes in hippocampal volume: a study in depressed patients and healthy controls. PLoS One, 2015; 10, e0119061. doi: 10.1371/journal.pone.0119061 [28] Iga JI, Watanabe SY, Numata S, et al. Association study of polymorphism in the serotonin transporter gene promoter, methylation profiles, and expression in patients with major depressive disorder. Hum Psychopharmacol Clin Exp, 2016; 31, 193−9. doi: 10.1002/hup.2527 [29] Okada S, Morinobu S, Fuchikami M, et al. The potential of SLC6A4 gene methylation analysis for the diagnosis and treatment of major depression. J Psychiatr Res, 2014; 53, 47−53. doi: 10.1016/j.jpsychires.2014.02.002 [30] Iosifescu DV, Jones A, O'Gorman C, et al. Efficacy and safety of AXS-05 (dextromethorphan-bupropion) in patients with major depressive disorder: a phase 3 randomized clinical trial (GEMINI). J Clin Psychiatry, 2022; 83, 21m14345. [31] Berman RM, Cappiello A, Anand A, et al. Antidepressant effects of ketamine in depressed patients. Biol Psychiatry, 2000; 47, 351−4. doi: 10.1016/S0006-3223(99)00230-9 [32] Zarate CA Jr, Singh JB, Carlson PJ, et al. A randomized trial of an N-methyl-D-aspartate antagonist in treatment-resistant major depression. Arch Gen Psychiatry, 2006; 63, 856−64. doi: 10.1001/archpsyc.63.8.856 [33] Murrough JW, Wan LB, Iacoviello B, et al. Neurocognitive effects of ketamine in treatment-resistant major depression: association with antidepressant response. Psychopharmacology, 2014; 231, 481−8. doi: 10.1007/s00213-013-3255-x [34] Murrough JW, Iosifescu DV, Chang LC, et al. Antidepressant efficacy of ketamine in treatment-resistant major depression: a two-site randomized controlled trial. Am J Psychiatry, 2013; 170, 1134−42. doi: 10.1176/appi.ajp.2013.13030392 [35] Chandley MJ, Szebeni A, Szebeni K, et al. Elevated gene expression of glutamate receptors in noradrenergic neurons from the locus coeruleus in major depression. Int J Neuropsychopharmacol, 2014; 17, 1569−78. doi: 10.1017/S1461145714000662 [36] Myung W, Song J, Lim SW, et al. Genetic association study of individual symptoms in depression. Psychiatry Res, 2012; 198, 400−6. doi: 10.1016/j.psychres.2011.12.037 [37] Prévot T, Sibille E. Altered GABA-mediated information processing and cognitive dysfunctions in depression and other brain disorders. Mol Psychiatry, 2021; 26, 151−67. doi: 10.1038/s41380-020-0727-3 [38] Schweizer C, Balsiger S, Bluethmann H, et al. The γ2 subunit of GABAA receptors is required for maintenance of receptors at mature synapses. Mol Cell Neurosci, 2003; 24, 442−50. doi: 10.1016/S1044-7431(03)00202-1 [39] Yin HL, Pantazatos SP, Galfalvy H, et al. A pilot integrative genomics study of GABA and glutamate neurotransmitter systems in suicide, suicidal behavior, and major depressive disorder. Am J Med Genet Part B Neuropsychiatr Genet, 2016; 171, 414−26. doi: 10.1002/ajmg.b.32423 -
 23037+Supplementary Materials.zip

-

 点击查看大图
计量
- 文章访问数: 104
- HTML全文浏览量: 40
- PDF下载量: 14
- 被引次数: 0

 Quick Links