

 下载:
下载:


-
Coke Oven Emissions (COEs) is a broad term used to refer to mixed gases and solid particles produced during coke production, and its main component is polycyclic aromatic hydrocarbons (PAHs). Numerous studies have demonstrated that exposure to COEs/PAHs raises the risk of several diseases, including cardiovascular diseases, respiratory diseases, and lung cancer [1]. Workers at coke oven plants are more likely to be exposed to COEs than others, which increases their likelihood of getting associated diseases.
Numerous studies have demonstrated that COEs exposure affects the mitochondrial DNA copy number (mtDNAcn) and inhibits mitochondrial biogenesis [2]. Mitochondria are dual-membrane organelles found in all eukaryotic cells that regulate various cellular activities, such as adenosine triphosphate generation, cell homeostasis, apoptosis, and macromolecule biosynthesis [3]. Mitochondrial DNA (mtDNA) is a circular, double-stranded DNA molecule containing 16,569 base pairs without introns, and its number in the genome is called mtDNAcn. Usually, tens to thousands of mtDNAcn are found in a cell [4]. For mitochondrial function and cellular homeostasis, the integrity of the mitochondrial genome is of great importance. Due to the underdevelopment of the damage repair system of the mtDNA, it is susceptible to damage caused by reactive oxygen species (ROS) and thus becomes the target of many environmental pollutants [5]. As research progresses, the mtDNAcn is expected to become a biomarker of mitochondrial dysfunction [6]. The fact that COEs exposure causes a significant amount of ROS to be produced in vivo, which may inhibit mtDNA synthesis and result in mitochondrial dysfunction, suggests that the mtDNAcn may be a sensitive biomarker for diseases associated with COEs exposure [7, 8].
It is important to establish appropriate limits for COEs concentrations in the workplace environment to protect coke oven workers from various health hazards caused by exposure to COEs-induced mitochondrial damage. There are certain limitations to extrapolating exposure limits to human health risks determined only by the size of the no-observed-adverse-effect level (NOAEL) or lowest-observed-adverse-effect level (LOAEL) metrics from animal studies [9]. To compensate for the limitations of the NOAEL/LOAEL, Crump et al. proposed the benchmark dose (BMD), which has been widely used in the risk assessment of environmental contaminants [10]. Our research group previously found a dose-response relationship between COEs exposure and telomere damage and estimated its exposure limit using the Benchmark Dose Software (BMDS) program published by the United States Environmental Protection Agency (USEPA) [11]. Currently, several programs have been developed to evaluate the BMD. In the present study, we selected three common methods to estimate the BMD and its lower 95% confidence limit (BMDL) of COEs-induced mitochondrial damage, including the BMDS version 3.20, Bayesian benchmark dose modeling (BBMD), and possible risk obtained from animal studies (PROAST) version 67.0.
Based on the findings of the previous study, 782 people were chosen as research subjects to investigate the dose–response relationship between COEs exposure and mtDNAcn and to assess the BMDL of COEs-induced mitochondrial damages using the BBMD, BMDS, and PROAST.
-
A total of 782 volunteers, including 238 participants in the control group and 544 workers in the exposure group, were enrolled in the study. The exposure group in this study comprised workers aged 18 to 60 who had at least one year of work experience. The control group members did not have any occupational COEs exposure, although living in the same city as the exposed group. After training, investigators gathered basic information from all the volunteers in a questionnaire survey. “Smoking” was defined as smoking more than one cigarette a day for over six months, while “alcohol consumption” was defined as having consumed more than two drinks per week in the past six months since the survey began. Na2EDTA anticoagulation tubes were used to collect peripheral blood from every individual. This research protocol was approved by the Ethics Committee of Zhengzhou University (ZZUIRB 2021−153). Informed consent forms were signed by the subjects before implementation, and international and national ethical standards for biomedical research were strictly followed. The previous article published by our research team has more detailed basic information [11].
-
In the present study, the exposure levels of COEs in the coking plant’s various workshops were examined. The sampling point was set up in accordance with the Code for Monitoring and Sampling of Hazardous Substances in the Air of the Workplace (GBZ159−2004). There were four workshops, each with two coke ovens. In each workshop, a total of 18 representative locations, such as furnace top, furnace side, furnace bottom, duty room, and office, were selected. The total suspended particulate medium-flow sampler (Laoying 2050, Laoshan, Shandong, China) was used to gather air samples at the location. The relative height of the sampler inlet was approximately 1.5 m from the ground. Then, the sampler was started, and the flow rate was adjusted to 100 L/min. After 5 min of sampling, the sampling flow rate, atmospheric pressure, temperature, and meteorological parameters were recorded during sampling and 5 min before the end of sampling. The flow rate was often observed during the sampling period when the sampling flow rate decreased by more than 5% due to the high pollutant concentration at 4 h. The sampling time and flow rate of each segment were recorded.
The concentration of COEs was measured in the laboratory according to the standard “fixed source emissions–determination of benzene soluble particulate matter–Soxhlet extraction method” (HJ690−2014). The cumulative exposure dose (CED) of COEs (CED-COEs) for each participant in the study, comprising the control and exposure groups, was determined using the following equation [12]: CED [(mg/m3) · year] = Σ C (mg/m3) × T (year), where C stands for the average daily workplace exposure concentration of COEs and T represents the hours worked at a particular site. In the exposed group, the time-weighted average (TWA) concentration was calculated according to the type of work (Supplementary Table S1, available in www.besjournal.com). In the control group, C refers to the living environment concentration, and T is the age. The coefficient of variation was 0.46%–13%, and the limit of determination was 0.004 mg/m3. Additional details of COEs collection and concentration measurements were described in previous publications of our research group [13].
Table S1. Concentration of COEs exposed to each type of work in four coking plants workshops
Type of work TWA# Workshop-one Workshop-two Workshop-three Workshop-four Larry car operator 0.191 0.208 0.280 0.339 Stop car operator 0.165 0.189 0.115 0.208 Pusher car operator 0.070 0.058 0.064 0.115 Quench car operator 0.096 0.153 0.089 0.116 Temperature controller 0.080 0.084 0.099 0.215 Temperature measurer 0.083 0.100 0.086 0.133 Benchman coke side 0.081 0.070 0.096 0.096 Coke side machine operator 0.200 0.189 0.105 0.526 Furnace cover worker 0.068 0.099 0.102 0.165 Ascension pipe worker 0.169 0.122 0.102 0.183 Coke oven repairer 0.133 0.148 0.101 0.251 Supervisors 0.010 0.010 0.010 0.010 Note. TWA: Time weighted average concentration, #: unit is mg/m3. The reference standard of COEs concentration (calculated as benzene dissolved matter) was PC-TWA 0.1 mg/m3. -
The mtDNAcn of peripheral leukocytes was detected via real-time fluorescence-based quantitative PCR (RT-PCR). Mitochondrial NADH dehydrogenase subunit 1 gene (MT-ND1) is an internal reference gene of the mtDNA, while human β-globin is an internal reference gene of nuclear DNA. Two parallel samples were set for each sample, and each reaction system was 10 μL in total, consisting of the DNA template, Mix, DNase-free and RNase-free water, and primers. This study utilized the same measurement method as early studies [14].
-
Statistical analysis was performed using SPSS 21.0 (SPSS Inc., Chicago, USA). The number and percentage of qualitative data were described. Median and quartile were used to describe the quantitative data that did not obey a normal distribution. The quantitative data following a normal distribution were described by (Mean ± SD) deviation. The two-independent sample t-test was used to analyze the distribution of quantitative variables between the exposed group and control group, and the χ2 test was used to analyze the distribution of qualitative variables between the exposed group and control group. The mtDNAcn was compared between groups by the two-independent sample t-test. The Jonckheere-Terpstra test was used for comparisons between multiple groups, such as BMI. The Jonckheere-Terpstra test is a nonparametric test used to test whether there are significant differences in the distribution of multiple populations from multiple independent samples. The classic t-test is a comparison between two groups, and the data obey the normal distribution, which needs to be based on a specific population distribution. The relationship between the demographic characteristics and mtDNAcn was analyzed by the two-independent sample t-test and variance analysis. A generalized linear model was used to analyze the relationship between the CED-COEs and mtDNAcn. Two-sided tests were used for all statistical analyses with test level α = 0.05.
-
The BMD estimate of the reduction in the mtDNAcn caused by CED-COEs was analyzed using the BMDS version 3.20 (USEPA), web-based BBMD [15], and PROAST version 67.0 [16]. The software fitted the dose-response relationship of the total population, male population, and female population. The benchmark response in this study was 10%, estimating the COEs exposure to the BMD and BMDL. According to the BMDS guidelines [17], a goodness-of-fit P-value greater than 0.1 and a minimum fit equation of the Akaike information criterion (AIC) were selected as the optimal model. According to BBMD technical guidelines, the Model-average was selected as the model with the best goodness of fit [15]. On the PROAST website, the model with the lowest AIC will be selected as the best model [18].
-
In previous papers published by the research group, the demographic characteristics of the research subjects have been fully described [13]. The results show that there were statistically significant differences in age, gender, smoking, and drinking (P < 0.05), whereas there were no statistically significant differences in the BMI between the two groups (P > 0.05). The comparison between the exposed group and control group showed that the CED-COEs in the exposed group were 1.12 (0.34, 2.14) higher than that in the control group 0.07 (0.06, 0.09), with a statistically significant difference (P < 0.001). The mtDNAcn in the exposed group was lower than that in the control group (0.60 ± 0.29 vs. 1.03 ± 0.31, P < 0.001) (Table 1).
Table 1. General characteristics of COEs exposure and control group
Characteristics Control group (n = 238) Exposure group (n = 544) χ2/Z/t P Age (years)a, n (%) ≤ 40 142 (59.7) 273 (50.2) 5.974 0.015 > 40 96 (40.3) 271 (49.8) Gendera, n (%) Male 139 (58.4) 390 (71.7) 13.357 < 0.001 Female 99 (41.6) 154 (28.3) Smokinga, n (%) No 197 (82.8) 321 (59.0) 41.817 < 0.001 Yes 41 (17.2) 223 (41.0) Drinkinga, n (%) No 138 (58.0) 248 (45.6) 10.176 0.001 Yes 100 (42.0) 296 (54.4) ΒΜΙ (kg/m2)a, n (%) < 18.5 5 (2.1) 12 (2.2) 2.995 0.392 18.5–23.9 108 (45.4) 224 (41.2) 24.0–27.9 101 (42.4) 229 (42.3) ≥ 28.0 24 (10.1) 78 (14.3) CED-COEsb, P50 (P25, P75) 0.07 (0.06, 0.09) 1.12 (0.34, 2.14) 22.093 < 0.001 mtDNAcnc, Mean ± SD 1.03 ± 0.31 0.60 ± 0.29 18.931 < 0.001 Note. Smoking was defined as smoking more than one cigarette a day and lasting more than half a year. Drinking was defined as drinking more than twice a week in the last six months. BMI: body mass index; CED: cumulative exposure dose; COEs: coke oven emissions. a: P values derived from χ2 for categorical variables. b: P values derived from Mann–Whitney U test for categorical variables. c: P values derived from the t-test for continuous variables. -
The intergroup analysis results (Table 2) show that there were statistically significant differences in the mtDNAcn between the control group and exposed group in terms of age, gender, smoking, drinking, and BMI, and the mtDNAcn of the exposed group was lower than that of the control group (P < 0.001). The results of stratified analysis within the group showed that in the stratified gender of the control group, the mtDNAcn of the females was higher than that of the males (1.08 ± 0.34 vs. 1.00 ± 0.28; P = 0.039), and there was no statistical significance between the mtDNAcn and other demographic characteristics of the control group or exposed group (P > 0.05).
Table 2. Association of demographic characteristics with the mitochondrial DNA copy number
Characteristics Control group Exposure group t Pa n Mean ± SD n Mean ± SD Age (years) ≤ 40 142 1.05 ± 0.31 273 0.60 ± 0.28 15.294 < 0.001 > 40 96 1.01 ± 0.30 271 0.60 ± 0.31 11.229 < 0.001 t 1.100 −0.036 Pa 0.273 0.971 Gender Male 139 1.00 ± 0.28 390 0.59 ± 0.30 14.426 < 0.001 Female 99 1.08 ± 0.34 154 0.62 ± 0.29 11.521 < 0.001 t −2.075 −1.280 Pa 0.039 0.201 Smoking No 197 1.04 ± 0.32 321 0.60 ± 0.29 16.184 < 0.001 Yes 41 0.99 ± 0.27 223 0.59 ± 0.29 8.204 < 0.001 t 0.909 0.405 Pa 0.364 0.685 Drinking No 138 1.05 ± 0.33 248 0.61 ± 0.30 13.260 < 0.001 Yes 100 1.01 ± 0.27 296 0.58 ± 0.29 13.052 < 0.001 t 0.939 1.383 Pa 0.349 0.167 BMI (kg/m2) < 18.5 5 1.05 ± 0.22 12 0.70 ± 0.29 2.427 0.028 18.5–23.9 108 1.01 ± 0.33 224 0.61 ± 0.30 10.942 < 0.001 24.0−27.9 101 1.06 ± 0.29 230 0.58 ± 0.28 14.388 < 0.001 ≥ 28.0 24 1.03 ± 0.30 78 0.58 ± 0.33 6.039 < 0.001 J–T 0.366 1.095 Pc 0.778 0.351 Note. BMI: body mass index. a: P values derived from the two-sample t-test. b: P values derived from the variance analysis. c: P values derived from the Jonckheere-Terpstra test. -
The CED-COEs by the quartile were divided into four groups as the independent variable, mtDNAcn as the dependent variable, and age, gender, smoking, drinking, and BMI as the covariates. The low-dose group was used as the control group, and the relationship between CED-COEs and the mtDNAcn was analyzed using the generalized linear model. The trend test showed that the mtDNAcn decreased as the CED-COEs exposure increased (P < 0.001) after adjusting for all covariates (Table 3).
Table 3. Differences in the mtDNAcn by different CED-COEs levels
CED−COEs [(mg/m3)·year] n Mean ± SD β (95% CI) χ2 P < 0.092 196 1.03 ± 0.31 Reference 0.092− 195 0.67 ± 0.36 −0.404 (−0.471, −0.338) 142.108 < 0.001 0.423− 196 0.63 ± 0.28 −0.416 (−0.479, −0.353) 166.937 < 0.001 ≥ 1.686 195 0.59 ± 0.30 −0.462 (−0.529, −0.394) 178.853 < 0.001 P-trend < 0.001 Note. CED: cumulative exposure dose; COEs: coke oven emissions. The model was adjusted for gender, age, smoking, drinking, and BMI. -
In this study, according to the EPA (USEPA) technical guidelines for the BMD and taking into account the mtDNAcn damage, the cut-off point of the mtDNAcn was defined as the 5th percentile of the control group. That is, ≤ 0.57 was defined as the impaired group, and > 0.57 was defined as the normal group. Table 4 shows that the mtDNAcn damage rate increased with increasing CED-COEs (P < 0.001), further stratified by gender, and a trend for males and females can also be seen.
Table 4. Trend tests for mitochondrial DNA damage at different CED-COEs levels
CED-COEs [(mg/m3)·year] Total Male Female + − % + − % + − % < 0.092 9 187 4.59 4 109 3.54 5 78 6.02 0.092− 86 109 44.10 55 64 46.22 31 45 40.79 0.423− 77 119 39.29 54 71 43.20 23 48 32.39 ≥ 1.686 94 101 48.21 82 90 47.67 12 11 52.17 χ2 104.360 69.184 33.350 P-trend < 0.001 < 0.001 < 0.001 Notes. “+” represents subjects with mitochondrial DNA damage. “−” represents subjects without mitochondrial DNA damage. -
Based on the BMDS user guide, a goodness-of-fit P-value greater than 0.1 and a minimum fit equation of AIC were selected as the optimal model. The model types are Dichotomous-Hill, Gamma-Model, Log-Logistic, Multistage, Weibull, Logistic, Log-Probit, Probit, and Quantal-Linear. The results of the BMDS show that the total population and female population models were fitted unsuccessfully, and the male population model was fitted successfully as the Dichotomous-Hill model, as shown in Table 5. The Dichotomous-Hill dose-response model formula is P [mtDNAcn damaged] = g + (v − v × g)/{1+exp[-a − b × Log(dose)]}. The BMD and BMDL of males were 0.087 and 0.076 mg/m3 per year, respectively.
Table 5. BMD and BMDL estimation of the mitochondrial DNA damage
Subjects n g v a b BMD# BMDL# AIC Goodness of fit χ2 P Male 529 0 0.461 12.054 5.466 0.087 0.076 614.552 0.640 0.424 Note. Dichotomous-Hill model; #: unit is (mg/m3)·year. BMD: benchmark dose; BMDL: lower limit of 95% confidence interval of BMD; AIC: Akaike information criterion; g: background; v: maximum probability of response predicted by the mode; a: intercept; b: slope. -
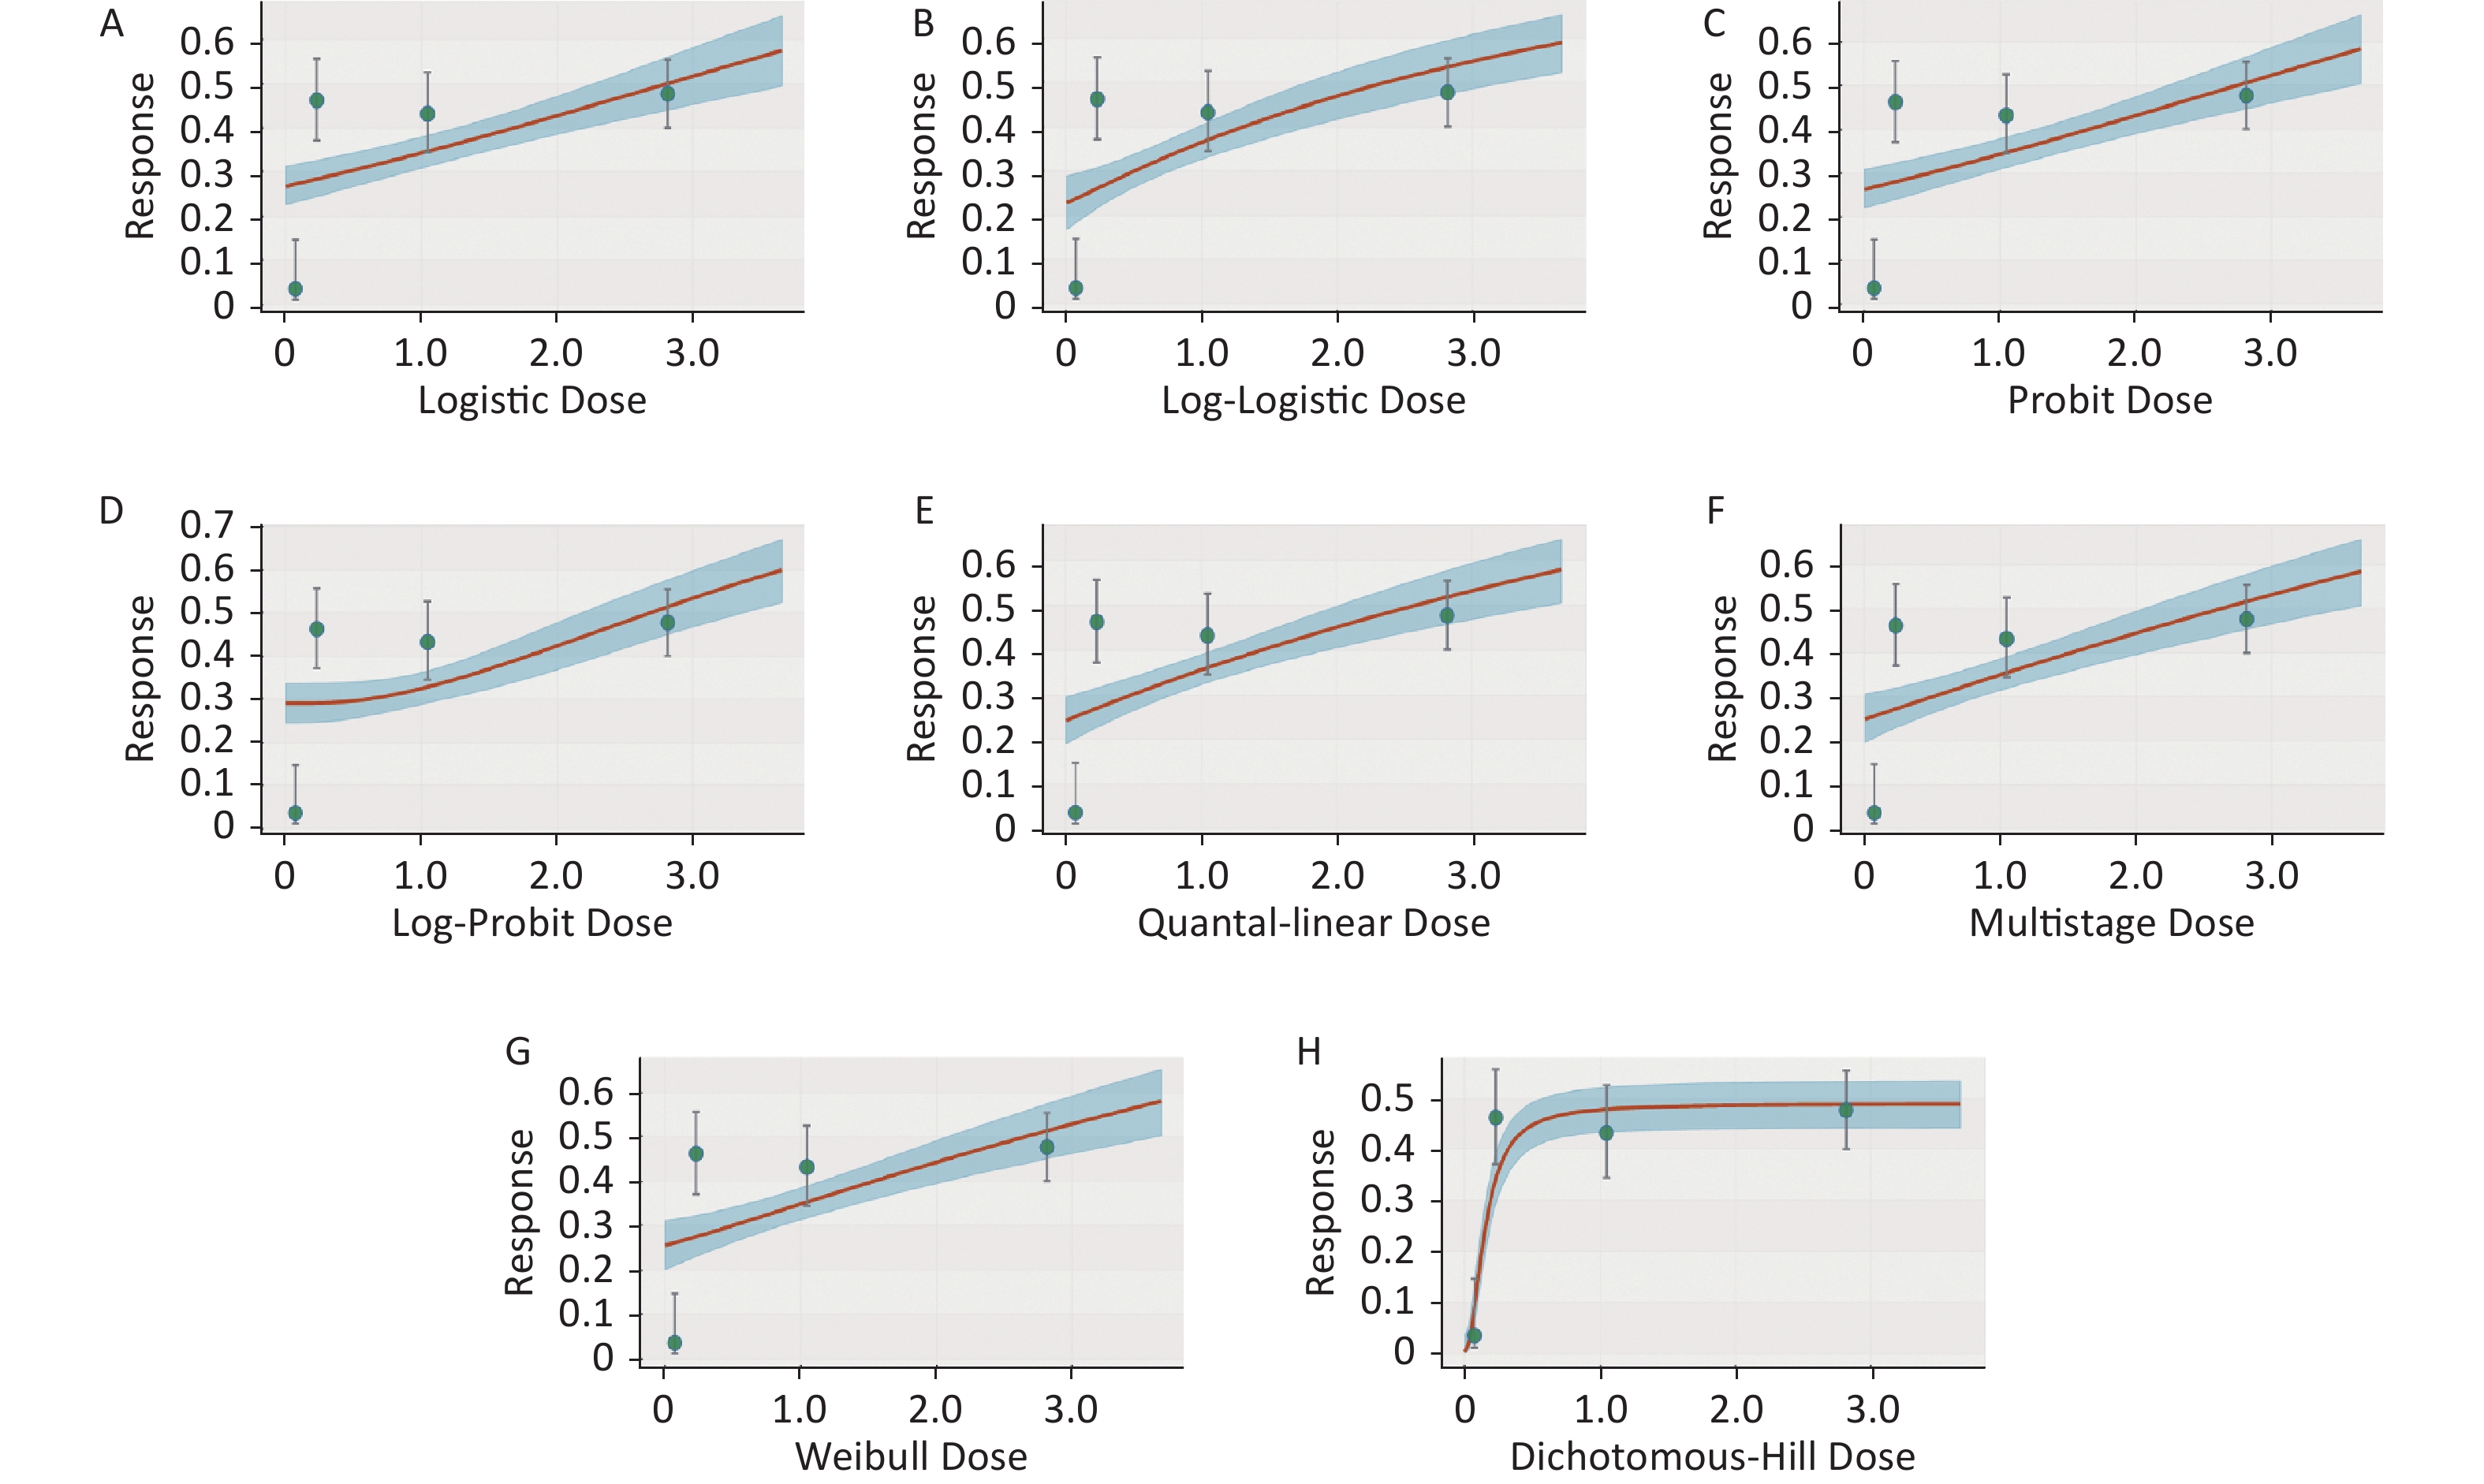
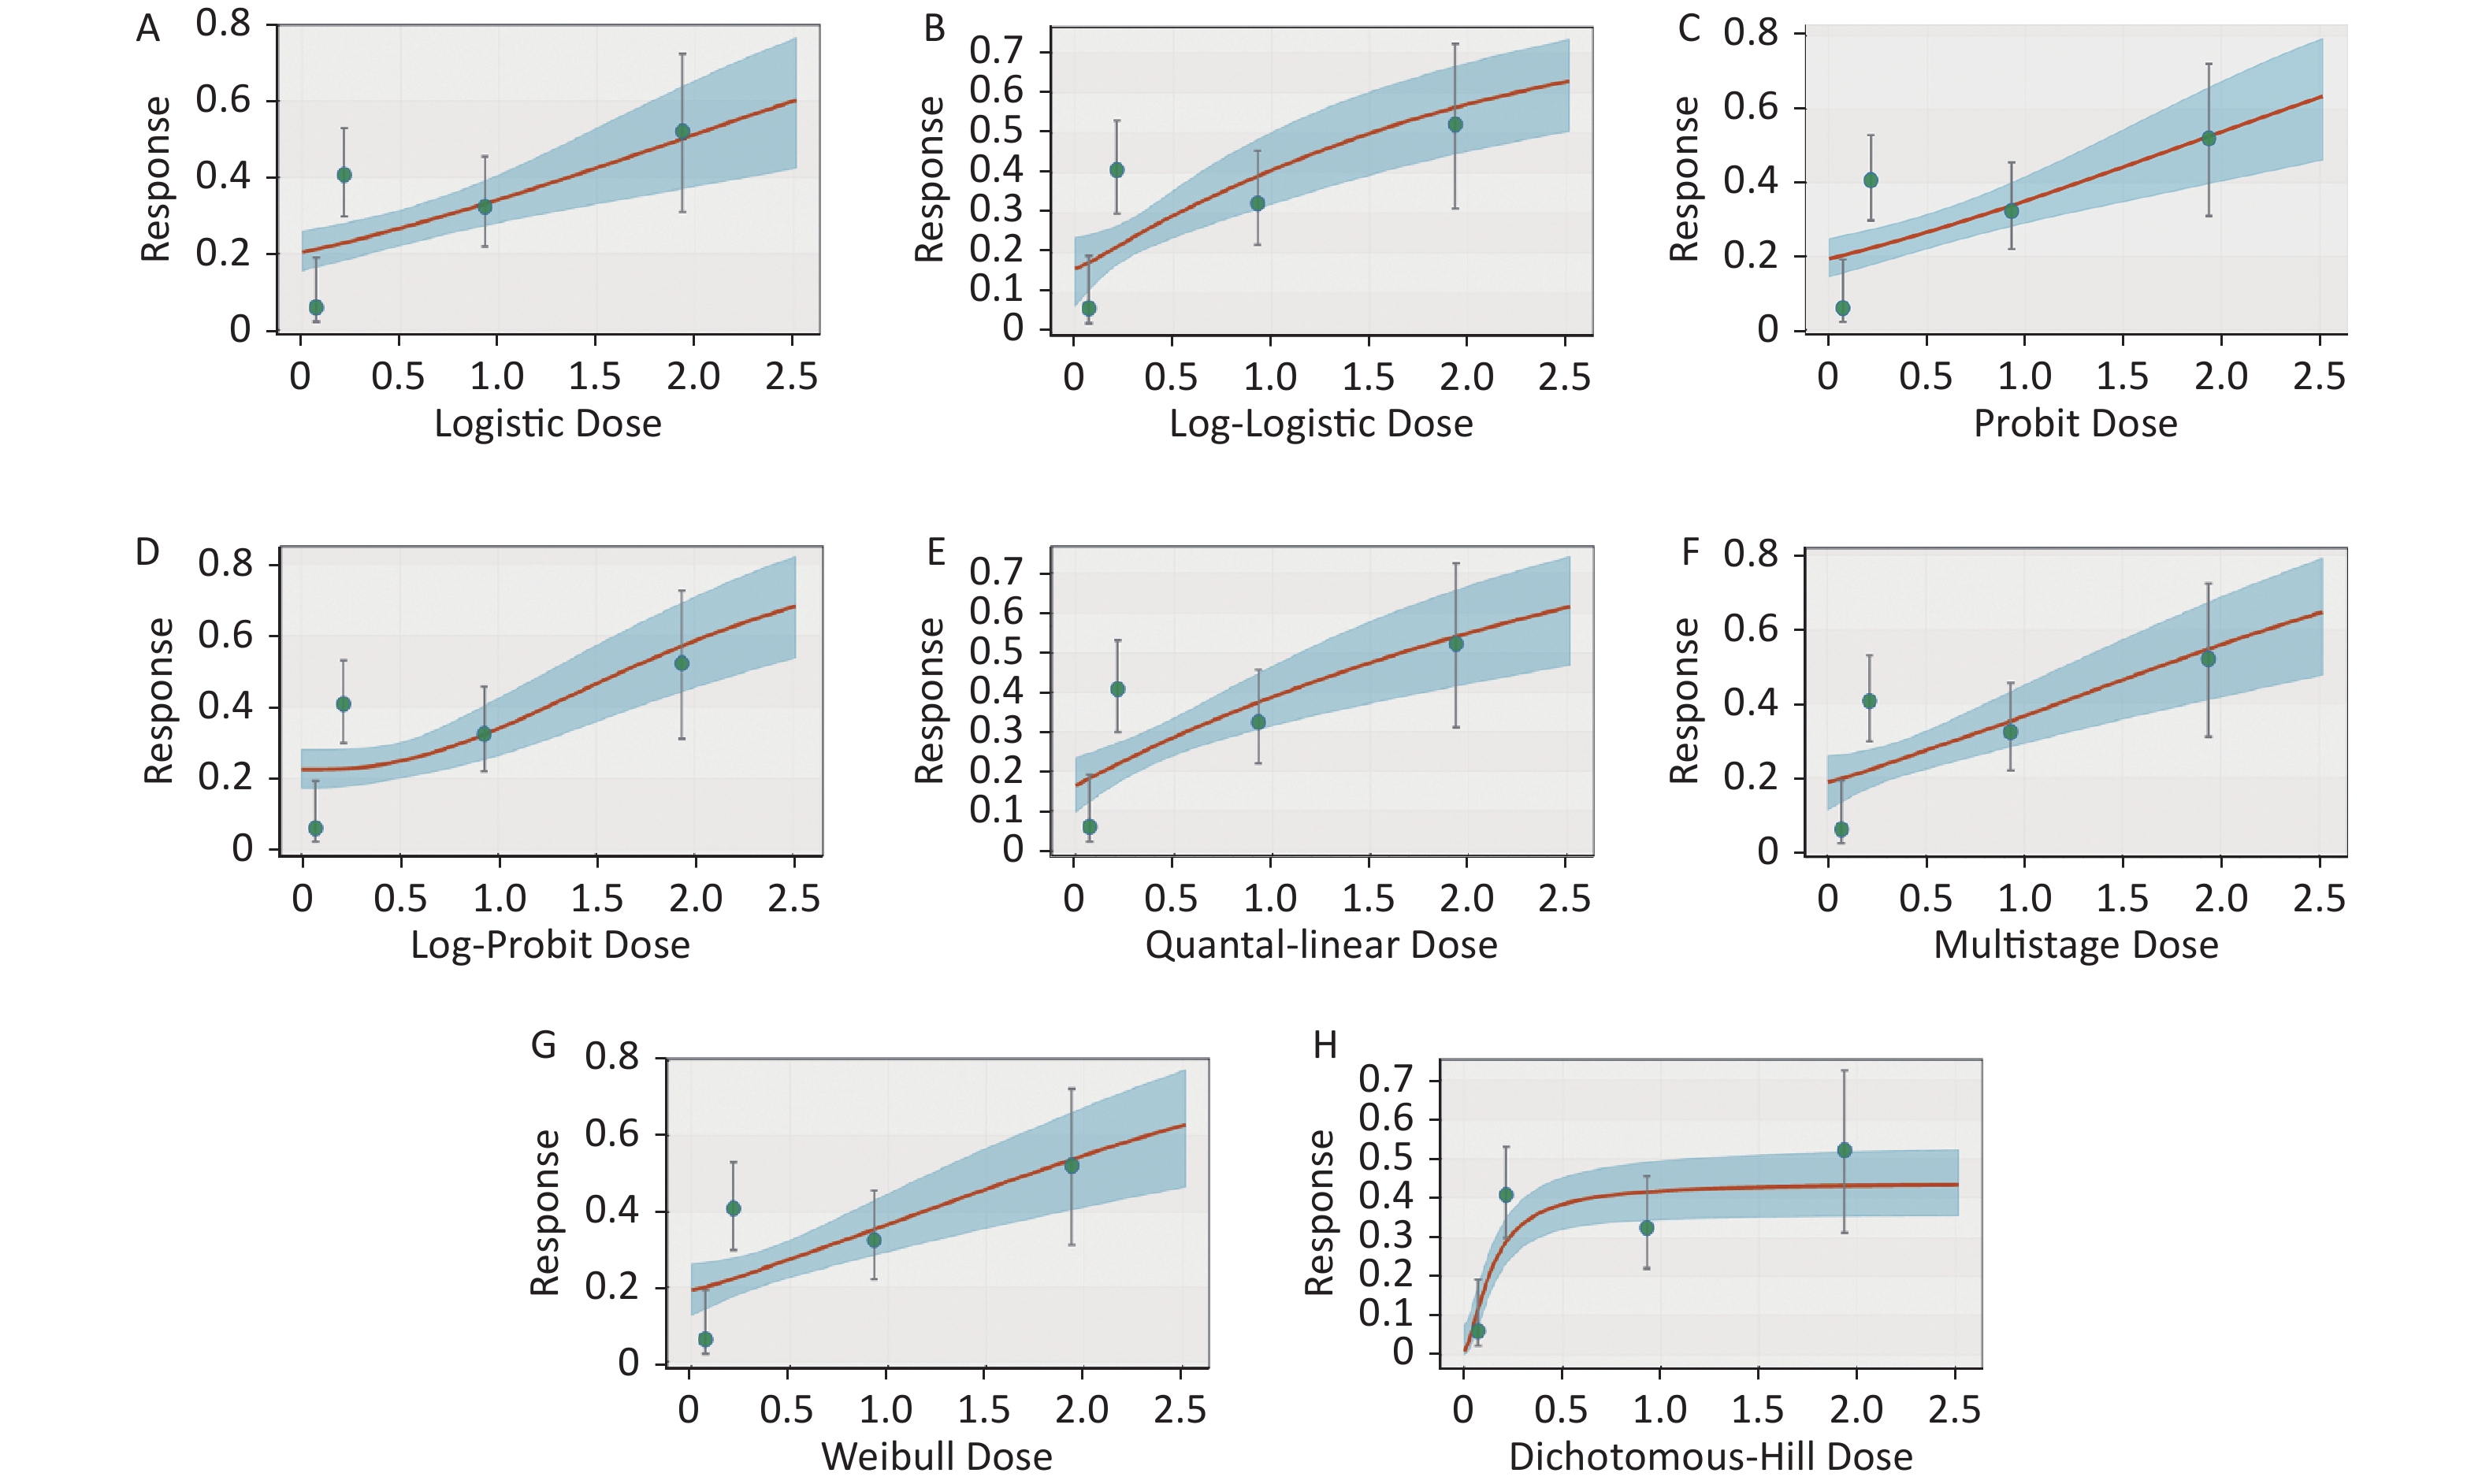
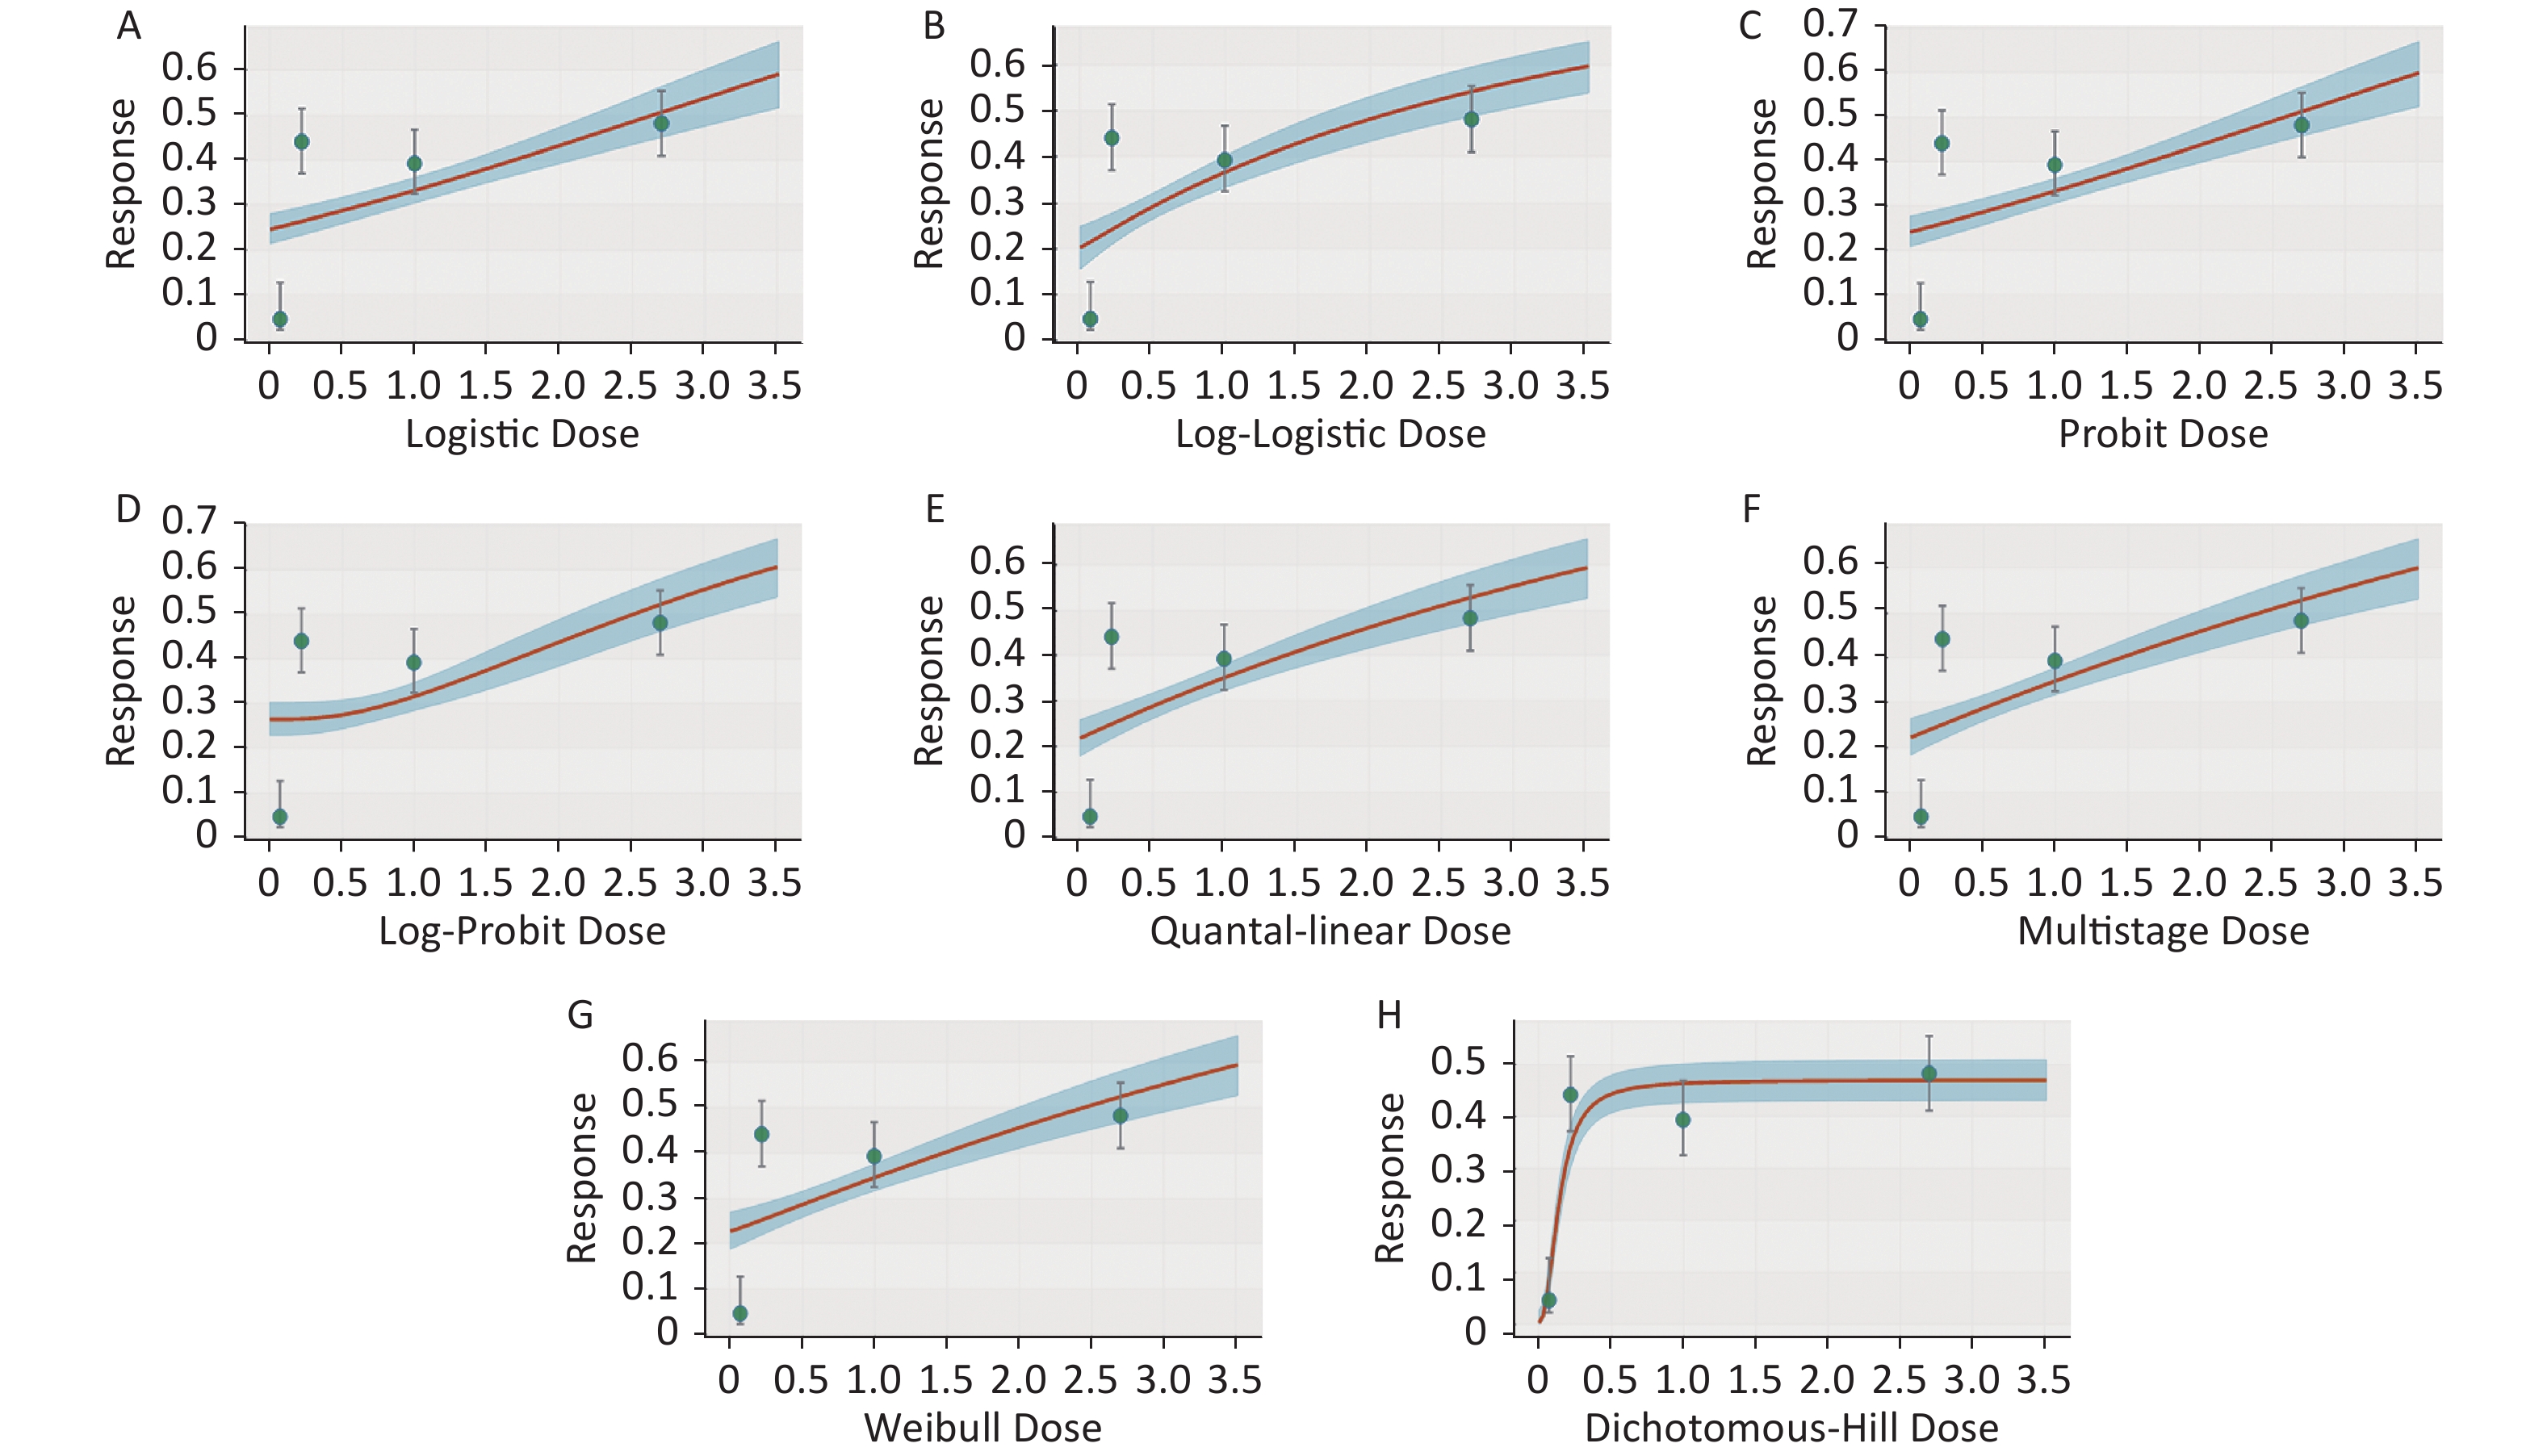
According to the BBMD technical guidelines, the Model-average was selected as the model with the best goodness of fit. As shown in Table 6, the model of the total population, male population, and female population all chose the Model-average. The BMD and BMDL in the total population were 0.100 and 0.068 mg/m3 per year, respectively. The BMD and BMDL in the males were 0.411 and 0.062 mg/m3 per year, respectively. In the females, the BMD and BMDL were 0.439 and 0.061 mg/m3 per year, respectively (Table 6, Supplementary Figures S1–S3, available in www.besjournal.com).
Table 6. Benchmark dose estimates for BBMD-based dichotomous data
Model BMD# BMDL# P Model weight Total Logistic 0.882 0.733 0.476 0.047 Log-logistic 0.841 0.700 0.441 0.060 Probit 0.573 0.442 0.377 0.093 Log-probit 0.616 0.462 0.385 0.071 Quantal-linear 0.668 0.485 0.389 0.065 Multistage 0.455 0.311 0.382 0.119 Weibull 1.221 0.931 0.381 0.032 Dichotomous-Hill 0.080 0.064 0.649 0.512 Model-average 0.100 0.068 − 1.000 Male Logistic 0.977 0.780 0.461 0.052 Log-logistic 0.550 0.347 0.316 0.117 Probit 0.923 0.745 0.421 0.073 Log-probit 1.426 1.038 0.370 0.038 Quantal-linear 0.656 0.482 0.380 0.097 Multistage 0.733 0.507 0.387 0.079 Weibull 0.810 0.545 0.394 0.064 Dichotomous-Hill 0.079 0.057 0.642 0.480 Model-average 0.411 0.063 − 1.000 Female Logistic 0.619 0.443 0.489 0.096 Log-logistic 0.323 0.149 0.359 0.153 Probit 0.553 0.409 0.436 0.127 Log-probit 0.856 0.553 0.438 0.072 Quantal-linear 0.343 0.217 0.409 0.151 Multistage 0.481 0.247 0.423 0.128 Weibull 0.512 0.275 0.433 0.103 Dichotomous-Hill 0.071 0.043 0.559 0.17 Model-average 0.439 0.061 − 1.000 Note. #: Unit is (mg/m3)·year. BMD: benchmark dose; BMDL: lower limit of 95% confidence interval of BMD. -
In the PROAST method, the optimal model is selected when the AIC value is the lowest. The model types are Gamma, Log-Logistic, Weibull, Log-Probit, Two-State, LVM-Expon.m5-, and LVM-Hill m5-. BMD of the total population, males, and females were 0.0787, 0.0791, and 0.0751 mg/m3 per year, respectively. The BMDL in the total population, males, and females were 0.0735, 0.0713, and 0.0671 mg/m3 per year, respectively (Table 7).
Table 7. Benchmark dose estimates for the PROAST-based dichotomous data
Subjects Optimal model n BMD# BMDL# AIC Total LVM-Hill m5- 782 0.0787 0.0735 884.8 Males LVM-Expon.m5- 529 0.0791 0.0713 616.5 Females LVM-Expon.m5- 253 0.0751 0.0671 272.9 Note. #: Unit is mg/m3 per year. BMD: benchmark dose; BMDL: lower limit of 95% confidence interval of BMD; AIC: Akaike information criterion. -
The total population was subdivided according to the total length of service (40 years for males and 35 years for females). The BMDL of the male population was 0.076 mg/m3 per year. The occupational exposure limits (OELs) of the male COEs was 0.00190 mg/m3. Based on the application guidelines of the BBMD, our results determined that the BMDL of the mtDNAcn damage was 0.068 mg/m3 per year in the total population, 0.063 mg/m3 per year in the males, and 0.061 mg/m3 per year in the females. The OELs is 0.00170 mg/m3 for the total population, 0.00158 mg/m3 for the males, and 0.00174 mg/m3 for the females. Based on the same calculation, in PROAST, the OELs of the total population, males, and females are 0.00184, 0.00178, and 0.00192 mg/m3, respectively (Table 8).
Table 8. Calculation results of the BMDS, BBMD, and PROAST
Subjects BMDS BBMD PROAST BMDL OELs BMDL OELs BMDL OELs Total − − 0.068 0.00170 0.0735 0.00184 Male 0.076 0.00190 0.063 0.00158 0.0713 0.00178 Female − − 0.061 0.00174 0.0671 0.00192 Note. BMDL: lower limit of the 95% confidence interval of the BMD; OELs: occupational exposure limits. BMDS: benchmark dose software; BBMD: bayesian benchmark dose modeling; PROAST: possible risk obtained from animal studies. -
The sources of COEs in our environment include coke production, asphalt mining, incomplete combustion of organic materials, and automotive exhaust. When working in a coke oven facility, various particles and volatile organic substances, especially PAHs, can enter the body through the skin or respiratory system and cause some harm to the mitochondria in the organism [19, 20]. Mounting evidence shows that long-term exposure to environmental contaminants may result in mitochondrial malfunction, which may eventually lead to human diseases [21, 22]. An abnormal mitochondrial function is associated with various complex human diseases, such as respiratory diseases [23], Alzheimer’s disease [24], cardiovascular diseases [25], and even cancer [26]. The mtDNAcn, a biomarker representing changes in the tissue metabolic state brought on by exposure to external detrimental stimuli, will indicate changes in the mitochondrial content and mitochondrial integrity [27].
Based on the study’s findings, the mtDNAcn was lower in the COEs exposure group (0.60 ± 0.29 vs. 1.03 ± 0.31), and this difference is statistically significant (P < 0.001). A dose-response connection between the CED-COEs and mtDNAcn was observed. The fact that the mtDNAcn decreased as the CED-COEs increased (P < 0.001) indicates that the mtDNAcn is a biomarker of COEs exposure. Pieters N’s study [28] found that when indoor non-volatile COEs levels doubled, the mitochondrial damage was negatively correlated with COEs exposure levels. Du et al. [29] examined the urine of 697 coke oven workers who had worked at the Shanxi coking plant for more than a year and found that PAHs urinary metabolites were negatively correlated with the peripheral blood mtDNAcn. The above results are consistent with the results of this study. Some studies have found that short-term exposure to environmental toxins may increase the mtDNAcn and increase the number of mitochondria to compensate for the damage, and long-term continuous exposure to pollutants may lead to a decrease in the mtDNAcn [30]. According to the analysis, CED-COEs in the total population, males, and females showed a dose-response relationship with the mtDNAcn damage rate. The mitochondrial damage rate increased with the increase in CED-COEs. Based on such interesting results, we further investigated to fully understand their impact on health risk assessment. This is the exposure limit that can be used as a new COEs exposure.
With the development of our society and economy, the importance we attach to occupational safety increases every year. Different countries have established OELs. China’s regulations published in 2019 limit the time-weighted allowable concentration of COEs to 0.1 mg/m3 (benzene soluble part) [31]. The TWA of COEs recommended by the National Institute for Occupational Safety & Health of the United States is 0.20 mg/m3 (benzene soluble part) for coke oven workers [32]. In addition, the permissible exposure limit set by the Occupational Safety and Health Administration in 1998 was 0.15 mg/m3 (benzene soluble portion) [33].
At present, the traditional level of unobserved adverse events has been replaced by the BMD to assess human health risks. In this study, we used three different calculation methods. The BBMD and PROAST use frequency-based statistical methods, but the BMDS is probabilistic [15]. The BMDS recommended by the USEPA can fit various types of data, among which the two most commonly used are dichotomy data and continuous data. The BMDS mainly conducts dose-response model fitting and parameter estimation based on the maximum likelihood method [34]. The BBMD is based on Bayesian analysis, and MCMC sampling is used for model parameter estimation and reference dose estimation. The BBMD can not only estimate the BMD of binary and continuous data but can also provide a method to incorporate prior information through the prior distribution of model parameters, which can improve the reliability of the dose-response model of inferior data. In addition, the BBMD can calculate the weight of the fitting model and further calculate the average reference dose of the model [35]. The web application for PROAST was created in the R programming language to make it simple to use. Its ability to compare dosage responses across several subgroups is an essential feature.
In the current investigation, the mtDNAcn was employed as a biomarker of exposure to occupational COEs for BMD analyses. According to the BMDS user guide, the fitting of the total population and female population model was not successful, but the fitting of the male population was successful. The above results show that the BMDS failed to fit the data of the total population and females. However, the BBMD successfully fitted the models of the total population, males, and females, which also confirmed that the BBMD procedure had less failure rate [15]. Through a variety of calculation methods, the exposure limit of PAHs was conservatively estimated to be 0.002 mg/m3. Although the difference between males and females was small, it still could not be ignored. Compared with current OELs, the BMDL estimated by the mtDNAcn as a biomarker of health damage caused by COEs was lower in this study. These findings suggest that the current recommended OELs may not be sufficient to protect coke oven workers and that the appropriate reduction of OELs may be considered to better protect the health of coke oven workers. Policymakers can appropriately increase the current emphasis on precision health risk assessment.
COEs exposure was measured using the BBMD at the telomere injury threshold in earlier research, resulting in COEs exposure limit of 0.024 mg/m3 for males and 0.018 mg/m3 for females (benzene soluble fraction) [11]. COEs exposure limits were calculated using oxidative damage values, and the reference COEs exposure limits were 0.037 mg/m3 for males and 0.021 mg/m3 for females [36]. These results are significantly higher than our findings, indicating that the mtDNAcn may be a more sensitive biomarker in COEs-exposed employees than telomere length and oxidative damage. These markers may not always indicate disease, but they can indicate a metabolic malfunction or accelerated aging, both of which are substantial alterations. Over the past 10 years, numerous studies have found links between telomere length and a variety of age-related illnesses, including osteoporosis, dementia, cancer, and cardiovascular disease [37].
However, the mtDNAcn may not be a disease endpoint and may be affected by certain conditions. Therefore, more population studies or in vitro experiments are needed to prove the results of this study.
-
In conclusion, this study shows that there is a dose-response relationship between COEs and mtDNAcn injury rate of peripheral leukocytes of coke oven workers; that is, the mtDNAcn decreased with the increase in CED-COEs. The results of the BDML were estimated by three methods, suggesting that lower exposure levels can better protect the susceptible population, which can provide a reference for the formulation of COEs exposure threshold and provide a good working environment for workers.
-
This research protocol was approved by the Ethics Committee of Zhengzhou University (ZZUIRB 2021−153). International and national ethical requirements for biomedical research were strictly observed during implementation, and informed consent forms were signed by the subjects.
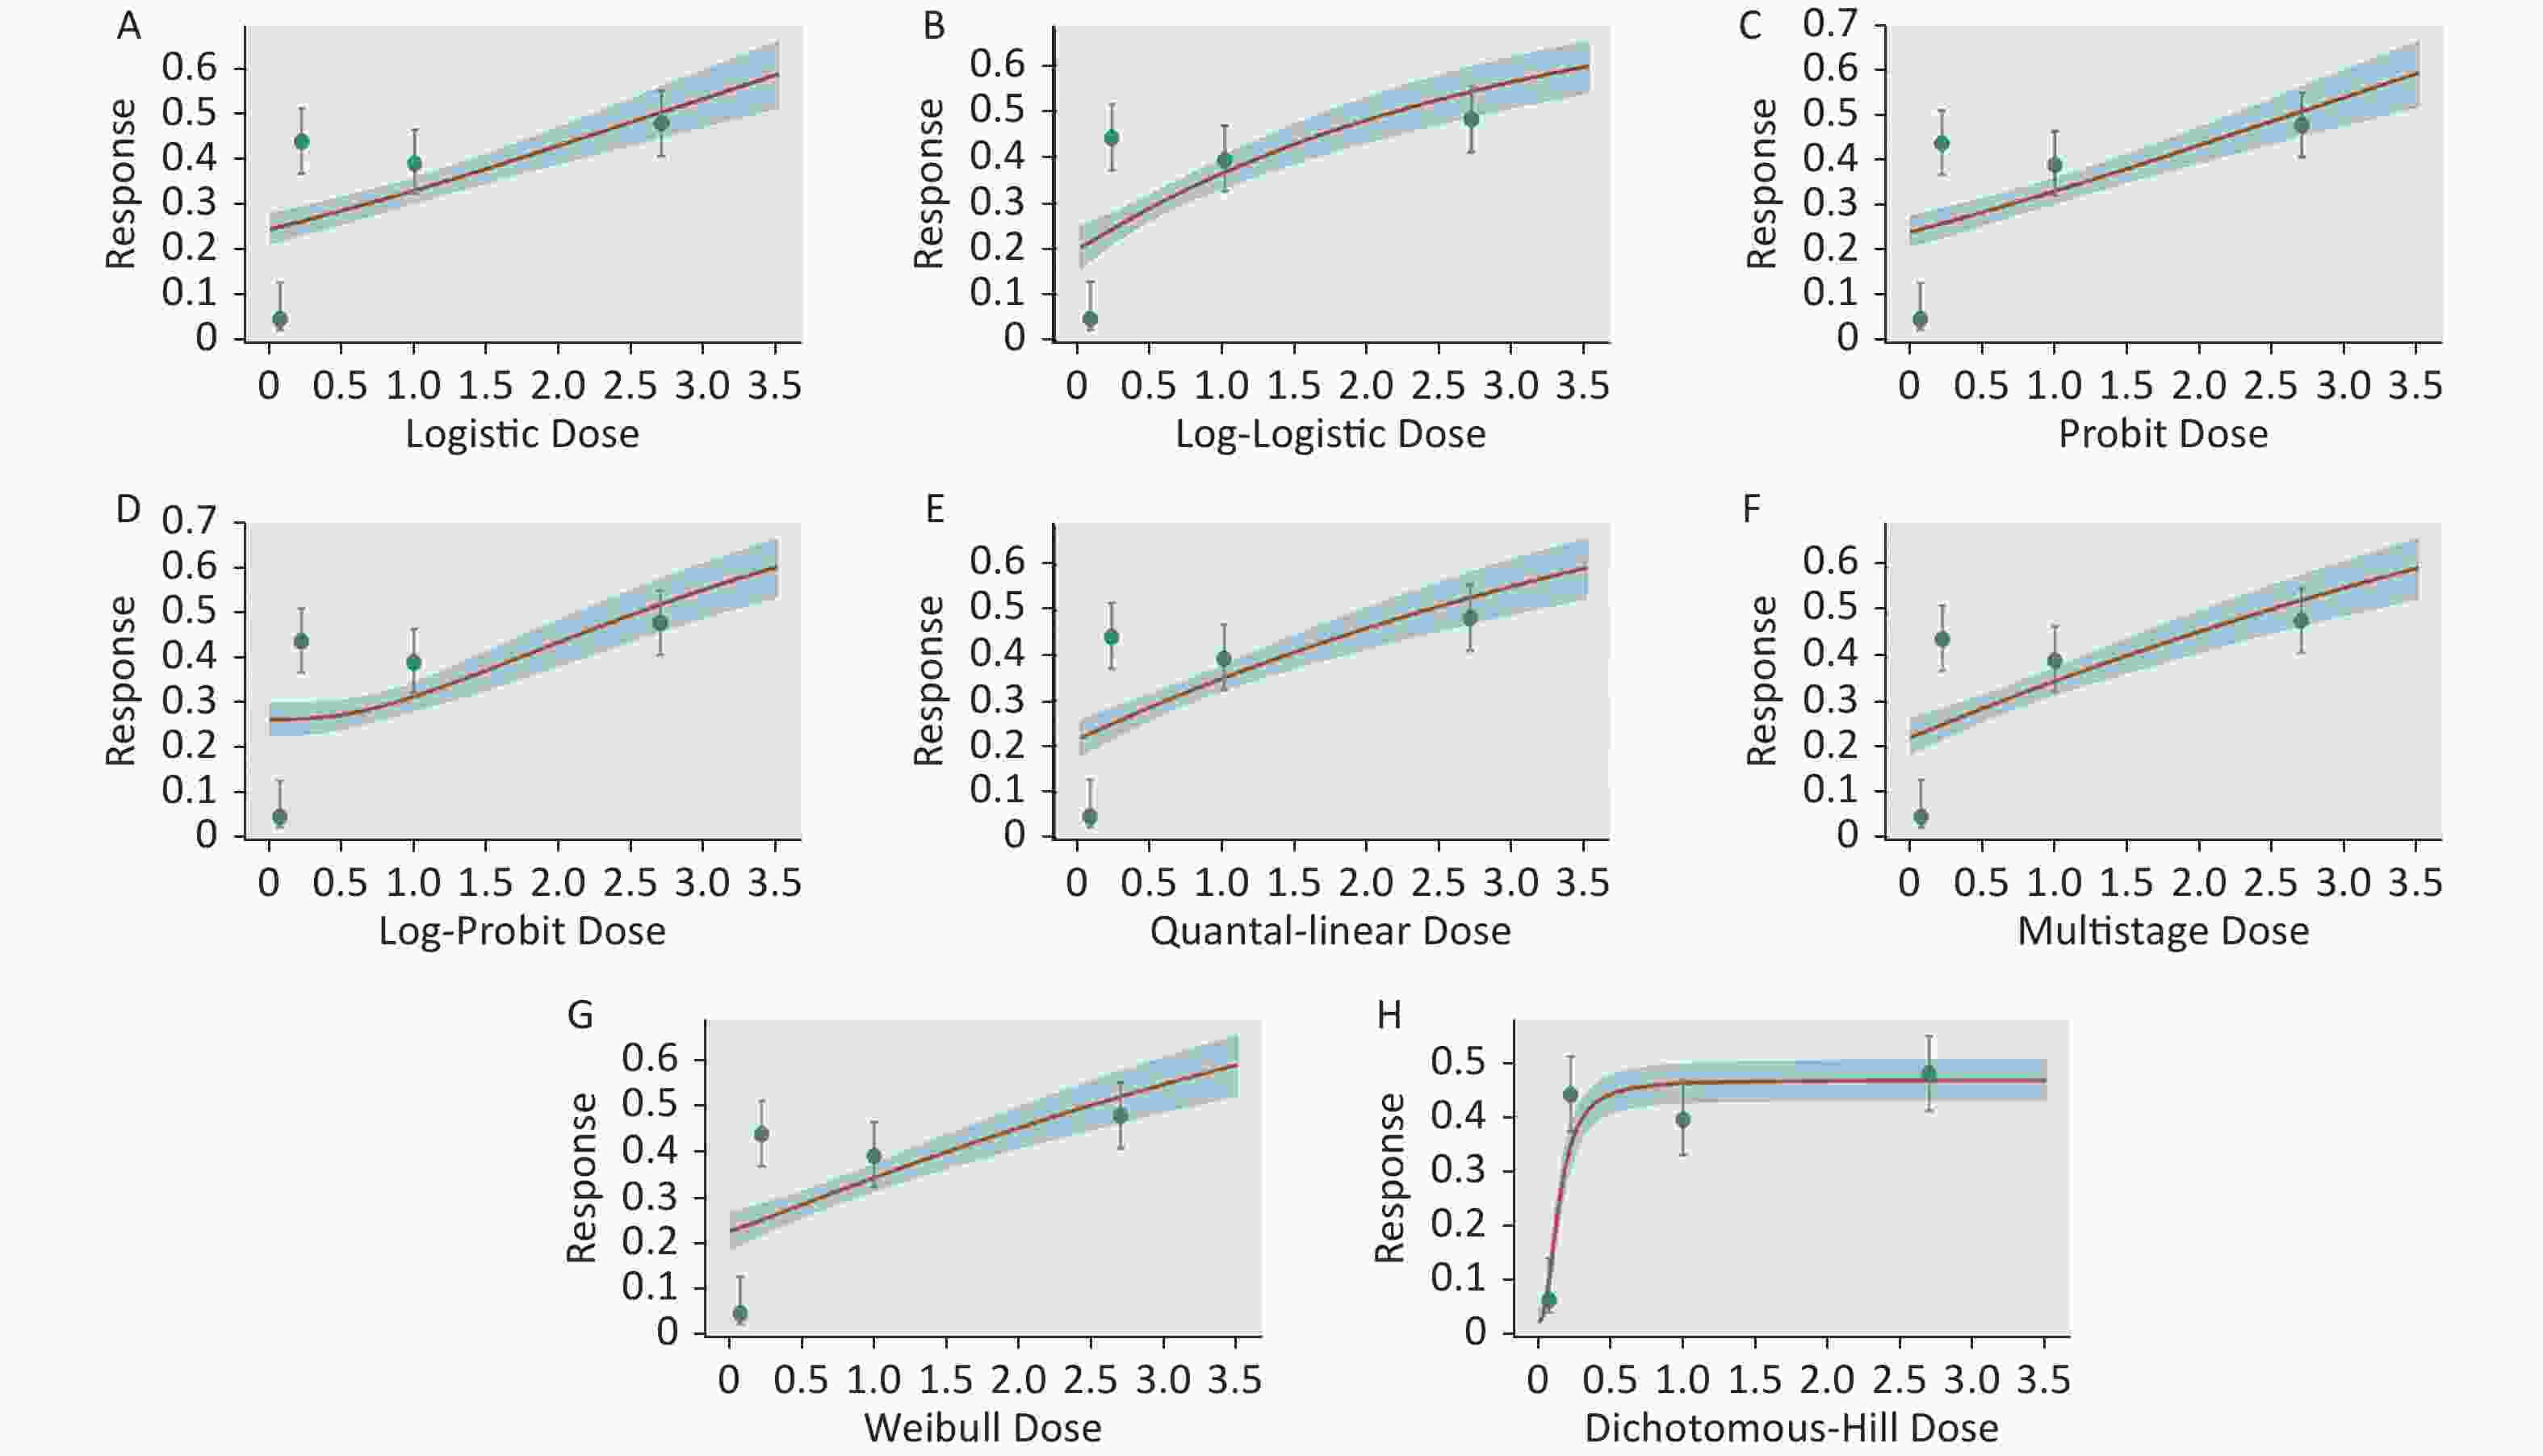
Figure S1. Dose-response relationship between CED-COEs and mitochondrial DNA copy number damage rate in the total population. (A) Logistic model (B) Log-Logistic model (C) Probit model (D) Log-Probit model (E) Quantal-linear model (F) Multistage model (G) Weibull model (H) Dichotomous-Hill model. The X-axis described the dose of CED-COEs and the Y-axis described the rates of mtDNAcn damage. This plot includes original dose-response data and a fitted curve with its 90th percentile interval shaded in blue.
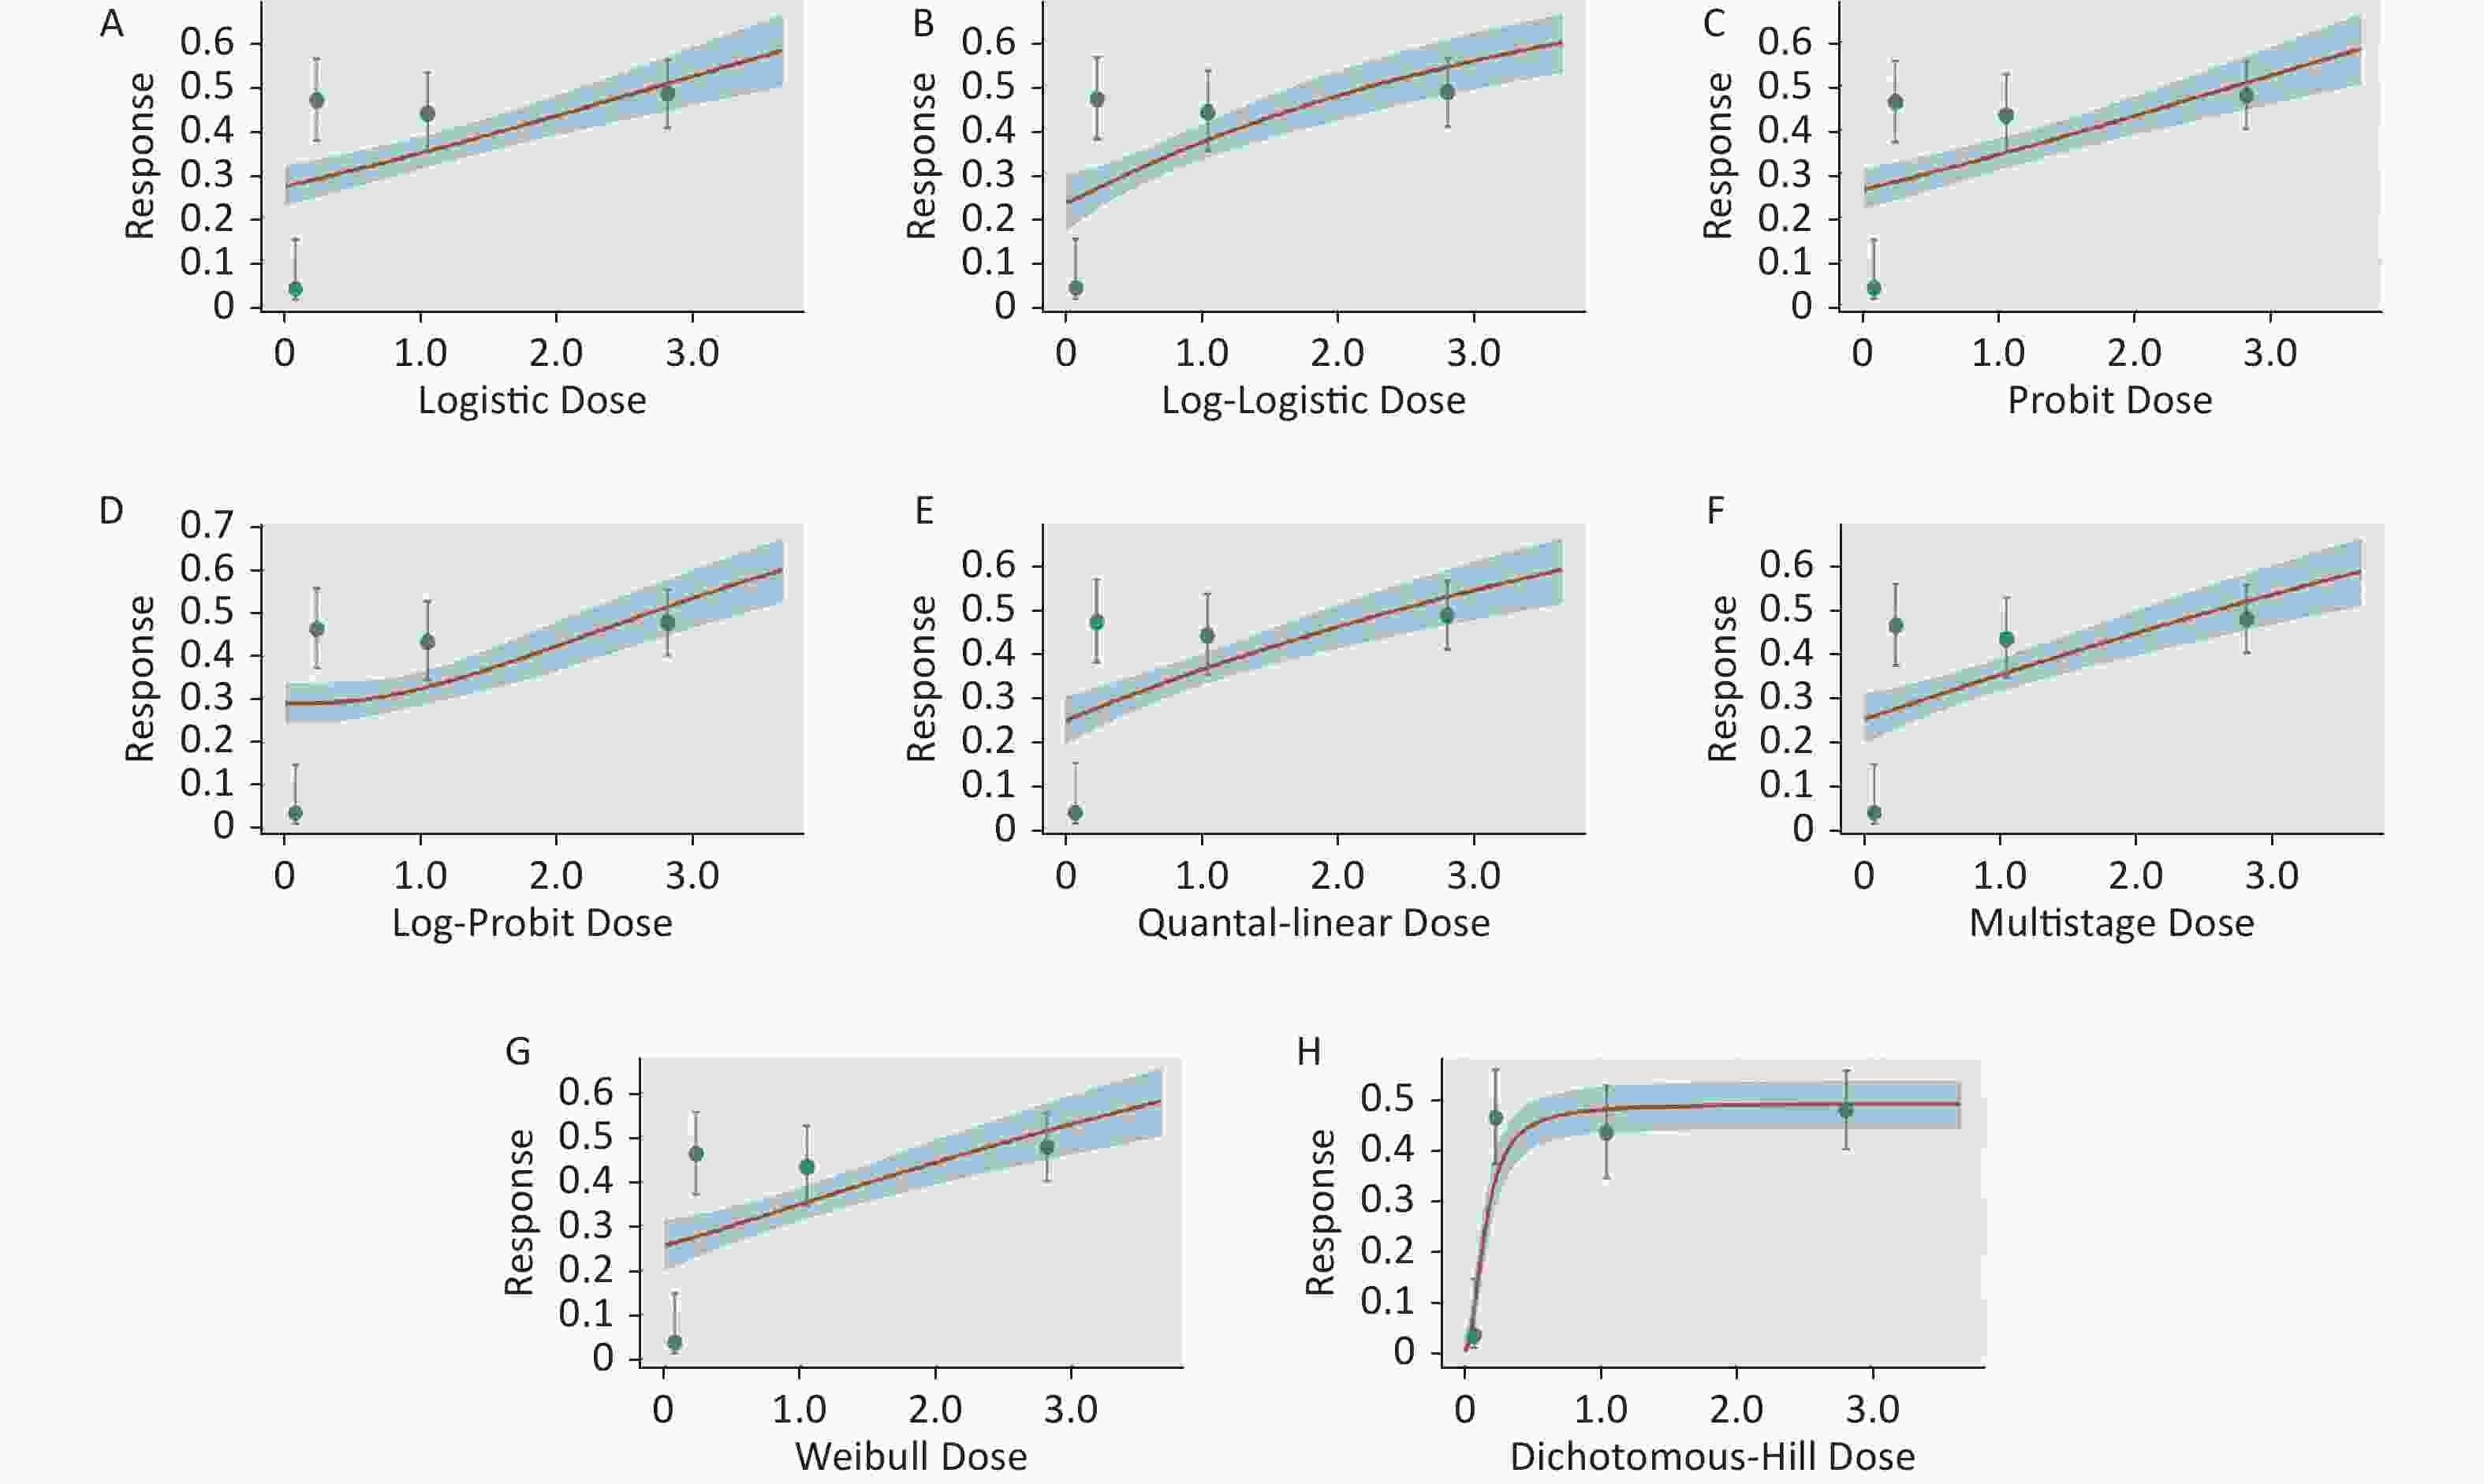
Figure S2. Dose-response relationship between CED-COEs and mitochondrial DNA copy number damage rate in male. (A) Logistic model (B) Log-Logistic model (C) Probit model (D) Log-Probit model (E) Quantal-linear model (F) Multistage model (G) Weibull model (H) Dichotomous-Hill model. The X-axis described the dose of CED-COEs and the Y-axis described the rates of mtDNAcn damage. This plot includes original dose-response data and a fitted curve with its 90th percentile interval shaded in blue.
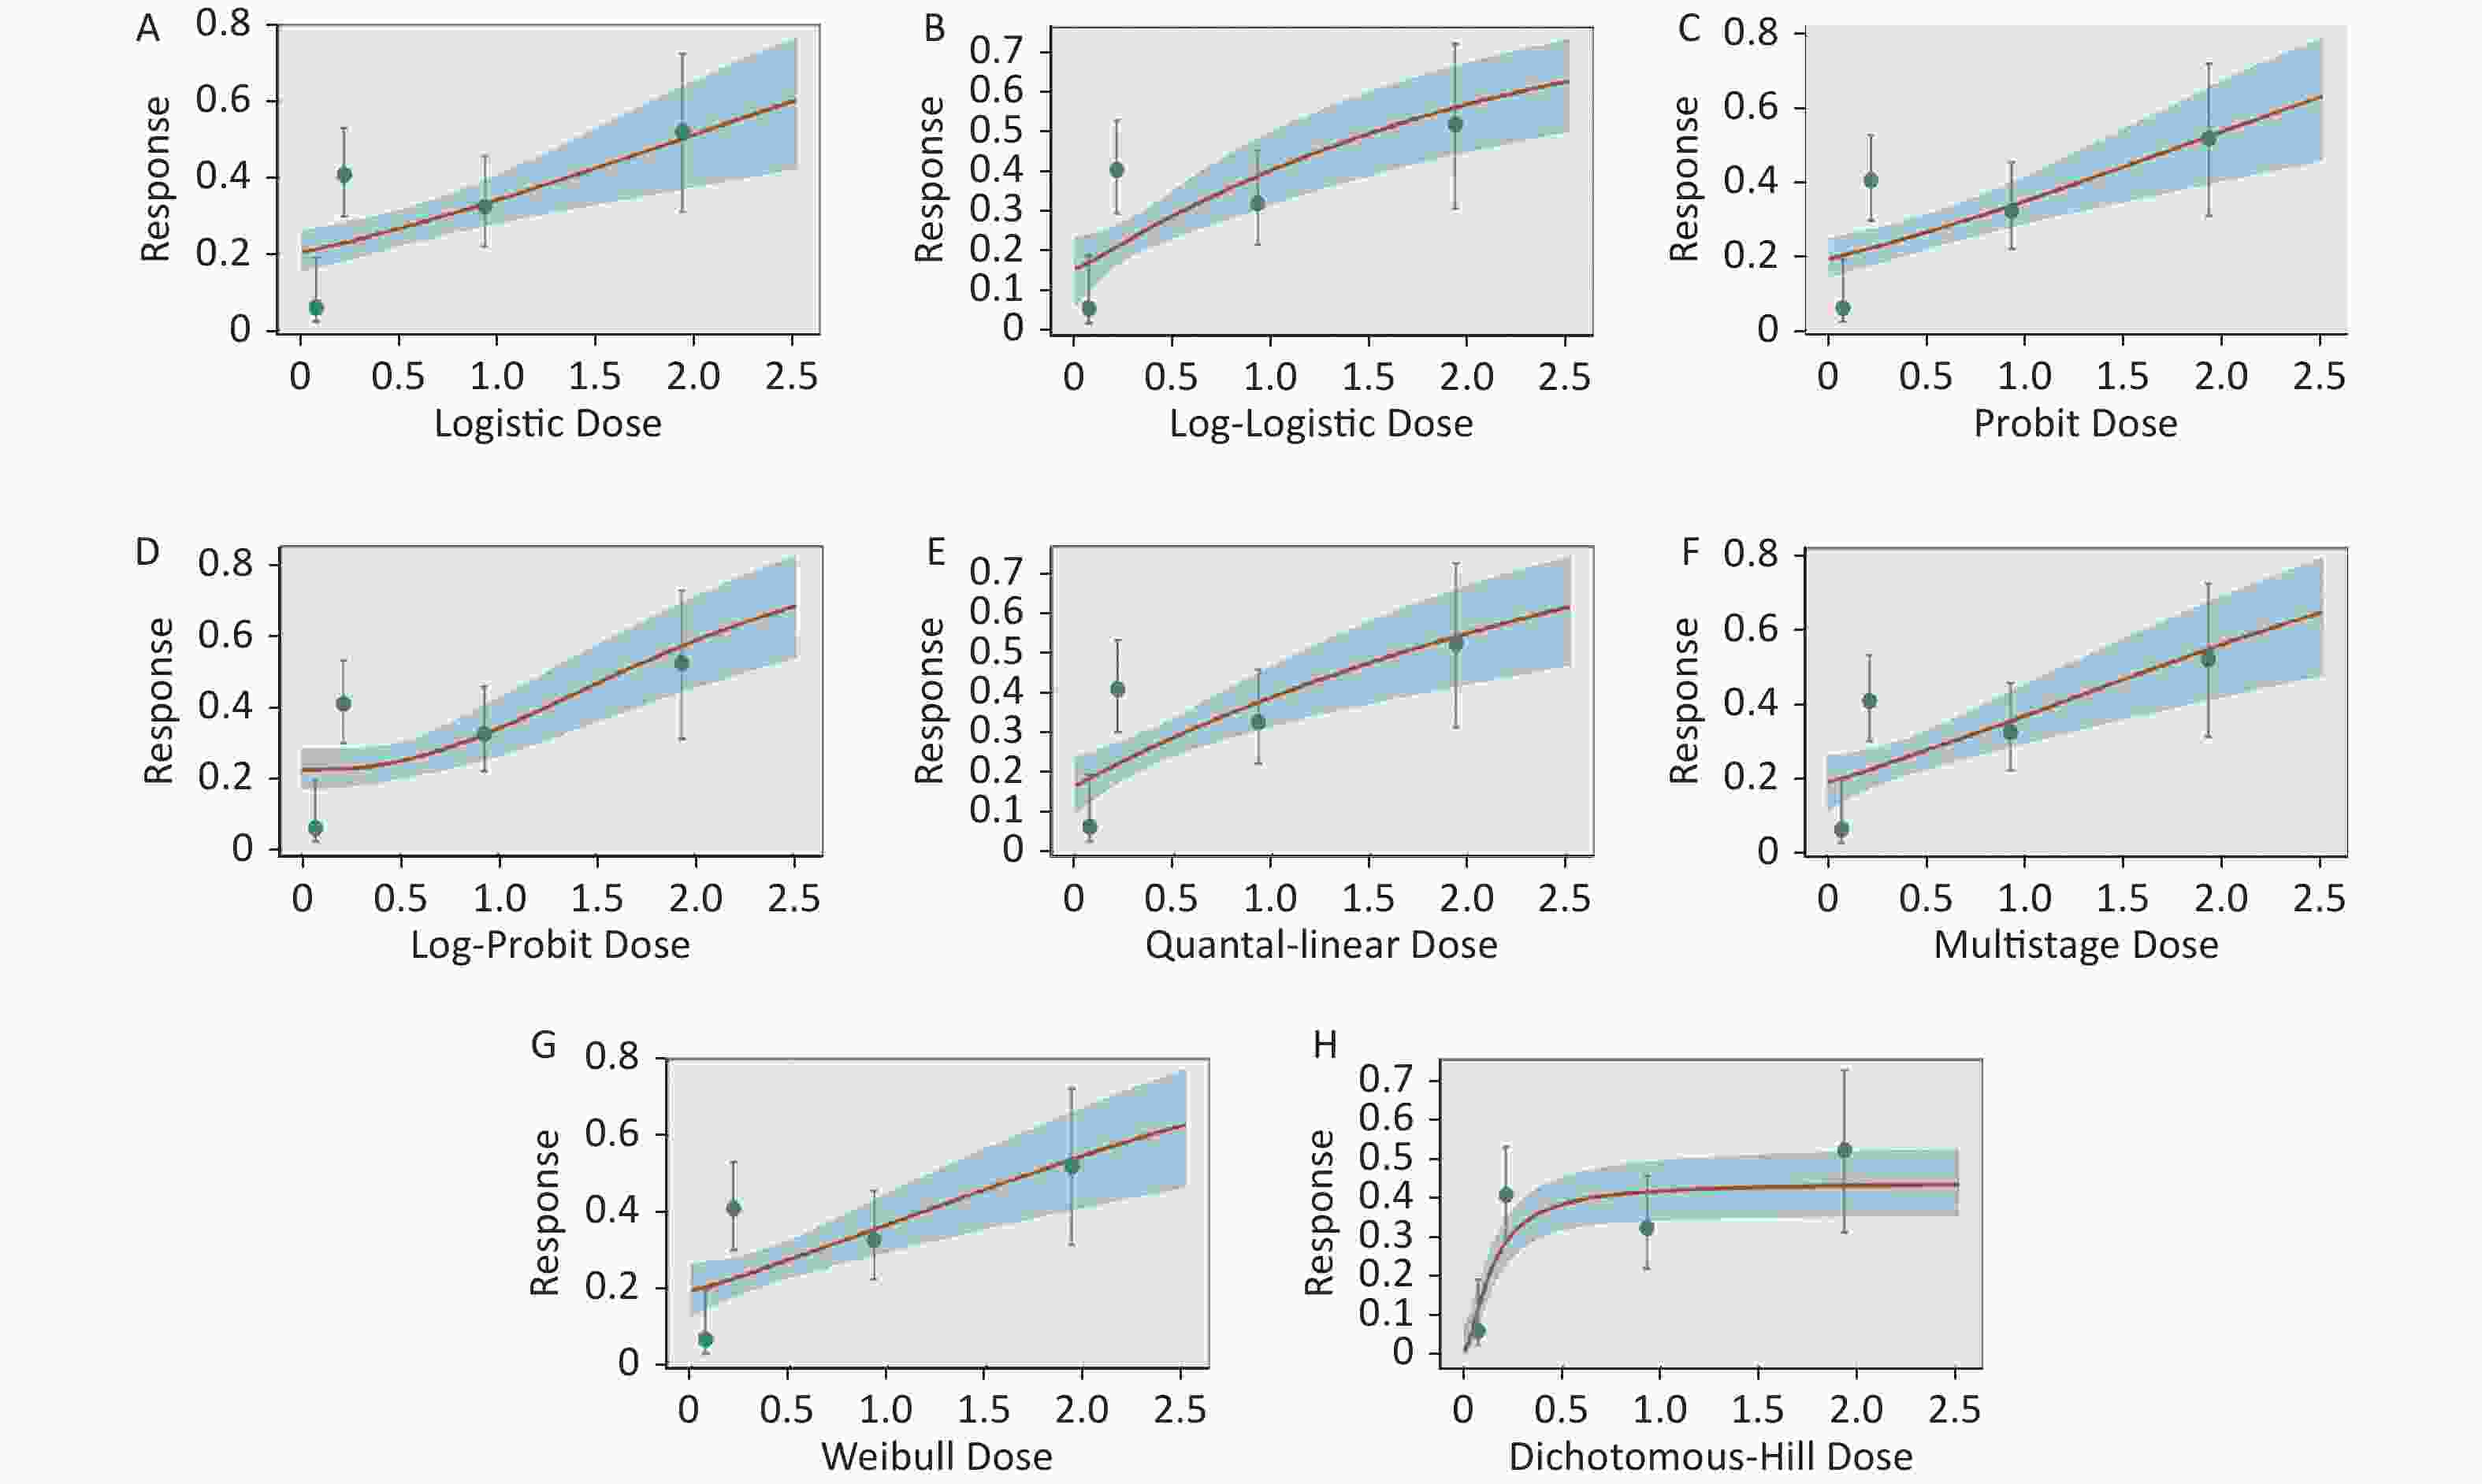
Figure S3. Dose-response relationship between CED-COEs and mitochondrial DNA copy number damage rate in female. (A) Logistic model (B) Log-Logistic model (C) Probit model (D) Log-Probit model (E) Quantal-linear model (F) Multistage model (G) Weibull model (H) Dichotomous-Hill model. The X-axis described the dose of CED-COEs and the Y-axis described the rates of mtDNAcn damage. This plot includes original dose-response data and a fitted curve with its 90th percentile interval shaded in blue.
doi: 10.3967/bes2023.060
Benchmark Dose Assessment for Coke Oven Emissions-Induced Mitochondrial DNA Copy Number Damage Effects
-
Abstract:
Objective The study aimed to estimate the benchmark dose (BMD) of coke oven emissions (COEs) exposure based on mitochondrial damage with the mitochondrial DNA copy number (mtDNAcn) as a biomarker. Methods A total of 782 subjects were recruited, including 238 controls and 544 exposed workers. The mtDNAcn of peripheral leukocytes was detected through the real-time fluorescence-based quantitative polymerase chain reaction. Three BMD approaches were used to calculate the BMD of COEs exposure based on the mitochondrial damage and its 95% confidence lower limit (BMDL). Results The mtDNAcn of the exposure group was lower than that of the control group (0.60 ± 0.29 vs. 1.03 ± 0.31; P < 0.001). A dose–response relationship was shown between the mtDNAcn damage and COEs. Using the Benchmark Dose Software, the occupational exposure limits (OELs) for COEs exposure in males was 0.00190 mg/m3. The OELs for COEs exposure using the BBMD were 0.00170 mg/m3 for the total population, 0.00158 mg/m3 for males, and 0.00174 mg/m3 for females. In possible risk obtained from animal studies (PROAST), the OELs of the total population, males, and females were 0.00184, 0.00178, and 0.00192 mg/m3, respectively. Conclusion Based on our conservative estimate, the BMDL of mitochondrial damage caused by COEs is 0.002 mg/m3. This value will provide a benchmark for determining possible OELs. -
Key words:
- Coke oven emissions /
- Mitochondrial DNA copy number /
- Benchmark dose /
- Occupational exposure limits
The authors declare no conflict of interest
&These authors contributed equally to this work.
注释:1) AUTHOR CONTRIBUTIONS: 2) CONFLICTS OF INTEREST: -
S1. Dose-response relationship between CED-COEs and mitochondrial DNA copy number damage rate in the total population. (A) Logistic model (B) Log-Logistic model (C) Probit model (D) Log-Probit model (E) Quantal-linear model (F) Multistage model (G) Weibull model (H) Dichotomous-Hill model. The X-axis described the dose of CED-COEs and the Y-axis described the rates of mtDNAcn damage. This plot includes original dose-response data and a fitted curve with its 90th percentile interval shaded in blue.
S2. Dose-response relationship between CED-COEs and mitochondrial DNA copy number damage rate in male. (A) Logistic model (B) Log-Logistic model (C) Probit model (D) Log-Probit model (E) Quantal-linear model (F) Multistage model (G) Weibull model (H) Dichotomous-Hill model. The X-axis described the dose of CED-COEs and the Y-axis described the rates of mtDNAcn damage. This plot includes original dose-response data and a fitted curve with its 90th percentile interval shaded in blue.
S3. Dose-response relationship between CED-COEs and mitochondrial DNA copy number damage rate in female. (A) Logistic model (B) Log-Logistic model (C) Probit model (D) Log-Probit model (E) Quantal-linear model (F) Multistage model (G) Weibull model (H) Dichotomous-Hill model. The X-axis described the dose of CED-COEs and the Y-axis described the rates of mtDNAcn damage. This plot includes original dose-response data and a fitted curve with its 90th percentile interval shaded in blue.
S1. Concentration of COEs exposed to each type of work in four coking plants workshops
Type of work TWA# Workshop-one Workshop-two Workshop-three Workshop-four Larry car operator 0.191 0.208 0.280 0.339 Stop car operator 0.165 0.189 0.115 0.208 Pusher car operator 0.070 0.058 0.064 0.115 Quench car operator 0.096 0.153 0.089 0.116 Temperature controller 0.080 0.084 0.099 0.215 Temperature measurer 0.083 0.100 0.086 0.133 Benchman coke side 0.081 0.070 0.096 0.096 Coke side machine operator 0.200 0.189 0.105 0.526 Furnace cover worker 0.068 0.099 0.102 0.165 Ascension pipe worker 0.169 0.122 0.102 0.183 Coke oven repairer 0.133 0.148 0.101 0.251 Supervisors 0.010 0.010 0.010 0.010 Note. TWA: Time weighted average concentration, #: unit is mg/m3. The reference standard of COEs concentration (calculated as benzene dissolved matter) was PC-TWA 0.1 mg/m3.  下载: 导出CSV
Table 1. General characteristics of COEs exposure and control group
Characteristics Control group (n = 238) Exposure group (n = 544) χ2/Z/t P Age (years)a, n (%) ≤ 40 142 (59.7) 273 (50.2) 5.974 0.015 > 40 96 (40.3) 271 (49.8) Gendera, n (%) Male 139 (58.4) 390 (71.7) 13.357 < 0.001 Female 99 (41.6) 154 (28.3) Smokinga, n (%) No 197 (82.8) 321 (59.0) 41.817 < 0.001 Yes 41 (17.2) 223 (41.0) Drinkinga, n (%) No 138 (58.0) 248 (45.6) 10.176 0.001 Yes 100 (42.0) 296 (54.4) ΒΜΙ (kg/m2)a, n (%) < 18.5 5 (2.1) 12 (2.2) 2.995 0.392 18.5–23.9 108 (45.4) 224 (41.2) 24.0–27.9 101 (42.4) 229 (42.3) ≥ 28.0 24 (10.1) 78 (14.3) CED-COEsb, P50 (P25, P75) 0.07 (0.06, 0.09) 1.12 (0.34, 2.14) 22.093 < 0.001 mtDNAcnc, Mean ± SD 1.03 ± 0.31 0.60 ± 0.29 18.931 < 0.001 Note. Smoking was defined as smoking more than one cigarette a day and lasting more than half a year. Drinking was defined as drinking more than twice a week in the last six months. BMI: body mass index; CED: cumulative exposure dose; COEs: coke oven emissions. a: P values derived from χ2 for categorical variables. b: P values derived from Mann–Whitney U test for categorical variables. c: P values derived from the t-test for continuous variables.
下载: 导出CSV
Table 2. Association of demographic characteristics with the mitochondrial DNA copy number
Characteristics Control group Exposure group t Pa n Mean ± SD n Mean ± SD Age (years) ≤ 40 142 1.05 ± 0.31 273 0.60 ± 0.28 15.294 < 0.001 > 40 96 1.01 ± 0.30 271 0.60 ± 0.31 11.229 < 0.001 t 1.100 −0.036 Pa 0.273 0.971 Gender Male 139 1.00 ± 0.28 390 0.59 ± 0.30 14.426 < 0.001 Female 99 1.08 ± 0.34 154 0.62 ± 0.29 11.521 < 0.001 t −2.075 −1.280 Pa 0.039 0.201 Smoking No 197 1.04 ± 0.32 321 0.60 ± 0.29 16.184 < 0.001 Yes 41 0.99 ± 0.27 223 0.59 ± 0.29 8.204 < 0.001 t 0.909 0.405 Pa 0.364 0.685 Drinking No 138 1.05 ± 0.33 248 0.61 ± 0.30 13.260 < 0.001 Yes 100 1.01 ± 0.27 296 0.58 ± 0.29 13.052 < 0.001 t 0.939 1.383 Pa 0.349 0.167 BMI (kg/m2) < 18.5 5 1.05 ± 0.22 12 0.70 ± 0.29 2.427 0.028 18.5–23.9 108 1.01 ± 0.33 224 0.61 ± 0.30 10.942 < 0.001 24.0−27.9 101 1.06 ± 0.29 230 0.58 ± 0.28 14.388 < 0.001 ≥ 28.0 24 1.03 ± 0.30 78 0.58 ± 0.33 6.039 < 0.001 J–T 0.366 1.095 Pc 0.778 0.351 Note. BMI: body mass index. a: P values derived from the two-sample t-test. b: P values derived from the variance analysis. c: P values derived from the Jonckheere-Terpstra test.
下载: 导出CSV
Table 3. Differences in the mtDNAcn by different CED-COEs levels
CED−COEs [(mg/m3)·year] n Mean ± SD β (95% CI) χ2 P < 0.092 196 1.03 ± 0.31 Reference 0.092− 195 0.67 ± 0.36 −0.404 (−0.471, −0.338) 142.108 < 0.001 0.423− 196 0.63 ± 0.28 −0.416 (−0.479, −0.353) 166.937 < 0.001 ≥ 1.686 195 0.59 ± 0.30 −0.462 (−0.529, −0.394) 178.853 < 0.001 P-trend < 0.001 Note. CED: cumulative exposure dose; COEs: coke oven emissions. The model was adjusted for gender, age, smoking, drinking, and BMI.
下载: 导出CSV
Table 4. Trend tests for mitochondrial DNA damage at different CED-COEs levels
CED-COEs [(mg/m3)·year] Total Male Female + − % + − % + − % < 0.092 9 187 4.59 4 109 3.54 5 78 6.02 0.092− 86 109 44.10 55 64 46.22 31 45 40.79 0.423− 77 119 39.29 54 71 43.20 23 48 32.39 ≥ 1.686 94 101 48.21 82 90 47.67 12 11 52.17 χ2 104.360 69.184 33.350 P-trend < 0.001 < 0.001 < 0.001 Notes. “+” represents subjects with mitochondrial DNA damage. “−” represents subjects without mitochondrial DNA damage.
下载: 导出CSV
Table 5. BMD and BMDL estimation of the mitochondrial DNA damage
Subjects n g v a b BMD# BMDL# AIC Goodness of fit χ2 P Male 529 0 0.461 12.054 5.466 0.087 0.076 614.552 0.640 0.424 Note. Dichotomous-Hill model; #: unit is (mg/m3)·year. BMD: benchmark dose; BMDL: lower limit of 95% confidence interval of BMD; AIC: Akaike information criterion; g: background; v: maximum probability of response predicted by the mode; a: intercept; b: slope.
下载: 导出CSV
Table 6. Benchmark dose estimates for BBMD-based dichotomous data
Model BMD# BMDL# P Model weight Total Logistic 0.882 0.733 0.476 0.047 Log-logistic 0.841 0.700 0.441 0.060 Probit 0.573 0.442 0.377 0.093 Log-probit 0.616 0.462 0.385 0.071 Quantal-linear 0.668 0.485 0.389 0.065 Multistage 0.455 0.311 0.382 0.119 Weibull 1.221 0.931 0.381 0.032 Dichotomous-Hill 0.080 0.064 0.649 0.512 Model-average 0.100 0.068 − 1.000 Male Logistic 0.977 0.780 0.461 0.052 Log-logistic 0.550 0.347 0.316 0.117 Probit 0.923 0.745 0.421 0.073 Log-probit 1.426 1.038 0.370 0.038 Quantal-linear 0.656 0.482 0.380 0.097 Multistage 0.733 0.507 0.387 0.079 Weibull 0.810 0.545 0.394 0.064 Dichotomous-Hill 0.079 0.057 0.642 0.480 Model-average 0.411 0.063 − 1.000 Female Logistic 0.619 0.443 0.489 0.096 Log-logistic 0.323 0.149 0.359 0.153 Probit 0.553 0.409 0.436 0.127 Log-probit 0.856 0.553 0.438 0.072 Quantal-linear 0.343 0.217 0.409 0.151 Multistage 0.481 0.247 0.423 0.128 Weibull 0.512 0.275 0.433 0.103 Dichotomous-Hill 0.071 0.043 0.559 0.17 Model-average 0.439 0.061 − 1.000 Note. #: Unit is (mg/m3)·year. BMD: benchmark dose; BMDL: lower limit of 95% confidence interval of BMD.
下载: 导出CSV
Table 7. Benchmark dose estimates for the PROAST-based dichotomous data
Subjects Optimal model n BMD# BMDL# AIC Total LVM-Hill m5- 782 0.0787 0.0735 884.8 Males LVM-Expon.m5- 529 0.0791 0.0713 616.5 Females LVM-Expon.m5- 253 0.0751 0.0671 272.9 Note. #: Unit is mg/m3 per year. BMD: benchmark dose; BMDL: lower limit of 95% confidence interval of BMD; AIC: Akaike information criterion.
下载: 导出CSV
Table 8. Calculation results of the BMDS, BBMD, and PROAST
Subjects BMDS BBMD PROAST BMDL OELs BMDL OELs BMDL OELs Total − − 0.068 0.00170 0.0735 0.00184 Male 0.076 0.00190 0.063 0.00158 0.0713 0.00178 Female − − 0.061 0.00174 0.0671 0.00192 Note. BMDL: lower limit of the 95% confidence interval of the BMD; OELs: occupational exposure limits. BMDS: benchmark dose software; BBMD: bayesian benchmark dose modeling; PROAST: possible risk obtained from animal studies.
下载: 导出CSV
-
[1] Sun KL, Song Y, He FL, et al. A review of human and animals exposure to polycyclic aromatic hydrocarbons: health risk and adverse effects, photo-induced toxicity and regulating effect of microplastics. Sci Total Environ, 2021; 773, 145403. doi: 10.1016/j.scitotenv.2021.145403 [2] Pavanello S, Dioni L, Hoxha M, et al. Mitochondrial DNA copy number and exposure to polycyclic aromatic hydrocarbons. Cancer Epidemiol Biomarkers Prev, 2013; 22, 1722−9. doi: 10.1158/1055-9965.EPI-13-0118 [3] Filograna R, Mennuni M, Alsina D, et al. Mitochondrial DNA copy number in human disease: the more the better? FEBS Lett, 2021; 595, 976−1002. [4] Fukunaga H. Mitochondrial DNA copy number and developmental origins of health and disease (DOHaD). Int J Mol Sci, 2021; 22, 6634. doi: 10.3390/ijms22126634 [5] Roubicek DA, de Souza-Pinto NC. Mitochondria and mitochondrial DNA as relevant targets for environmental contaminants. Toxicology, 2017; 391, 100−8. doi: 10.1016/j.tox.2017.06.012 [6] Castellani CA, Longchamps RJ, Sun J, et al. Thinking outside the nucleus: mitochondrial DNA copy number in health and disease. Mitochondrion, 2020; 53, 214−23. doi: 10.1016/j.mito.2020.06.004 [7] Bansal S, Leu AN, Gonzalez FJ, et al. Mitochondrial targeting of cytochrome P450 (CYP) 1B1 and its role in polycyclic aromatic hydrocarbon-induced mitochondrial dysfunction. J Biol Chem, 2014; 289, 9936−51. doi: 10.1074/jbc.M113.525659 [8] Golden TR, Melov S. Mitochondrial DNA mutations, oxidative stress, and aging. Mech Ageing Dev, 2001; 122, 1577−89. doi: 10.1016/S0047-6374(01)00288-3 [9] Filipsson AF, Sand S, Nilsson J, et al. The benchmark dose method-review of available models, and recommendations for application in health risk assessment. Crit Rev Toxicol, 2003; 33, 505−42. [10] Crump KS. A new method for determining allowable daily intakes. Fundam Appl Toxicol, 1984; 4, 854−71. doi: 10.1016/0272-0590(84)90107-6 [11] Wang W, Wang PP, Wang SH, et al. Benchmark dose assessment for coke oven emissions-induced telomere length effects in occupationally exposed workers in China. Ecotoxicol Environ Saf, 2019; 182, 109453. doi: 10.1016/j.ecoenv.2019.109453 [12] Wang W, Qiu YL, Jiao J, et al. Genotoxicity in vinyl chloride-exposed workers and its implication for occupational exposure limit. Am J Ind Med, 2011; 54, 800−10. doi: 10.1002/ajim.20990 [13] Duan XR, Yang YL, Zhang DP, et al. Genetic polymorphisms, mRNA expression levels of telomere-binding proteins, and associates with telomere damage in PAHs-Exposure workers. Chemosphere, 2019; 231, 442−9. doi: 10.1016/j.chemosphere.2019.05.134 [14] Duan XR, Yang YL, Zhang H, et al. Polycyclic aromatic hydrocarbon exposure, miRNA genetic variations, and associated leukocyte mitochondrial DNA copy number: a cross-sectional study in China. Chemosphere, 2020; 246, 125773. doi: 10.1016/j.chemosphere.2019.125773 [15] Shao K, Shapiro AJ. A web-based system for bayesian benchmark dose estimation. Environ Health Perspect, 2018; 126, 017002. doi: 10.1289/EHP1289 [16] RIVM. PROAST. the Netherlands Ministry of Health, Welfare and Sport (VWS). 2012. http://www.rivm.nl/en/Documents_and_publications/Scientific/Models/PROAST. [2022−06−16]. [17] Davis JA, Gift JS, Zhao QJ. Introduction to benchmark dose methods and U. S. EPA's benchmark dose software (BMDS) version 2.1. 1. Toxicol Appl Pharmacol, 2011; 254, 181−91. doi: 10.1016/j.taap.2010.10.016 [18] Committee EFSAS, Hardy A, Benford D, et al. Update: use of the benchmark dose approach in risk assessment. EFSA J, 2017; 15, e04658. [19] Gao ML, Chen L, Li YF, et al. Synergistic increase of oxidative stress and tumor markers in PAH-exposed workers. Asian Pac J Cancer Prev, 2014; 15, 7105−12. doi: 10.7314/APJCP.2014.15.17.7105 [20] Hu Y, Chen B, Yin Z, et al. Increased risk of chronic obstructive pulmonary diseases in coke oven workers: interaction between occupational exposure and smoking. Thorax, 2006; 61, 290−5. doi: 10.1136/thx.2005.051524 [21] Carugno M, Pesatori AC, Dioni L, et al. Increased mitochondrial DNA copy number in occupations associated with low-dose benzene exposure. Environ Health Perspect, 2012; 120, 210−5. doi: 10.1289/ehp.1103979 [22] Pieters N, Janssen BG, Dewitte H, et al. Biomolecular markers within the core axis of aging and particulate air pollution exposure in the elderly: a cross-sectional study. Environ Health Perspect, 2016; 124, 943−50. doi: 10.1289/ehp.1509728 [23] Białas AJ, Sitarek P, Miłkowska-Dymanowska J, et al. The role of mitochondria and oxidative/antioxidative imbalance in pathobiology of chronic obstructive pulmonary disease. Oxid Med Cell Longev, 2016; 2016, 7808576. [24] Guo CY, Sun L, Chen XP, et al. Oxidative stress, mitochondrial damage and neurodegenerative diseases. Neural Regen Res, 2013; 8, 2003−14. [25] Steggall A, Mordi IR, Lang CC. Targeting metabolic modulation and mitochondrial dysfunction in the treatment of heart failure. Diseases, 2017; 5, 14. doi: 10.3390/diseases5020014 [26] Srinivasan S, Guha M, Kashina A, et al. Mitochondrial dysfunction and mitochondrial dynamics-The cancer connection. Biochim Biophys Acta (BBA)- Bioenerg, 2017; 1858, 602−14. doi: 10.1016/j.bbabio.2017.01.004 [27] Yang SY, Castellani CA, Longchamps RJ, et al. Blood-derived mitochondrial DNA copy number is associated with gene expression across multiple tissues and is predictive for incident neurodegenerative disease. Genome Res, 2021; 31, 349−58. doi: 10.1101/gr.269381.120 [28] Pieters N, Koppen G, Smeets K, et al. Decreased mitochondrial DNA content in association with exposure to polycyclic aromatic hydrocarbons in house dust during wintertime: from a population enquiry to cell culture. PLoS One, 2013; 8, e63208. doi: 10.1371/journal.pone.0063208 [29] Du JJ, Pan BL, Cao XM, et al. Urinary polycyclic aromatic hydrocarbon metabolites, peripheral blood mitochondrial DNA copy number, and neurobehavioral function in coke oven workers. Chemosphere, 2020; 261, 127628. doi: 10.1016/j.chemosphere.2020.127628 [30] Hou LF, Zhu ZZ, Zhang X, et al. Airborne particulate matter and mitochondrial damage: a cross-sectional study. Environ Health, 2010; 9, 48. doi: 10.1186/1476-069X-9-48 [31] National Health Commission of the People’s Republic of China. GBZ 2.1-2019. Occupational exposure limits for hazardous agents in the workplace Part 1: chemical hazardous agents. Beijing: Standards Press of China, 2019. (In Chinese) [32] NIOSH. Coke Oven Emissions, Pocket Guide to Chemical Hazards. U. S. NationalInstitute for Occupational Safety and Health, 1997. [33] OSHA. Occupational Safety and Health Standards, oxicand Hazardous Substances. Occupational Safety and Health Administration, 1998. [34] U. S. EPA. Benchmark dose technical guidance. Washington: U. S. Environmental Protection Agency, 2012. [35] Chiu WA, Slob W. A unified probabilistic framework for dose-response assessment of human health effects. Environ Health Perspect, 2015; 123, 1241−54. doi: 10.1289/ehp.1409385 [36] Zou KL, Wang PP, Duan XR, et al. Benchmark dose estimation for coke oven emissions based on oxidative damage in Chinese exposed workers. Ecotoxicol Environ Saf, 2020; 202, 110889. doi: 10.1016/j.ecoenv.2020.110889 [37] Herrmann M, Pusceddu I, März W, et al. Telomere biology and age-related diseases. Clin Chem Lab Med, 2018; 56, 1210−22. doi: 10.1515/cclm-2017-0870 -
 22369+Supplementary Materials.pdf

-

 点击查看大图
计量
- 文章访问数: 404
- HTML全文浏览量: 181
- PDF下载量: 33
- 被引次数: 0

 Quick Links