


-
Asthma is a disease that affects 1%-18% of the human population worldwide. Asthma is heterogeneous and characterized by various symptoms and reversible expiratory airflow limitation[1,2]. Given the heterogeneity of underlying pathogenesis and variety of respiratory symptoms, the early diagnosis and management of asthma are considerably difficult, notably in asthmatic children[3,4]. Chronic obstructive pulmonary disease (COPD) is another common chronic respiratory disease characterized by persistent respiratory symptoms and irreversible airflow limitation[5,6]. In clinical practice, differential diagnosis between these diseases is sometimes difficult due to the similar clinical presentations and lung function test results[7].
The pathogenesis and pathology of asthma differ from those of COPD, involving the different inflammatory cells and inflammatory mediators in the airways[8]. COPD is characterized by the increased number of macrophages in the peripheral airways, lung parenchyma, pulmonary vessels, and activated neutrophils and lymphocytes, such as T-helper (Th) 1 and Th17 cells[6]. Asthma is characterized by the increased number of activated eosinophils, mast cells, and Th2 lymphocytes in the airways, together with the increased levels of inflammatory mediators, such as interleukin-4 and 5[1]. The diagnosis of asthma or COPD is mainly based on patient clinical symptoms and spirometry function testing. Invasive diagnostic methods, including bronchoscopy and surgery, can improve the diagnostic accuracy[9] but are unnecessary for every patient due to their invasive characteristics. Nevertheless, non-invasive diagnostic approaches that can be used to distinguish asthma from COPD are still limited.
Metabolomics is the comprehensive assessment of low-molecular-weight (< 1,000 Da) endogenous metabolites; it can reflect the biochemical reactions and metabolic changes under a given set of physiological or pathophysiological conditions[10]. Endogenous metabolites include a wide variety of small molecules, such as sugars, lipids, steroids, and amino acids[11]. These metabolites represent the functional phenotypes of a cell, tissue, or organism[12]. Currently, metabolomics, which is non-invasive and can be applied to various types of biological fluids, has been deemed considerably helpful for the identification of metabolites related to the diagnosis and prognosis of diseases and can provide early disease detection and deep understanding of disease pathogenesis[13]. In the past decade, both mass spectrometry (MS)[14-17] and nuclear magnetic resonance (NMR)[18-24]-based metabolomic techniques have been utilized in the diagnosis of asthma and have demonstrated evident metabolic alterations associated with the pathogenesis of this disease. Moreover, our previous pilot study has shown that serum metabolic activity is significantly altered in patients with mild persistent asthma based on gas chromatography (GC) coupled with MS[25]. However, the differences in metabolic profiling of serum samples among asthmatic, COPD, and healthy individuals have not been previously studied by liquid chromatography (LC) coupled with MS methodologies. This innovative method can provide the complementary detection of high-molecular-weight metabolites with poor thermal stability that cannot be detected by GC-MS[26].
In the present study, we applied a LC-MS method on the serum samples derived from patients with asthma and COPD and healthy subjects and investigated the metabolomic alteration and differences among these groups. We hypothesized that the metabolic profiling of asthmatic patients differs from that of COPD or healthy subjects and that LC-MS-based metabolomic analysis could assist clinicians to distinguish asthma from COPD.
-
A total of 17 patients with mildly persistent asthma, 17 patients with stable COPD, and 15 healthy subjects were recruited from the respiratory clinic of the Peking University Third Hospital between January 2015 and December 2016. Asthma was diagnosed according to the Global Initiative for Asthma guidelines. COPD was diagnosed according to the Global Initiative for Chronic Obstructive Lung Disease guidelines. The healthy subjects had no history or appearance of chronic respiratory diseases or other diseases that might influence the results. The subjects’ clinical data, including demographic characteristics, tobacco exposure, blood glucose, blood triglyceride and cholesterol, and spirometry function, were collected. These data were analyzed anonymously in our study.
The exclusion criteria were the following: subjects with airflow limitation diseases other than asthma or COPD; acute exacerbation of asthma or COPD within the prior four weeks; any other acute infection or sepsis within the same time period; definite neoplastic diseases; severe trauma or surgery within the same time period.
All the study subjects participating in the present study had provided informed consent prior to data collection. The present study was performed in accordance with the Declaration of Helsinki (1964) and all subsequent revisions and approved by the Ethics Committee of Peking University Third Hospital (2014071).
-
To avoid and minimize the variation in the biochemical parameters due to circadian rhythms, blood samples were collected in the morning between 8:00 AM and 10:30 AM following overnight fasting (at least 8 h). Blood samples were transferred into serum gel tubes and gently inverted twice. The samples were allowed to rest at room temperature for 30 min until complete coagulation. The tubes were centrifuged at 2,500 ×g for 15 min at 4 ℃. The serum was immediately divided into aliquots, transferred in cryovials, and stored at −80 ℃ for further analysis.
-
The demographic characteristics of the study subjects were analyzed by the SPSS software (version 19.0, IBM, Armonk, NY, USA). Continuous variables were expressed as mean ± standard deviation, and categorical variables were expressed as numbers. The t-test test was used to assess the differences among groups considering continuous variables. The chi-squared test was used for assessment of the differences in categorical variables. The results were considered statistically significant at P-values lower than 0.05 (P < 0.05).
-
Sample Preparation Each 100 µL aqueous serum was added to 400 µL methanol-acetonitrile (1:1, vol/vol) solution and vortexed for 30 s. Following incubation for 1 h at −20 ℃, the mixed sample was centrifuged at 12,000 rpm at 4 ℃ for 15 min. Subsequently, 400 µL supernatant was isolated and evaporated to dryness at room temperature. The dried residue was reconstituted in 100 µL acetonitrile-H2O (1:1, vol/vol). Following sonication for 10 min in a water bath and centrifugation for 15 min at 12,000 rpm at 4 ℃, the supernatant was isolated and kept at −80 ℃ prior to LC-MS analysis. The quality control (QC) sample was derived from small aliquots of all the studied samples, which were pooled and thoroughly mixed, and then processed in the same way as the studied samples.
Detection Platform And Validation LC-MS analysis was performed using an Agilent 1290 ultraperformance liquid chromatography (UPLC) system (Agilent Technologies, Santa Clara, CA, USA) coupled with an AB Triple quadrupole time-of-flight 5,600 mass spectrometer (AB SCIEX, Foster City, CA, USA). The system utilized ACQUITY UPLC BEH Amide (2.1 mm × 100 mm, 1.7 µm, Waters, USA) as the chromatographic column.
A total of 10 µL of each reconstituted sample was obtained from sample vials, which were stored at 4 ℃, and injected onto the UPLC column. Chromatographic separations utilized a binary mobile phase system (phase A: water containing 25 mmol/L ammonium acetate and 25 mmol/L ammonium hydroxide; phase B: acetonitrile). Gradient elution was performed as described in Supplementary Table 1 (www.besjournal.com). The eluent from the column was directed to MS analysis without split. The QC sample was injected on the column randomly. Six replicates of QC sample were used for the evaluation of the method reproducibility.
Time (min) Flow rate (uL/min) Mobile phase A (%) Mobile phase B (%) 0.00 300 15 85 1.00 300 15 85 12.00 300 35 65 12.10 300 60 40 15.00 300 60 40 15.10 300 15 85 20.00 300 15 85 Mobile phase A: water containing 25 mM ammonium acetate and 25 mM ammonium hydroxide; Mobile phase B: acetonitrile Table S1. Gradient elution program used in Ultra Performance Liquid Chromatography method
An electrospray ionization source (ESI) operating in positive and negative ion modes was used in MS analysis, with spraying voltage of 5.5 kV for ESI+ mode and of −4.5 kV for ESI- mode. The ionization temperature was set at 600 ℃. The voltages of atomization gas, auxiliary gas, and curtain gas were set at 60, 60, and 35 psi, respectively. The declustering potential was set at 60 V, and the range of collision energy was set at 35 ± 15 eV. The data were collected in the centroid mode form with a m/z range of 60 to 1,200.
-
Data Pre-processing And QC The analysis conducted in 49 serum samples resulted in the detection of 16,262 peaks in the ESI+ mode, whereas 13,983 peaks were detected in the ESI-mode. The open-source XCMS software package (Version xcms4dda) was used to process raw data. The XCMS settings were the following: S/N threshold, 6; accurate molecular weight deviation, 25; peak width, 5-30 s. Following the acquisition of a matrix, the metabolite features with associated retention time (RT), accurate mass, and chromatographic peak area and data alignment and normalization were performed using QC samples. The metabolic features with poor reproducibility were removed. Normalization was processed by the total ion current. The total area normalization method was performed on this data analysis set. The reproducibility of the method was assessed by the internal standard response stability, the dispersion of QC samples in principal component analysis (PCA) scatter plot (Supplementary Figures S1-S4 available in www.besjournal.com), and the correlation among the QC samples. Finally, 2,446 peaks were identified in the ESI+ mode, and 1,761 peaks in the ESI- mode were reserved and subjected to further multivariate analysis.
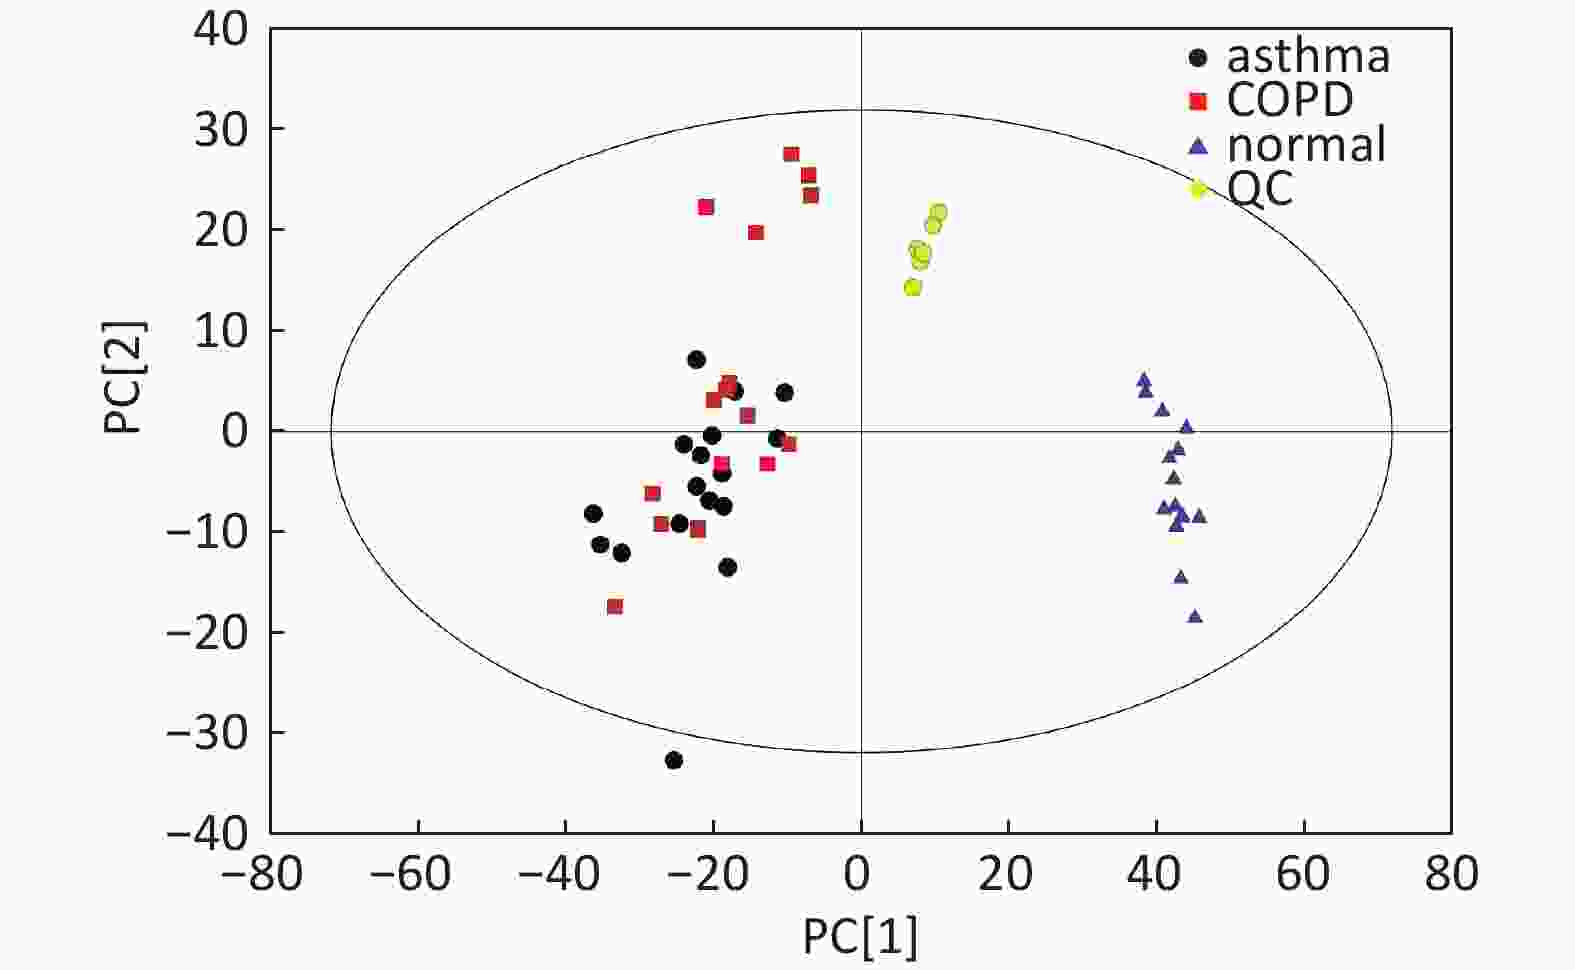
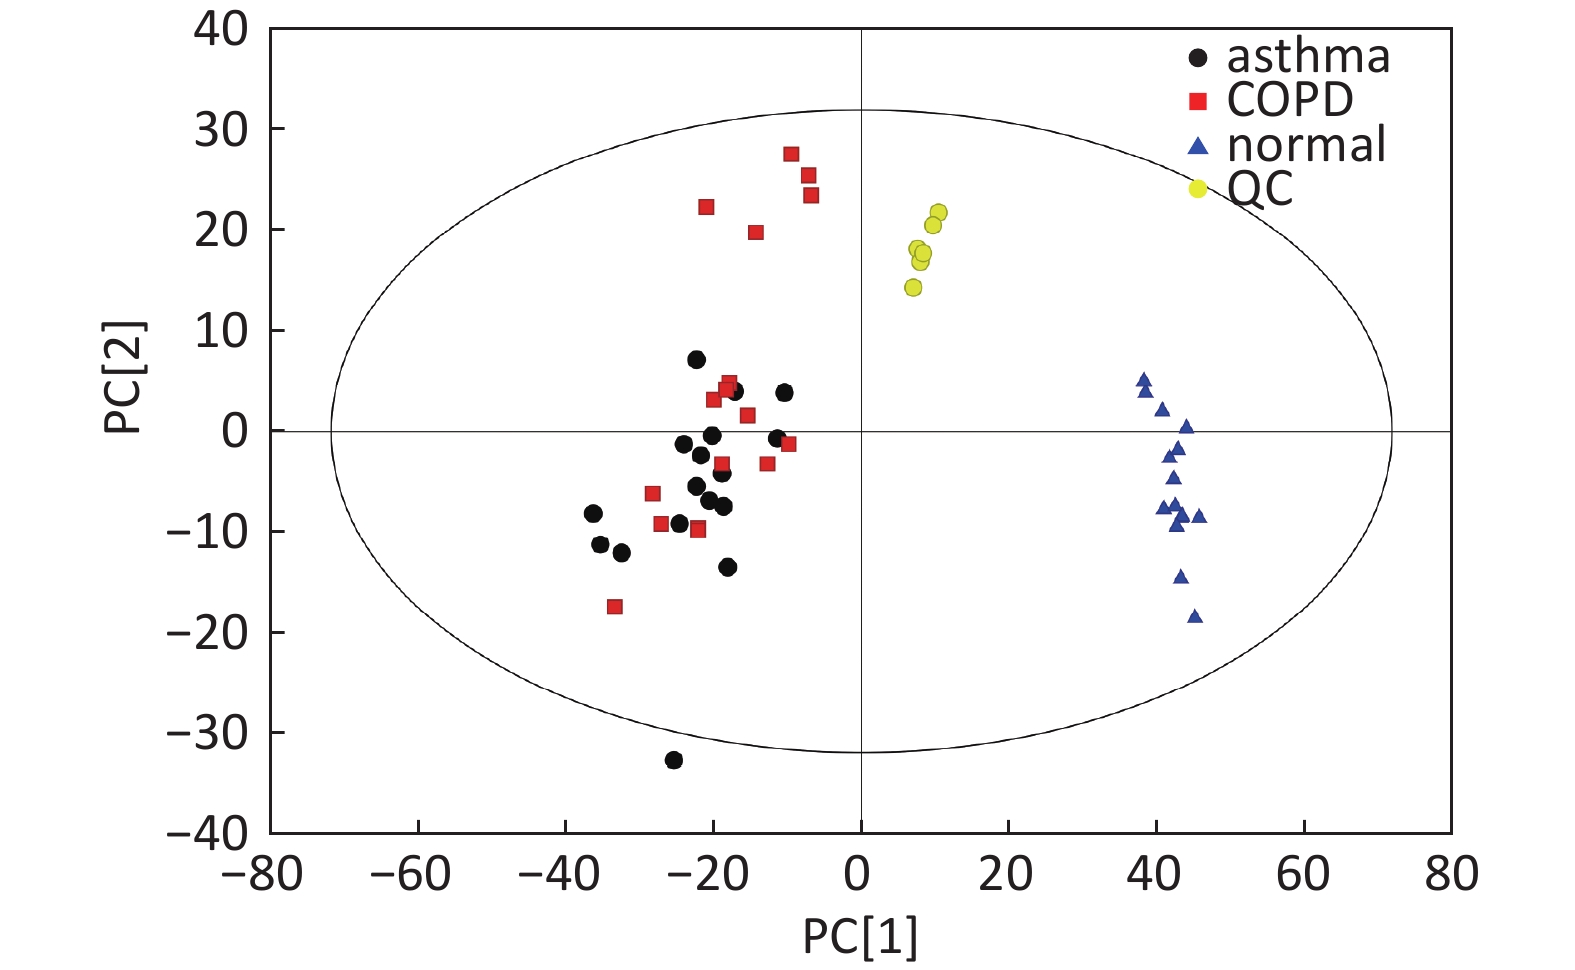
Figure S1. Distribution of QC samples in PCA scatter 2D plots (Supplementary Figures S1 and S2 for ESI+ and ESI- mode, respectively). QC samples were densely distributed in these plots (yellow points in ESI+ mode and black points in ESI- mode)
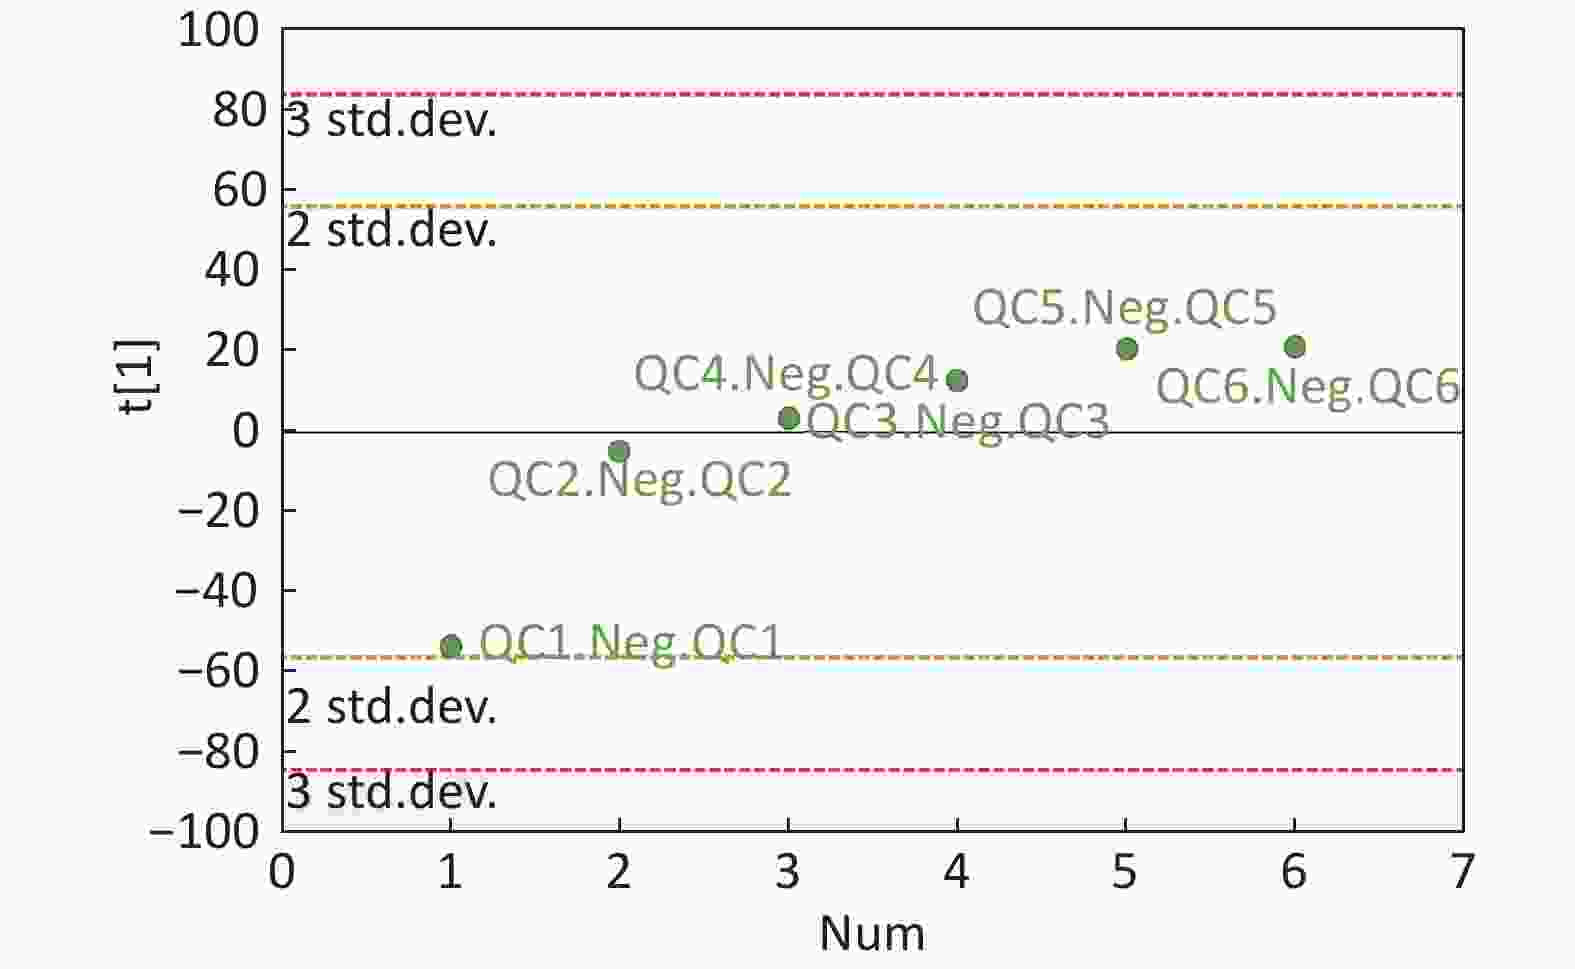
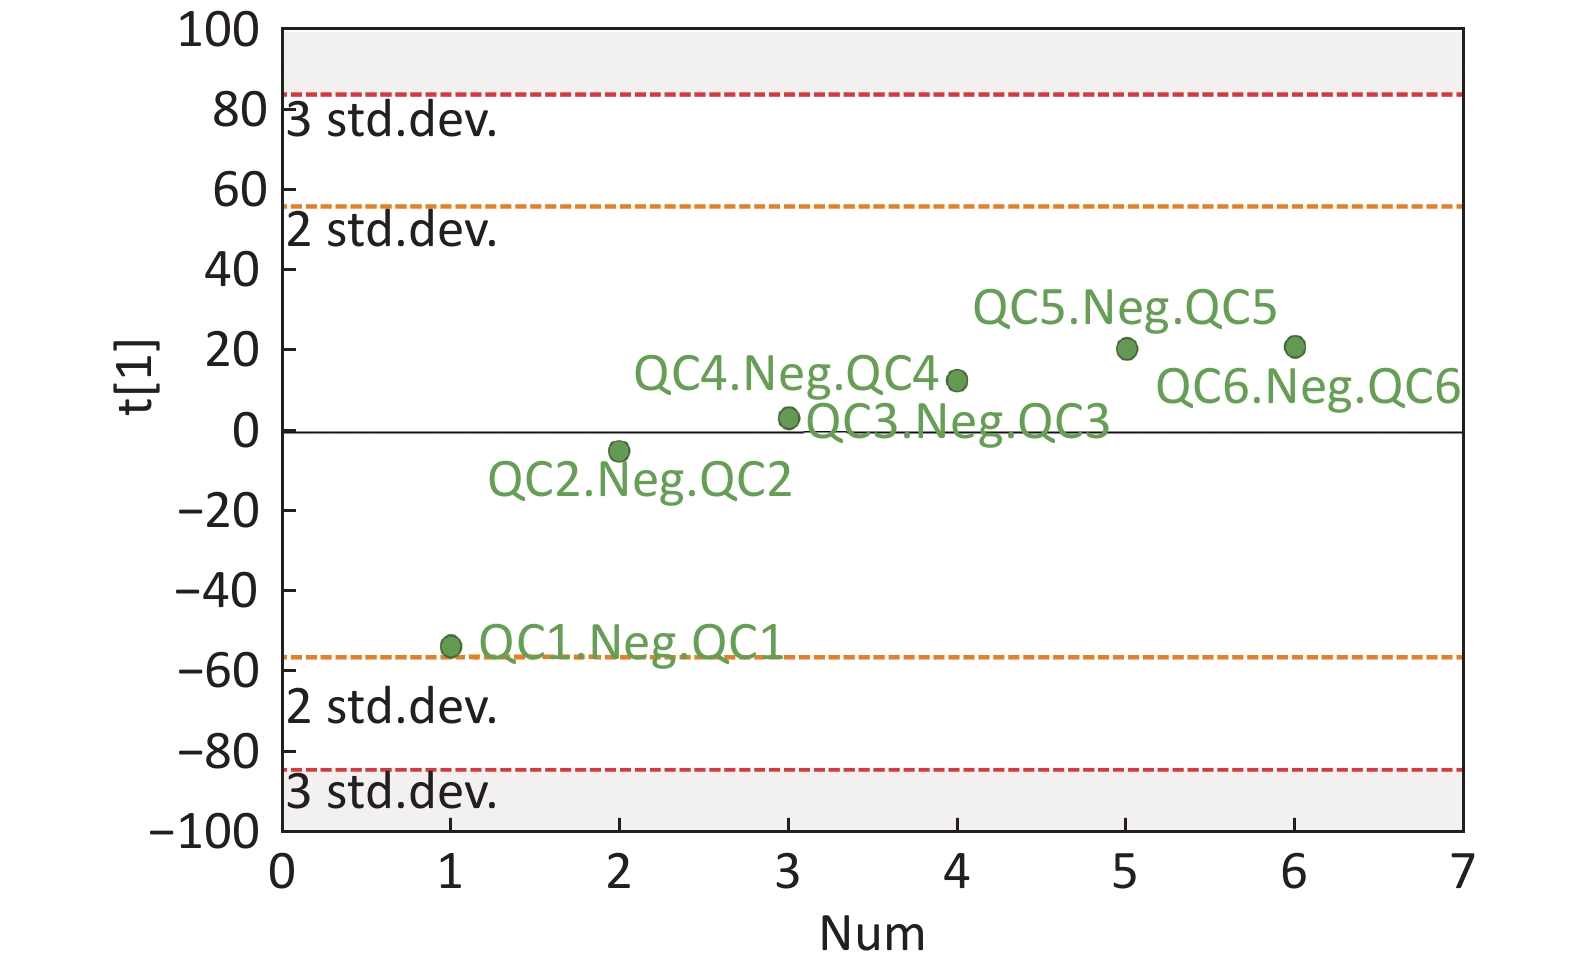
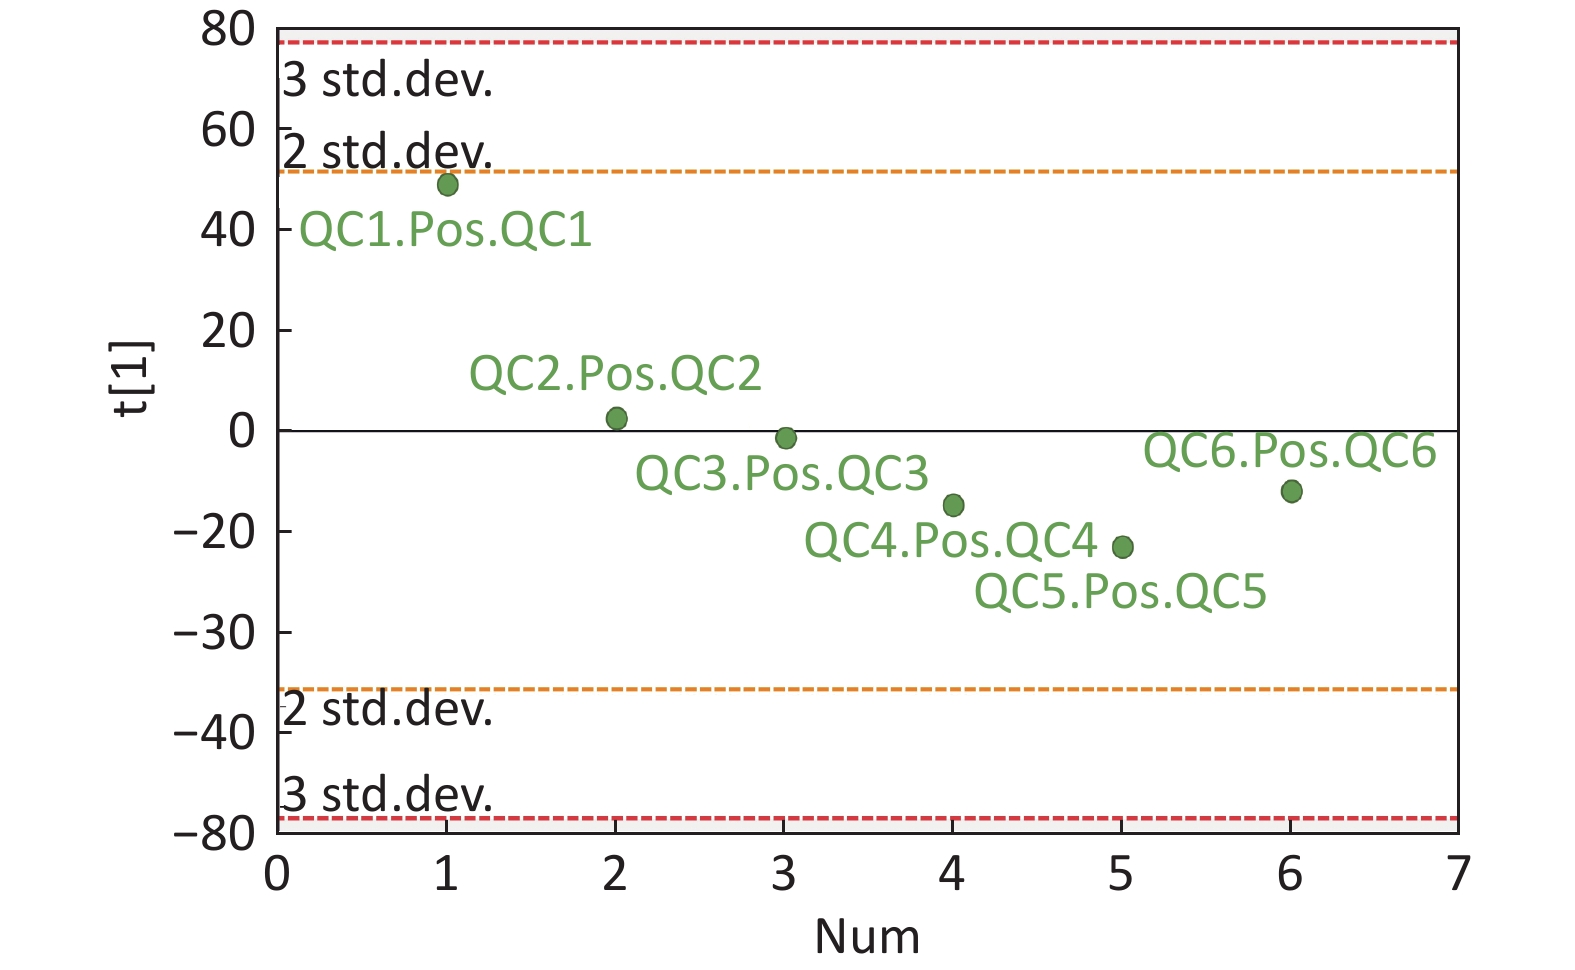
Figure S4. QC samples in PCA scatter 1D plots (Supplementary Figures S3 and S4 for ESI+ and ESI- mode, respectively). All of the QC samples were within the 95% confidential interval and ± 2 standard deviation.
Multivariate Analysis The three-dimensional (3D) data involving the peak number, sample name, and normalized peak area were processed with the SIMCA 14.0 software package (Umetrics AB, Umea, Sweden) for PCA and orthogonal projections to latent structures-discriminate analysis (OPLS-DA). PCA indicated the distribution of the origin data. To obtain a higher level of group separation and a better understanding of the variables responsible for classification, supervised OPLS-DA was applied. To refine this analysis, the first principal component of the variable importance projection (VIP) was obtained. The Student’s t-test was used for pairwise comparison. The VIP values exceeding 1.0 with a P-value lower than 0.05 (P < 0.05) in the Student’s t-test were selected to correspond to potential differential metabolites.
Metabolite Identification, Receiver Operating Characteristic (ROC) Curve, And Pathway Analysis The selected differential metabolites were further identified by searching the Kyoto Encyclopedia of Genes and Genomes (KEGG), the METLIN databases for first-order MS, and a self-built database for second-order MS. The ROC curves were determined, and the area under the ROC curve (AUC) was used to detect the efficiency of this method in distinguishing asthma from healthy subjects or COPD patients. Finally, each potential differential metabolite was cross-listed with the metabolic pathways in the KEGG database. The top altered metabolic pathways were then identified and constructed to relevant reference maps.
-
The patients with COPD were older than those with asthma and healthy subjects. The ages between asthma and healthy controls were comparable. The sex proportions showed no statistical difference among the three groups (P = 0.224). The patients with COPD included 2 current smokers (11.8%), 10 ex-smokers (58.8%), and 5 non-smokers (29.4%). Neither patients with asthma nor healthy subjects were smokers. Similar levels of blood glucose, triglyceride, and cholesterol were observed among the three groups. The patients with COPD exhibited the worst spirometry function among the three groups (Table 1).
Characteristics Asthma (n = 17) COPD (n = 17) Controls (n = 15) Age (year) 53.7 ± 19.5 79.3 ± 8.8†‡ 48.5 ± 12.9 Male/Female 6/11 11/6 8/7 Height (cm) 169.6 ± 6.7 173.7 ± 4.7 171.3 ± 3.9 Weight (kg) 67.6 ± 5.8 67.4 ± 5.2 66.5 ± 3.8 BMI (kg/m2) 23.5 ± 1.6 22.3 ± 1.2 22.7 ± 1.2 Smoking status Current- 0 2 0 Ex- 0 10 0 Never- 17 5 15 Glucose (mmol/L) 4.9 ± 0.7 4.8 ± 0.8 4.6 ± 0.8 Triglyceride (mmol/L) 1.8 ± 0.3 1.8 ± 0.3 1.7 ± 0.3 Total cholesterol (mmol/L) 4.1 ± 0.8 4.0 ± 0.7 4.2 ± 0.9 High density lipoprotein (mmol/L) 1.5 ± 0.6 1.6 ± 0.5 1.6 ± 0.5 Low density lipoprotein (mmol/L) 2.4 ± 0.5 2.7 ± 0.9 2.8 ± 1.0 FEV1/FVC (%) 79.4 ± 4.2 61.3 ± 6.3†‡ 86.0 ± 4.7 FEV1 %predicted 89.9 ± 4.0* 59.6 ± 6.8†‡ 91.5 ± 4.4 Note. †COPD vs. Asthma, P < 0.001; ‡COPD vs. Controls, P < 0.001; *Asthma vs. Controls, P < 0.001. Table 1. Demographic characteristics of the study subjects
-
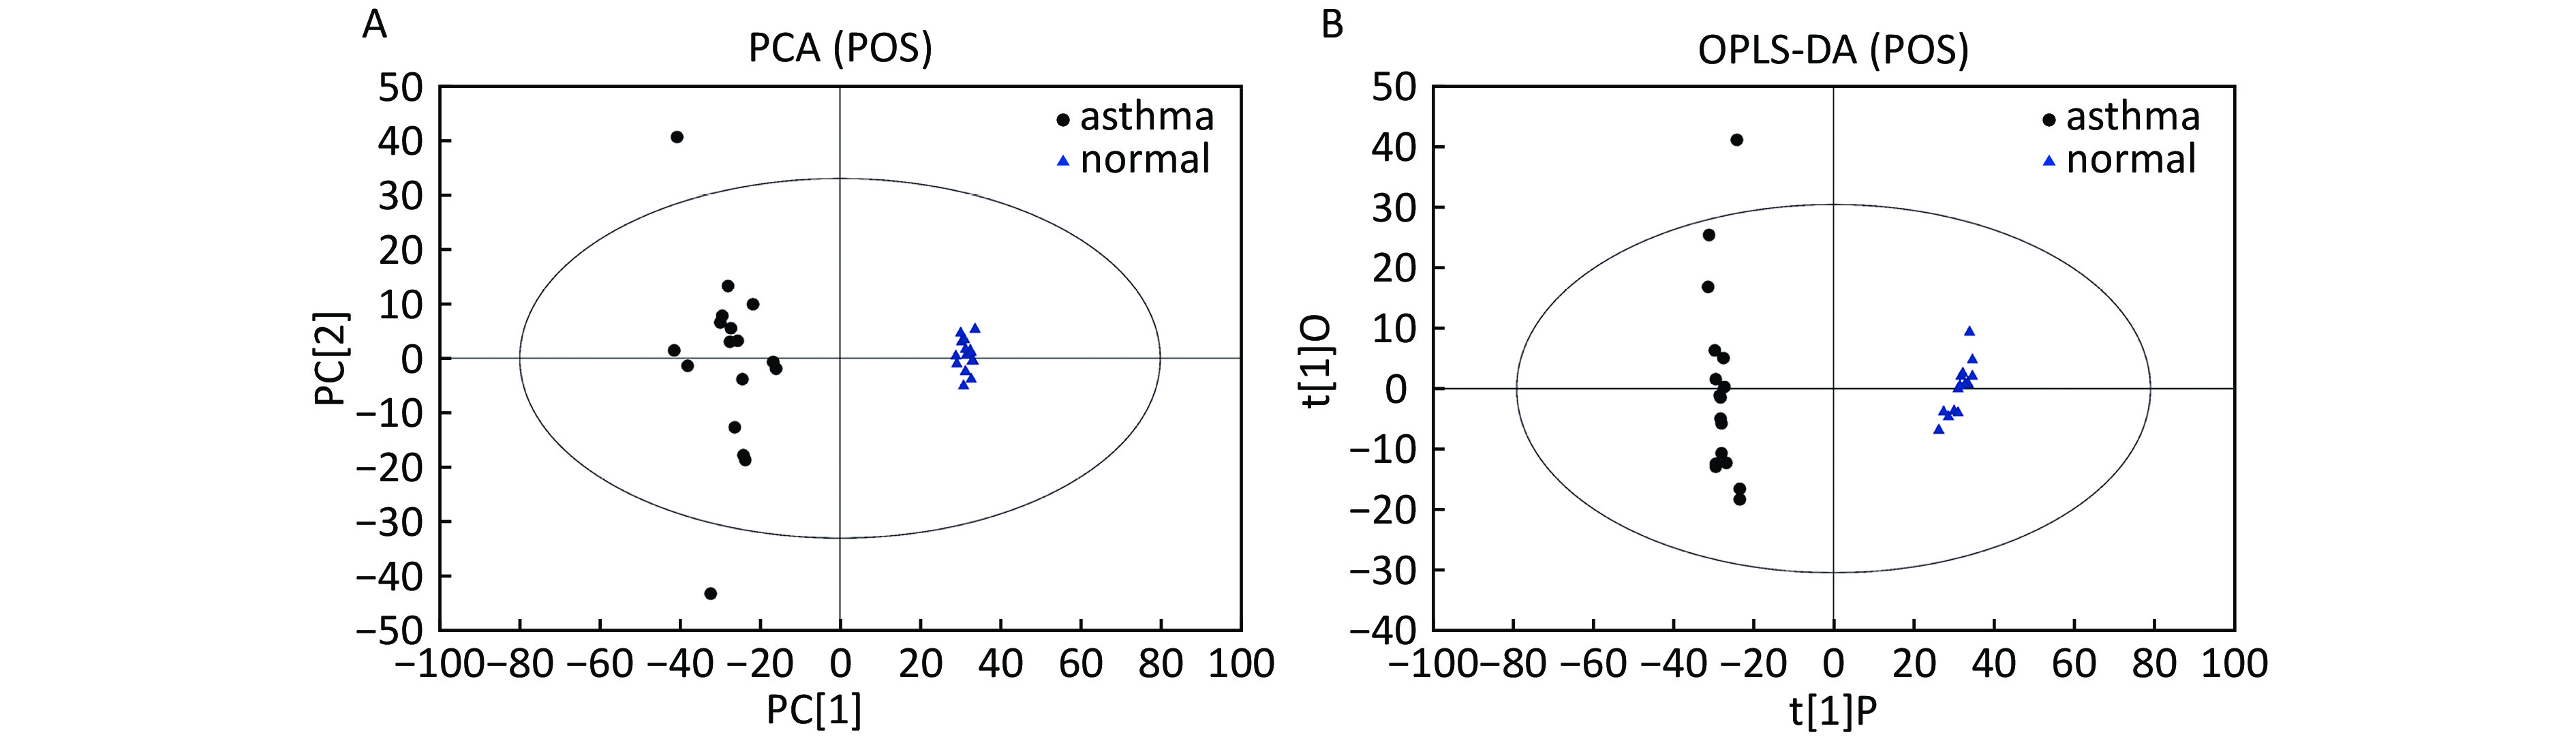
Data In Electrospray Positive Ion Mode As shown in Figure 1A, PCA indicated a distinct separation between the asthma and healthy subjects, and the majority of the samples were within the 95% confidence interval (CI) with the exception of those corresponding to two asthmatic patients. The OPLS-DA plot further showed distinct separation between the asthmatic and healthy subjects (Figure 1B). Similarly, the majority of the samples were within the 95% CI with the exception of one asthmatic sample. The R2Y and Q2Y of this OPLS-DA model were 0.994 and 0.980, respectively.
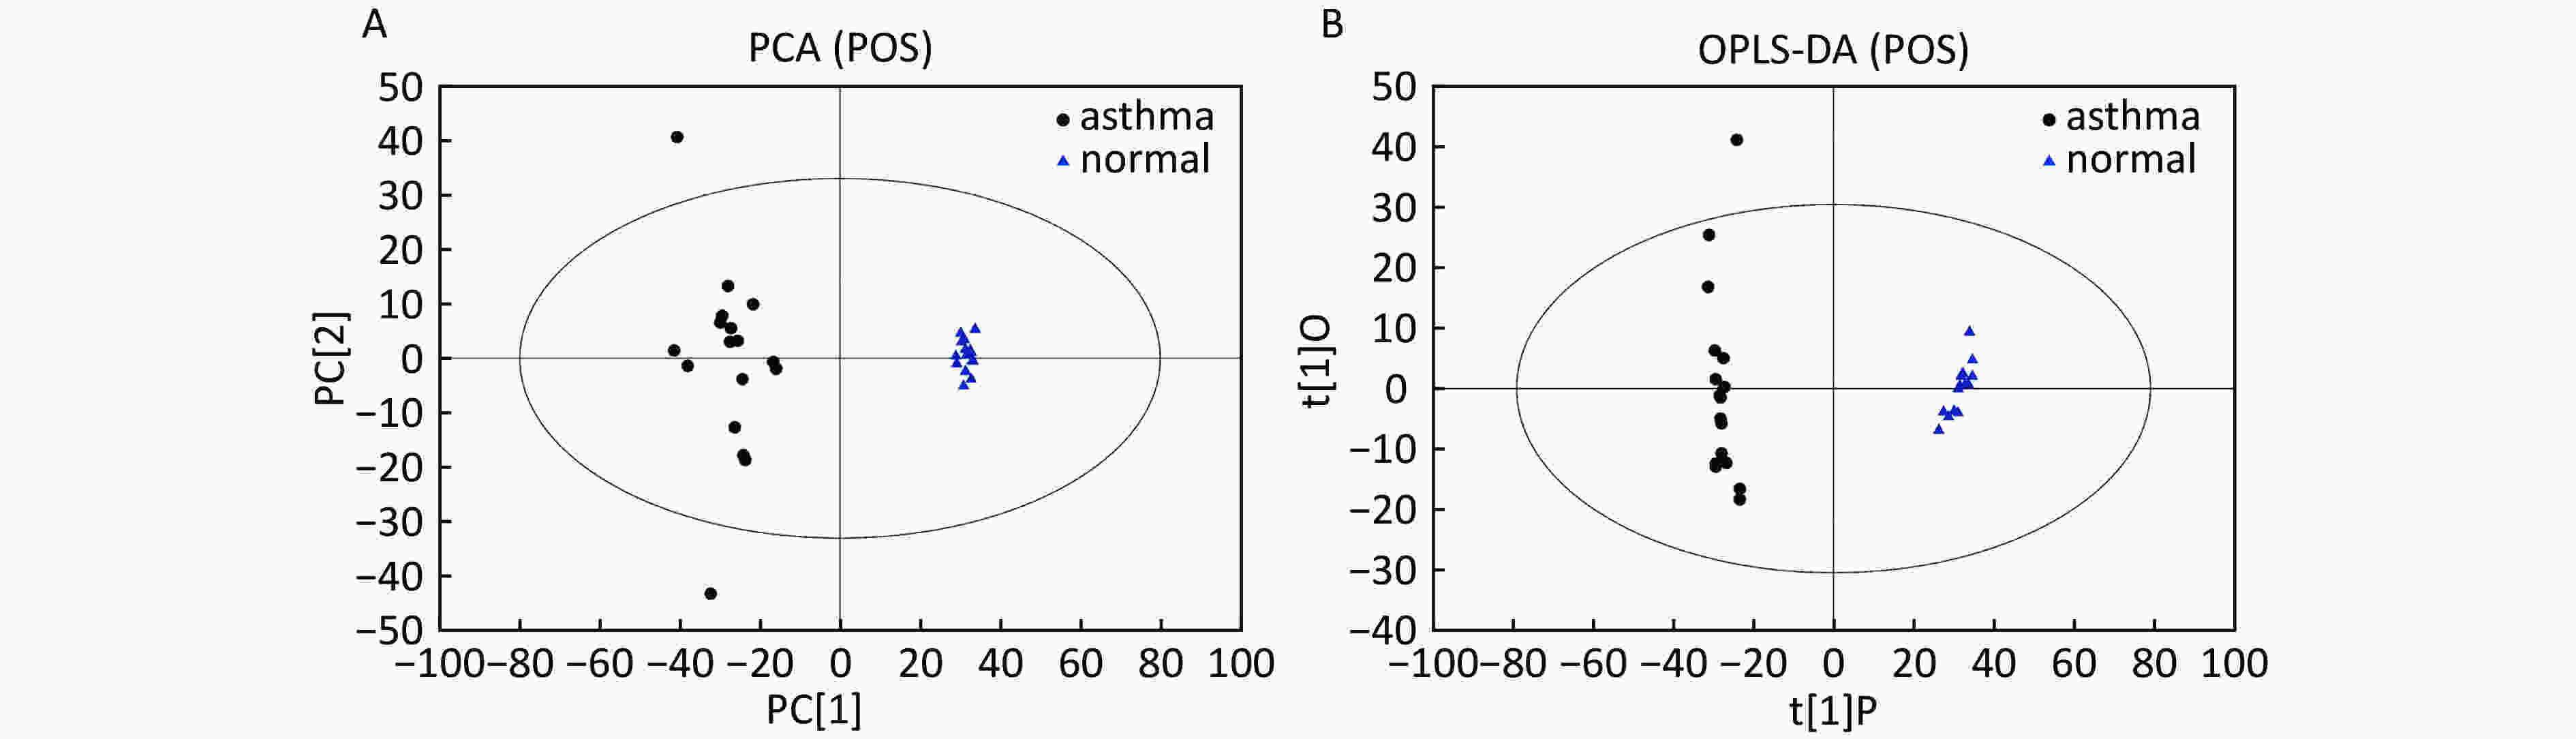
Figure 1. PCA and OPLS-DA of LC-MS metabolite profiles between asthmatic and healthy subjects based on the electrospray positive ion mode. (A) Score scatter plot of PCA model obtained from asthmatic and healthy subjects. The X-(PC[1]) and Y-axis (PC[2]) indicate the first and second principal components, respectively. (B) Score scatter plot of the OPLS-DA model obtained from the asthmatic and healthy subjects. The X-(t[1]P) and Y-axis (t[1]O) indicate the predictive and orthogonal directions, respectively.
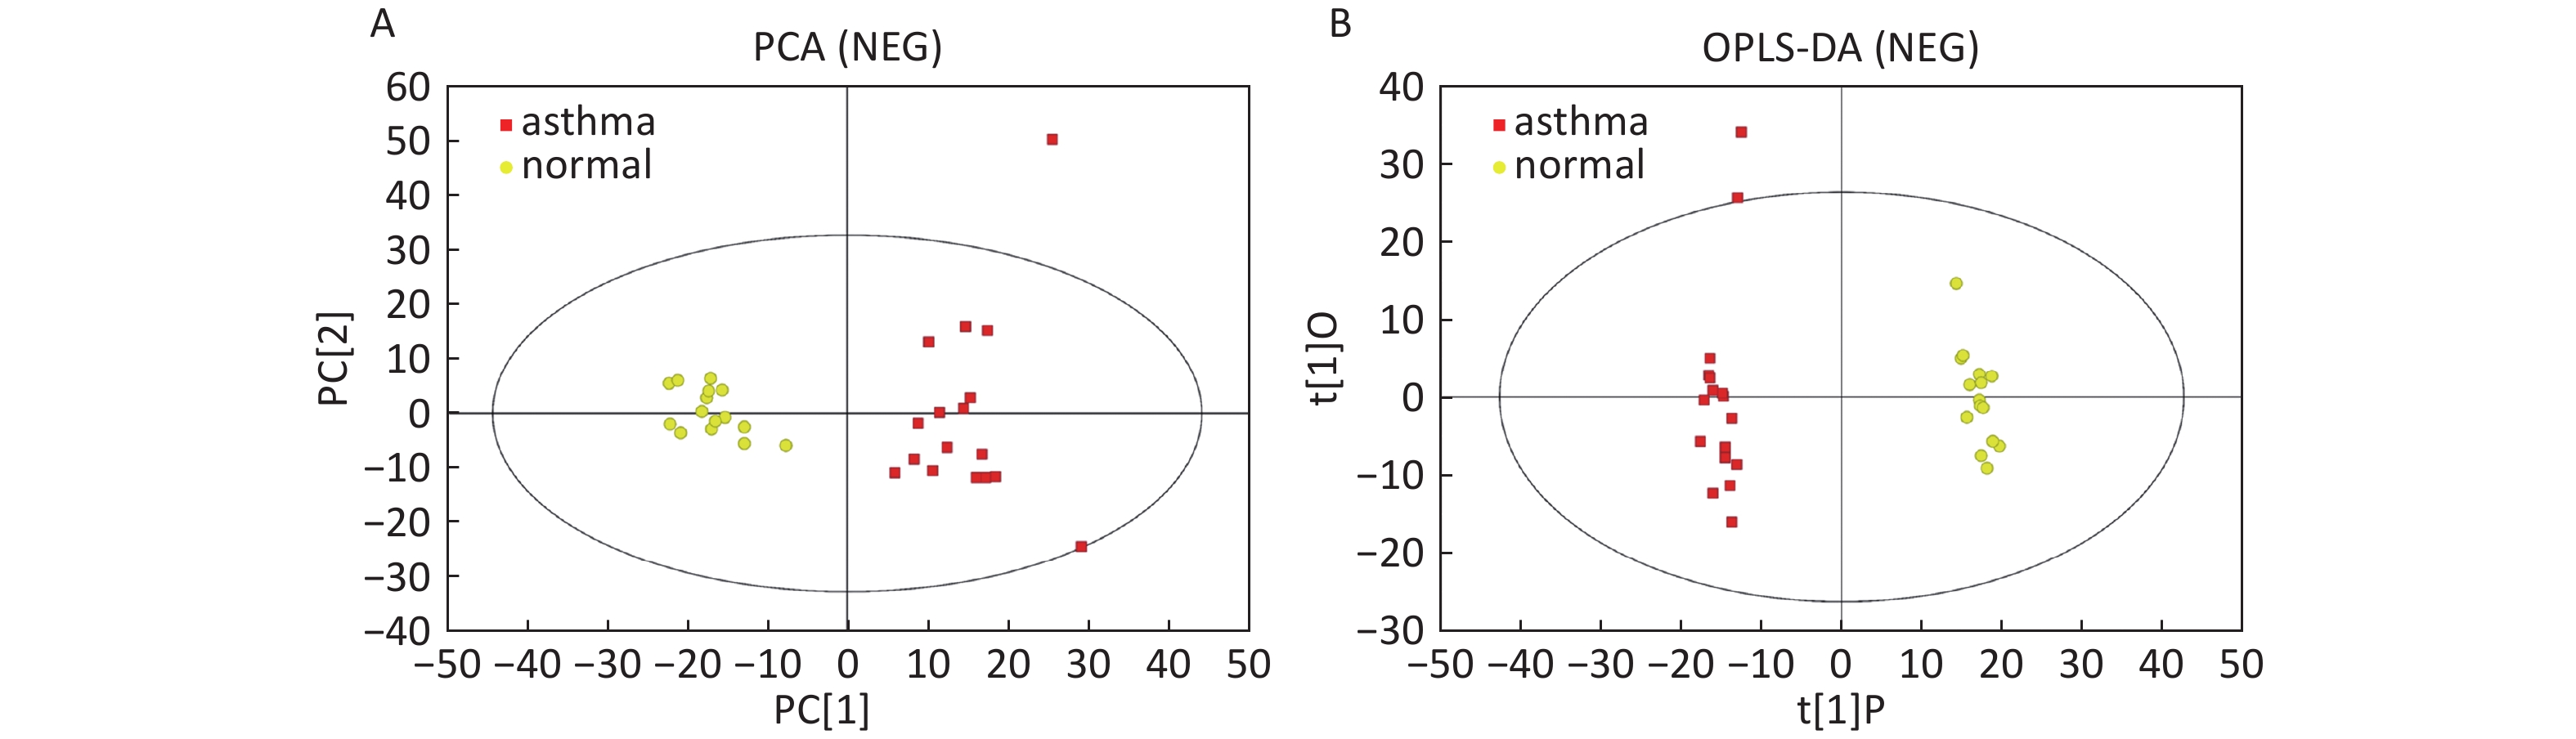
Data In Electrospray Negative Ion Mode As shown in Figure 2A, PCA also demonstrated a distinct separation between asthma and healthy subjects, and the majority of the samples were within the 95% CI with the exception of one sample corresponding to an asthmatic patient. The OPLS-DA plot indicated the distinct separation between the asthmatic patients and healthy subjects (Figure 2B). Similarly, the majority of the samples were within the 95% CI, with the exception of two samples from the asthmatic patients. The R2Y and Q2Y of this OPLS-DA model were 0.991 and 0.921, respectively.

Figure 2. PCA and OPLS-DA of LC-MS metabolite profiles between the asthmatic and healthy subjects in electrospray negative ion mode. (A) Score scatter plot of PCA model obtained from asthmatic and healthy subjects. The X-(PC[1]) and Y-axis (PC[2]) indicate the first and second principal components, respectively. (B) Score scatter plot of the OPLS-DA model obtained from the asthmatic and healthy subjects. The X-(t[1]P) and Y-axis (t[1]O) indicate the predictive and orthogonal directions, respectively.
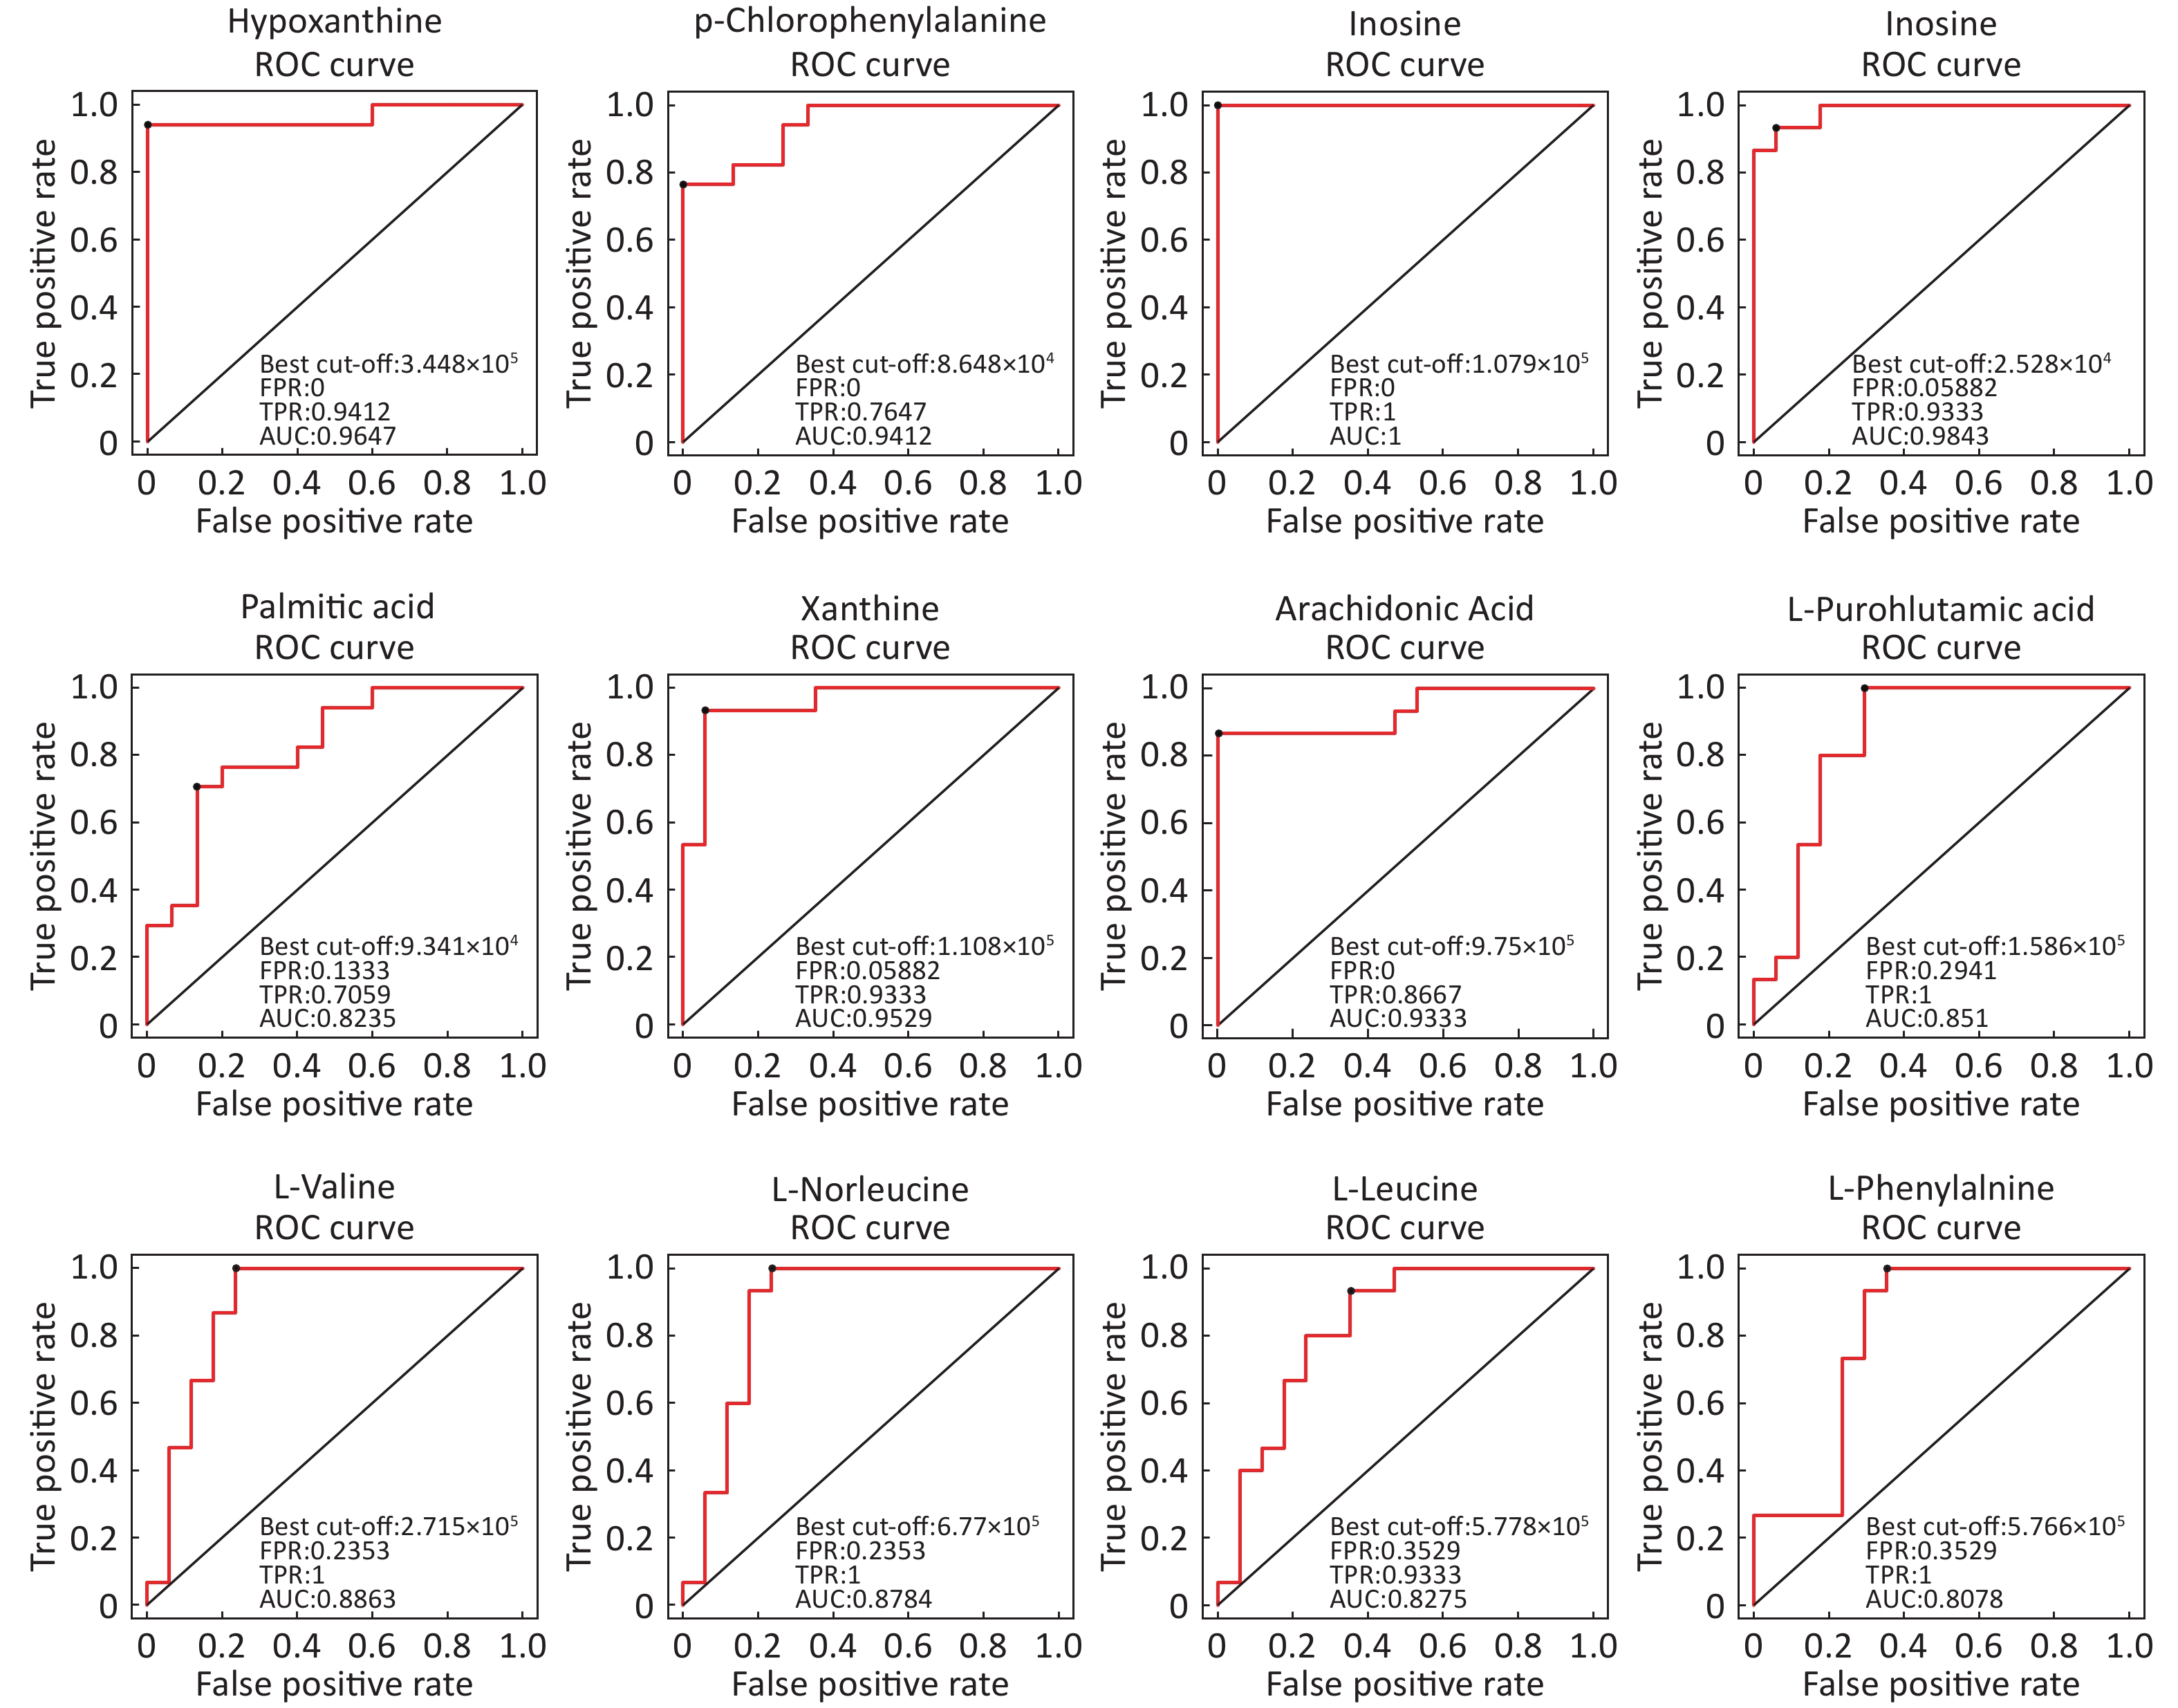
Identification Of Differential Levels Of Metabolites Based on the score, the VIP, and P-value, we identified 5 different metabolites in the ESI+ mode and 14 different metabolites in the ESI- mode (Table 2). In the ESI+ mode, the levels of hypoxanthine, p-chlorophenylalanine, and inosine significantly increased in the asthmatic patients, whereas the levels of L-glutamine and glycerophosphocholine significantly decreased compared with the control subjects. In the ESI- mode, the levels of hypoxanthine, theophylline, bilirubin, inosine, and palmitic acid were significantly higher in the asthmatic patients compared with those in COPD subjects, whereas the levels of succinate, xanthine, arachidonic acid, L-pyroglutamic acid, indoxyl sulfate, L-valine, L-norleucine, L-leucine, and L-phenylalanine were significantly lower in the asthmatic patients compared with control subjects. The ROC curve was used to evaluate the predictive performance of the aforementioned differential metabolites. Figure 3 shows the metabolites with AUC ≥ 0.8.
Metabolite name Score Median RT (s) Mean asthma Mean control VIP P-value Fold-changea Positive ion mode (ESI+) Hypoxanthine 0.888 127.044 762,120.978 107,680.398 1.292 1.828 × 10⁻⁶ 7.078 P-chlorophenylalanine 0.946 299.633 103,213.840 69,289.675 1.082 3.215 × 10⁻⁵ 1.490 L-Glutamine 0.951 386.792 14,215.705 52,805.785 1.329 2.179 × 10⁻⁶ 0.269 Glycerophosphocholine 0.990 473.276 107,868.019 432,953.058 1.331 1.876 × 10⁻⁶ 0.249 Inosine 0.997 172.638 402,568.442 21,353.459 1.262 3.141 × 10⁻⁶ 18.853 Negative ion mode (ESI-) Hypoxanthine 0.986 127.177 421,202.385 58,594.857 1.993 2.494 × 10⁻⁶ 7.188 Succinate 0.986 467.769 24,293.468 30,744.437 1.155 9.328 × 10⁻³ 0.790 Xanthine 0.997 170.712 69,038.696 145,934.844 1.988 6.556 × 10⁻⁶ 0.473 Arachidonic Acid (peroxide free) 0.950 46.921 550,848.247 1408,228.636 1.896 4.184 × 10⁻⁵ 0.391 L-Pyroglutamic acid 0.998 267.481 419,335.669 722,668.930 1.609 2.727 × 10⁻⁴ 0.580 Indoxyl sulfate 0.996 46.881 253,902.424 399,864.278 1.146 1.160 × 10⁻² 0.635 Theophylline 0.969 63.751 746,404.311 27,458.526 1.143 5.567 × 10⁻³ 27.183 L-Valine 0.990 283.093 238,204.741 329,407.691 1.643 1.128 × 10⁻⁴ 0.723 L-Norleucine 0.992 212.926 611,132.345 862,255.499 1.571 2.653 × 10⁻⁴ 0.709 Bilirubin 0.997 54.940 16,581.417 9,240.124 1.050 3.550 × 10⁻² 1.795 L-Leucine 0.997 234.501 551,017.884 780,835.022 1.387 1.354 × 10⁻³ 0.706 Inosine 0.998 171.190 841,330.913 31,156.248 1.799 3.193 × 10⁻⁵ 27.004 Palmitic acid 0.999 161.731 116,896.629 79,641.247 1.329 3.144 × 10⁻³ 1.468 L-Phenylalanine 0.919 197.371 527,761.313 683,438.123 1.589 4.118 × 10⁻⁴ 0.772 Note. aFold-change: Asthma versus Control. Abbreviations: RT: retention time; VIP: variable importance for the projection. Table 2. Differentially expressed metabolites between asthmatic and healthy subjects
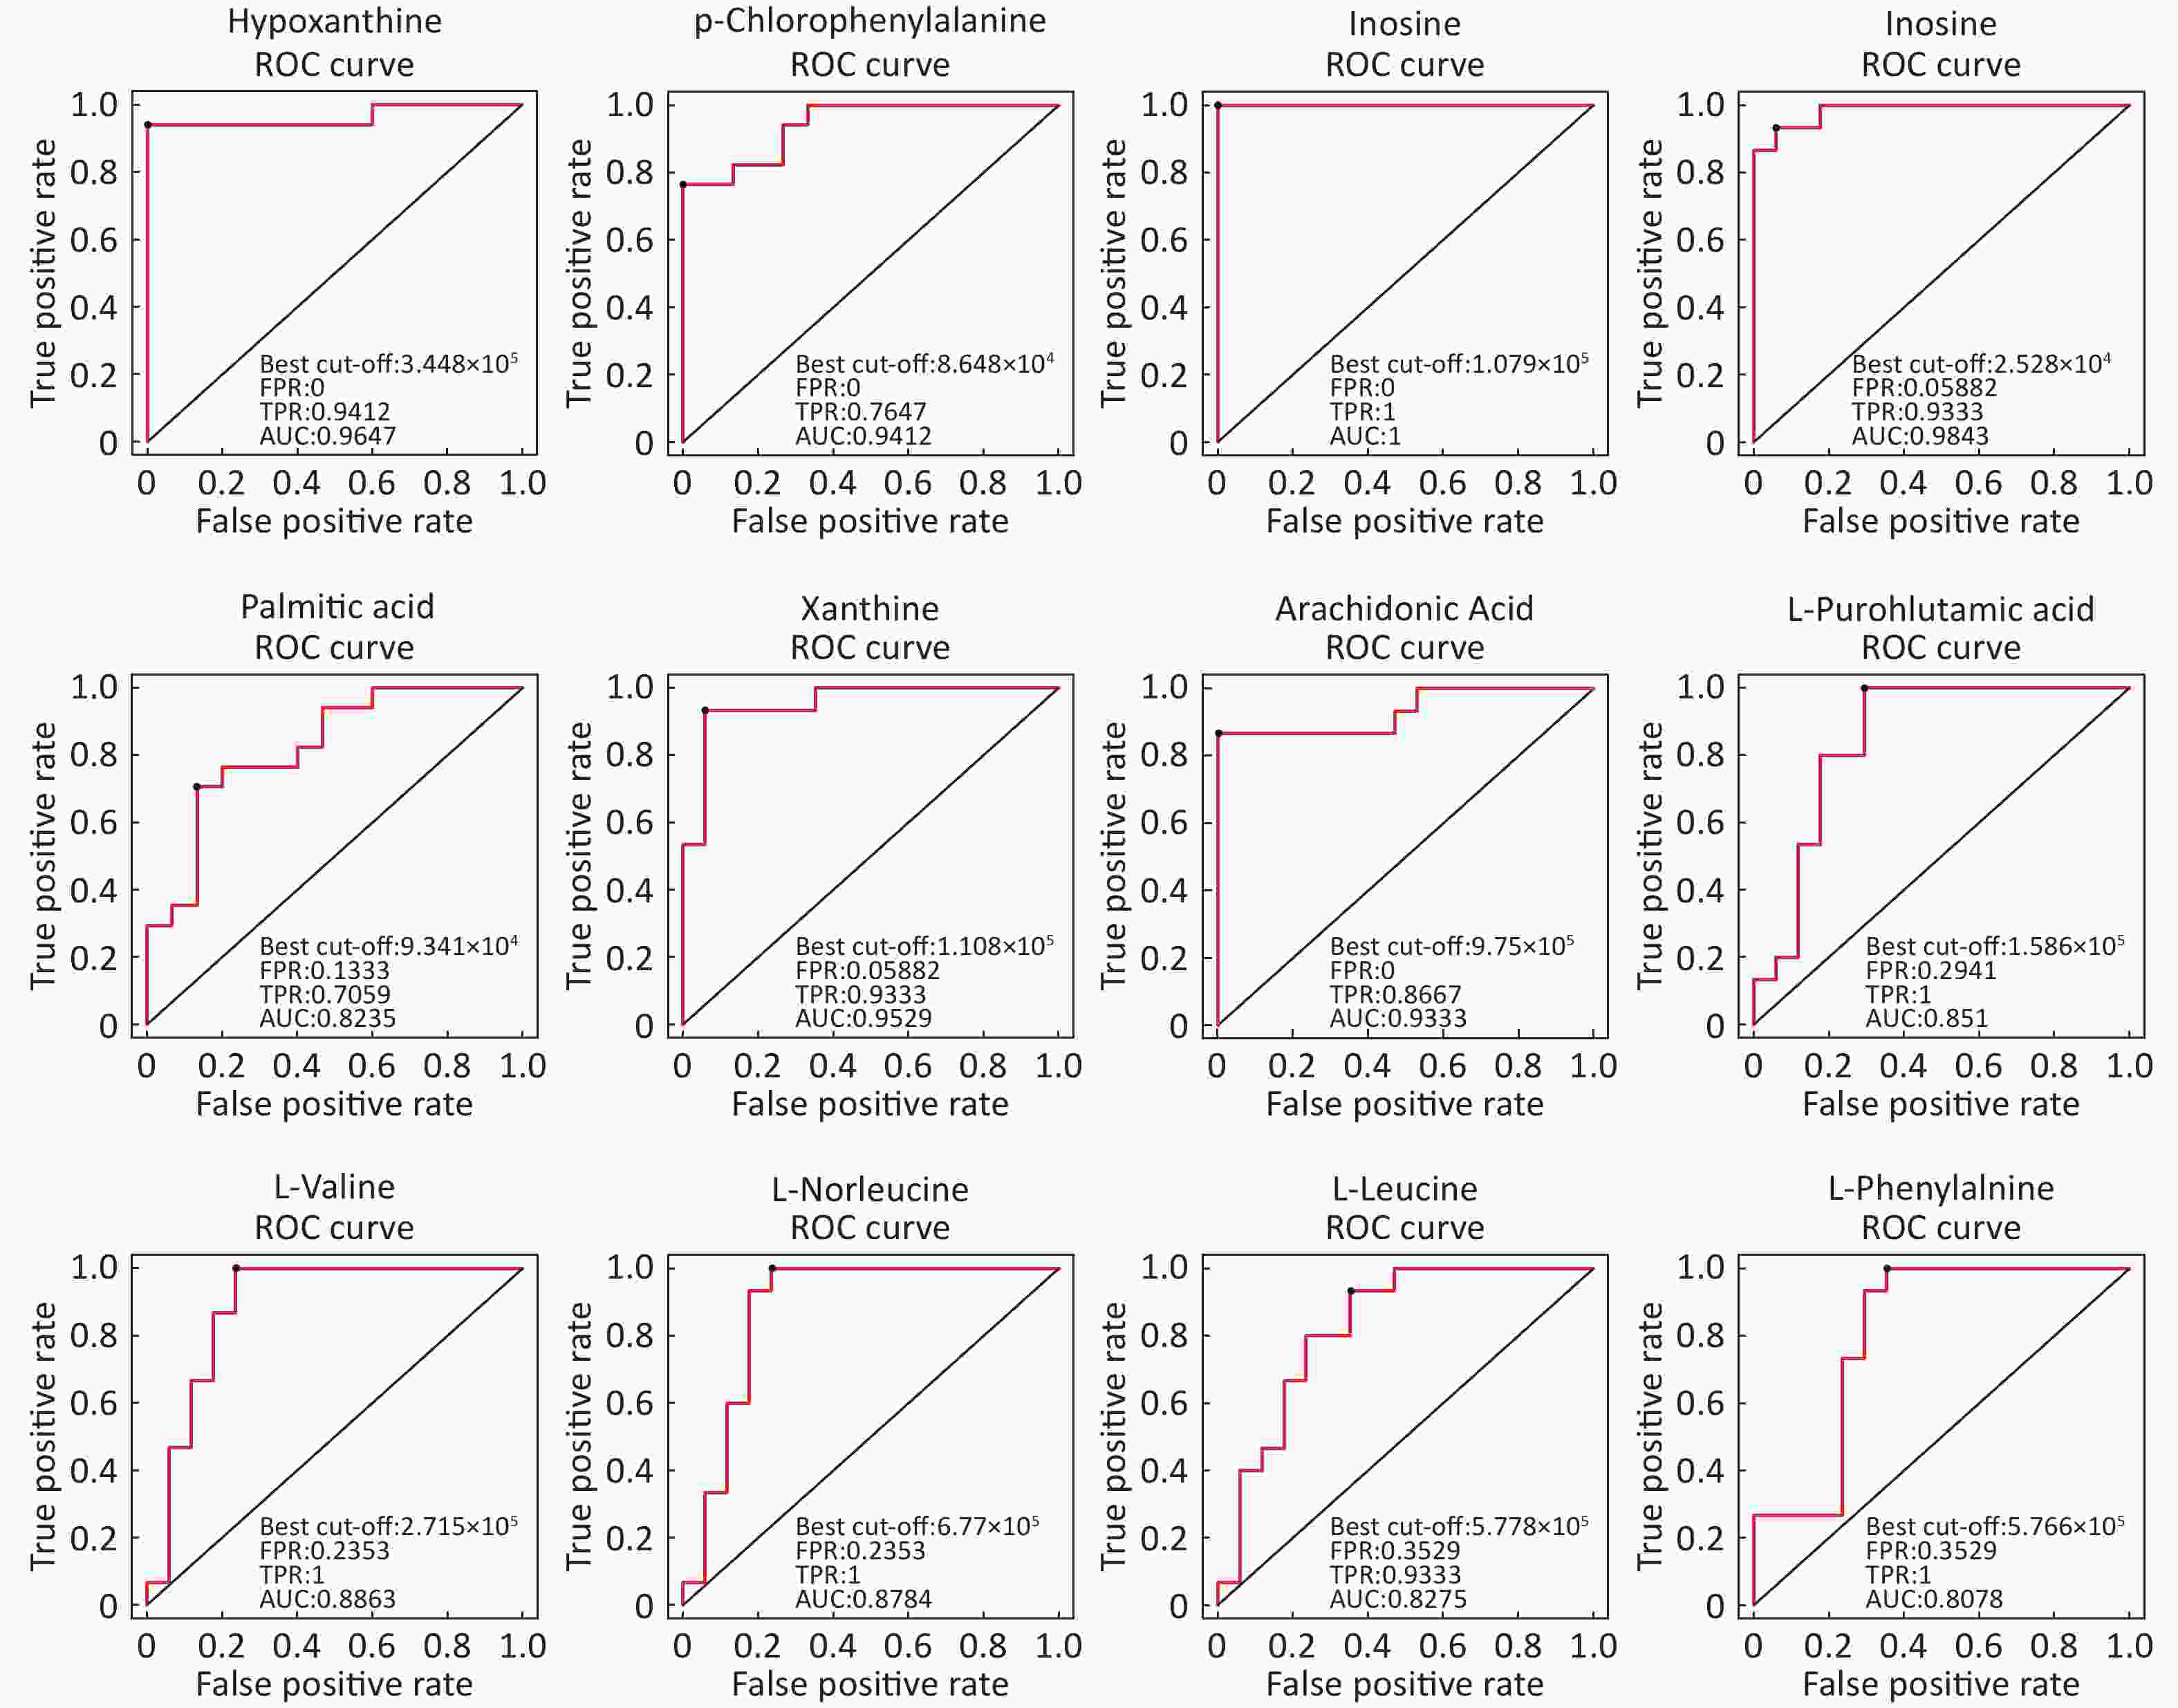
Figure 3. ROC curves of differential metabolites between asthmatic and control subjects with AUC ≥ 0.80.
-
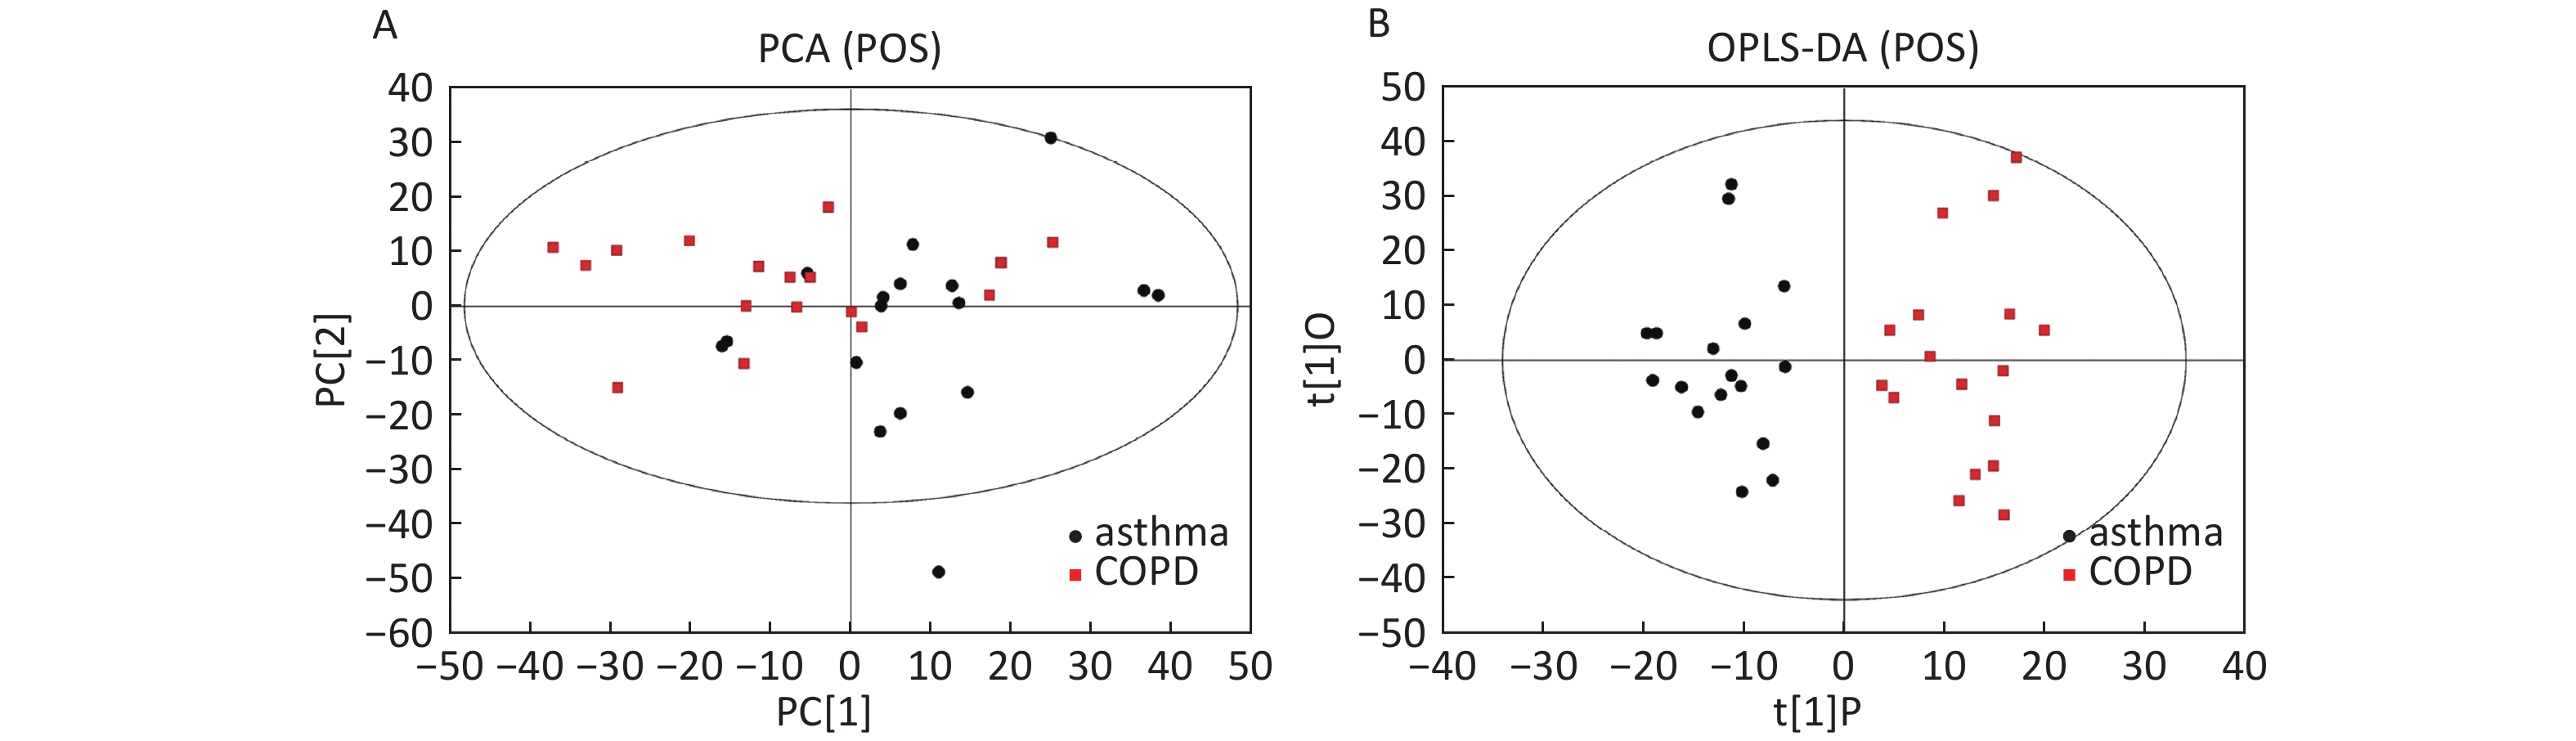
Data in Electrospray Positive Ion Mode PCA roughly detected a differential metabolic profile between asthma and COPD (Figure 4A). One sample corresponding to an asthmatic patient was outside the 95% CI. Based on the OPLS-DA, the score scatter plot indicated a clear separation between the asthmatic and COPD (Figure 4B) subjects, and all the samples were within the 95% CI. The R2Y and Q2Y values in this OPLS-DA model were 0.879 and 0.252, respectively.
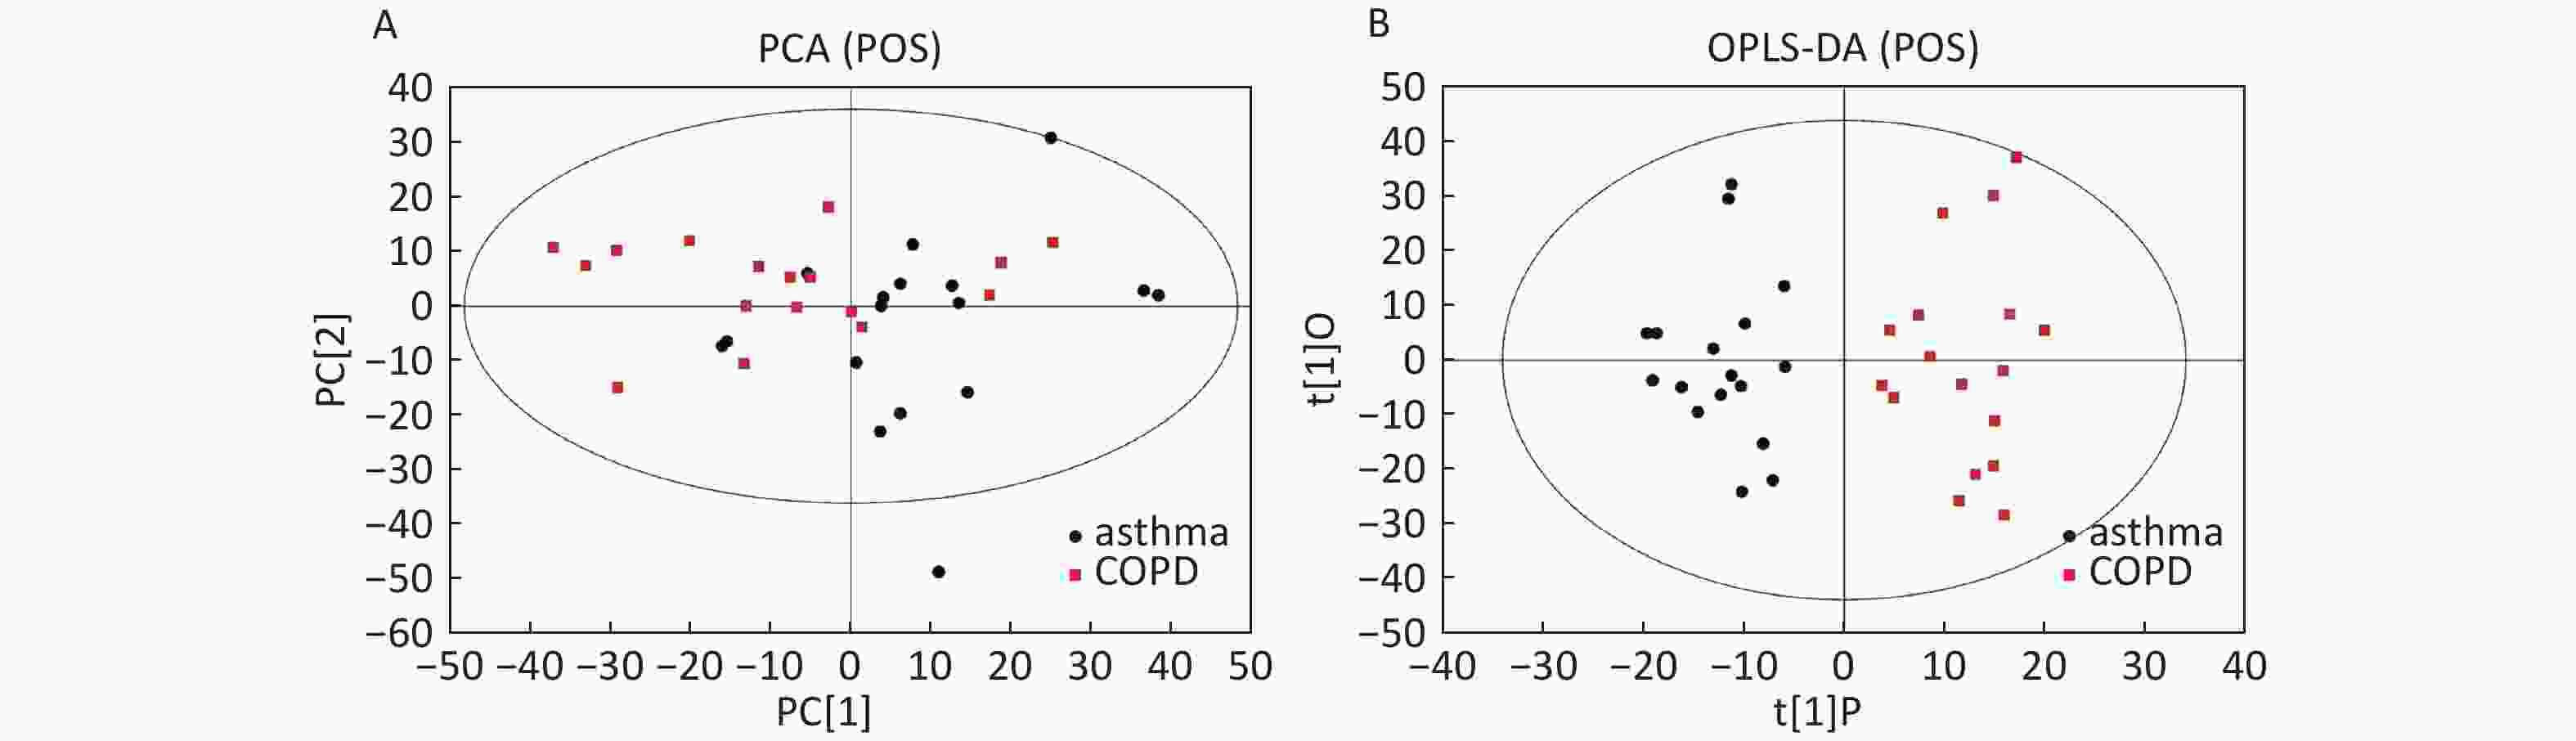
Figure 4. PCA and OPLS-DA of LC-MS metabolite profiles between the asthmatic and COPD subjects in electrospray positive ion mode. (A) Score scatter plot of PCA model obtained from the asthma and COPD subjects. The X-(PC[1]) and Y-axis (PC[2]) indicate the first and second principal components, respectively. (B) Score scatter plot of the OPLS-DA model obtained from asthmatic and COPD subjects. The X-(t[1]P) and Y-axis (t[1]O) indicate the predictive and orthogonal directions, respectively.
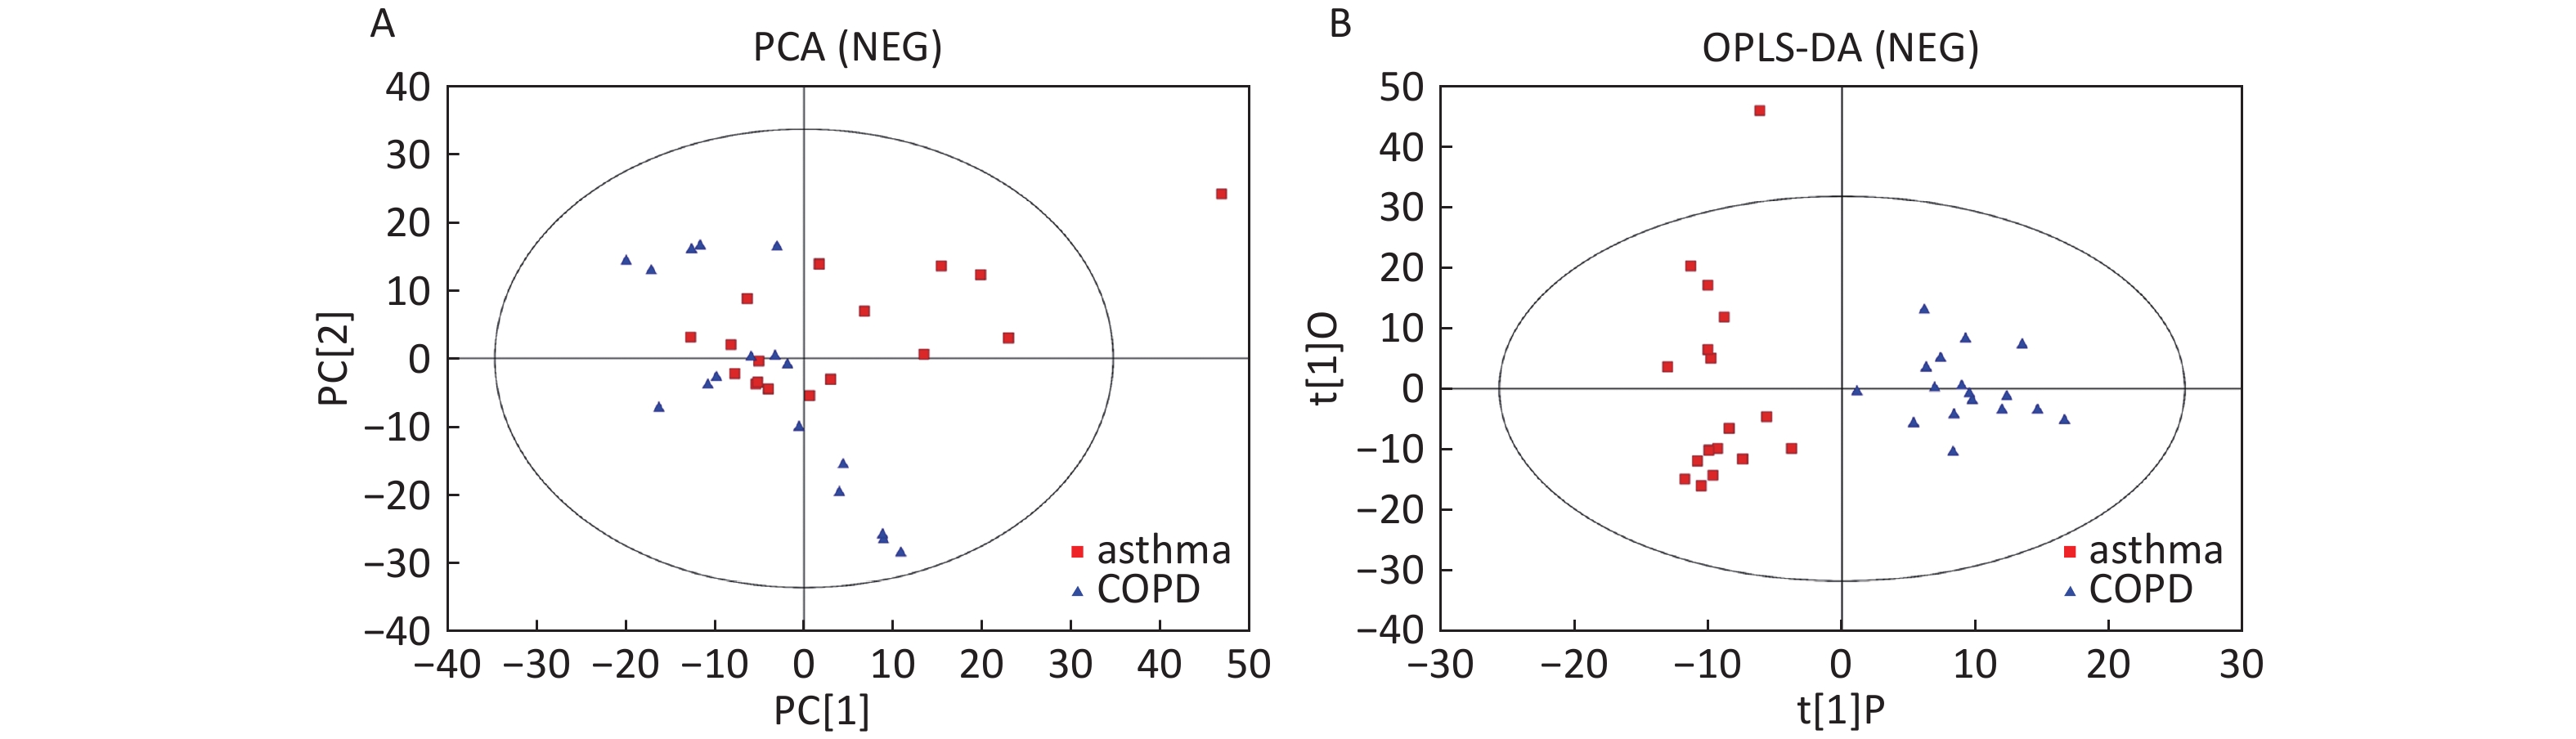
Data in Electrospray Negative Ion Mode The trends of sample distribution also differed between the asthmatic and COPD subjects in PCA (Figure 5A). One sample that corresponded to an asthmatic patient was outside the 95% CI. OPLS-DA indicated a straightforward separation between the asthma and COPD patients, and one asthmatic sample was outside the 95% CI (Figure 5B). The R2Y and Q2Y values in this OPLS-DA model were 0.901 and 0.252, respectively.
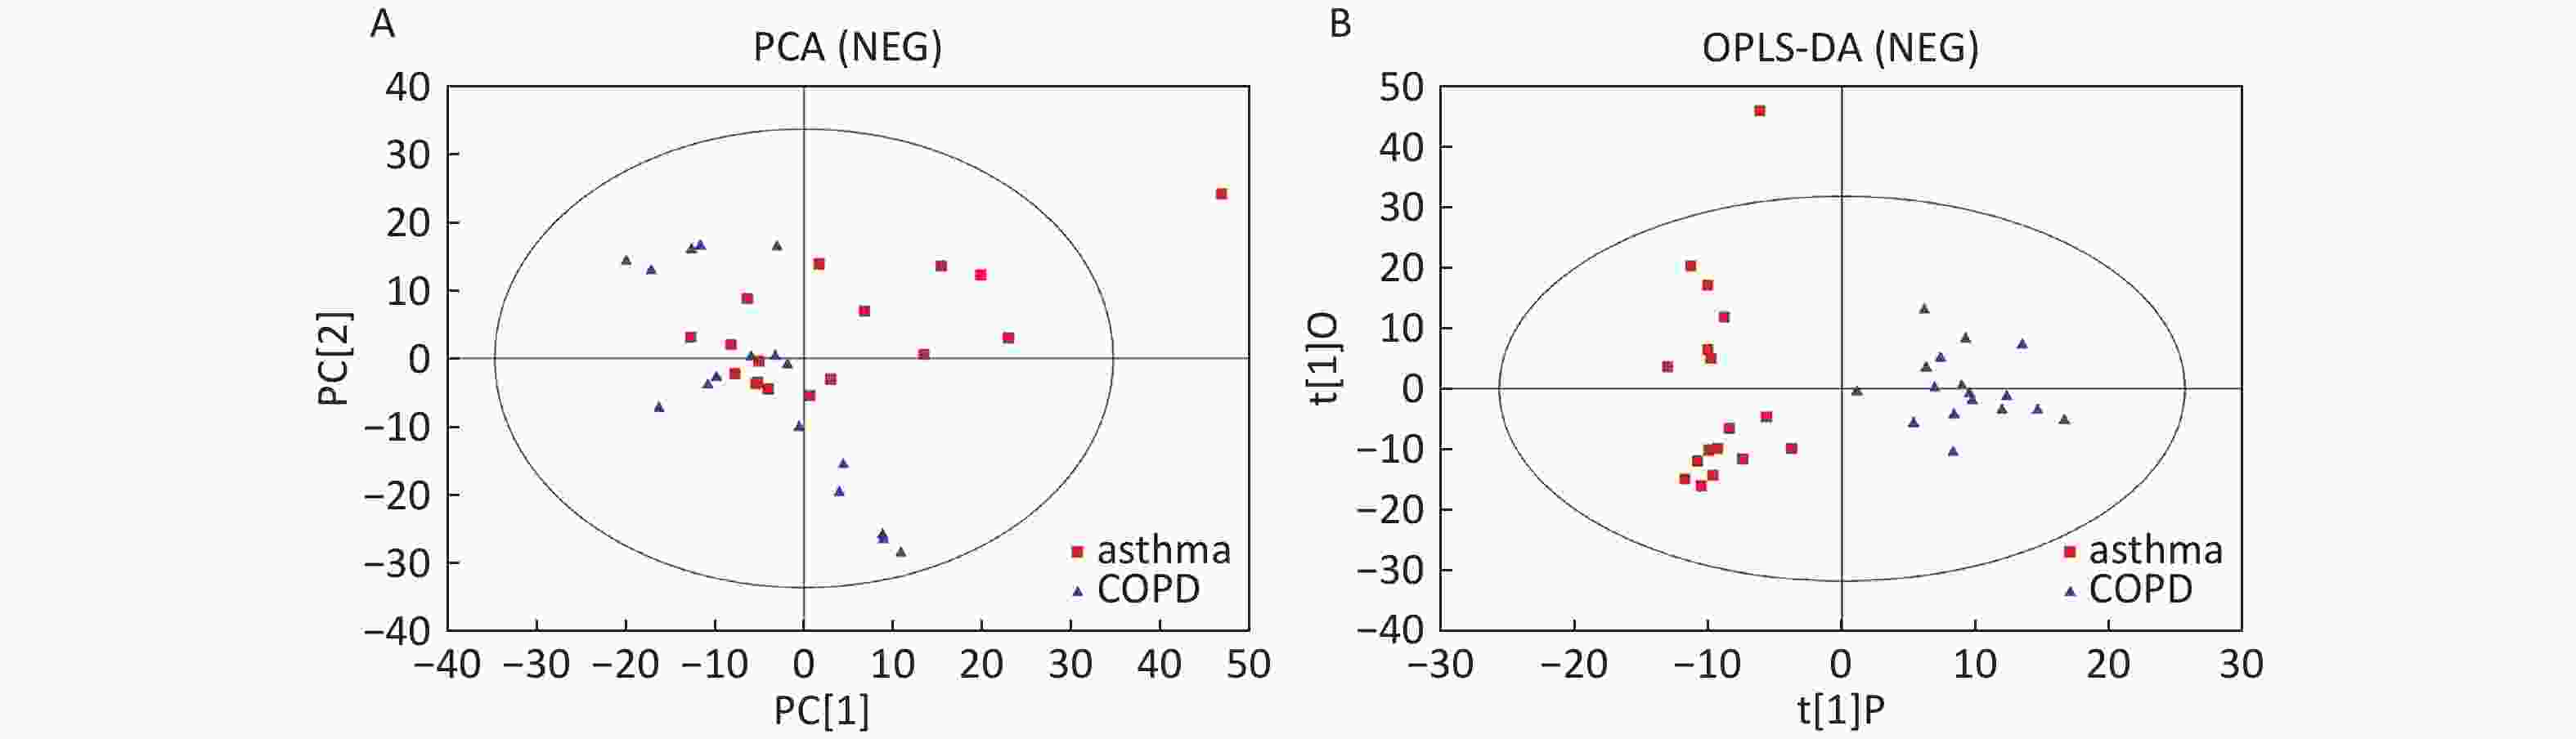
Figure 5. PCA and OPLS-DA of LC-MS metabolite profiles between asthma and COPD subjects in electrospray negative ion mode. (A) Score scatter plot of PCA model obtained from asthma and COPD subjects. The X-(PC[1]) and Y-axis (PC[2]) indicate the first and second principal components, respectively. (B) Score scatter plot of the OPLS-DA model obtained from asthmatic and COPD subjects. The X-(t[1]P) and Y-axis (t[1]O) indicate the predictive and orthogonal directions, respectively.
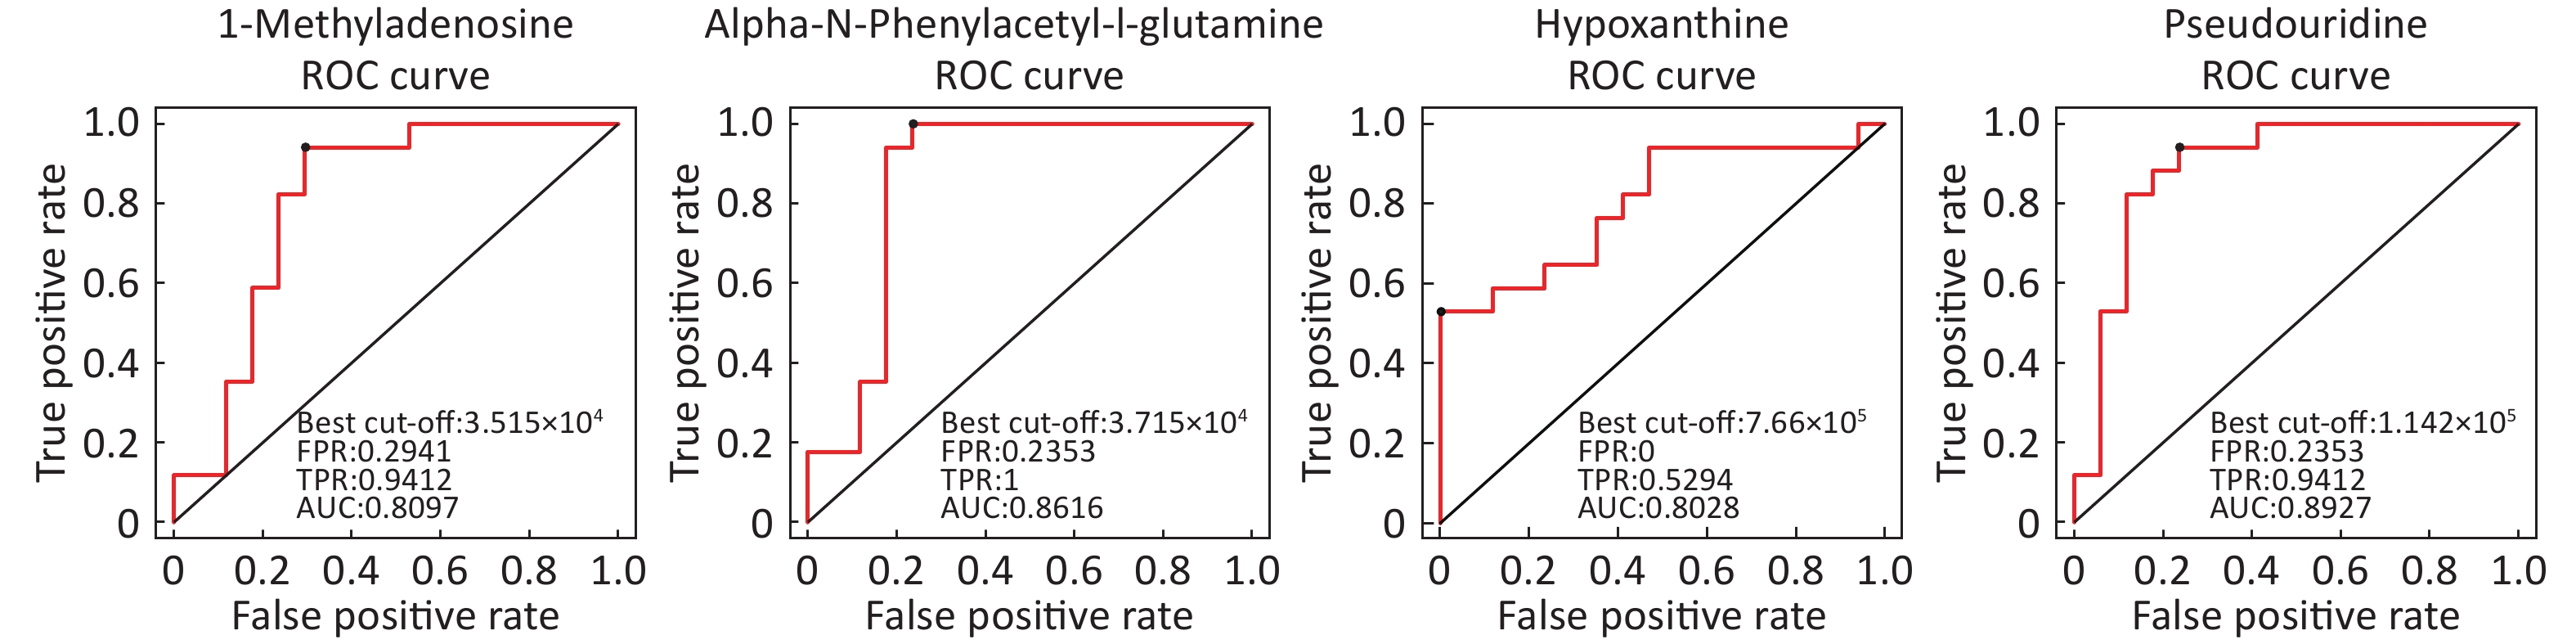
Identification of Metabolite Differential Levels Based on the score, VIP, and P-values, we detected nine different metabolites in the ESI+ mode and seven different metabolites in ESI- mode (Table 3). In the ESI+ mode, the levels of hypoxanthine, L-pipecolic acid, p-chlorophenylalanine, and acetylcarnitine were significantly higher in the asthmatic patients, whereas the levels of alpha-N-phenylacetyl-L-glutamine, 1-methyladenosine, glycochenodeoxycholate, L-citrulline, and L-glutamine were significantly decreased in asthmatic patients compared with those of the COPD patients. In the ESI- mode, the levels of linoleic acid and hypoxanthine were significantly higher in asthmatic patients, whereas the levels of pseudouridine, alpha-N-phenylacetyl-L-glutamine, succinate, L-citrulline, and glycochenodeoxycholate were significantly decreased in asthmatic patients compared with those in the COPD patients. Figure 6 shows the ROC curves evaluating the predictive performance of differential detection of metabolites with AUC ≥ 0.8.
Metabolite name Score Median RT (s) Mean asthma Mean COPD VIP P-value Fold-changea Positive ion mode (ESI+) Hypoxanthine 0.888 127.044 762,120.978 381,909.931 2.527 0.001259746 1.996 Alpha-N-Phenylacetyl-L-glutamine 0.988 153.115 38,052.756 89,817.110 1.957 0.01036502 0.424 1-Methyladenosine 0.999 272.377 34,809.689 43,740.524 2.226 0.0038404 0.796 L-Pipecolic acid 0.963 236.526 232,104.868 123,058.269 1.738 0.01723709 1.886 P-chlorophenylalanine 0.946 299.633 103,213.840 88,268.687 1.065 0.02133749 1.169 Glycochenodeoxycholate 0.949 64.320 45,516.012 97,470.902 1.552 0.03594549 0.467 L-Citrulline 0.995 478.579 63,201.074 78,036.069 1.069 0.04906988 0.810 L-Glutamine 0.951 386.792 14,215.705 30,354.808 1.917 0.01095651 0.468 Acetylcarnitine 0.994 295.668 3,756,606.528 2,695,779.062 1.497 0.04943523 1.394 Negative ion mode (ESI-) Pseudouridine 0.983 210.311 103,185.823 150,318.467 2.984 0.000021522 0.686 Linoleic acid 0.819 48.449 385,935.752 265,424.563 1.472 0.04613066 1.454 Alpha-N-Phenylacetyl-L-glutamine 0.986 124.370 75,235.866 159,211.792 1.793 0.02703009 0.473 Hypoxanthine 0.986 127.177 421,202.385 228,230.660 2.046 0.00424504 1.846 Succinate 0.986 467.769 24,293.468 35,559.405 2.076 0.03407866 0.683 L-Citrulline 0.986 476.705 36,668.147 49,596.943 2.178 0.01640797 0.739 Glycochenodeoxycholate 1.000 63.258 111,864.373 232,527.155 1.661 0.04583166 0.481 Note. aFold-change: Asthma versus COPD.
Abbreviations: RT: retention time; VIP: variable importance for the projection.Table 3. Differential detection of metabolites between asthmatic and COPD subjects
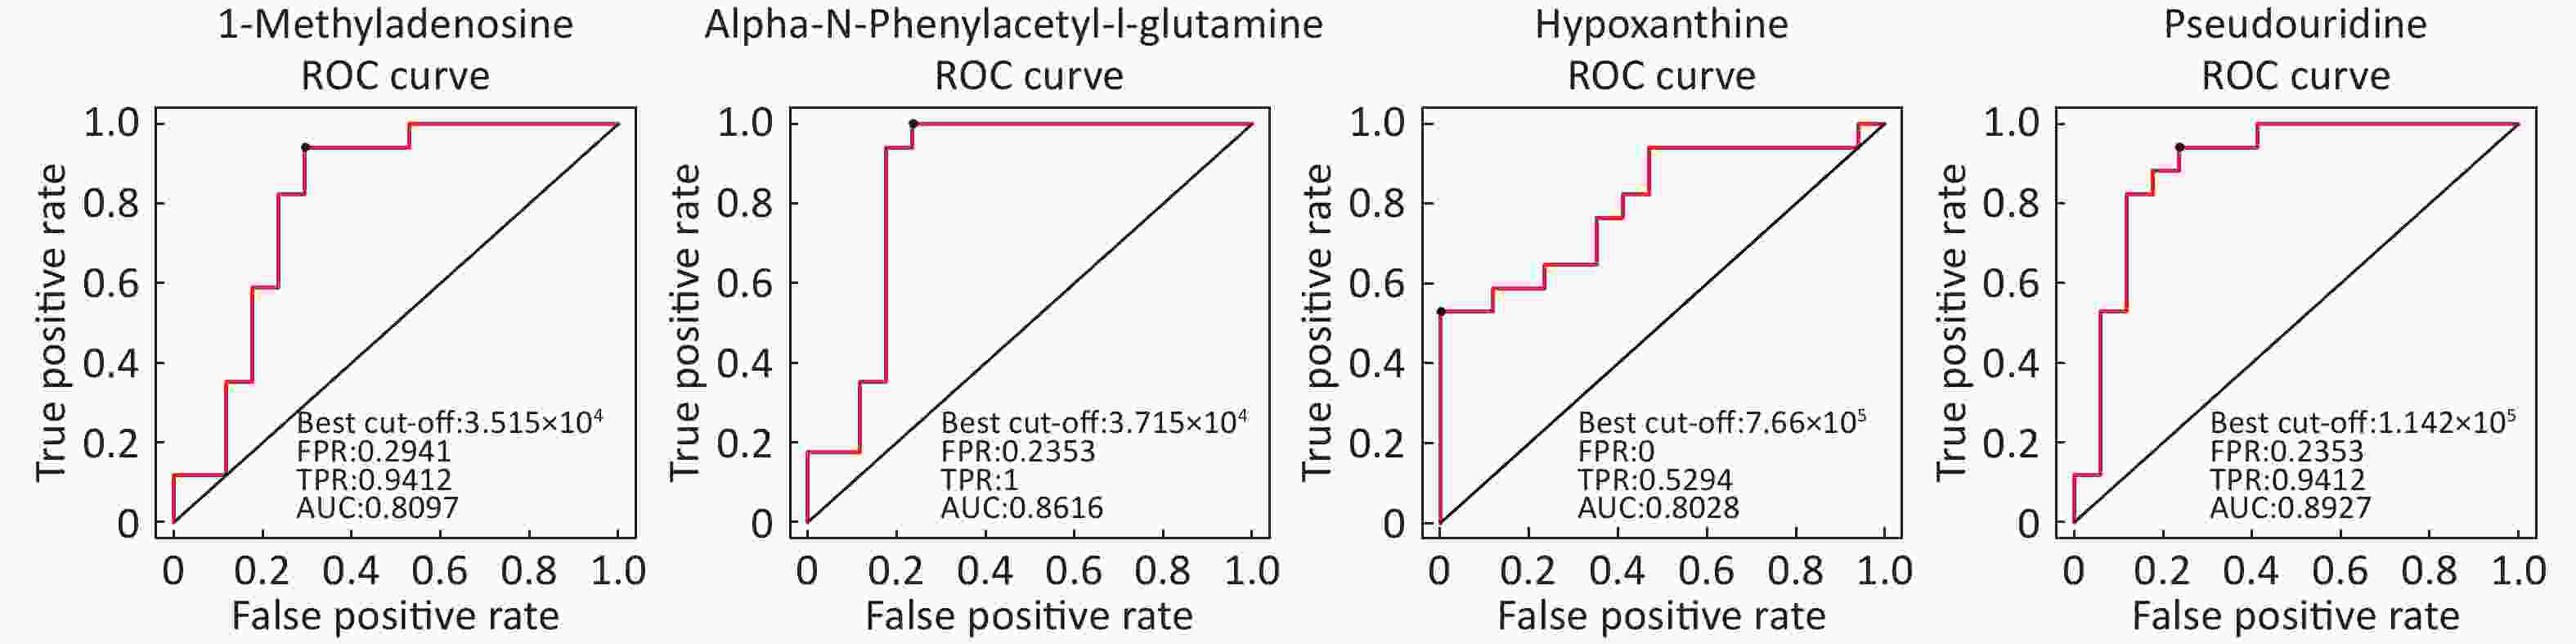
Figure 6. ROC curves of differential metabolites between asthmatic and COPD subjects with AUC ≥ 0.80.
-
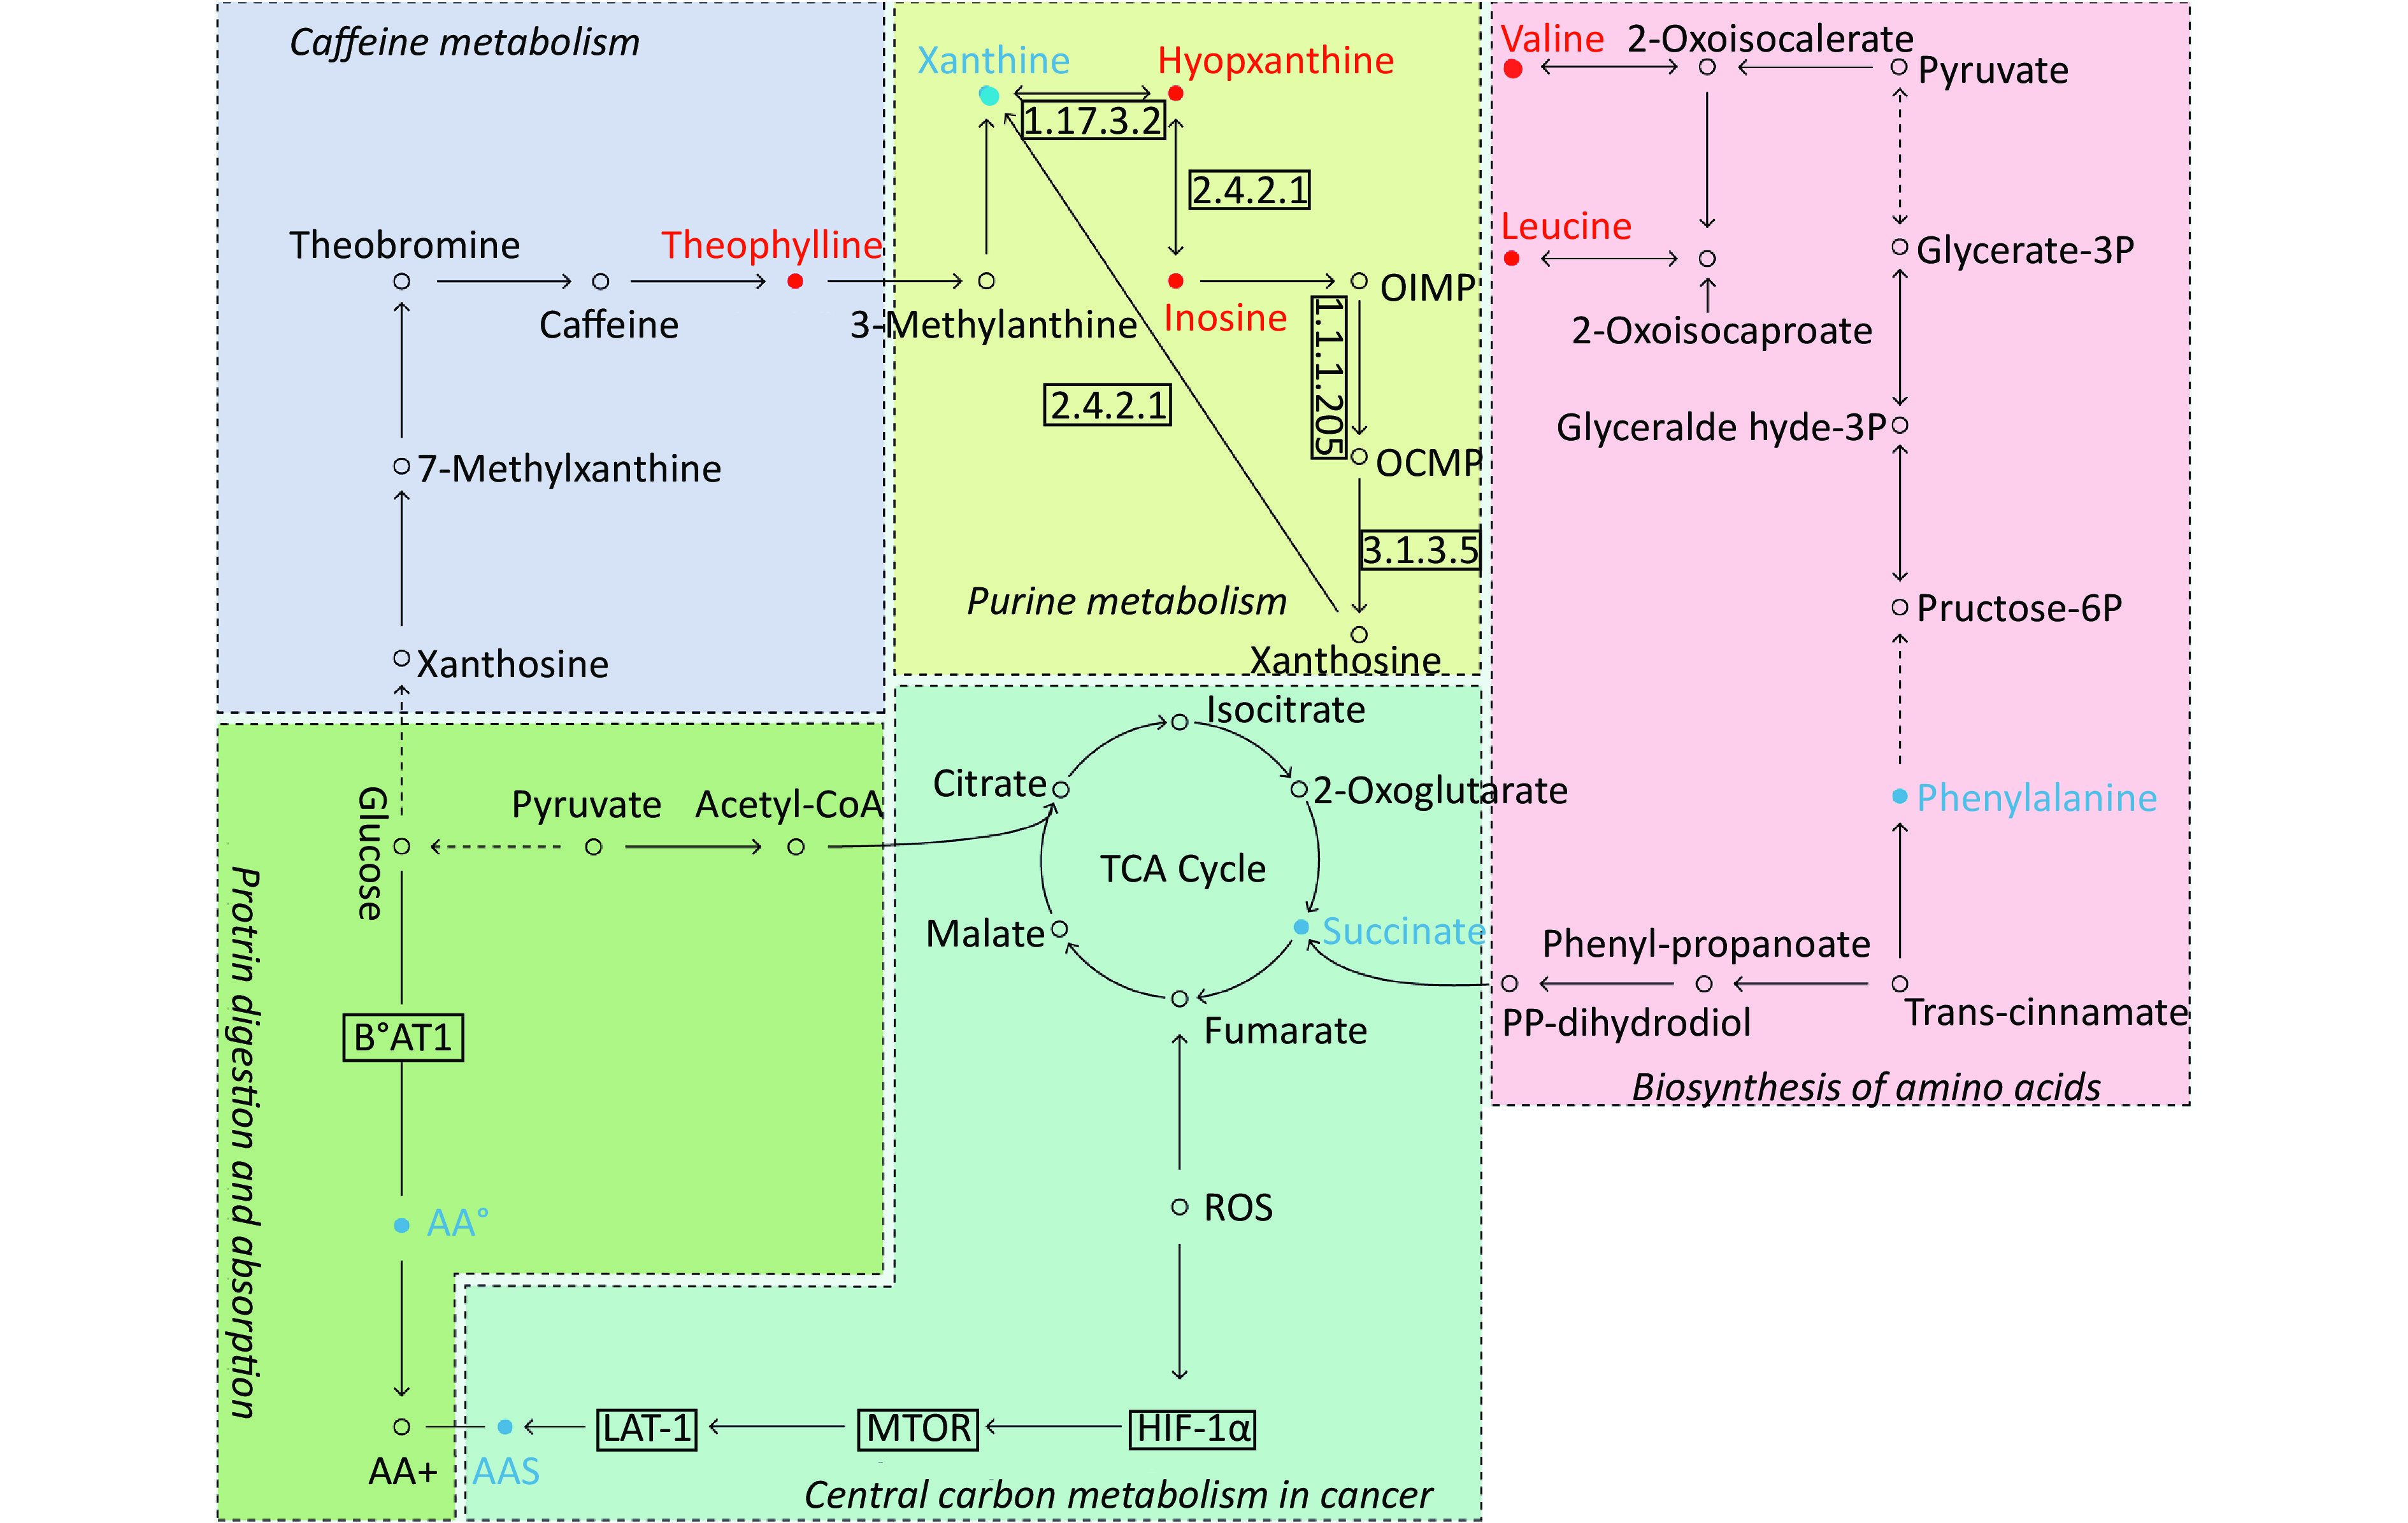
By searching the KEGG database, the key differential metabolites between the asthma patients and healthy controls were identified to be involved in the following pathways: purine metabolism, caffeine metabolism, tricarboxylic acid (TCA) cycle, protein digestion and absorption, and biosynthesis of amino acids (Figure 7). The key differential metabolites between asthma and COPD were identified to be involved in the pathways for purine metabolism and urea cycle (Figure 8).
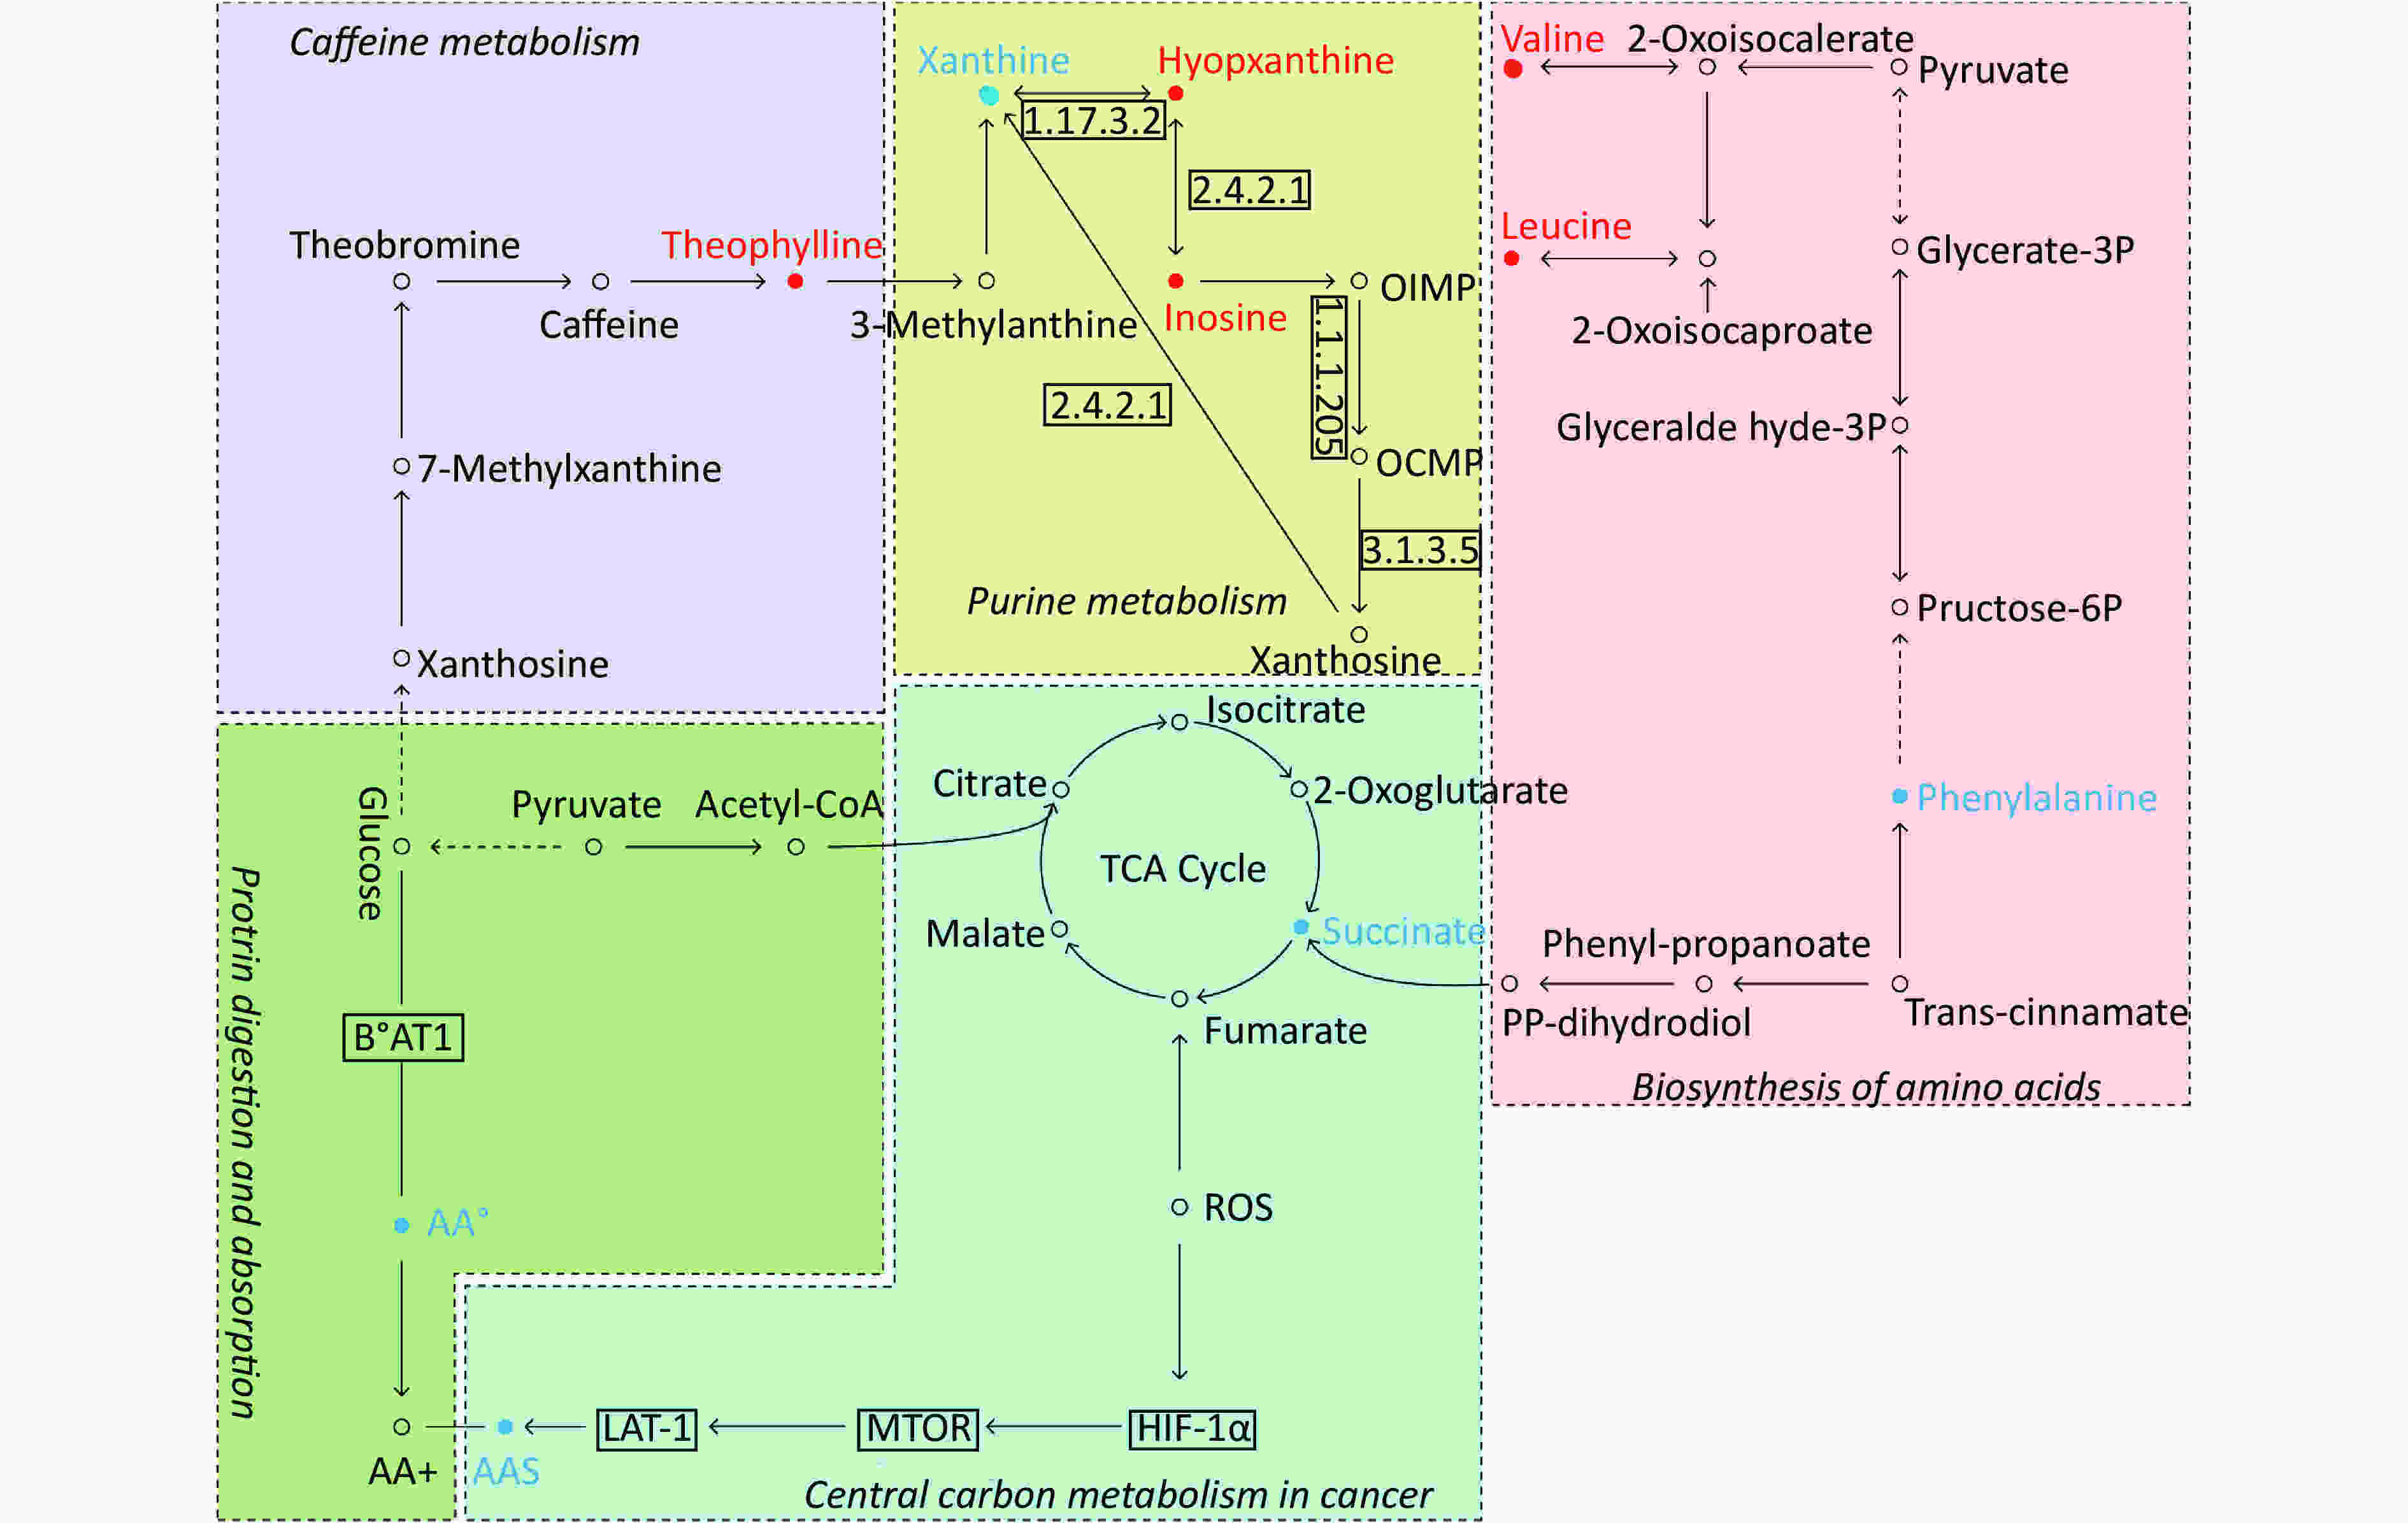
Figure 7. Pathway analysis of metabolomics alterations associated with asthmatic versus healthy control subjects. The purine metabolism, caffeine metabolism, TCA cycle, protein digestion and absorption, and biosynthesis of amino acids were altered in asthmatic subjects. Metabolite with red color in this reference map represents an increased level of this metabolite in asthmatic subjects, whereas the blue color represents a decrease.
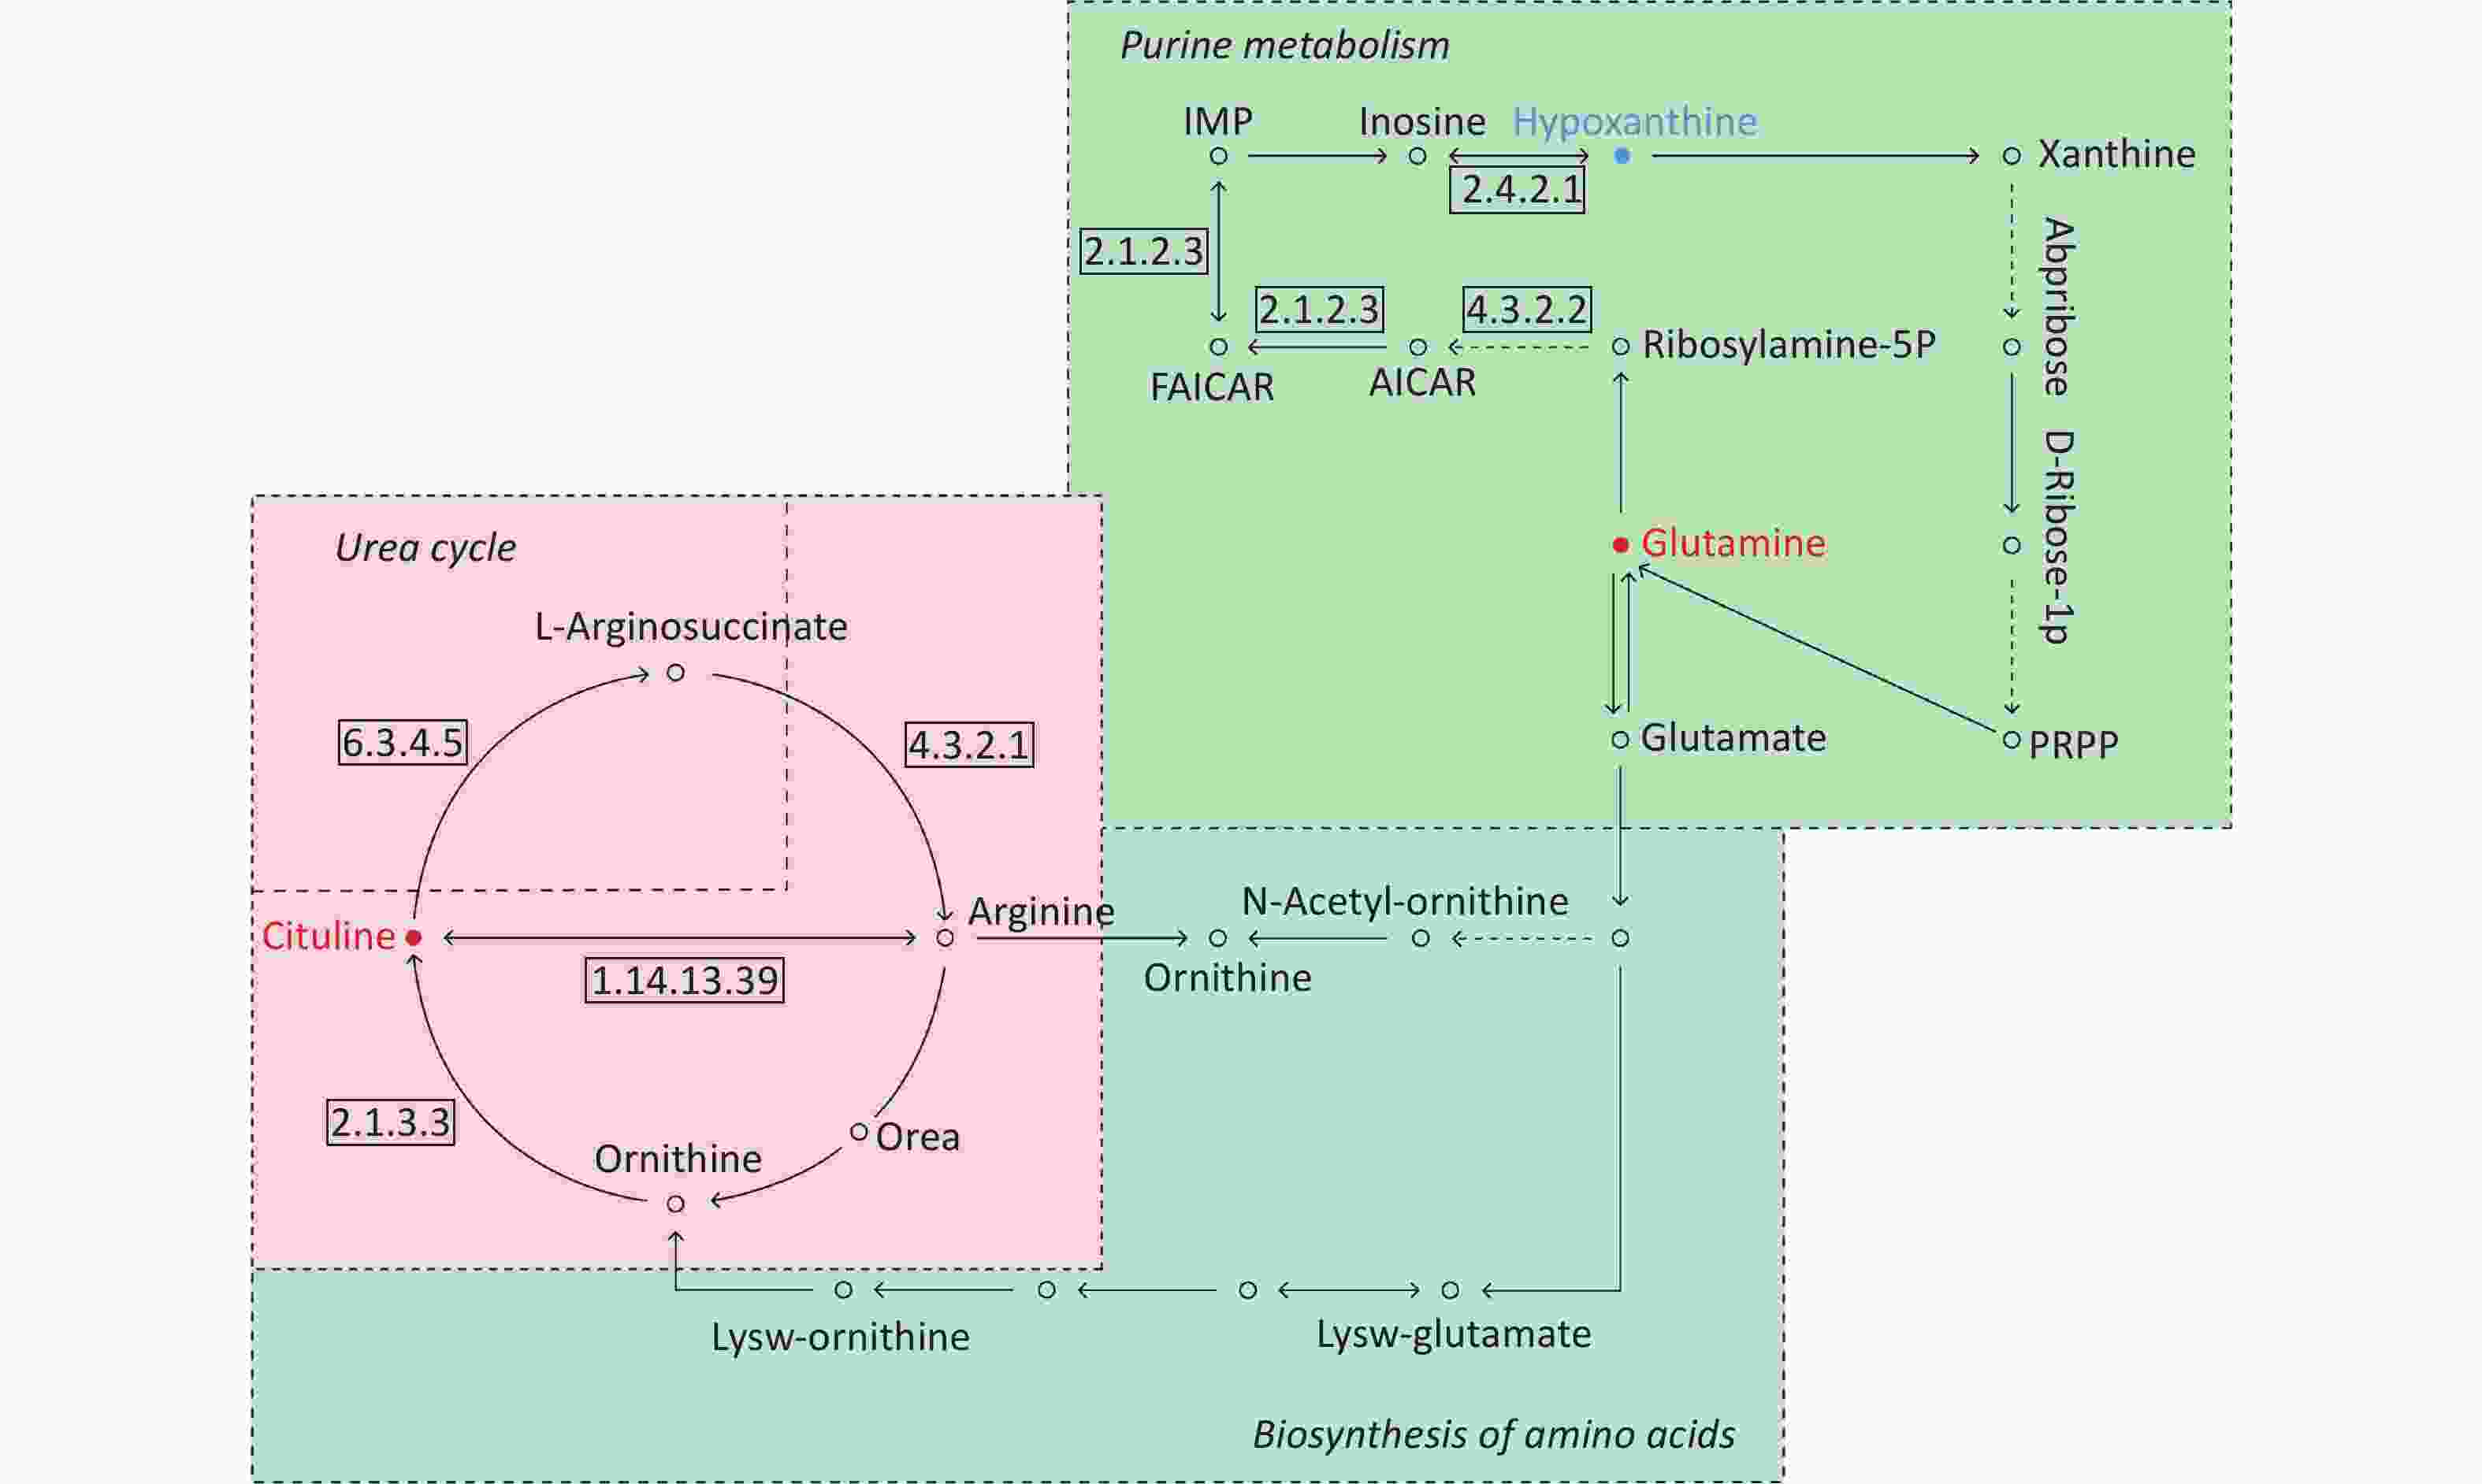
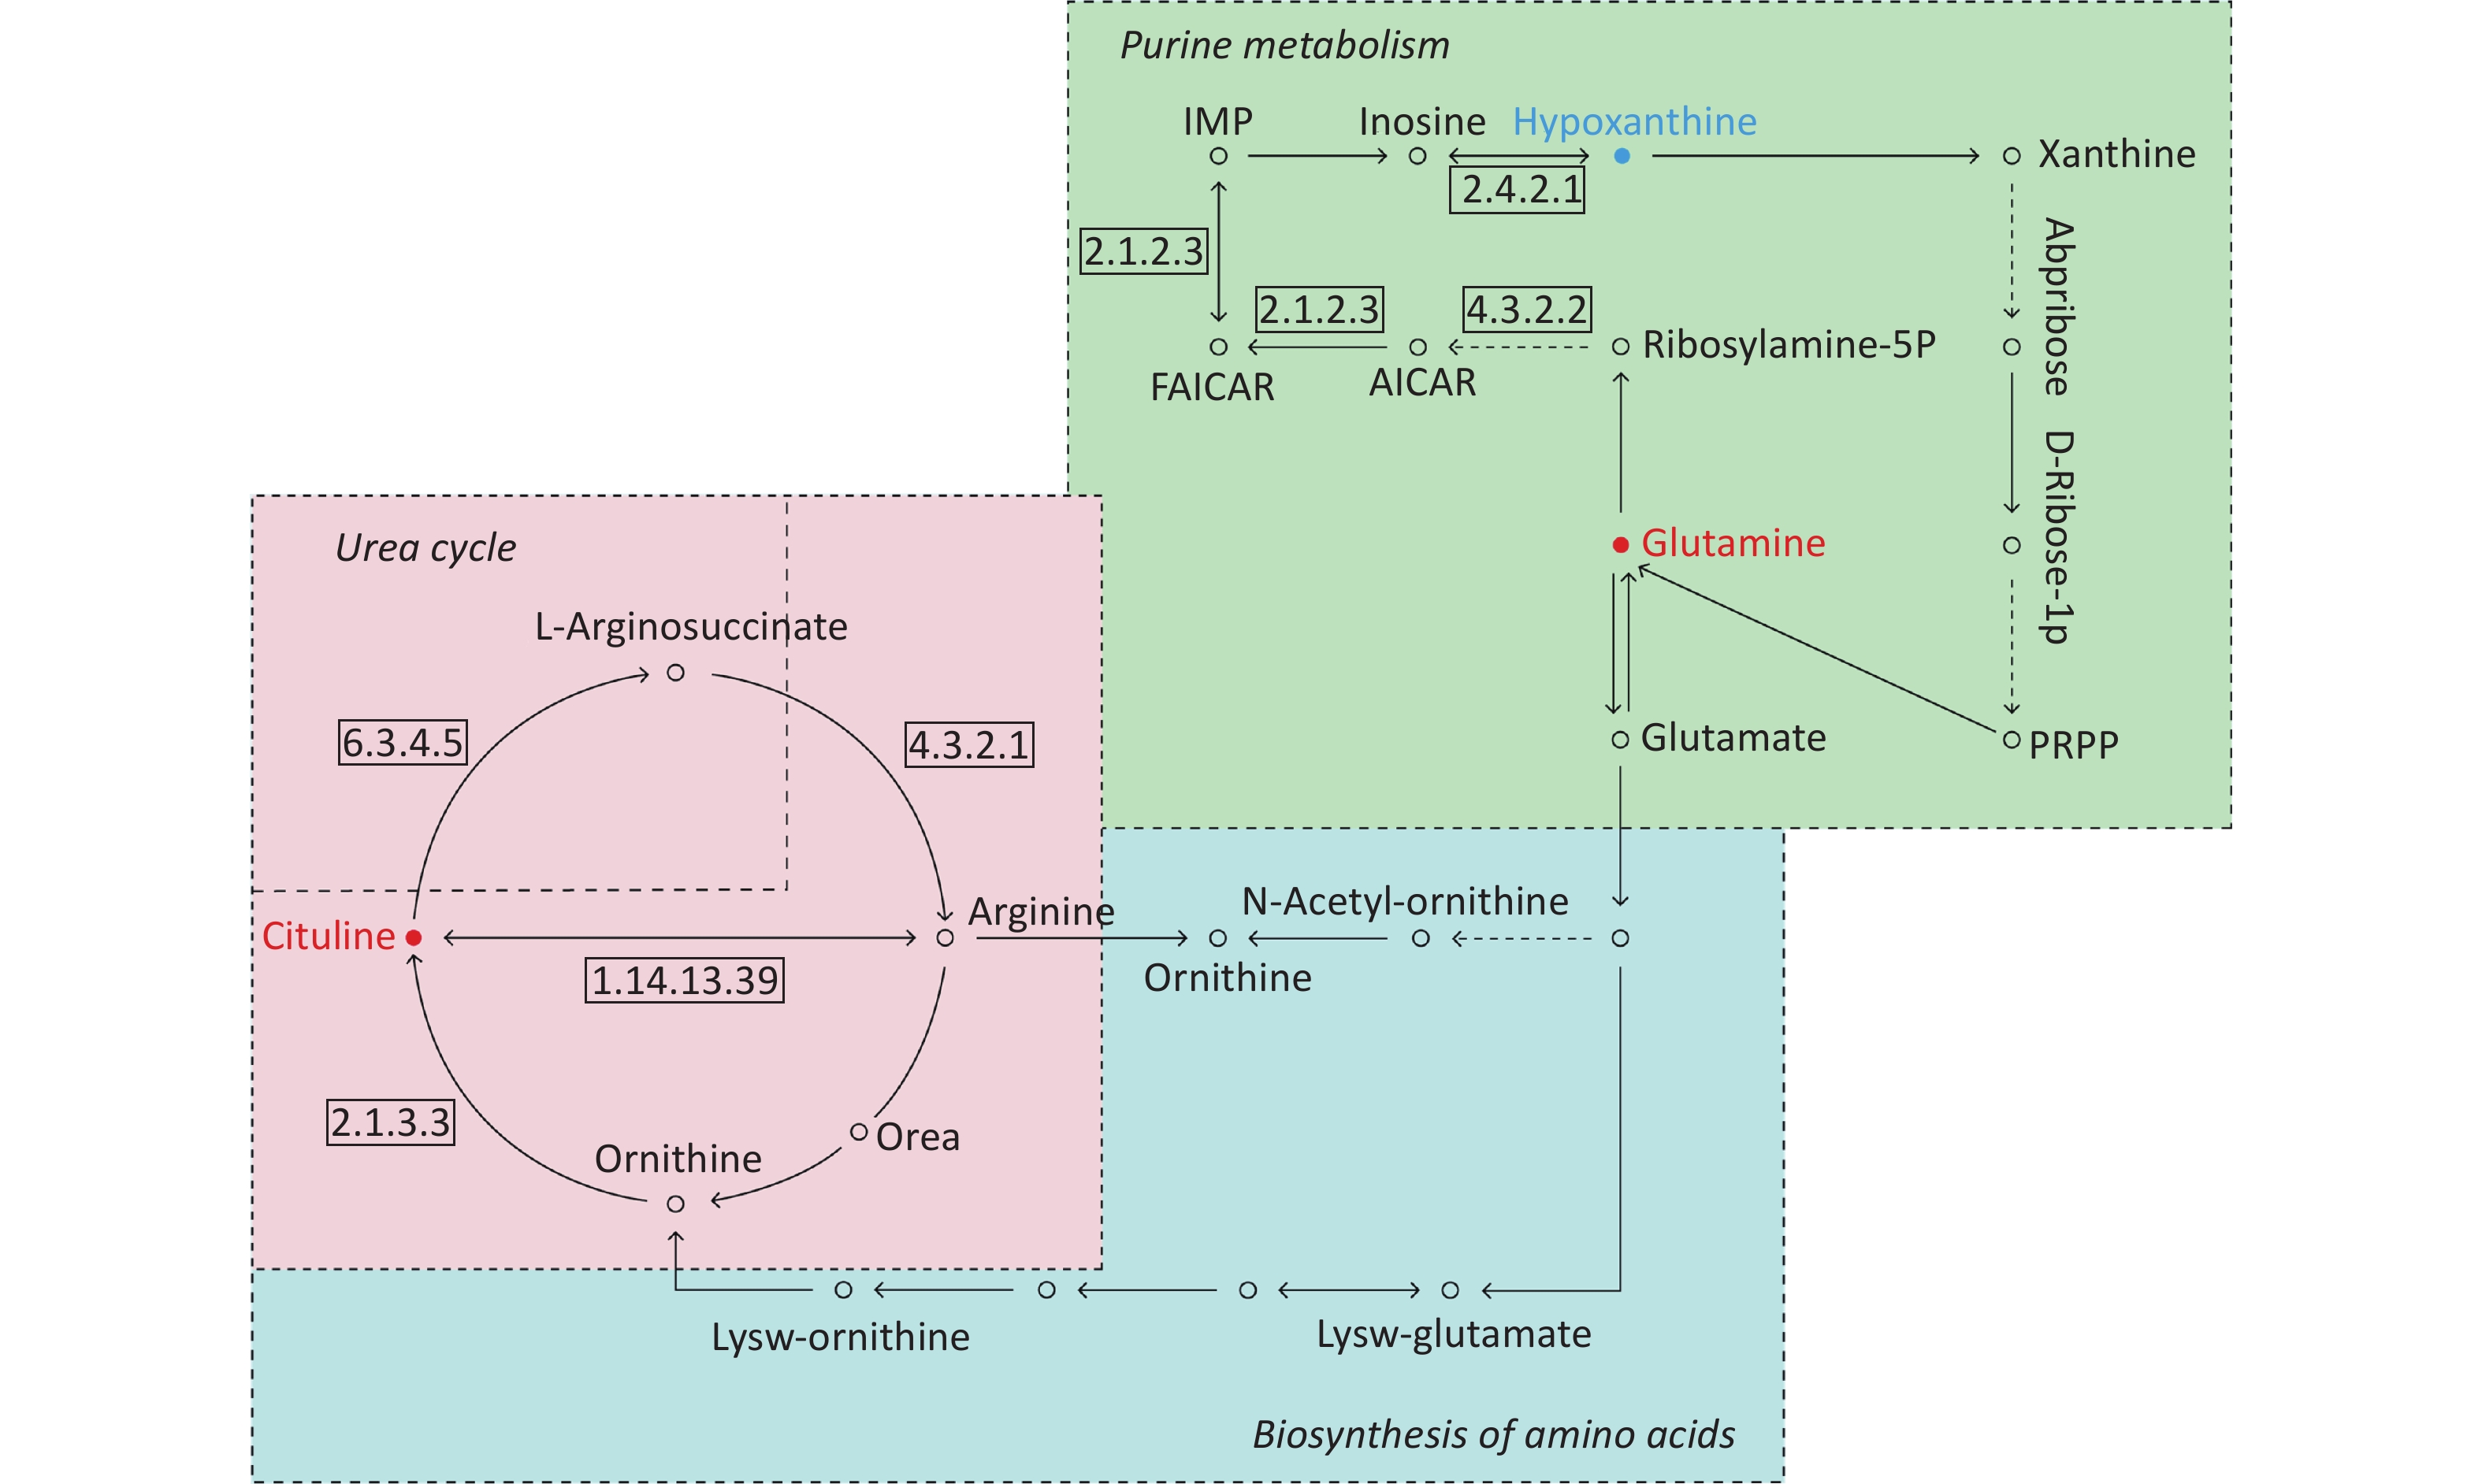
Figure 8. Pathway analysis of metabolomics alterations associated with asthmatic versus COPD subjects. The purine metabolism, urea cycle, and biosynthesis of amino acids were different between the two disorders. Metabolite with blue color in this reference map represents an increased level of this metabolite in asthmatic subjects, whereas the red color represents an increase of this metabolite in COPD subjects.
-
Compared with other ‘-omics’ strategies, metabolomics can offer a number of advantages because of its close biological proximity to the phenotype of life systems and the rapid observation of system perturbations in the metabolome[26]. A range of analytical platforms has been utilized in metabolic profiling studies, including chromatography coupled with MS or NMR spectroscopy, both of which are widely applied. For the first time, the present study demonstrated that the serum metabolic profiling of asthmatic patients was distinct from that of COPD and healthy subjects using UPLC-MS-based analysis. Our experimental data were of high quality and stability due to good QC. The QC samples were densely distributed in the PCA scatter 2D plots (refer to Supplementary Figures S1 and S2). Additionally, all the QC samples were within ± 2 standard deviation in the PCA scatter 1D plots (refer to Supplementary Figures S3 and S4 available in www.besjournal.com).
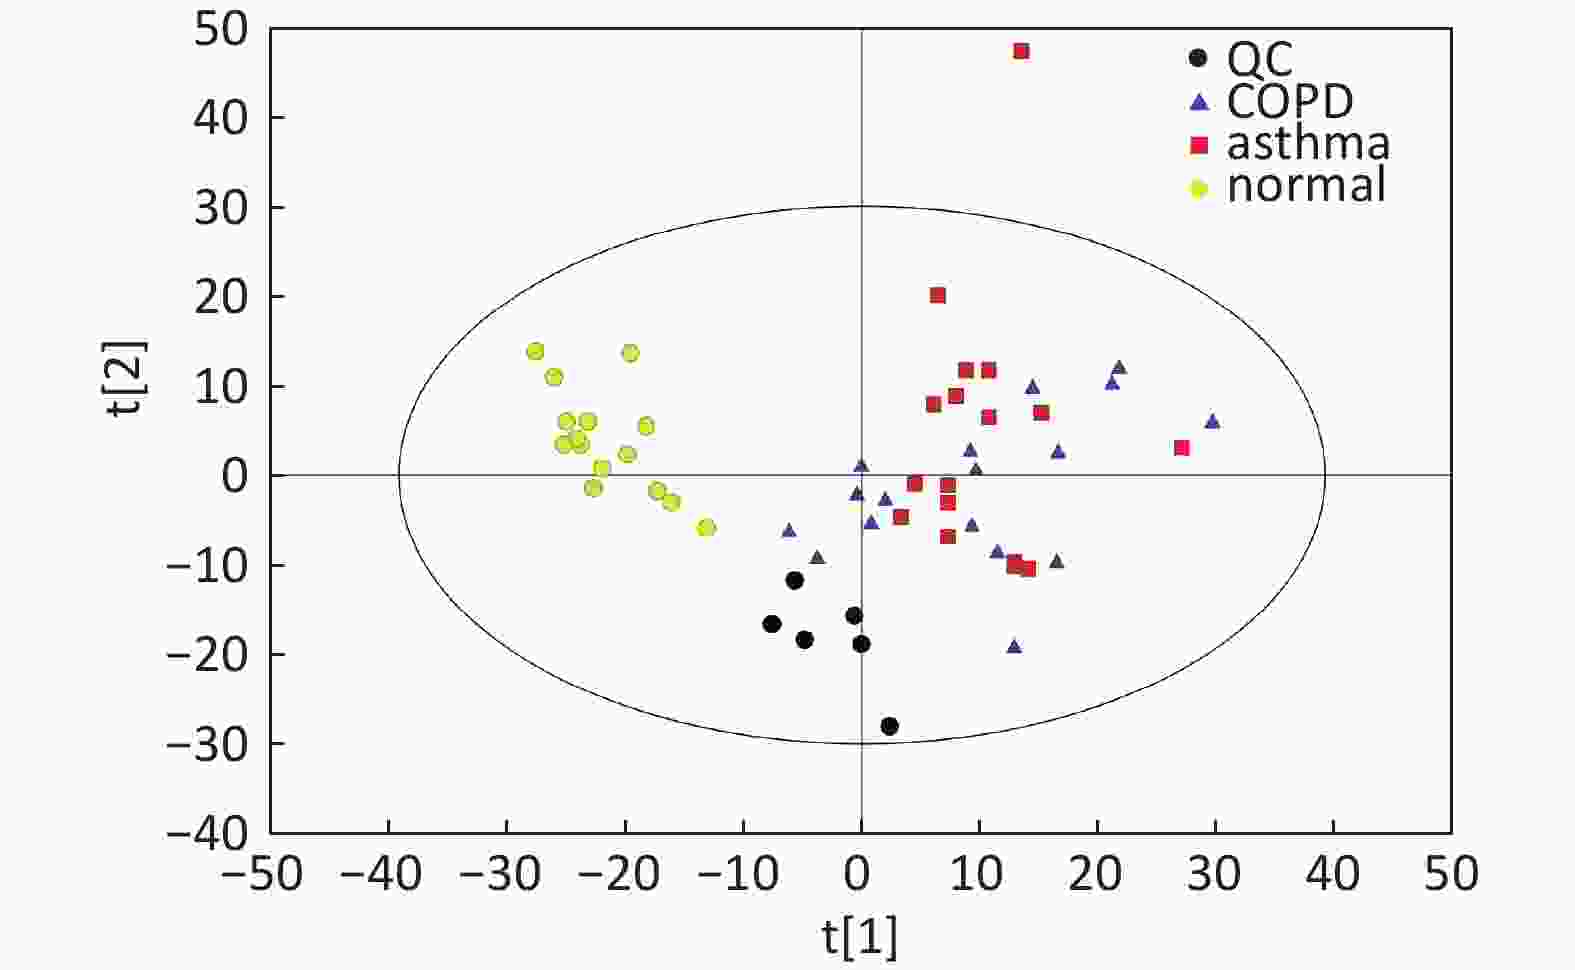
Figure S2. Distribution of QC samples in PCA scatter 2D plots (Supplementary Figures S1 and S2 for ESI+ and ESI− mode, respectively). QC samples were densely distributed in these plots (yellow points in ESI+ mode and black points in ESI− mode).
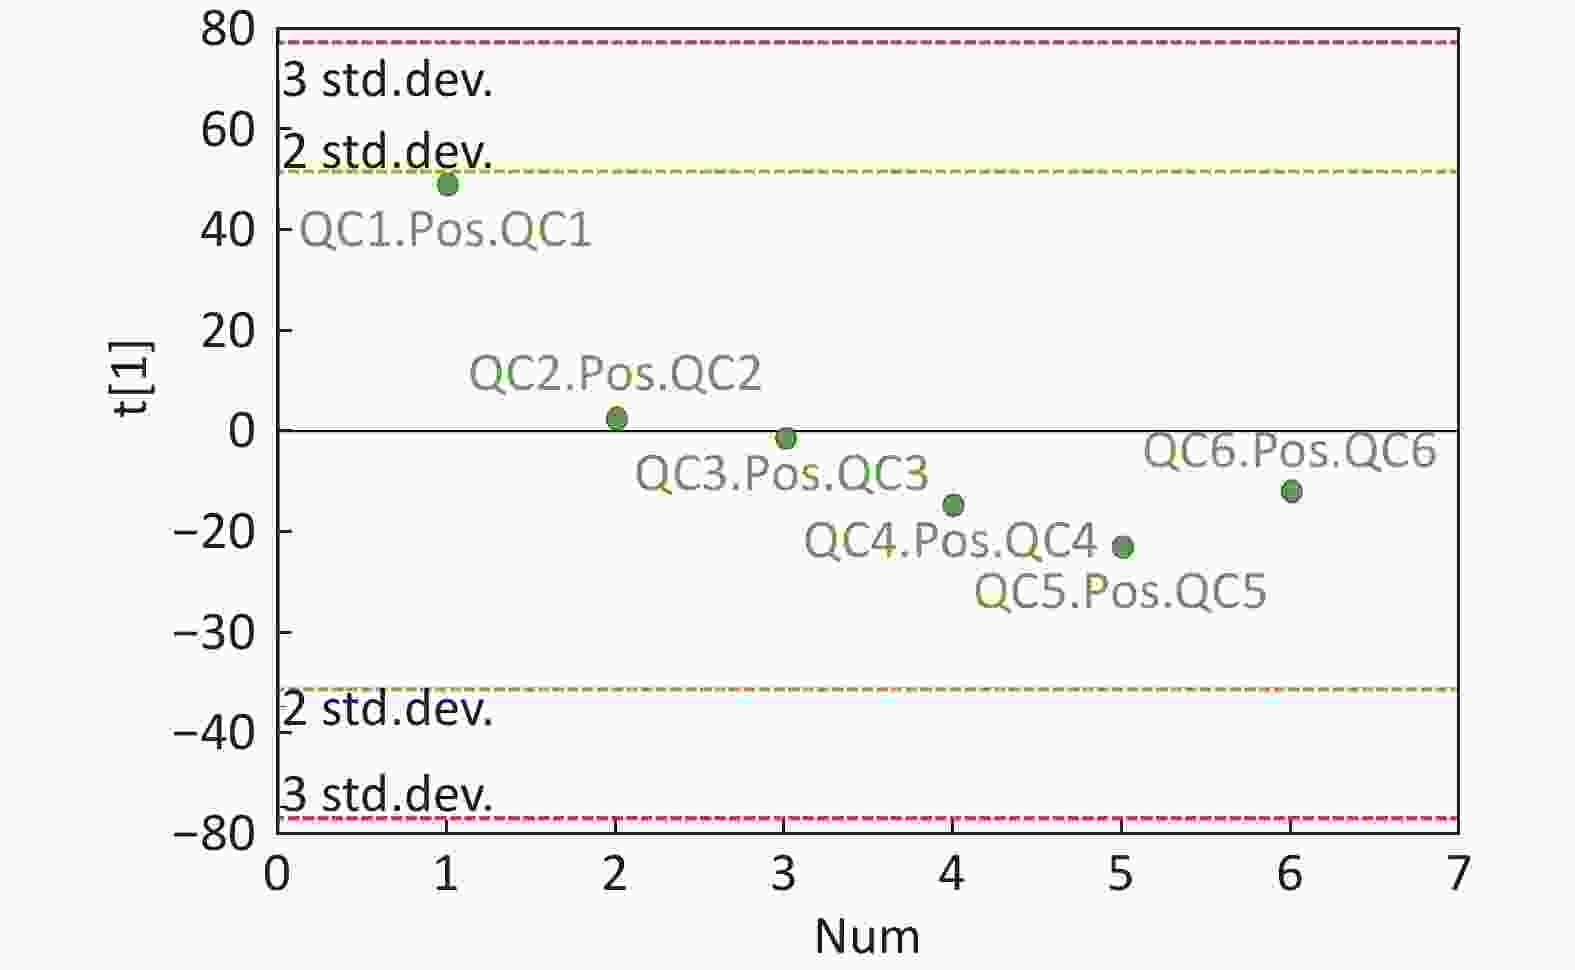
Figure S3. QC samples in PCA scatter 1D plots (Supplementary Figures S3 and S4 for ESI+ and ESI− mode, respectively). All of the QC samples were within the 95% confidential interval and ± 2 standard deviation.
Initially, the present study further reinforced our previous findings, which showed that serum metabolic profiling was significantly altered in patients with mild persistent asthma compared with that of healthy subjects based on GC-MS methods[25]. In addition, several metabolites and their altered trends were highly similar between these studies. For example, we observed that in both studies, the levels of inosine increased, whereas those of L-glutamine and arachidonic acid decreased in asthmatic patients compared with those in healthy subjects. These studies could complement each other due to the presence of several high-molecular-weight metabolites with poor thermal stability and which could only be detected by LC-MS methods[26]. Notably, both R2Y and Q2Y scores in the OPLS-DA model exceeded 0.9, despite the application of the ESI mode (ESI+ or ESI-), suggesting that the models had excellent fitness and predictive power to distinguish asthmatic patients from healthy subjects.
A previous study conducted by Saude et al. revealed through NMR analysis that urine metabolites were associated with airway dysfunction in an ovalbumin-challenged animal model[19]. They further utilized NMR analysis on urine samples to explore the differences in metabolite profiling among unstable asthmatic children, stable asthmatic children, and healthy subjects. The data indicated that urine metabolomic analysis could aid the identification of stable asthmatic patients from healthy subjects and of stable asthmatic patients from unstable asthmatic patients, achieving a good diagnostic accuracy (> 90%)[20]. Subsequently, Mattarucchi et al. initially applied LC-MS analysis to urine samples in asthmatic children and healthy subjects and demonstrated that metabolite profiles were distinct between the asthmatic patients and control subjects. This finding was unaffected by asthma control and/or medication[15]. Using a combined GC- and LC-MS platform, Ho et al. revealed that metabolite alterations in bronchoalveolar lavage fluid of ovalbumin-challenged mice could reverse several key metabolite changes compared with the levels of these metabolites in control animals and animals treated with glucocorticoids[27]. In addition, several experimental and human studies were conducted regarding metabolomic profiling differentiation between asthmatic patients and control subjects based on NMR methods and on different biofluid applications[22-24,28]. Collectively, the data demonstrated that the systemic metabolic state in asthma was considerably different from that in healthy subjects, although different metabolites were identified among these studies.
Furthermore, our data indicated that serum metabolic profiling was different between mild asthma and stable COPD subjects. In a pilot study, metabolomic analysis of human urine samples based on NMR spectroscopy highlighted that metabolomic profiling differences could be noted between patients with asthma and those with COPD prior to and following exacerbation. In addition, their predictive model could diagnose blinded asthma and COPD correctly with optimal accuracy[24]. However, the data regarding the application of metabolomic analysis on the differential diagnosis between asthma and COPD are still limited. Asthma and COPD are heterogeneous diseases with distinct phenotypes and in which metabolic states can differ from each other theoretically. The underlying mechanisms are unclear, and further studies are required to discover their precise function.
Notably, in our study, the OPLS-DA models for asthma and COPD exhibited no desirable predictive power compared with the models for asthma and healthy subjects. This finding was due to the Q2Y values being lower than 0.5 (< 0.5) despite the optimal fitness of the models (R2Y values were 0.879 for ESI+ mode and 0.901 for ESI- mode). These results may be ascribed to the following reasons: 1) The asthmatic and COPD subjects lacked matching in terms of age. The age is an important confounding factor for metabolic profiling analysis. 2) The patients with COPD were often current- or ex-smokers, and tobacco exposure may affect their metabolic profiles. 3) Relatively small sample sizes of asthma or COPD subject were used. Therefore, the differential detection of metabolites in the present study should be validated in a larger and prospective cohort study to assess their potential to distinguish asthma from COPD.
Interesting, the levels of hypoxanthine were evidently higher in asthmatic patients compared with those in healthy or COPD subjects. Hypoxanthine is a key metabolite in purine metabolism, and our study reported for the first time that the serum levels of hypoxanthine were significantly higher in asthmatic compared with healthy and/or COPD subjects. In addition, inosine is involved in purine metabolism, and its levels were significantly elevated in asthmatic patients compared with those in healthy subjects. Inosine can inhibit airway inflammation by reducing the number of macrophages, lymphocytes, and eosinophils, and cytokines interleukin-4 and -5 in the airway[29]. The increased inosine level may be associated with the increased activity of adenosine deaminase (ADA), which converts adenosine to inosine. The increase in ADA activity can protect the body from the inflammation responses of bronchial asthma in animal models[30]. We speculated that the increase in inosine is likely to be a protective response to airway inflammation in asthma. Purine metabolism is also proven to be associated with the pathogenesis of asthma in recent studies. Uric acid levels increased in bronchoalveolar lavage fluid and pulmonary tissue homogenates in asthmatic patients and in asthmatic mouse models[31]. Serum uric acid levels increased proportionally with the severity of asthma exacerbation and were inversely associated with lung function[32]. Uric acid could be produced by human airway epithelial cells, and the level of extracellular uric acid in culture was elevated by allergen stimulation[33]. An epidemiological study reported that the elevated serum uric acid level is a predictor for the development of airflow limitation[34]. However, another study showed that plasma uric acid levels decreased in ovalbumin-challenged asthmatic mouse models[35]. Although previous studies have shown inconsistencies, uric acid should be considered a useful biomarker for asthma. Uric acid is the final product of purine metabolism and is produced from xanthine and hypoxanthine by the enzyme xanthine oxidase. Therefore, the increasing levels of serum hypoxanthine in asthmatic patients in the present study suggests that xanthine oxidase may be inhibited, or hypoxanthine accumulates in the purine metabolic pathway in asthma, although no alteration of uric acid levels was detected in our study. According to our data, significantly increased serum hypoxanthine levels in asthma may aid the differential diagnosis of asthmatic patients compared with healthy individuals and COPD. Hypoxanthine can be a potential diagnostic biomarker for asthma. However, our study was a pilot research, and targeted metabolomic analysis should be conducted to further validate the role of hypoxanthine and purine metabolism in asthma.
In addition to purine metabolism, other metabolic pathways were identified to be involved in asthma. Metabolic alteration in TCA cycle had been identified and discussed in our previous work[25]. Changes in amino acid metabolism could be observed in our study. The potential functions of these differential metabolites (i.e., L-valine, L-leucine, and L-phenylalanine) in asthma were unclear. In a recent metabolomics study, the urine levels of 3,4-dihydroxy-L-phenylalanine increased significantly in corticosteroid-nonrespondent children who had severe asthma compared with corticosteroid-respondent children[36]. This finding was inconsistent to a certain extent with our study. In our research, the asthmatic subjects presented lower serum levels of L-phenylalanine than the healthy controls. However, the asthmatic subjects in our study comprised adults with mild asthma. The role of amino acid metabolism pathway in development of asthma needs to be further studied in the future.
Compared with COPD subjects, in addition to purine metabolism, the pathways of urea cycle and arginine metabolism in asthmatic subjects differed. In bronchial epithelial cells, L-arginine is the substrate of nitric oxide synthase and the upstream metabolite of nitric oxide[37]. The reduced bioavailability of L-arginine can limit the production of nitric oxide, and its bronchodilator effect will be impaired[38]. L-Citrulline can be metabolized to L-arginine by the enzyme argininosuccinate[39]. In our study, the serum levels of L-citrulline in asthmatic subjects were lower than that in COPD subjects, indicating that the bioactivity of argininosuccinate may differ between asthma and COPD, although no alteration in the levels of L-arginine was detected in our study. Another study showed that the whole-body citrulline rate of appearance was higher in stable COPD patients than in healthy controls, and the authors speculated that this phenomenon is likely a reflection of higher glutamine delivery and turnover because glutamine is the upstream metabolite of arginine[40]. This finding can partly support our results because serum L-glutamine level was also elevated in COPD subjects, in addition to elevated serum L-citrulline levels, compared with asthmatic subjects. The metabolomic profile difference between asthma and COPD had also been identified in a recent study. COPD patients showed increased ethanol and methanol levels in their exhaled breath condensate and significantly lower levels of formate and acetone/acetoin compared with asthmatic patients[41]. These findings reinforced the evidence indicating that airway inflammation is distinct between asthma and COPD.
The present study includes the following limitations: 1) Our results cannot be extrapolated to all the asthmatic patients and COPD subjects, as we only recruited individuals with mild persistent asthma and stable COPD. On the other hand, the association between metabolomic profiles and clinical phenotypes were excluded in the present study. This hypothesis can be tested in a study with a larger sample size. 2) The OPLS-DA models for asthma and COPD lacked a good predictive power, which has been mentioned previously. This finding may be due to the mismatched age and tobacco exposure between asthma and COPD subjects, which was the major limitation in our study. However, in clinical practice, individuals with COPD frequently include smokers and aged and exhibit lower incidence of allergic reactions compared with those of subjects with asthma[1, 6]. Tobacco exposure was difficult to match between asthma and COPD patients. The diagnosis of COPD cannot be completely excluded in heavy smokers even when they exhibit typical asthma-like symptoms with variable airflow limitation. By contrast, a non-smoker with fixed airflow limitation should not be diagnosed as COPD indiscreetly.
-
Our LC-MS analysis demonstrated that individuals with asthma have a unique serum metabolome, which can be used to distinguish them from patients with COPD and healthy subjects. Purine metabolism alteration may be distinct and involved in the pathogenesis of asthma, as hypoxanthine serum levels are markedly elevated in asthmatic individuals.
-
The authors declare that they have no competing interests.
-
LY and GXY analyzed and interpreted the patient data and was a major contributor in writing the manuscript. CC designed the study and collected and interpreted the patient data. ZX and WJ analyzed and interpreted the patient samples and revised the manuscript. TL contributed to the statistical analysis and interpreted the results. All authors read and approved the final manuscript.
Funds:
This research was funded by the National Natural Science Foundation of China-Youth Fund Project [No. 81400017, 81700039, 81800038]; and the National Natural Science Foundation of China Emergency Management Project [No. 81641153]

 Quick Links
 DownLoad: