


-
Postoperative delirium (POD) is a common surgical complication, particularly in older adults. Numerous studies have shown that POD is associated with a longer hospital stay[1], increased need for extended medical care, reduced quality of life[2], and higher mortality rates[2-4]. With the aging global population, the number of surgeries performed on older patients is also increasing. Therefore, the prevalence and potential consequences of postoperative delirium will continue to increase.
However, the mechanisms underlying the pathogenesis of delirium are poorly understood. Previous research has suggested several potential mechanisms, including neuroinflammation[5,6], oxidative stress injury[7,8], dysfunction of neurotransmitter systems[9], the circadian rhythm dysregulation hypothesis[7,10] and neuronal aging. Recent studies have shown that postoperative delirium is associated with changes in some metabolites[11-13].
Metabolomics is a crucial component of systems biology that provides precise and direct insights into biochemical processes in an organism. Monitoring the concentration levels provides an efficient means for detecting changes in specific cellular pathways. It is a valuable tool for investigating the underlying mechanisms of diseases as it reveals transient biochemical changes that are closely associated with the disease state of a system[14]. Several studies have indicated a clear link between changes in the cerebrospinal fluid or serum metabolites and the onset of POD[13,15]. While peripheral samples can provide some insight into these mechanisms, it is challenging to extrapolate changes in brain tissue based on these findings alone. Moreover, it is difficult to distinguish the potential causal effects of postoperative delirium on metabolites from other confounding factors in clinical studies. Therefore, preclinical studies should be performed to characterize postoperative delirium in laboratory animals.
POD is characterized by fluctuations in cognition, consciousness, attention, and emotion. These symptoms are primarily associated with specific brain regions, including the hippocampus, prefrontal cortex, and basolateral amygdala. Previous studies have shown a strong correlation between delirium and these three brain regions[16-18]. The changes in metabolites in these brain regions require further exploration.
Saliva contains essential metabolic information and serves as an effective biological marker of several neurological disorders[19-22]. Moreover, obtaining saliva sampling is a simple, painless, and non-invasive procedure with multiple advantages over other biological fluids. Therefore, in addition to the three brain regions mentioned above, we conducted a metabolic analysis of the saliva and attempted to identify noninvasive biomarkers.
-
All experiments were approved by Animal Ethics Committee of Beijing Shijitan Hospital Institutional Review Board. Male C57 mice, aged 13 months, were procured from Beijing Sipeifu Biotechnology. They were raised in the animal center at Beijing Shijitan Hospital until they reached 18 months of age. The mice were housed in a strictly regulated barrier environment, maintained at 25 ± 2 °C with a 12-hour light-dark cycle, and provided free access to food and water. The mice were randomly divided into two groups, namely the Anesthesia/Surgery group and the Control group, with 10 mice in each group. At 8 a.m., the process commenced in a transparent induction chamber where the mice were given 2%–3% sevoflurane mixed with a fresh gas flow rate of 3 L/min. It took approximately 10 minutes for the mice to lose their righting reflex before moving to the operating table. Once there, they were positioned supine and maintained with 2% sevoflurane after disinfecting the skin and laying down sheets. An incision measuring 1 cm was made along the longitudinal axis of the right anterior tibial skin, exposing and protecting the muscle tissue and the anterior edge of the tibia. The 27th syringe needle was inserted into the medullary cavity, perpendicular to the tibial plateau and withdrawn halfway. Then, the tibia was cut at the convex apex of the anterior lateral arc before a 25-inch syringe needle was inserted from the original insertion point, descending along the bone marrow cavity to the narrowest point at the distal end. Finally, the skin was intermittently stitched with a four # silk thread, and EMLA cream (2.5% lidocaine and 2.5% procaine) was applied to the incision. After the surgery, the mice were returned to their cages to recover from anesthesia. The control group mice were left in their home cages with room air for one hour, consistent with non-surgery conditions.
-
POD is an acute disruption at several cognitive levels, impacting innate and acquired behaviors.
As part of our study, we conducted two different tests - the buried food test and the open field test - to evaluate any changes in the natural behavior of mice. We also used the Y maze test to assess any changes in their learned behavior. It is important to note that these tests are specifically designed to evaluate behaviors in mice that rely on attention, clear thought, and a normal level of consciousness. These tests could be useful in assessing certain aspects of delirium that are like the Confusion Assessment Method (CAM) features. Therefore, we performed a battery of behavioral tests in the order of buried food test, open field test, and Y maze test 24 h before the surgery (baseline) and at 6, 9, and 24 h after the surgery (Figure 1A) to mimic features of clinical POD diagnosis in patients as previously described[18,23,24]. Six mice were selected randomly from each group to complete the behavioral tests.

Figure 1. Behavioral tests and hippocampus C3/S100beta levels between the Anesthesia/Surgery and Control groups. (A) Diagram of the experimental design. The mice received behavior tests 24 h (baseline) before the surgery (Anesthesia/Surgery), and then at 6, 9, and 24 h after the Anesthesia/Surgery. (B) The buried food test, (C–D) Open field test, and (E–F) Y maze test were compared to baseline (24 h before surgery). The mice who received anesthesia and surgery had higher levels of C3 (G) and S100beta (H) in the hippocampus compared to the control group. Data are presented as the mean ± standard error of the mean (SEM). *P < 0.05 vs. the control group, **P < 0.01 vs. the control group, ****P < 0.0001 vs. the control group. C3: Complement C3, S100beta: S100 calcium-binding protein B protein. C: the control group, AS: the Anesthesia/Surgery group.
We utilised mice’s innate preference for sweet food and conducted a buried food test to evaluate their attention and olfactory sensitivity. Before the test, mice were fed sweetened cereals for two days, and on the test day, they were placed in their home cage in the testing room for over an hour to acclimate to the setting. A piece of sweetened cereal is randomly placed 0.5 cm beneath fresh bedding in a test cage during the test. The mouse was then given 5 minutes to uncover and hold the food pellet. If it failed, the latency period was set at 300 seconds.
In this research, we conducted an open-field test to assess the spontaneous behavioral activity of the two groups. The mice were placed in a 50 cm × 50 cm square grid, and their behavior was recorded for 5 minutes in an open field box using a camera connected to the Any-Maze animal tracking software. We analyzed the data based on time spent and the average speed in the center.
The Y maze is a spatial recognition and memory evaluation tool for rodents. The box features three arms of equal length, positioned at 120-degree angles. The test comprises two stages: training and detection. In the training phase, one of the arms was obstructed, and the mouse was granted ten minutes to explore the maze. After a half-hour interval, the second stage commenced, wherein the blockage in the new arm was removed, and the mouse was placed in the starting component. It was then free to roam for five minutes while its activity was recorded.
-
Mice were administered pilocarpine 0.1 mg/100 g intraperitoneally 24 h after surgery. Saliva was collected by drawing it into an EP tube using a capillary glass tube (Ringcaps; Hirschmann Laborgerate GmbH & Co. KG, Eberstadt, Germany). The samples were then centrifuged at 12,000 rpm for 20 minutes, and the resulting supernatant was transferred to a −80 °C refrigerator. After sacrifice, the hippocampus, cortex, and amygdala were quickly removed on ice and stored at −80 °C for further experiments.
-
Four mice were sacrificed in each group, hippocampal tissues were dissected and analyzed using proteomics. Hippocampal samples were prepared using RIPA lysis buffer, separated using SDS-PAGE, and incubated overnight with primary antibodies (anti-S100Beta: 1:1,000, Rabbit mAb, CST90393; anti-C3: 1:2,000, Rabbit mAb, Abcam97462; anti-α-tubulin: 1:5,000, Rabbit mAb, Abcam52866). Enhanced chemiluminescence was used to detect specific immunoreactivity, and the signal strength was quantified with Image J.
-
Six mice were used to collect saliva and brain regions for metabolomics analysis. Based on previous research[25,26], we utilised UHPLC (1290 Infinity LC, Agilent Technologies) in combination with a quadrupole time-of-flight (AB Sciex TripleTOF 6600) to effectively separate the samples. Then, we employed an ACQUIY UPLC BEH Amide 1.7 µm column for the separation process and set the ESI source conditions to IonSpray Voltage Floating (ISVF) ± 5,500 V. The instrument accurately collected data over the m/z range of 60–1,000 Da in MS-only acquisition and over the m/z range of 25–1,000 Da in-auto MS/MS acquisition, while the product ion scan was obtained using information-dependent acquisition (IDA). To achieve consistent results, the collision energy (CE) was fixed at 35 V with ± 15 eV, and the Declustering potential (DP) was set at 60 V (+) and −60 V (−).
-
Behavioral and proteomic data that follow normal distribution was presented as mean (SD), and we used a t-test of two independent samples to compare between groups. For non-normal distribution data, we presented it as median and quartile and used the rank-sum test of two independent samples to compare between groups. The metabolomics data was first normalized and then analyzed using the R package (R version 3.6.3, AT&T BellLaboratories, New Zealand). The PCA plot was created using the scatterplot3d package. Figure of differential metabolites results, and the Volcano plot were generated using the ggplot2 package. The Complex Heatmap R package was utilized to draw the heatmap, which was then visualized based on ggplot2. Additionally, the KEGG pathway enrichment analysis was conducted using the MBROLE version. This involved conducting Pareto-scaled PCA and OPLS-DA. A 7-fold cross-validation and response permutation testing was performed to ensure the model’s accuracy. The contribution of each variable to the classification was calculated by determining the VIP value of each variable in the OPLS-DA model. Metabolites with a VIP value greater than one and a P-value less than 0.05 were identified as significant. Person’s correlation analysis was conducted to determine the correlation between two variables.
-
A battery of behavioral tests was used to evaluate the postoperative delirium induced by anesthesia and surgery in older mice. The natural behavior of mice can be studied by the open fields test and the buried food test. Figure 1B showed that mice in the Anesthesia/Surgery group took more time to search for food at 6 h and 9 h after surgery as compared to the Control group [34.19 (38.92) vs. 156.5 (100.8), P = 0.004] and [56.62 (23.31) vs. 480.2 (153.1), P = 0.020, respectively].
To evaluate the motor function of mice, we conducted an open-field test. Our study found that there was no significant difference in motor speed between the two groups in the central region at 6 h, 9 h, and 24 h after surgery [93.35 (43.17) vs. 49.56 (33.76), P = 0.180; 77.45 (81.65) vs. 61.50 (32.6), P = 0.394; 162.8 vs. 62.08 (106.27), P = 0.132, respectively, as shown in Figure 1C]. In terms of time spent in the center, there were no significant changes observed between the surgical group and the control group [6 h: 32.95 (45.03) vs. 23.58 (43.8), P = 0.937; 9 h: 73.57 (133.4) vs. 33.07 (40.9), P = 0.180; 24 h: 16.29 (20.13) vs. 8.926 (27.0), P = 0.937, as shown in Figure 1D]. In conclusion, our results suggest that anesthesia and surgery do not affect the motor function of mice.
Finally, we conducted a Y maze test to evaluate the hippocampus-dependent spatial learning of mice after surgery. The results showed that the number of entries of the new arm in the Anesthesia/Surgery group decreased compared to the Control group at 6 h after the surgery [4.5 (3.5) vs. 1.0 (1.0), P = 0.002, Figure 1E]. However, there was no significant difference between the two groups at 9 h after surgery [2.5 (2.25) vs. 1.5 (2.5), P = 0.316] and 24 h after surgery [1.5 (2.5) vs. 1 (1.5), P = 0.188]. The duration in the new arm of the mice in the Anesthesia/Surgery group was lower than that of the Control group at 6 h [185.6 (155.9) vs. 52.01 (68.2), P = 0.041], 9 h [177.6 (65.9) vs. 53.4 (20.6), P = 0.001], and 24 h [162.5 (23.13) vs. 27.78 (23.8), P < 0.001] after surgery (Figure 1F). These findings suggested that the recovery of learning and memory abilities in mice depends on the time after surgery.
-
The C3 and S100beta levels at 24 h postoperatively in the hippocampus showed a significant increase in the Anesthesia/Surgery group compared to the control group [C3: 0.236 (0.515) vs. 0.154 (0.115), P = 0.002; S100beta: 0.614 (0.233) vs. 0.308 (0.136), P = 0.004,] as illustrated in Figure 1G and 1H, respectively.
-
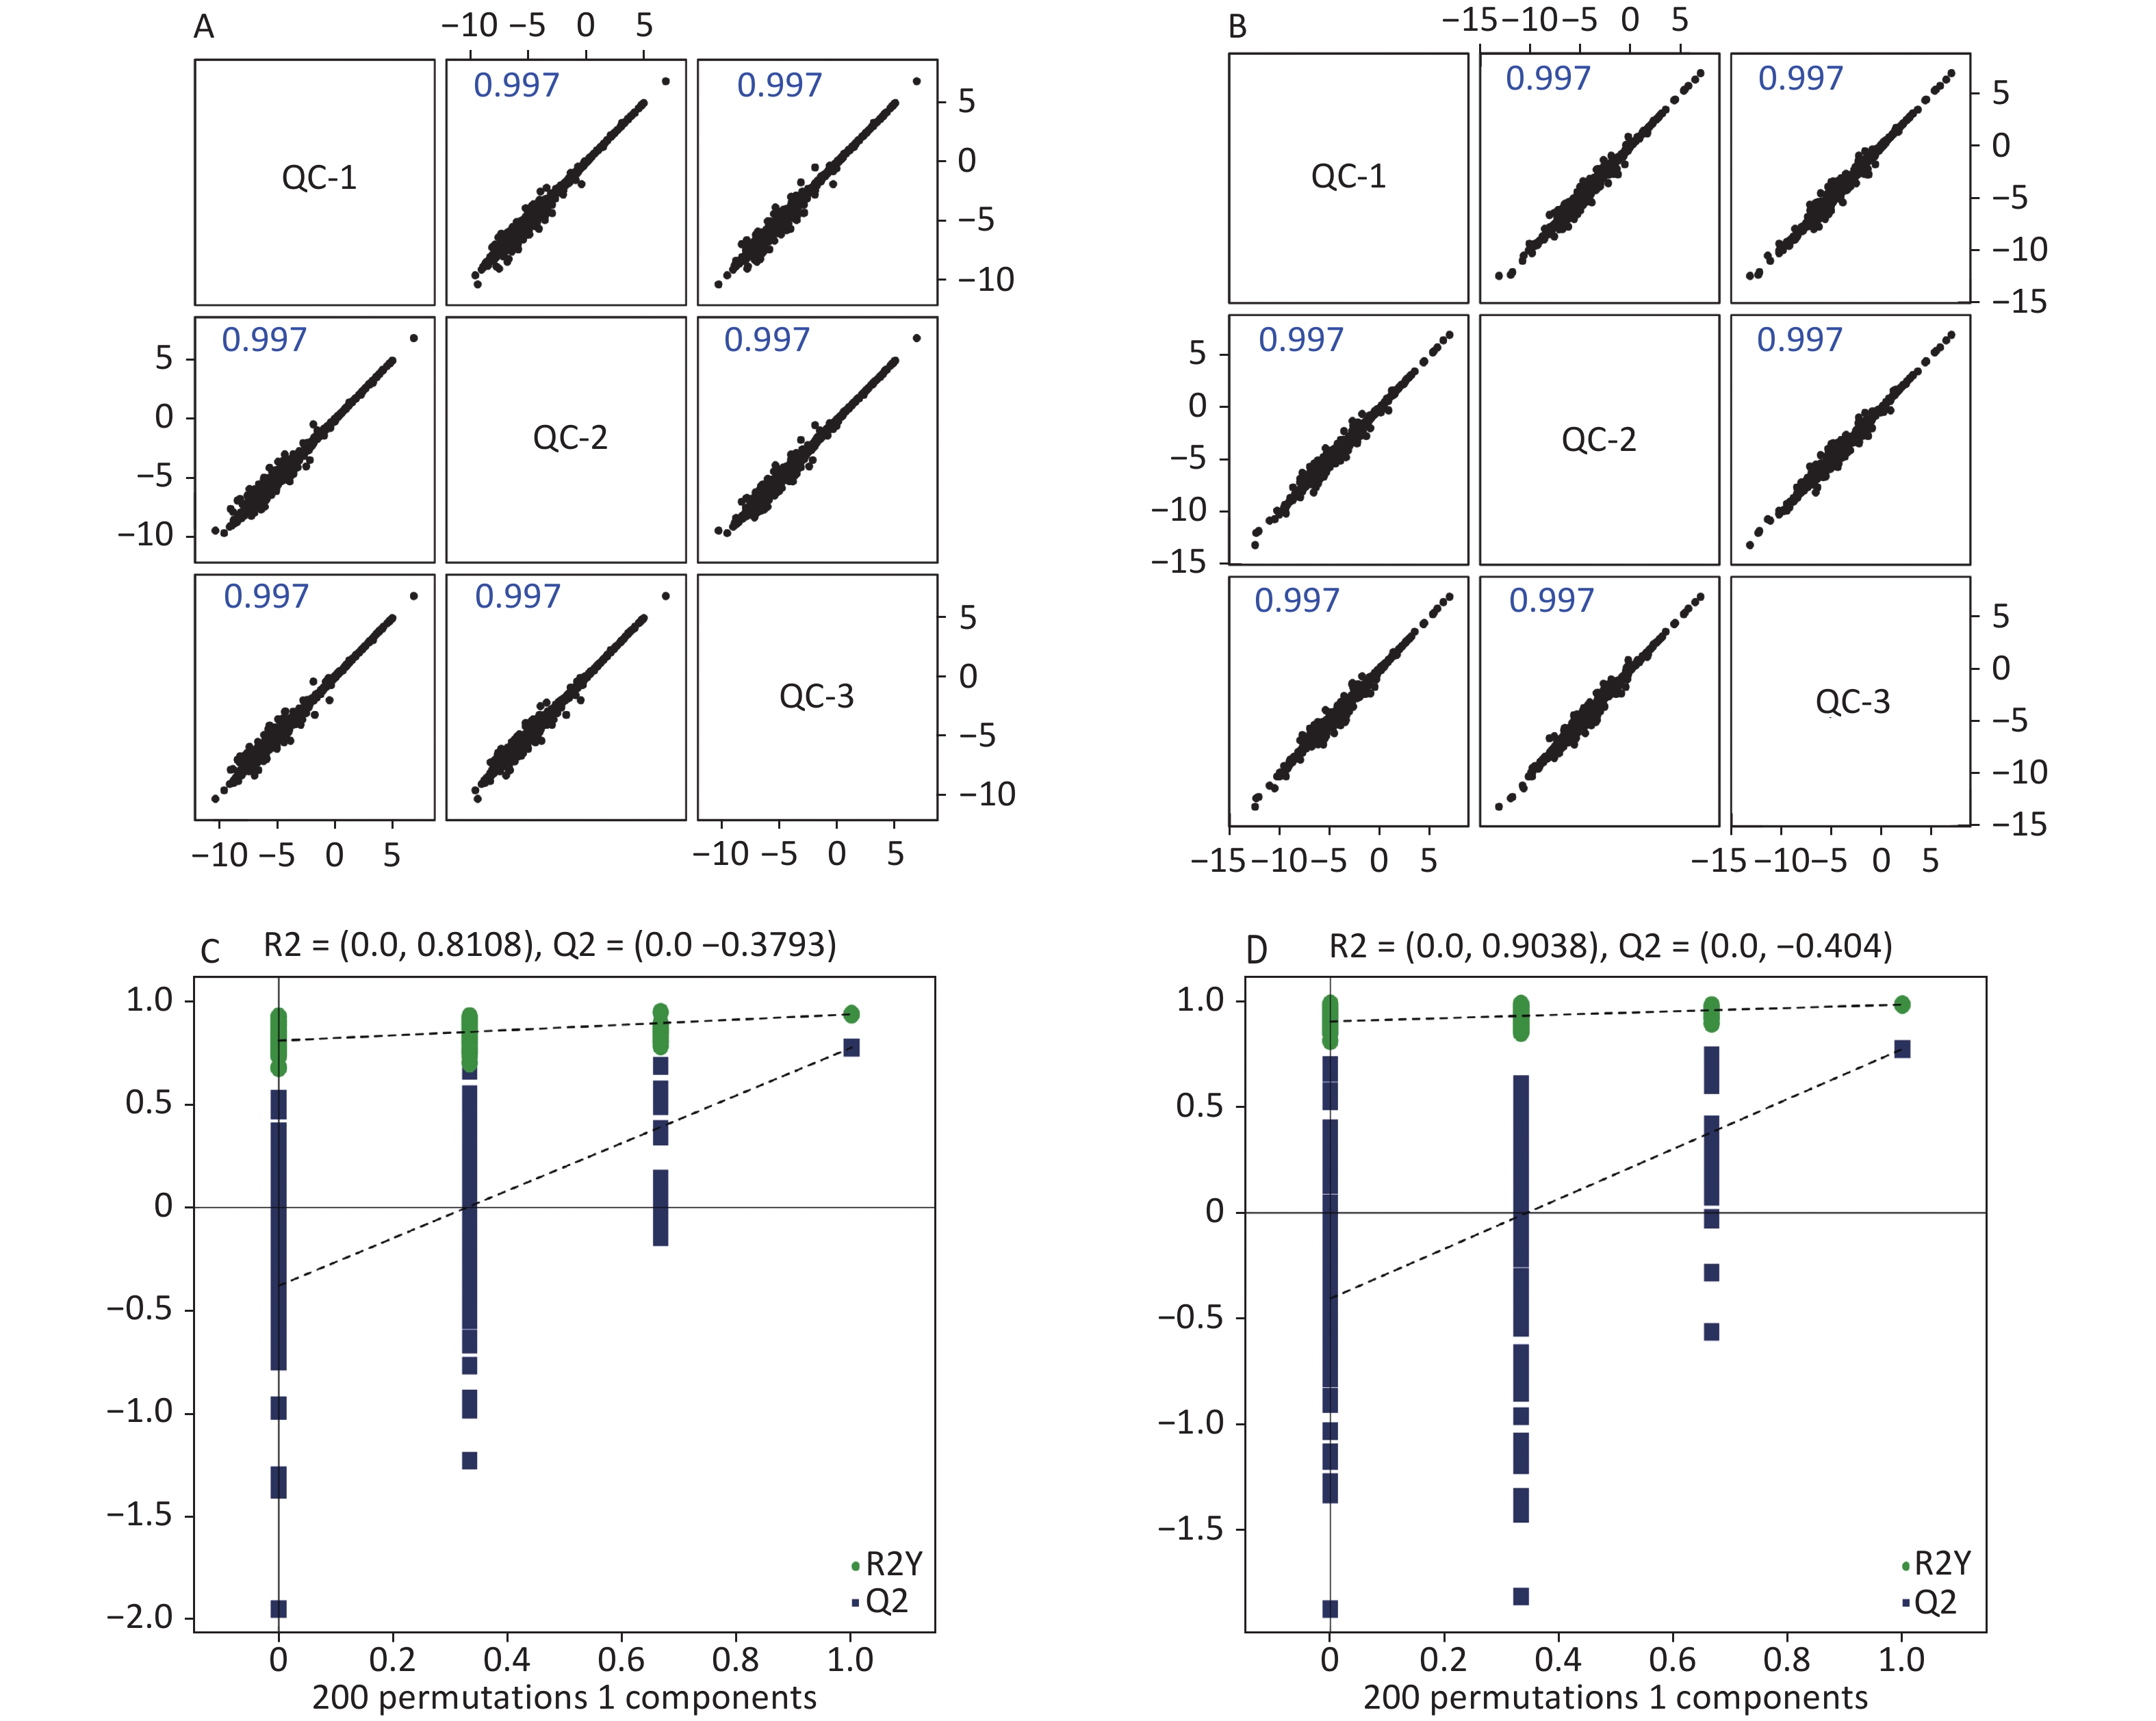
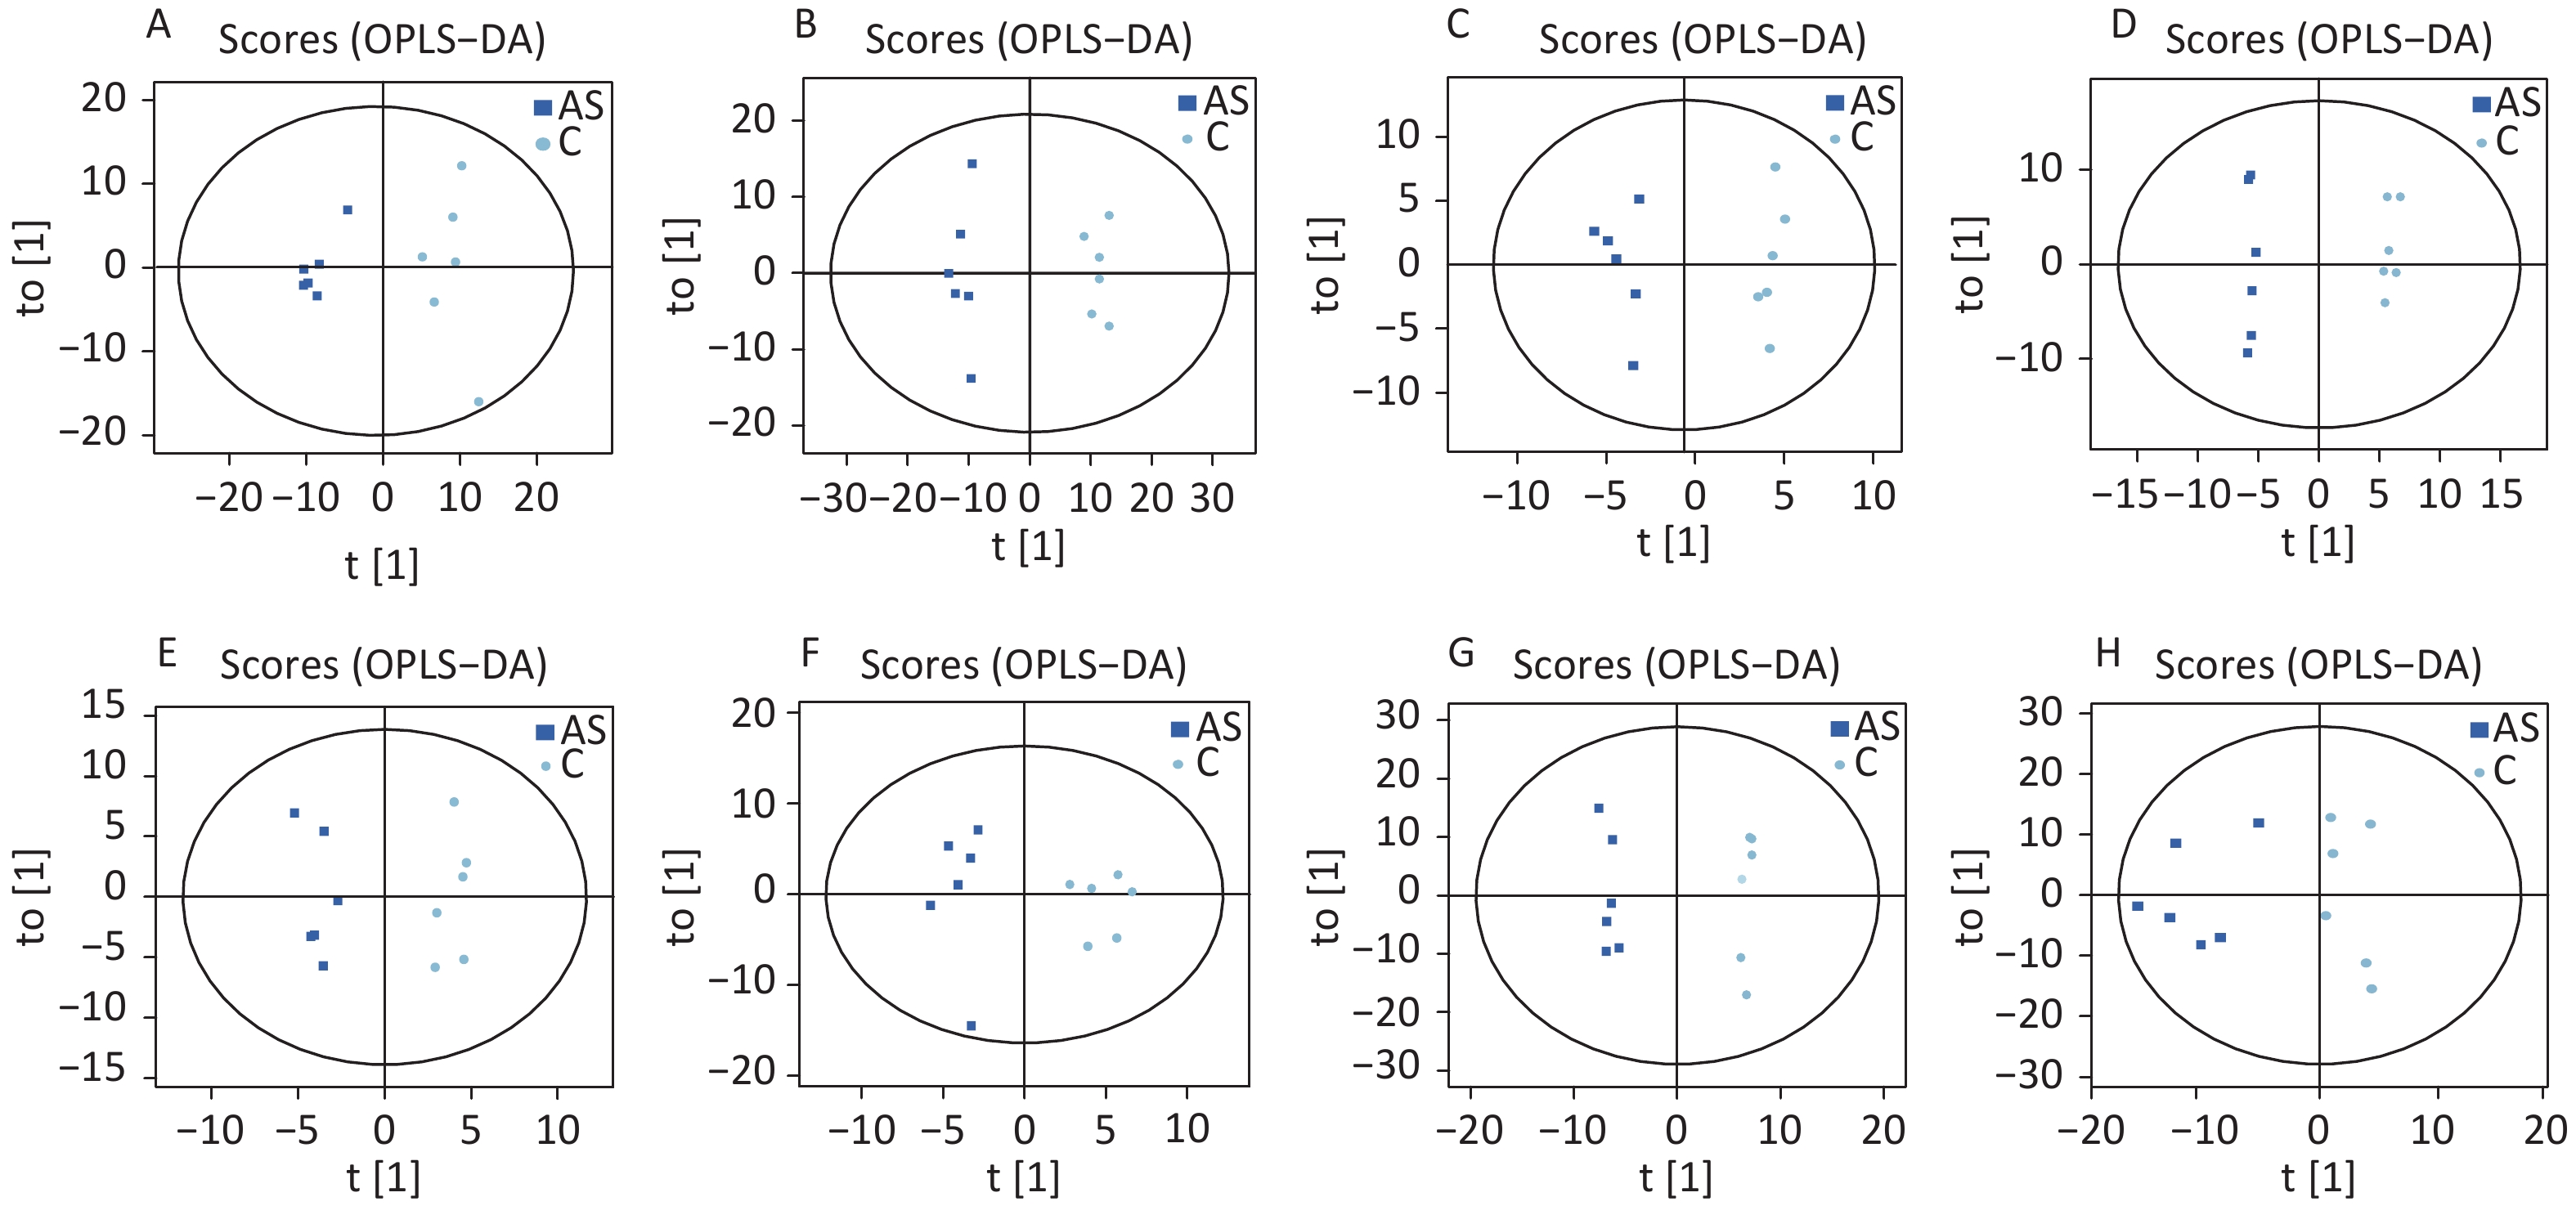
High-quality experimental data is crucial for reliable results. We conducted a Person correlation analysis on the quality control samples in the positive (Figure 2A) and negative (Figure 2B) ion modes of saliva samples. To avoid overfitting in the modeling process, we conducted a Permutation test, demonstrating that the model did not have any fitting phenomenon and had good robustness (Figure 2C–D). All the correlation coefficients of the quality control samples were above 0.9, indicating high experimental repeatability. OPLS-DA score plots were utilised to distinguish between metabolites in all samples.The quality control of experimental data of hippocampus, cortex and amygdala can be seen in Supplementary Figure S1, available in www.besjournal.com. Figure 3 shows a significant separation of the two groups in positive and negative ion modes. Similarly, Q2 (positive-ion mode, 0.777 and negative-ion mode, 0.774) indicated the stability and reliability of the model.
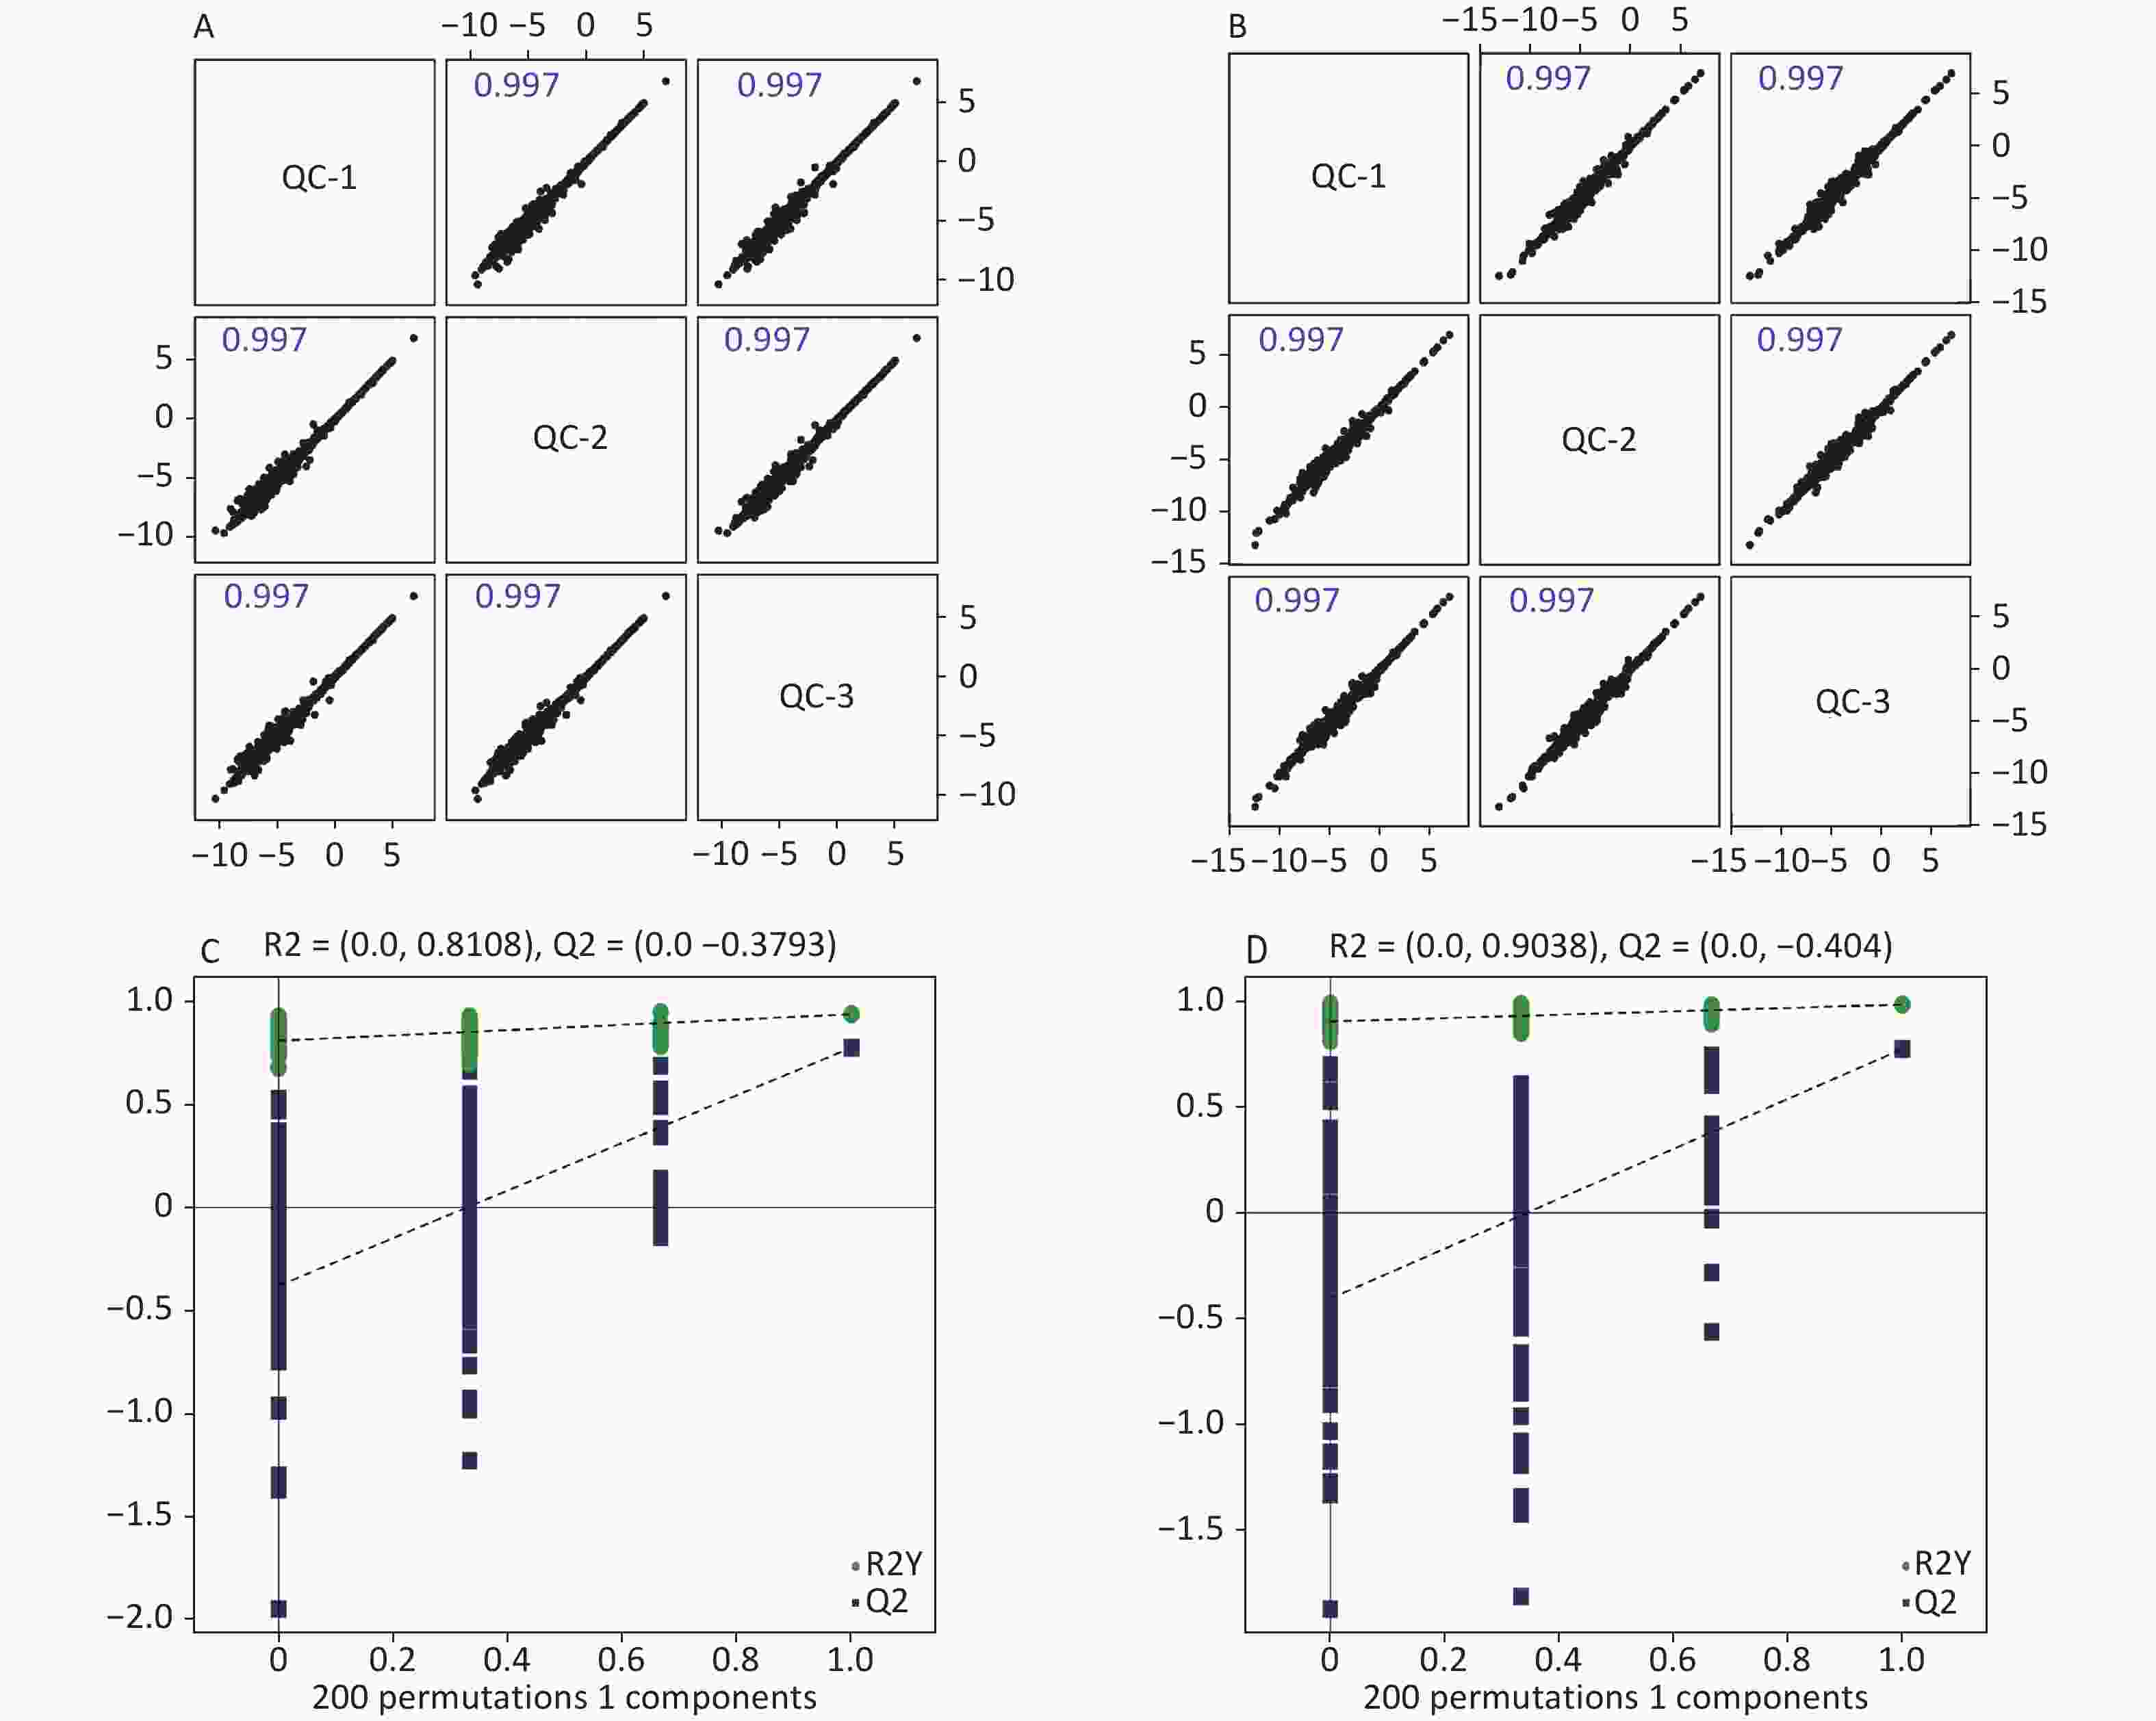
Figure 2. Quality control of experimental data (saliva sample). Person correlation analysis on the quality control samples in the positive (A) and negative (B) modes. Permutation tests between the two groups in the positive mode (C) and the negative mode (D).
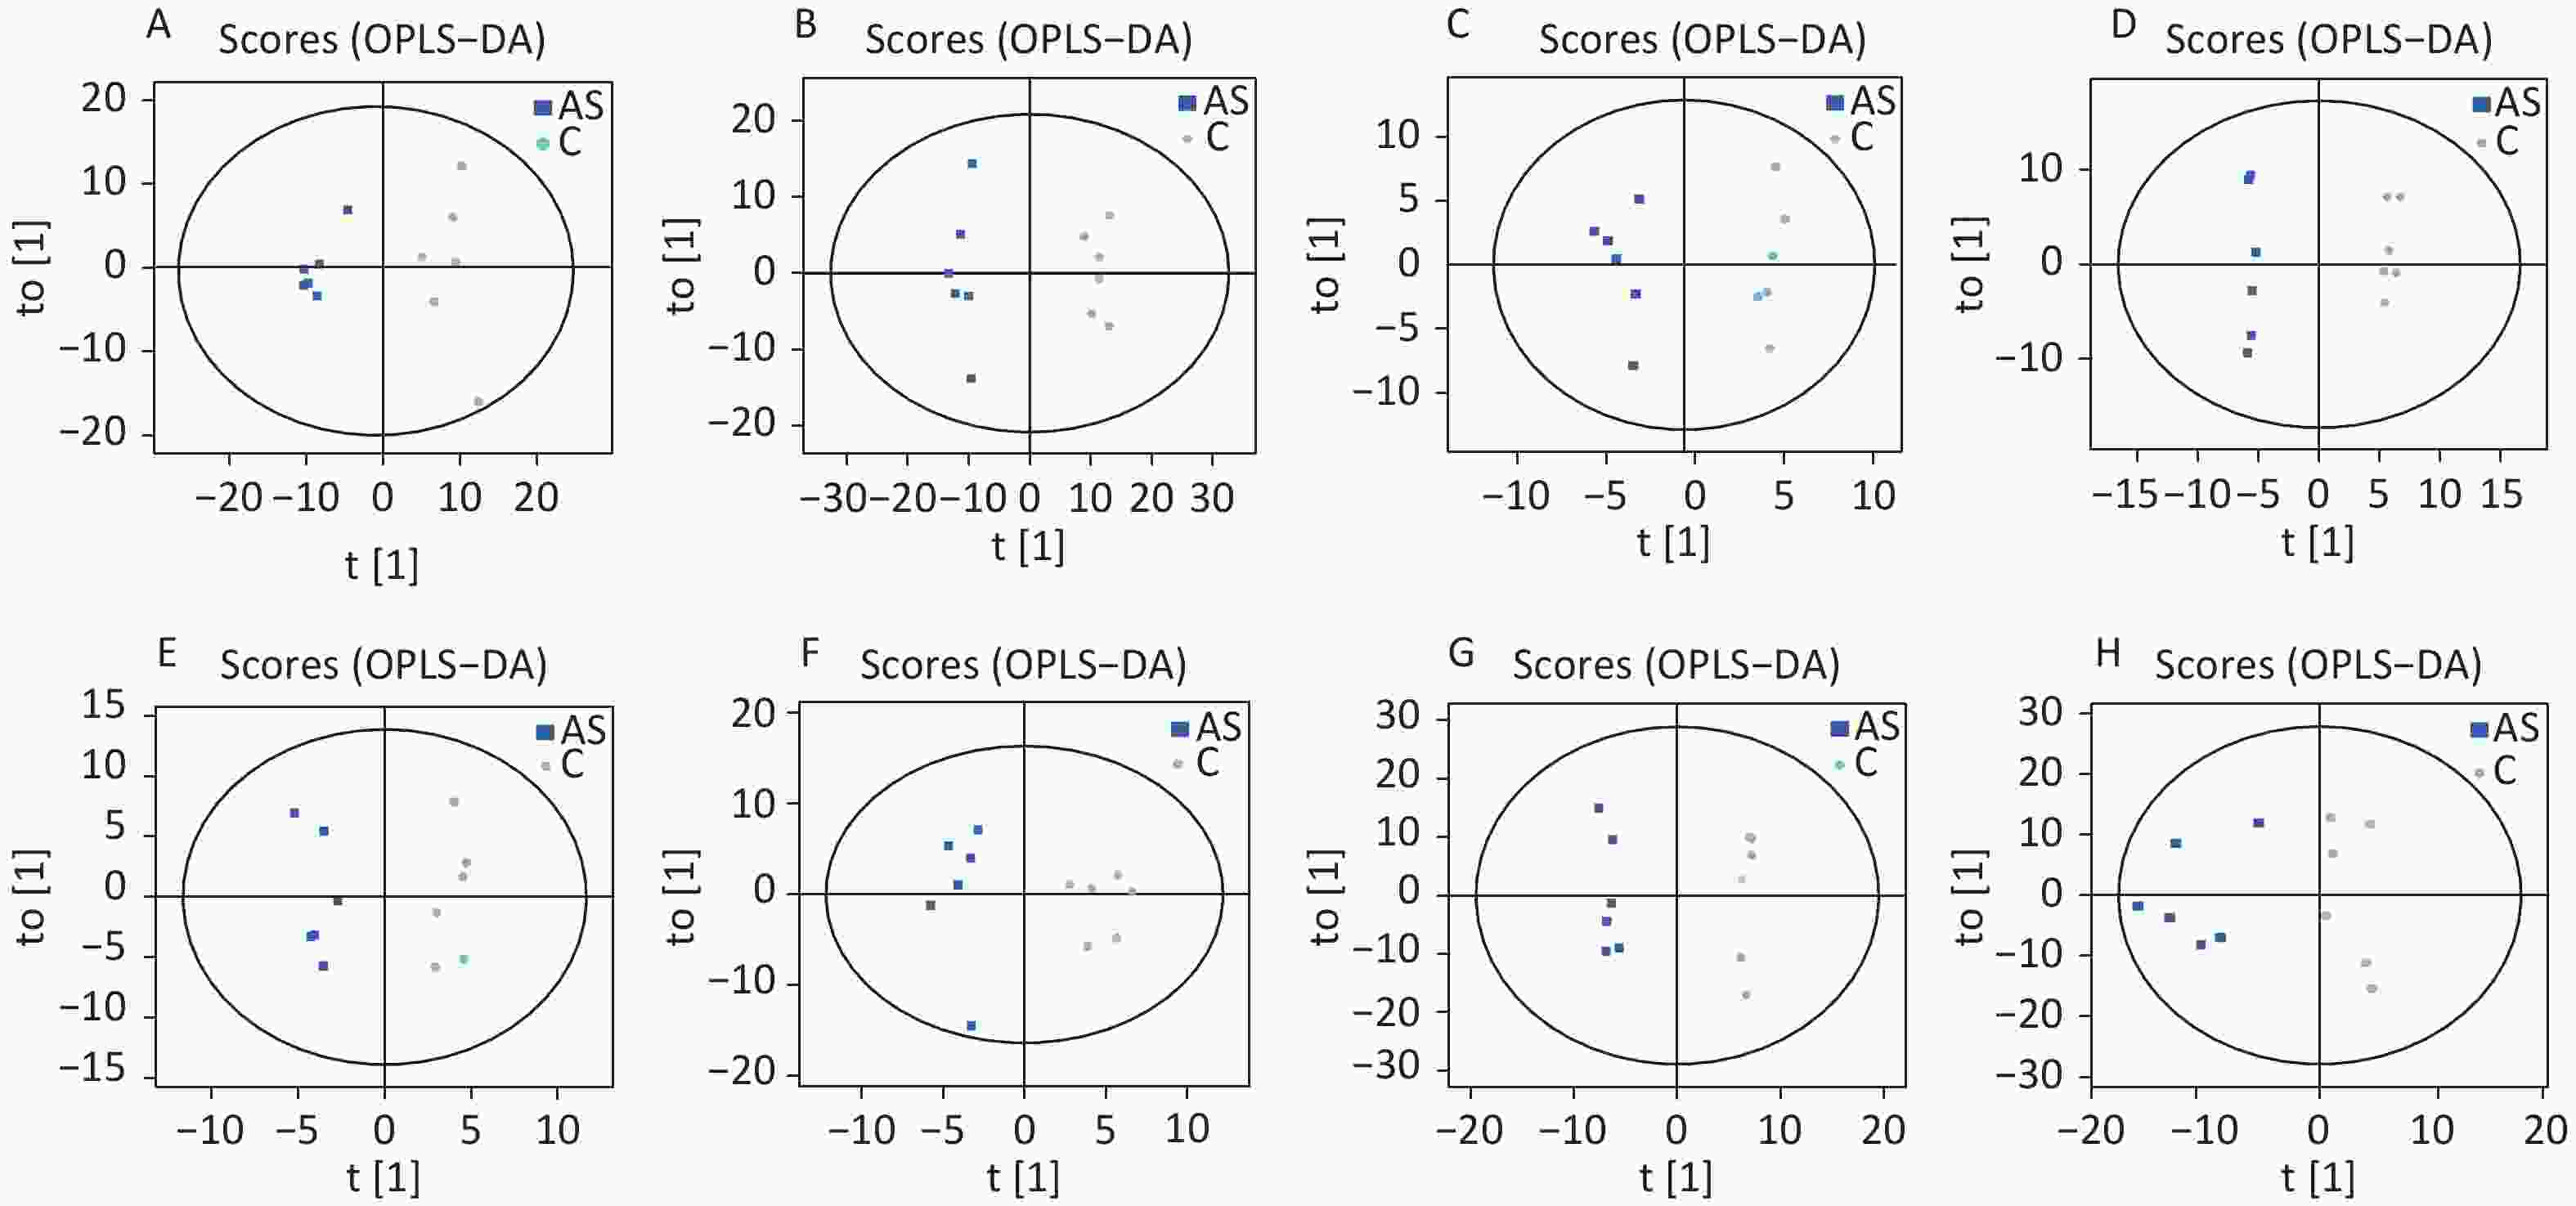
Figure 3. The OPLS-DA score plots were demonstrated as saliva (A) (the positive ion mode) and (B) (the negative ion mode), hippocampus (C) (the positive ion mode) and (D) (the negative ion mode), cortex (E) (the positive ion mode) and (F) (the negative ion mode), amygdala (G) (the positive ion mode) and (H) (the negative ion mode) between the two groups. C: the control group, AS: the Anesthesia/Surgery group.
Metabolomics techniques were utilised to identify metabolites in delirium models from samples such as saliva, hippocampus, cortex, and amygdala. In saliva, a total of 638 metabolites (429 features in positive mode and 209 elements in negative mode) were detected. In the hippocampus, 1,023 metabolites were detected (672 in positive mode and 351 in negative mode). Similarly, 1,370 metabolites (868 in positive mode and 502 in negative mode) were identified in cortex tissue. Furthermore, in amygdala tissue, a total of 1,558 metabolites (944 in positive mode and 614 in negative mode) were detected. The classification of metabolites in these four samples is shown in Table 1.
Metabolites (superclass) NO. of identified metabolites Saliva Hippocampus Cortex Amygdala Lipids and lipid−like molecules 153 225 347 363 Organic acids and derivatives 173 254 315 320 Organoheterocyclic compounds 68 101 133 203 Benzenoids 56 84 96 197 Organic oxygen compounds 45 84 114 130 Phenylpropanoids and polyketides 24 43 57 86 Nucleosides nucleotides and analogues 14 61 71 63 Organic nitrogen compounds 26 29 39 53 Alkaloids and derivatives 2 3 5 7 Lignans, neolignans and related compounds 3 2 1 6 Organosulfur compounds − − 1 5 Homogeneous non−metal compounds − − − 3 Organoheterocyclic compounds − − 1 1 Organometallic compounds 2 1 4 1 Organic 1,3−dipolar compounds − 1 − − Hydrocarbon derivatives − − 1 − Table 1. Classification and quantity of differential metabolites screened
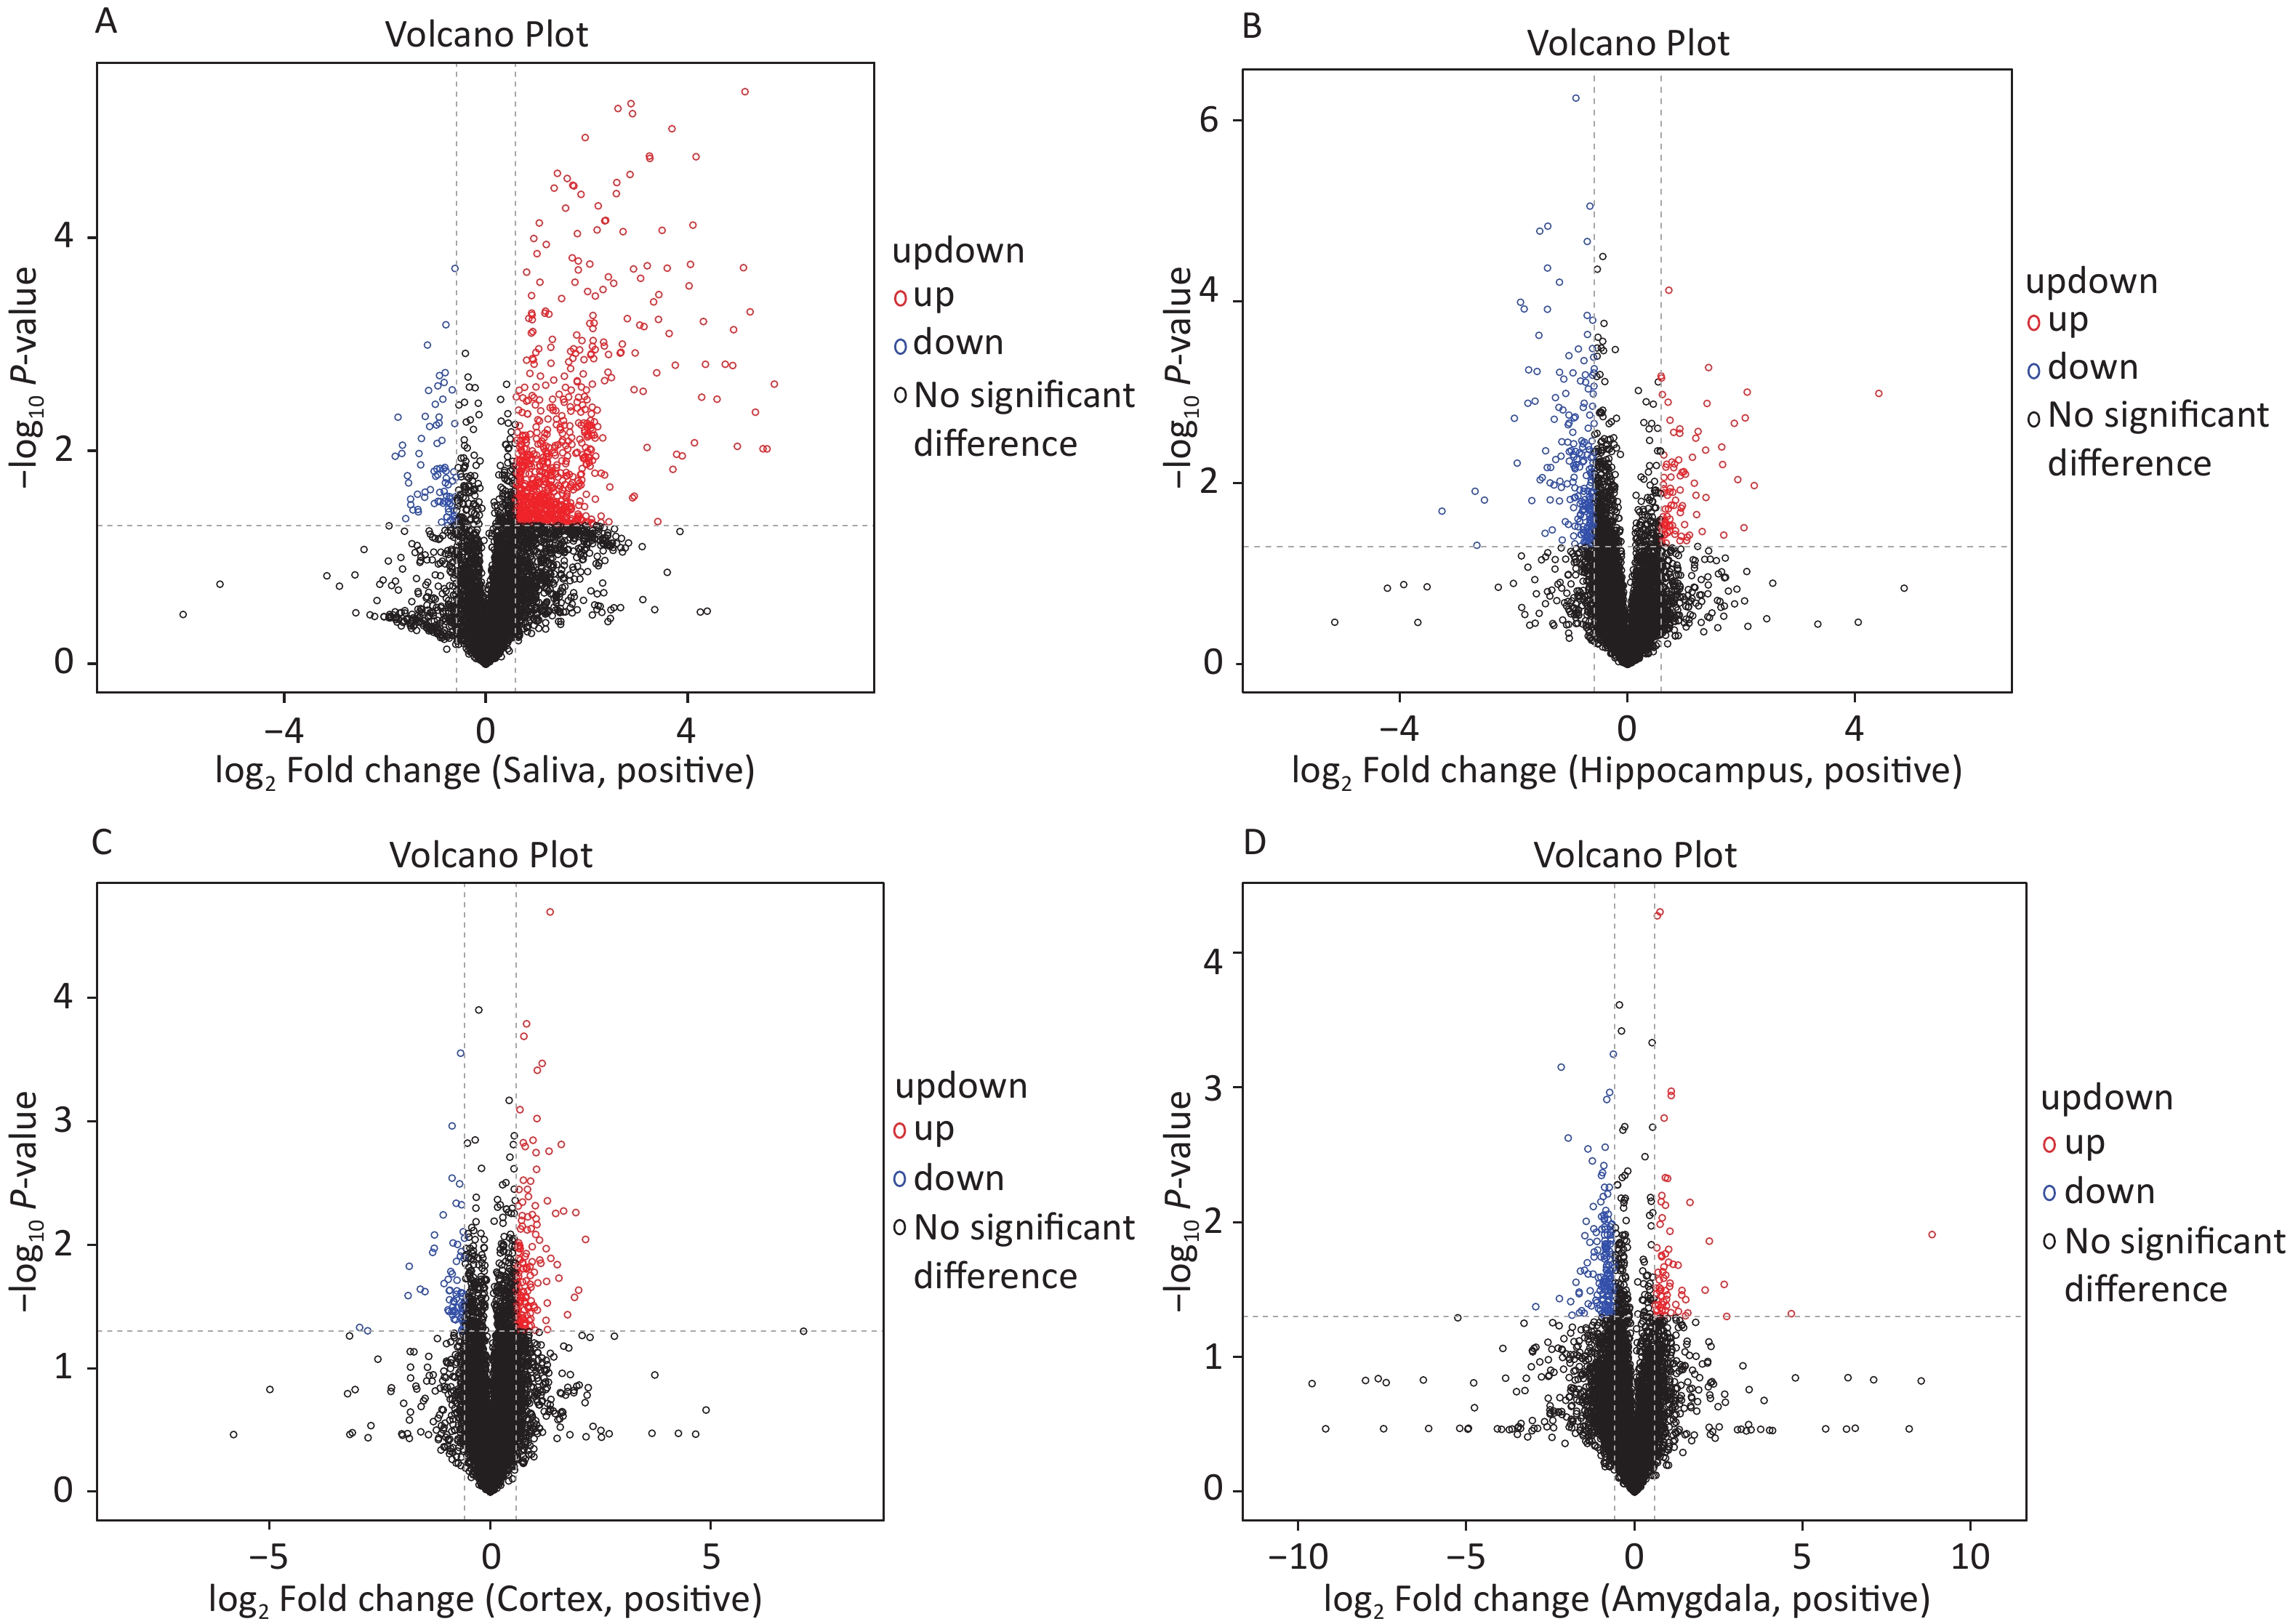
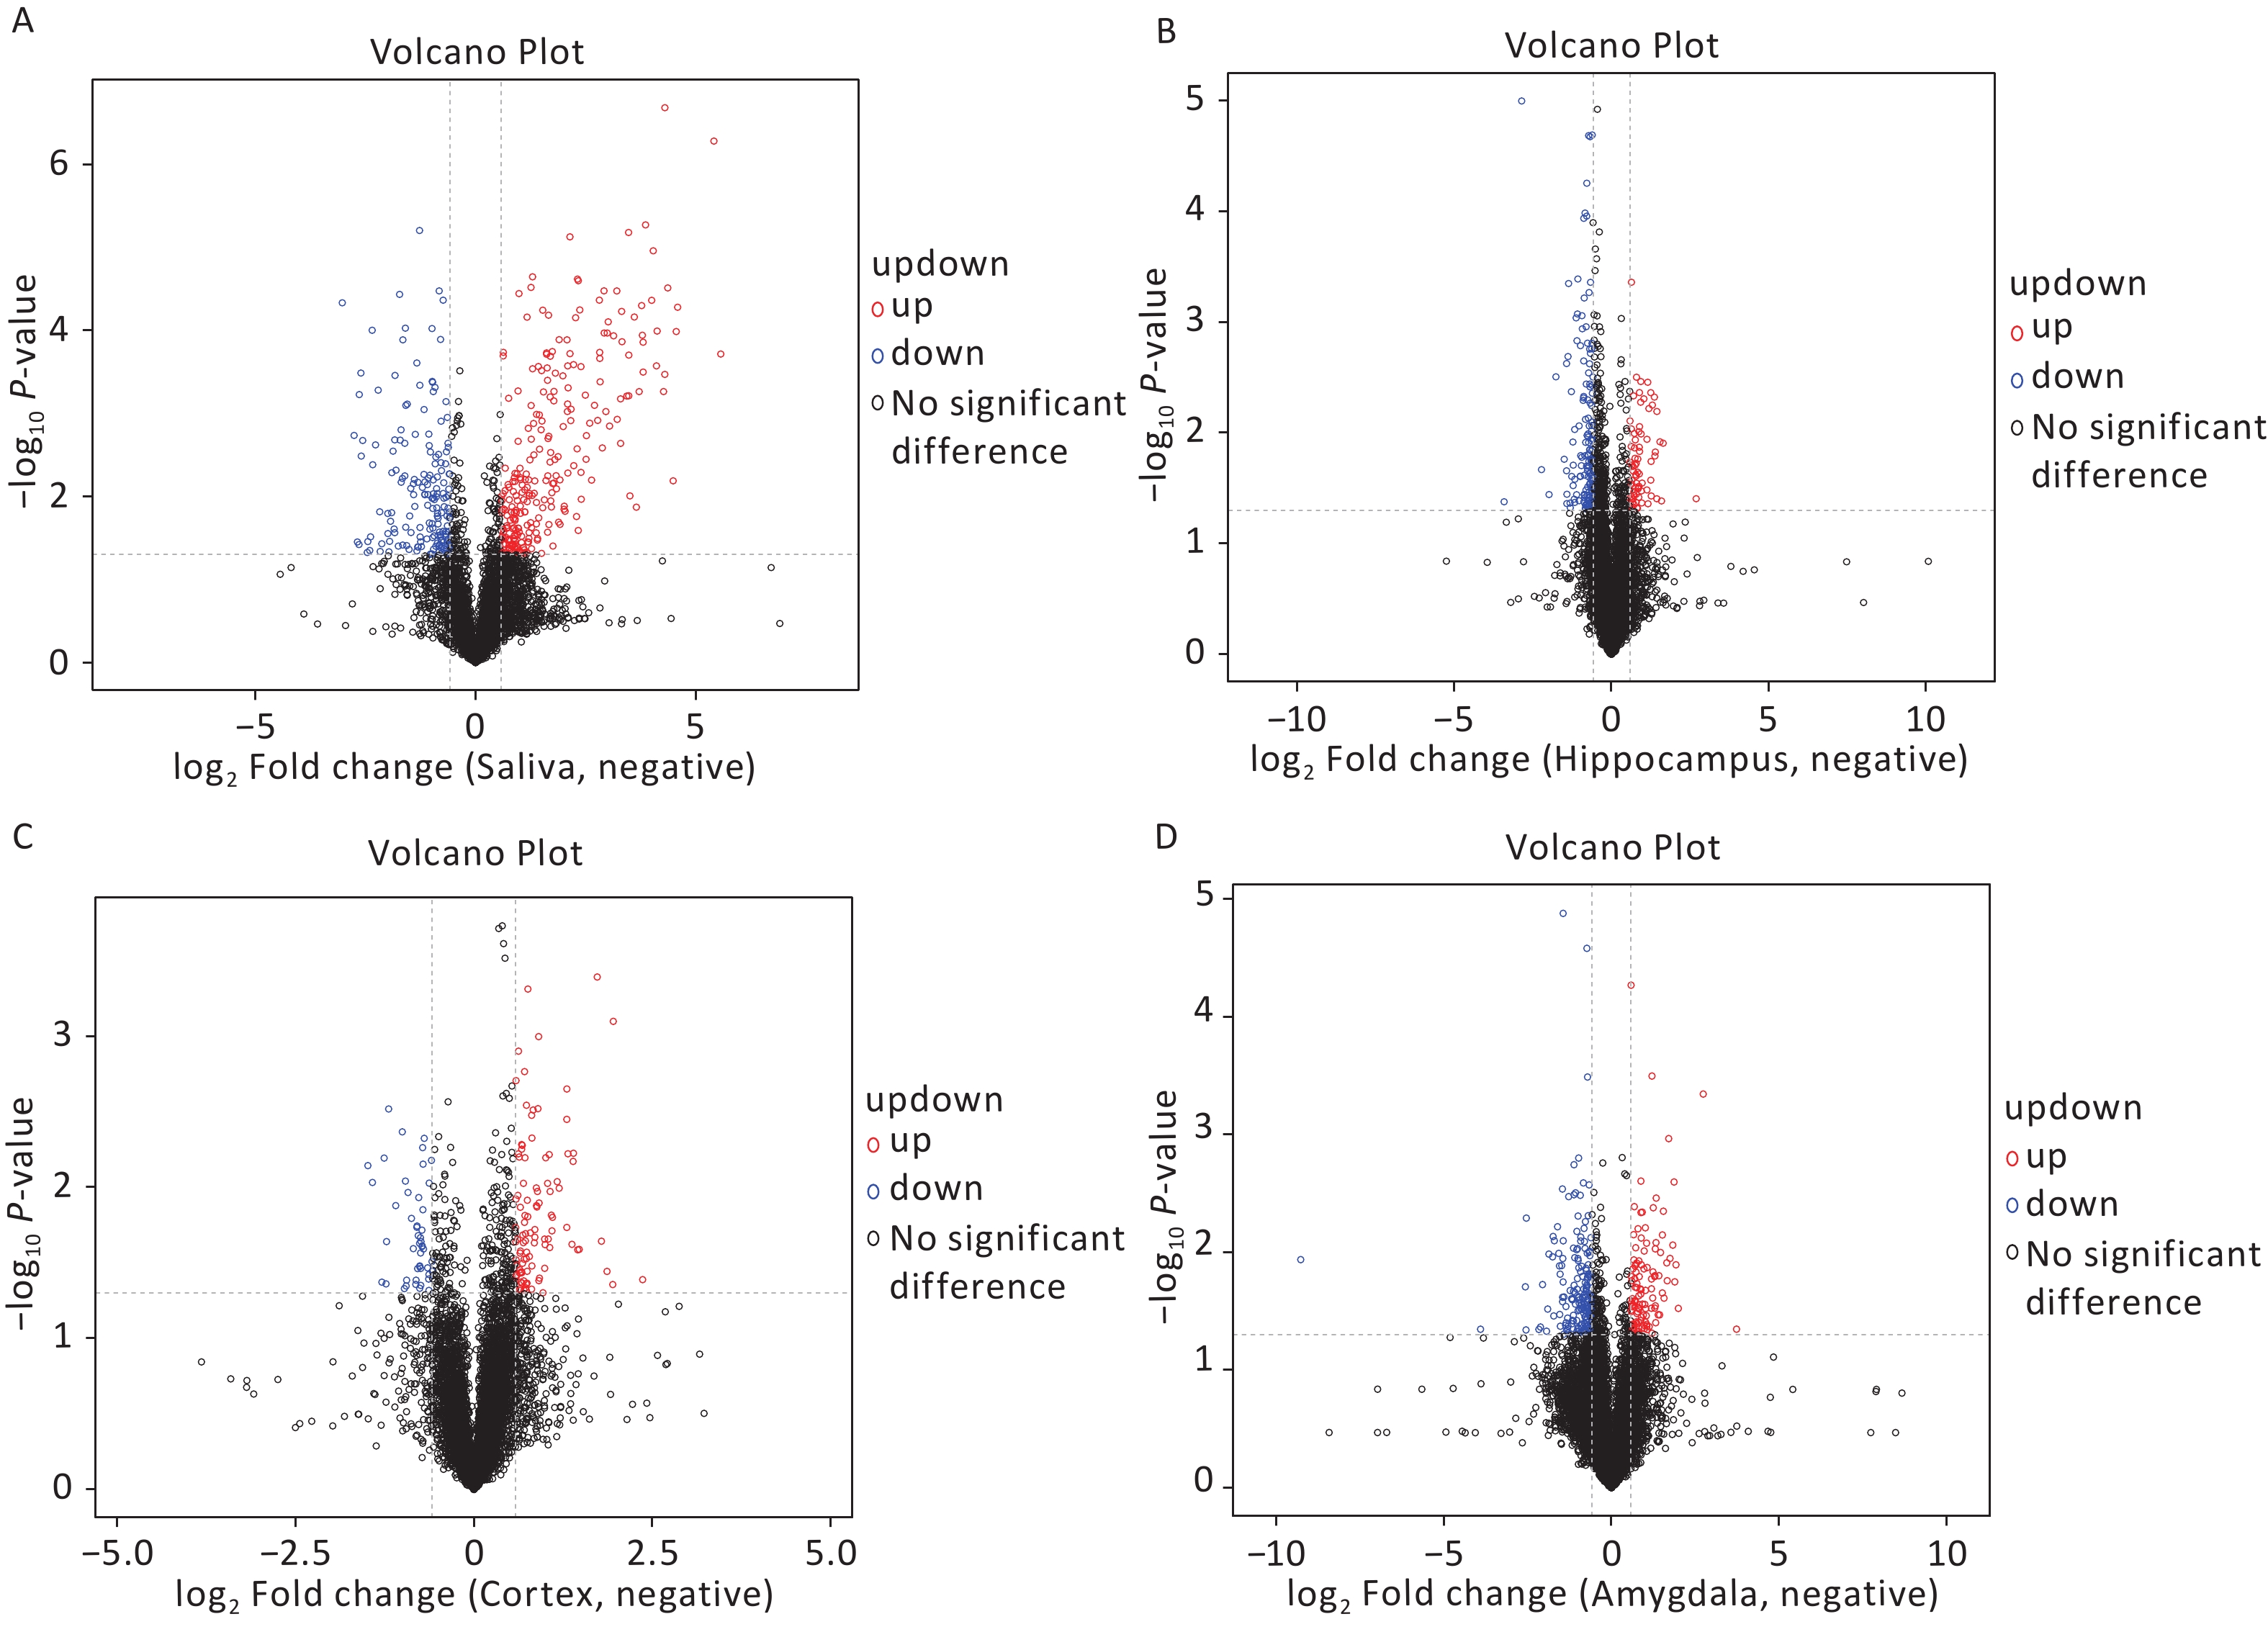
The OPLS-DA analysis is a multivariate statistical analysis method that can significantly identify metabolite differences while eliminating irrelevant factors. We utilised this method to compare the surgical and the control group. The model’s predictive ability, measured by Q2, was higher than 0.7 for all comparison groups, indicating reliability. The OPLS-DA score charts separated the surgical and the control groups (Figure 3). Figure 4 presented volcano plots of metabolites in positive mode. Red circles indicate upregulated metabolites, while blue circles indicate downregulated metabolites. The volcanic plots in the negative mode are shown in Supplementary Figure S2, available in www.besjournal.com.
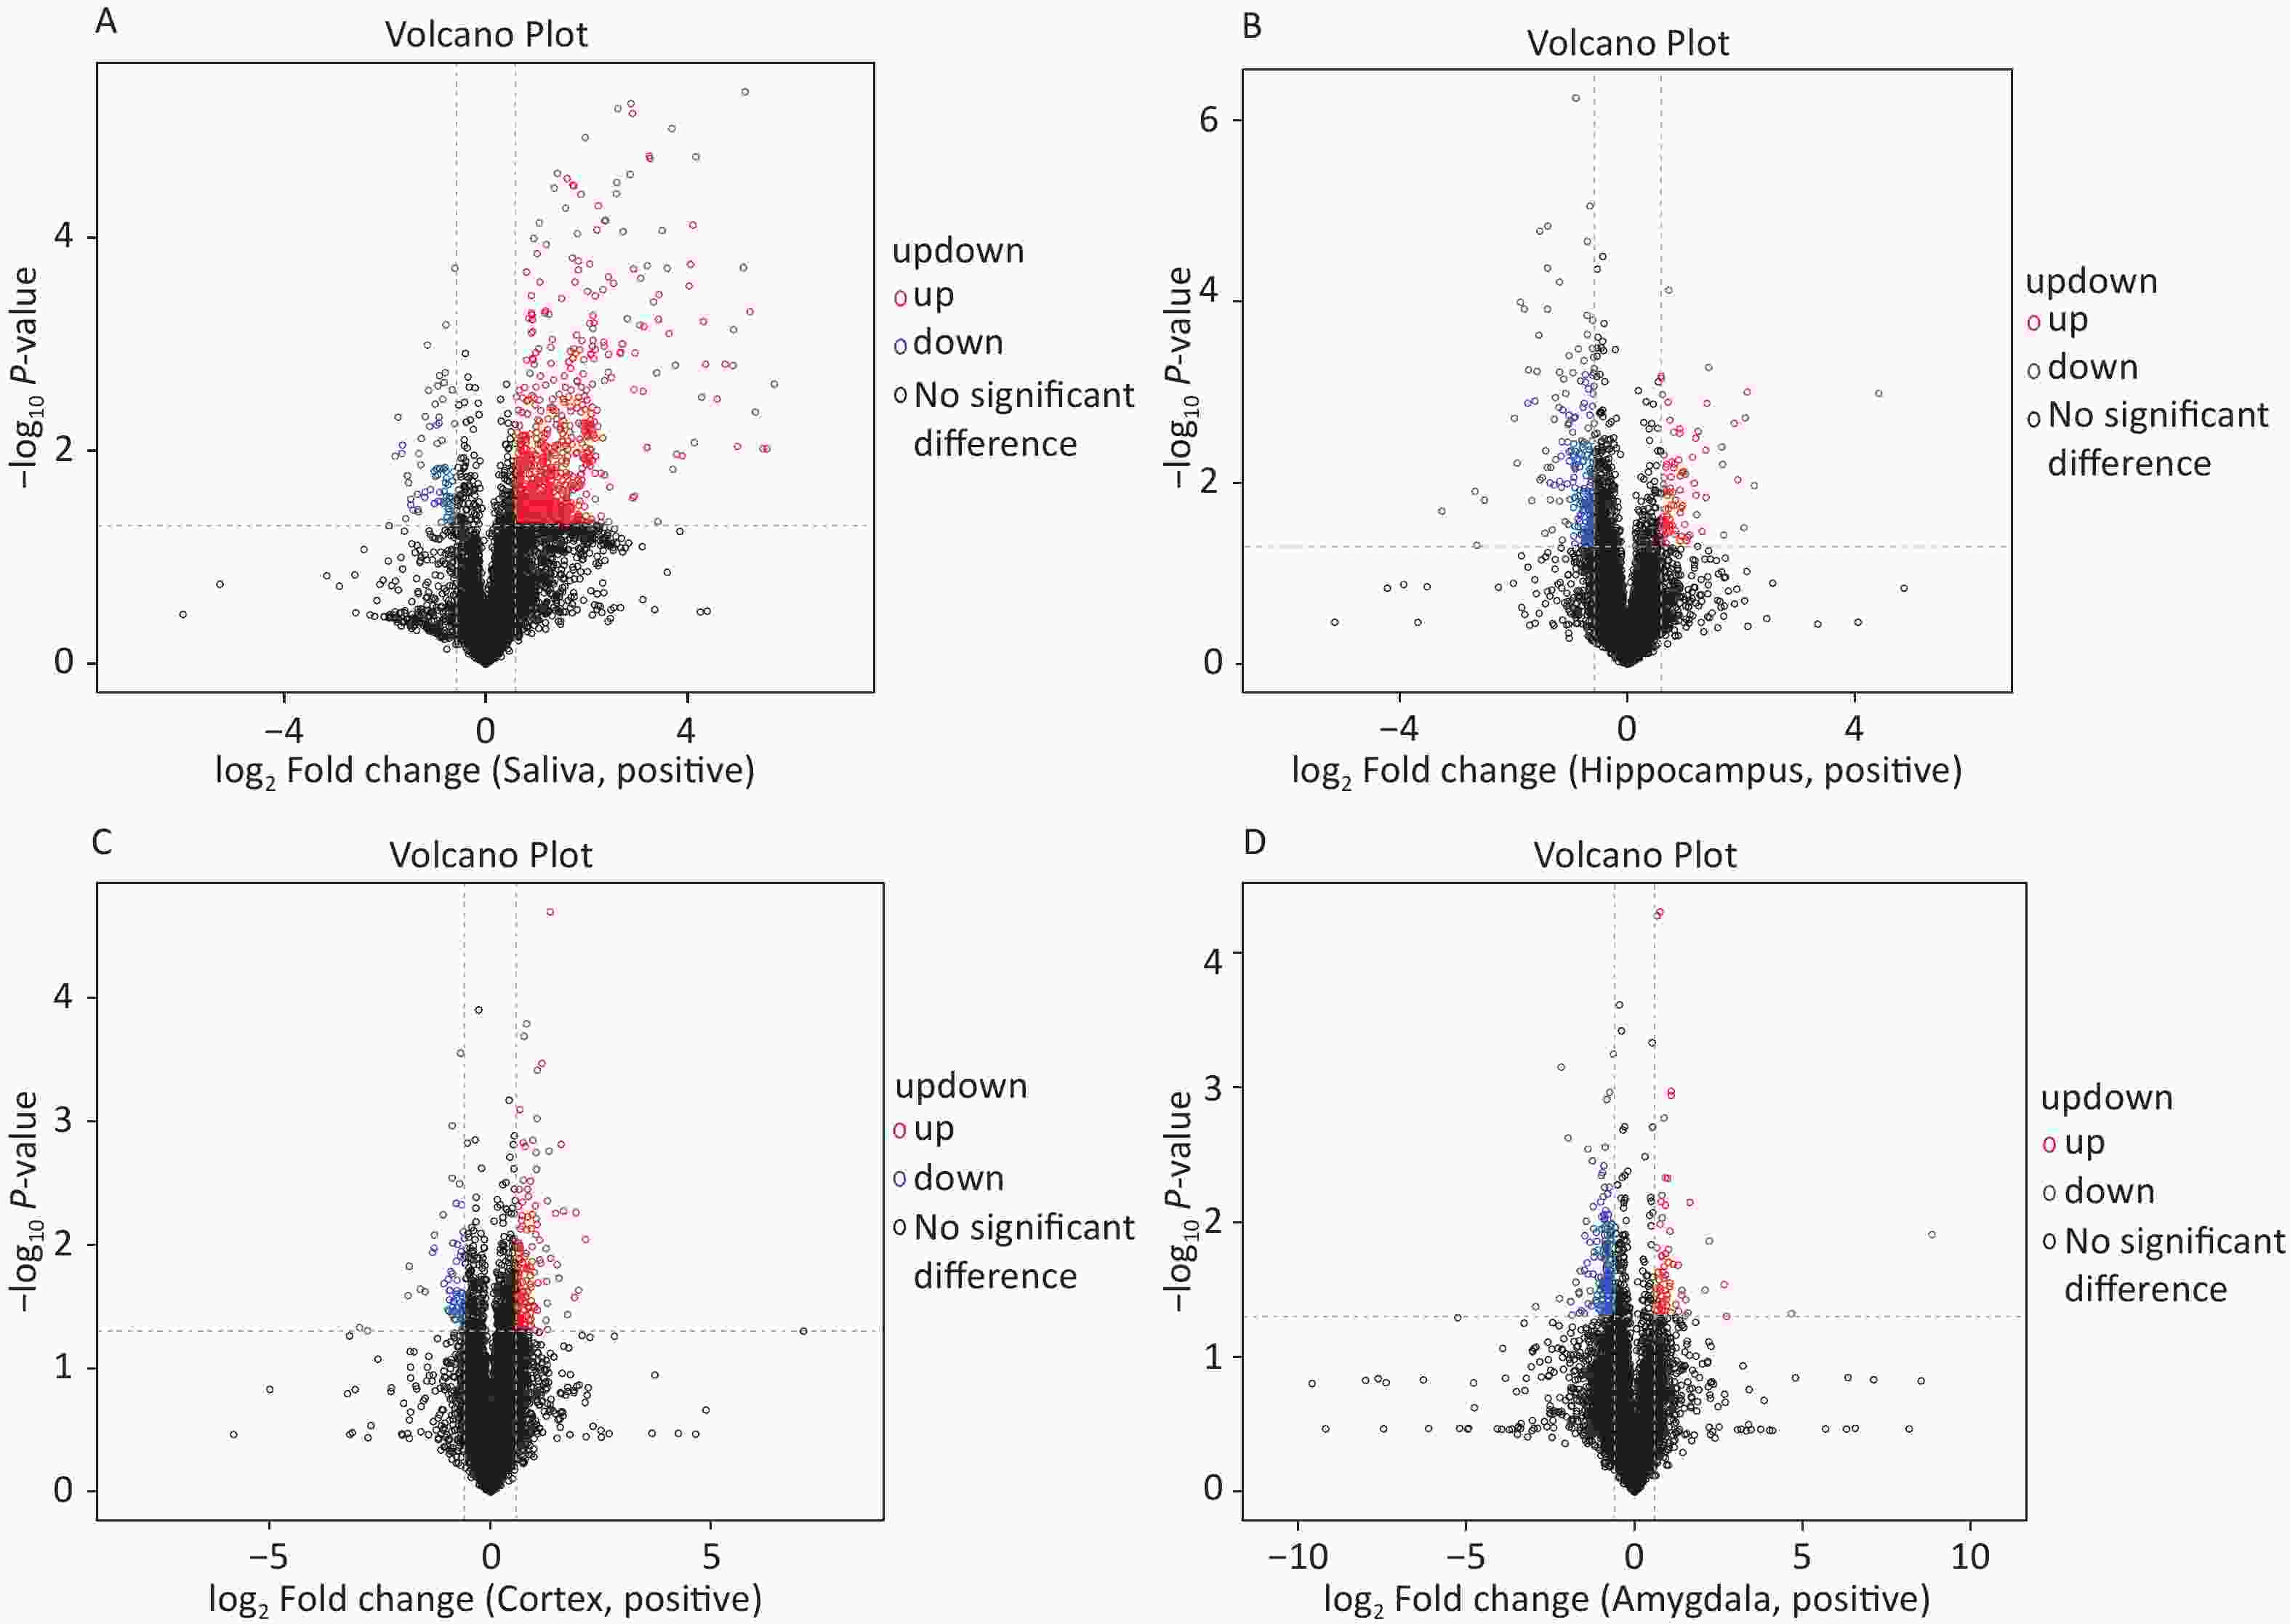
Figure 4. Based on univariate analysis, the volcanic plots present differential (A) saliva, (B) hippocampus, (C) cortex, and (D) amygdala metabolites with the criteria of FC > 1.5 or FC < 0.67, P-value < 0.05 in positive mode of the two groups. As shown in the volcano plots, the upregulated and downregulated features were marked as red and blue, respectively. FC, fold change.
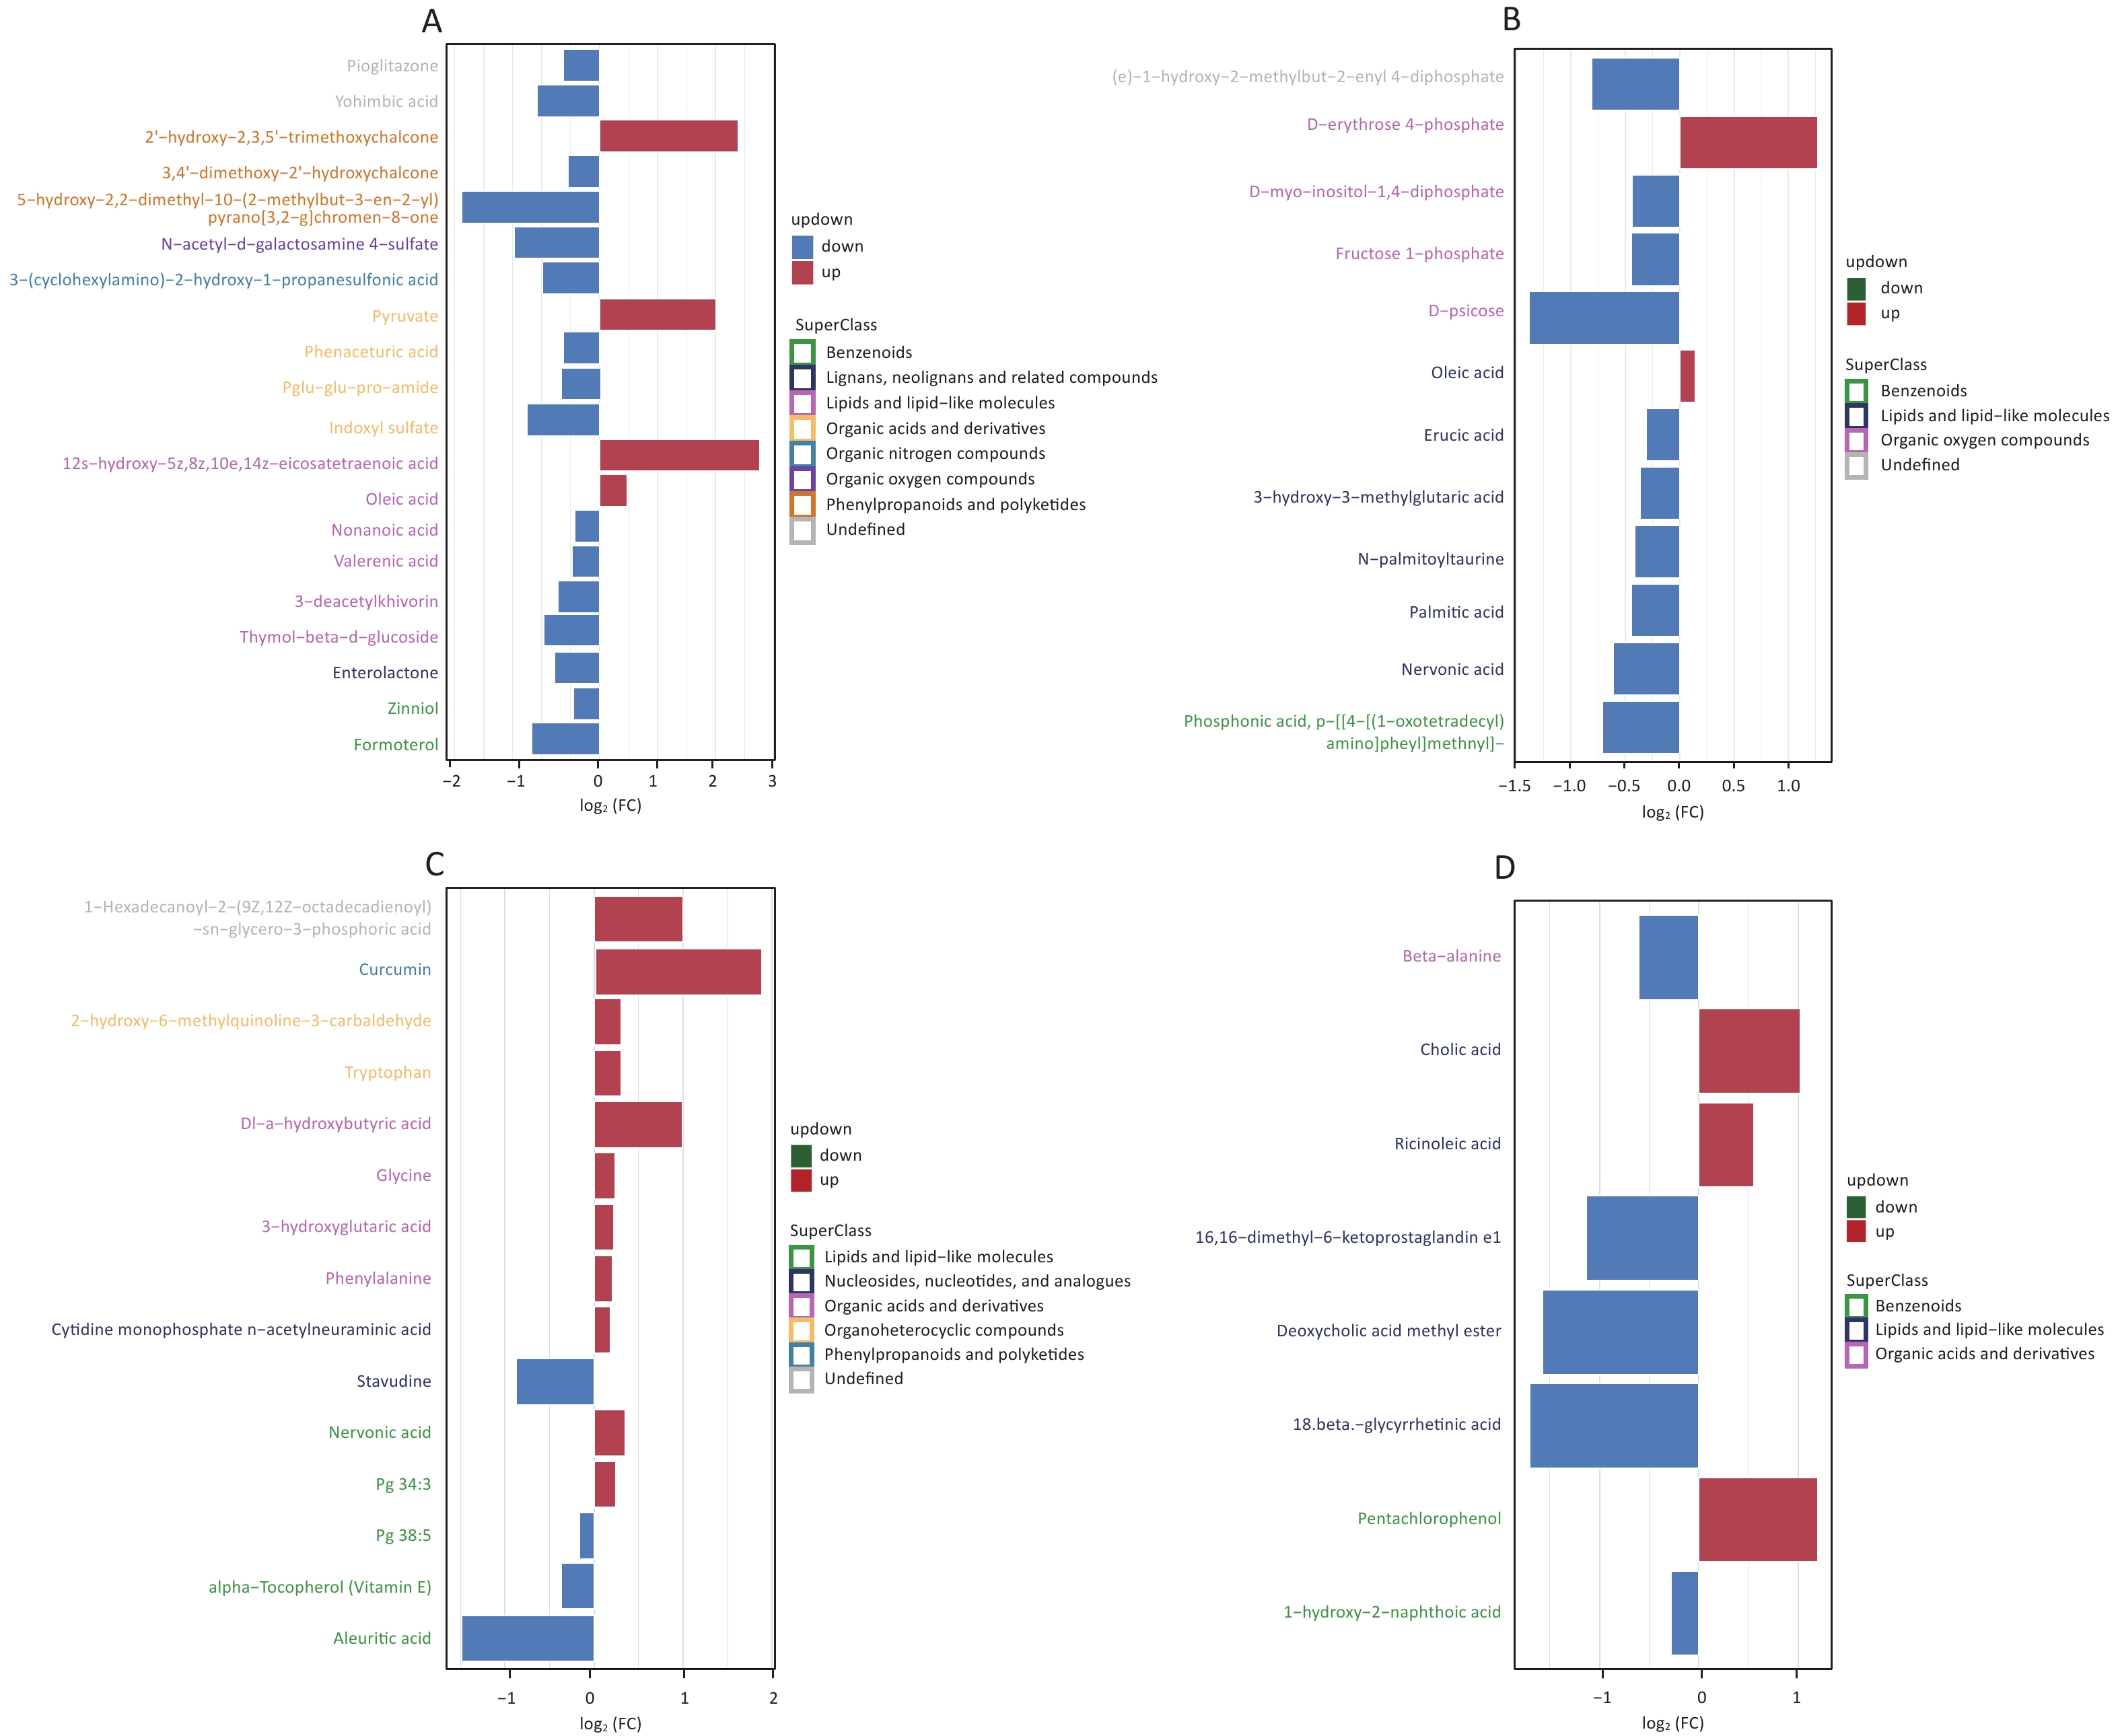
We screened metabolites following a strict selection criterion, including OPLS-DA VIP > 1 and P value < 0.05. Our analysis revealed that salivary metabolites showed 24 increases and 19 decreases in quantity. In the hippocampus, we found 12 increased and 21 reduced metabolites. Cortex samples exhibited an increase in 27 metabolites and a decrease in 11 metabolites. Amygdala samples showed 7 upregulated and 7 downregulated metabolites. The details of different metabolites were shown in Supplementary Figures S3 and S4, available in www.besjournal.com.

Figure S3. Screening for differential metabolites in saliva (A), hippocampus (B), cortex (C), and amygdala (D) under positive mode with criteria OPLS-DA VIP > 1 and P value < 0.05.
We first identified the differential metabolites and then matched them with the KEGG database to find out the pathways they are associated with. To determine which metabolic and signal transduction pathways are significantly affected, we used Fisher’s Exact Test to analyze and calculate the significance levels of metabolite enrichment in each path. This analysis’s results were presented as a bubble plot (Figure 5).
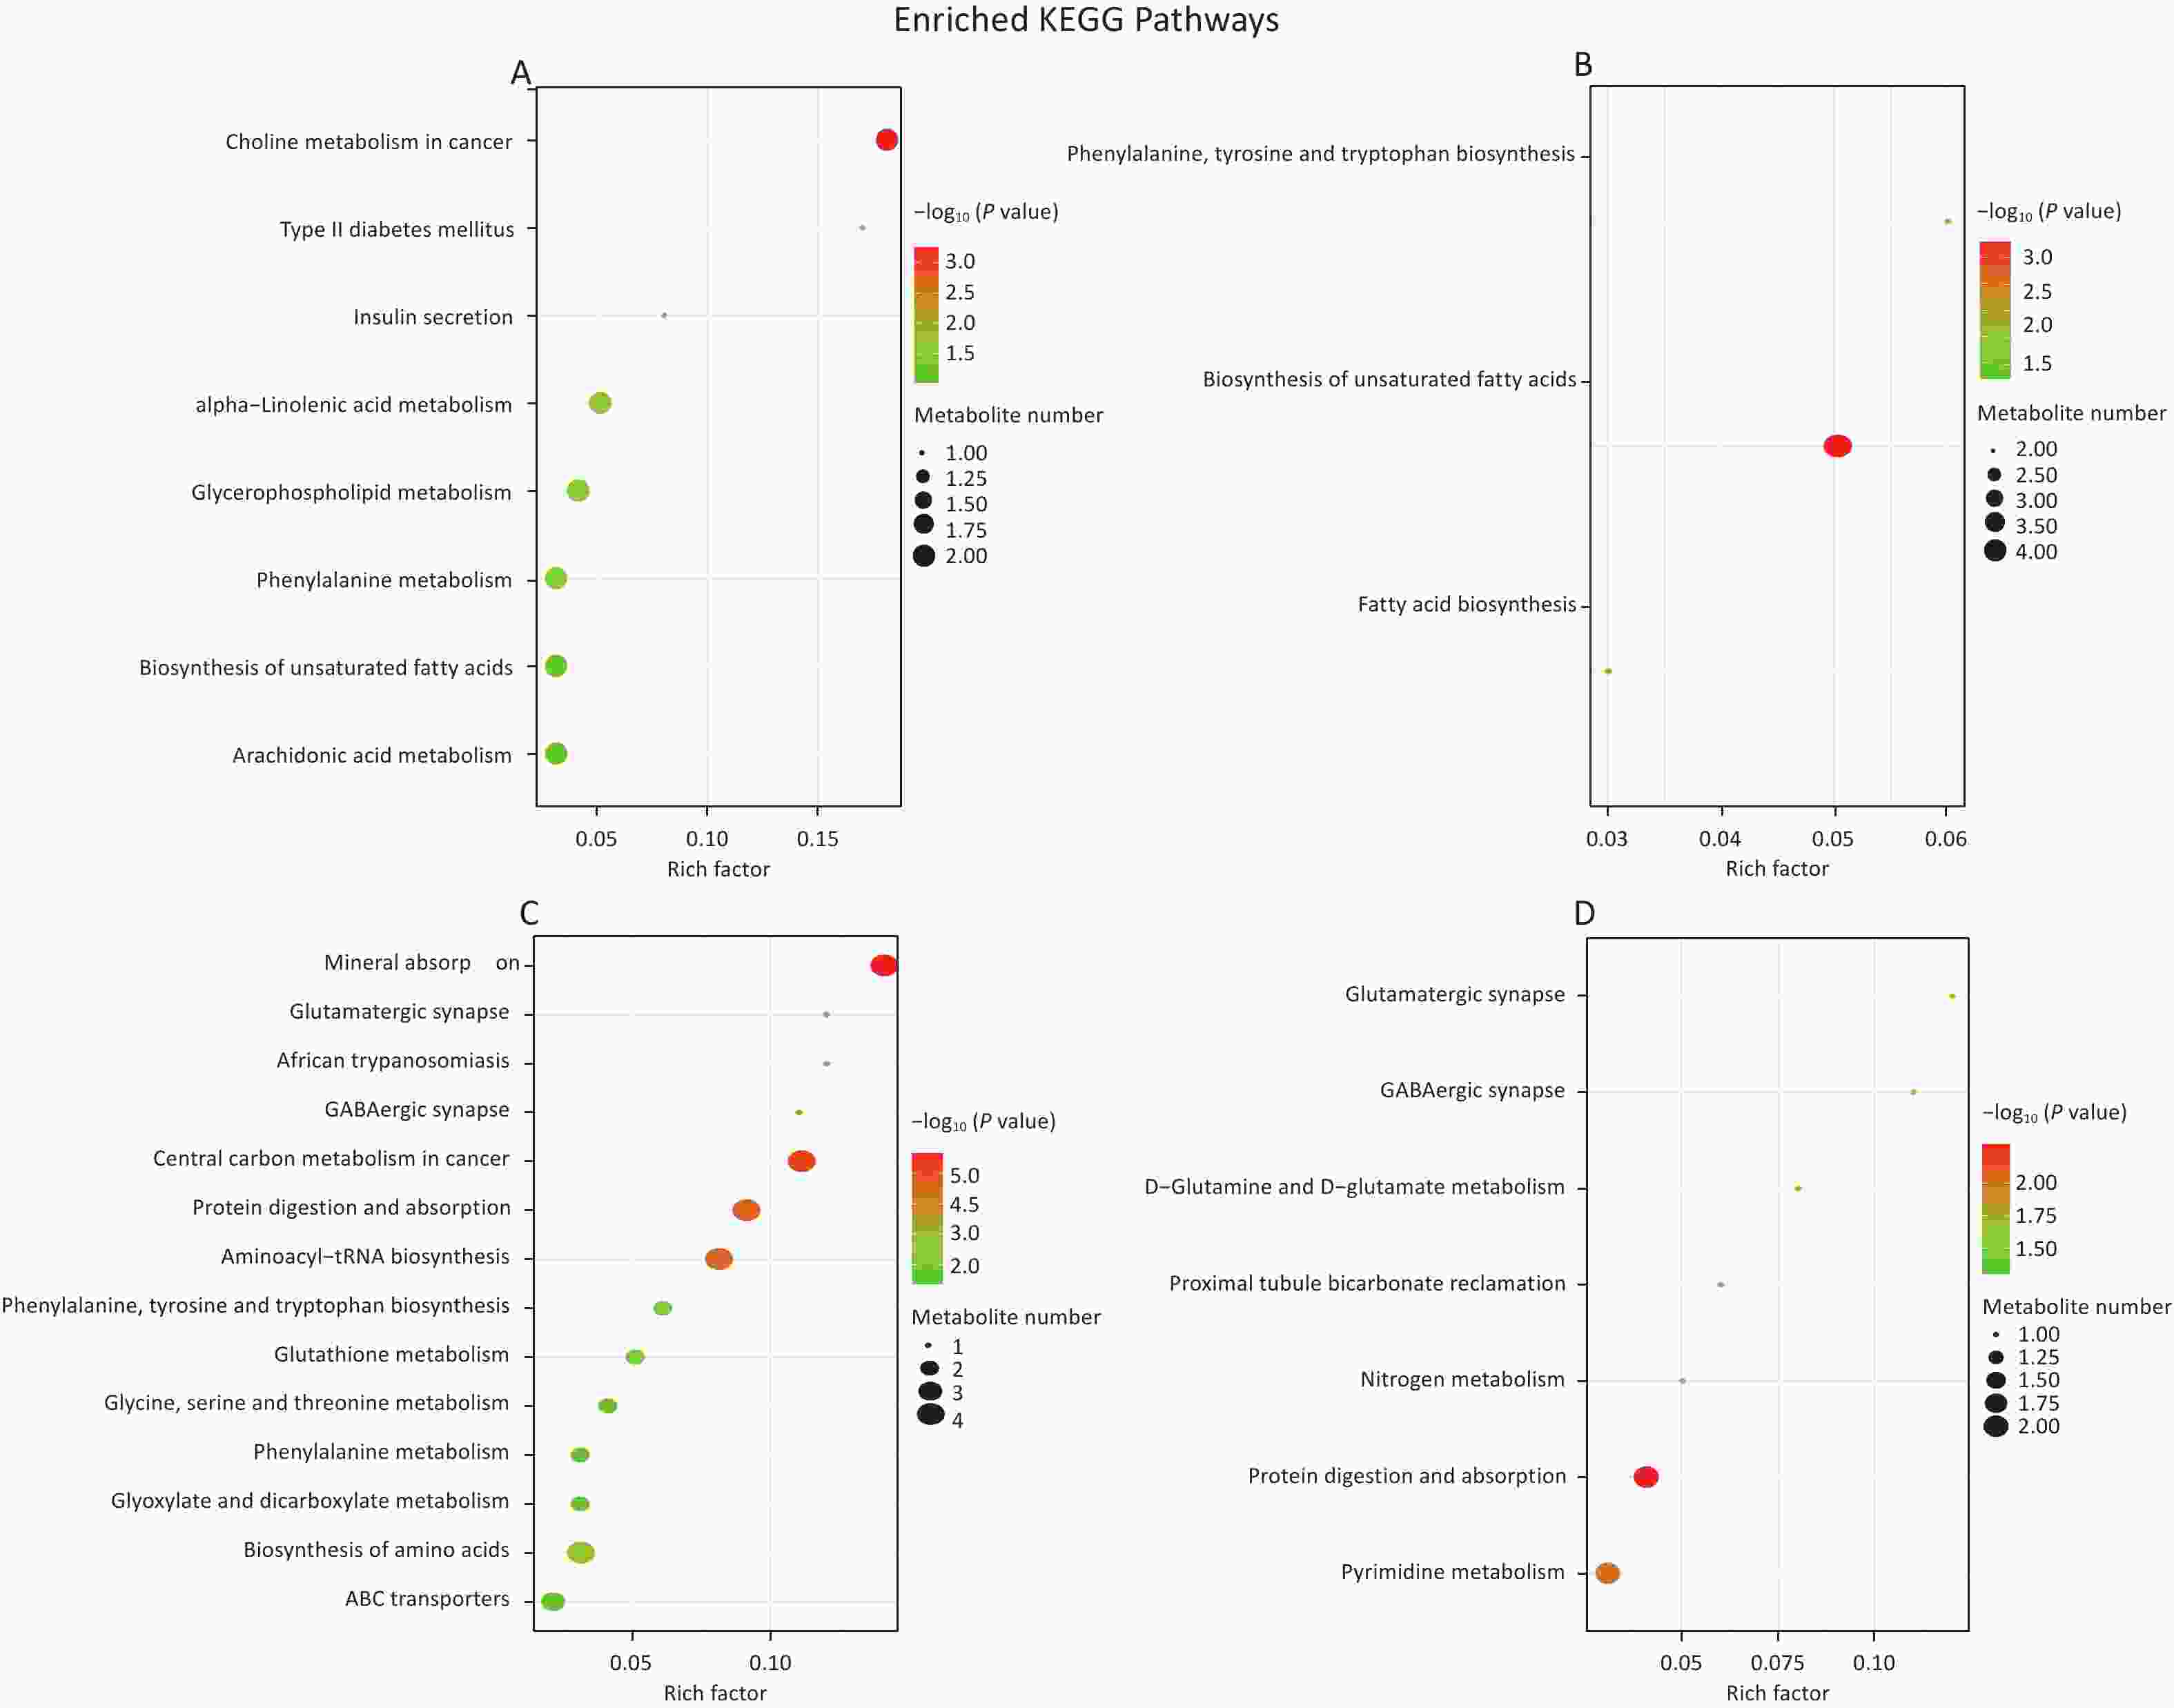
Figure 5. Enrichment map of metabolic pathways in saliva (A), hippocampus (B), cortex (C), and amygdala (D). Color represents the P-value of enrichment analysis. The darker the color, the smaller the P-value, and the more significant the enrichment degree.
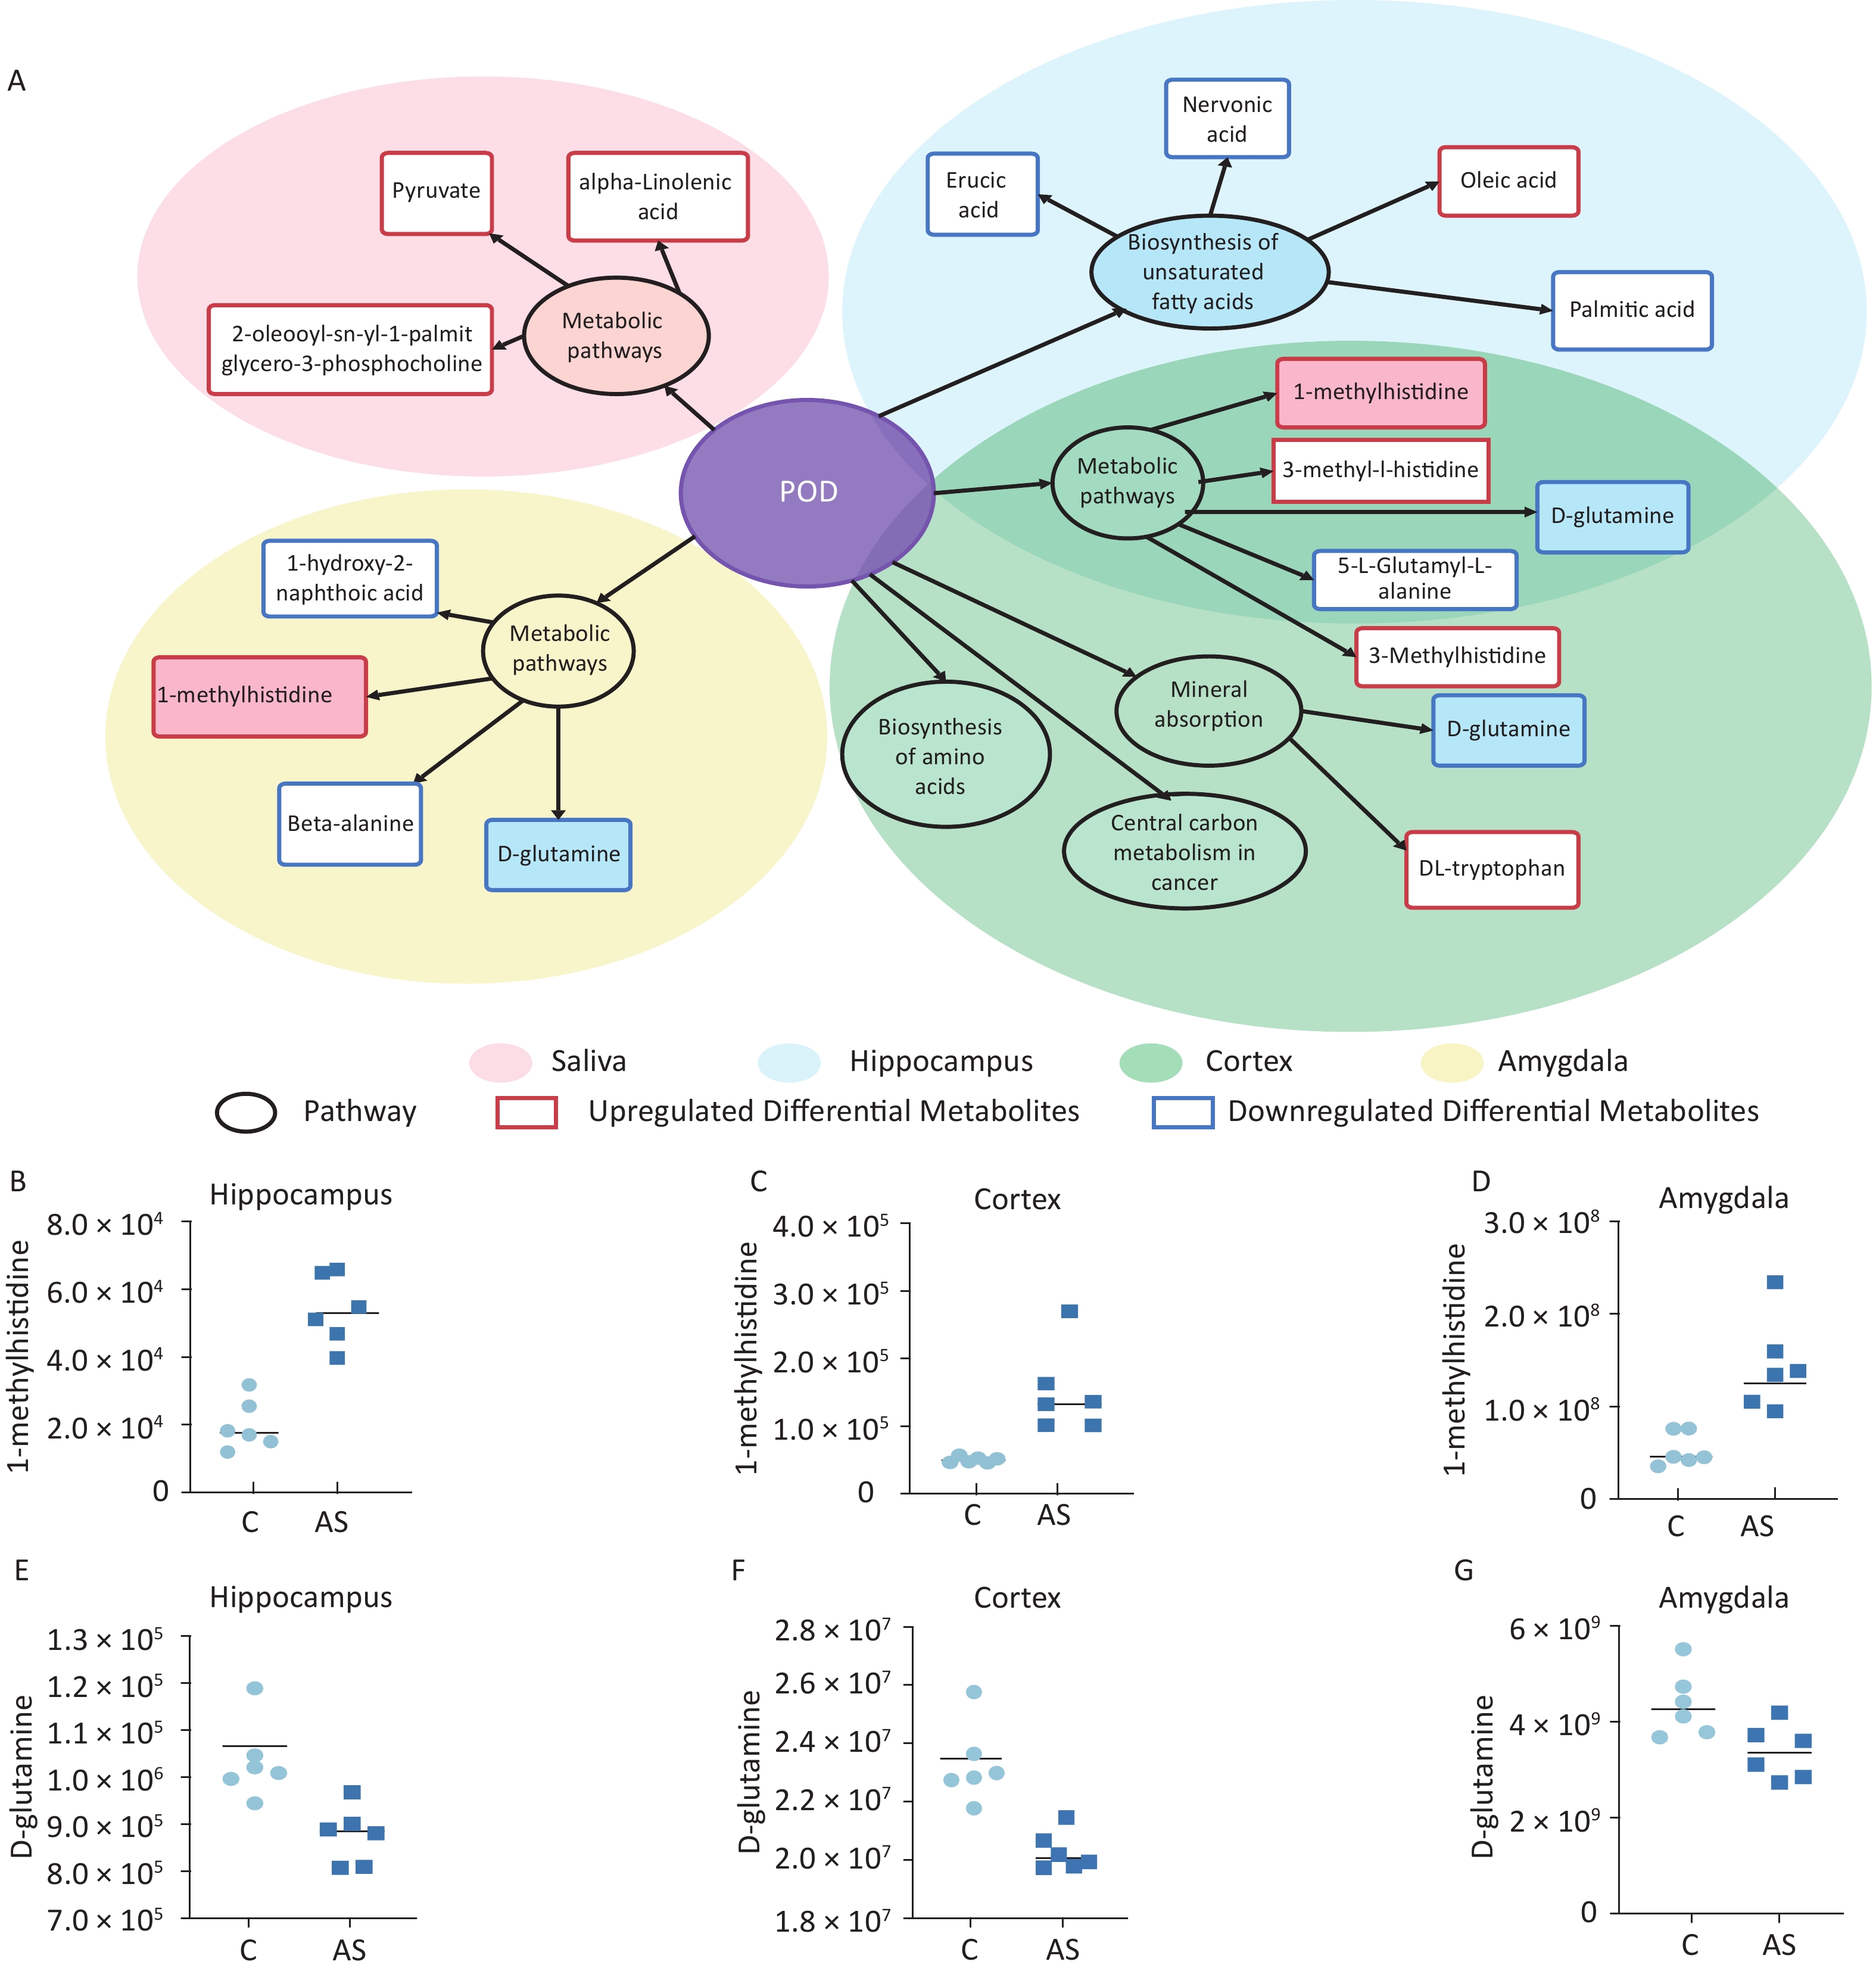
Our study involved screening for different metabolites in saliva samples and three brain regions. To facilitate the summary and observation of the expression of various metabolites annotated by the KEGG metabolic pathway, we chose the main pathway with the highest number of differential metabolites (Figure 6A). The main metabolic pathways in the hippocampus were mainly related to the “biosynthesis of unsaturated fatty acids” and “mmu01100 metabolic pathways”. Cortex enriched multiple pathways, including “mmu01100 metabolic pathways” “mineral absorption” “central carbon metabolism in cancer” and “biosynthesis of amino acids”. The main pathways involved in the amygdala region were “pyrimidine metabolism” and “protein digestion and absorption”. Significantly, “1-methylhistidine” was upregulated, and “D-glutamine” was downregulated in the amygdala, hippocampus, and cortex. The expression of these two substances in different brain regions is shown in Figure 6B–G.
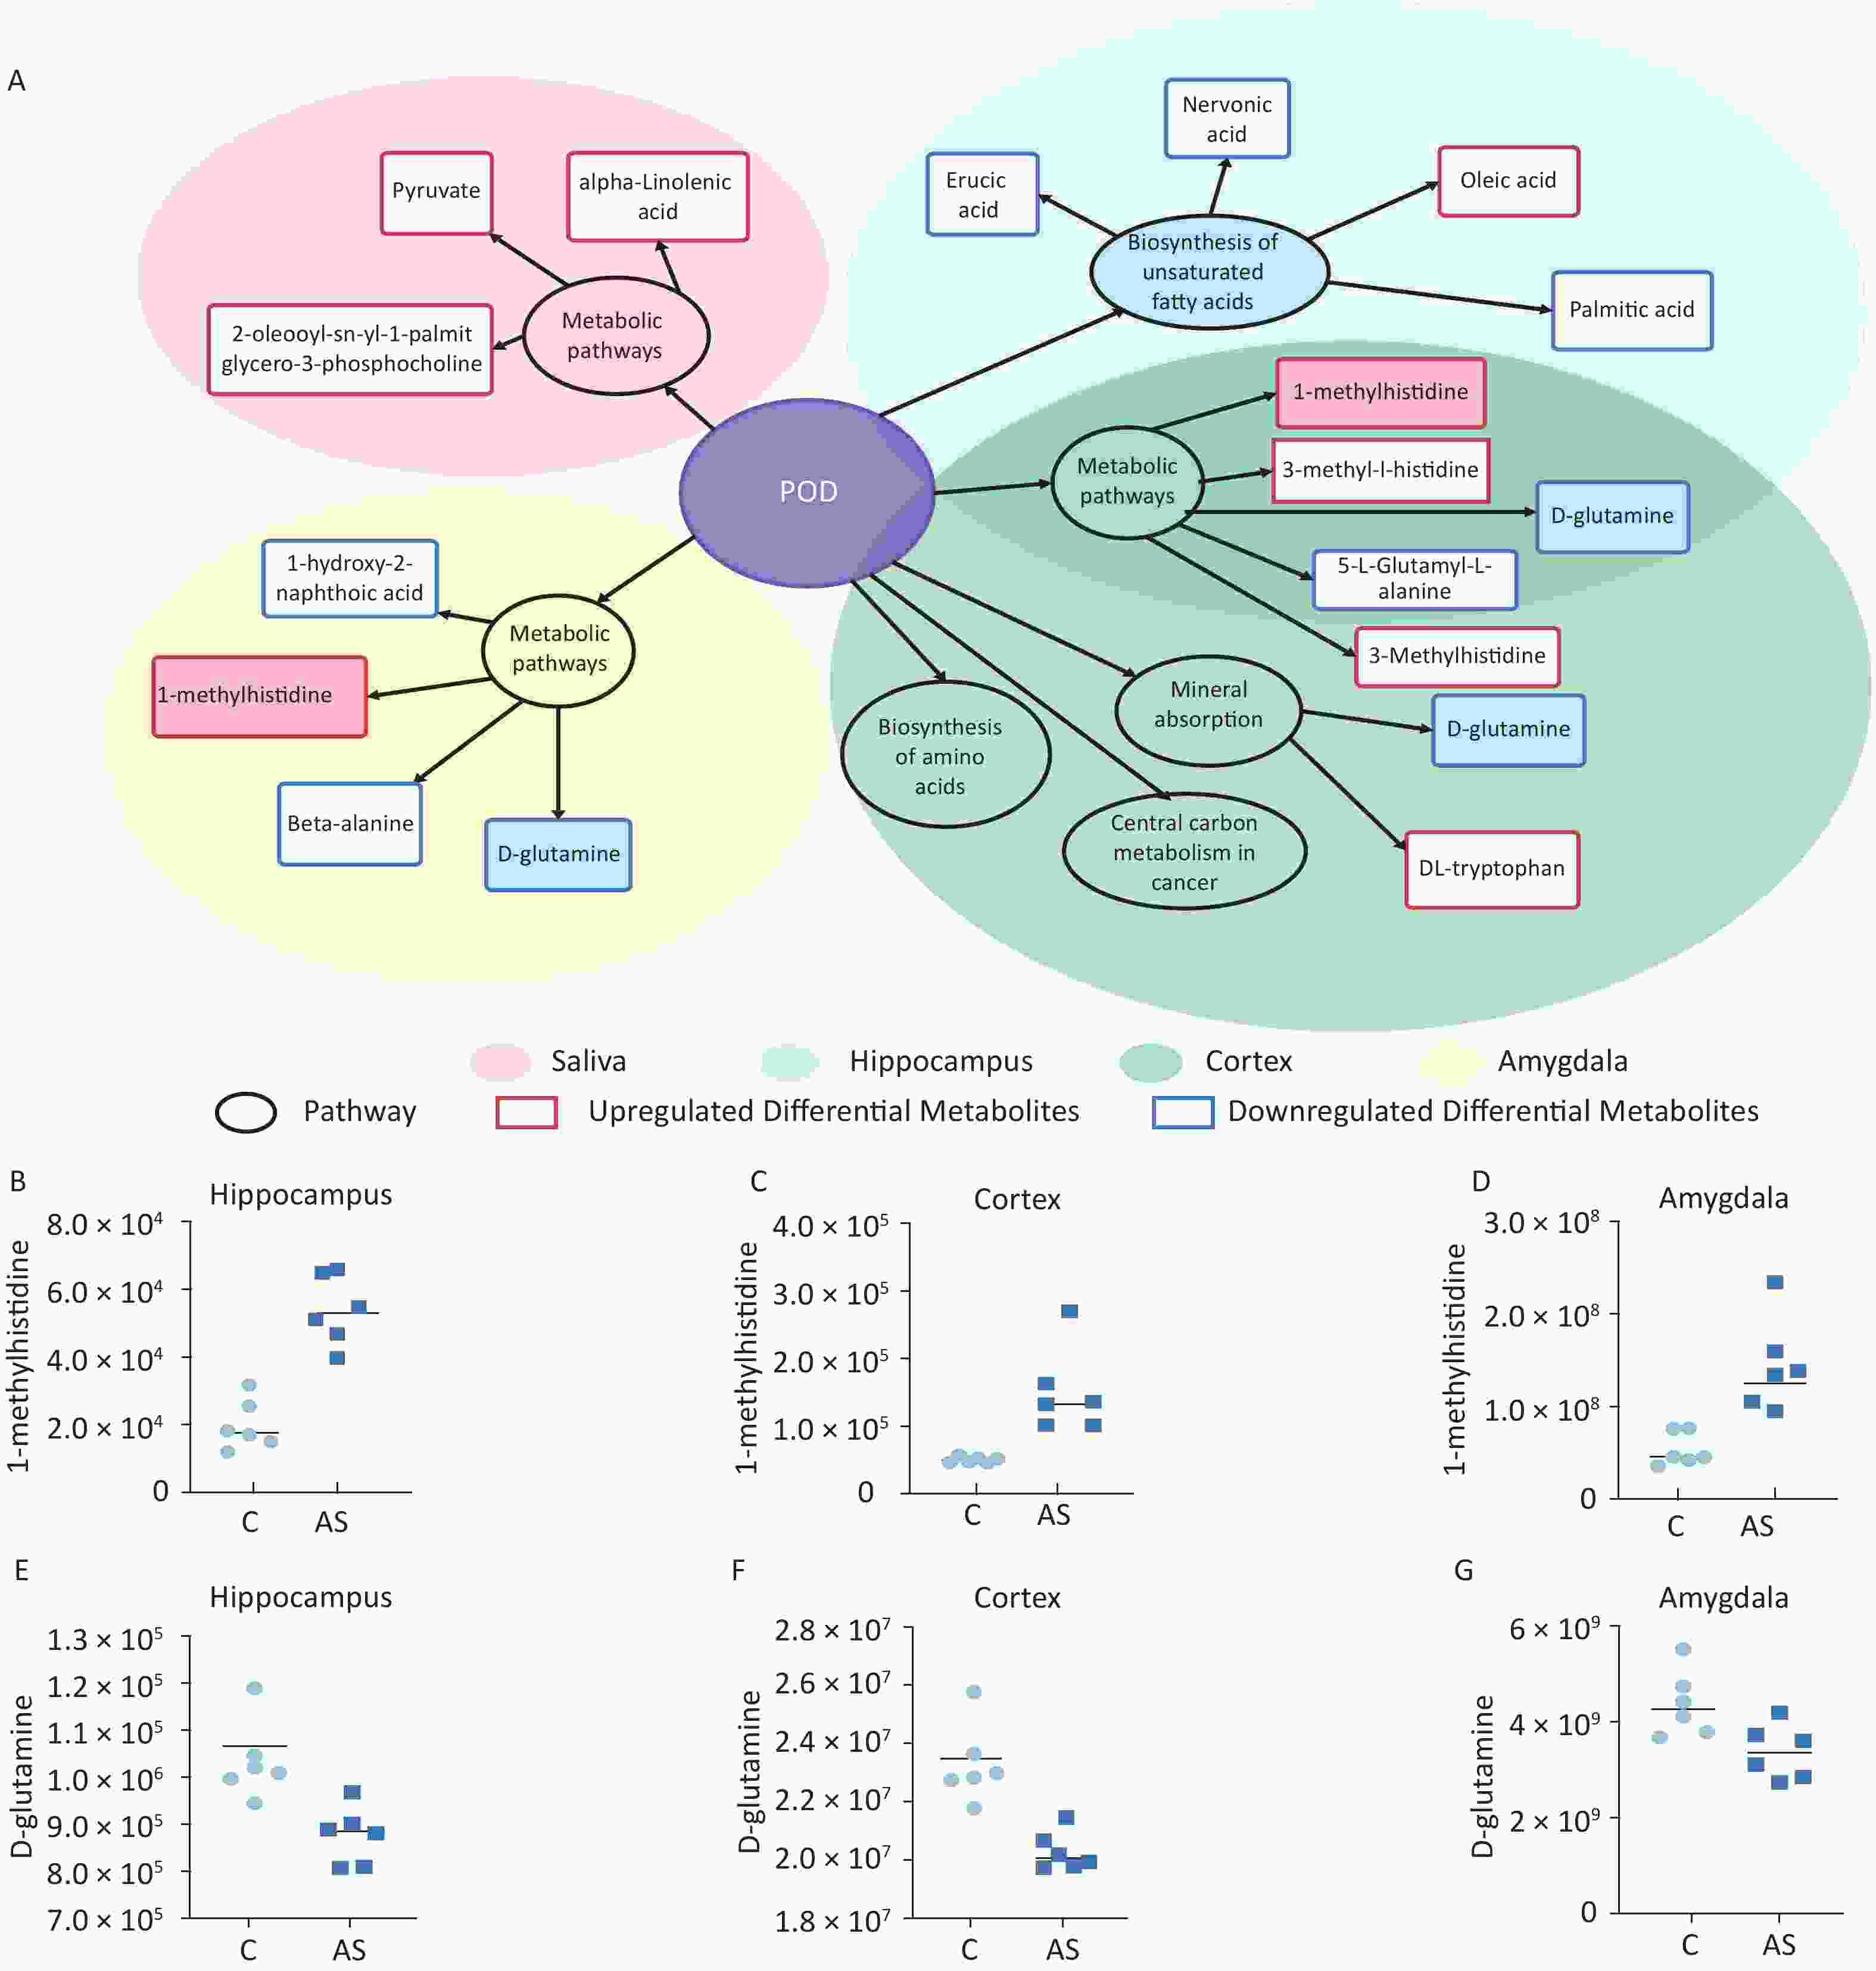
Figure 6. (A) A summary of the primary differential metabolites found in saliva, hippocampus, cortex, and amygdala samples. The shadow color represents different samples, and the overlapping parts indicate common pathways and metabolites. The circle represents the primary metabolic pathway, while the rectangle represents differential metabolites. The upregulated and downregulated metabolites were marked as red rectangles and blue rectangles, respectively. The levels of 1-methylhistidine and D-Glutamine expression were measured in the hippocampus (B, E), cortex (C, F), and amygdala (D, G). C: the control group, AS: the Anesthesia/Surgery group. POD, ostoperative delirium.
We detected 43 differential metabolites in saliva samples and performed KEGG pathway analysis to understand their biological functions. The analysis revealed that “hsa01100 Metabolic pathways” were involved in the largest number of metabolites, including “Pyruvate” “alpha-linolenic acid” and “2-oleoyl-1-palmitoy-sn-glycero-3-phosphocholine”. Furthermore, these three substances had similar expression patterns as determined by cluster analysis (Figure 7). Based on these findings, we selected these three substances as potential biomarkers of saliva.
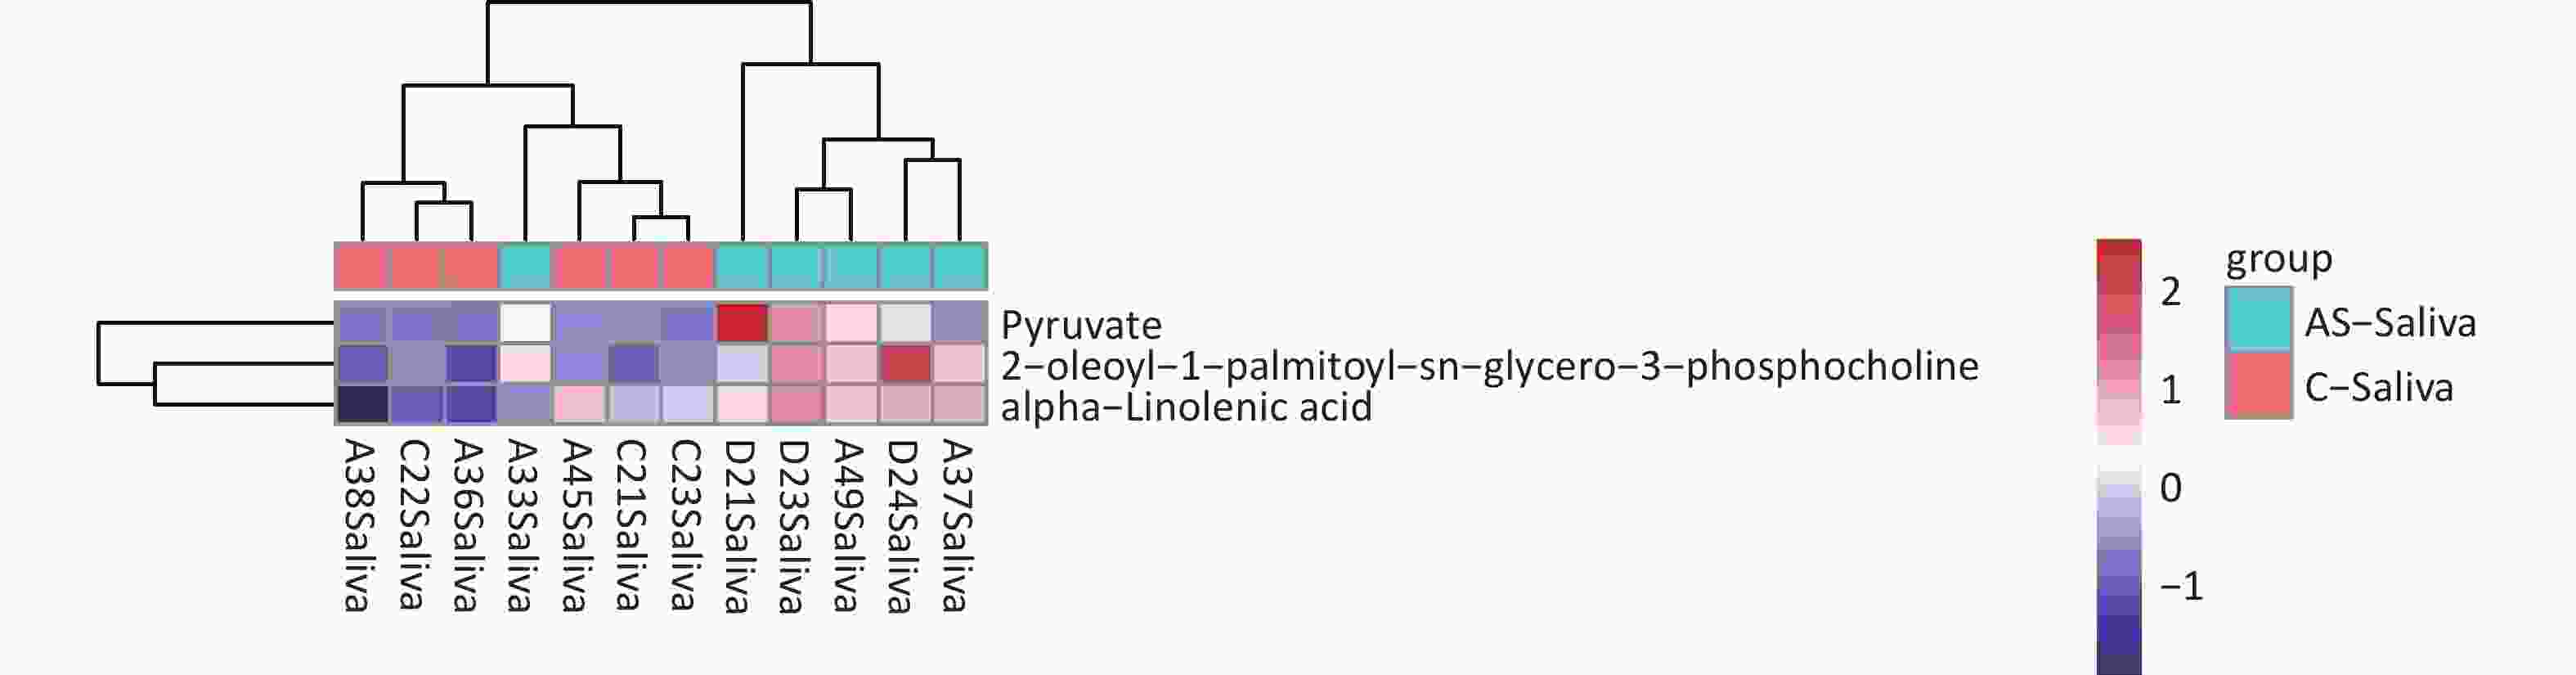
Figure 7. Differential metabolite clustering heatmap of KEGG pathways. The chart displays differential metabolites, where the vertical axis represents the significantly differentially expressed metabolite, and the horizontal axis represents the sample group. The color blocks at different positions show the relative expression levels of metabolites, with red indicating high expression levels, and blue indicating low expression levels. Metabolites with similar expression patterns are clustered under the same cluster on the left.
-
The pathological mechanism of postoperative delirium is not yet clear. Previous studies have identified several risk factors associated with postoperative delirium, such as age[27], surgical procedures[28], nutritional deficiencies[29,30], electrolyte abnormalities[31], fluid imbalances, baseline cognitive impairment[27], sleep disorders[32], and low oxygenation status[33]. Our research also suggested that multiple pathophysiological mechanisms, such as energy metabolism dysfunction, oxidative stress and neurotransmitter dysregulation, might be involved in POD.
Orthopaedic surgery has been shown to impair memory in rodent models[34,35]. The current study created a model of postoperative delirium in mice induced by tibial fracture fixation surgery under sevoflurane anesthesia. Behavioral tests confirmed the surgery affected the mice’s attention and learning abilities. C3 is the central component of the complement system, which has been extensively investigated in the central nervous system[36-38]. Research studies have found that mice with defects in the complement C3 gene exhibit positive effects in models of synaptic loss[39]. Our study has revealed that anesthesia/surgery leads to an increase in C3 levels in the hippocampus of mice, which is consistent with the findings of Xiong’s research[40]. Furthermore, it has been reported that patients suffering from postoperative delirium show increased C3 levels in their cerebrospinal fluid[41]. S100beta is a significant predictor of POD in clinical studies[42,43]. The increase of S100b in the Anaesthesia/Surgery group suggests that anesthesia and surgery stress lead to brain damage.
-
Based on metabolomics analysis, we identified 43 differential metabolites in saliva. Pyruvate is a molecule found in mammals associated with brain energy utilization[44]. It converts into acetyl CoA, nicotinamide adenine dinucleotide (reduced form, NADH), and CO by mammalian pyruvate dehydrogenase complexes[45]. This reaction acts as a bridge between anaerobic and aerobic brain energy metabolism. Our research shows a significant increase in pyruvate levels in saliva. This could be due to a decrease in the activity of pyruvate dehydrogenase complex enzymes. An imbalance in energy metabolism in the brain and reduced activity of pyruvate dehydrogenase complexes have been associated with acute brain injuries and several neurodegenerative diseases[46]. Another study indicates that pyruvate can provide clues for treating Alzheimer’s disease[47]. However, we found no differences in pyruvate levels in brain tissue between the two groups. Further research is needed to explore the relationship between saliva pyruvate levels and brain energy metabolism.
-
Oxidative stress has been one of the potential mechanisms of POD[48]. In this study, 1-methylhistidine was found to be upregulated in three different regions of the brain. This metabolite is produced as a byproduct of anserine (beta-alanyl-L-1-methyl-histidine), divided into carnosine and analogues. Carnosine and its analogues act as antioxidants in oxidative stress conditions like neurodegenerative diseases and hypoxic-ischemic injuries[49,50]. They were studied for their ability to scavenge free radicals and stimulate antioxidant systems. Besides, our research has revealed that other indicators of antioxidants were upregulated, such as 3-methyl-l-histidine in the hippocampus and cortex. Taken together, these antioxidants indicate that peroxidation damage occurred in the brains of delirium mice. In agreement with this speculation, a study on elderly African Americans suggests that N-acetyl-1-methylhistidine’s higher serum levels are associated with decreased cognitive function in older ages[51].
-
One common change in neurotransmitters associated with delirium is the excess glutamate release. Some studies have suggested that the harmful effects of beta-amyloid peptide on the brain may be due to excessive activation of glutamatergic transmission and excitotoxicity. This could explain the higher occurrence of delirium in patients with existing cognitive dysfunction and the persistent cognitive impairment that follows delirium episodes over the long term[7]. In physiological conditions, glutamate is released from synaptic vesicles into the synaptic cleft, where astrocytes clear it and then convert it into glutamine. However, in oxidative stress conditions, this transform homeostasis is disrupted. Our study found that D-glutamine exhibited a decreasing trend in all three brain regions. Previous studies have found that D-glutamine decreases in the serum[12] and cerebrospinal fluid[15] in POD patients. We confirmed the results in different brain regions in a mouse delirium model.
Here are some limitations. Firstly, the sample size is small. While the reproducibility of biological samples was good, the saliva samples for biomarker screening was not convincing enough. It requires further validation with large-scale samples. Secondly, the amygdala does not have clear anatomical boundaries in brain tissue, which challenges the accuracy of material extraction. Better ways are needed to harvest the amygdala in the future. Thirdly, saliva is collected after the establishment of the delirium model. These non-invasive biomarkers can be used as biomarkers for diagnosing POD but cannot be used as predictive biomarkers, which is more valuable. Future research needs to explore non-invasive biomarkers for predicting POD.
-
Our study indicates that dysfunction in energy metabolism, oxidative stress, and neurotransmitter regulation may contribute to the development of postoperative delirium. This study also emphasizes that the disturbance in salivary biomarker concentrations can be utilized as a non-invasive diagnostic tool for POD identification.
-
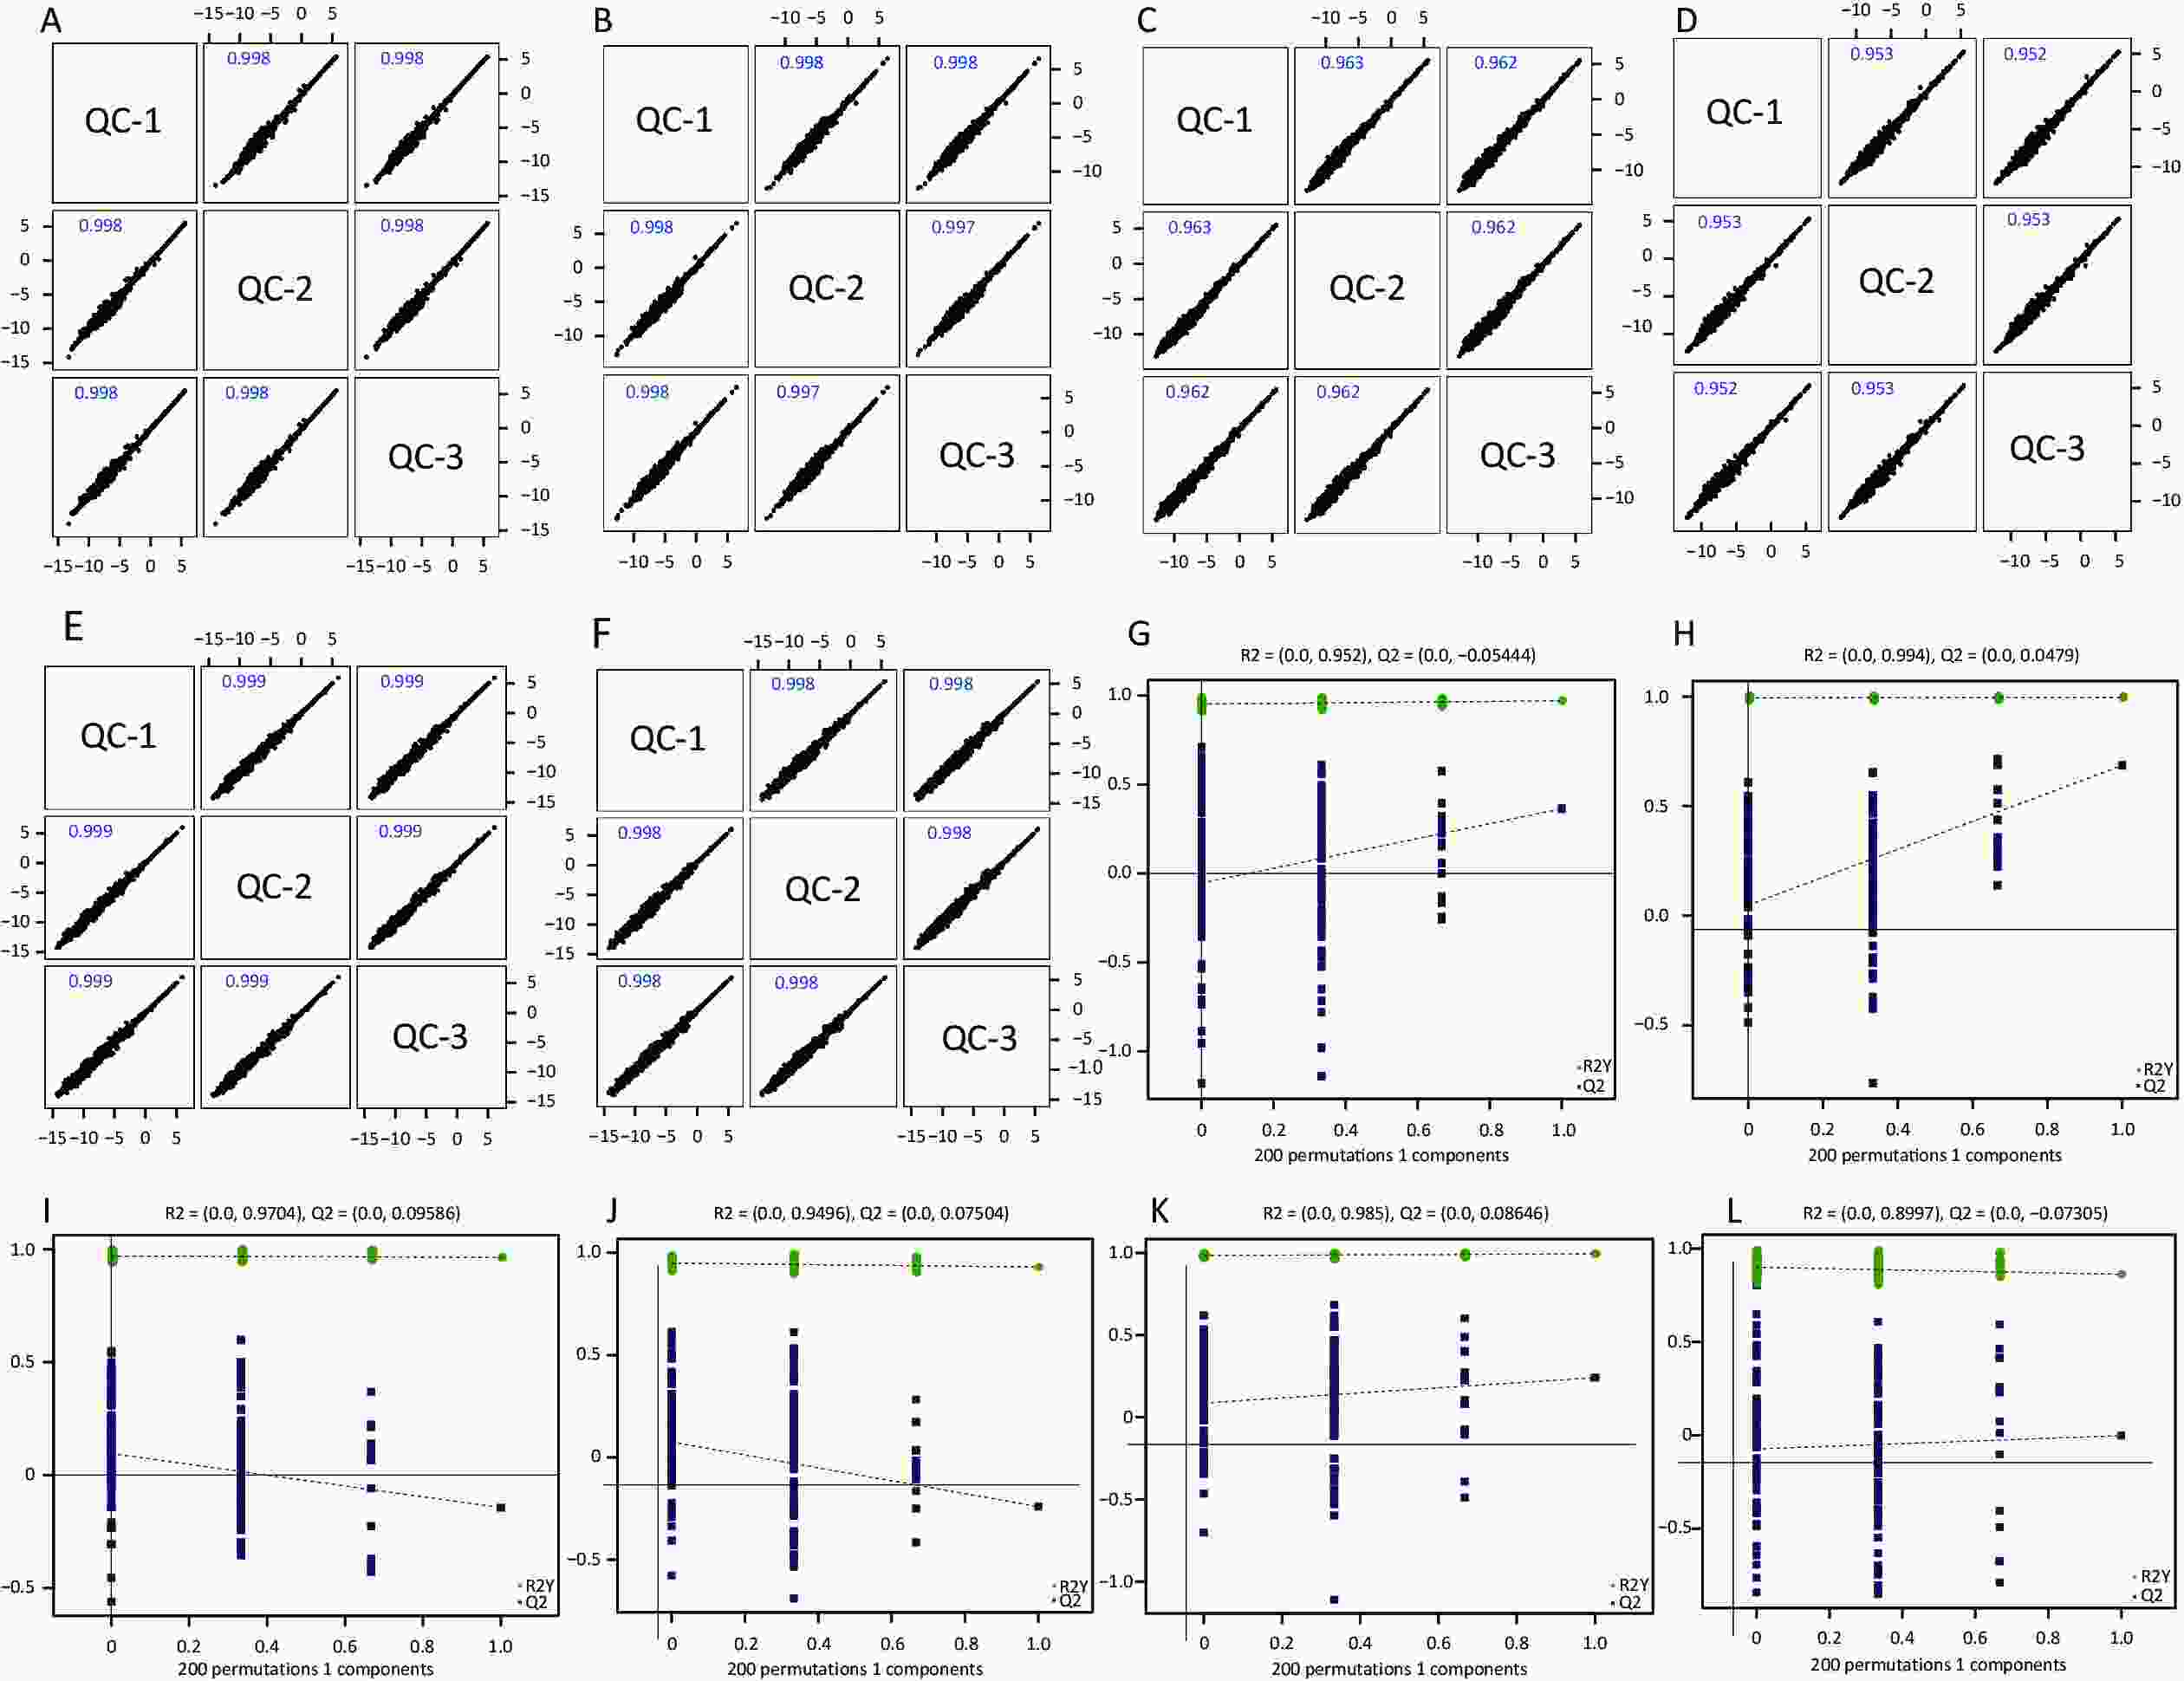
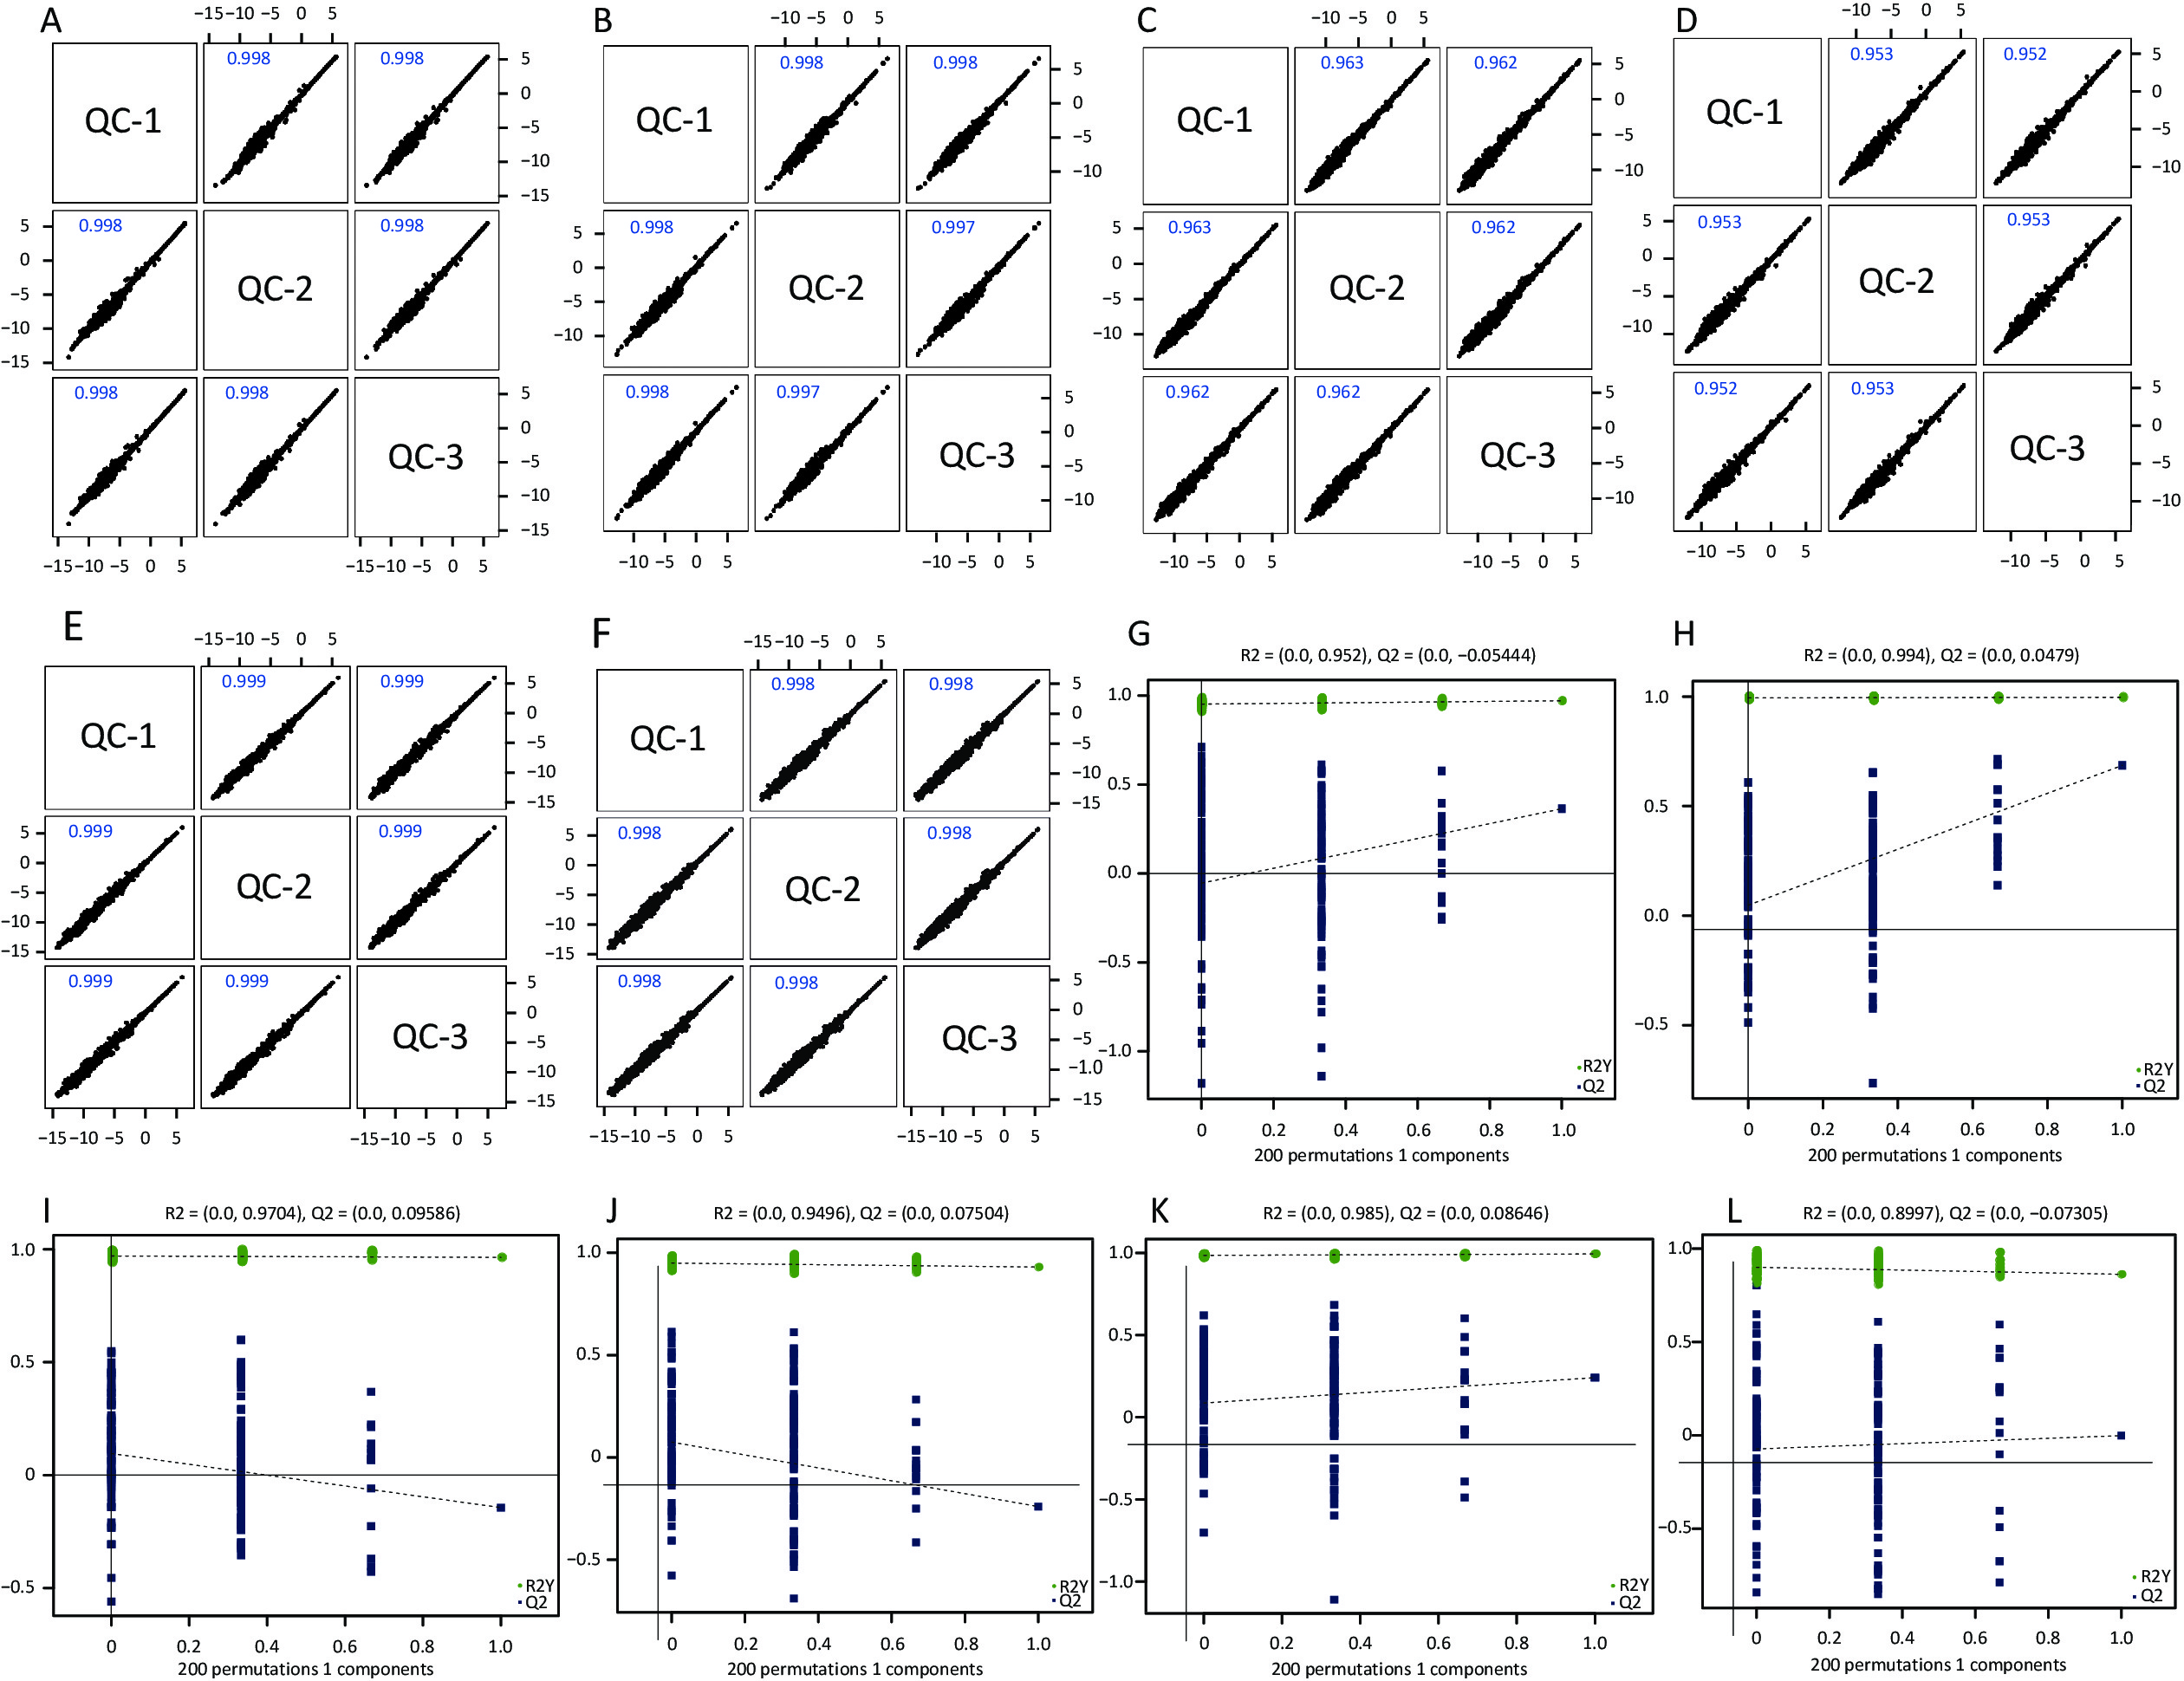
Figure S1. Quality control of experimental data (hippocampus, cortex and amygdala). Person correlation analysis on the quality control hippocampus sample in the positive (A) and negative (B) modes; cortex sample in the positive (C) and negative (D) modes; amygdala sample in the positive (E) and negative (F) modes. Permutation tests between the two groups of hippocampus sample in the positive mode (G) and the negative mode (H); cortex sample in the positive (I) and negative (J) modes; amygdala sample in the positive (K) and negative (L) modes.
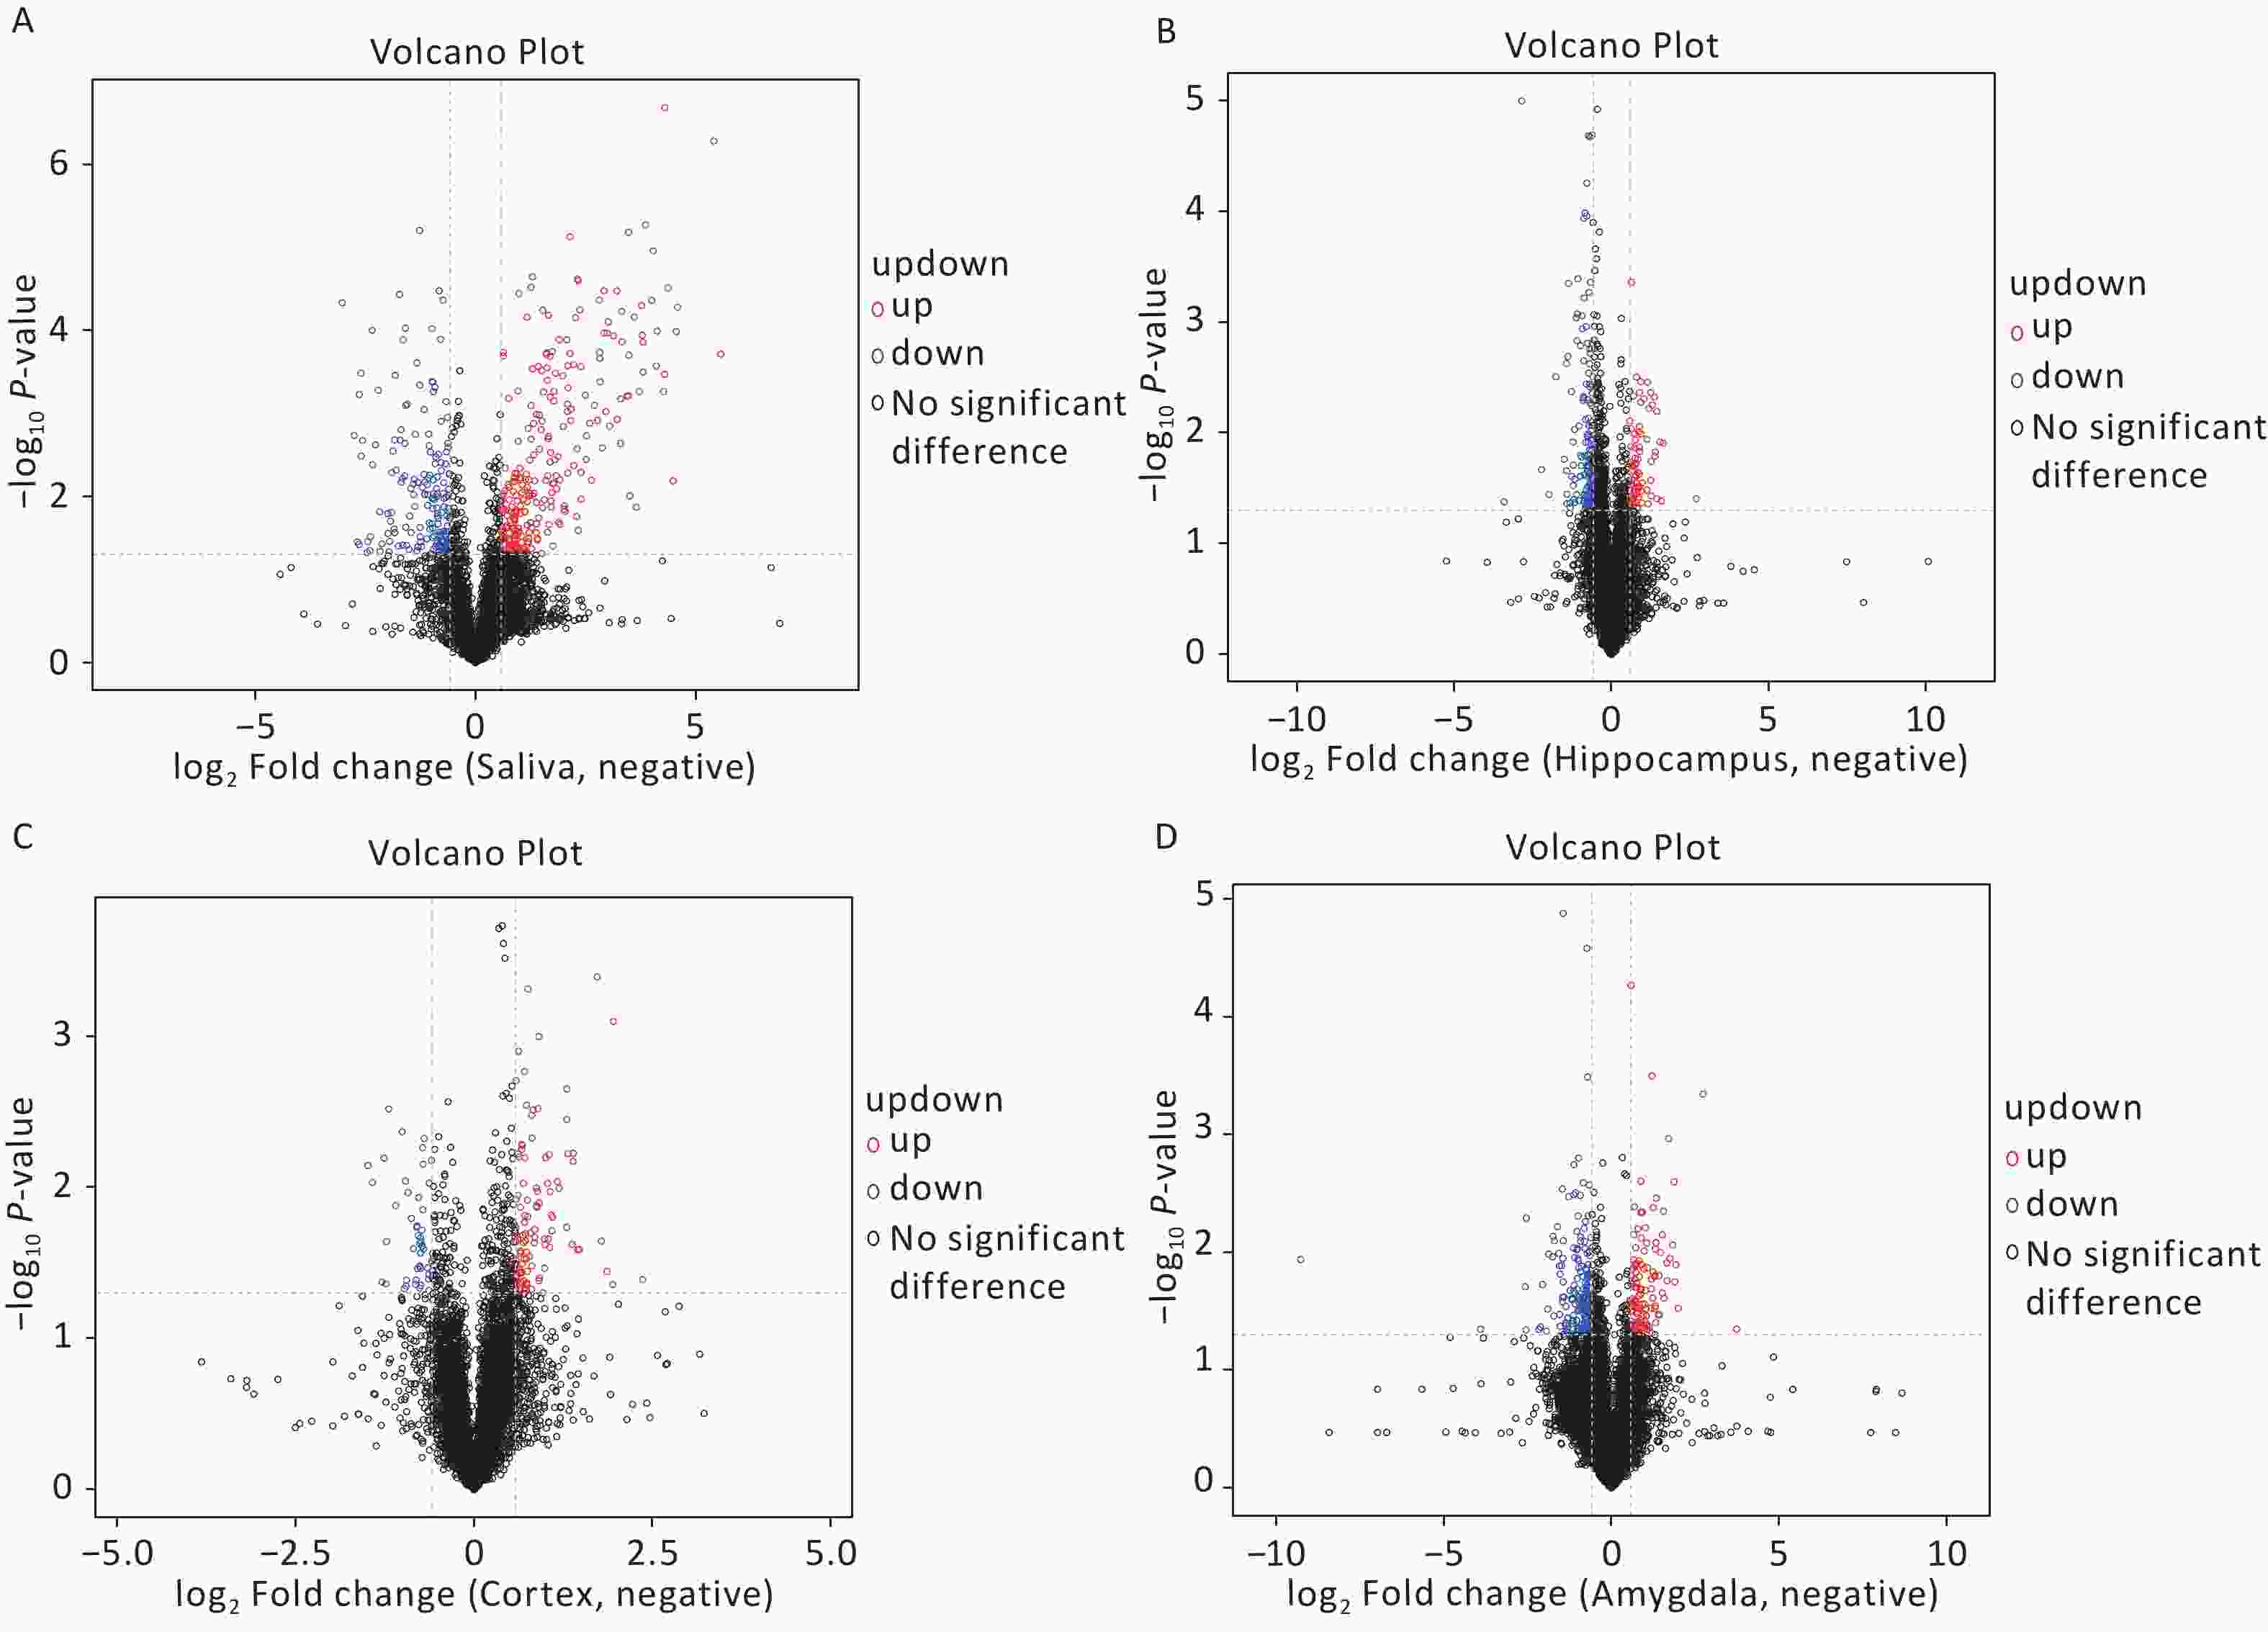
Figure S2. The volcanic plots present differentials: (A) saliva, (B) hippocampus, (C) cortex, (D) amygdala metabolites with the criteria of FC > 1.5 or FC < 0.67, P-value < 0.05 in negative mode.
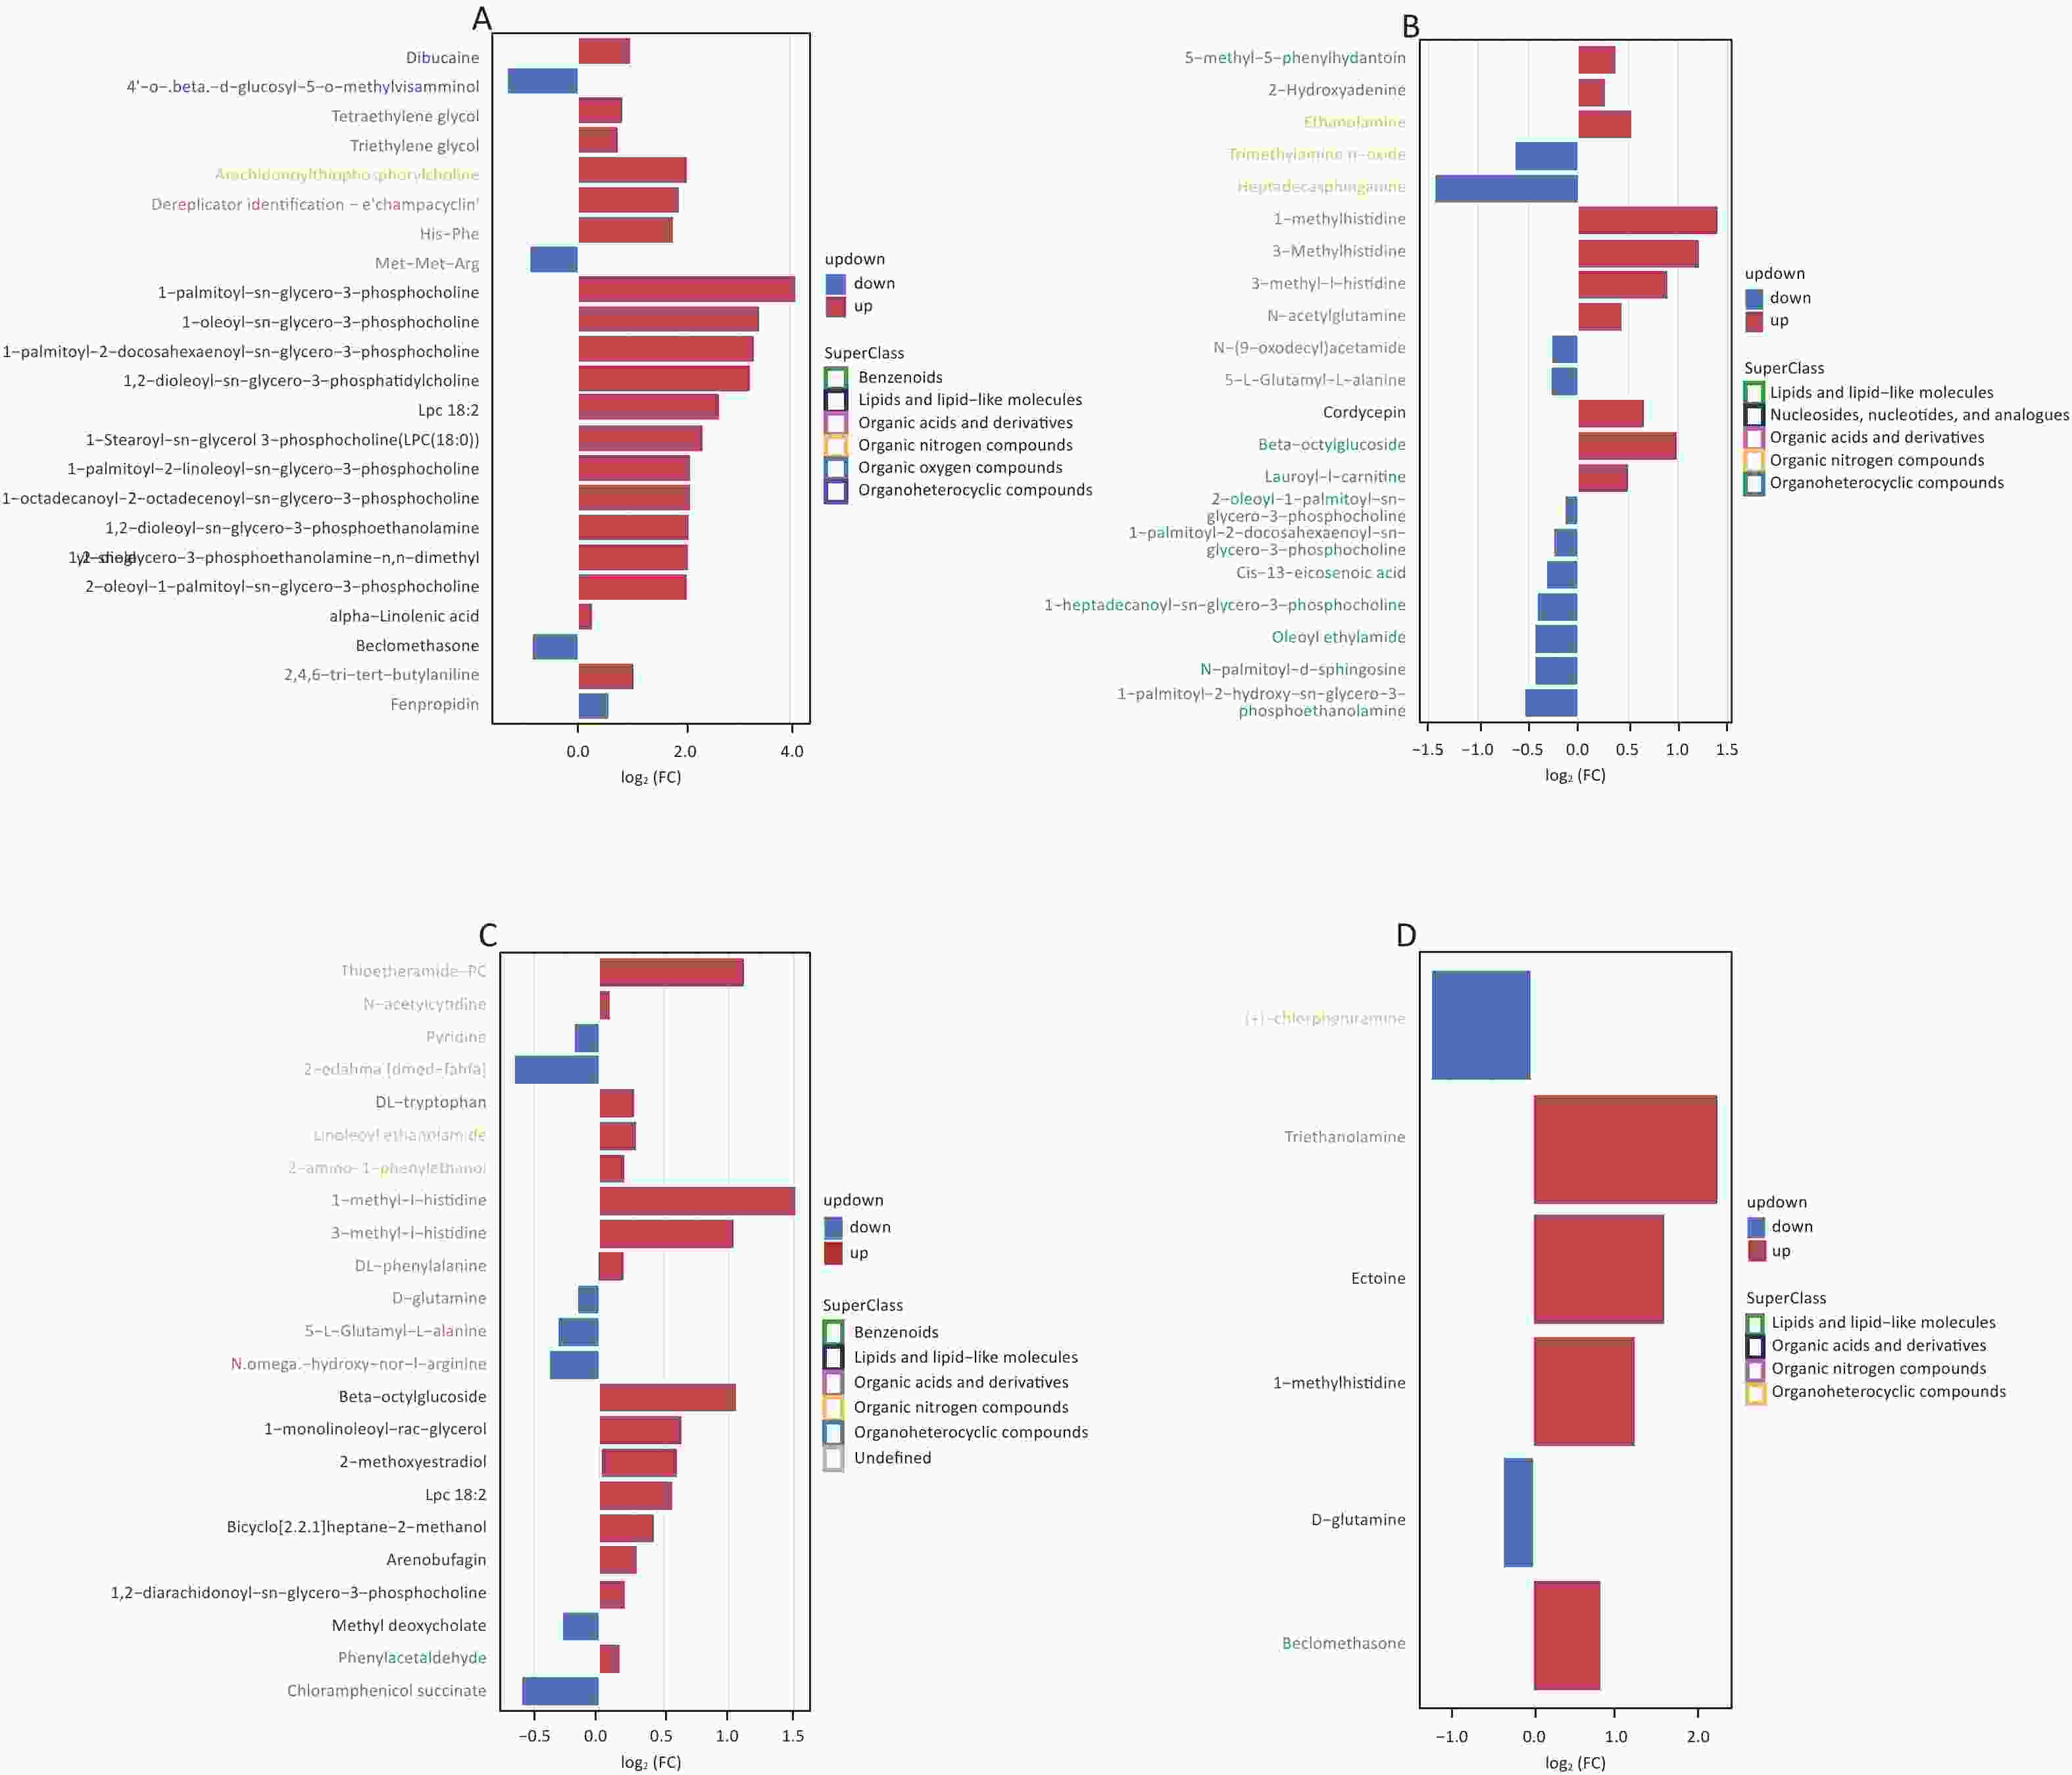
Figure S4. Screening for differential metabolites in saliva (A), hippocampus (B), cortex (C), and amygdala (D) under negative mode with criteria OPLS-DA VIP > 1 and P value < 0.05.
HTML
Animals and Postoperative Delirium Model
Behavioral Test
Sample Preparation and Extraction
Western Blot
Metabolomics Analyses
Statical Analyses
Anesthesia/Surgery-induced Postoperative Delirium in Older Mice
Anesthesia/Surgery-induced Neuroinflammation in Older Mice with Postoperative Delirium
The Changes of Metabolite Profiles in Older Mice with Postoperative Delirium
Energy Metabolism Dysfunction
Oxidative Stress
Neurotransmitter Dysregulation
 23323Supplementary Materials.pdf
|

|

 Quick Links
 DownLoad: