


HTML
-
In recent years, obesity and its metabolic disorders have emerged as major health concerns worldwide, which are attributable to a combination of genetics, improper diet and lifestyle[1]. At the most basic level, obesity results from an imbalance between calories consumption and calories expenditure[2].
As we all know, the three types of adipose tissue are white, brown, and beige[3]. Among these, brown adipose tissues (BAT) is distinguished by its ability to dissipate energy as heat[4]. Studies showed that obese subjects have significantly less active BAT than do lean people[5]. Therefore, researchers have postulated that BAT may play a role in obesity and might be a promising target for novel anti-obesity therapies. Natural bioactive compounds, like polyphenols, dietary fiber, omega-3 fatty acids and so on have been reported to act as antioxidant and anti-inflammatory agents to inhibit obesity by increasing BAT thermogenesis and energy expenditure[6, 7]. For example, green tea extract exerted potent body fat-suppressive effects in rats fed on by increasing thermogenesis of brown adipose tissue through β-adrenoceptor activation[8]. Phenols in olive oil also inhibited obesity through enhancing BAT thermogenesis by enhancing uncoupling protein 1 (UCP1) expression and promoting noradrenaline secretion[9]. Chronic consumption of a moderate dose of proanthocyanidins, a family of natural polyphenols flavonoids, could correct an energy imbalance through improving mitochondrial function and thermogenic capacity of BAT in the obese rats[10]. Therefore, it is possible for natural bioactive ingredients to exert anti-obesity function through activating BAT and promoting white adipocyte browning.
Barley, a kind of cereal, has historically been used as a source of human's daily diet[11]. Bioactive component levels of barley are higher than wheat, including β-glucan, arabinoxylans, phenols, anthocyanins, flavonoids, and selenium[12]. Recently, cereal fermentations showed significant potential in improvement of the nutritional quality and benefits of functional foods[13]. According to our previous study, we found that Lactobacillus plantarum dy-1 showed a stronger performance in fermentation of cereals compared with other Lactobacillus strains, which was previously isolated from pickles by the authors[14]. Therefore, Lactobacillus plantarum dy-1 was used as a starter to prepare extract of Lactobacillus-fermented barley (LFBE). Lactobacillus plantarum (L.P) fermentation is one of the best ways to improve the content of bioactive components, as it effectively increases the digestibility of cereal and particularly high tannin cereals[15, 16]. Studies have showed that L.P fermentation improves phenolic concentration and antioxidant activity in cowpea flour[17]. Likewise, L.P fermentation can also increases the bioavailability of barley and oat flour[18]. In our study, we chose Lactobacillus plantarum dy-1, which was previously isolated from pickles by the authors, showing a stronger performance in fermentation of cereals compared with other Lactobacillus strains[14].
The strain of SD rats is a good animal model for studying nutrition, especially the HFD-induced obese model[19]. Our previous studies suggested that LFBE could suppress body weight gain in HFD-induced obese SD rats by relieving the inflammatory status in the system and in white adipose tissues. On the other hand, from the perspective of BAT, whether the LFBE can make some differences on the BAT thermogenesis and white adipose tissue (WAT) browning, which remains elusive. Therefore, this study was aimed to evaluate the metabolic influence of LFBE in the obese and focus on determining whether LFBE exerts the resultant effects on BAT and WAT to decrease the obesity.
-
The fresh YANGSI-3 barley was purchased from Shuang Zeng Agriculture Science Limited Company (Zhengjiang, China). Lactobacillus plantarum dy-1 (L.P dy-1) was separated by our laboratory and preserved in the database of the Chinese Common Microbe Bacterial Preservation Administration Center (CGMCC NO.6016). 3T3-L1 pre-adipocytes were provided by Nanjing Medical University (Nanjing, China). Foetal bovine serum and dulbecco's modified eagle medium were purchased from Gibco company (Sigma, America). Sprague-Dawley rats were offered by Animal Experimental Center at Jiangsu University. TaKaRa MiniBEST Universal RNA extraction kit, PrimeScriptTM RT Master Mix kit and SYBR Premix Ex TaqTM kit were purchased from Takara Bio company (Dalian, China). Mitochondrial protein extraction assay kit was purchased from KeyGen Bio Tech Company (Shanghai, China). A One Touch Ultra Blood Glucose Meter kit was purchased from Johnson & Johson Medical (Shanghai, China). All primers were purchased from Sangon Biotech Company (Shanghai, China). The primary antibodies against UCP1 (ab10983) were purchased from Abcam (Tokyo, Japan). DEX, INS, and IBMX were purchased from Shanghai Canspec S & I Company (Shanghai, China). The others reagents were purchased from Sinopharm Chemical Reagent Co. Ltd. (Shanghai, China).
-
The barley was grinded with High Speed Universal Milling Machine (Zhejiang, China) and filtered through a 80-mesh sieve. We added 2.5% L.P dy-1 (4 × 10⁸ cfu/mL) to the barley flour with seven-times deionized water to ferment at 30 ℃ for 24 h. After centrifugation (8, 000 ×g for 20 min), the supernatant of the fermented liquid was dried with vacuum freeze drier (Marin Christ, Germany) and collected as LFBE. In addition, we mixed barley flour with seven-time deionized water for 3 h at normal temperature, and the supernatant after centrifugation was dried with vacuum freeze drier to be raw barley extract (RBE).
The main bioactive compounds of LFBE and RBE were analyzed by the following methods. The soluble sugar, crude protein and lipid were determined according to the SN/T 4260-2015, Kjeldahl method and the Soxhlet extractor method, respectively.
-
Approximate 1 g LFBE was dissolved in 10 mL of 70% acetone in distilled water (v/v) at room temperature for 1 h. After centrifugation (5, 000 ×g for 15 min), we collected the supernatant, and used rotary evaporation to dry at 40 ℃. The residue was redissolved in 5 mL distilled water and abandon the undissolved substance after centrifugation (5, 000 ×g for 15 min). The supernatant was collected as polyphenols compounds (PC) and stored in -20 ℃ for analysis and cell experiments. The total phenol content of PC was determined by the Folin-ciocalteu colorimetric method[20].
Identification and quantification of polyphenol compounds were carried out using a rapid-separation high-performance liquid chromatography (HPLC) system (ShimadzuCorp., Kyoto, Japan) equipped with a photodiode array (PDA) according to the previous study[21].
-
3T3-L1 preadipocyte cells purchased from American Type Culture Collection (Manassas, USA) were cultured in Dulbecco's modified Eagle's medium (DMEM) containing 10% bovine calf serum at 37 ℃ and 5% CO2. Cells were cultured for two days to confluence (day 0), and then were induced with 0.5 mmol/L 3-isobuty-1-methylxanthine (MIX; Sigma, St. Louis, MO), 1 μmol/L dexamethasone (Sigma), and 10 μg/mL insulin (Sigma) for 2 days (day 1). From day 2 to 4, the medium was replaced with 10 μg/mL insulin. On day 4 and thereafter, the cells were then switched back to DMEM containing only 10% FBS, and medium was replaced with the fresh every 2 days. At day 1, cells also were supplemented with various concentrations of LFBE, RBE, total phenols, ferulic acid and vanillic acid. The 3T3-L1 cells were treated with ferulic acid and vanillic acid isolated from LFBE using HPLC.
-
Cells were fixed with 4% formalin in phosphate buffer for 30 min at room temperature and then stained with 0.6% (w/v) filtered oil red O solution (60% isopropanol, 40% water) for 30 min. Then, the cells were washed with dH2O for three times and photographed under a Leica DMR XA fluorescence microscope (Leica Microsystems Wetzlar GmbH, Wetzlar, Germany) equipped with the appropriate filters. Image J was used for the quantification of Oil-Red-O intensity for each group (n = 8 pictures).
-
All animal experiments were performed under the approval of the Animal Experimental Center at Jiangsu University (LARC, Zhenjiang, China) with the license number SCXK (SU) 2013-0011. All of the experiments were conducted in compliance with the National Institute of Health Guidelines for the Care and Use of Laboratory Animals (NIH Publications No. 80-23), revised in 1996. The Animal Care and Use Committee of the Jiangsu University approved this animal study. Male Sprague-Dawley rats weighing 200 ± 20 g were raised in a SPF room at 22 ± 2 ℃ with a relative humidity of 40%-60%, and artificially illuminated to provide an approximately 12-h light: dark cycle, and provided free access to standard laboratory diet and water.
The obese rat model was established for 8 weeks according to the previous method[22]. Total 24 experimental rats (8 normal rats and 16 obese rats, 4 per cage) given normal control diet (containing 70% corn, 1.8% bean pulp, 17.0% fishmeal, 5.0% grass powder, 2.0% yeast powder, 1.9% vegetable oil, 0.4% essential amino acid, 0.8% vitamin, 0.7% mineral substance, 0.2% CaHPO4, 0.2% salt) and high fat diet (HFD; containing 73% normal control diet, 12% lard, 10% sucrose, and 5% yolk powder) were divided into three groups (n = 8 each): Group 1, normal rats were given normal diet and 4 mL distilled water/kg body weight (bw); Group 2, obese rats were given a HFD and 4 mL distilled water/kg bw; Group 3, obese rats were given a HFD and 800 mg LFBE/kg bw. The dosage of LFBE was referred to our previous studies[21, 23]. The experimental period lasted for 10 weeks, and the gavage was conducted in the morning everyday. Welfare-related assessments and interventions were carried out after the experiment and there were no important adverse events in each experimental group.
During the 10-week experiment, the body weight and food intake were recorded every week. After 10 weeks, the animals were deprived of feed overnight (23:00-08:00 h) and anesthetized with chloral hydrate. Then we collected blood samples through abdominal aorta punctures, and centrifuged the blood samples at 10, 000 ×g for 3 min to obtain the serum for the biochemical experiments. We dissected out the interscapular BAT (IBAT), abdomen adipose tissue (AAT), epididymis adipose tissue (EAT) and recorded the weight of each sample. The IBAT was divided into three parts, all of which were stored in liquid nitrogen quickly for RNA preparation, 10% formaldehyde for histological analysis, and cold 250 mmol/L saccharose for the extraction of mitochondrial protein, respectively. The AAT and EAT were kept at -80 ℃ for further analysis.
-
We analyzed the triglycerides (TG), total cholesterol (TC), high-density lipoproteins cholesterol (HDL-C), and low-density lipoproteins (LDL-C) levels of the serum samples with an Olympus AU2700 Clinical Chemistry Analyzer (Olympus Inc., Japan). We determined the insulin levels using commercial rat insulin ELISA kits (R & D Systems China Co. Ltd., Shanghai, China).
-
We dissected a small piece of IBAT and fixed in it 10% formaldehyde overnight. We rinsed the samples with phosphate-buffered saline before embedded in paraffin. The paraffin-embedded BAT was sectioned at a 5 mm thickness, and then stained with hematoxylin and eosin. The prepared specimens were observed with a CX41 microscope (Olympus, Tokyo, Japan). We measured the cell diameter using the ImageJ Program.
-
We analyzed the total protein levels in the mitochondria of the IBAT with a mitochondrial protein extraction assay kit (KeyGen BioTech, Shanghai, China). We determined the protein content using the Bradford method[24]. We determined the activity of the BAT mitochondrial dehydrogenase using a slightly modified version of the method adopted by Sreelatha et al.[25]. Briefly, we added 5 mg of sodium hydrosulfite in 10 mL glass tubes with 1 mL of 20-120 μg/mL 2, 3, 5-triphenyl tetrazolium chloride, 2.5 mL of Tris-HCl (pH = 8.4), and 0.5 mL of 0.36% Na2SO4. All of the tubes were kept at 37 ℃ for 2 h in the dark to ensure adequate reaction. We added 0.5 mL of formaldehyde and 5 mL of acetone to terminate the reaction, and then kept all of the tubes at 37 ℃ for 10 min. We used a spectrophotometer to measure absorb values in 485 nm, and then made stander curve. 390 μg mitochondrial protein samples was added to 10 mL glass tubes with 1 mL of 40 μg/mL 2, 3, 5-triphenyl tetrazolium chloride, 2.5 mL of Tris-HCl (pH = 8.4), and 0.5 mL of 0.36% Na2SO4. The following method was same with the above. The dehydrogenase activity was measured with the synthesis rate of the triphenyl formazone (TF·μg/h).
-
We extracted the total RNA samples from 3T3-L1 preadipocytes, BAT and WAT using a TaKaRa MiniBEST Universal RNA extraction kit (Takara Bio, DaLian, China). The quality and purity of RNA were detected by using NanoDrop (Thermo Scientific, USA). For preparation of the cDNA, RNA sample was reverse-transcribed using the PrimeScriptTM RT Master Mix kit (Takara Bio, DaLian, Chian). Quantitative real-time RT-PCR was performed on a CFX96TM real-time PCR detection system (California, America) using the SYBR Premix Ex TaqTM kit (Takara Bio, DaLian, China). β-actin was used as an internal control for its stable expression. We evaluated the PCR products by analyzing their melting curves (data not shown). Quantitative PCR amplification for all of the caspases included pre-incubation at 94 ℃ for 6 min, followed by 38 cycles at 95 ℃ for 5 s, 57 ℃ for 45 s and 72 ℃ for 30 s, 40 cycles, and then calculated the fold change for all of the samples using the 2-ΔΔCt method for β-actin as the normalization reference[26]. The primer sequences of all tested genes were listed in Table 1.
Genes Forward (5'-3') Reverse (5'-3') Rats β-3-adrenergic receptor TTCCCAGCGGAGTTTTCATC AGCGGGTTGAAGGCAGAGT UCP1 GTGGATGCCTACAGGACCAT ATGAACATCACCACGTTCCA COX AAAGCCTCGTCCAGATGCTA ATGGTGGCTGTCTTGGTAGG PGC-1α TGCAGGCCTAACTCCTCCCAC AATAGGCCATCCATGGCTAGTCC cAMP GTCAGGTCATCACTATCGGCAAT AGAGGTCTTTACGGATGTCAACGT β-actin CTACAATGAGCTGCGTGTGG AAGGAAGGCTGGAAGAGTGC Cells β-3-adrenergic receptor CCTTCAACCCGGTCATCTACTG CGCACCTTCATAGCCATCAAA UCP1 CGATGTCCATGTACACCAAGGA TTGTGGCTTCTTTTCTGCGA COX CCCCCTGCTGCCCGACACCTT CCCCAGCAACCCGGCCAGC PGC-1α GCTTTGAAGTTTTTGGTGAAATTG GCTATGGTTTCATCACCTACCGT β-actin AGCCATGTACGTAGCCATCC TCCCTCTCAGCTGTGGTGGTGAA PPAR-γ GAGATGCCATTCTGGCCCACCACCTTCGG TATCATAAATAAGCTTCAATCGGATGGTTC SREBP-1c ATCGGCGCGGAAGCTGTCGGGGTAGCGTC ACTGTCTTGGTTGTTGATGAGCTGGAGCAT C/EBPa GGTTTTGCTCTGATTCTTGCC CGAAAAAACCCAAACATCCC aP2 AGCATCAAACCCTAGATGGCG CATAAACACATTCCACCACCAGC PTP1B CGGAACAGGTACCGAGATGT GAAGTGCCCACATGTTTTG Table 1. Primers Used in Real-time RT-PCR
-
The primary antibodies against UCP1 (ab10983) were purchased from Abcam (Tokyo, Japan). We extracted the total proteins of the IBAT and EAT using the lysis buffer of a Western or IP assay kit (Shanghai, Chain). We measured the protein content of each sample using the Bradford method. Samples containing 30 μg of protein were incubated for 5 min at 100 ℃ with a 5 × concentrated buffer (250 mmol/L Tris-HCl buffer at pH 6.8, 0.5% bromophenol blue, 50% glycerol, 10% sodium dodecyl sulfate, and 5% 2-ME). We then separated the samples by 10% SDS-PAGE, transferred them to a polyvinylidene fluoride (PVDF) membrane, and blotted them with antibodies against UCP1 and β-actin. Bands were detected using electrochemiluminescence (ECL) reagents (Millipore) according to the manufacturer's instructions. All primary and secondary antibodies were obtained from Abcam (Abcam, Cambridge, MA). ImageJ Program (National Institutes of Health, Maryland) was used to quantify band densities. The UCP1 band intensities were normalized by the β-actin band intensity, and the results were expressed as a relative ratio.
-
Data were presented as mean ± SD (standard deviation) and analyzed using SPSS Statistics software version 17.0 (SPSS, Chicago, IL). One-way analysis of variance (ANOVA) with Tukey range test was employed to identify differences between independent sample groups. Significance was when P-value < 0.05 at 95% confidence. We analyzed all of Western blot analysis pictures and histological studies using ImageJ Program.
Materials and Chemicals
Preparation and Analysis of Chemical Components of LFBE
Identification and Quantification of Polyphenols Compounds Extraction
Cell Culture and Differentiation
Oil Red O Staining
Animals and Treatment
Serum Biochemical Assays
Histological Studies
Mitochondrial Dehydrogenase Activity
Quantitative Real-time RT-PCR
Western Blot Analysis
Statistical Analysis
-
Table 2 presented the main bioactive composition and selected micronutrient contents of LFBE and RBE after 24 h of incubation with L.P. Compared to RBE, the main bioactive composition like total soluble sugar and lipid were decreased by 45.43% and 8.29%, respectively, while total protein and polyphenol compounds (PC, expressed as gallic acid equivalent) was increased by 150.75% and 20.88% respectively after 24 h of incubation with L.P. It seemed that L.P fermentation could markedly alter the content of main bioactive compounds.
Sample Soluble Sugar (%) Protein (%) Lipid (%) Polyphenol Compounds (%) LFBE 35.44 ± 1.57b 34.93 ± 0.23a 1.44% ± 0.30a 1.10 ± 0.06a RBE 64.94 ± 4.00a 13.93 ± 0.33b 1.57% ± 0.28a 0.91 ± 0.02b Note. LFBE, extract of fermented barley with Lactobacillus plantarum dy-1; RBE, extract of unfermented raw barley. The results are expressed as the mean ± SD (n = 3 duplicates). Different letters between LFBE and RBE indicate a significant difference (P < 0.05). Table 2. Main Bioactive Composition in LFBE and RBE (dry-weight)
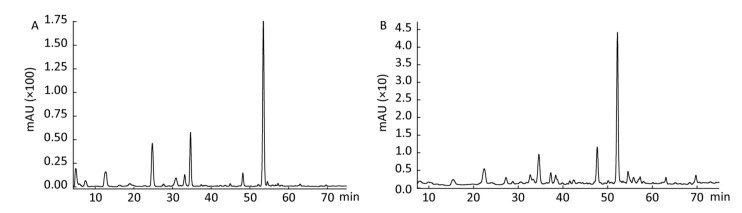
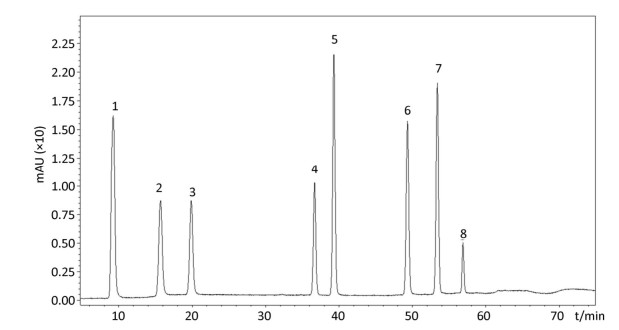
In the follow-up experiments, we focused on extracting, identifying and quantifying the polyphenol compounds. The HPLC analysis of phenolics by comparison with authentic standard compounds was performed. The profile and regression equation of polyphenol compounds were shown in the Supplementary Figure S1 and Supplementary Table S1 (available in www.besjournal.com). The profiles of the extracts of polyphenol compounds of LFBE and RBE were exhibited in the Figure 1. Notably, we found that the ferulic acid and vanillic acid contents of LFBE were much higher than those of RBE (112.79 ± 0.09 vs. 23.52 ± 0.49 μg/g, 117.99 ± 0.04 vs. 22.36 ± 0.30 μg/g, respectively, Supplementary Table S2 available in www.besjournal.com), which was consistent with our previous data[21].
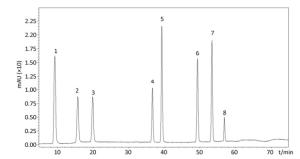
Figure Supplementary Figure S1. Kinds of polyphenol compounds analyzed by HPLC technology. 1. gallic acid; 2. coumaric acid; 3. protocatechuic acid; 4. vanillic acid; 5. caffeic acid; 6. p-Coumaric Acid; 7. ferulaic acid; 8. Rutin.
NO. Retention Time (S) Compounds Regression Equation R2 1 8.3 gallic acid y=8.0 × 10⁻⁸x-0.0021 0.9992 2 15.5 coumaric acid y=1.7 × 10⁻⁷x-0.0012 0.9998 3 20.5 protocatechuic acid y=1.5 × 10⁻⁷x-0.0012 0.9998 4 36.3 vanillic acid y=1.8 × 10⁻⁷x-0.0014 0.9999 5 39.3 caffeic acid y=8.1 × 10⁻⁸x-0.0021 0.9999 6 49.5 p-Coumaric Acid y=5.2 × 10⁻⁸x-0.0008 0.9998 7 55 ferulaic acid y=5.0 × 10⁻⁸x-0.0012 0.9999 8 57.2 rutin y=2.7 × 10⁻⁷x-0.0006 0.9998 Table Supplementary Table S1. Regression Equation of Polyphenol Compounds Through Chromatographic Separation
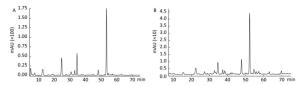
Figure 1. Identification and quantification of polyphenol compounds by HPLC in LFBE (A) and RBE (B).
Parameters Samples Extraction Ratio from Raw Barley without Fermented (%) LFBE (μg/g) RBE (μg/g) Gallic acid 8.30 ± 0.05a 1.98 ± 0.03b Coumaric acid 49.99 ± 2.19a 5.39 ± 0.20b Protocatechuic acid 6.35 ± 0.38a 5.18 ± 0.85b Vanillic acid 117.99 ± 0.04a 22.36 ± 0.30b 1.9 × 10⁻⁵ Caffeic acid 1.31 ± 0.06b 2.27 ± 0.10a p-Coumaric Acid 8.33 ± 0.06a 6.16 ± 0.17b Ferulaic acid 112.79 ± 0.09a 23.52 ± 0.49b 2.0 × 10⁻⁵ Rutin 8.12 ± 0.38a 8.50 ± 0.26a Note. LFBE, extract of fermented barley with Lactobacillus plantarum dy-1; RBE, extract of unfermented raw barley. The results are expressed as the mean ± SD (n = 3 duplicates). Different letters between LFBE and RBE indicate a significant difference (P < 0.05). Table Supplementary Table S2. Contents of Identified Polyphenol Compounds in the LFBE and RBE
-
To investigate the effect of LFBE and PC in the extraction on fat metabolism, we firstly measured their influence on 3T3-L1 preadipocytes by Oil-Red-O method. After quantification of the intensity by Image J, results showed that LFBE treatment significantly decreased the fat accumulation of 3T3-L1 preadipocytes by 32.01%, 38.44%, and 58.0% compared to control at 100, 200, and 400 μg/mL, respectively (Figure 2A). However, the RBE showed no effect on the fat accumulation of 3T3-L1 preadipocytes (Figure 2B). These results were in accordance with our previous study[21].
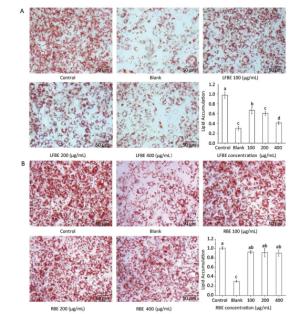
Figure 2. The effects of LFBE (A) and RBE (B) on 3T3-L1 adipocyte differentiation (×200). Data are expressed as the mean ± SD. Different letters indicate significant differences among groups (n = 3 duplicates, P < 0.05).
In the followed experiment, the total polyphenol compounds in the LFBE exhibited dramatic anti-lipogenic effects in a manner of dosage-dependant (Figure 3A). In addition, ferulic acid and vanillic acid isolated from LFBE using HPLC also held the abilities to decrease fat accumulation at the concentration of 0.3, 0.6, and 1.2 μg/mL equivalent in the total polyphenol compound in the LFBE (Figure 3B and C).
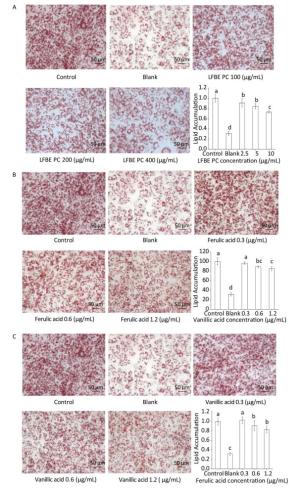
Figure 3. Effects of LFBE PC (A), ferulic acid (B), and vanllic acid (C) in different concentrations on the differentiation of 3T3-L1 preadipocyctes (×200). Data are expressed as the mean ± SD. Different letters indicate significant differences among groups (n = 3 duplicates, P < 0.05).
-
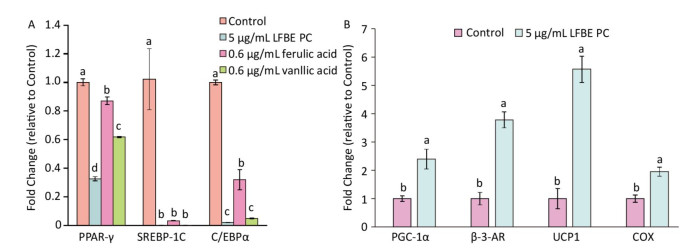
In order to research the effect of PC in LFEB on lipid metabolism, we induced 3T3-L1 preadipocytes by PC and studied the genes expression profiles which controlled fat synthesis and browning of 3T3-L1 preadipocytes. As showed in Figure 4A, the genes expression levels of peroxisome proliferator- activated receptor-γ (PPAR-γ), sterol regulatory element binding protein 1 c (SREBP-1C) and CCAAT/enhancer binding protein α (C/EBPα) were dramatically decreased by LFBE PC, ferulic acid and vanillic acid compared to modeling group without treatment. Additionally, vanillic acid seemed to work better than ferulic acid and similar to the total polyphenol compound in the LFBE.
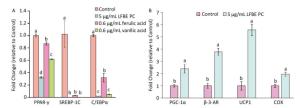
Figure 4. Effect of LFBE PC on the mRNA expression of genes associated with lipid metabolism during differentiation of 3T3-L1 adipocytes. (A) Expression of genes (PPAR-γ, SREBP-1C, and C/EBPα) related with lipid synthesis were regulated by LFBE PC, ferulic acid and vanllic acid. (B) Expression of genes (PGC-1α, β-AR, UCP1, and COX) related with lipid browning were regulated by LFBE PC. Data are expressed as the mean ± SD (n = 3 duplicates). Different letters indicate significant differences among groups (P < 0.05).
As shown in Figure 4B, the genes expression levels of peroxisome proliferator-activate receptor-γ coactivator 1α (PGC-1α), β-3-adrenergic receptor (β-3-AR), UCP1 and cytochrome c oxidase (COX) were notably increased by LFBE PC compared to modeling group, especially the expression of UCP1. Taken together, the PC in the LFEB may be the main bioactive compounds that inhibited fat synthesis and promoted browning of 3T3-L1 preadipocytes of 3T3-L1 preadipocytes.
-
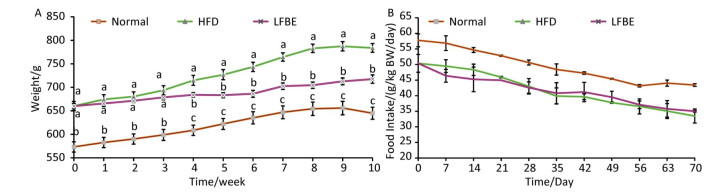
Figure 5 outlined the change trend of mean body weight and food intake during the 10-week treatment. During the first 3 weeks, the weight of the rats in the LFBE group increased slightly. From the 4th week to the 10th week, the LFBE group exhibited a significantly lower body weight than the HFD group (P < 0.05, Figure 5A).
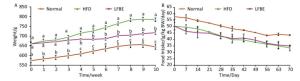
Figure 5. Development of body weight (A) and food intake (B) of all rats in Normal, HFD and LFBE groups during the 10-week experimental period. Data are expressed as the mean ± SD (n = 8 rats per group). Different letters indicate significant differences (P < 0.05).
During the experimental period, the food intake of the rats in the LFBE group was slightly lower than that of the HFD group, but didn't have significant difference (Figure 5B). This indicated that LFBE inhibiting the sharp increase of body weight may not be ascribed to less food intake.
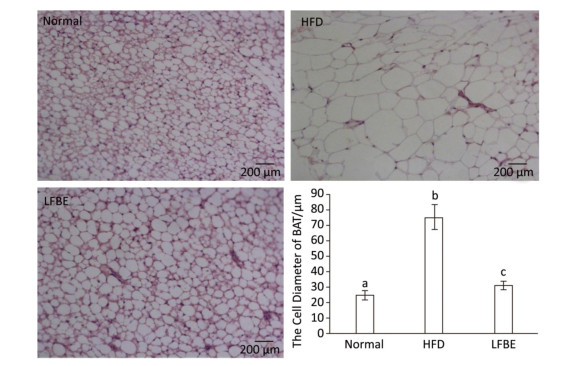
When expressed as a percentage of body weight, the EAT and AAT weighed remarkably higher in the HFD rats than the normal rats (Table 3). Additionally, the weights of EAT and AAT were significantly reduced in the LFBE group relative to the HFD group (P < 0.05). For IBAT weight, the HFD group showed slightly lower than normal group while the IBAT weight was obviously increased in the LFBE group compared to the HFD group (P < 0.05, Table 3). Furthermore, the size of IBAT cells were larger in the HFD group than in the normal group, and the LFBE group exhibited a significant decrease in the cell size (Figure 6). Taken together, these results suggested that LFBE may inhibit the progression of obesity via increasing BAT mass.
Item Normal HFD LFBE TG (mmol/L) 1.13 ± 0.11c 3.71 ± 0.50a 2.51 ± 0.43b TC (mmol/L) 1.73 ± 0.28b 2.33 ± 0.35a 1.77 ± 0.18b HDL (mmol/L) 1.08 ± 0.06a 0.86 ± 0.04b 1.04 ± 0.04a LDL (mmol/L) 0.31 ± 0.06a 0.32 ± 0.03a 0.16 ± 0.04b Insulin (mU/mL) 28.51 ± 0.35b 31.46 ± 0.46a 26.32 ± 0.95b IBAT (g/100 g) 0.11 ± 0.07a, b 0.10 ± 0.01b 0.17 ± 0.03a EAT (g/100 g) 1.90 ± 0.36b 2.86 ± 0.08a 1.95 ± 0.21b AAT (g/100 g) 1.75 ± 0.08c 6.56 ± 0.47a 3.96 ± 0.50b Note. TG, triacylglycerols; TC, total cholesterol; HDL, high-density lipoproteins; LDL, low-density lipoproteins; IBAT, interscapular BAT; EAT, epididymis adipose tissue; AAT, abdomen adipose tissue. Values are expressed as means ± SD (n = 8 rats per group). Statistical analysis was performed using ANOVA. The means with different superscript were considered significantly different (P < 0.05). Table 3. Tissues Weight and Serum Parameters for Rats in Each Group
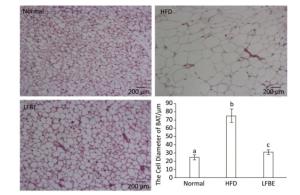
Figure 6. Hematoxylin and eosin (H & E) section of BAT under microscope (×200) in normal, HFD and LFBE groups (0.5 pixels = 1 μm). Data are expressed as the mean ± SD (n = 8 rats per group). Different letters indicate significant differences among groups (P < 0.05).
-
HFD rats showed an increase in the serum triglyceride and cholesterol levels and decrease in the HDL compared to normal rats (Table 3). LFBE significantly decreased the levels of serum triglyceride, cholesterol level and LDL (P < 0.05), and increased the serum HDLC level.
-
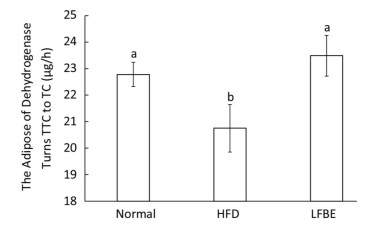
Dehydrogenase is one of the most important respiratory enzymes in the mitochondria, and its activity symbolizes the rate at which ATP is produced[27]. Figure 7 illustrated the dehydrogenase activity among three groups. Results showed that HFD group decreased dehydrogenase activity by 8.90% and LFBE restored the activity by an increase of 13.11% when compared with HFD group (P < 0.05, Figure 7), which meaned that LFBE may enhance more ATP production.
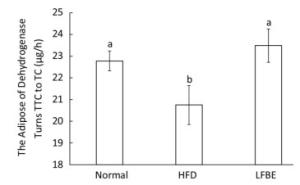
Figure 7. The dehydrogenase activity in BAT mitochondria. Significant differences were observed in the activity of dehydrogenase between HFD and LFBE group. Data are expressed as the mean ± SD (n = 8 rats per group). Different letters indicate significant differences among groups (P < 0.05).
-
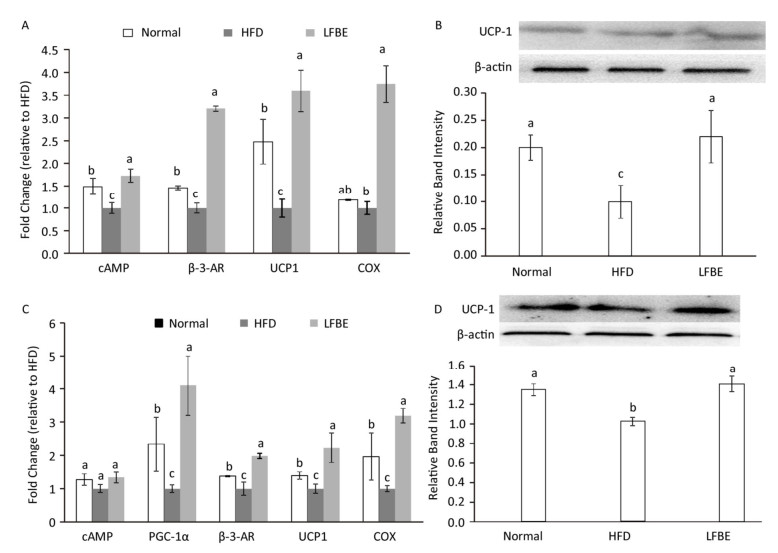
UCP1 is an important gene for BAT thermogenesis and WAT browning. Real-time T-PCR analysis revealed that LFBE intake significantly increased the expression of the UCP1 gene in both EAT and IBAT by 3.59-fold and 2.23-fold, espectively, compared with the HFD group (P < 0.05, Figure 8A and C). The mRNA levels of cyclic adenosine monophosphate (cAMP), β-3-AR and COX in the EAT of LFBE group obviously were higher than HFD group (Figure 8A). Likewise, the mRNA expression of PGC-1α, β-3-AR, UCP1, and COX in the IBAT were significantly increased by LFBE except the cAMP (Figure 8C).

Figure 8. Effects of LFBE on the mRNA expression of brown-specific genes and UCP1 protein level in EAT (A and B) and IBAT (C and D), respectively. Western relative band intensity was measured by Image J software. Data are expressed as the mean ± SD (n = 3 duplicates). Different letters indicate significant differences among groups (P < 0.05).
We further detected the protein levels of UCP1 in the EAT and IBAT (Figure 8B and D). It's well known that the expression of UCP1 in the EAT was lower than that of IBAT[28], which was reinforced by our present study. In the EAT, relative to the normal group, the UCP1 protein level was profoundly lower in the HFD group, which was restored by the supplement of LFBE. Likewise, in the IBAT, LFBE treatment notably induced the improvement of UCP1 protein level compared to the HFD group. Taken together, results revealed that LFBE may potentiate process of the IBAT thermogenesis and EAT browning via activating the UCP1-dependent mechanism to suppress the obesity.
Chemical Composition of LFBE and RBE
LFBE and the PC in the Extraction Decreased the Fat Accumulation in 3T3-L1 Preadipocytes
PC in the LFBE Inhibited Adipogenesis and Potentiated Browning of 3T3-L1 Preadipocytes
Effects of LFBE on Body Weight, Food Intake, Adipose Tissue Weights, and IBAT Cell Size in HFD-fed SD Rats
Effects of LFBE on Serum Parameters
Effects of LFBE on the Dehydrogenase Activity in the Mitochondria
Effects of LFBE on EAT Browning and IBAT Thermogenesis
-
Consistent with previous studies[23], we confirmed the beneficial effects of LFBE rather than RBE on decreasing fat accumulation in the 3T3-L1 preadipocytes, especially the increased polyphenol compounds. This fully showed that fermentation was an excellent tool to improve the barley properties such as bioactivity. What's more, we preliminarily figured out that the PC in the LFBE inhibited the 3T3-L1 preadipocytes differentiation by down-regulating the expression of PPAR-γ, SREBP-1C, and C/EBPα. It is well known that the expression of adipocyte‐specific factors, including PPAR-γ and C/EBPα perform a pivotal role in the control of adipogenesis through the regulation of the expression of their downstream genes such as adipocyte fatty acid‐binding protein 2 (aP2), lipoprotein lipase and adiponectin[29]. And SREBP-1C mainly regulates the biosynthesis of cholesterol and fatty acids[30]. Here we found that vanillic acid and ferulic acid worked similar to the total polyphenol compounds in the LFBE. Thus, we postulated that the increased vanillic acid and ferulic acid isolated from fermented barley might be the main contributor to suppress the adipogenisis. Chin-Lin Hsu[31] has demonstrated that phenolic acids like vanillic acid remarkably caused an inhibition of adipogenesis in the 3T3-L1 adipocytes.
Follow-up vitro studies, we discovered the effect of LFBE PC on up-regulating the genes expression of PGC-1α, β-AR, UCP1, and COX at mRNA level in the 3T3-L1 preadipocytes. Especially the UCP1 gene, which generates heat by uncoupling fuel oxidation from adenosine triphosphate production, is an key indicator to evaluate the browning process in the adipocytes[32, 33], Such as, genes including PGC-1α, β-AR and COX are important transcriptional factors regulating energy metabolism in the mitochondrial[34, 35]. Taken together, we confirmed that polyphenol compounds extracted from LFBE could inhibit the adipogenesis and potentiate browning of 3T3-L1 preadipocytes via the above molecular targets.
Obviously, LFBE exhibited anti-obesity effects in the present animal study, evidenced by the LFBE-mediated inhibition of increase in body weight and decrease of serum lipid levels without a marked difference in the food intake. To rebalance energy homeostasis in the obese, pharmacological therapies aim to either decrease energy intake or increase energy expenditure[36]. As results showed that there was no difference in the food intake, we further explored whether LFBE treated obesity by increasing energy expenditure. Given its large capacity to dissipate energy, BAT is a potentially promising target to accomplish this[37]. Reports indicated that there were two general strategies for BAT-centered therapies: one was increasing BAT mass and the other was activating BAT[38]. Regarding the former, our data about the ratio of IBAT weight relative to body weight suggested that LFBE significantly improved the mass of IBAT of obese rats. As we all know that obese subjects have significantly less active BAT than do lean people[5].
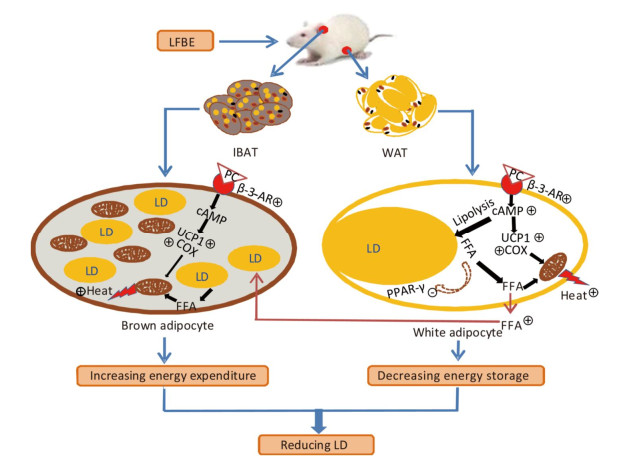
Another alternative approach to increase BAT mass is to enhance the browning of WAT (Figure 1). Different WATs, such as subcutaneous WAT and the epidydimal WAT (EAT), exhibit a varying capacity for browning, i.e., they have propensity to be inducible BAT via browning[39, 40]. Kopecky et al. demonstrated that the body weight and WAT mass in obese mice which over-expressed UCP1 in WAT by transgenic method were reduced[41]. Referred to Hiroki's study[42], a designed diet containing barley induced changes in UCP1 expression in WAT of bovine. Similarly, our results showed that the expression of UCP1 at protein level was augmented by the administration of LFBE in the EAT, which inferred that LFBE could dissipate stored energy in the EAT by inducing browning. Additionally, cAMP, an key second messenger, which was increased by LFBE, induces translocation of the lipase to the surface of lipid droplets and enhances its catalytic activity[43]. Then the released free fatty acids are then shuttled into mitochondria, where they activate UCP1. β-3-AR and cAMP, which were closely related with the UCP1-mechanism, assumed signal-reception and signal-transduction roles in the mechanism, respectively[35, 44]. Likely, the increased COX gene level and dehydrogenase activity related to mitochondrial oxidative phosphorylation confirmed that LFBE certainly improved the mitochondrial function. In summary, LFBE exhibited potential benefits to enhance the browning process of WAT, as well in the 3T3-L1 preadipocytes.
With respect to the above latter strategy (that is activating BAT), this was reinforced in our study. Activated BAT has beneficial effects on metabolic health and counteracts hyperlipidemia, obesity, and diabetes, at least in mice[45]. Same with the EAT, the UCP1 protein level was notably up-regulated by LFBE, that was to say LFBE might activate the BAT through UCP1 mechanism. Furthermore, real-time PCR data indicated that the mRNA level of PGC-1α gene was striking augmented by LFBE. PGC-1α gene, which plays an important role in the regulation of anti-apoptosis through increasing mitochondrial activity, oxidative stress, and fatty acid oxidation[46, 47], suggesting that LFBE promoted the consumption of lipid and glucose in BAT, and improved the glycolipid metabolism of rats.
Certainly, except the huge alteration in the polyphenol compounds of the LFBE compared to RBE, the changes of total protein were also observed in the chemical component analysis. Therefore, this is the major limitation in our present study and further studies may be necessary to run the identification and quantitative analysis of protein extraction from LFBE. And we need to evaluate whether the protein extraction exerts the positive effects on the EAT browning and IBAT thermogenesis, so that we can elucidate the mechanism of the anti-obesity effects of LFBE more comprehensively.
-
In summary, although barley has been well known to have abundant bioactive functions, fermented barley with L.P dy-1 was initially studied in our present research for its anti-obesity effects by activating BAT and promoting WAT browning through a UCP1-dependent mechanism (Figure 9). What's more, PC in LFBE may be partly responsible for inhibiting fat accumulation and promoting browning in vitro and vivo. The precise mechanisms underlying this process were required future research. Based on our data, LFBE has potential as a functional food supplement with a role in managing human obesity and obesity-related diseases.

Figure 9. A model illustrates the conceivable mechanism about the bioactive components in LFBE promoting BAT thermogenesis and WAT browning. β-3-AR activated by bioactive components in LFBE, which might be ferulic acid and vanillic acid, increases cAMP level. cAMP works as signal transmitter and improves UCP1 and COX levels. Mitochondrion is adjusted by UCP1 to utilize energy to produce heat. Abbreviations: LFBE, An extract of fermented barley with Lactobacillus plantarum dy-1; BAT, interscapular brown adipose tissue; WAT, white adipose tissue; β-3-AR, β-3-adrenergic receptor; cAMP, cyclic adenosine monophosphate; UCP1, uncoupling protein 1; COX, cytochrome c oxidase; LD, Lipid drop; FFA, free fatty acid.
-
HDF, high fat diet; PGC-1α, peroxisome proliferator-activate receptor-γ coactivator 1α; β-3-AR, β-3-adrenergic receptor; COX, cytochrome c oxidase; cAMP, cyclic adenosine monophosphate; PPAR-γ, peroxisome proliferator-activated receptor-γ; SREBP-1C, sterol regulatory element binding protein 1c; C/EBPα, CCAAT/enhancer binding protein α; D2, 2 iodothyronine deiodinase.
-
We also appreciate the Laboratory Animal Research Center of Jiangsu University. We also hank our colleagues at the School of Food and Biological Engineering who provided assistance with this study.
-
No potential conflict of interest was reported by the authors.
-
Conceived and designed the experiments: DONG Ying, XIAO Xiang, ZHANG Jia Yan, BAI Juan, SUN Xin Juan. Performed experiments, analyzed date, prepared illustration and wrote the manuscript: XIAO Xiang.
the National Natural Science Foundation of China 31701598
the National Natural Science Foundation of China 31371760

 Quick Links
 DownLoad: