

 下载:
下载:


-
Metabolic syndrome is one of the most serious and prevalent non-communicable chronic diseases in humans. The syndrome is characterized by a group of metabolic abnormalities resulting in abdominal obesity, dyslipidemia, hyperglycemia, and hypertension[1]. It is evident that the development of obesity is caused by a disorder of lipid metabolism and glucose homeostasis[2]. Moreover, these are often accompanied by oxidative stress, insulin resistance, and low-grade inflammation, characterized by changes in biochemical markers of inflammation and the activation of some proinflammatory signaling pathways[3-5]. Dietary fat and free fatty acids are known to impair insulin sensitivity, enhance hepatic glucose production, and activate inflammatory cascades[6]. Thus, glucose content is an important tissue and cell marker of obesity and hyperglycemia. Many bioactive substances, such as litchi pulp extracts[7], flavonoids from Tetrastigma obtectum[8], and berberine[9], have been shown to enhance glucose consumption in hepatocellular carcinoma (HepG2) cells.
An excellent source of phenolic compounds, barley is a cereal often associated with beneficial health effects[10-11]. Phenolic acids are associated with a low risk for chronic diseases[12]. The content of phenolic acid in cereal grains is comparable with or even higher than that found in fruits, berries, and vegetables. However, little attention has been paid to the health benefits of cereal consumption attributed to their high content of phenolic acids[13-14]. Phenolic acids in cereals are mostly present in bound form through ester bonds to arabinoxylan chains or through ether bonds to lignin[15]. However, fermentation of flours from whole grain barley with lactic acid bacteria can significantly increase the content of free phenolic acids[12]. In addition, Seo et al. showed that phenolic compounds, including coumaric acid (CA) and ferulic acid (FA), in aqueous extracts of hulled barley inhibit adipogenesis in vitro and obesity in vivo[16]. It is predicted that phenolic acids will play an important role in preventing obesity and related diseases.
MicroRNAs (miRNAs or miRs) are short non-coding RNA, only 18-25 nucleotides in length. It has been demonstrated that miRNAs may regulate cellular gene expression at the transcriptional or post-transcriptional level, by suppressing translation of protein coding genes or cleaving target mRNAs to induce their degradation, through imperfect pairing with target mRNAs[17]. In addition, miRNAs play important regulatory roles in many physiological processes, like regulating cell viability, embryonic development, lipid metabolism, inflammatory responses, and autoimmunity. Some miRNAs have been proposed to be associated with obesity, such as miR-375, miR-34a, miR-122, and so on[18-20]. Further, miR-34a is the most highly elevated hepatic miRNA in obese mice and is also substantially elevated in patients who have steatosis[19]. It had the benefit of exercise and miR-212 downregulation in preventing nonalcoholic fatty liver disease by targeting fibroblast growth factor[21]. However, the potential of miRNAs to mediate the protective effects of phenolic acids against obesity remains largely unknown.
In our previous study, LFBE significantly prevented body weight gain and fat mass increase and improved lipid profiles and glucose tolerance in male rats with high-fat-diet-induced obesity. We also demonstrated that hepatic miR-212 is upregulated in high-fat-diet-fed rats. In this study, we used HepG2 cells to explore whether fermented barley extract and phenolic acids increased glucose consumption and reduced proinflammatory cytokine secretion. Moreover, the contribution of miR-212 to the occurrence of palmitate-reduced glucose consumption (insulin resistance) was studied. Fermented barley extract and phenolic acids with significant effects on glucose consumption may have a potential role in the prevention of obesity.
-
Hulled barley (Yang si mai 3) was purchased from Yan Cheng of China. The moisture, ash, and fat contents were determined according to the approved methods of the American Association of Cereal Chemists. The selected Lactobacillus strain was Lactobacillus plantarum dy-1, which had been previously isolated and assigned preservation number CGMCC NO. 6016 in the database of the Chinese Common Microbe Bacterial Preservation Administration Center. Fetal bovine serum and Dulbeccoa's modified Eaglea's medium (DMEM) were purchased from GIBCO. CA, FA, gallic acid (GA), caffeic acid (CFA), and vanillic acid (VA) were purchased from Sigma-Aldrich, Inc. (Supelco, Bellefonte, USA). All of the other reagents and solvents were purchased from Sinopharm Chemical Reagent Co. Ltd. (Shanghai, China) and were of either analytical or chromatographic grade.
-
Two hundred grams of barley powders, 1.4 L of distilled water, and logarithmic-phase Lactobacillus plantarum dy-1 (viable count reached 4 × 10⁸ cfu/mL) were shaken and incubated at 30 ℃ under aerobic conditions for 24 h in a microbiological incubator. After fermentation, the solution was centrifuged at 12, 000 g for 15 min at 4 ℃ using a refrigerated centrifuge (Jouan, France), then the supernatant was freeze-dried into a powder (LFBE) using a vacuum freeze dryer (Marin Christ, Germany). In addition, for the unfermented barley, 200 g of powder were extracted with 1.4 L of distilled water at room temperature for 3 h on Air bath thermostat oscillator (100 r/min). The supernatant was collected by centrifugation and then freeze-dried into a powder (RBE) under the same conditions as the fermented barley.
-
For the identification of polyphenols in LFBE, the major phenolic acids were extracted. The 50% methanol solution extract was concentrated in a rotary evaporator at 40 ℃. The concentrated extract was redissolved in 5 mL 25% methanol and filtered through a 0.45-µm membrane filter. Then, a rapid- separation high-performance liquid chromatography (HPLC) system (Shimadzu Corp., Kyoto, Japan) equipped with a photo-diode array (PDA) was used for analysis, identification, and quantification of phenolic acids. Specific parameters were performed as previously described[22].
-
Human HepG2 cells were used for experimentation and obtained from the Shanghai Institutes for Biological Sciences (SIBS) of the Chinese Academy of Sciences (CAS). The cells were cultured in monolayers up to 80% confluence in DMEM supplemented with 10% heat-inactivated fetal calf serum and 1% penicillin/streptomycin at 37 ℃ in a humidified incubator supplied with 5% CO2. Cell counts were determined using a CC-108 micro-cell counter (Sysmex, Kobe, Japan). Cells in the logarithmic growth phase were used for all the studies described below.
-
HepG2 cells were cultured in high-glucose DMEM supplemented with 10% FBS. After confluence, cells were cultured in 96-well culture plates in high-glucose DMEM supplemented with 10% FBS for 24 h and then treated with 0.15 mmol/L palmitate for 12 h in serum-free and phenol red-free high-glucose DMEM. Cells were then washed twice with each of high-glucose DMEM and PBS. Serum-free and phenol red-free high-glucose DMEM with the test compounds at various concentrations was added to the cells, which were incubated for 24 h. After this incubation, the glucose content in the culture medium was measured by the glucose oxidase method using a glucose assay kit. In this way, the effect of the test compounds on glucose consumption in HepG2 cells was studied. Glucose consumption = glucose concentrations of blank wells - glucose concentrations in plated wells.
-
Approximately 2 × 10⁷ HepG2 cells were lysed in TRIzol Reagent. Total RNA was prepared according to the manufacturera's instructions (Takara, Japan). The concentration of purified RNA was estimated by measuring the absorbance at 260/280 nm in a UV spectrophotometer (Bio-Rad Laboratories, USA). Purified RNA of each sample was used for cDNA synthesis using the PrimeScript® RT Master Mix (Takara, Japan). To analyze mRNA by RT-PCR, the first-strand cDNA was synthesized according to the manufacturera's instructions. Experimental reactions containing 25 µL of SYBR Green PCR Master Mix (Takara, Japan) were performed using north tube plates. Quantitative PCR was conducted on the iCycler according to the SYBR Green method. Forward and reverse primers (IL-6, IL-1β, MCP-1, TNF-α) were designed using the tools available on the MIT Whitehead Institute website. PCR conditions were 94 ℃ for 6 min followed by 40 cycles of amplification consisting of 95 ℃ for 5 s, 57 ℃ for 45 s, and 72 ℃ for 30 s. The relative expression of mRNA was calculated using the 2-ΔΔCt method.
MicroRNA-212 was carried out using a MicroRNA Assay kit (Tiangen Biotech, Beijing, China). Reactions were incubated at 95 ℃ for 10 min, followed by 40 cycles at 95 ℃ for 10 s and 60 ℃ for 60 s on an ABI PRISM 7900 system (Applied Biosystems, Foster City, USA). The U6 small nuclear RNA was used as an internal control.
-
MiR-212 mimic, miR-212 inhibitor (anti-miR-212) and their negative controls (NC) were synthesized by Viewsolid Biotech (Beijing, China). HepG2 cells were maintained in DMEM supplemented with 10% fetal bovine serum (FBS) at 37 ℃ in a humidified incubator with 5% CO2. Cells (1 × 10⁵) were transfected with either 20 nmol/L miR-212 mimic (5a'-UUCUCCGAACGUGUCACGUTT-3a'), 20 nmol/L miR-212 inhibitor (5a'-ACGUGACACGUUCGGAGAAT T-3a') and NC using LipofectamineTM 2000 (Sigma) according to the manufacturera's instructions. At 12 h post-transfection, the transfected cells were transferred into normal growth medium. The transfection efficiency was evaluated by real-time PCR and fluorescence microscopy. After transfection for 12 h, inflammatory cytokines produced by the cells were analyzed by real-time PCR.
-
A region of a fragment encompassing the 3a'-UTR of DUSP9 containing the seeding sequences for has-miR-212 was amplified by PCR from genomic DNA and then inserted into the PGL3-3a'-UTR dual luciferase reporter plasmid (Promega, Madison, WI, USA) to generate the reporter construct (shRNA- hsa-miR-212-3p). Mutagenesis of the reporter plasmids was carried out with the QuikChange site-directed mutagenesis kit (Stratagene, La Jolla, CA). All constructs were confirmed by DNA sequencing. After 24 h of transfection, the cells were harvested for firefly and Renilla luciferase activity assay. Renilla luciferase activities were used to normalize those of firefly luciferase, correcting for the transfection efficiency.
-
Cells were lysed using cell lysis buffer [20 mmol/L Tris, pH 7.5, 150 mmol/L NaCl, 1% Triton X-100, 2.5 mmol/L sodium pyrophosphate, 1 mmol/L EDTA, 1% Na3VO4, 0.5 µg/mL leupeptin, 1 mmol/L phenylmethanesulfonyl fluoride (PMSF)]. The lysates were collected and then centrifuged at 10, 000 ×g at 4 ℃ for 5 min. The supernatants were collected, assayed for protein concentration by BCA protein assay, aliquoted, and stored at -80 ℃ until use for western blot analyses. Briefly, proteins (30 µg) were subjected to SDS-PAGE on 10%-12% Tris-glycine gels. The separated proteins were transferred onto PVDF membrane (Millipore) and probed with Dusp-9, JNK, p-JNK, P38, and p-P38 antibodies (Abcam Inc., Cambridge, MA, USA) using the appropriate peroxidase-conjugated secondary antibody (Abcam Inc., Cambridge, MA, USA). Signals were visualized using the Chemiluminescence HRP detection system (Millipore) and the VersaDoc imaging system (Bio-Rad). Membranes were stripped and re-probed with a β-actin antibody (Abcam Inc., Cambridge, MA, USA).
-
All of the statistical analyses were accomplished by using SPSS Statistics software version 17.0 (SPSS, Chicago, IL, USA). Analysis of variance (ANOVA) was used to test for differences between the means.
-
HPLC analysis followed by individual identification of compounds by comparison with authentic standard compounds was performed. Five compounds were identified: coumaric acid (CA), ferulic acid (FA), gallic acid (GA), caffeic acid (CFA), and vanillic acid (VA) (Table 1). LFBE exhibited significantly higher VA and FA contents compared to those of RBE, which correlated well with the stronger biological actions of LFBE.
Table 1. Phenolic Acid Contents of RBE and LFBE (dry weight)
Component RBE LFBE GA (µg/g) 1.98 ± 0.08b 8.30 ± 0.08a CA (µg/g) 5.39 ± 0.05b 49.99 ± 0.51a VA (µg/g) 22.35 ± 0.21b 117.99 ± 1.15a CFA (µg/g) 2.27 ± 0.07a 1.31 α 0.02b FA (µg/g) 23.52 ± 0.07b 112.79 ± 1.21a Note. Data are expressed as the mean ± SEM, n = 3. Different letters indicate a significant difference (P < 0.05). RBE: aqueous extract of unfermented raw barley; LFBE: aqueous extract of fermented barley with Lactobacillus plantarum dy-1; CA: coumaric acid; GA: gallic acid; VA: vanillic acid; CFA: caffeic acid; FA: ferulic acid. -
In the present study, LFBE and RBE were tested for their effects on glucose consumption in HepG2 cells. LFBE significantly enhanced glucose consumption in HepG2 cells at concentrations of 50-100 µg/mL (no cytotoxicity) (Table 2). Glucose consumption decreased at high concentrations of LFBE, compared with low and intermediate concentrations, due to its ability to inhibit HepG2 cell growth. However, RBE scarcely increased glucose consumption at all concentrations tested.
Table 2. Effect of LFBE and RBE on Glucose Consumption after 24 h Treatment of HepG2 Cells
Item Control (µg/mL) Model (µg/mL) LFBE (µg/mL) RBE (µg/mL) 0 0 200 100 50 200 100 50 Glucose consumption (mmol/L)a 2.64 ± 0.24a 1.26 ± 0.25d 2.02 ± 0.81b 2.51 ± 0.36a 2.18 ± 0.17b 1.42 ± 0.26c 1.34 ± 0.22cd 1.23 ± 0.13d Note. Data are expressed as the mean ± SEM, n = 8. Different letters indicate a significant difference (P < 0.05). Control: normal cells without palmitate treatment; Model: HepG2 cells treated with palmitate; RBE: aqueous extract of unfermented raw barley; LFBE: aqueous extract of fermented barley with Lactobacillus plantarum dy-1. The effects of FA and VA on glucose consumption in HepG2 cells were also investigated (Table 3). At all concentrations tested from 2 µg/mL to 8 µg/mL, VA showed a significant enhancement of glucose consumption in HepG2 cells (compared with model). FA also enhanced glucose consumption in HepG2 cells, but the effect was not significant. These results indicated that VA showed the greatest enhancement of glucose consumption in HepG2 cells. Therefore, VA may contribute to the glucose-consumption-enhancing activity of LFBE. Since 50-100 µg/mL LFBE did not induce cell toxicity, and 100 µg/mL LFBE enhanced glucose consumption the most, 100 µg/mL LFBE was selected for further studies. At the same time, 2-8 µg/mL VA did not induce cell toxicity, and 4 µg/mL and 8 µg/mL VA had a similar effect on enhancement of glucose consumption activity. Therefore, 4 µg/mL VA was selected for further studies.
Table 3. Effect of FA and VA on Glucose Consumption after 24 h Treatment of HepG2 Cells
Item Control (µg/mL) Model (µg/mL) FA (µg/mL) VA (µg/mL) 0 0 8 4 2 8 4 2 Glucose consumption (mmol/L)a 2.69 ± 0.16a 1.37 ± 0.16e 1.84 ± 0.23cd 1.76 ± 0.23d 1.60 ± 0.21d 2.43 ± 0.41b 2.25 ± 0.16b 2.05 ± 0.21c Note. Data are expressed as the mean ± SEM, n = 8. Different letters indicate a significant difference (P < 0.05). Control: normal cells without palmitate treatment; Model: HepG2 cells treated with palmitate; FA: ferulic acid; VA: vanillic acid. -
Chronic, low-grade inflammation is a major component of obesity[23]. The mRNA expression levels of proinflammatory cytokines (TNF-α, IL-6, IL-1β, etc.) were measured in palmitate-induced HepG2 cells by RT-PCR. As shown in Table 4, compared with the model, the relative mRNA contents of TNF-α were 0.08, 0.07, and 0.52 in HepG2 cells of the control, VA, and LFBE, respectively. Furthermore, the relative mRNA contents of IL-1β were 0.01, 0.01, and 0.09, respectively, and the relative mRNA contents of IL-6 were 0.35, 0.44, and 0.14, respectively. The results showed that palmitate induced changes in inflammatory cytokines, increasing the risk of inflammation. VA and LFBE can significantly reduce the levels of TNF-α, IL-1β, and IL-6.
Table 4. TNF-α, IL-1β, and IL-6 mRNA Expression Analysis in HepG2 Cells
Relative mRNA Expression TNF-α IL-1β IL-6 Control (0 µg/mL) 0.08 ± 0.00c 0.01 ± 0.00c 0.35 ± 0.02c Model (0 µg/mL) 1.00 ± 0.01a 1.00 ± 0.00a 1.00 ± 0.02a VA (4 µg/mL) 0.07 ± 0.00c 0.01 ± 0.00c 0.44 ± 0.02b LFBE (100 µg/mL) 0.52 ± 0.03b 0.09 ± 0.00b 0.14 ± 0.01d Note. Data are expressed as the mean ± SEM, n = 8. Different letters indicate a significant difference (P < 0.05). Control: normal cells without palmitate treatment; Model: HepG2 cells treated with palmitate. -
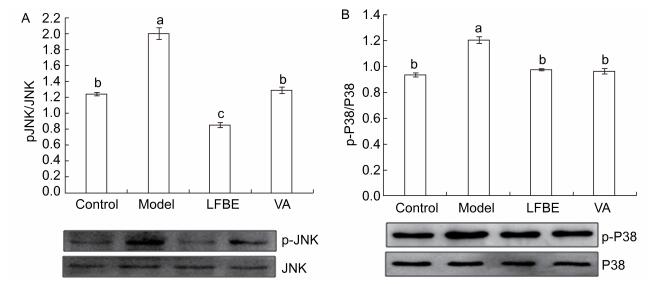
The phosphorylation of mitogen-activated protein kinase (MAPK) plays an important role in activating transcription factors that induce inflammatory gene expression. As shown in Figure 1, LFBE and VA treatment led to a significant reduction in phosphorylation of p38 and JNK1 compared with the model in palmitate-induced HepG2 cells.
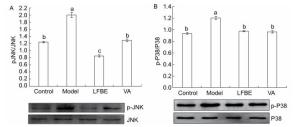
Figure 1. Inhibitory effects of LFBE and VA on phosphorylation of JNK (A) and p38 (B) in HepG2 cells. Results are expressed as relative ratios of band density of phosphorylated forms of p38 and JNK to the respective total proteins. Data are means ± SEM of six replicate experiments. Different letters indicate a significant difference in each figure (P < 0.05). Control: normal cells without palmitate treatment; Model: HepG2 cells treated with palmitate; LFBE: aqueous extract of fermented barley with Lactobacillus plantarum dy-1; VA: vanillic acid.
-
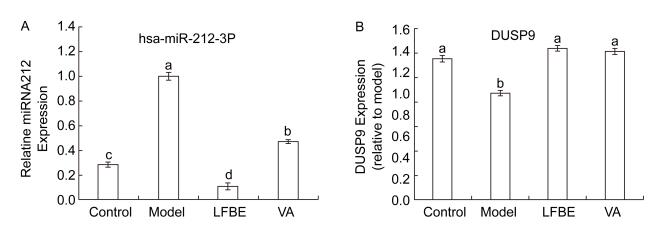
To address how LFBE and VA improve lower levels of glucose improve high levels of glucose and the expression of proinflammatory factors in palmitate-induced HepG2 cells. MiR-212 was upregulated in palmitate-induced HepG2 cells, while the addition of LFBE and VA diminished miR-212 expression relative to the model (Figure 2A). These results prompted us to further clarify the functional and molecular mechanisms of miR-212 dysregulation in glucose consumption and expression of proinflammatory factors. We also measured DUSP9 mRNA levels and confirmed that DUSP9 downregulation was blocked when LFBE and VA treatment increased glucose consumption and reduced proinflammatory cytokine expression (Figure 2B).
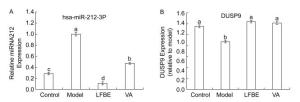
Figure 2. The expression of miR-212 (A) and mRNA expression of DUSP9 (B) in HepG2 cells treated with LFBE and VA. Data are means ± SEM of six replicate experiments. Different letters indicate a significant difference in each figure (P < 0.05). Control: normal cells without palmitate treatment; Model: HepG2 cells treated with palmitate; LFBE: aqueous extract of fermented barley with Lactobacillus plantarum dy-1; VA: vanillic acid.
-
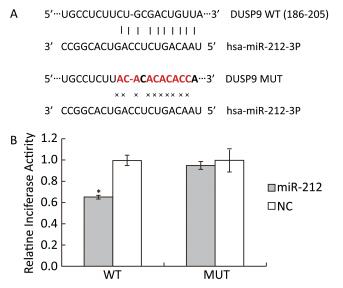
Previously, we found that high-fat-diet-induced downregulation of miR-212 and LFBE effectively prevented the decrease in miR-212 expression induced by a high-fat-diet in obese rats by microarray and RT-PCR in liver (unpublished data). We performed a luciferase reporter assay to identify genes that were targeted by miR-212. As shown in the miRWalk database, DUSP9 is a validated target gene of miR-212, given that DUSP9 is a central regulator contributing to the inflammatory response. To verify that DUSP9 is a true target of miR-212, we generated Renilla luciferase reporter plasmids containing miR-212 binding sites in the 3a'-UTR of DUSP9. Transfection of the miR-212 precursor oligonucleotide significantly reduced luciferase expression from a reporter plasmid that contained the 3a'-UTR of DUSP9 compared with the transfection of control miRNA (Figure 3).
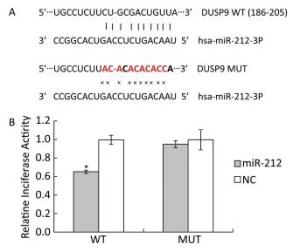
Figure 3. Target validation for miR-212. A: Top, miR-212 and the miR-212-binding site in the 3a'-UTR of DUSP9. Bottom, miR-212 and the mutated miR-212-binding site in the 3a'-UTR of DUSP9. B: Results are shown as the relative luciferase activity for the combination of miR-212 and reporter construct. NC: negative control. Data are means ± SEM of six replicate experiments. *, P < 0.05, compared with corresponding control.
To further determine whether DUSP9 is a validated target gene of miR-212, HepG2 cells were transfected with miR-212 mimics, inhibitor or their NC. As measured by qRT-PCR, miR-212 mimics upregulated, while miR-212 inhibitor downregulated miR-212 levels in HepG2 cells (Figure 4A), confirming that the inhibitors and mimics used in this study are effective. The miR-212 mimics downregulated DUSP9 mRNA and protein levels (Figure 4B and C). By contrast, treatment with the miR-212 inhibitor enhanced the expression of DUSP9 mRNA and protein in HepG2 cells. These data suggest that miR-212 downregulates the expression of DUSP9 by targeting the DUSP9 3a'-UTR to facilitate translational repression or mRNA degradation in HepG2 cells. In addition, to determine whether LFBE and VA directly modulate miR-212, the results presented in Figure 3 were analyzed again. We found that the expression of miR-212 was decreased, and mRNA expression of DUSP9 was increased, by LFBE and VA treatment (Figure 2). Above all, these data confirmed that LFBE and VA modulate miR-212 and clearly indicate that DUSP9 is a target gene of miR-212 involved in palmitate-induced abnormal glucose consumption.
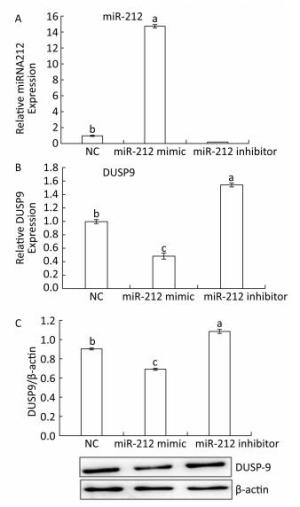
Figure 4. A: The expression of miR-212 in HepG2 cells treated with miR-212 mimic and miR-212 inhibitor. B: The mRNA expression of DUSP9 in HepG2 cells treated with miR-212 mimic and miR-212 inhibitor. C: The protein expression of DUSP9 in HepG2 cells treated with miR-212 mimic and miR-212 inhibitor. NC: negative control. Data are means ± SEM of six replicate experiments. Different letters indicate a significant difference in each figure (P < 0.05).
-
Recently, cereal fermentations have shown significant potential to improve the nutritional quality and increase the health effects of foods and ingredients[24]. Barley fermentation with Lactobacillus plantarum dy-1 can lead to a significant increase of free phenolic acids (mainly VA, FA, GA, and CA), whereas CFA was even reduced in LFBE vs. RBE. Koji (Aspergillus kawauchi) fermentation of barley has been reported to enhance the concentrations of polyphenols[25]. This is further reinforced by fermentation of barley with probiotic LAB strains, which can significantly increase the content of free phenolic acids, thereby improving the nutritional value of the grain[18]. More detailed studies of the changes in microbial populations and the activities of relevant enzymes during fermentation of barley are required to determine the mechanisms that improve the nutritional value of barley upon fermentation[26]. Hepatocellular carcinoma (HepG2) cells, which possess the same bioactivity as normal hepatic cells, are valuable for investigating liver-associated functions and stable during many passages[8]. Previous studies have shown that palmitate can indirectly phosphorylate JNK, cause the abnormal phosphorylation of IRS and AKT, block insulin signaling pathways, activate a series of inflammatory processes, and reduce glucose consumption in hepatocytes[27-28]. Therefore, palmitate-induced HepG2 cells have been used as a model to study the effects of LFBE on glucose consumption and proinflammatory cytokine secretion, and miRNA-212 contributes to the occurrence of palmitate-induced abnormal glucose consumption.
In the present study, we examined the role of miRNAs in palmitate-induced abnormal glucose consumption by using HepG2 cells as a model. We demonstrated that miR-212 expression was increased in HepG2 cells. Amelioration of glucose consumption, proinflammatory cytokines (TNF-α, IL-6, IL-1β), and phosphorylation of JNK and P38 protein in HepG2 cells by LFBE was accompanied by the normalization of miR-212 expression levels. DUSP9 was one of the targets of miR-212, and it was directly and inversely regulated by miR-212.
We found that LFBE rich in VA can markedly increase glucose consumption and reduce the secretion of proinflammatory cytokines in HepG2 cells. Elevated levels of free fatty acids and cytokines, such as TNF-α, IL-6, IL-1β, are involved in this process by activating stress pathways that impede insulin signaling and lead to a decreased insulin response[29]. TNF-α, IL-1β, and IL-6 overexpression induces insulin resistance and human obesity[29]. Studies have shown that abundant polyphenols possess anti-oxidative and anti-inflammatory properties[30]. A VA derivative was reported to inhibit PTP1B activity, reduce the interference in insulin-signaling proteins, and lead to the alleviation of insulin resistance in type2 diabetes mellitus patients[31]. VA also significantly down-regulated hepatic inflammation-related proteins, including cyclooxygenase-2 and monocyte chemoattractant protein-1 expression in high-fat-diet-fed rats[32].
Furthermore, we also observed that LFBE rich in VA regulated two important transcription factors, JNK1 and p38. The c-Jun NH2-terminal kinases (JNK1) are members of the MAPK superfamily. Inflammation is thought to be an important driver of diet-induced obesity and insulin resistance, and JNK1 is a central player in this process[33]. Modulation of hepatic JNK1 in adult animals also produces systemic effects on glucose metabolism, which underscores the importance of this pathway in the liver[34]. p38 is also a vital member of the MAPK family. The p38 MAPK family is another sub-group of the MAPK superfamily and is closely associated with inflammation[35]. Recent evidence suggests that the phosphorylation of JNK and p38 plays an important role in activating transcription factors that induce inflammatory gene expression[30].
Recent studies confirmed that miRNAs act as key regulators of signal transduction in diverse diseases[36]. MiRNAs may have an important role in obesity; we observed that miRNA-212 expression patterns were upregulated in HepG2 cells. When glucose consumption was ameliorated by LFBE and VA, the expression of miRNA-212 was recovered. In fact, miR-212 dysregulation has previously been reported in non-alcoholic fatty liver disease[22]. Several studies have shown that overexpressing miR-132 and/or miR-212 increase glucose-stimulated insulin secretion[37]. To our knowledge, we are the first to reveal the potential role of miR-212 in glucose consumption, which may be used as a therapeutic tool for managing obesity and obesity-related diseases.
A target study revealed that DUSP9 was a direct target of miR-212. DUSP9 is an interesting candidate for the regulation of the stress responses involved in obesity and insulin resistance. DUSP9 reversed the effect of TNF-α to alter IL-6, Glut1, and Glut4 expression and inhibit insulin-stimulated glucose uptake in 3T3-L1 adipocytes[37]. Overexpression of DUSP9 in the liver of ob/ob mice decreased ERK and JNK phosphorylation, leading to a reduction in fed and fasted glycemia, improved glucose intolerance, decreased expression of gluconeogenic and lipogenic genes, and reduced hepatic steatosis[38]. DUSP9 is a strong negative regulator of transcription factor activating kinases (ERK, JNK, and p38) in the MAPK pathways[39]. DUSP9 may improve hypercholesterolemia by upregulating SREBP2 and LDL levels and decreasing hepatic glucose output and fasted glucose levels in C57 mice with high-fat-diet-induced insulin resistance[40]. The upregulation of miR-212 and downregulation of DUSP9 in HepG2 cells led to a decrease in glucose consumption and an increase in proinflammatory cytokine secretion. We demonstrated that the miR-212 inhibitor increased DUSP9 mRNA and protein levels.
We also demonstrated that LFBE increased glucose consumption and reduced proinflammatory cytokine secretion in HepG2 cells by downregulating miR-212. VA in LFBE was well regulated for glucose consumption in HepG2 cells and can be seen as a primary mediator. We identified DUSP9 as a novel target of miR-212. We also revealed that the miR-212 inhibitor can increase glucose consumption and reduce proinflammatory cytokine secretion in HepG2 cells. Given the promising preclinical findings presented in this study, we suggest that LFBE rich in VA possesses great potential for preventing obesity.
-
The authors declare no conflict of interest.
-
ZHANG Jia Yan designed the study, assisted in animal experiments, collected test data, interpreted the results, and wrote the manuscript. XIAO Xiang interpreted the results and revised the manuscript. DONG Ying designed the study, interpreted the results, and wrote the manuscript. ZHOU Xing Hua collected test data and drafted the manuscript. All authors agreed to the final content.
doi: 10.3967/bes2018.091
Fermented Barley Extracts with Lactobacillus plantarum dy-1 Rich in Vanillic Acid Modulate GlucoseConsumption in Human HepG2 Cells
-
Abstract:
Objective To investigate the effect of fermented barley extracts with Lactobacillus plantarum dy-1 (LFBE) for modulating glucose consumption in HepG2 cells via miR-212 regulation. Methods Hepatocellular carcinoma (HepG2) cells were treated with palmitate. After 12 h, palmitate-induced HepG2 cells were treated with LFBE and its main components. Changes in glucose consumption, proinflammatory cytokine secretion, and miRNA-212 expression in HepG2 cells was observed. Results Treatment with LFBE rich in vanillic acid (VA) increased glucose consumption and reduced proinflammatory cytokine secretion in HepG2 cells. LFBE and VA normalized the upregulation of miR-212, which led to the upregulation of dual-specificity phosphatase-9 (DUSP9), a direct target of miR-212, at both protein and mRNA levels. Downregulation of miR-212 markedly increased glucose consumption and reduced proinflammatory cytokine secretion by enhancing DUSP9 expression. Conclusion The results showed the benefit of LFBE and miR-212 downregulation in modulating glucose consumption and reducing proinflammatory cytokine secretion by targeting DUSP9. VA in LFBE was a strong regulator of palmitate-induced abnormal glucose consumption in HepG2 cells and can be a primary mediator. -
Key words:
- Fermented barley extract /
- Vanillic acid /
- Glucose consumption /
- HepG2 /
- Dual-specificity phosphatase-9
-
Figure 1. Inhibitory effects of LFBE and VA on phosphorylation of JNK (A) and p38 (B) in HepG2 cells. Results are expressed as relative ratios of band density of phosphorylated forms of p38 and JNK to the respective total proteins. Data are means ± SEM of six replicate experiments. Different letters indicate a significant difference in each figure (P < 0.05). Control: normal cells without palmitate treatment; Model: HepG2 cells treated with palmitate; LFBE: aqueous extract of fermented barley with Lactobacillus plantarum dy-1; VA: vanillic acid.
Figure 2. The expression of miR-212 (A) and mRNA expression of DUSP9 (B) in HepG2 cells treated with LFBE and VA. Data are means ± SEM of six replicate experiments. Different letters indicate a significant difference in each figure (P < 0.05). Control: normal cells without palmitate treatment; Model: HepG2 cells treated with palmitate; LFBE: aqueous extract of fermented barley with Lactobacillus plantarum dy-1; VA: vanillic acid.
Figure 3. Target validation for miR-212. A: Top, miR-212 and the miR-212-binding site in the 3a'-UTR of DUSP9. Bottom, miR-212 and the mutated miR-212-binding site in the 3a'-UTR of DUSP9. B: Results are shown as the relative luciferase activity for the combination of miR-212 and reporter construct. NC: negative control. Data are means ± SEM of six replicate experiments. *, P < 0.05, compared with corresponding control.
Figure 4. A: The expression of miR-212 in HepG2 cells treated with miR-212 mimic and miR-212 inhibitor. B: The mRNA expression of DUSP9 in HepG2 cells treated with miR-212 mimic and miR-212 inhibitor. C: The protein expression of DUSP9 in HepG2 cells treated with miR-212 mimic and miR-212 inhibitor. NC: negative control. Data are means ± SEM of six replicate experiments. Different letters indicate a significant difference in each figure (P < 0.05).
Table 1. Phenolic Acid Contents of RBE and LFBE (dry weight)
Component RBE LFBE GA (µg/g) 1.98 ± 0.08b 8.30 ± 0.08a CA (µg/g) 5.39 ± 0.05b 49.99 ± 0.51a VA (µg/g) 22.35 ± 0.21b 117.99 ± 1.15a CFA (µg/g) 2.27 ± 0.07a 1.31 α 0.02b FA (µg/g) 23.52 ± 0.07b 112.79 ± 1.21a Note. Data are expressed as the mean ± SEM, n = 3. Different letters indicate a significant difference (P < 0.05). RBE: aqueous extract of unfermented raw barley; LFBE: aqueous extract of fermented barley with Lactobacillus plantarum dy-1; CA: coumaric acid; GA: gallic acid; VA: vanillic acid; CFA: caffeic acid; FA: ferulic acid.  下载: 导出CSV
Table 2. Effect of LFBE and RBE on Glucose Consumption after 24 h Treatment of HepG2 Cells
Item Control (µg/mL) Model (µg/mL) LFBE (µg/mL) RBE (µg/mL) 0 0 200 100 50 200 100 50 Glucose consumption (mmol/L)a 2.64 ± 0.24a 1.26 ± 0.25d 2.02 ± 0.81b 2.51 ± 0.36a 2.18 ± 0.17b 1.42 ± 0.26c 1.34 ± 0.22cd 1.23 ± 0.13d Note. Data are expressed as the mean ± SEM, n = 8. Different letters indicate a significant difference (P < 0.05). Control: normal cells without palmitate treatment; Model: HepG2 cells treated with palmitate; RBE: aqueous extract of unfermented raw barley; LFBE: aqueous extract of fermented barley with Lactobacillus plantarum dy-1.
下载: 导出CSV
Table 3. Effect of FA and VA on Glucose Consumption after 24 h Treatment of HepG2 Cells
Item Control (µg/mL) Model (µg/mL) FA (µg/mL) VA (µg/mL) 0 0 8 4 2 8 4 2 Glucose consumption (mmol/L)a 2.69 ± 0.16a 1.37 ± 0.16e 1.84 ± 0.23cd 1.76 ± 0.23d 1.60 ± 0.21d 2.43 ± 0.41b 2.25 ± 0.16b 2.05 ± 0.21c Note. Data are expressed as the mean ± SEM, n = 8. Different letters indicate a significant difference (P < 0.05). Control: normal cells without palmitate treatment; Model: HepG2 cells treated with palmitate; FA: ferulic acid; VA: vanillic acid.
下载: 导出CSV
Table 4. TNF-α, IL-1β, and IL-6 mRNA Expression Analysis in HepG2 Cells
Relative mRNA Expression TNF-α IL-1β IL-6 Control (0 µg/mL) 0.08 ± 0.00c 0.01 ± 0.00c 0.35 ± 0.02c Model (0 µg/mL) 1.00 ± 0.01a 1.00 ± 0.00a 1.00 ± 0.02a VA (4 µg/mL) 0.07 ± 0.00c 0.01 ± 0.00c 0.44 ± 0.02b LFBE (100 µg/mL) 0.52 ± 0.03b 0.09 ± 0.00b 0.14 ± 0.01d Note. Data are expressed as the mean ± SEM, n = 8. Different letters indicate a significant difference (P < 0.05). Control: normal cells without palmitate treatment; Model: HepG2 cells treated with palmitate.
下载: 导出CSV
-
[1] Matsuda M, Shimomura I. Increased oxidative stress in obesity:implications for metabolic syndrome, diabetes, hypertension, dyslipidemia, atherosclerosis, and cancer. Obes Res Clin Pract, 2013; 7, e330-41. doi: 10.1016/j.orcp.2013.05.004 [2] Qin N, Chen Y, Jin MN, et al. Anti-obesity and anti-diabetic effects of flavonoid derivative (Fla-CN) via microRNA in high fat diet induced obesity mice. Eur J Pharm Sci, 2016; 82, 52-63. doi: 10.1016/j.ejps.2015.11.013 [3] Xiao H, Xie G, Wang J, et al. Chicoric acid prevents obesity by attenuating hepatic steatosis, inflammation and oxidative stress in high-fat diet-fed mice. Food Res Int, 2013; 54, 345-53. doi: 10.1016/j.foodres.2013.07.033 [4] Masharani UB, Maddux BA, Li X, et al. Insulin resistance in non-obese subjects is associated with activation of the JNK pathway and impaired insulin signaling in skeletal muscle. PLoS One, 2011; 6, e19878. doi: 10.1371/journal.pone.0019878 [5] Shoelson SE, Herrero L, Naaz A. Obesity, inflammation, and insulin resistance. Gastroenterology, 2007; 132, 2169-80. doi: 10.1053/j.gastro.2007.03.059 [6] Zheng JS, Arnett DK, Parnell LD, et al. Genetic variants at PSMD3 interact with dietary fat and carbohydrate to modulate insulin resistance. J Nutr, 2013; 143, 354-61. doi: 10.3945/jn.112.168401 [7] Lv Q, Si M, Yan Y, et al. Effects of phenolic-rich litchi (Litchi chinensis Sonn.) pulp extracts on glucose consumption in human HepG2 cells. J Funct Foods, 2014; 7, 621-9. doi: 10.1016/j.jff.2013.12.023 [8] Jin MN, Shi GR, Tang SA, et al. Flavonoids from Tetrastigma obtectum enhancing glucose consumption in insulin-resistance HepG2 cells via activating AMPK. Fitoterapia, 2013; 90, 240-6. doi: 10.1016/j.fitote.2013.07.024 [9] Yin J, Hu R, Chen M, et al. Effects of berberine on glucose metabolism in vitro. Metabolism, 2002; 51, 1439-43. doi: 10.1053/meta.2002.34715 [10] Zhao H, Dong J, Lu J, et al. Effects of extraction solvent mixtures on antioxidant activity evaluation and their extraction capacity and selectivity for free phenolic compounds in barley (Hordeum vulgare L). J Agric Food Chem, 2006; 54, 7277-86. doi: 10.1021/jf061087w [11] Quinde-Axtell Z, Baik BK. Phenolic compounds of barley grain and their implication in food product discoloration. J Agric Food Chem, 2006; 54, 9978-84. doi: 10.1021/jf060974w [12] Hole AS, Rud I, Grimmer S, et al. Improved bioavailability of dietary phenolic acids in whole grain barley and oat groat following fermentation with probiotic Lactobacillus acidophilus, Lactobacillus johnsonii, and Lactobacillus reuteri. J Agric Food Chem, 2012; 60, 6369-75. doi: 10.1021/jf300410h [13] Wang T, He F, Chen G. Improving bioaccessibility and bioavailability of phenolic compounds in cereal grains through processing technologies:A concise review. J Funct Foods, 2014; 7, 101-11. doi: 10.1016/j.jff.2014.01.033 [14] Del Rio D, Rodriguez-Mateos A, Spencer JP, et al. Dietary (poly) phenolics in human health:structures, bioavailability, and evidence of protective effects against chronic diseases. Antioxid Redox Sign, 2013; 18, 1818-92. doi: 10.1089/ars.2012.4581 [15] Begum A, Goswami A, Chowdhury P. A comparative study on free and bound phenolic acid content and their antioxidant activity in bran of rice (Oryza sativa L.) cultivars of Eastern Himalayan range. Int J Food Sci Technol, 2015; 50, 2529-36. doi: 10.1111/ijfs.12920 [16] Seo CR, Yi B, Oh S, et al. Aqueous extracts of hulled barley containing coumaric acid and ferulic acid inhibit adipogenesis in vitro and obesity in vivo. J Funct Foods, 2015; 12, 208-18. doi: 10.1016/j.jff.2014.11.022 [17] Cannell IG, Kong YW, Bushell M. How do microRNAs regulate gene expression? Biochem Soc Trans, 2008; 36, 1224-31. doi: 10.1042/BST0361224 [18] Zhao E, Keller MP, Rabaglia ME, et al. Obesity and genetics regulate microRNAs in islets, liver, and adipose of diabetic mice, Mamm. Genome, 2009; 20, 476-85. http://cn.bing.com/academic/profile?id=ceaee723972b84e43c4fafd225a514a5&encoded=0&v=paper_preview&mkt=zh-cn [19] Fu T, Choi, SE, Kim DH, et al. Aberrantly elevated microRNA-34a in obesity attenuates hepatic responses to FGF19 by targeting a membrane coreceptor β-Klotho. Proc Natl Acad Sci, 2012; 109, 16137-42. doi: 10.1073/pnas.1205951109 [20] Esau C, Davis S, Murray SF, et al. miR-122 regulation of lipid metabolism revealed by in vivo antisense targeting. Cell metabolism, 2006; 3, 87-98. doi: 10.1016/j.cmet.2006.01.005 [21] Xiao J, Bei Y, Liu J, et al. miR-212 downregulation contributes to the protective effect of exercise against non-alcoholic fatty liver via targeting FGF-21. J Cell Mol Med, 2016; 20, 204-16. doi: 10.1111/jcmm.12733 [22] Zhang JY, Xiao X, Dong Y, et al. Dietary supplementation with Lactobacillus plantarum dy-1 fermented barley suppresses body weight gain in high-fat diet-induced obese rats. J Sci Food Agric, 2016; 96, 4907-17. doi: 10.1002/jsfa.2016.96.issue-15 [23] Cooke AA, Connaughton RM, Lyons CL, et al. Fatty acids and chronic low grade inflammation associated with obesity and the metabolic syndrome. Eur J Pharmacol, 2016; 785, 207-14. doi: 10.1016/j.ejphar.2016.04.021 [24] Rathore S, Salmerón I, Pandiella SS. Production of potentially probiotic beverages using single and mixed cereal substrates fermented with lactic acid bacteria cultures. Food Microbiol, 2012; 30, 239-44. doi: 10.1016/j.fm.2011.09.001 [25] Giriwono PE, Hashimoto T, Ohsaki Y, et al. Extract of fermented barley attenuates chronic alcohol induced liver damage by increasing antioxidative activities. Food Res Int, 2010; 43, 118-24. doi: 10.1016/j.foodres.2009.09.008 [26] ÐordevicxTM, Šiler-MarinkovicxSS, Dimitrijevicx-Brankovic SI. Effect of fermentation on antioxidant properties of some cereals and pseudo cereals. Food Chem, 2010; 119, 957-63. doi: 10.1016/j.foodchem.2009.07.049 [27] Tang Z, Xia N, Yuan X, et al. PRDX1 is involved in palmitate induced insulin resistance via regulating the activity of p38MAPK in HepG2 cells. Biochem Biophys Res Commun, 2015; 465, 670-7. doi: 10.1016/j.bbrc.2015.08.008 [28] Van Beek M, Oravecz-Wilson KI, Delekta PC, et al. Lucas1, Bcl10 links saturated fat overnutrition with hepatocellular NF-κB activation and insulin resistance. Cell reports, 2012; 1, 444-52. doi: 10.1016/j.celrep.2012.04.006 [29] Esser N, Legrand-Poels S, Piette J, et al. Inflammation as a link between obesity, metabolic syndrome and type 2 diabetes. Diabetes Res Clin Pr, 2014; 105, 141-50. doi: 10.1016/j.diabres.2014.04.006 [30] Xie C, Kang J, Li Z, et al. The açaí flavonoid velutin is a potent anti-inflammatory agent:blockade of LPS-mediated TNF-α and IL-6 production through inhibiting NF-κB activation and MAPK pathway. J Nutr Biochem, 2012; 23, 1184-91. doi: 10.1016/j.jnutbio.2011.06.013 [31] Feng Y, Carroll AR, Addepalli R, et al. Vanillic acid derivatives from the green algae Cladophora socialis as potent protein tyrosine phosphatase 1B inhibitors. J Nat Prod, 2007; 70, 1790-2. doi: 10.1021/np070225o [32] Chang WC, Wu JSB, Chen CW, et al. Protective effect of vanillic acid against hyperinsulinemia, hyperglycemia and hyperlipidemia via alleviating hepatic insulin resistance and inflammation in High-Fat Diet (HFD)-fed rats. Nutrients, 2015; 7, 9946-59. doi: 10.3390/nu7125514 [33] Han MS, Jung DY, Morel C, et al. JNK expression by macrophages promotes obesity-induced insulin resistance and inflammation. Science, 2013; 339, 218-22. doi: 10.1126/science.1227568 [34] Nakatani Y, Kaneto H, Kawamori D, et al. Modulation of the JNK pathway in liver affects insulin resistance status. J Biol Chem, 2004; 279, 45803-9. doi: 10.1074/jbc.M406963200 [35] Shehzad A, Ha T, Subhan F, et al. New mechanisms and the anti-inflammatory role of curcumin in obesity and obesity-related metabolic diseases. Eur J Nutr, 2011; 50, 151-61. doi: 10.1007/s00394-011-0188-1 [36] Wang YY, Li H, Wang XH, et al. Probucol inhibits MMP-9 expression through regulating miR-497 in HUVECs and apoE knockout mice, Thromb Res, 2016; 140, 51-8. doi: 10.1016/j.thromres.2016.02.012 [37] Nesca V, Guay C, Jacovetti C, et al. Identification of particular groups of microRNAs that positively or negatively impact on beta cell function in obese models of type 2 diabetes. Diabetologia, 2013; 56, 2203-12. doi: 10.1007/s00125-013-2993-y [38] Emanuelli B, Eberlé D, Suzuki R, et al. Overexpression of the dual-specificity phosphatase MKP-4/DUSP-9 protects against stress-induced insulin resistance. Proc Natl Acad Sc USA, 2008; 105, 3545-50. doi: 10.1073/pnas.0712275105 [39] Wu F, Lv T, Chen G, et al. Epigenetic silencing of DUSP9 induces the proliferation of human gastric cancer by activating JNK signaling. Oncol Rep, 2015; 34, 121-8. doi: 10.3892/or.2015.3998 [40] Yang Y, Ouyang X, Xiang J, et al. Effects of DUSP9 on cholesterol and gluconeogenesis in high-fat diet induced insulin resistance C57 mice. Chongqing Med J, 2013; 42, 1561-3. -

 点击查看大图
计量
- 文章访问数: 4261
- HTML全文浏览量: 1343
- PDF下载量: 97
- 被引次数: 0

 Quick Links