

 下载:
下载:

-
The emergency room is the primary place for critically ill patients to seek medical treatment[1]. China is the world's most densely populated country, and its regional development is extremely uneven. The emergency service supply of first-class hospitals in cities, especially megacities, is still not in line with the demand for medical treatment, and the emergency rescue unit equipment and personnel allocation are facing challenges[2].
In the medical literature, high-pressure cold weather is an important cause of upper and lower respiratory tract fever outbreaks, and fog can affect the number of pneumonia patient intensive care unit admissions[3]. Acute cerebrovascular disease has obvious seasonal and diurnal variation characteristics, and air pollution has an effect on the outpatient quantity of cardiovascular diseases[4]. The number of emergency patients with cardiovascular disease is related to meteorological factors, such as air quality[5, 6], temperature[7], and air pressure[8]. However, many studies have focused on the correlation between the weather and outpatient or emergency visitor flow, while few have predicted the number of visits to specific emergency units. Human flow prediction is a typical time-series prediction problem. The commonly used prediction methods can be divided into two categories: one is the linear model, such as ARIMA[9], and the other is the nonlinear model, which uses machine learning methods, such as the support vector machine (SVM) and deep learning neural network[10]. Compared with machine learning methods, the linear model is simple to construct and fast to train, but it cannot deal with nonlinear and random problems well. Therefore, the purpose of this study was to use a GRU deep learning neural network to accurately predict the flow of people in each triage unit of emergency rooms so as to provide a theoretical basis and scientific guidance for rationalizing the pre-storage and distribution of emergency resources and to carry out the pre-triage work for patients in advance.
The basic data of 486,137 pre-examination triage patients were extracted from the emergency treatment database of PLA general hospital on May 1, 2015 to March 19, 2018. After analysis, we found the triage directions included fever, trauma, stomatology, gynecology, ophthalmology, neurology, comprehensive, ENT, chest pain, abdominal pain, and orthopedics.
In the process of the pre-examination triage, the triage level should be determined according to the priority and urgency of the patient’s health condition. It is divided into four levels, from light to heavy, with the fourth level being the lowest level and the first being the highest level. Considering the factors of the sample size and the objective and actual needs of emergency medical institutions, we classified the triage as a combination of primary and secondary patients and identified them as ‘level 1/2.’. Similarly, in order to improve the accuracy of prediction, grade iii and iv patients were combined and labeled as ‘level 3/4.’. In this study, the daily number of hospital visits was the minimum research unit.
The emergency rescue unit is the area where emergency institutions rescue emergency patients, and it is the area where treatment measures are improved and medical resources are concentrated. The smooth operation of an emergency rescue unit and the rationality of resource allocation directly affects the survival rate of patients. Therefore, we carried out a study on emergency grading and pre-diagnosis to predict the number of patients who needed to be admitted to the emergency rescue unit.
In addition to the conventional surface meteorological observation data obtained on May 1, 2015 to March 19, 2018 from the US national oceanic and atmospheric administration (NOAA), we also included the wind direction, wind speed, visibility, temperature, dew point, MW (artificially observed weather), air quality, and other meteorological elements.
First, descriptive analysis was carried out on all dimensions of the original data, and departments with large sample sizes and obvious seasonal fluctuations were selected as the predicted objects. Therefore, we predicted the number of patients received by the department of trauma, otolaryngology, gynecology, abdominal pain, orthopedics, neurology, comprehensive department, and rescue unit with a triage rating of ‘level 3/4.’. We also predicted the number of patients received by comprehensive department with a triage rating of ‘level 1/2.’.
Second, there was a strong daily fluctuation in the data of each department, which has a great impact on the training of the deep learning model. Therefore, in this experiment, the daily random fluctuations were filtered out by sliding a window of 10, and the optimal window size was determined by the model prediction results.
Then, the number of emergency patients and the meteorological observation data in the same period after data pre-processing were completed. The emergency disease prediction model was established using the Gated Recurrent Unit (GRU) neural network method, and the prediction model was used to predict the number of emergency patients in the future and test the predicted results. The GRU is a variant of the LSTM algorithm that combines a forgotten gate and an input gate into a separate ‘update gate’ using a reset gate to determine the extent to which previous information is forgotten. The effects are similar, but with fewer GRU parameters, the training is faster and requires less data to generalize:
The neural network model was used to predict the number of emergency patients, which can be divided into the following steps:
(1) Data pre-processing, including data filling and filtering, and merging human flow data and meteorological observation data;
(2) Using five-fold cross-validation to divide the training set and test set and conduct standardization;
(3) Initializing the neural network and adjusting the parameter combination;
(4) Training the neural network to obtain the root mean square error of the predicted test set;
(5) If the root-mean-square error has reached the predetermined target, proceed to the next step; otherwise, return to Step (3);
(6) Select the model with the smallest root-mean-square error and test the predicted results through the validation set data.
The daily number of hospital visits, the daily average of wind direction (DIR), wind speed (SPD), visibility (VSB), temperature (TEMP), dew point (DEWP), sea-level pressure (SLP), ALT, STP and other factors, cloud cover (SKC), and MV were coded one-hot as predictive factors into the model. When the time steps were 1, 5, 10, 15, 20, and 30, the five-fold cross validation was used to investigate the prediction effect. In order to optimize the effect of the prediction model, the 10-day sliding window was used to smooth the daily number of patients, and then the neural network model was used to predict the number of emergency patients. The prediction effect of the model was evaluated by the mean square difference between the fitting results of the historical samples and the actual number of hospital visits. The model with the best prediction effect is selected to determine the optimal time step size. The time step takes data, such as the weather in the past, as the input.
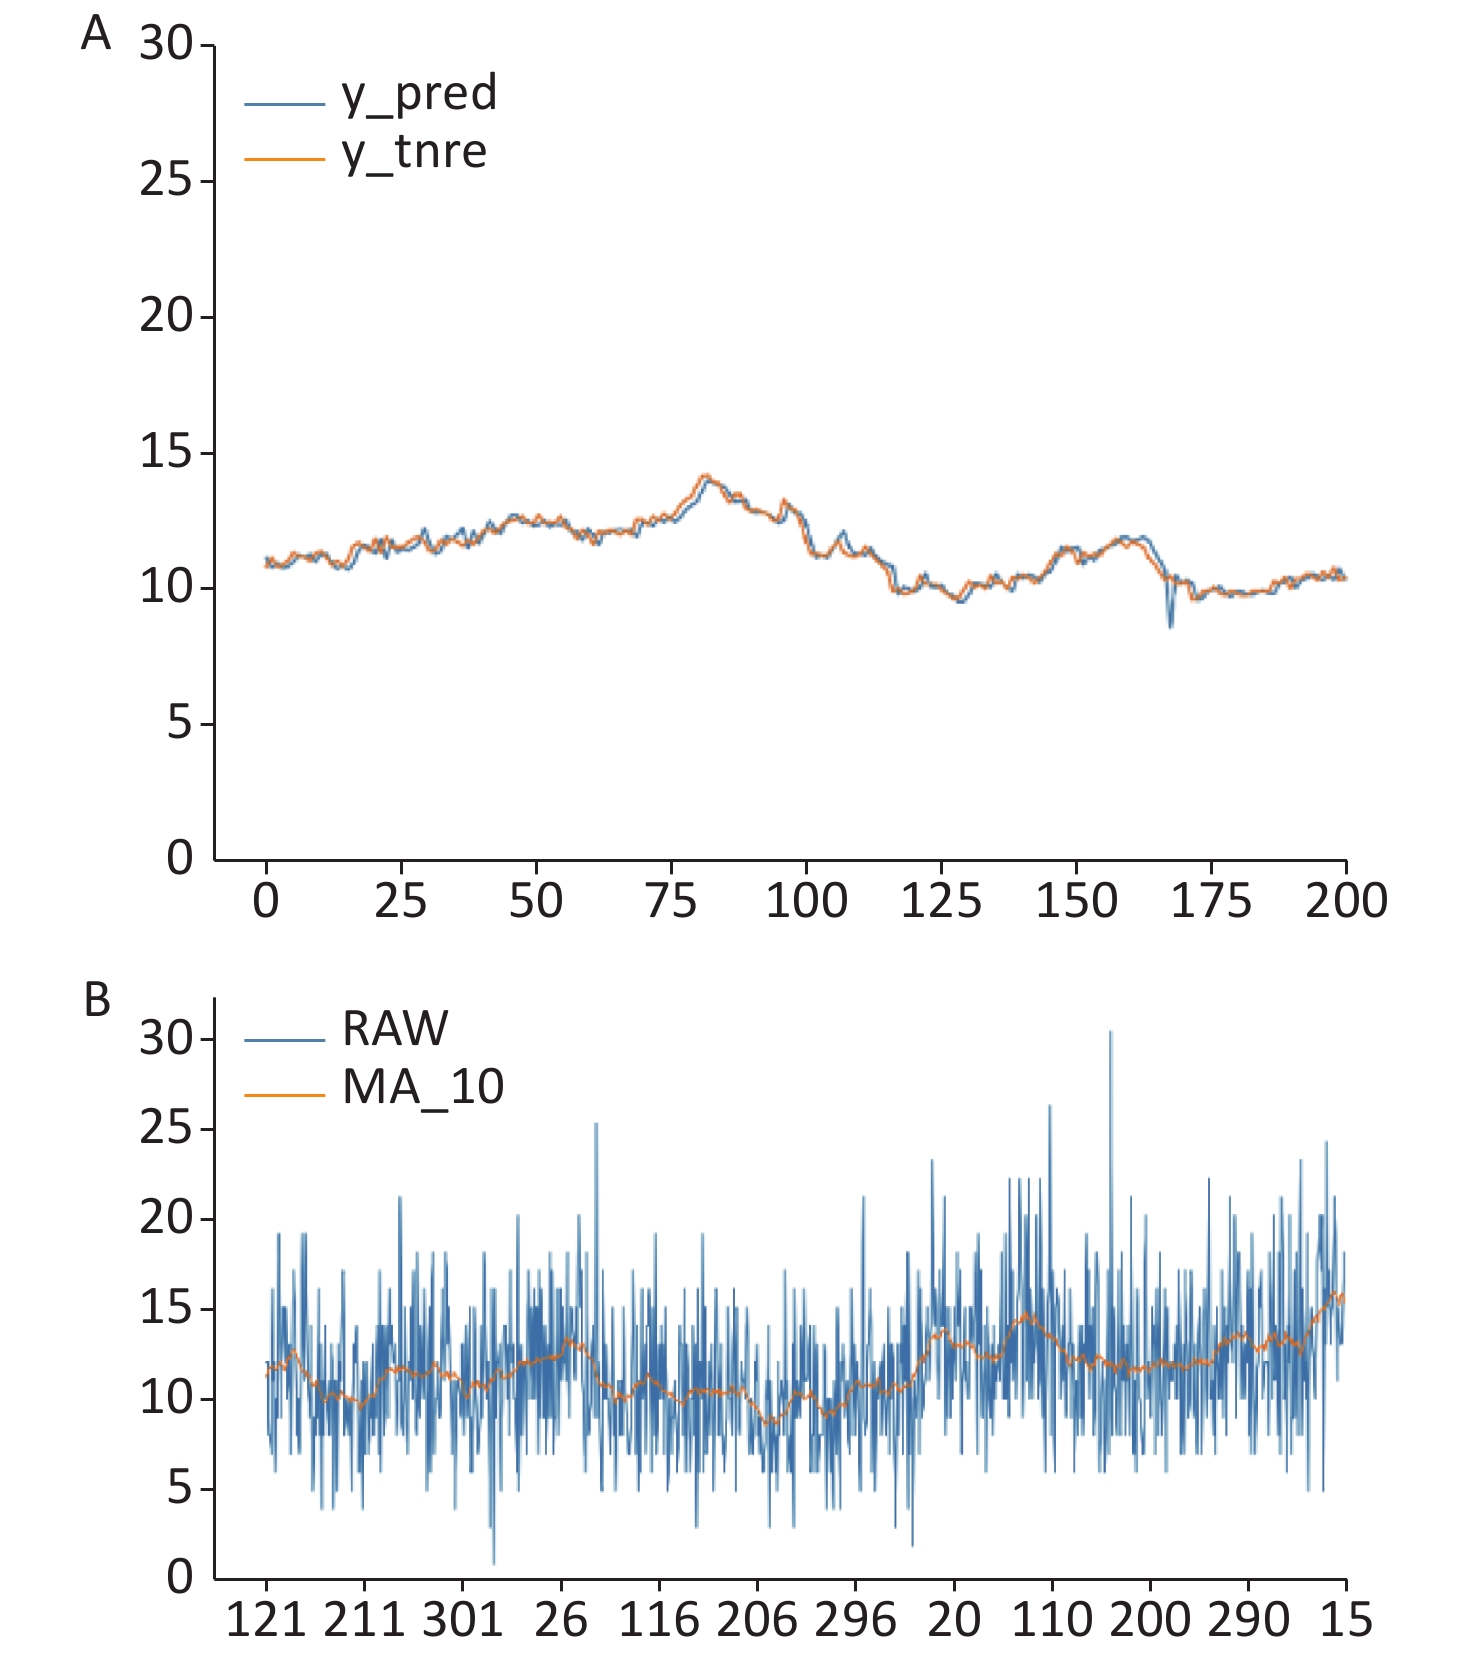
Due to space limitations, the comprehensive department with triage level of ‘level 1/2.’ is used here as an example to analyze the predicted results. First, we compare the prediction results at different time steps. When the time step is 1, the root-mean-square error of the model is the smallest, and the root-mean-square error is 0.366763. The model fitting effect under this parameter combination is shown in Figure 1A. The prediction effect is in Figure 1B. The blue line is the original data, the yellow line is the model fitting data, and the horizontal axis represents the specific number of days per year. From the model fitting data, it can be seen that the daily number of patients in the comprehensive department fluctuates between 10 and 15, and the annual peak occurs in winter, while the valley value appears in summer, showing an upward trend in autumn and a downward trend in spring, indicating that the daily number of patients in the department has an obvious meteorological seasonal law. In addition, it can also be seen from the figure that a secondary peak occurs every once in a while, when the overall seasonal fluctuation occurs, which indicates that there are other factors influencing the number of patients, and this point also conforms to the actual situation of the disease distribution in the population.
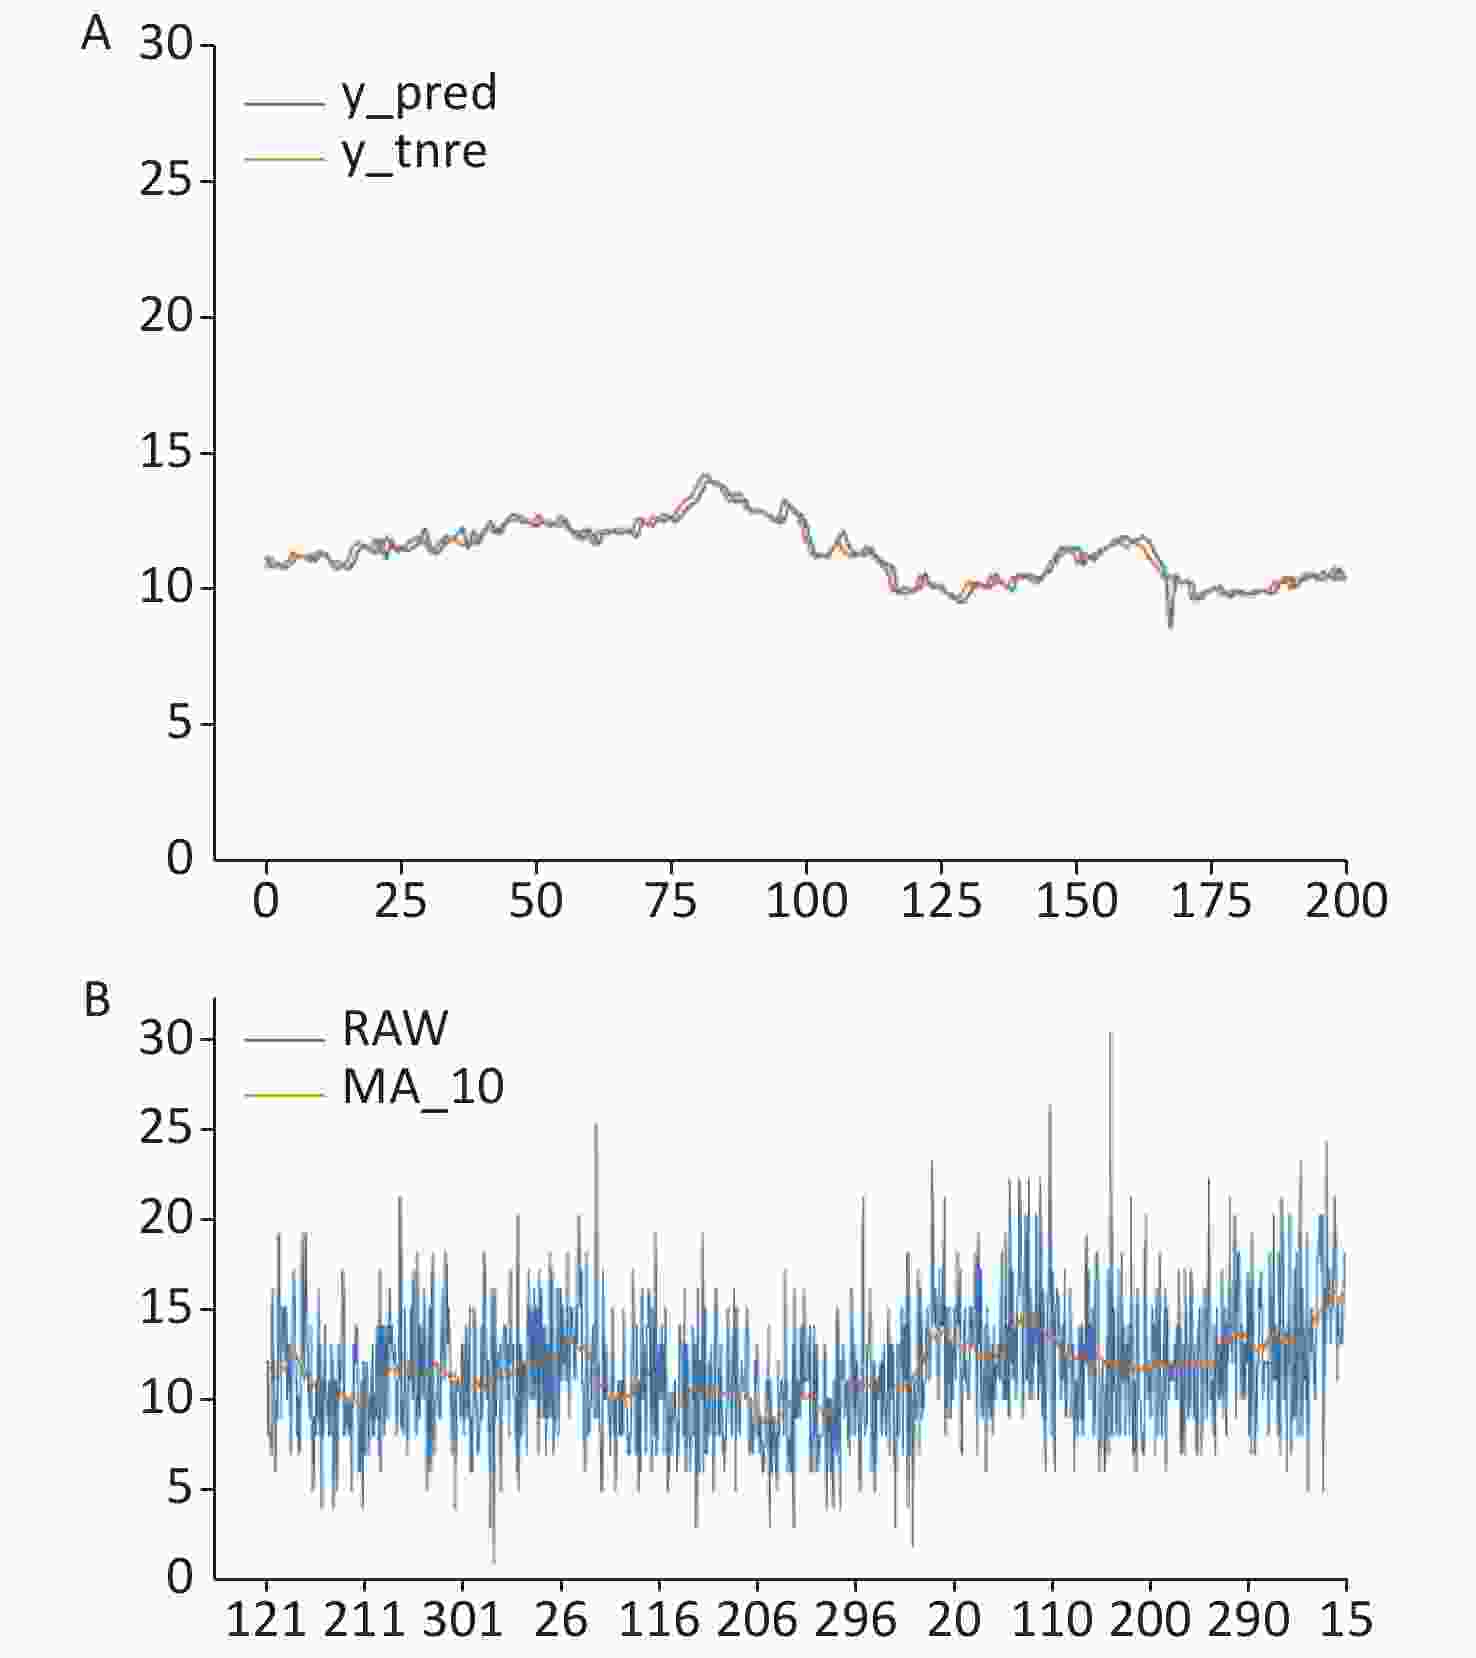
Figure 1. Model fitting effect under time step 1 (A) and prediction effect of comprehensive (level 1/2.) (B) .
Table 1 shows the prediction problem of the outpatient flow faced by this scheme, the error RMSE of the selected triage direction, and grade in the gate recurrent unit neural network GRU and seasonal autoregressive integrated moving average model (SARIMA).
Table 1. Error comparison
Item Trauma (level 3/4.) Otolaryngology
(level 3/4.)Gynecology
(level 3/4.)Abdominal pain
(level 3/4.)Orthopedics
(level 3/4.)GRU 7.5605 9.3482 6.1442 8.4475 7.6192 SARIMA 7.1059 10.4018 6.1479 14.4437 7.1938 GRU step 1 15 1 10 15 Neurology (level 3/4.) Comprehensive
(level 3/4.)Comprehensive
(level 1/2.)The rescue unit GRU 6.2601 12.6360 3.4996 4.5969 SARIMA 6.7451 16.8113 4.1292 5.9666 GRU step 15 1 1 15 Note. GRU: Gated Recurrent Unit model; SARIMA: Seasonal Autoregressive Integrated Moving Average model. Overall, the prediction error of GRU is lower than that of SARIMA, so GRU is a better method for the problems studied in this study.
The prediction results from the two dimensions of the triage level and triage department are reasonable, and the existing regularity has been revealed to a certain extent. Therefore, this model can be used to classify the visiting flow according to the historical sample data, set the warning threshold scientifically, and predict the visiting flow of each emergency triage department according to the meteorological conditions to provide for an early warning about the flow of people to better allocate medical resources and play a role in disease prevention and control.
According to the box diagram, the warning-level threshold is divided. Due to the lack of objective reference materials in this part, the classification level is also related to the actual capacity of each medical institution to accept patients. Therefore, a self-drawn standard method was adopted, which is as follows: the daily average treatment times were used as the reference standard, and the warning level was divided into green, yellow, orange, and red, a total of four levels:
Green — less than the average;
Yellow — greater than the mean, less than the upper quartile;
Orange — greater than the upper quartile, less than the maximum;
Red — greater than the maximum.
The warning level of the human traffic flow in the emergency triage department is shown in Table 2.
Table 2. Traffic warning level of the emergency triage department
Emergency triage of the department
and human flow warning levelGreen Yellow Orange Red Comprehensive_12 (NS_12) NS_12 ≤ 11 11 ≤ NS_12 < 14 14 ≤ NS_12 < 30 NS_12 ≥ 30 Trauma_34 (NT_34) NT_34 ≤ 30 30 ≤ NT_34 < 36 36 ≤ NT_34 < 58 NT_34 ≥ 58 Gynecology (NG_34) NG_34 ≤ 26 26 ≤ NG_34 < 31 31 ≤ NG_34 < 47 NG_34 ≥ 47 Neurology_34 (NN_34) NN_34 ≤ 28 28 ≤ NN_34 < 33 33 ≤ NN_34 < 51 NN_34 ≥ 51 Comprehensive_34 (NS_34) NS_34 ≤ 68 68 ≤ NS_34 < 78 78 ≤ NS_34 < 146 NS_34 ≥ 146 Otolaryngology_34 (NE_34) NE_34 ≤ 29 29 ≤ NE_34 < 36 36 ≤ NE_34 < 68 NE_34 ≥ 68 Abdominal pain_34 (NA_34) NA_34 ≤ 42 42 ≤ NA_34 < 48 48 ≤ NA_34 < 76 NA_34 ≥ 76 Orthopedics_34 (NO_34) NO_34 ≤ 32 32 ≤ NO_34 < 37 37 ≤ NO_34 < 59 NO_34 ≥ 59 The Rescue Unit (NJ_34) NJ_34 ≤ 22 22 ≤ NJ_34 < 26 26 ≤ NJ_34 < 38 NJ_34 ≥ 38 Note. Unit: person-time. Previous studies focused on the correlation between a single disease and weather, pollution, and other factors, and explored the underlying mechanism. The purpose of this study was to propose a universal method: as long as a large sample data are collected, the model can be run, and the forecast of the number of patients in different emergency treatment units in the future can be published as a routine part of a hospital’s business.
In this work, starting from the maximization of the training and verification accuracy, the correlation between the selected diseases and weather factors was investigated by comparing the time step of the best prediction results. We used a comparison of the trauma department and gynecology department as an example. The time step of the optimal prediction parameter was 1, that is, only the data of the past 1 d as the input can get better results than the data of the past 5 d, 10 d, 15 d, and so on. This means that the long-term data of the past are disturbing: there is little correlation between things like trauma and seasonal weather, which is consistent with common sense. For neurology, abdominal pain, and other departments, the prediction effect was optimal when the time step was larger, indicating that it was related to the weather.
However, this research had some shortcomings. First, the data used in this study were from the first-aid database of the General Hospital of the People's Liberation Army. Considering that these patients were not sick in Beijing, the weather in Beijing could not be used. Due to the issues of privacy and data ethics, the original data were not used, so the proportion of these patients in the whole population and the size of the overall prediction disturbance could not be analyzed. Second, in order to grasp the long-term trend of the number of patients, we carried out a moving smoothing process on the data, which eliminated the daily random fluctuations. If these random variables are further studied and the factors (including, but not limited to, weather factors) that influence the daily outpatient volume are taken into account, the model can be revised to obtain more detailed prediction results at the application level. However, since we were limited by the data set, this study does not include enough in-depth research; this type of research will be performed in the future.
doi: 10.3967/bes2020.111
Application Research on Gated Recurrent Unit Deep Learning Prediction and Graded Early Warning of Emergency Department Visits Based on Meteorological Environmental Data
-
-
Figure 1. Model fitting effect under time step 1 (A) and prediction effect of comprehensive (level 1/2.) (B) .
Table 1. Error comparison
Item Trauma (level 3/4.) Otolaryngology
(level 3/4.)Gynecology
(level 3/4.)Abdominal pain
(level 3/4.)Orthopedics
(level 3/4.)GRU 7.5605 9.3482 6.1442 8.4475 7.6192 SARIMA 7.1059 10.4018 6.1479 14.4437 7.1938 GRU step 1 15 1 10 15 Neurology (level 3/4.) Comprehensive
(level 3/4.)Comprehensive
(level 1/2.)The rescue unit GRU 6.2601 12.6360 3.4996 4.5969 SARIMA 6.7451 16.8113 4.1292 5.9666 GRU step 15 1 1 15 Note. GRU: Gated Recurrent Unit model; SARIMA: Seasonal Autoregressive Integrated Moving Average model.  下载: 导出CSV
Table 2. Traffic warning level of the emergency triage department
Emergency triage of the department
and human flow warning levelGreen Yellow Orange Red Comprehensive_12 (NS_12) NS_12 ≤ 11 11 ≤ NS_12 < 14 14 ≤ NS_12 < 30 NS_12 ≥ 30 Trauma_34 (NT_34) NT_34 ≤ 30 30 ≤ NT_34 < 36 36 ≤ NT_34 < 58 NT_34 ≥ 58 Gynecology (NG_34) NG_34 ≤ 26 26 ≤ NG_34 < 31 31 ≤ NG_34 < 47 NG_34 ≥ 47 Neurology_34 (NN_34) NN_34 ≤ 28 28 ≤ NN_34 < 33 33 ≤ NN_34 < 51 NN_34 ≥ 51 Comprehensive_34 (NS_34) NS_34 ≤ 68 68 ≤ NS_34 < 78 78 ≤ NS_34 < 146 NS_34 ≥ 146 Otolaryngology_34 (NE_34) NE_34 ≤ 29 29 ≤ NE_34 < 36 36 ≤ NE_34 < 68 NE_34 ≥ 68 Abdominal pain_34 (NA_34) NA_34 ≤ 42 42 ≤ NA_34 < 48 48 ≤ NA_34 < 76 NA_34 ≥ 76 Orthopedics_34 (NO_34) NO_34 ≤ 32 32 ≤ NO_34 < 37 37 ≤ NO_34 < 59 NO_34 ≥ 59 The Rescue Unit (NJ_34) NJ_34 ≤ 22 22 ≤ NJ_34 < 26 26 ≤ NJ_34 < 38 NJ_34 ≥ 38 Note. Unit: person-time.
下载: 导出CSV
-
[1] Yang L, Qiu PQ, Wang Y, et al. Thoughts and status quo of emergency medical care in Shanghai municipal hospitals. Chin Hosp, 2017; 21, 1−4. (In Chinese) [2] Qin XJ, Chen YR, Feng J, et al. Survey on public health emergency response ability of the emergency department of county general hospitals in the border area of Guangxi. J Appl Prev Med, 2008; 34, 14−7. (In Chinese) [3] Zhang ZH, Hong YC, Liu N. Association of ambient Particulate matter 2.5 with intensive care unit admission due to pneumonia: a distributed lag non-linear model. Sci Rep, 2017; 7, 8679. doi: 10.1038/s41598-017-08984-x [4] Wang ZX, Zhao J, Niu ZL, et al. Influence of air pollution on the outpatient volume of cardiovascular and cerebrovascular diseases using the Poisson generalized additive models in Weifang. Chin J Health Statist, 2017; 34, 232−5. (In Chinese) [5] Cao JS, Li WH, Tan JG, et al. Association of ambient air pollution with hospital outpatient and emergency room visits in Shanghai, China. Sci Total Environ, 2009; 407, 5531−6. doi: 10.1016/j.scitotenv.2009.07.021 [6] Tian YH, Xiang X, Juan J, et al. Fine particulate air pollution and hospital visits for asthma in Beijing, China. Environ Poll, 2017; 230, 227−33. doi: 10.1016/j.envpol.2017.06.029 [7] Brandl EJ, Lett TA, Bakanidze G, et al. Weather conditions influence the number of psychiatric emergency room patients. Int J Biometeorol, 2018; 62, 843−50. doi: 10.1007/s00484-017-1485-z [8] Kam HJ, Sung JO, Park RW. Prediction of daily patient numbers for a regional emergency medical center using time series analysis. Healthc Inform Res, 2010; 16, 158−65. doi: 10.4258/hir.2010.16.3.158 [9] Milenković M, Švadlenka L, Melichar V, et al. SARIMA Modelling approach for railway passenger flow forecasting. Transport, 2018; 33, 1113−20. [10] Zhang D, Kabuka MR. Combining weather condition data to predict traffic flow: a GRU-based deep learning approach. IET Intell Trans Syst, 2018; 12, 578−85. doi: 10.1049/iet-its.2017.0313 -

 点击查看大图
图(1) / 表ll (2)
计量
- 文章访问数: 1084
- HTML全文浏览量: 481
- PDF下载量: 63
- 被引次数: 0

 Quick Links