

 下载:
下载:


-
Seasonal influenza viruses have caused significant morbidity and mortality worldwide. Especially in the United States, influenza viruses spread during the winter, leading to a sharp increase in acute respiratory infections and hospitalizations. Influenza affects approximately 5% to 20% of the population each season[1]. Influenza is a climate-related acute respiratory infectious disease with a seasonal trend. In temperate regions, influenza infection usually has an obvious annual peak, which mainly occurs in winter months. However, the seasonal patterns in tropical and subtropical regions seem to be more complex. In the tropics, influenza activity can occur throughout the year or as multiple epidemics, sometimes varying from year-to-year[2].
Several meteorological factors are responsible for the seasonal outbreak of influenza. These include temperature, relative humidity, pressure, wind speed, precipitation, and other factors. The incidence and mortality of influenza rise with the reduction of temperature[3]. The exposure-lag-response relationships between influenza virus activity and environmental factors, such as temperature, are not completely defined. Available evidence is often based on traditional statistical models, which do not reveal the cumulative or lag effects of environmental factors on influenza. Moreover, despite the increasing number of population-based estimates of influenza-associated excess deaths and hospitalizations, few studies of influenza-like illness (ILI) have been published. To address this shortcoming, we used distributed lagged nonlinear models (DLNMs) to explore the influence of meteorological factors on ILI.
The study site is the state of Mississippi in the southern USA. The state is located in a humid subtropical climate region, with an annual average temperature ranging from 17 °C in the north to 20 °C along the coast. Normal precipitation ranges from approximately 1,270 to 1,650 mm, and is fairly evenly spread throughout the year. ILI epidemics of various magnitudes have plagued Mississippi annually for decades. The study utilized weekly data on ILI incidence from the United States Outpatient Influenza-like Illness Surveillance Network (ILINet). The data were from the first week of 2011 to week 29 of 2020. ILI is defined as “fever (temperature of 100 °F (37.8 °C) or greater) and a cough and/or a sore throat without a known cause other than influenza” (
https://www.cdc.gov/flu/weekly/overview.htm accessed on November 24, 2021). Data of weekly meteorological variables, including mean temperature, mean wind speed, accumulated precipitation, mean atmospheric pressure, and mean relative humidity, were obtained from the National Oceanic and Atmospheric Administration. We also downloaded data of particulate matter ≤ 2.5 µm in diameter (PM2.5) from the US Environmental Protection Agency. The data were selected based on previous studies about influenza and other respiratory diseases.DLNMs were employed to determine the correlation between meteorological factors and ILI incidence. The Poisson regression was constructed with a quasi-Poisson function that allowed the excess dispersion in the weekly number of ILI cases to combine DLNMs. The weekly ILI incidence was calculated as:
$$\begin{aligned} E\left({Y}_{t}\right)=\; &\alpha +cb.x+\sum ns\left(meteorological\;factors,df\right)+\\ &ns\left({{PM}}_{2.5},df\right)+ns\left(time,df\right)+factor\left(holiday\right) \end{aligned}$$ where E(Yt) is the weekly ILI incidence; t is the week during the study period from 2011 through 2020; α is the intercept; cb represents the cross-basis matrix in the distributed lag models; x is the interest study factor; ns() is the natural cubic spline; df is the degree of freedom; time represents seasonality and long term trends with a degree of freedom of 7/year; and holiday refers to a binary variable of public holidays used to control the impact of public holidays. If one of the factors was studied, the remaining five variables were adjusted as covariates. Based on the potential lag effect and influenza incubation period reported in previous studies, the maximum time lag was selected as 4 weeks. To select the best model and evaluate the robustness of the model, df of each factor was determined based on previous studies and combined with Akaike Information Criterion for quasi-Poisson (Q-AIC). The optimal df of each factor was 3, except the temperature (df = 4). The “dlnm” package in R3.6.0 was used to create the DLNMs
The seasonal autoregressive integrated moving average with exogenous variables (SARIMAX) model is an extension of SARIMA model. The input series includes covariates, such as meteorological factors. In the resulting SARIMAX (p, d, q) (P, D, Q)s (X), p, d, and q denote the order of autoregression, order of difference, and order of moving average, respectively; P, D, and Q denote the order of seasonal autoregression, order of difference, and order of moving average, respectively; and s is the specific value of cycle; s is the cycle of American influenza (52 weeks); and X is the vector of external variables. The data in the training set, from the first week of 2011 to week 52 of 2018, were used to construct the SARIMA model. The data in the validation set from the first week of 2019 to week 29 of 2020 were used to test the effect of model. The autocorrelation function (ACF) and partial autocorrelation function (PACF) used to estimate the model residuals were tested by the Ljung-Box Q test. The minimum Bayesian information criterion (BIC) was taken as the optimal SARIMAX model. The “TSA” package in R3.6.0 was used to create the SARIMAX model.
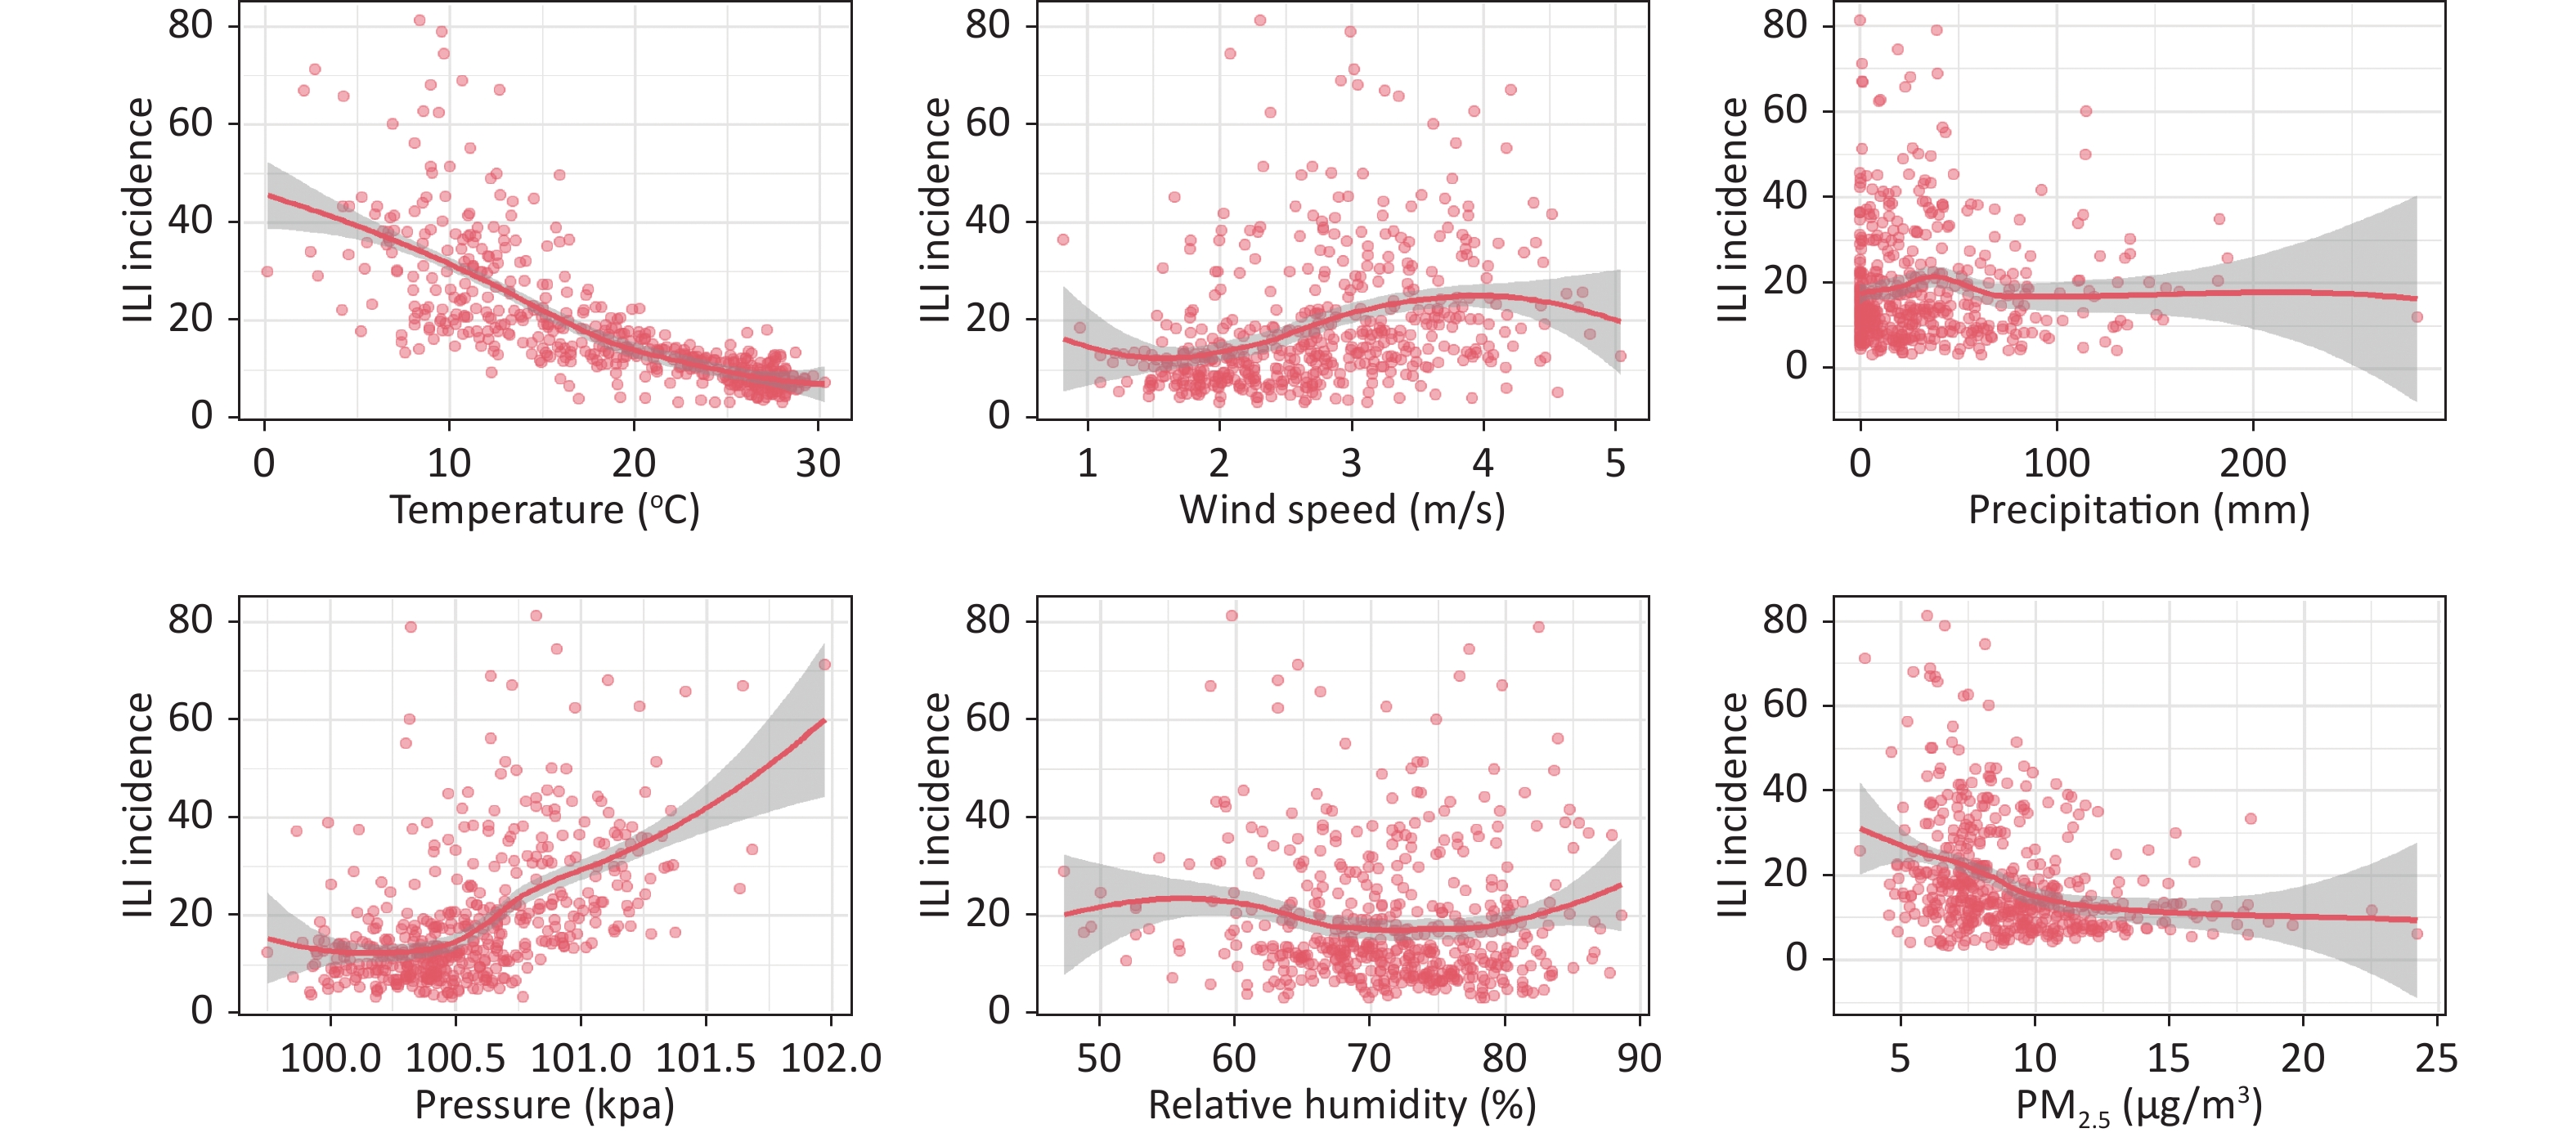
From the first week of 2011 to week 29 of 2020, a total of 280, 871 ILI cases were reported in Mississippi. The weekly ILI incidence fluctuated from 3.35 to 81.23 per 100,000 population (Supplementary Table S1, available in www.besjournal.com). ILI occurred throughout the year. The peaks of incidence were in winter months, but with temporal variations in the peaks among different years. The temperature and PM2.5 were negatively correlated with ILI incidence in Mississippi. Wind speed and pressure were positively correlated with ILI incidence. Temperature very strongly correlated with ILI incidence, and pressure moderately strongly correlated. Correlation of the other factors was weakly or absent (Supplementary Table S2, Supplementary Figure S1, available in www.besjournal.com).
Table S1. Descriptive summary for ILI incidence, meteorological factors and PM2.5 in Mississippi, 2011–2020
Variables Mean Std P25 P50 P75 Min. Max. ILI incidence (per 100,000) 18.81 13.46 9.61 14.20 22.67 3.35 81.23 Temperature (°C) 18.54 7.26 12.11 18.97 25.73 0.13 30.26 Wind speed (m/s) 2.73 0.81 2.05 2.71 3.30 0.82 5.03 Precipitation (mm) 31.25 37.67 3.31 19.56 42.93 0.00 283.21 Pressure (kpa) 100.55 0.35 100.32 100.50 100.77 99.75 101.97 Relative humidity (%) 71.46 7.10 67.14 71.71 76.43 47.29 88.57 PM2.5 (μg/m3) 9.07 2.82 7.17 8.44 10.49 3.47 24.20 Note. ILI: influenza-like illness. Table S2. Spearman correlation of meteorological factors and PM2.5 with ILI incidence in Mississippi, 2011–2020
Temperature Wind speed Precipitation Pressure Relative humidity PM2.5 ILI incidence −0.854** 0.430** 0.049 0.539** −0.087 −0.360** Note. **P < 0.001. ILI: influenza-like illness. 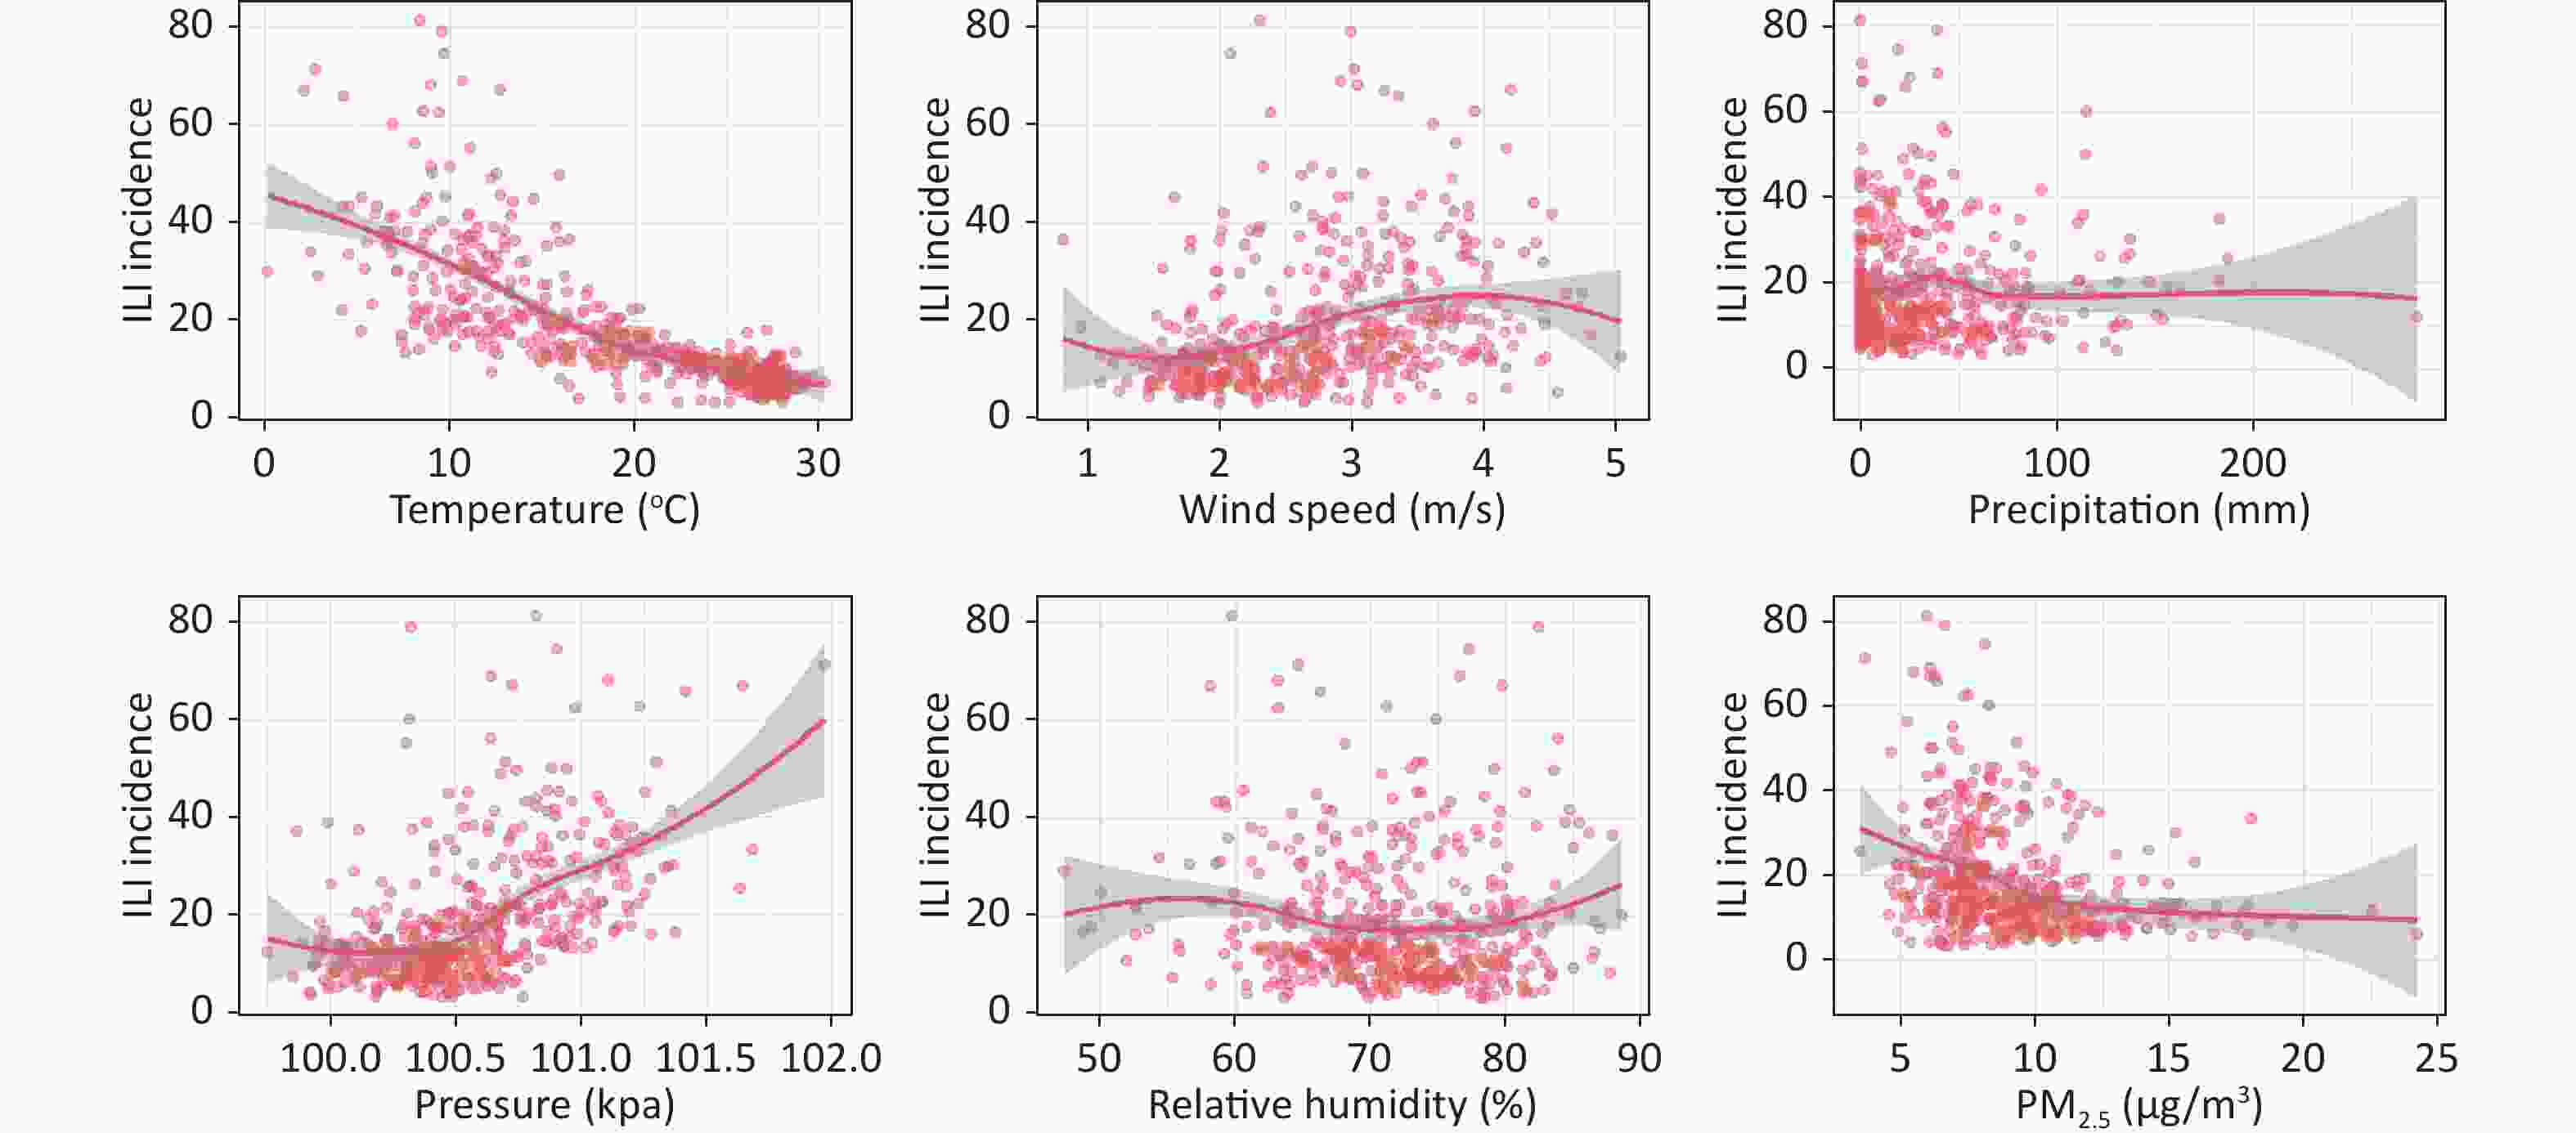
Figure S1. Scatter plot of meteorological factors and PM2.5 with ILI incidence. ILI: influenza-like illness.
The DLNM analysis revealed that the duration of the effect of temperature and pressure on the ILI incidence was 4 weeks. The median temperature and pressure were 18.97 °C and 100.5 kpa, respectively, adjusted for wind speed, precipitation, humidity, and PM2.5. The relationship between temperature and pressure and ILI incidence at different percentiles was analyzed using percentage points set as the 1st, 10th, 90th, and 99th percentiles.
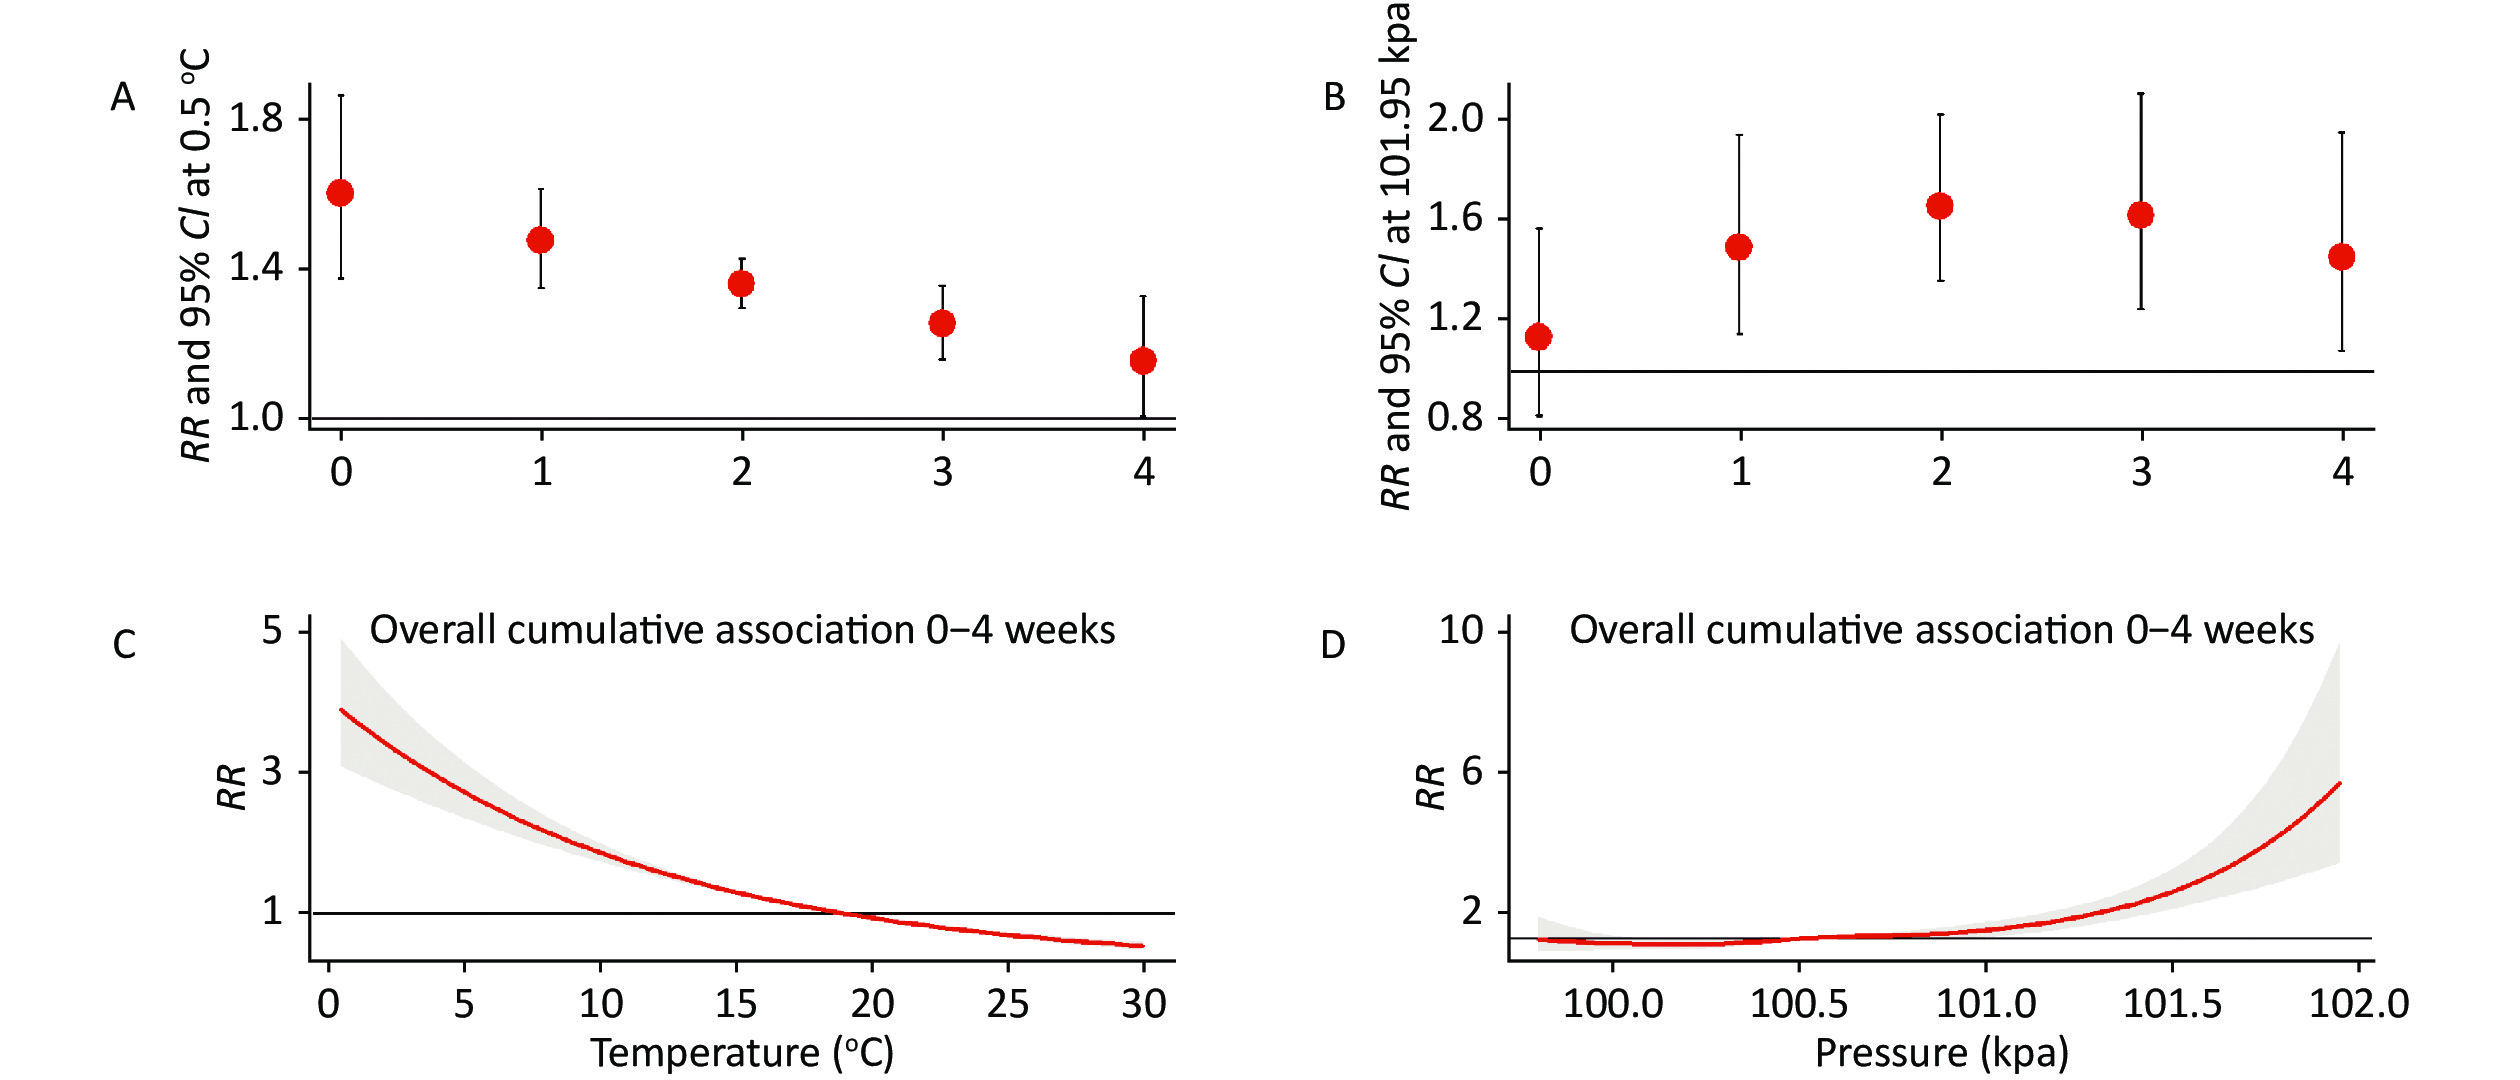
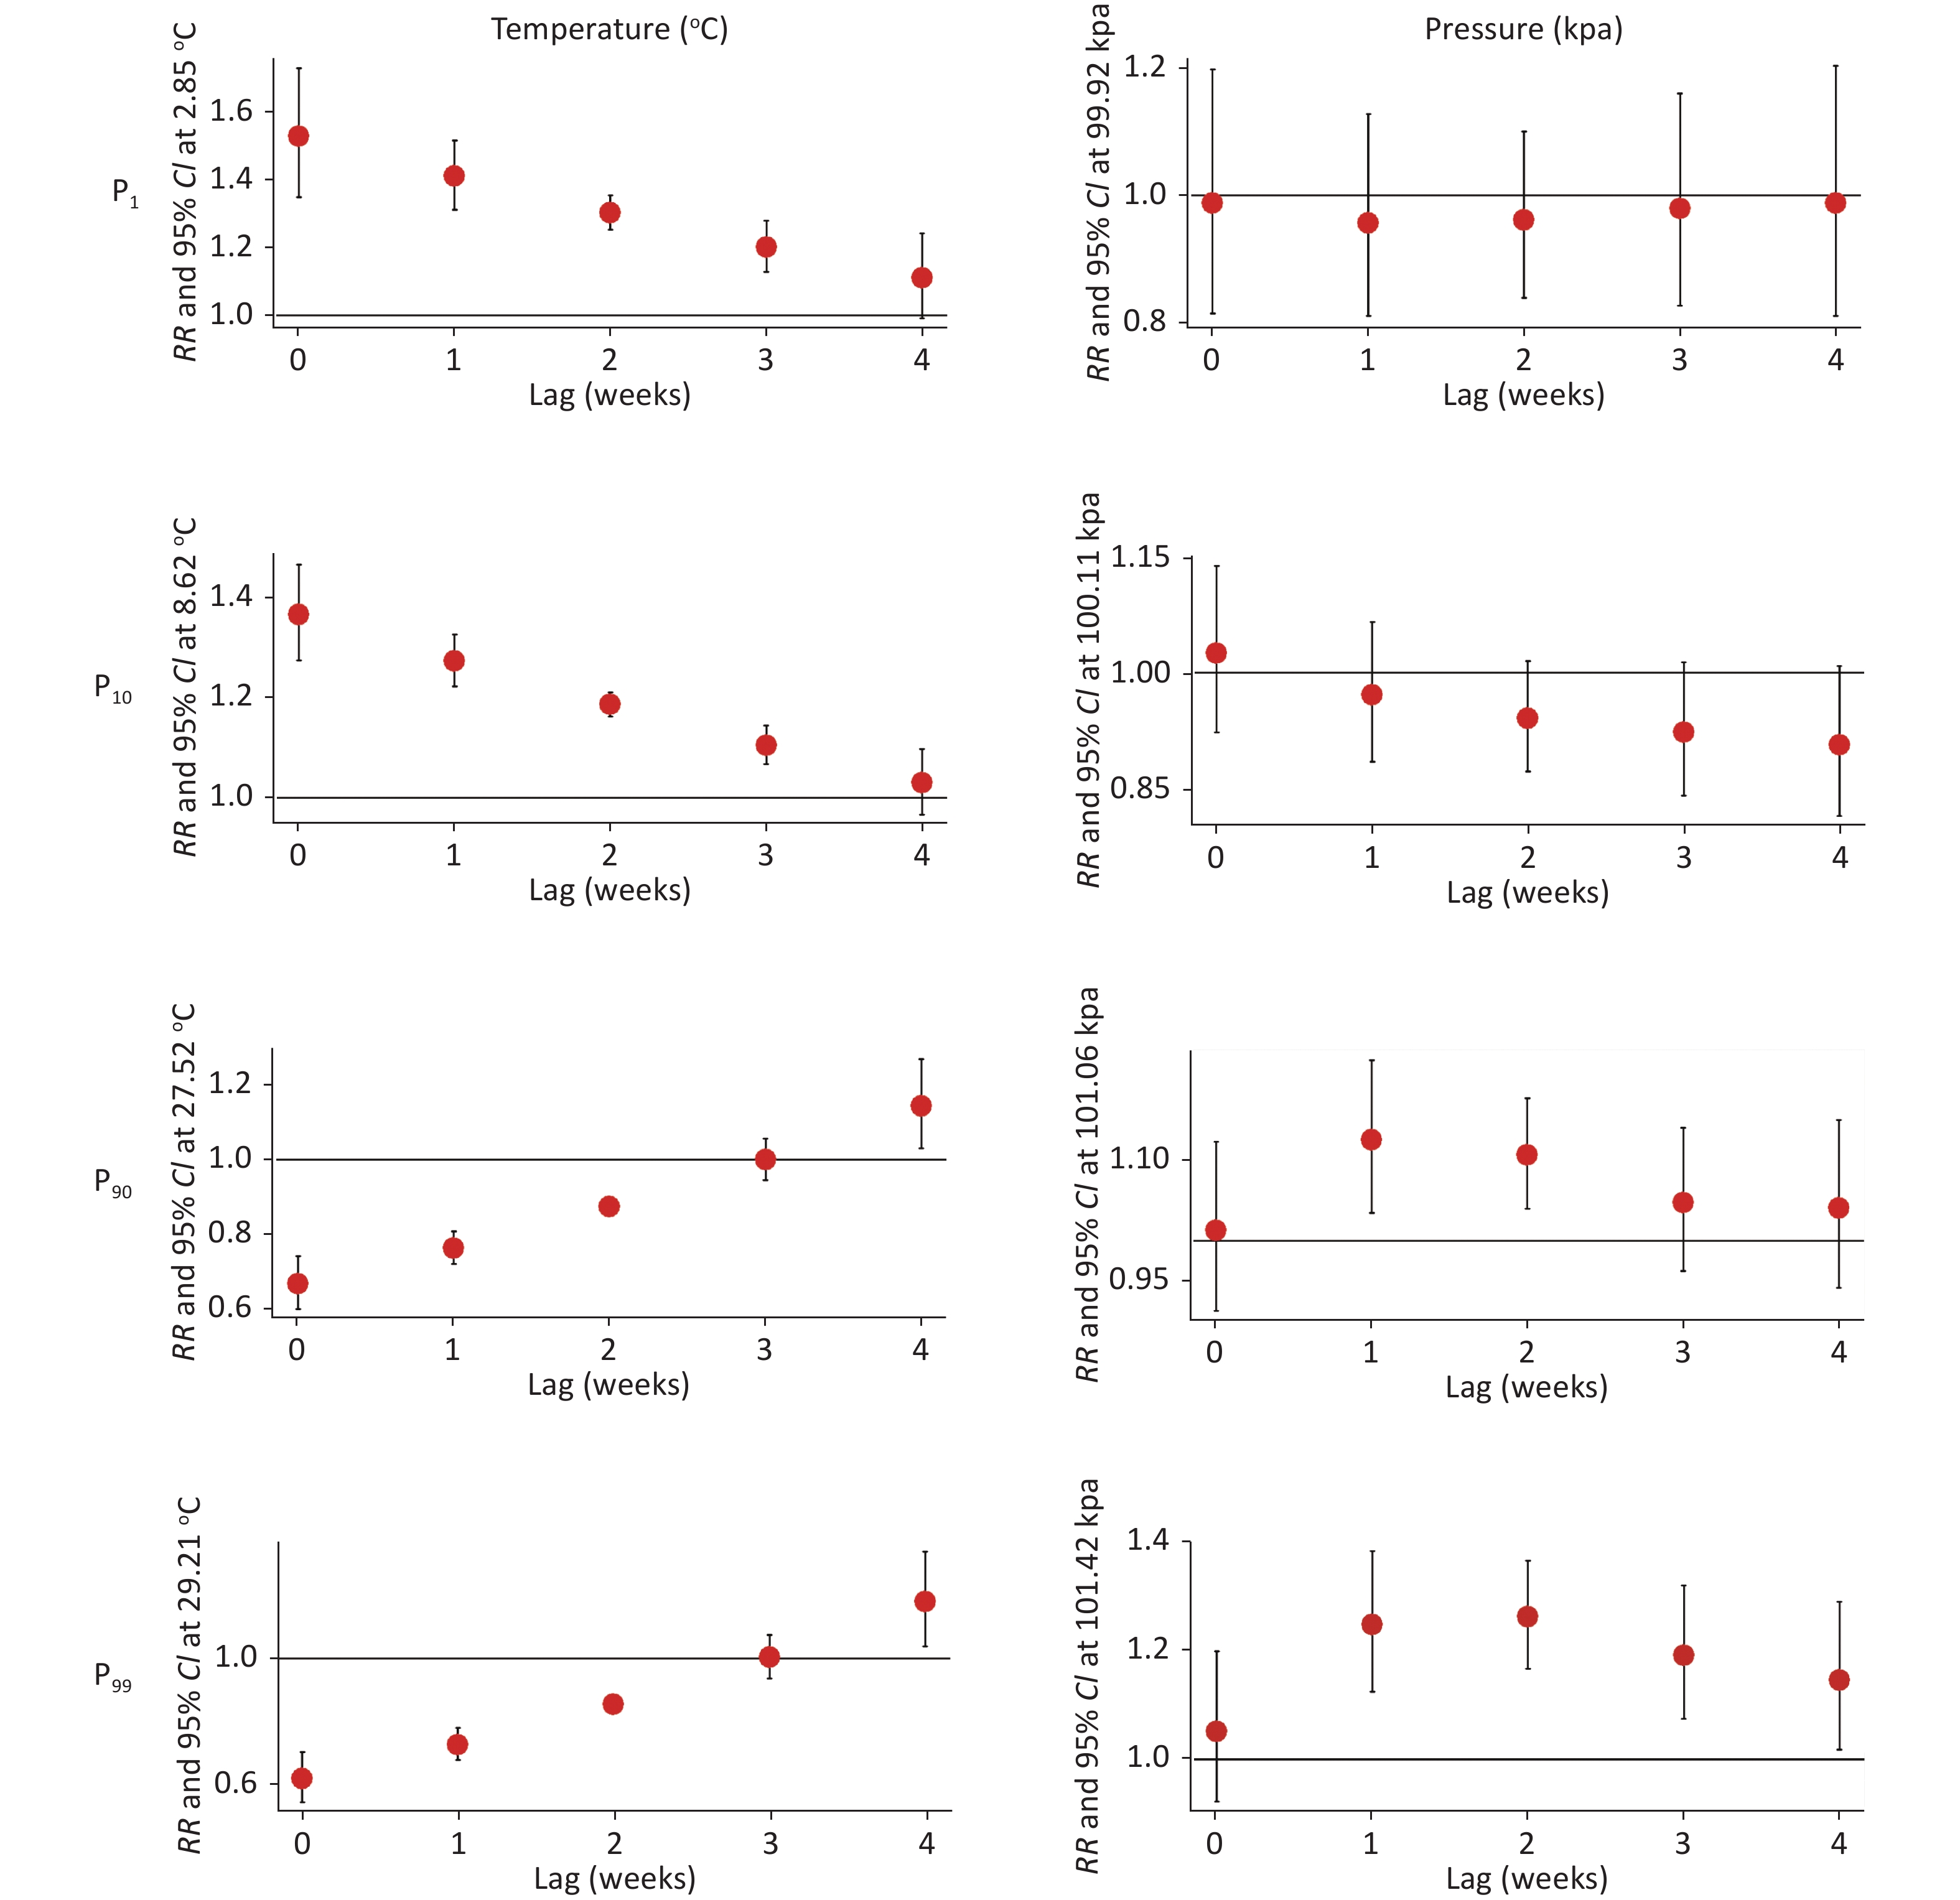
The relative risk (RR) of ILI incidence was elevated as temperature decreased. RR was highest (1.60, 95% CI: 1.37−1.86) when the temperature decreased to 0.5 °C at 0-week lag (Figure 1A). The cumulative exposure of temperature from 0 to 4 weeks indicated an increased RR with decreased temperature. RR was highest when the temperature dropped to 0.5 °C (4.63, 95% CI: 3.63−5.90; Figure 1C). As shown in Figure 2, lower temperatures (P1 = 2.85 °C, P10 = 8.62 °C) could increase the risk of ILI incidence, while higher temperatures (P90 = 27.52 °C, P99 = 29.21 °C) could increase the risk of ILI incidence for lag 0 to 3 weeks (Supplementary Table S3, available in www.besjournal.com). Consistent with our findings, low temperature is reportedly a risk factor for influenza at different lag periods[4]. Low temperature can promote the spread of influenza by prolonging the survival of the virus, increasing crowd contact, and affecting host immunity[5]. In addition, experiments performed with guinea pigs at different temperatures demonstrated that low temperature enhanced the transmission efficiency of influenza virus in the air. Breathing cold air could slow mucociliary clearance and thereby encourage the transmission of influenza virus in the respiratory tract. Moreover, low temperature may make the host more susceptible to influenza virus infection or prolong the course of disease after infection[6].
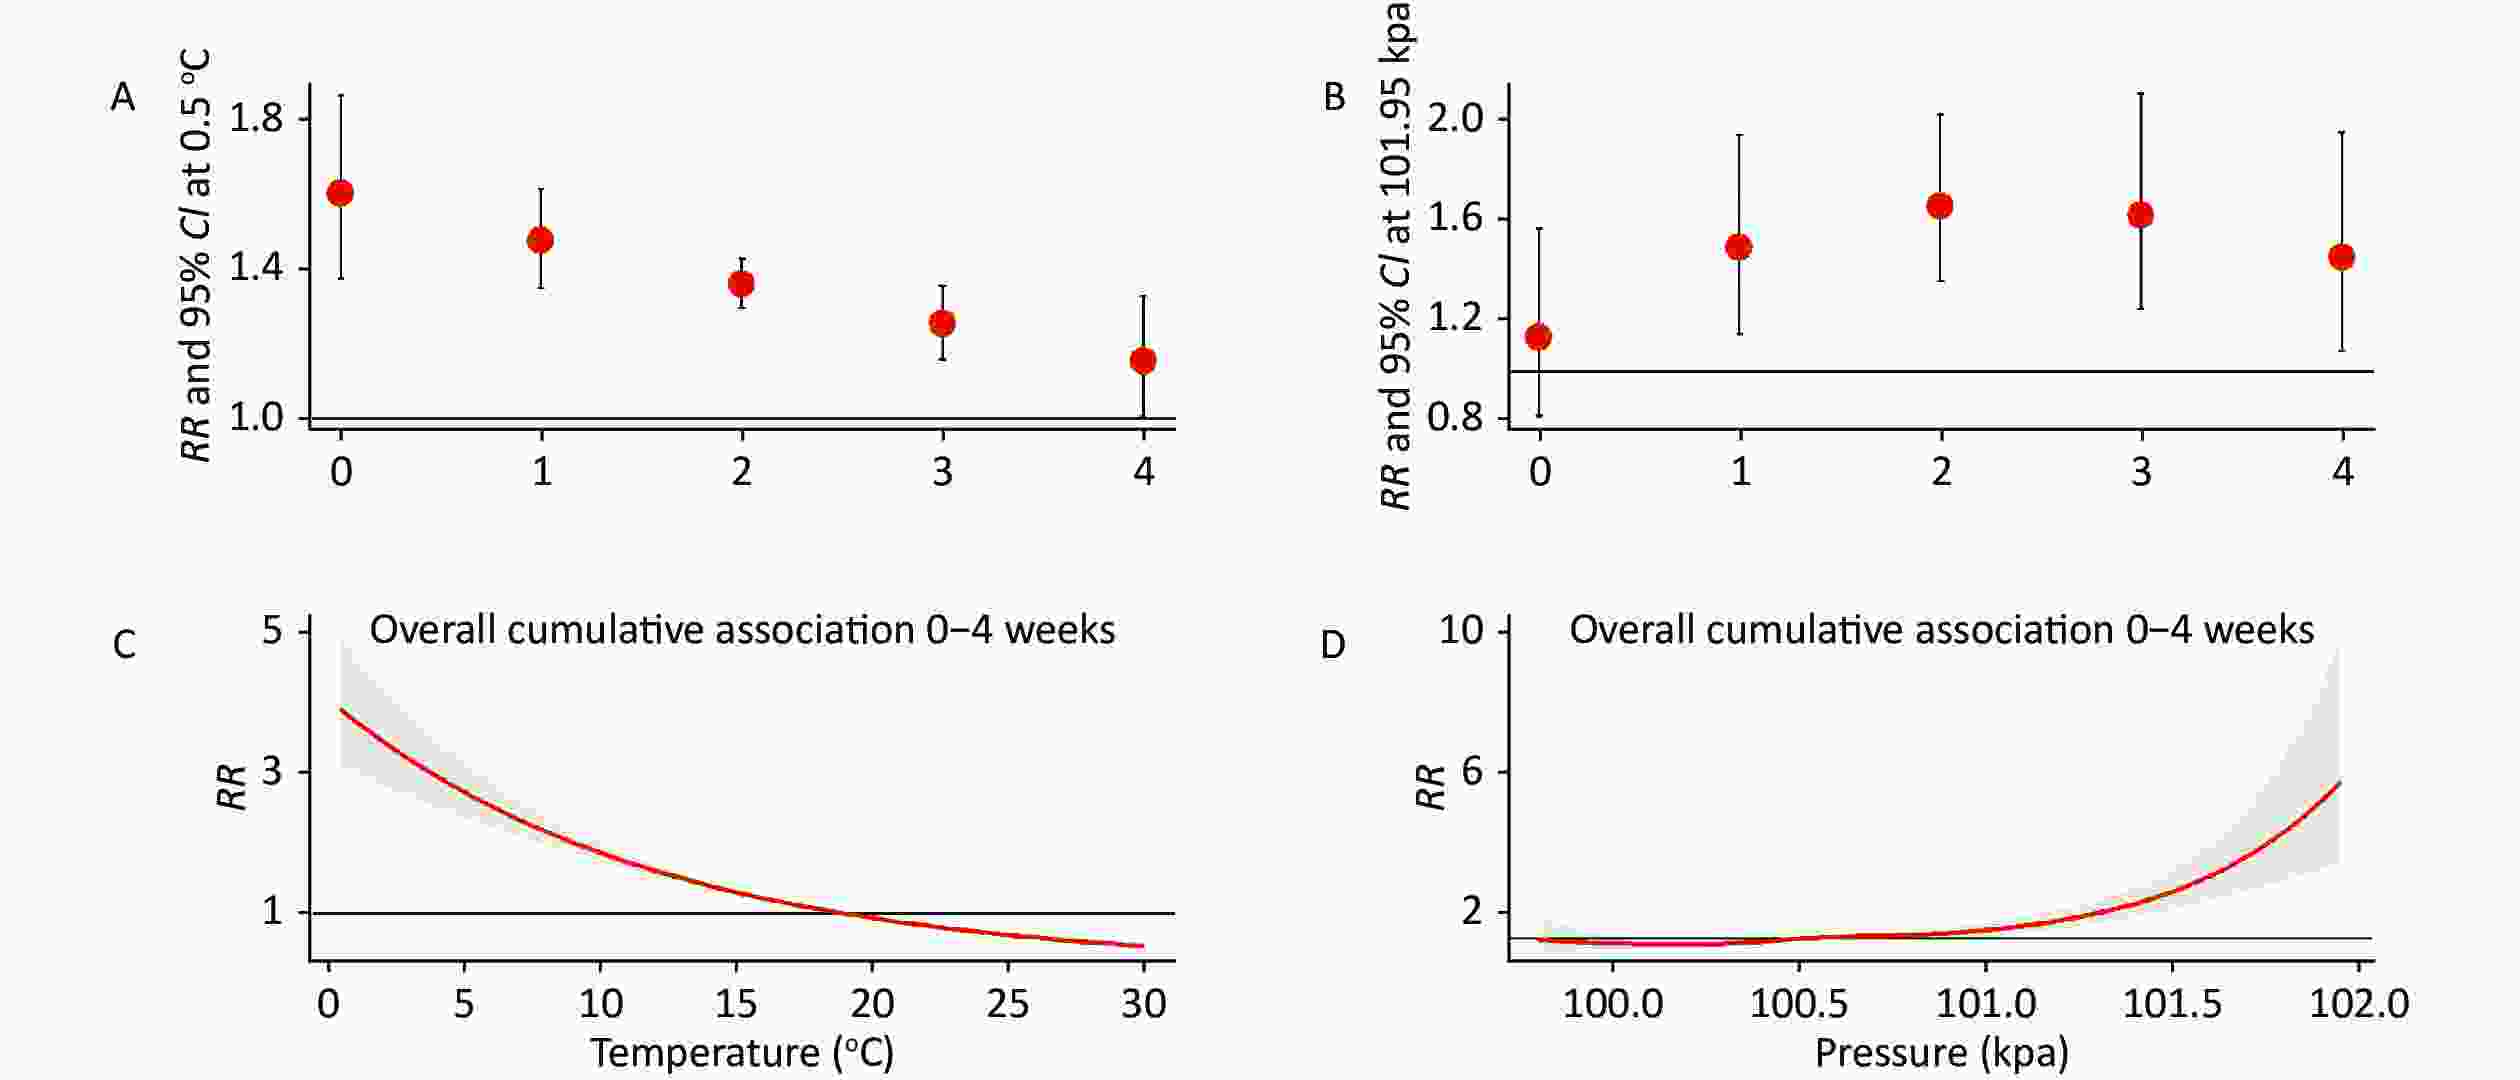
Figure 1. Associations of influenza-like illness (ILI) incidence with temperature and pressure. Lag-response associations of ILI incidence with temperature (A) and pressure (B). Cumulative associations of ILI incidence with temperature (C) and pressure (D).
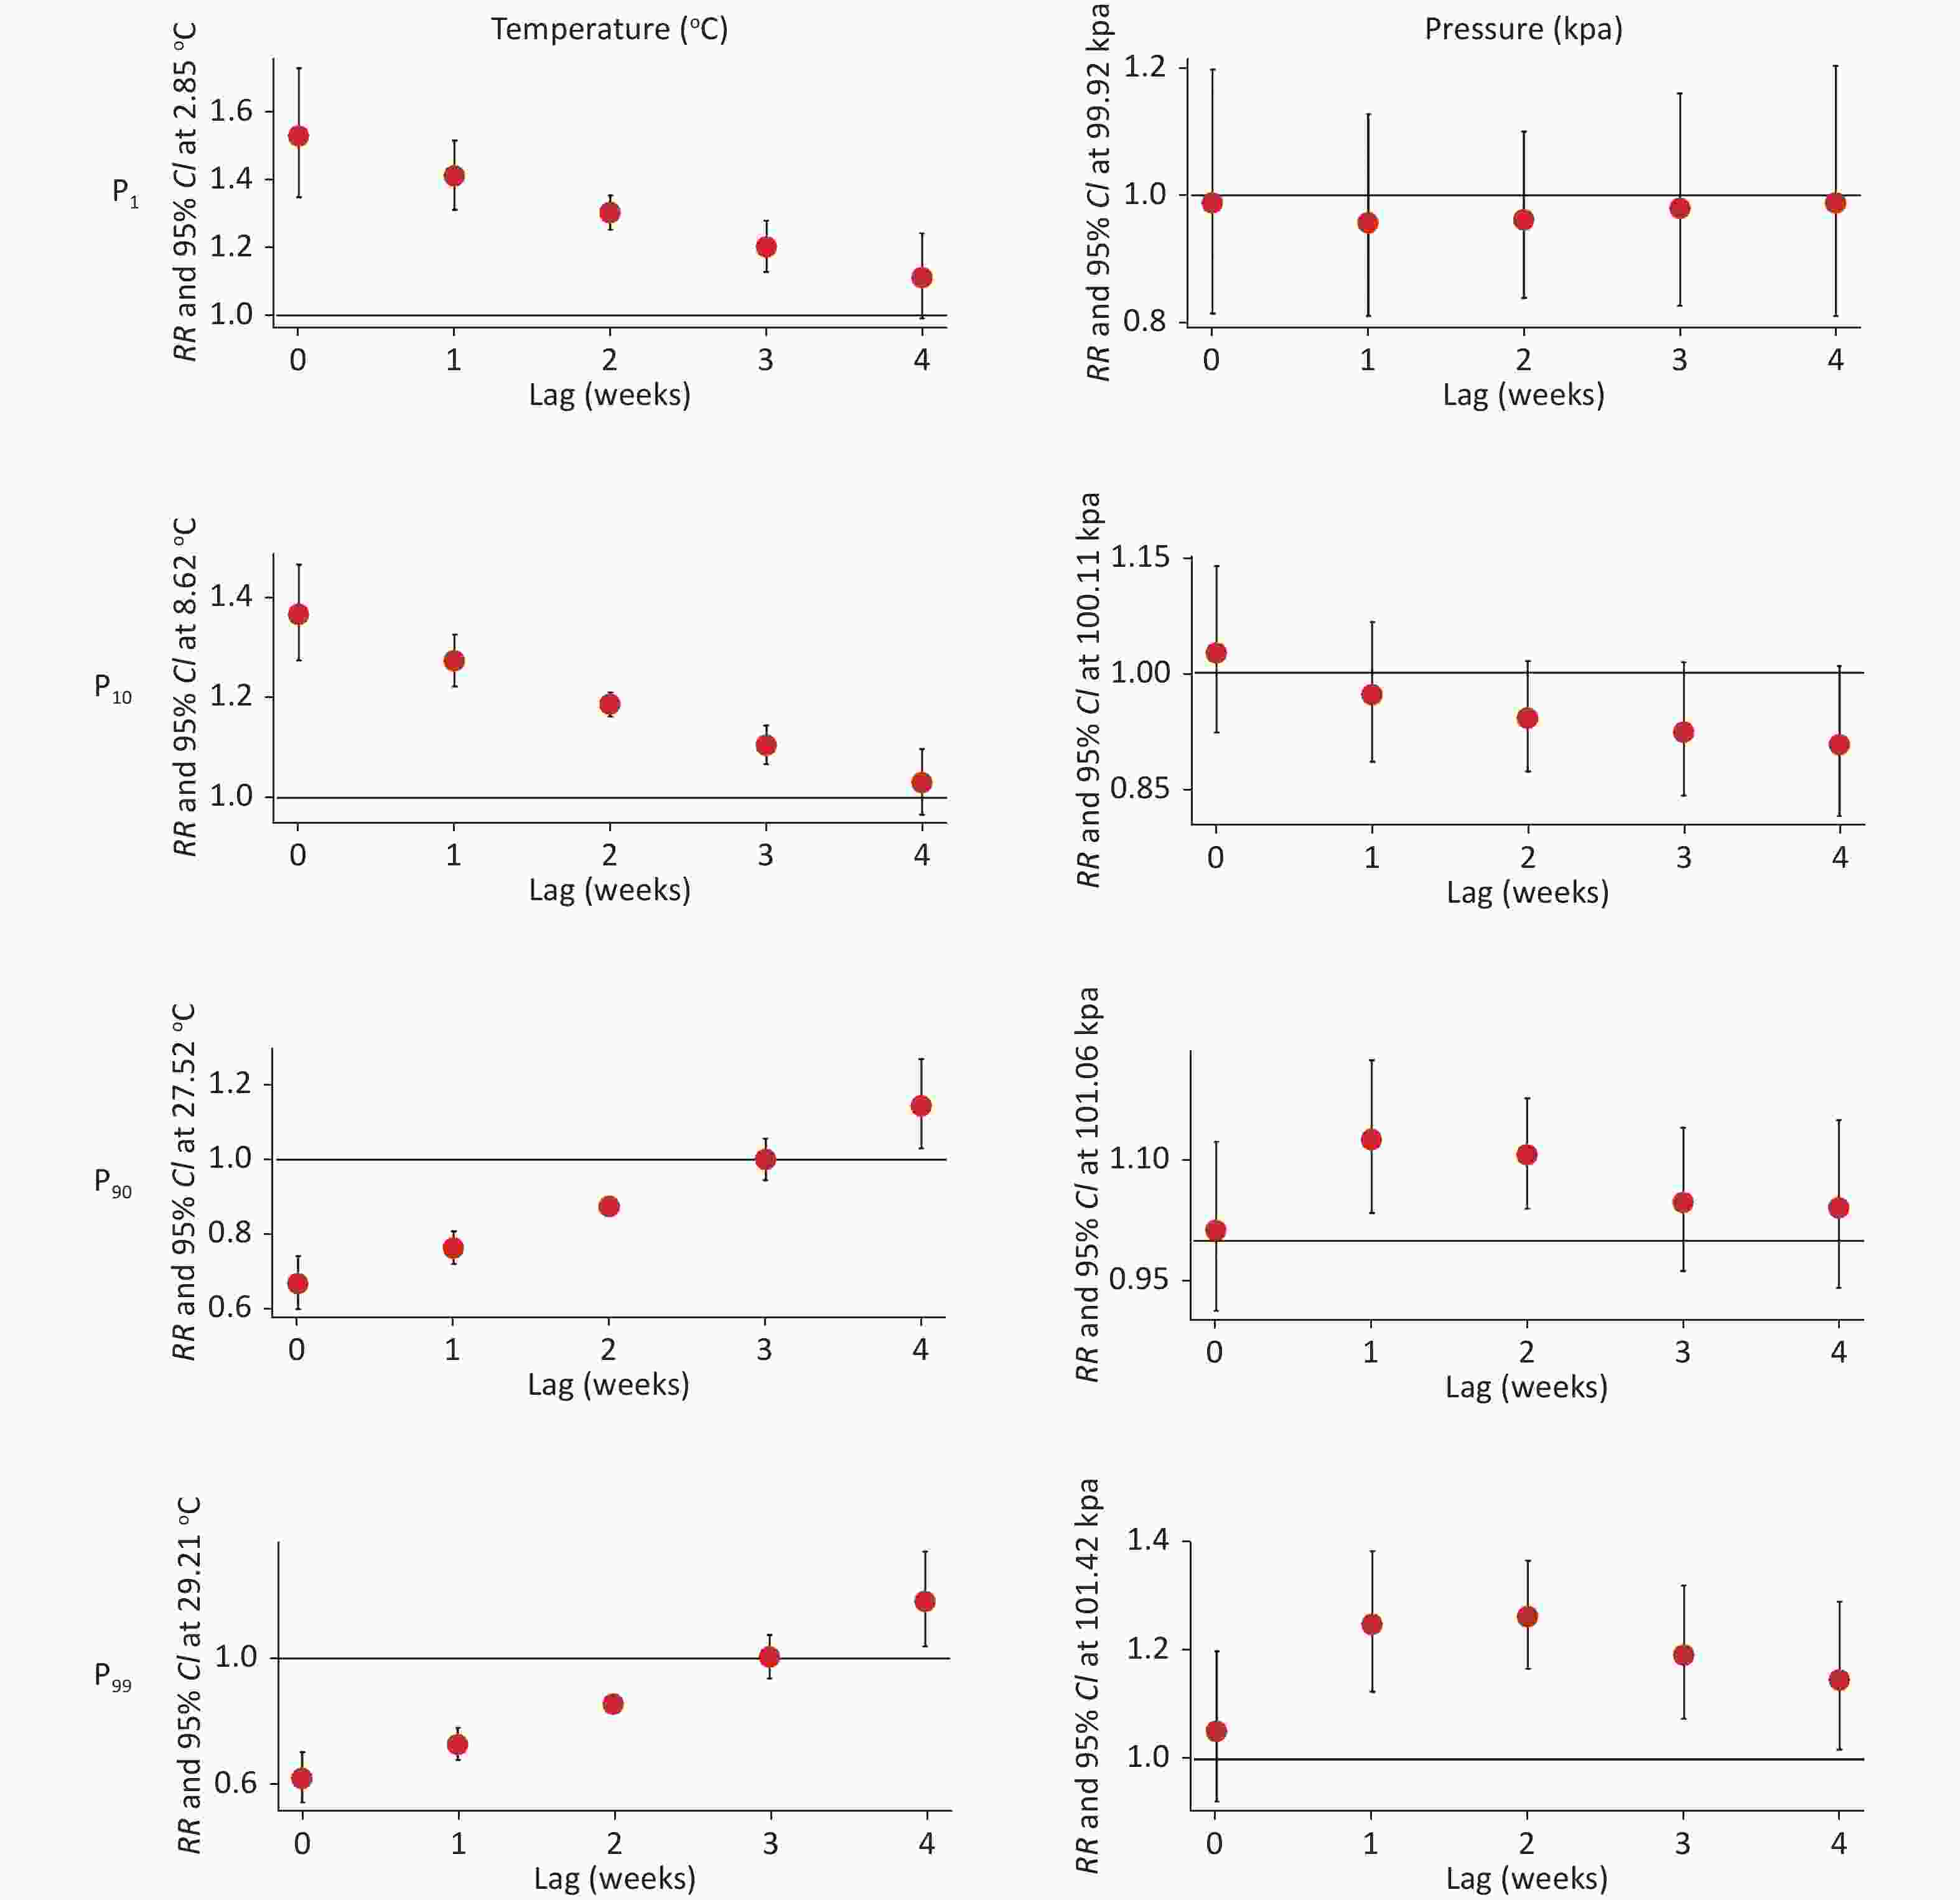
Figure 2. Effects of temperature (left) and pressure (right) on influenza-like illness (ILI) incidence estimated at the extreme values of P1, P10, P90, and P99.
Table S3. The RR values of the effect of temperatures at each percentile node on ILI at lag of 0–4 weeks
Lag weeks Values P1 = 2.85 °C P10 = 8.62 °C P90 = 27.52 °C P99 = 29.21 °C 0 RR 1.529* 1.369* 0.667* 0.617* (95% CI) 1.350–1.732 1.276–1.469 0.601–0.741 0.542–0.701 1 RR 1.411* 1.275* 0.763* 0.725* (95% CI) 1.312–1.518 1.225–1.328 0.721–0.808 0.676–0.778 2 RR 1.303* 1.188* 0.873* 0.853* (95% CI) 1.253–1.354 1.164–1.212 0.852–0.895 0.827–0.879 3 RR 1.202* 1.106* 0.999 1.003 (95% CI) 1.129–1.281 1.069–1.146 0.944–1.056 0.937–1.074 4 RR 1.110 1.031 1.143* 1.180* (95% CI) 0.991–1.242 0.967-1.099 1.03–1.268 1.039–1.34 0–4 RR 3.750* 2.366* 0.508* 0.451* (95% CI) 3.087–4.556 2.139–2.616 0.448–0.575 0.387–0.526 Note. *P < 0.05. ILI: influenza-like illness. At 1−4 weeks lag, pressure had a positive effect on ILI incidence. The RR was highest in the second week (1.66, 95% CI: 1.36−2.02; Figure 1B). Data of the cumulative exposure to pressure from 0 to 4 weeks showed that the RR increased with the increment of pressure. Pressure > 100.5 kpa increased the risk of ILI incidence. RR was highest when the pressure was 102.0 kpa (6.64, 95% CI: 3.74−11.80; Figure 1D). Lower pressures (P1 = 99.92 kpa, P10 = 100.11 kpa) did not influence ILI incidence, while general high pressure (P90 = 101.06 kpa) could increase the risk of ILI incidence for lag 1 to 2 weeks (Figure 2). Extremely high pressure (P99 = 101.42 kpa) could increase the risk of ILI incidence for lag 1 to 4 weeks (Supplementary Table S4, available in www.besjournal.com). Very few studies have examined the effects of atmospheric pressure on influenza. Some studies found that high pressure is associated with influenza. Pressure is an important determinant of weather. High pressure during winter can result in contraction of local blood vessels in the nasal cavity and small cracks in the mucous membrane. These changes can allow respiratory viruses to easily invade the body. In addition, because the inverse temperature layer of the atmosphere is relatively stable, air pollutants do not easily diffuse and self-purify. This favors the replication and spread of viruses, resulting in numerous viruses in the atmosphere[7]. High pressure often means a sunny day. The resulting increase in outdoor activities increases the risk of virus infection[8].
Table S4. The RR values of the effect of pressures at each percentile node on ILI at lag of 0–4 weeks
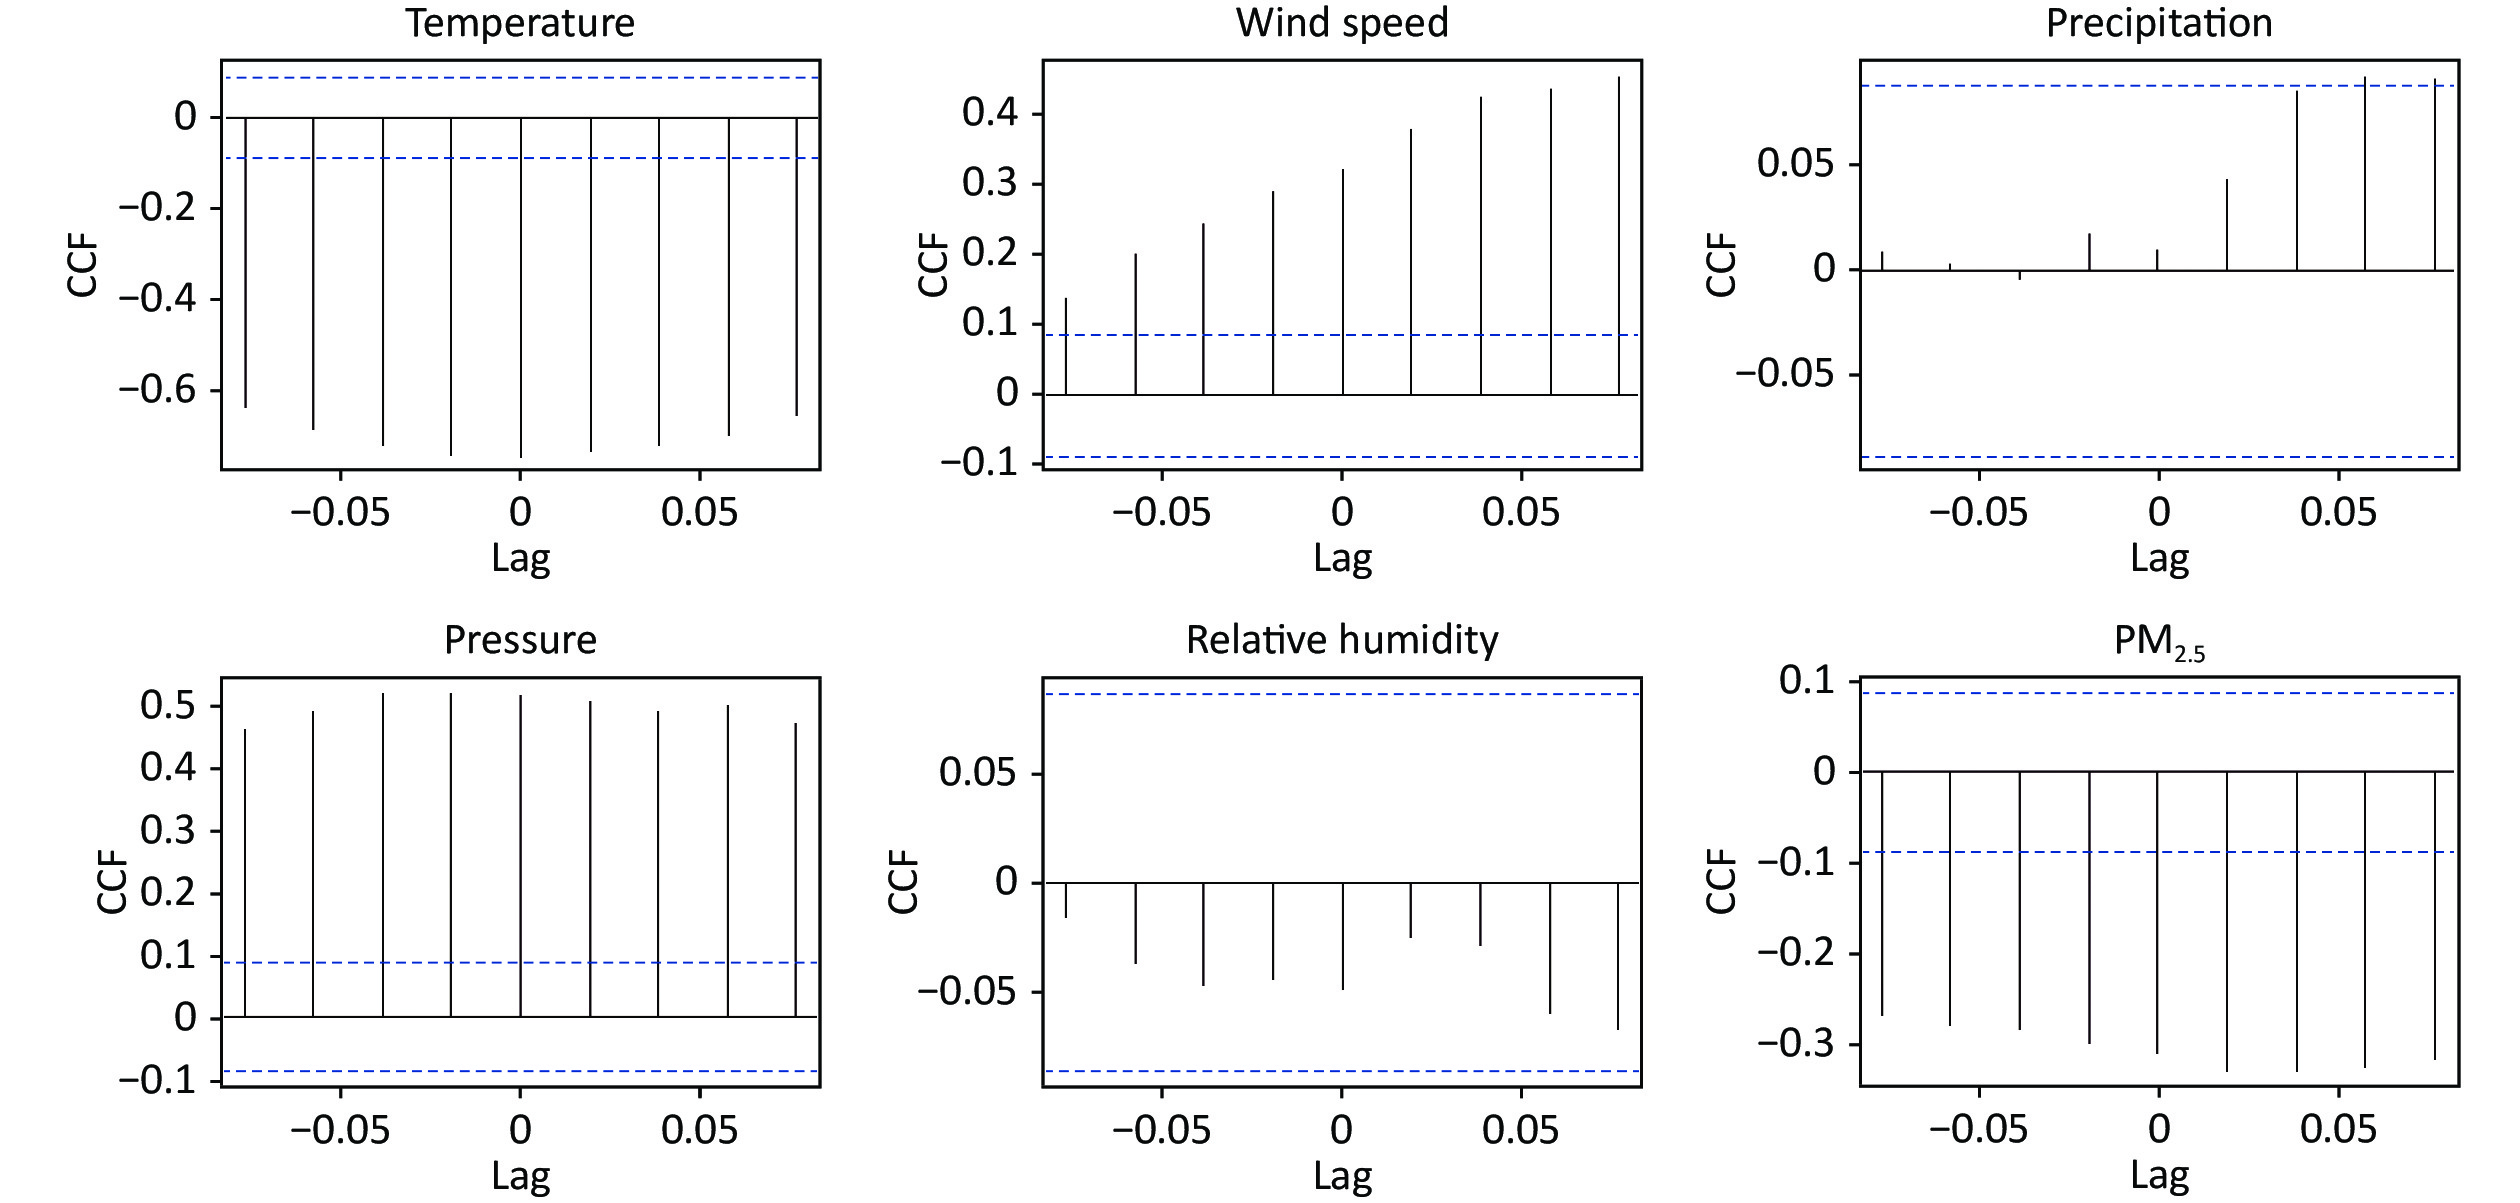
Lag weeks Values P1 = 99.92 kpa P10 = 100.11 kpa P90 = 101.06 kpa P99 = 101.42 kpa 0 RR 0.988 1.025 1.013 1.052 (95% CI) 0.816–1.196 0.923–1.137 0.913–1.123 0.923–1.199 1 RR 0.957 0.971 1.126* 1.247* (95% CI) 0.813–1.127 0.885–1.066 1.035–1.225 1.125–1.383 2 RR 0.962 0.941 1.107* 1.262* (95% CI) 0.841–1.1 0.873–1.015 1.04–1.178 1.167–1.366 3 RR 0.980 0.923 1.048 1.191* (95% CI) 0.828–1.159 0.842–1.013 0.962–1.14 1.075–1.32 4 RR 0.988 0.907 1.041 1.146* (95% CI) 0.813–1.202 0.815–1.008 0.941–1.151 1.018–1.29 0–4 RR 0.880 0.784 1.375* 2.261* (95% CI) 0.564–1.372 0.613–1.002 1.116–1.695 1.783–2.868 Note. *P < 0.05. The optimal SARIMA (1, 0, 0) (1, 1, 0)52 structured on our previous research results were used to build the SARIMAX models with meteorological factors as covariates[9]. The cross-correlation function was used to investigate relationships of meteorological factors and PM2.5 with ILI incidence. All the variables, except precipitation and relative humidity, were significantly correlated with ILI incidence (Supplementary Figure S2, available in www.besjournal.com). These findings were consistent with the preceding Spearman’s correlation analysis results. A total of four SARIMAX model parameters with covariates were significant, with decreased AIC values. The temperature lagged 1-week and 4-week (β = −0.276, P = 0.008; β = 0.216, P = 0.038), wind speed lagged 1-week (β = −0.672, P = 0.013), and pressure lagged 4-week (β = −1.802, P = 0.002) influenced ILI incidence (Table 1). SARIMAX (1, 0, 0) (1, 1, 0)52 with temperature at lag 1-week, wind speed at lag 0-week, and pressure at lag 4-week was the optimal model with the lowest AIC and BIC values. The SARIMAX model displayed a good fitting effect on the prediction of ILI incidence (Supplementary Table S5, Supplementary Figure S3, available in www.besjournal.com).
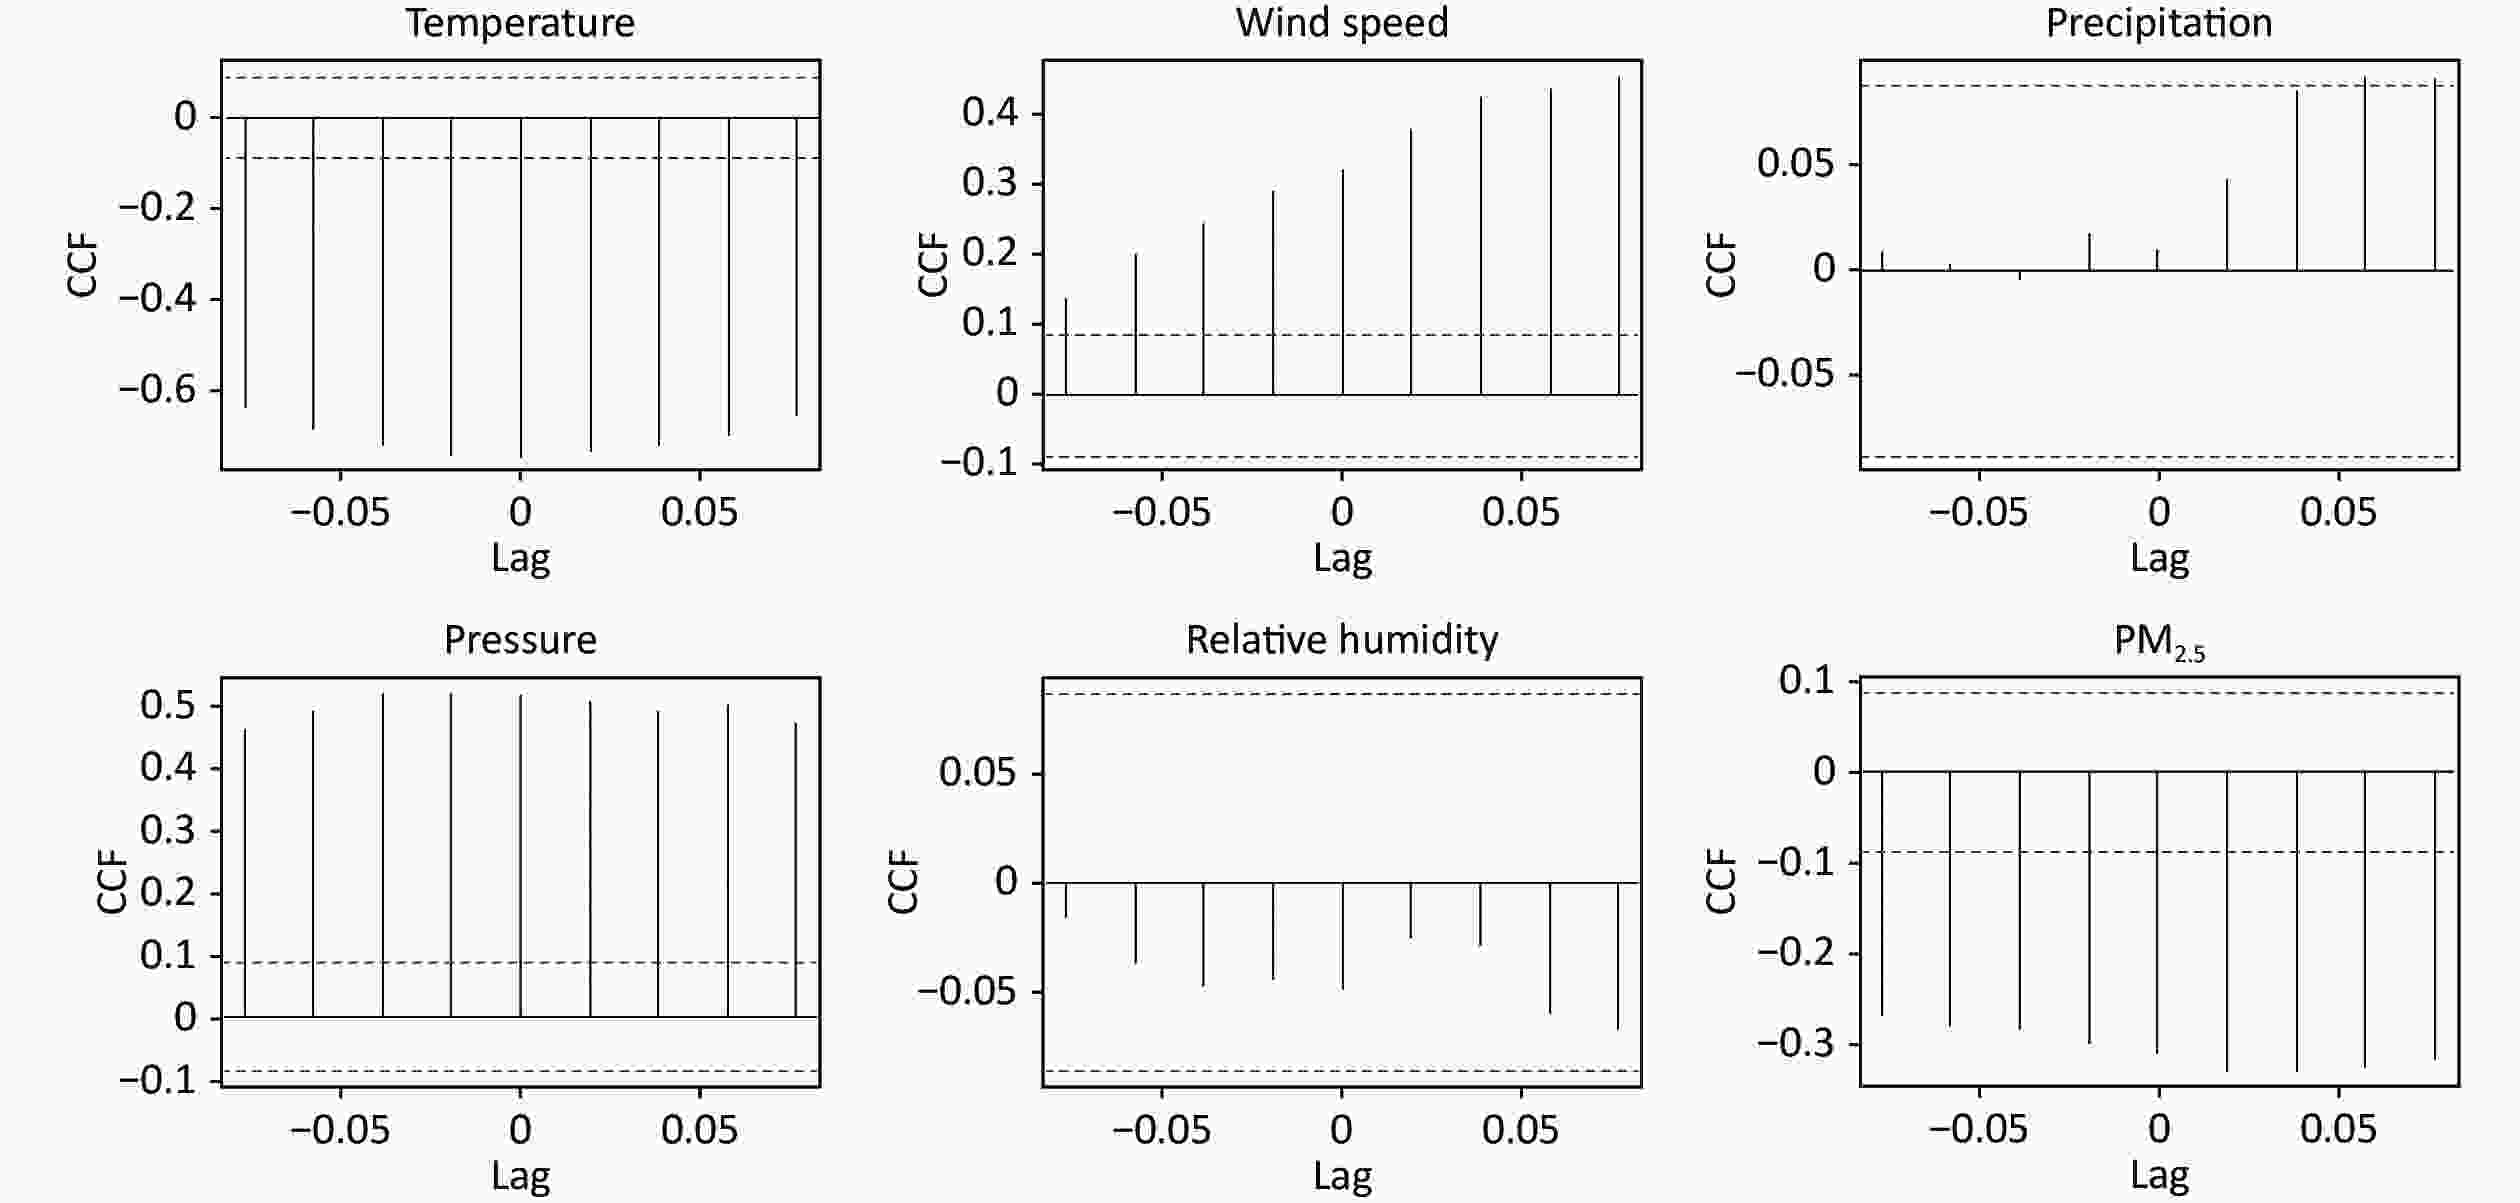
Figure S2. Correlations with pre-whitened meteorological factors and PM2.5. CCF: Cross-correlation Function
Table 1. SARIMAX models of ILI incidence with different meteorological factors and PM2.5
Model Meteorological factors AIC BIC Variables Lag β SE (β) P SARIMAX (1, 0, 0) (1, 1, 0)52 Temperature 0 0.042 0.105 0.688 2237.400 2252.990 SARIMAX (1, 0, 0) (1, 1, 0)52 1 −0.276 0.104 0.008* 2224.420 2240.000 SARIMAX (1, 0, 0) (1, 1, 0)52 2 0.023 0.104 0.826 2222.790 2238.360 SARIMAX (1, 0, 0) (1, 1, 0)52 3 −0.188 0.104 0.070 2214.520 2230.070 SARIMAX (1, 0, 0) (1, 1, 0)52 4 0.216 0.104 0.038* 2208.340 2223.880 SARIMAX (1, 0, 0) (1, 1, 0)52 Wind speed 0 −0.672 0.270 0.013* 2231.410 2247.000 SARIMAX (1, 0, 0) (1, 1, 0)52 1 0.057 0.272 0.835 2231.330 2246.910 SARIMAX (1, 0, 0) (1, 1, 0)52 2 −0.067 0.271 0.805 2222.780 2238.350 SARIMAX (1, 0, 0) (1, 1, 0)52 3 0.442 0.271 0.103 2215.150 2230.700 SARIMAX (1, 0, 0) (1, 1, 0)52 4 −0.361 0.275 0.189 2210.910 2226.450 SARIMAX (1, 0, 0) (1, 1, 0)52 Pressure 0 −0.059 0.594 0.921 2237.550 2253.140 SARIMAX (1, 0, 0) (1, 1, 0)52 1 0.424 0.602 0.481 2230.880 2230.880 SARIMAX (1, 0, 0) (1, 1, 0)52 2 1.101 0.589 0.062 2219.370 2234.930 SARIMAX (1, 0, 0) (1, 1, 0)52 3 −0.102 0.594 0.864 2217.760 2233.310 SARIMAX (1, 0, 0) (1, 1, 0)52 4 −1.802 0.586 0.002* 2203.300 2218.840 SARIMAX (1, 0, 0) (1, 1, 0)52 PM2.5 0 0.122 0.083 0.143 2235.420 2251.010 SARIMAX (1, 0, 0) (1, 1, 0)52 1 −0.016 0.083 0.849 2231.340 2246.910 SARIMAX (1, 0, 0) (1, 1, 0)52 2 0.022 0.083 0.795 2222.770 2238.340 SARIMAX (1, 0, 0) (1, 1, 0)52 3 0.052 0.083 0.534 2217.400 2232.960 SARIMAX (1, 0, 0) (1, 1, 0)52 4 −0.103 0.083 0.214 2211.090 2226.640 SARIMAX (1, 0, 0) (1, 1, 0)52 Temperature 1 −0.195 0.109 0.074 2198.740 2225.950 4 0.129 0.105 0.222 − − Wind speed 0 −0.600 0.267 0.024* − − Pressure 4 −1.504 0.596 0.012* − − SARIMAX (1, 0, 0) (1, 1, 0)52 Temperature 1 −0.211 0.109 0.049* 2198.230 2221.550 Wind speed 0 −0.596 0.267 0.026* − − Pressure 4 −1.672 0.581 0.004* − − Note. *: P < 0.05. AIC: Akaike Information Criterion; BIC: Bayesian information criterion. Table S5. Comparison between SARIMA model and SARIMAX model of ILI incidence
Model β P Ljung-Box Q Test MAE RMSE MAPE Statistics P SARIMA (1, 0, 0) (1, 1, 0)52 − − 21.822 0.149 5.230 7.905 33.698 AR1 0.886 < 0.001 − − − − − SAR1 −0.607 < 0.001 − − − − − SARIMAX (1, 0, 0) (1, 1, 0)52 − − 1.900 0.168 5.222 7.885 33.386 AR1 0.865 < 0.001 − − − − − SAR1 0.097 0.065 − − − − − Temperature lag1 −0.211 0.049 − − − − − Wind speed lag0 −0.596 0.026 − − − − − Pressure lag4 −1.672 0.004 − − − − − 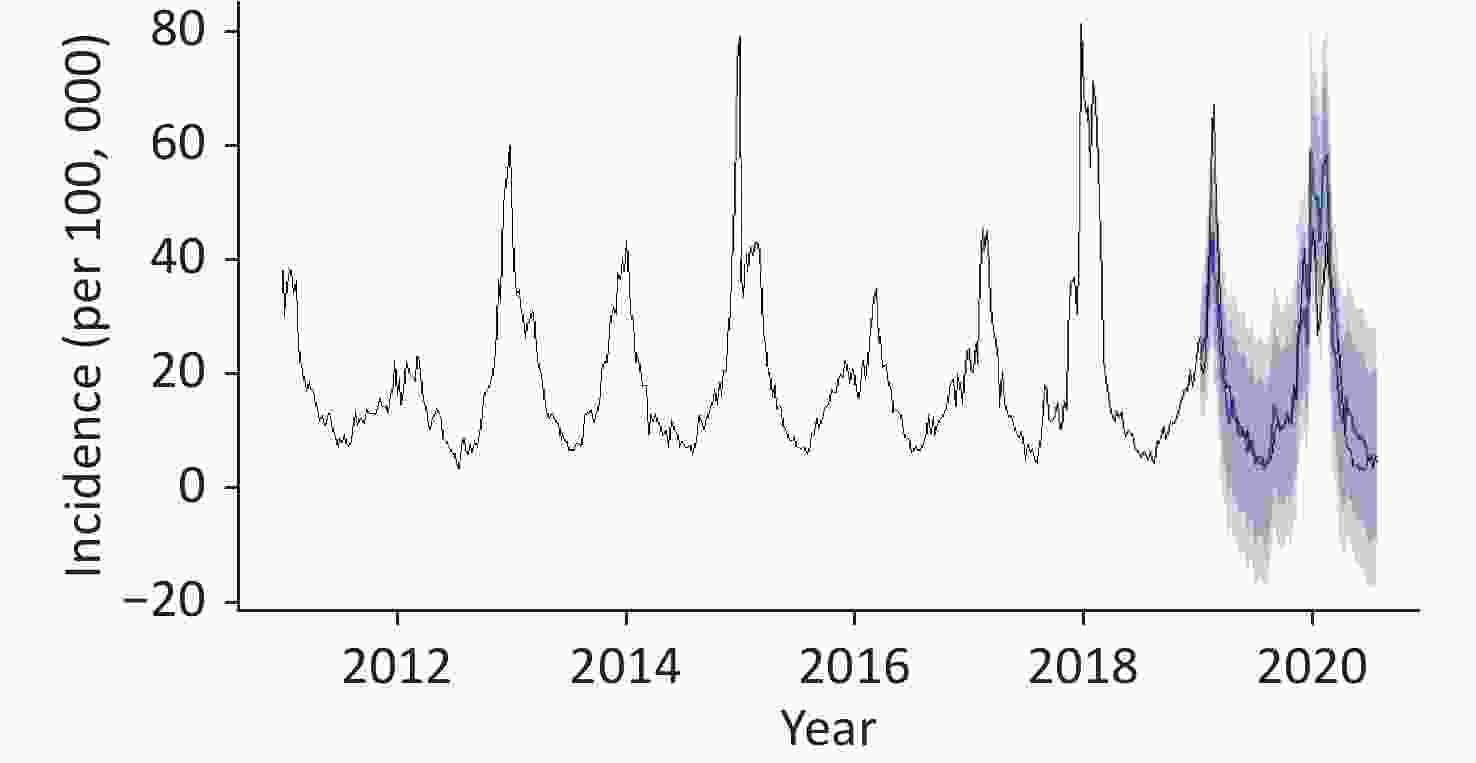
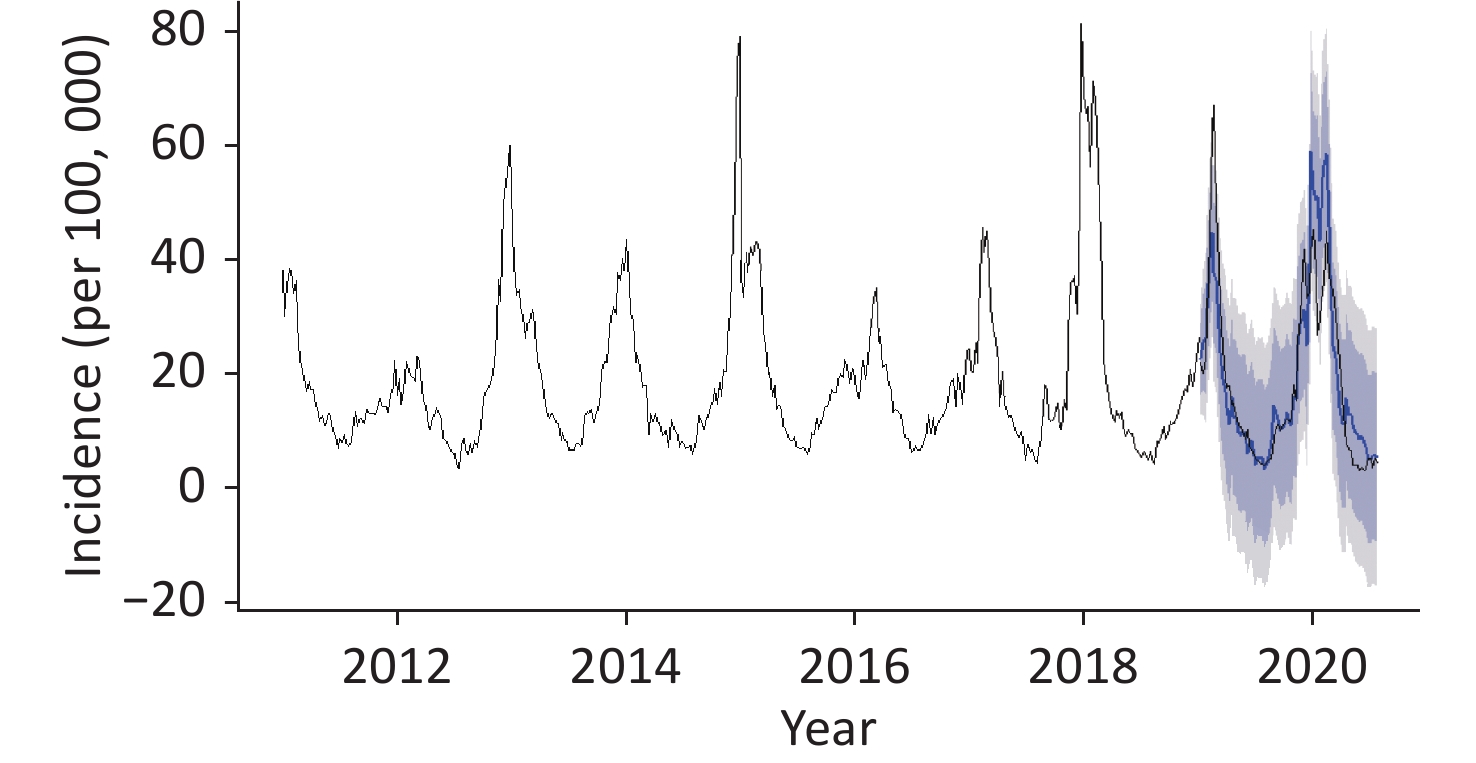
Figure S3. The observed and predicted value of influenza-like illness (ILI) incidence in Mississippi.
Wind speed was also included in the model as a covariate, in addition to the temperature and pressure variables, which were most strongly correlated with ILI. Wind speed is a common meteorological variable. However, its correlation with disease has not been studied extensively. We observed that the RR of ILI incidence increased significantly with increased wind speed at the 0-week lag. However, the incidence gradually decreased at wind speeds above 4 m/s. Wind can resuspend bacteria from soil or plant surfaces[10]. This increases the chances that the influenza virus will be redrawn into the respiratory tract. Based on common resuspension, higher wind speeds may dilute local bacterial concentrations[7,10], thus reducing the infection of influenza.
DLNMs and a 10-year time-series with covariates were respectively adopted in the correlation analysis and prediction. This enabled the simultaneous evaluation of the real-time and delayed effect of meteorological variation by capturing the true incidence of ILI incidence as much as possible. Nonetheless, several limitations need to be acknowledged. First, only the PM2.5 air pollution factor was considered when controlling for confounding factors. In subsequent studies, more air pollution factors should be included in the model and more mixed effects of meteorological factors and air pollution factors should be assessed. Second, the study was performed in a single subtropical city. The findings may not be generalizable to the regions with different climatic conditions.
In conclusion, lower temperatures and higher pressures were risk factors of ILI incidence in Mississippi. Greater attention should be paid to ILI incidence during periods of cold and in the winter when the air pressure is high. These findings will be helpful for establishing an early warning system, strengthening active prevention and intervention of disease risk factors, and reducing the burden of disease in society.
Declarations of Interest None
doi: 10.3967/bes2022.123
Association and Prediction of Influenza-like Illness with Meteorological Factors in Mississippi, USA
-
-
S1. Scatter plot of meteorological factors and PM2.5 with ILI incidence. ILI: influenza-like illness.
Figure 1. Associations of influenza-like illness (ILI) incidence with temperature and pressure. Lag-response associations of ILI incidence with temperature (A) and pressure (B). Cumulative associations of ILI incidence with temperature (C) and pressure (D).
Figure 2. Effects of temperature (left) and pressure (right) on influenza-like illness (ILI) incidence estimated at the extreme values of P1, P10, P90, and P99.
S2. Correlations with pre-whitened meteorological factors and PM2.5. CCF: Cross-correlation Function
S3. The observed and predicted value of influenza-like illness (ILI) incidence in Mississippi.
S1. Descriptive summary for ILI incidence, meteorological factors and PM2.5 in Mississippi, 2011–2020
Variables Mean Std P25 P50 P75 Min. Max. ILI incidence (per 100,000) 18.81 13.46 9.61 14.20 22.67 3.35 81.23 Temperature (°C) 18.54 7.26 12.11 18.97 25.73 0.13 30.26 Wind speed (m/s) 2.73 0.81 2.05 2.71 3.30 0.82 5.03 Precipitation (mm) 31.25 37.67 3.31 19.56 42.93 0.00 283.21 Pressure (kpa) 100.55 0.35 100.32 100.50 100.77 99.75 101.97 Relative humidity (%) 71.46 7.10 67.14 71.71 76.43 47.29 88.57 PM2.5 (μg/m3) 9.07 2.82 7.17 8.44 10.49 3.47 24.20 Note. ILI: influenza-like illness.  下载: 导出CSV
S2. Spearman correlation of meteorological factors and PM2.5 with ILI incidence in Mississippi, 2011–2020
Temperature Wind speed Precipitation Pressure Relative humidity PM2.5 ILI incidence −0.854** 0.430** 0.049 0.539** −0.087 −0.360** Note. **P < 0.001. ILI: influenza-like illness.
下载: 导出CSV
S3. The RR values of the effect of temperatures at each percentile node on ILI at lag of 0–4 weeks
Lag weeks Values P1 = 2.85 °C P10 = 8.62 °C P90 = 27.52 °C P99 = 29.21 °C 0 RR 1.529* 1.369* 0.667* 0.617* (95% CI) 1.350–1.732 1.276–1.469 0.601–0.741 0.542–0.701 1 RR 1.411* 1.275* 0.763* 0.725* (95% CI) 1.312–1.518 1.225–1.328 0.721–0.808 0.676–0.778 2 RR 1.303* 1.188* 0.873* 0.853* (95% CI) 1.253–1.354 1.164–1.212 0.852–0.895 0.827–0.879 3 RR 1.202* 1.106* 0.999 1.003 (95% CI) 1.129–1.281 1.069–1.146 0.944–1.056 0.937–1.074 4 RR 1.110 1.031 1.143* 1.180* (95% CI) 0.991–1.242 0.967-1.099 1.03–1.268 1.039–1.34 0–4 RR 3.750* 2.366* 0.508* 0.451* (95% CI) 3.087–4.556 2.139–2.616 0.448–0.575 0.387–0.526 Note. *P < 0.05. ILI: influenza-like illness.
下载: 导出CSV
S4. The RR values of the effect of pressures at each percentile node on ILI at lag of 0–4 weeks
Lag weeks Values P1 = 99.92 kpa P10 = 100.11 kpa P90 = 101.06 kpa P99 = 101.42 kpa 0 RR 0.988 1.025 1.013 1.052 (95% CI) 0.816–1.196 0.923–1.137 0.913–1.123 0.923–1.199 1 RR 0.957 0.971 1.126* 1.247* (95% CI) 0.813–1.127 0.885–1.066 1.035–1.225 1.125–1.383 2 RR 0.962 0.941 1.107* 1.262* (95% CI) 0.841–1.1 0.873–1.015 1.04–1.178 1.167–1.366 3 RR 0.980 0.923 1.048 1.191* (95% CI) 0.828–1.159 0.842–1.013 0.962–1.14 1.075–1.32 4 RR 0.988 0.907 1.041 1.146* (95% CI) 0.813–1.202 0.815–1.008 0.941–1.151 1.018–1.29 0–4 RR 0.880 0.784 1.375* 2.261* (95% CI) 0.564–1.372 0.613–1.002 1.116–1.695 1.783–2.868 Note. *P < 0.05.
下载: 导出CSV
Table 1. SARIMAX models of ILI incidence with different meteorological factors and PM2.5
Model Meteorological factors AIC BIC Variables Lag β SE (β) P SARIMAX (1, 0, 0) (1, 1, 0)52 Temperature 0 0.042 0.105 0.688 2237.400 2252.990 SARIMAX (1, 0, 0) (1, 1, 0)52 1 −0.276 0.104 0.008* 2224.420 2240.000 SARIMAX (1, 0, 0) (1, 1, 0)52 2 0.023 0.104 0.826 2222.790 2238.360 SARIMAX (1, 0, 0) (1, 1, 0)52 3 −0.188 0.104 0.070 2214.520 2230.070 SARIMAX (1, 0, 0) (1, 1, 0)52 4 0.216 0.104 0.038* 2208.340 2223.880 SARIMAX (1, 0, 0) (1, 1, 0)52 Wind speed 0 −0.672 0.270 0.013* 2231.410 2247.000 SARIMAX (1, 0, 0) (1, 1, 0)52 1 0.057 0.272 0.835 2231.330 2246.910 SARIMAX (1, 0, 0) (1, 1, 0)52 2 −0.067 0.271 0.805 2222.780 2238.350 SARIMAX (1, 0, 0) (1, 1, 0)52 3 0.442 0.271 0.103 2215.150 2230.700 SARIMAX (1, 0, 0) (1, 1, 0)52 4 −0.361 0.275 0.189 2210.910 2226.450 SARIMAX (1, 0, 0) (1, 1, 0)52 Pressure 0 −0.059 0.594 0.921 2237.550 2253.140 SARIMAX (1, 0, 0) (1, 1, 0)52 1 0.424 0.602 0.481 2230.880 2230.880 SARIMAX (1, 0, 0) (1, 1, 0)52 2 1.101 0.589 0.062 2219.370 2234.930 SARIMAX (1, 0, 0) (1, 1, 0)52 3 −0.102 0.594 0.864 2217.760 2233.310 SARIMAX (1, 0, 0) (1, 1, 0)52 4 −1.802 0.586 0.002* 2203.300 2218.840 SARIMAX (1, 0, 0) (1, 1, 0)52 PM2.5 0 0.122 0.083 0.143 2235.420 2251.010 SARIMAX (1, 0, 0) (1, 1, 0)52 1 −0.016 0.083 0.849 2231.340 2246.910 SARIMAX (1, 0, 0) (1, 1, 0)52 2 0.022 0.083 0.795 2222.770 2238.340 SARIMAX (1, 0, 0) (1, 1, 0)52 3 0.052 0.083 0.534 2217.400 2232.960 SARIMAX (1, 0, 0) (1, 1, 0)52 4 −0.103 0.083 0.214 2211.090 2226.640 SARIMAX (1, 0, 0) (1, 1, 0)52 Temperature 1 −0.195 0.109 0.074 2198.740 2225.950 4 0.129 0.105 0.222 − − Wind speed 0 −0.600 0.267 0.024* − − Pressure 4 −1.504 0.596 0.012* − − SARIMAX (1, 0, 0) (1, 1, 0)52 Temperature 1 −0.211 0.109 0.049* 2198.230 2221.550 Wind speed 0 −0.596 0.267 0.026* − − Pressure 4 −1.672 0.581 0.004* − − Note. *: P < 0.05. AIC: Akaike Information Criterion; BIC: Bayesian information criterion.
下载: 导出CSV
S5. Comparison between SARIMA model and SARIMAX model of ILI incidence
Model β P Ljung-Box Q Test MAE RMSE MAPE Statistics P SARIMA (1, 0, 0) (1, 1, 0)52 − − 21.822 0.149 5.230 7.905 33.698 AR1 0.886 < 0.001 − − − − − SAR1 −0.607 < 0.001 − − − − − SARIMAX (1, 0, 0) (1, 1, 0)52 − − 1.900 0.168 5.222 7.885 33.386 AR1 0.865 < 0.001 − − − − − SAR1 0.097 0.065 − − − − − Temperature lag1 −0.211 0.049 − − − − − Wind speed lag0 −0.596 0.026 − − − − − Pressure lag4 −1.672 0.004 − − − − −
下载: 导出CSV
-
[1] Iuliano AD, Roguski KM, Chang HH, et al. Estimates of global seasonal influenza-associated respiratory mortality: a modelling study. Lancet, 2018; 391, 1285−300. doi: 10.1016/S0140-6736(17)33293-2 [2] Chong KC, Lee TC, Bialasiewicz S, et al. Association between meteorological variations and activities of influenza A and B across different climate zones: a multi-region modelling analysis across the globe. J Infect, 2020; 80, 84−98. doi: 10.1016/j.jinf.2019.09.013 [3] Jing SL, Huo HF, Xiang H. Modeling the effects of meteorological factors and unreported cases on seasonal influenza outbreaks in Gansu Province, China. Bull Math Biol, 2020; 82, 73. doi: 10.1007/s11538-020-00747-6 [4] Dai QG, Ma W, Huang HD, et al. The effect of ambient temperature on the activity of influenza and influenza like illness in Jiangsu Province, China. Sci Total Environ, 2018; 645, 684−91. doi: 10.1016/j.scitotenv.2018.07.065 [5] Munshili Njifon HL, Monamele CG, Kengne Nde C, et al. Influence of meteorological parameters in the seasonality of influenza viruses circulating in Northern Cameroon. Influenza Other Respir Viruses, 2019; 13, 158−65. doi: 10.1111/irv.12612 [6] Liu ZD, Zhang J, Zhang Y, et al. Effects and interaction of meteorological factors on influenza: based on the surveillance data in Shaoyang, China. Environ Res, 2019; 172, 326−32. doi: 10.1016/j.envres.2019.01.053 [7] Lu JY, Chen ZQ, Liu YH, et al. Effect of meteorological factors on scarlet fever incidence in Guangzhou City, Southern China, 2006-2017. Sci Total Environ, 2019; 663, 227−35. doi: 10.1016/j.scitotenv.2019.01.318 [8] Willem L, Van Kerckhove K, Chao DL, et al. A nice day for an infection? Weather conditions and social contact patterns relevant to influenza transmission. PLoS One, 2012; 7, e48695. doi: 10.1371/journal.pone.0048695 [9] Song ZJ, Jia XC, Bao JZ, et al. Spatio-temporal analysis of influenza-like illness and prediction of incidence in high-risk regions in the United States from 2011 to 2020. Int J Environ Res Public Health, 2021; 18, 7120. doi: 10.3390/ijerph18137120 [10] Zhong X, Qi JH, Li HT, et al. Seasonal distribution of microbial activity in bioaerosols in the outdoor environment of the Qingdao coastal region. Atmos Environ, 2016; 140, 506−13. doi: 10.1016/j.atmosenv.2016.06.034 -
 22178Supplementary Materials.pdf

-

 点击查看大图
计量
- 文章访问数: 1095
- HTML全文浏览量: 522
- PDF下载量: 91
- 被引次数: 0


 Quick Links