

 下载:
下载:

-
Ionizing radiation can have different effects in the moderately radiosensitive thyroid gland. Although radiation therapy is widely used for the treatment of thyroid diseases, many negative effects have been noticed in acute and chronic radiation exposure, most notably in subjects exposed to high radiation doses. Since the atomic bomb explosion in Japan, several studies have been conducted to assess the relation between ionizing radiation and thyroid injury[1]. Numerous epidemiological investigations and animal experiments have revealed that ionizing radiation can result in long-term adverse effects[2-4]. Radiation workers are inevitably exposed to ionizing radiation in the workplace. With developments in modern medicine, radio-diagnosis and radiotherapy are increasingly used[5], resulting in an increase in the occupationally exposed population[6].
Although some international epidemiological studies have reported on the association between radiation dose and thyroid health, the conclusions of these studies were drawn based on short term high-dose radiation exposure (acute exposure) and thus, they may not be applicable to medical radiation workers exposed to long-term, low-dose ionizing radiation (chronic exposure)[4]. A previous study has reported that the radiation dose in the occupationally exposed population is significantly lower than that among Chernobyl clean-up workers[7]. Much research is needed to demonstrate the effect of occupational low-dose ionizing radiation exposure on thyroid health.
Thyroid hormone testing, including triiodothyronine (T3), thyroxine (T4), and thyroid-stimulating hormone (TSH) assessments, are frequently used to evaluate thyroid function. However, in China, thyroid function testing is not mandatory among clinical radiation workers during occupational health examinations[8]. Although some studies have reported on the influence of radiation exposure on the thyroid function of medical radiation workers[9,10], most of them have failed to establish a causal relation between the sequence of radiation exposure and effects on health due to their cross-sectional design. In addition, few studies have compared individual dose levels with thyroid hormone measurements to evaluate the direct association between long-term, low-dose occupational ionizing radiation exposure and thyroid function in medical radiation workers.
Therefore, we aimed to evaluate the association between low-dose occupational radiation exposure and thyroid function among medical radiation workers in a retrospective cohort. Towards this goal, we compared the serum TSH, T3, and T4 levels among medical radiation workers with radiation doses determined using a thermoluminescent dosimeter (TLD).
-
In this retrospective cohort study, we combined information of all medical radiation workers registered in the Occupational Health Inspection Information System (OHIIS) and Personal Dose Monitoring System (PDMS) of the Guangdong Occupational Disease Prevention and Control Institute (GDODPCI) between 2010 and 2019. This study included all medical radiation workers employed at 20 tertiary Grade-A hospitals in Guangzhou, China, from January 1, 2010 to December 31, 2019.
The inclusion criteria were (a) being a medical radiation worker before January 1, 2019, (b) availability of personal external radiation doses of 4 consecutive monitoring cycles and ≥ 2 physical examination results during the study period, and (c) non-exposure to a major radiation accident during the study period. We excluded workers who had been diagnosed with thyroid disease or who had a history of thyroid surgery before the beginning of follow-up and workers who had abnormal thyroid hormone levels at baseline. The results of thyroid hormone levels during pregnancy were also excluded. Information on age, gender, type of work, occupational history, and dates and results of occupational health examinations was extracted from the OHIIS.
Follow-up of the cohort started the date of first registration in the OHIIS and finished the last recorded date in the GDODPCI between January 1, 2010 and December 31, 2019. Because there were different times at which the first physical examination was performed, we defined the first physical examination of each worker during the study period as the baseline physical examination and the subsequent radiation physical examination as the follow-up physical examination. The number of follow-up years was defined as the year of the first physical examination subtracted from the year of the last follow-up physical examination. The subjects were divided into four groups according to their type of work: diagnostic radiology, radiotherapy, nuclear medicine, and interventional radiology.
-
Because the PDMS does not provide an estimate of the thyroid-absorbed dose, we could not estimate the thyroid equivalent dose. Thus, this study used external individual doses based on occupational radiation exposure absorbed from the time of placement of a radiation dosimeter on the body of a worker at a 10-mm depth, HP (10). As the annual exposure dose of radiation workers is usually lower than the limit, HP (10) can be directly regarded as the effective dose according to the national standard (Ministry of Health, People’s Republic of China. GBZ 128-2016 Code for personal monitoring of Occupational External Exposure[S]. Beijing: People’s Medical Publishing House, 2016)[11]. The cumulative dose equivalent of four consecutive monitoring periods (3 months each) was considered as the annual effective dose. The relevant Equations were:
$$ {{{\rm{E}}}}=\sum\limits _{T}{W}_{T}\cdot {H}_{T, R} $$ (1) $$ {{{\rm{D}}}}=\sum\limits _{i=1}^{4}{E}_{i} $$ (2) $$ {\bar {{\rm{D}}}}=\frac{\sum _{j=1}^{Y}{D}_{j}}{Y} $$ (3) where E is the radiation exposure dose [in millisieverts (mSv)] of each period; WT is the weighting factor of each tissue; HT, R is the equivalent dose of each tissue; D is the annual cumulative effective dose (in mSv);
$ {E}_{i} $ is the radiation exposure dose in the i-th period of a year; Y is the number of monitoring years;${\bar {{\rm{D}}}}$ is the average annual effective dose (in mSv) during the study period; and$ {D}_{j} $ is the radiation exposure dose in the j-th year of worker monitoring in the GDODPCI.The TLD was always worn on the left chest. Staff who worked in high-dose workplaces (i.e. interventional radiology units) was required to wear two TLDs, one under their lead aprons and another outside their lead scarves to estimate the radiation dose. The effective dose of external radiation was calculated using the following Equation, in accordance with the national standard:
$$ E=0.5{H}_{W}+0.025{H}_{N} $$ (4) where HN is the HP (10) outside the lead scarves and HW is the HP (10) under the lead apron. Generally, HW was considered as the effective dose of external radiation. Considering the influence of different measurement methods, we stipulated that E could be calculated using this equation only when HN/HW > 20.
We administered a uniform questionnaire to workers whose effective dose per year was higher than the investigation level (5 mSv/a, i.e., 1.25 mSv/quarter) to verify the authenticity of the results of the individual dose monitoring. When individual dose monitoring results could not truly reflect the dose received in the corresponding monitoring cycle, we used the notional dose instead.
-
Serum thyroid hormones and TSH are the common biological diagnostic indicators of thyroid function. Thyroid assessments include total T3 (T3), total T4 (T4), free T3 (FT3), free T4 (FT4), reverse T3 (rT3), and thyroxine-binding globulin (TBG). Although FT3 and FT4 levels can reflect thyroid function more accurately, only serum TSH, T3, and T4 levels were analyzed due to their availability at the GDODPCI.
All workers underwent annual occupational health examinations at the Department of Occupational Health of the GDODPCI at least twice during the study period. Whole blood samples were collected in the morning, allowed to clot at room temperature, and centrifuged (3,000 g/min, 10 min) to extract the serum. Serum T3, T4, and TSH levels were determined using a chemiluminescence immunoassay analyzer using their respective assay kits (Siemens, Japan). Standard solutions were obtained from the TSH, T3, and T4 assay kits (Siemens, Japan). Reference values were based on the specifications of the testing instruments and assay kits used: TSH, 0.2 × 10⁻³ U/L–5.5 ×10−3 U/L; T3, 0.9–2.8 nmol/L; and T4, 57–161 nmol/L. All examination results were reviewed and confirmed by a professional endocrinologist.
-
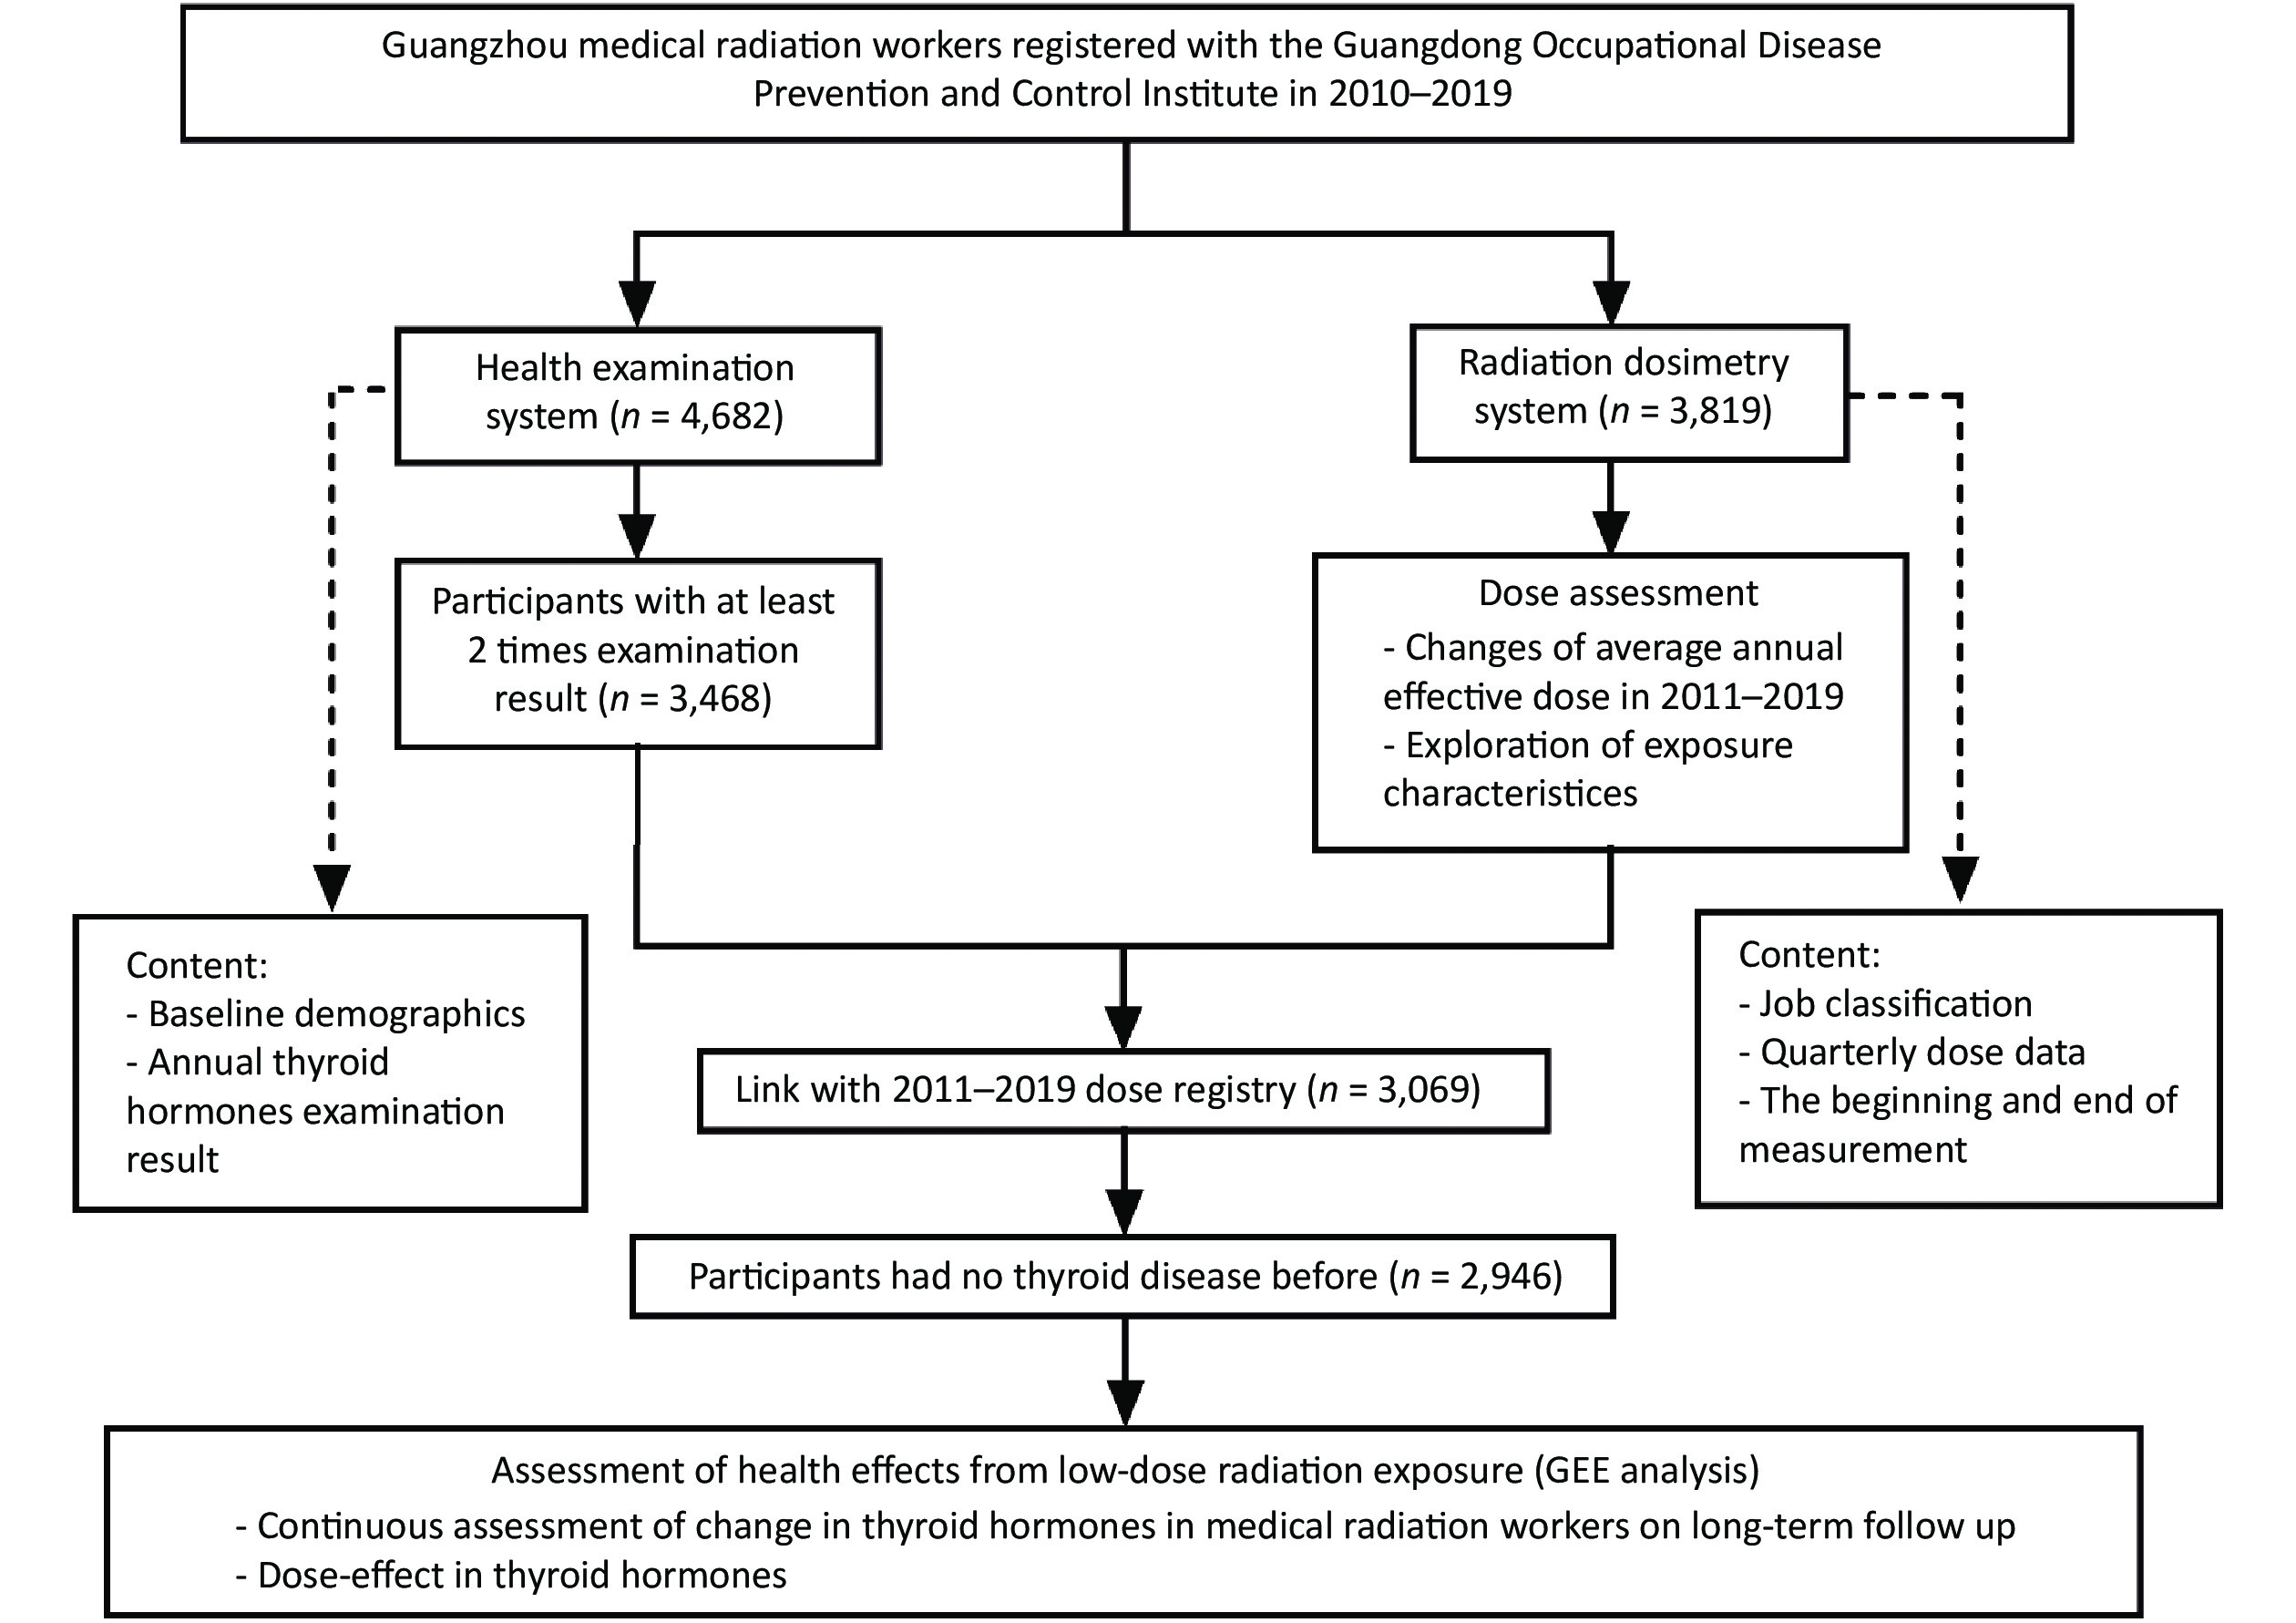
First, we investigated the trends in the annual effective dose among radiation workers with different occupations and gender. Next, we assessed the effect of low levels of ionizing radiation on thyroid hormone levels. Figure 1 shows the study flow diagram. We combined all data of the participants according to name and work unit because personal identification numbers were unavailable in the PDMS. All continuous variables were assessed for normality using the Shapiro-Wilk test; those displaying a skewed distribution are presented as median with interquartile range (IQR). Categorical variables are presented as frequency (constituent ratio). The differences in characteristics during the study period were examined using Chi-square tests for categorical variables and the Kruskal-Wallis rank sum test for continuous variables.

Figure 1. Study flow diagram.
The data consisted of clinical data of repeated measurements. The generalized estimating equation (GEE), which considers the correlation among repeated measurements, was used. It can process data with missing values, allowing different observation times and observation intervals for each observation object. Therefore, the relation among annual changes in T3, T4, and TSH levels was analyzed using the GEE approach. We compared the differences in thyroid hormone levels among different gender, age and occupation groups. The participants were also grouped according to their quartile (Q1–Q4) of annual effective dose (mSv/a) (Q1: 0.120–0.162, Q2: 0.162–0.225, Q3: 0.225–0.348, Q4: 0.348–5.814). All statistical analyses were performed using SAS software package (version 9.4; SAS Institute, Cary, NC). Significance was set at P < 0.05 and using the 95% confidence interval (CI).
-
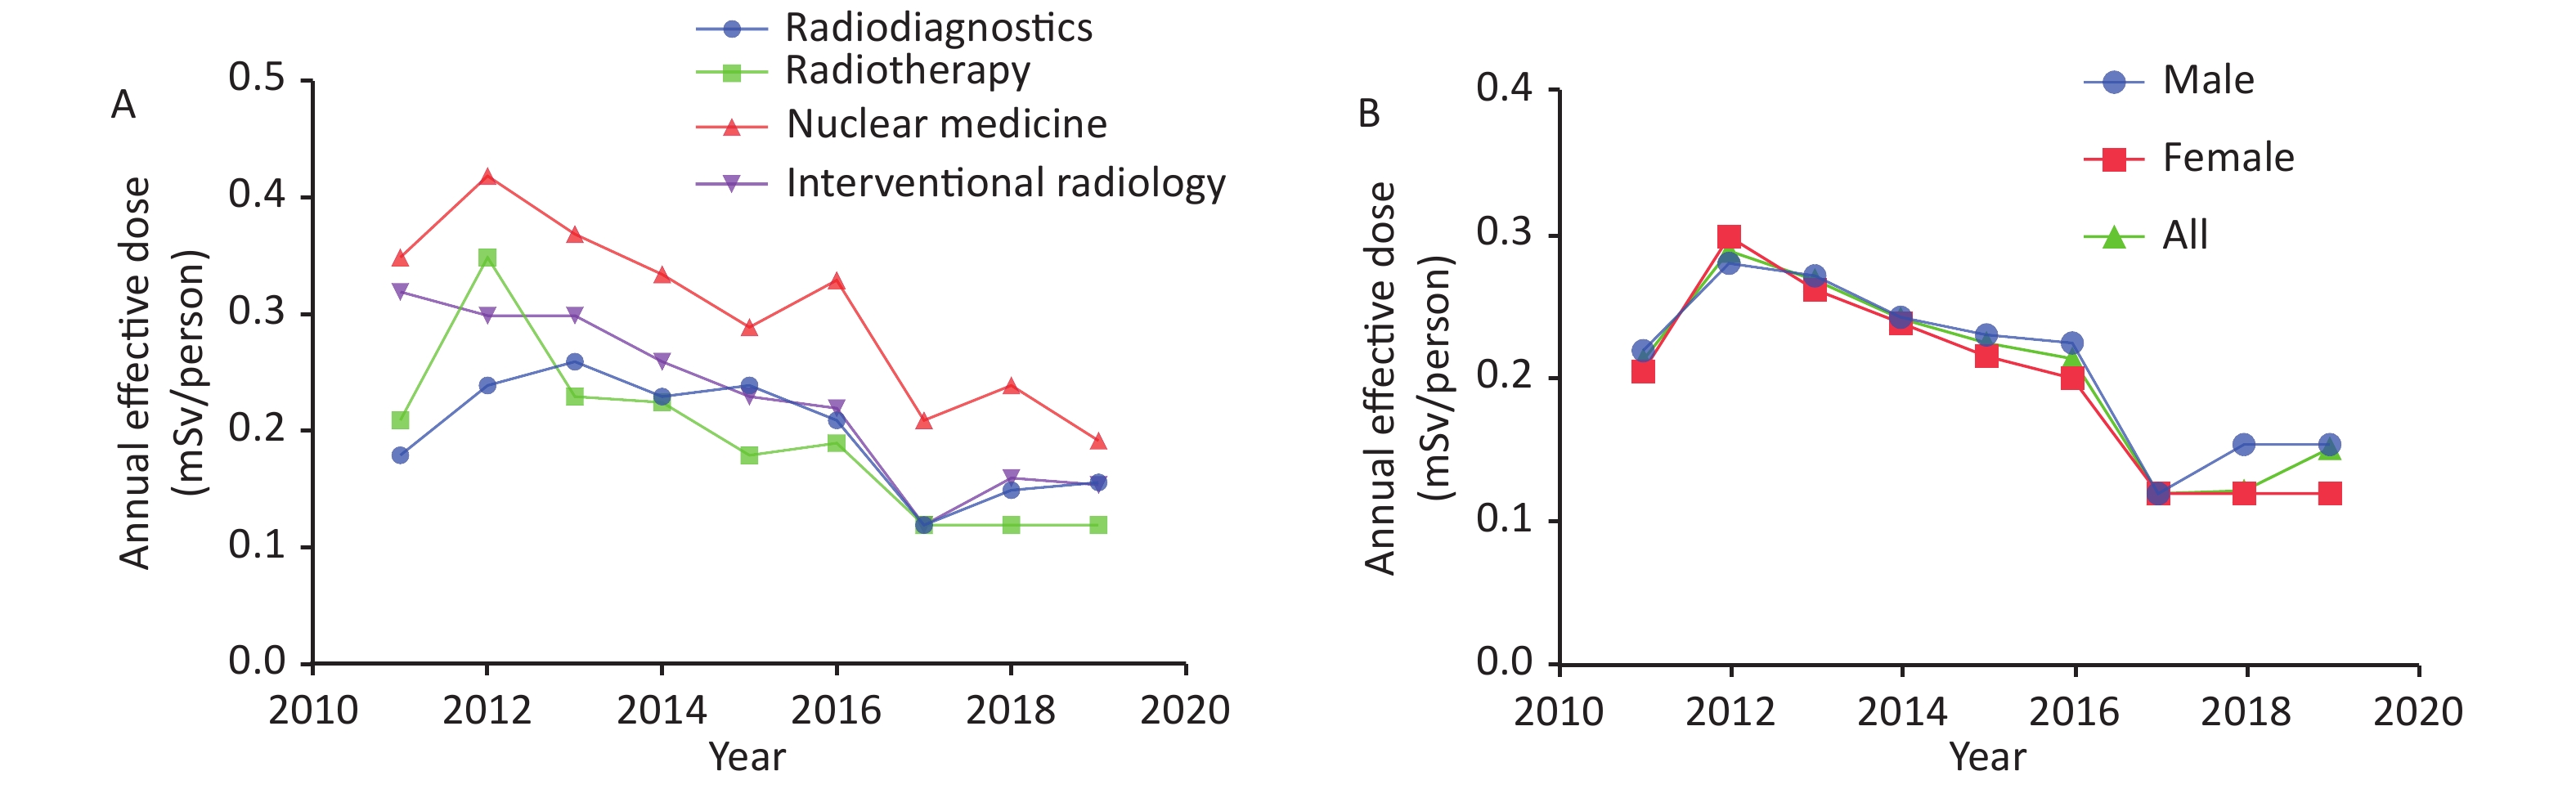
Table 1 shows the annual average effective dose and number of staff receiving doses of more than 5 mSv between 2011 and 2019. A low proportion of staff (0%–5%) was exposed to more than 5 mSv of radiation annually. Approximately 50% of the participants were exposed to a radiation dose lower than the detectable limits in 2018. The annual effective dose grouped by occupation (Table 2, Figure 2A) and gender (Figure 2B) showed a general downward trend. The median annual effective dose of medical radiation workers was much lower than the annual investigation level (5 mSv/a), with the annual effective dose being highest among nuclear medicine staff. A slight but significant difference was observed between exposures in males and females during the study period (P < 0.05).
Table 1. Annual average effective dose and number of staff members receiving doses of more than 5 mSv per year by calendar year, 2011–2019
Year n Mean SD Median IQR No. of staffs > 5 mSv/a (%) 2011 1,176 0.43 0.86 0.21 0.28 3 (0.26) 2012 1,306 0.46 0.64 0.29 0.34 3 (0.23) 2013 1,688 0.41 0.54 0.27 0.25 3 (0.18) 2014 2,146 0.40 0.61 0.24 0.33 5 (0.23) 2015 2,390 0.34 0.45 0.23 0.27 3 (0.13) 2016 2,594 0.33 0.39 0.21 0.25 2 (0.08) 2017 2,969 0.28 0.41 0.12 0.16 2 (0.07) 2018 3,161 0.26 0.31 0.12 0.15 0 (0.00) 2019 2,855 0.24 0.30 0.15 0.13 1 (0.04) Table 2. Annual occupational radiation exposure dose (mSv) among medical radiation staff members by occupation, 2011–2019
Year Diagnostic radiology Radiotherapy Nuclear medicine Interventional radiology n Mean SD Median IQR n Mean SD Median IQR n Mean SD Median IQR n Mean SD Median IQR 2011 506 0.25 0.31 0.18 0.21 258 0.32 0.51 0.21 0.22 107 0.63 1.00 0.33 0.43 305 0.74 1.39 0.32 0.78 2012 558 0.34 0.58 0.24 0.29 289 0.42 0.34 0.35 0.32 120 0.71 0.96 0.42 0.42 339 0.58 0.72 0.29 0.56 2013 739 0.32 0.45 0.26 0.21 348 0.30 0.21 0.24 0.19 159 0.61 0.70 0.37 0.40 442 0.56 0.72 0.30 0.46 2014 961 0.35 0.61 0.23 0.32 427 0.31 0.30 0.22 0.24 192 0.51 0.65 0.33 0.37 566 0.52 0.73 0.26 0.42 2015 1,050 0.32 0.36 0.24 0.28 494 0.26 0.44 0.18 0.17 212 0.50 0.57 0.29 0.37 634 0.39 0.54 0.23 0.27 2016 1,136 0.30 0.33 0.21 0.24 530 0.26 0.23 0.19 0.21 225 0.53 0.65 0.34 0.39 703 0.35 0.45 0.22 0.26 2017 1,312 0.24 0.25 0.12 0.15 594 0.23 0.25 0.12 0.14 244 0.43 0.59 0.20 0.30 819 0.33 0.58 0.12 0.15 2018 1,373 0.24 0.21 0.15 0.17 635 0.20 0.22 0.12 0.08 264 0.41 0.48 0.24 0.40 889 0.27 0.39 0.16 0.12 2019 1,240 0.23 0.22 0.16 0.14 631 0.22 0.22 0.12 0.10 256 0.32 0.34 0.19 0.29 728 0.25 0.45 0.15 0.11 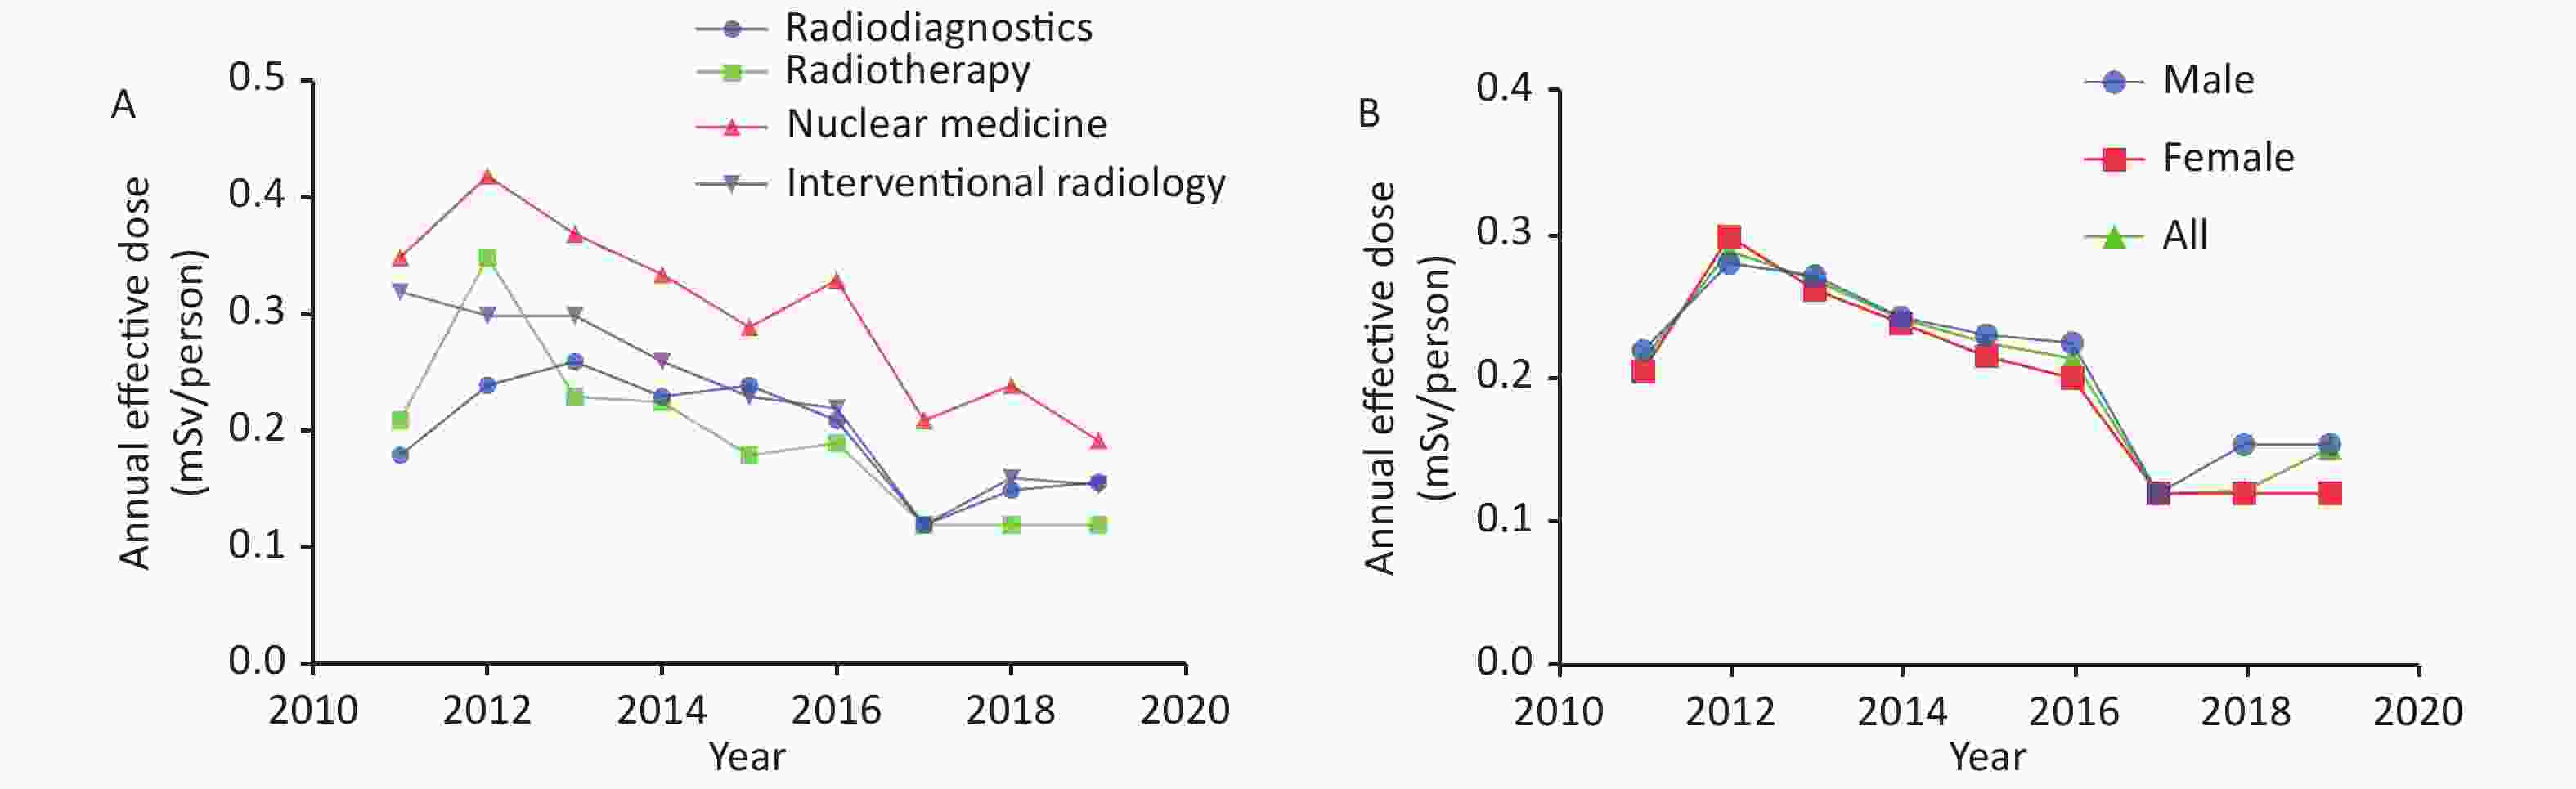
Figure 2. Trends in annual effective doses of medical radiation workers in tertiary Grade-A hospitals in Guangzhou, 2011–2019. (A) The trend of annual effective doses (mSv/person) according to occupation; (B) The trend of annual effective doses (mSv/person) according to gender.
-
A total of 2,946 radiation workers (median age 34 years, IQR 15 years; 62.02% males) were included. The total follow-up was 12,566 person-years (Table 3). The median age of the subjects increased during the study period. There were significant differences between the baseline and follow-up levels of T3 and T4 (P < 0.05), but not of TSH. Similarly, a significant difference was observed regarding occupation (P = 0.001), but not gender.
Table 3. Subject characteristics at follow-up (n = 2,946)
Variables Baseline 1st year 2nd year 3rd year 4th year 5th year 6th year 7th year 8th year 9th year Continuous variables Age* (y) 34 (15) 33 (13) 36 (15) 35 (13) 40 (16) 40 (14) 42 (14) 43 (12) 45 (13) 45 (11) TSH (× 10−3 U/L) 1.58 (1.06) 1.67 (1.06) 1.57 (1.10) 1.55 (1.09) 1.58 (1.06) 1.68 (1.32) 1.59 (1.12) 1.80 (1.18) 1.71 (1.15) 1.76 (1.08) T3 (nmol/L)* 1.74 (0.47) 1.65 (0.44) 1.64 (0.44) 1.66 (0.48) 1.68 (0.41) 1.70 (0.49) 1.55 (0.38) 1.52 (0.37) 1.77 (0.55) 1.60 (0.62) T4 (nmol/L)* 110.00 (28.30) 105.45 (27.10) 104.00 (27.40) 102.55 (26.40) 102.70 (26.70) 102.60 (30.30) 96.60 (25.40) 95.40 (24.40) 92.80 (20.40) 90.60 (18.60) Categorical variables Gender Male 1,827 (62.02) 244
(61.62)1,480 (62.34) 322
(61.69)983
(64.04)227
(65.04)485
(63.98)133
(68.56)128
(70.72)54
(62.07)Female 1,119 (37.98) 152
(38.38)894
(37.66)200
(38.31)552
(35.96)122
(34.96)273
(36.02)61
(31.44)53
(29.28)33
(37.93)Occupation* Diagnostic radiology 1,267 (43.01) 82
(20.71)1,075
(45.28)160
(30.65)702
(45.73)109
(31.23)287 (37.86) 62
(31.96)68
(37.57)27
(31.03)Radiotherapy 613 (20.81) 140 (35.35) 463 (19.50) 134 (25.67) 346 (22.54) 75 (21.49) 224 (29.55) 30
(15.46)40
(22.10)11
(12.64)Nuclear medicine 252 (8.55) 47 (11.87) 207 (8.70) 51 (9.77) 135 (8.79) 38 (10.89) 69 (9.10) 30
(15.46)18
(9.94)11
(12.64)Interventional radiology 814 (27.63) 127 (32.07) 629 (26.5) 177 (33.91) 352 (22.93) 127 (36.39) 178 (23.48) 72
(37.11)55
(30.39)38
(43.68)Note. *P-value of heterogeneity between groups are < 0.05. Median (interquartile range) is used to express, Kruskal-Wallis rank sum test is used to compare multiple groups of differences, frequency (constituent ratio) is used to express classified variables, and Chi-square test is used to compare multiple groups of differences. -
Table 4 shows the parameter estimates of thyroid hormone levels based on a GEE model. After adjusting for demographic variables, follow-up years, and radiation dose, a trend of reduced T3 and T4 levels was found with each increasing year of radiation work, with an annual change of −0.015 (95% CI −0.018 to −0.012) nmol/L and −2.294 (95% CI −2.426 to −2.162) nmol/L during the follow-up period, respectively. Male radiation workers presented significantly higher T3 and T4 levels and lower TSH levels than female radiation workers. There was no significant difference in TSH, T3, and T4 levels between staff aged < 40 years and those aged ≥ 40 years (all P > 0.05), or with respect to occupation. The T3 level in Q4 was higher than in Q1 (β = 0.046, 95% CI: 0.013 to 0.079) nmol/L. No other significant difference in thyroid hormone levels was observed in the subgroups’ average annual effective dose compared to the levels in Q1.
Table 4. Parameter estimates of the GEE method in medical radiation workers (n = 2,946)
Variables# TSH (× 10−3 U/L) T3 (nmol/L) T4 (nmol/L) β 95% CI P-value β 95% CI P-value β 95% CI P-value Follow-up year 0.017 −0.003 0.037 0.103 −0.015 −0.018 −0.012 < 0.001 −2.294 −2.426 −2.162 < 0.001 Gender Female Ref Ref Ref Male −0.133 −0.215 −0.052 0.001 0.127 0.106 0.148 < 0.001 1.401 0.103 2.700 0.034 Attained age (y) < 40 Ref Ref Ref ≥ 40 0.034 −0.043 0.112 0.388 0.000 −0.021 0.021 0.976 0.528 −0.816 1.872 0.441 Occupation Diagnostic Radiology −0.010 −0.148 0.129 0.892 0.010 −0.024 0.043 0.570 1.345 −0.996 3.687 0.260 Radiotherapy −0.061 −0.203 0.082 0.404 −0.010 −0.050 0.031 0.635 1.584 −0.991 4.158 0.228 Nuclear medicine Ref Ref Ref Interventional Radiology −0.101 −0.246 0.044 0.173 −0.010 −0.047 0.027 0.593 0.470 −1.978 2.917 0.707 Average annual effective dose (mSv/a) Q1 Ref Ref Ref Q2 0.001 −0.090 0.092 0.986 −0.010 −0.041 0.021 0.530 0.542 −1.223 2.308 0.547 Q3 −0.004 −0.092 0.084 0.927 −0.016 −0.047 0.015 0.319 −0.339 −2.144 1.465 0.712 Q4 0.088 −0.019 0.195 0.107 0.046 0.013 0.079 0.006 1.751 −0.105 3.608 0.064 Note. #Adjusted for age at the beginning of follow-up, gender, occupation and follow-up year. Ref: Reference group. -
This study demonstrated that workers in the nuclear medicine department were exposed to the highest radiation doses. We observed that T3 and T4 levels of the participants slightly but significantly decreased during the follow-up years. Our results are in accordance with those of a Taiwanese study, which found that occupational exposure to ionizing radiation in medical radiation workers was associated with a decline in serum T3 and T4 levels[12]. We provided a direct estimate of the annual change in T3 and T4 levels with respect to low-dose occupation radiation exposure.
Additionally, our findings suggest that sex-related factors may potentially influence the long-term response to radiation as evidenced by the differences observed in the levels of the three thyroid hormones between genders. A previous study conducted by Narendran et al.[13] revealed that sex can influence the prolonged response to radiation exposure. In agreement with our results, a 20-year cohort study of US radiology technologists reported that the risk of thyroid cancer in female clinical radiation workers was 75% higher than that in males,[14] indicating that the thyroid gland is more radio-sensitive in females[15].
Although staff who worked in the nuclear medicine department was exposed to the highest dose of radiation, the levels of the three thyroid hormones were not significantly different when stratified by occupation and age. This is consistent with the results of a previous study including clinical radiologists[10]. T3 levels increased when the radiation dose reached a certain level, suggesting the existence of a dose threshold beyond which the synthesis and secretion of T3 is promoted. However, this study found no relation between radiation doses and thyroid hormone level decreases. This might be due to the negative feedback regulation mechanism of the thyroid system. The hypothalamus-pituitary-thyroid regulatory loop can control the relative stability of thyroid hormone secretion and maintain the dynamic balance of TSH, T3, and T4 levels by increasing the secretion of TSH to promote T4 and T3 secretion when the serum concentration of T4 and T3 is reduced. Furthermore, the absence of relation between radiation and hormone levels decrease in this study may also be explained by the low level of radiation exposure among workers and the small differences in exposure level between groups. A cohort study of workers highly exposed to radiation in the Chernobyl accident showed a surprisingly small effect of exposure on the thyroid[16]. These findings support the hypothesis that it is difficult to establish the relation between radiation dose and hypothyroidism under the current low occupational radiation exposure levels[17,18]. Therefore, more studies are needed to demonstrate the dose-response relation between occupational exposure to ionizing radiation and thyroid health.
Our study has several strengths, including its retrospective, population-based design with long-term follow-up, which minimized the selection bias and allowed for further observations and multiple assessments of a large sample with a link to clinical laboratory and radiation dosimetry data. Moreover, GEE analysis was performed to assess the trends in serum thyroid hormone changes with adjustment for important confounding factors. However, the study also had its limitations. The lack of information on the subject’s identification number in dosimetry made it difficult for us to link the two systems. As such, we combined all the information by the same name, hospital, and department and checked the medical documents for cases with controversial data. In addition, it was not possible to consider an external control group because thyroid hormone measurement is not a standard component of the medical examination of workers not exposed to ionizing radiation[19]. Potential bias in estimates of the dose-effect association due to restriction to a specific population (i.e., medical radiation workers) is also usually weak when internal comparisons are carried out within the cohort[20]. These limitations should be considered when interpreting our results. Further prospective studies are needed to clarify the effect of radiation on thyroid hormone levels, considering important confounding factors such as family history of thyroid disease and lifestyle factors, including smoking, alcohol drinking, and iodine intake into account.
-
Our results showed that, although medical radiation workers were exposed to extremely low doses of radiation in their workplace, thyroid hormone secretion might still be affected by chronic exposure. Therefore, medical radiation workers should carefully follow the protection instructions to minimize the adverse health effects of radiation exposure.
-
The authors would like to thank the ‘Guangdong Province Engineering & Technology Research Center for Medical 3D Printer and Personalized Medicine’ for its support during this study.
-
The authors declare that they have no competing interests.
doi: 10.3967/bes2021.037
Occupational Radiation Exposure and Changes in Thyroid Hormones in a Cohort of Chinese Medical Radiation Workers
-
Abstract:
Objective This study aimed to evaluate the association between occupational radiation exposure and changes in thyroid hormone levels among medical radiation workers. Methods This retrospective cohort study included 2,946 radiation workers from 20 Guangzhou hospitals. Data on general characteristics, participant radiation dosimetry, and thyroid function test results [thyroid-stimulating hormone (TSH), triiodothyronine (T3), and thyroid hormone (T4)] were extracted from dosimetry and medical records. The generalized estimating equation was used to evaluate the trend of changes in thyroid hormone levels over time and was adjusted for age, gender, and occupation. Results The average annual effective dose was very low and showed a general downward trend. During the follow-up period, changes in T3 and T4 levels among radiation workers were –0.015 [95% confidence interval (CI) –0.018 to –0.012] nmol/L per year and –2.294 (95% CI –2.426 to –2.162) nmol/L per year, respectively. Thyroid hormone levels were significantly different between males and females. T3 levels in the group of upper quartile of dose were significantly higher than in the lower quartile group (P = 0.006). No significant decreased trend in thyroid hormone levels was observed with increasing average effective doses. Conclusion Thyroid hormone secretion might be affected even in low-dose radiation exposure environments. -
Key words:
- Occupational radiation /
- Thyroid function /
- Cohort
-
Figure 2. Trends in annual effective doses of medical radiation workers in tertiary Grade-A hospitals in Guangzhou, 2011–2019. (A) The trend of annual effective doses (mSv/person) according to occupation; (B) The trend of annual effective doses (mSv/person) according to gender.
Table 1. Annual average effective dose and number of staff members receiving doses of more than 5 mSv per year by calendar year, 2011–2019
Year n Mean SD Median IQR No. of staffs > 5 mSv/a (%) 2011 1,176 0.43 0.86 0.21 0.28 3 (0.26) 2012 1,306 0.46 0.64 0.29 0.34 3 (0.23) 2013 1,688 0.41 0.54 0.27 0.25 3 (0.18) 2014 2,146 0.40 0.61 0.24 0.33 5 (0.23) 2015 2,390 0.34 0.45 0.23 0.27 3 (0.13) 2016 2,594 0.33 0.39 0.21 0.25 2 (0.08) 2017 2,969 0.28 0.41 0.12 0.16 2 (0.07) 2018 3,161 0.26 0.31 0.12 0.15 0 (0.00) 2019 2,855 0.24 0.30 0.15 0.13 1 (0.04)  下载: 导出CSV
Table 2. Annual occupational radiation exposure dose (mSv) among medical radiation staff members by occupation, 2011–2019
Year Diagnostic radiology Radiotherapy Nuclear medicine Interventional radiology n Mean SD Median IQR n Mean SD Median IQR n Mean SD Median IQR n Mean SD Median IQR 2011 506 0.25 0.31 0.18 0.21 258 0.32 0.51 0.21 0.22 107 0.63 1.00 0.33 0.43 305 0.74 1.39 0.32 0.78 2012 558 0.34 0.58 0.24 0.29 289 0.42 0.34 0.35 0.32 120 0.71 0.96 0.42 0.42 339 0.58 0.72 0.29 0.56 2013 739 0.32 0.45 0.26 0.21 348 0.30 0.21 0.24 0.19 159 0.61 0.70 0.37 0.40 442 0.56 0.72 0.30 0.46 2014 961 0.35 0.61 0.23 0.32 427 0.31 0.30 0.22 0.24 192 0.51 0.65 0.33 0.37 566 0.52 0.73 0.26 0.42 2015 1,050 0.32 0.36 0.24 0.28 494 0.26 0.44 0.18 0.17 212 0.50 0.57 0.29 0.37 634 0.39 0.54 0.23 0.27 2016 1,136 0.30 0.33 0.21 0.24 530 0.26 0.23 0.19 0.21 225 0.53 0.65 0.34 0.39 703 0.35 0.45 0.22 0.26 2017 1,312 0.24 0.25 0.12 0.15 594 0.23 0.25 0.12 0.14 244 0.43 0.59 0.20 0.30 819 0.33 0.58 0.12 0.15 2018 1,373 0.24 0.21 0.15 0.17 635 0.20 0.22 0.12 0.08 264 0.41 0.48 0.24 0.40 889 0.27 0.39 0.16 0.12 2019 1,240 0.23 0.22 0.16 0.14 631 0.22 0.22 0.12 0.10 256 0.32 0.34 0.19 0.29 728 0.25 0.45 0.15 0.11
下载: 导出CSV
Table 3. Subject characteristics at follow-up (n = 2,946)
Variables Baseline 1st year 2nd year 3rd year 4th year 5th year 6th year 7th year 8th year 9th year Continuous variables Age* (y) 34 (15) 33 (13) 36 (15) 35 (13) 40 (16) 40 (14) 42 (14) 43 (12) 45 (13) 45 (11) TSH (× 10−3 U/L) 1.58 (1.06) 1.67 (1.06) 1.57 (1.10) 1.55 (1.09) 1.58 (1.06) 1.68 (1.32) 1.59 (1.12) 1.80 (1.18) 1.71 (1.15) 1.76 (1.08) T3 (nmol/L)* 1.74 (0.47) 1.65 (0.44) 1.64 (0.44) 1.66 (0.48) 1.68 (0.41) 1.70 (0.49) 1.55 (0.38) 1.52 (0.37) 1.77 (0.55) 1.60 (0.62) T4 (nmol/L)* 110.00 (28.30) 105.45 (27.10) 104.00 (27.40) 102.55 (26.40) 102.70 (26.70) 102.60 (30.30) 96.60 (25.40) 95.40 (24.40) 92.80 (20.40) 90.60 (18.60) Categorical variables Gender Male 1,827 (62.02) 244
(61.62)1,480 (62.34) 322
(61.69)983
(64.04)227
(65.04)485
(63.98)133
(68.56)128
(70.72)54
(62.07)Female 1,119 (37.98) 152
(38.38)894
(37.66)200
(38.31)552
(35.96)122
(34.96)273
(36.02)61
(31.44)53
(29.28)33
(37.93)Occupation* Diagnostic radiology 1,267 (43.01) 82
(20.71)1,075
(45.28)160
(30.65)702
(45.73)109
(31.23)287 (37.86) 62
(31.96)68
(37.57)27
(31.03)Radiotherapy 613 (20.81) 140 (35.35) 463 (19.50) 134 (25.67) 346 (22.54) 75 (21.49) 224 (29.55) 30
(15.46)40
(22.10)11
(12.64)Nuclear medicine 252 (8.55) 47 (11.87) 207 (8.70) 51 (9.77) 135 (8.79) 38 (10.89) 69 (9.10) 30
(15.46)18
(9.94)11
(12.64)Interventional radiology 814 (27.63) 127 (32.07) 629 (26.5) 177 (33.91) 352 (22.93) 127 (36.39) 178 (23.48) 72
(37.11)55
(30.39)38
(43.68)Note. *P-value of heterogeneity between groups are < 0.05. Median (interquartile range) is used to express, Kruskal-Wallis rank sum test is used to compare multiple groups of differences, frequency (constituent ratio) is used to express classified variables, and Chi-square test is used to compare multiple groups of differences.
下载: 导出CSV
Table 4. Parameter estimates of the GEE method in medical radiation workers (n = 2,946)
Variables# TSH (× 10−3 U/L) T3 (nmol/L) T4 (nmol/L) β 95% CI P-value β 95% CI P-value β 95% CI P-value Follow-up year 0.017 −0.003 0.037 0.103 −0.015 −0.018 −0.012 < 0.001 −2.294 −2.426 −2.162 < 0.001 Gender Female Ref Ref Ref Male −0.133 −0.215 −0.052 0.001 0.127 0.106 0.148 < 0.001 1.401 0.103 2.700 0.034 Attained age (y) < 40 Ref Ref Ref ≥ 40 0.034 −0.043 0.112 0.388 0.000 −0.021 0.021 0.976 0.528 −0.816 1.872 0.441 Occupation Diagnostic Radiology −0.010 −0.148 0.129 0.892 0.010 −0.024 0.043 0.570 1.345 −0.996 3.687 0.260 Radiotherapy −0.061 −0.203 0.082 0.404 −0.010 −0.050 0.031 0.635 1.584 −0.991 4.158 0.228 Nuclear medicine Ref Ref Ref Interventional Radiology −0.101 −0.246 0.044 0.173 −0.010 −0.047 0.027 0.593 0.470 −1.978 2.917 0.707 Average annual effective dose (mSv/a) Q1 Ref Ref Ref Q2 0.001 −0.090 0.092 0.986 −0.010 −0.041 0.021 0.530 0.542 −1.223 2.308 0.547 Q3 −0.004 −0.092 0.084 0.927 −0.016 −0.047 0.015 0.319 −0.339 −2.144 1.465 0.712 Q4 0.088 −0.019 0.195 0.107 0.046 0.013 0.079 0.006 1.751 −0.105 3.608 0.064 Note. #Adjusted for age at the beginning of follow-up, gender, occupation and follow-up year. Ref: Reference group.
下载: 导出CSV
-
[1] Imaizumi M, Furukawa K, Ohishi W, et al. Thyroid diseases among atomic bomb survivors. Radiat Protect Dosim, 2018; 182, 62−6. doi: 10.1093/rpd/ncy157 [2] Rudqvist N, Schuler E, Parris TZ, et al. Dose-specific transcriptional responses in thyroid tissue in mice after (131)I administration. Nucl Med Biol, 2015; 42, 263−8. doi: 10.1016/j.nucmedbio.2014.11.006 [3] Kamiya K, Ozasa K, Akiba S, et al. Long-term effects of radiation exposure on health. The Lancet, 2015; 386, 469−78. doi: 10.1016/S0140-6736(15)61167-9 [4] Seo S, Lim WY, Lee DN, et al. Assessing the health effects associated with occupational radiation exposure in Korean radiation workers: protocol for a prospective cohort study. Bmj Open, 2018; 8, 1−7. [5] Niu Y, Su Y, Liang J, et al. Study on estimation of medical exposure frequency in China. Chin J Radiol Med Prot, 2019; 39, 325−30. (In Chinese doi: 10.1088/1361-6498/aafc7f [6] United Nations Scientific Committee on the Effects of Atomic Radiation (UNSCEAR) (2008) Sources and Effects of Ionizing Radiation. New York: United Nations, 2008. [7] Tian Y, Zhang La, Ju Y. Dose level of occupational exposure in China. Radiat Prot Dosim, 2008; 128, 491−95. (In Chinese [8] Ministry of Health of the People's Republic of China. Specifications for occupational health surveillance for radiation workers. GBZ 235-2011. Beijing: People's Medical Publishing House (PMPH), 2011. (In Chinese) [9] Gong L, He Q. Research progress on low dose ionizing radiation effects and its effects on thyroid function and nodules of radiation workers in China. Occupation and Health, 2019; 35, 1430−2, 36. (In Chinese [10] Tu L, Wong S, Dong Q, et al. effect of low-dose ionizing radiation exposure on thyroid function in a medical occupational population. Chin J Ind Hyg Occup Dis, 2018; 36, 91−4. (In Chinese [11] Ministry of Health of the People's Republic of China. Specifications for individual monitoring of occupational external exposure. GBZ 128-2016. Beijing: People's Medical Publishing House (PMPH), 2016. (In Chinese) [12] Wong YS, Cheng YY, Cheng TJ, et al. The Relationship Between Occupational Exposure to Low-dose Ionizing Radiation and Changes in Thyroid Hormones in Hospital Workers. Epidemiology, 2019; 30, S32−S38. doi: 10.1097/EDE.0000000000001004 [13] Narendran N, Luzhna L, Kovalchuk O. Sex Difference of Radiation Response in Occupational and Accidental Exposure. Front Genet, 2019; 10. [14] Kitahara CM, Preston DL, Neta G, et al. Occupational radiation exposure and thyroid cancer incidence in a cohort of U.S. radiologic technologists, 1983-2013. Int J Cancer, 2018; 143, 2145−9. doi: 10.1002/ijc.31270 [15] Little MP, Lim H, Friesen MC, et al. Assessment of thyroid cancer risk associated with radiation dose from personal diagnostic examinations in a cohort study of US radiologic technologists, followed 1983–2014. Bmj Open, 2018; 8, e021536. doi: 10.1136/bmjopen-2018-021536 [16] Boehm BO, Steinert M, Dietrich JW, et al. Thyroid examination in highly radiation-exposed workers after the Chernobyl accident. Eur J Endocrinol, 2009; 160, 625−30. doi: 10.1530/EJE-08-0492 [17] Lee WJ, Ha M, Hwang SS, et al. The radiologic technologists' health study in South Korea: study design and baseline results. Int Arch Occup Environ Health, 2015; 88, 759−68. doi: 10.1007/s00420-014-1002-1 [18] Lee WJ, Preston DL, Cha ES, et al. Thyroid cancer risks among medical radiation workers in South Korea, 1996-2015. Environ Health, 2019; 18, 19. doi: 10.1186/s12940-019-0460-z [19] Luna-Sánchez S, del Campo MT, Morán JV, et al. Thyroid Function in Health Care Workers Exposed to Ionizing Radiation. Health Physics, 2019; 117, 403−07. doi: 10.1097/HP.0000000000001071 [20] Pizzi C, Stavola BD, Merletti F, et al. Sample selection and validity of exposure—disease association estimates in cohort studies. J Epidemiol Community Health, 2011; 65, 407−11. -

 点击查看大图
计量
- 文章访问数: 1606
- HTML全文浏览量: 684
- PDF下载量: 111
- 被引次数: 0


 Quick Links