

 下载:
下载:


-
This study aimed to describe the situation of iodine supplementation in pregnant women, and to explore the effects of such supplementation measures on iodine nutrition and thyroid function. Pregnant women in seven provinces were selected by multi-stage sampling. Basic information was collected and a food frequency questionnaire was administered. Salt iodine, urinary iodine, and thyroid function were determined. Subjects were divided into five groups based on iodine supplementation. For pregnant women, the median urinary iodine concentration (MUIC) in seven provinces was 164.3 μg/L, and thyroid nodules (15.75%) were a common thyroid disease. Gestation, iodine supplementation, etc. impacted iodine nutrition and thyroid function. Compared with other groups, simultaneous iodine supplementation with iodized salt, iodine-rich foods, and iodine preparations (the ISFP group) was the most effective approach for improving iodine nutrition; supplementation via iodine-rich foods only showed the lowest prevalence of TPOAb-positive (5.48%) and TgAb-positive (1.37%) diseases. In addition, pregnant women with MUIC in the 150–249 μg/L range showed higher rates of TPOAb-positive (13.78%) disease and sub-hypothyroidism (5.38%) compared to those with MUIC in the 100–149 μg/L range; however, goiter showed the opposite trend. Our results indicate that iodine supplementation needs vary from person to person.
Iodine is one of the essential trace elements in the human body and can only be obtained from the diet. Iodine can influence metabolism and growth by affecting the synthesis of thyroid hormone. Pregnant women are a special population, in which iodine intake is not only needed to meet the woman’s own health needs, but is also required to supply the growing fetus[1]; therefore, it is very important for pregnant women to supplement with iodine. In recent years, there has been controversy about the appropriate standard for median urinary iodine concentration (MUIC) in pregnant women. A study by Wu M, et al.[2,3] found that the appropriate MUIC in pregnant women was far below that recommended by the World Health Organization (WHO) and subjects with MUIC in of 100–150 μg/L had normal thyroid function. As a result, in this study we compared thyroid function in pregnant women with MUIC ranges of 100–149 μg/L and 150–249 μg/L.
Universal salt iodization (USI) had alleviated the risk of iodine deficiency disorders (IDD). However, some thyroid diseases have been increasing in prevalence in recent years, leading to a heated discussion about iodine supplementation measures and consumption amounts[4]. Ling W et al. argued that daily intake of iodized salt and iodine-rich food should complement one another to increase iodine nutrition. Drinking iodine-containing water can also help to supplement iodine, but can also induce iodine excess[5]. Moreover, iodine supplement preparations (e.g., multi-vitamin pills) have been more frequently recommended to pregnant women by clinical doctors. In this study, we provide a summary of various iodine supplementation measures and their respective effects on iodine nutrition, thyroid function, and thyroid-related diseases.
In our study, a multi-stage sampling method was adopted. First, seven provinces were selected according to their location in China. Four counties in each province were selected according to their economic level (high or low) and geographical characteristics (coastal or inland for Fujian and Liaoning; plateau or plain for Shanxi, Xinjiang, Anhui, Hubei, and Sichuan). Next, each participating county was divided into five sampling areas (east, west, south, north, and middle). According to the reliability of the iodine nutrition surveys, 100 individuals in each county were surveyed in our investigation, which was consistent with a 90% confidence interval within a precision range of ± 10%. Finally, 2,850 pregnant women were included in the study according to the inclusion and exclusion criteria, as follows: 1) age 20 to 40 years old without a history of smoking or alcohol abuse; 2) no use of iodine preparations in the past three days; 3) no special dietary habits, such as vegetarian food, etc; 4) healthy with no history of thyroid or family genetic diseases, etc; 5) no occupational iodine exposure (such as medical personnel who use iodine disinfectant or iodine contrast agent); and 6) recently had an angiography examination. This study was conducted according to the guidelines established in the Declaration of Helsinki, and all procedures involving human volunteers were approved by the Ethics Committee of Harbin Medical University. Written informed consent was obtained from each pregnant woman (20190502).
Questionnaires were used to collect basic information, consumption of iodized salt, foods intake (iodine content more than 10 μg/100 g, and choosing the contribution rate of various iodine-containing foods more than 1% for pregnant women through literatures), and iodine supplement preparations. A total of 2,643 household salt samples, 2,557 urine samples, and 2,525 blood samples were collected at the local health center for determination of iodine content and thyroid function. The household salt iodine was measured by direct titration. Urinary iodine concentration was measured using As3+−Ce4+catalytic spectrophotometry. Thyroid volume and function were respectively detected by B-ultrasound and electrochemiluminescence at the provincial Center for Disease Control (CDC). The following reference ranges for thyroid stimulating hormone (TSH) and free thyroxine (FT4) were determined using the “Guidelines for the management of thyroid diseases during pregnancy and postpartum (Second Edition)” [6]: first trimester, TSH, 0.09–4.52 mU/L and FT4, 13.15–20.78 pmol/L; second trimester, TSH, 0.45–4.32 mU/L and FT4, 9.77–18.89 pmol/L; third trimester, TSH, 0.30–4.98 mU/L and FT4, 9.04–15.22 pmol/L, The reference for antibodies and free triiodothyronine (FT3) were thyroid peroxidase antibody (TPOAb), 0–34 IU/mL, thyroglobulin antibody (TgAb), 0–115 IU/mL, FT3, 3.1–6.8 pmol/L. Furthermore, the reference of thyroid volume was less than 18 mL. In this study, urinary iodine concentration (UIC) in the 150–249 μg/L group was defined as iodine sufficient, and the thyroid-related diseases that were defined included hypothyroidism, sub-hypothyroidism, hyperthyroidism, sub-hyperthyroidism, TPOAb-positive, TgAb-positive, and double antibody positive.
Iodine intake for different sources was calculated according to consumption. To study the effects of different measures on iodine nutrition and thyroid function, pregnant women were divided into five groups : 1) an IF group (refers to eating 50 grams or more in wet weight of kelp, seaweed etc., more than once per month; participants); 2) an iodized salt group (IS, participants); 3) an iodized salt + iodine-rich food group (ISF, 1,164 participants); 4) an iodized salt + iodine supplement preparations group (ISP, in which there was a self-reported iodine supplementation habit for the last year prior to the investigation; 42 participants); and 5) iodized salt + iodine-rich food + iodine supplement preparations group (ISFP, participants). To explore the potential influence of each factor on urinary iodine and thyroid function, subjects were grouped by gestation, habitation (urban/rural), annual income, vomiting reaction (none; slight: occasional vomiting reaction; moderate: less than four times per day without weight loss; and serious: frequent reaction with weight loss), and dietary habits (times of meals each day). Other indicators calculated included the iodine supplementation rate of pregnant women (refers to the proportion of pregnant women receiving iodine supplements through either iodized salt and iodine supplement preparations or iodine rich food in all surveyed pregnant women), iodine supplement contribution (refers to the proportion of dietary iodine intake from drinking water, food, iodine preparations, or iodized salt), consumption rate of qualified iodized salt (refers to the rate of iodized salt with iodine content between 18–33 mg/kg).
SPSS 22.0 (International Business Machines Corp) was used for statistical analysis. For data with normal distribution, the mean and standard deviation were calculated (e.g., the iodine intake of iodized salt, food, and preparations); for skewed distribution data, median and interquartile range were analyzed (such as MUICs and the iodine intake of drinking water). Non-parametric rank test, Chi-square test, and Fisher’s exact probability were used to study the effect of different iodine supplement on urinary iodine. Binary logistic regression was adopted to analyze factors of iodine nutrition and thyroid function. All tests were two-side and P < 0.05 was defined as significant.
As for basic information (Supplementary Table S1, available in www.besjournal.com), rural pregnant women accounted for 63.3% of study participants. Furthermore, there were 428 first trimester participants (17.6%), 1,102 in the second trimester (45.2%), and 907 in the third trimester (37.2%). In view of dietary habits, most pregnant women (64.1%) followed a habit of eating three meals per day, but others had meals more frequently.
Table S1. Basic information of pregnant women in seven provinces
Indication Classification Number Proportion (%) Habitation Village 1,518 63.3 Urban 879 36.7 Gestation First trimester 428 17.6 Middle trimester 1,102 45.2 Last trimester 907 37.2 Level of education Primary school 114 4.8 Junior high school 850 35.5 Senior high school 534 22.3 Junior college 564 23.5 Bachelor degree 314 13.1 Master degree or above 21 0.8 Household
annual income, yuan a year< 20,000 349 14.6 20,000−29,999 403 16.8 30,000−59,999 685 28.6 60,000−100,000 651 27.2 > 100,000 309 12.8 Pregnancy vomiting reaction No 600 25.0 Slight 1,171 48.9 Moderate 420 17.5 Serious 206 8.6 Dietary habit Three meals a day 1,537 64.1 Four meals a day 300 12.5 Five or six meals a day 395 16.5 Rule-less 165 6.9 Total 2,397 100.0 The MUIC of all study participants was 164.3 μg/L (first trimester: 160.16 μg/L; second trimester: 156.90 μg/L; third trimester: 148.20 μg/L; Table 1), which is close to the lower limit of adequate iodine status (150 μg/L). The MUICs in Fujian (132.9 μg/L) and Liaoning (127.1 μg/L) were low, and more iodine intake was required. Concerning iodine supplementation measures, iodized salt (contribution rate of 42.93%) was the most common measures for supplementing iodine in pregnant women. Food supplementation was the other most common measure, with a contribution rate of 35.44%. However, the most important measure in Xinjiang was iodine supplement preparations (59.34%), followed by iodized salt (22.93%) and food supplementation (17.10%). It was also found that the iodine supplementation rate in pregnant women was above 90% in all provinces. With the exception of Sichuan, consumption rates of qualified iodized salt were all also above 90%.
Table 1. Iodine nutrition and iodine supplementation measures in pregnant women
Province Number MUIC* (μg /L) Sources of iodine intake (μg/d)
(contribution rate, %)3Iodine supplement (%) Iodized
salt, MeanFood,
meanPreparations,
meanDrinking
water, medianIodine
supplement
rate1Consumption
rate of qualified
iodized salt2Fujian 329 132.9 121.3 (51.49) 98.6 (39.74) 17.5 (7.41) 2.4 (2.40) 99.0 93.6 Liaoning 369 127.1 98.9 (48.41) 84.9 (44.41) 6.1 (2.96) 6.5 (4.22) 99.0 90.7 Shanxi 401 155.6 100.7 (49.15) 84.5 (47.39) 1.3 (0.47) 5.0 (2.99) 99.8 97.1 Sichuan 360 192.7 117.0 (50.56) 98.4 (38.23) 18.9 (8.33) 1.7 (2.88) 99.8 88.5 Xinjiang 367 229.8 117.9 (22.93) 102.8 (17.10) 312.5 (59.34) 3.1 (1.17) 100.0 90.1 Anhui 386 156.8 135.8 (57.59) 114.5 (41.28) 1.8 (0.75) 1.5 (0.38) 100.0 97.5 Hubei 321 175.0 100.2 (48.68) 104.9 (46.77) 6.8 (3.31) 2.0 (1.24) 99.5 96.3 Total 2,533 164.3 113.1 (42.93) 98.3 (35.44) 47.7 (19.78) 3.1 (1.85) 99.0 89.7 Note. *MUIC, population median urinary iodine concentration. 1Iodine supplement rate, the proportion of pregnant women who took iodized salt, iodine supplement preparations and iodine-rich foods. 2Consumption rate of qualified iodized salt, salt samples with iodine of 18–33 mg/kg / total number of samples. 3Contribution rate, iodine intake in drinking water, food, iodine preparations, or salt / all amounts of iodine intake. We next compared thyroid-related diseases in different MUIC (100–149 μg/L and 150–249 μg/L, Supplementary Table S2, available in www.besjournal.com). Counties with MUIC in the 150–249 μg/L range showed a higher prevalence of sub-hypothyroidism, TPOAb-positive and double antibody positive disease types than those with MUIC in the 100–149 μg/L range. However, the prevalence of goiter showed the opposite trend.
Table S2. Comparison of thyroid diseases prevalence grouped by counties and individual with different MUIC1 or UI2
Kind of disease Rate (%) grouped by
median urinary iodine
(counties, μg/L)P3 Rate (%) grouped by
urinary iodine
(individual, μg/L)P3 100−149 150−249 < 150 150−249 250−499 Hypothyroidism 0.46 0.50 0.888 0.27 0.87 0.78 0.174 Sub-hypothyroidism 2.46 5.38 0.000 2.67 5.24 3.72 0.014 Hyperthyroidism 1.55 1.65 0.842 1.42 1.50 2.94 0.078 Sub-hyperthyroidism 1.55 1.82 0.616 1.96 1.62 2.94 0.351 TPOAb positive 8.95 13.78 0.004 11.39 11.66 16.38 0.011 TgAb positive 6.19 6.69 0.623 6.35 6.13 7.71 0.489 Double antibody positive 3.78 5.48 0.034 4.41 3.44 5.39 0.188 Goiter 1.02 0.41 0.027 1.10 0.50 4.90 0.000 Nodules 16.44 17.15 0.646 17.10 15.30 14.40 0.321 Note. 1MUIC, population median urinary iodine concentration. 2UI, personal urinary iodine concentration. 3Chi-square test and Fisher’s exact test. Diseases related to thyroid function had the highest prevalence (19.76%, Supplementary Table S3, available in www.besjournal.com), which is consistent with a prior investigation from 2010–2012[7]. The next most prevalent condition was thyroid nodules (15.75%). Among diseases related to thyroid function, TPOAb-positive was the most prevalent (12.36%), and Sichuan had the highest rates of TPOAb-positive and sub-hypothyroidism, at 25.63% and 7.24%, respectively. In addition, both the prevalence of sub-hyperthyroidism in Fujian, Anhui and Shanxi (3.46%, 3.24%, and 2.54%, respectively), and TgAb-positive rates in Shanxi (9.14%), Liaoning (8.99%), and Sichuan (7.24%) were higher than the overall level. As for thyroid nodules, the prevalence in Shanxi and Liaoning was higher (22.74% and 20.8%, respectively). Goiter is a thyroid-related disease and the lowest prevalence (i.e., 3.25%) was in Liaoning.
Table S3. Prevalence of thyroid diseases for pregnant women in different provinces
Provinces Number Prevalence of thyroid function related diseases (%) Goiter1
rate
(%)Thyroid
nodule2
rate
(%)Hypo-
thyroidism3Subclinical
hypo-
thyroidism4Hyper-
thyroidism5Subclinical
hyper-
thyroidism6TPOAb
positive7TgAb
positive8Double
antibody
positive9Total Xinjiang 365 1.65 3.56 0.82 0.82 10.96 5.21 1.10 22.47 0.00 8.22 Sichuan 359 0.56 7.24 1.95 1.39 25.63 7.24 5.57 33.98 0.25 10.07 Shanxi 394 0.76 4.31 0.51 2.54 10.15 9.14 6.09 17.01 0.46 22.74 Liaoning 367 0.27 3.27 4.36 0.27 10.35 8.99 4.63 17.71 3.25 20.80 Fujian 318 0.31 1.26 2.52 3.46 7.55 3.14 2.20 15.09 0.52 14.25 Anhui 401 0.50 2.74 0.75 3.24 11.22 6.23 4.49 15.96 0.00 16.67 Hubei 321 0.31 3.74 0.62 1.25 10.28 4.98 4.98 15.89 0.50 16.54 Total 2,525 0.67 3.76 1.62 1.86 12.36 6.53 4.20 19.76 0.72 15.75 Note. 1Goiter, thyroid volume is beyond the upper limit of the normal range. 2Thyroid nodule, pathological changes caused by local abnormal growth of thyroid cells. 3Hypothyroidism, TSH is greater than the upper limit of the normal range, and FT4 is less than the lower limit of the normal range. 4Subclinical hypothyroidism, TSH is greater than the upper limit of the normal range, and FT4 is within the normal range. 5 Hyperthyroidism, TSH is less than the lower limit of the normal range, and FT4 is greater than the upper limit of the normal range. 6Subclinical hyperthyroidism, TSH is less than the lower limit of the normal range, and FT4 is within the normal range. 7TPOAb positive, TPOAb is greater than the upper limit of the normal range. 8TgAb positive, TgAb is greater than the upper limit of the normal range. 9Double Antibody positive, both TPOAb and TgAb are greater than the upper limit of the normal rang. Multivariate binary logistic regression analysis was adjusted for age. Pregnant women living in urban areas were less likely to have low iodine nutrition (UI < 150 μg/L, Supplementary Table S4, available in www.besjournal.com), which may be because they were likely to pay attention to the overall and balance of iodine nutrition. With respect to factors influencing thyroid function (Supplementary Table S5, available in www.besjournal.com), gestation, family annual income and vomiting reaction all had impacts on FT4. Compared with the second or third trimesters, pregnant women in their first trimester were at greater risk for having low FT4 levels, which may be due to changing hormone levels and increased need for iodine early in pregnancy. Moreover, concerning family annual income, pregnant women with high annual income had higher FT4 levels, likely due to the diversity and quality of their diets. For TSH, the third trimester had risks of both high and low TSH levels; in addition, dietary habits also had an effect on TSH. For factors influencing thyroid antibody (Supplementary Table S6, available in www.besjournal.com), it was found that higher annual income had a positive effect on the value of TPOAb, which may be consistent with the cause of high FT4 in these participants.
Table S4. Factors affecting pregnant women’s urinary iodine
Classification Normal group1 and low group2 Normal group and high group3 β SE Wald χ2 OR 95% CI P4 β SE Wald χ2 OR 95% CI P4 Age 30−40 years old 0.006 0.091 0.004 1.006 0.842, 1.201 0.952 0.020 0.111 0.032 1.020 0.821, 1.268 0.858 Gestation Middle trimester 0.095 0.137 0.482 0.905 0.705, 1.162 0.434 0.043 0.159 0.073 1.000 0.743, 1.347 0.999 Last trimester 0.095 0.148 0.412 0.893 0.680, 1.171 0.412 −0.113 0.170 0.439 0.862 0.621, 1.195 0.372 Habitation Urban 0.494 0.106 21.679 0.704 0.575, 0.862 0.001 −0.041 0.129 0.104 1.186 0.915, 1.536 0.198 Annual income, Yuan 20,000−29,999 0.218 0.191 1.302 1.145 0.793, 1.653 0.469 −0.356 0.230 2.394 0.997 0.639, 1.555 0.988 30,000−59,999 −0.089 0.280 0.100 1.749 1.016, 3.013 0.044 −0.173 0.343 0.255 0.859 0.441, 1.671 0.654 60,000−100,000 0.267 0.303 0.778 1.342 0.748, 2.407 0.325 0.048 0.377 0.016 1.268 0.614, 2.620 0.521 > 100,000 0.509 0.424 1.441 1.449 0.646, 3.248 0.368 −0.452 0.577 0.614 1.515 0.501, 4.584 0.462 Pregnancy vomiting reaction Slight 0.055 0.234 0.055 0.678 0.427, 1.076 0.099 0.086 0.298 0.083 1.137 0.637, 2.030 0.663 Moderate 0.006 0.456 0.000 0.534 0.224, 1.277 0.159 0.242 0.610 0.158 0.984 0.311, 3.117 0.978 Serious −0.578 0.728 0.630 0.695 0.180, 2.692 0.599 0.505 0.988 0.262 0.652 0.101, 4.193 0.653 Dietary habit Four meals a day −0.470 0.189 6.207 2.207 1.514, 3.217 0.000 −0.659 0.236 7.832 0.565 0.352, 0.908 0.018 Five or six meals a day −0.322 0.406 0.629 1.807 0.844, 3.869 0.128 −0.400 0.545 0.538 0.870 0.315, 2.403 0.788 Rule-less 0.341 0.560 0.369 0.884 0.310, 2.522 0.818 −0.150 0.187 0.637 0.750 0.191, 2.942 0.680 Note. 1Normal group, urinary iodine concentration is within the range of 150−249 μg/L. 2Low group, urinary iodine concentration is less than the 150 μg/L. 3High group, urinary iodine concentration is greater than the 249 μg/L. 4Multivariate Binary logistic regression. Table S5. Factors affecting pregnant women’s thyroid function
Indicator Classification Normal group and low group1 Normal group and high group1 β SE Waldχ2 OR 95% CI P2 β SE Waldχ2 OR 95% CI P2 FT4 Age 30−40 years old −0.137 0.210 0.427 0.872 0.577, 1.316 0.513 0.053 0.138 0.148 1.055 0.804, 1.383 0.700 Gestation Middle trimester −2.219 0.278 63.644 0.120 0.075, 0.193 0.000 −0.102 0.330 0.096 1.154 0.622, 2.143 0.649 Last trimester −2.056 0.330 38.854 0.151 0.081, 0.281 0.000 2.470 0.307 64.679 14.683 8.201, 26.288 0.000 Habitation Urban 0.174 0.236 2.542 1.715 1.101, 2.670 0.017 0.322 0.156 4.260 1.049 0.766, 1.436 0.766 Annual income, Yuan 20,000−29,999 −0.338 0.408 0.683 0.810 0.395, 1.662 0.566 −0.032 0.295 0.012 1.046 0.563, 1.943 0.888 30,000−59,999 0.514 0.866 0.352 2.948 0.590, 14.724 0.188 0.703 0.495 2.015 3.361 1.258, 8.981 0.016 60,000−100,000 −0.100 0.891 0.012 2.485 0.461, 13.388 0.289 1.825 0.537 11.547 8.097 2.820, 23.248 0.000 > 100,000 −2.070 1.281 2.611 0.334 0.024, 4.699 0.417 2.310 0.663 12.132 7.212 1.997, 26.045 0.003 Pregnancy vomiting reaction Slight −1.041 0.819 1.616 0.191 0.042, 0.875 0.033 −1.300 0.425 9.367 0.270 0.118, 0.621 0.002 Moderate 1.865 1.158 2.591 1.994 0.199, 19.949 0.557 −2.707 0.863 9.835 0.087 0.016, 0.464 0.004 Serious −7.750 1.017 0.986 41.291 0.752, 66.017 0.069 −5.462 1.442 14.339 0.012 0.001, 0.132 0.000 Dietary habit Four meals a day −1.022 0.479 4.554 0.759 0.329, 1.747 0.516 0.388 0.314 1.530 1.642 0.884, 3.051 0.117 Five or six meals a day −2.074 0.967 4.601 0.187 0.028, 1.248 0.083 0.542 0.759 0.510 1.563 0.359, 6.809 0.552 Rule-less −9.373 1.227 0.823 36.800 0.109, 52.238 0.995 3.526 1.285 7.528 17.754 2.197, 143.491 0.007 TSH Age 30−40 years old 0.030 0.202 0.022 1.031 0.694, 1.531 0.881 0.203 0.247 0.676 1.225 0.755, 1.986 0.411 Gestation Middle trimester 0.100 0.347 0.083 1.485 0.785, 2.810 0.224 0.283 0.523 0.292 1.059 0.429, 2.611 0.901 Last trimester 1.352 0.346 15.245 5.216 2.739, 9.933 0.000 1.487 0.502 8.788 4.673 1.988, 10.988 0.000 Habitation Urban 0.445 0.232 3.669 1.267 0.809, 1.986 0.301 0.256 0.281 0.828 1.898 1.139, 3.163 0.014 Annual income, Yuan 20,000−29,999 −0.193 0.467 0.171 0.608 0.254, 1.456 0.264 0.120 0.551 0.047 1.521 0.551, 4.195 0.418 30,000−59,999 0.999 0.876 1.299 3.867 0.708, 21.124 0.118 0.365 0.748 0.238 2.837 0.689, 11.672 0.149 60,000−100,000 2.102 0.896 5.500 9.375 1.650, 53.285 0.012 0.323 0.858 0.142 2.664 0.513, 13.823 0.244 > 100,000 2.310 1.147 4.054 11.675 1.196, 113.932 0.035 −2.184 1.937 1.271 0.853 0.015, 47.781 0.938 Pregnancy vomiting reaction Slight −1.148 0.793 2.094 0.247 0.051, 1.186 0.081 0.002 0.605 0.000 0.440 0.135, 1.431 0.172 Moderate −1.333 1.158 1.325 0.167 0.017, 1.615 0.122 −15.466 47.167 0.000 0.000 0.000, 1.978 0.997 Serious −1.778 1.856 0.918 0.232 0.008, 6.846 0.397 −12.652 57.168 0.000 0.000 0.000, 1.325 0.998 Dietary habit Four meals a day −0.043 0.372 0.013 1.036 0.500, 2.147 0.925 −0.619 0.677 0.837 1.886 0.582, 6.116 0.290 Five or six meals a day −1.709 0.864 3.906 0.167 0.031, 0.904 0.038 15.136 44.163 0.000 0.000 0.000, 5.348 0.997 Rule-less −1.214 1.403 0.749 0.278 0.027, 2.909 0.285 13.819 37.167 0.000 0.000 0.000, 7.616 0.998 Note. 1Normal, low and high group, FT4 or TSH is within, below and above the normal range, respectively. 2Multivariate Binary logistic regression. Table S6. Factors affecting pregnant women’s thyroid related antibodies
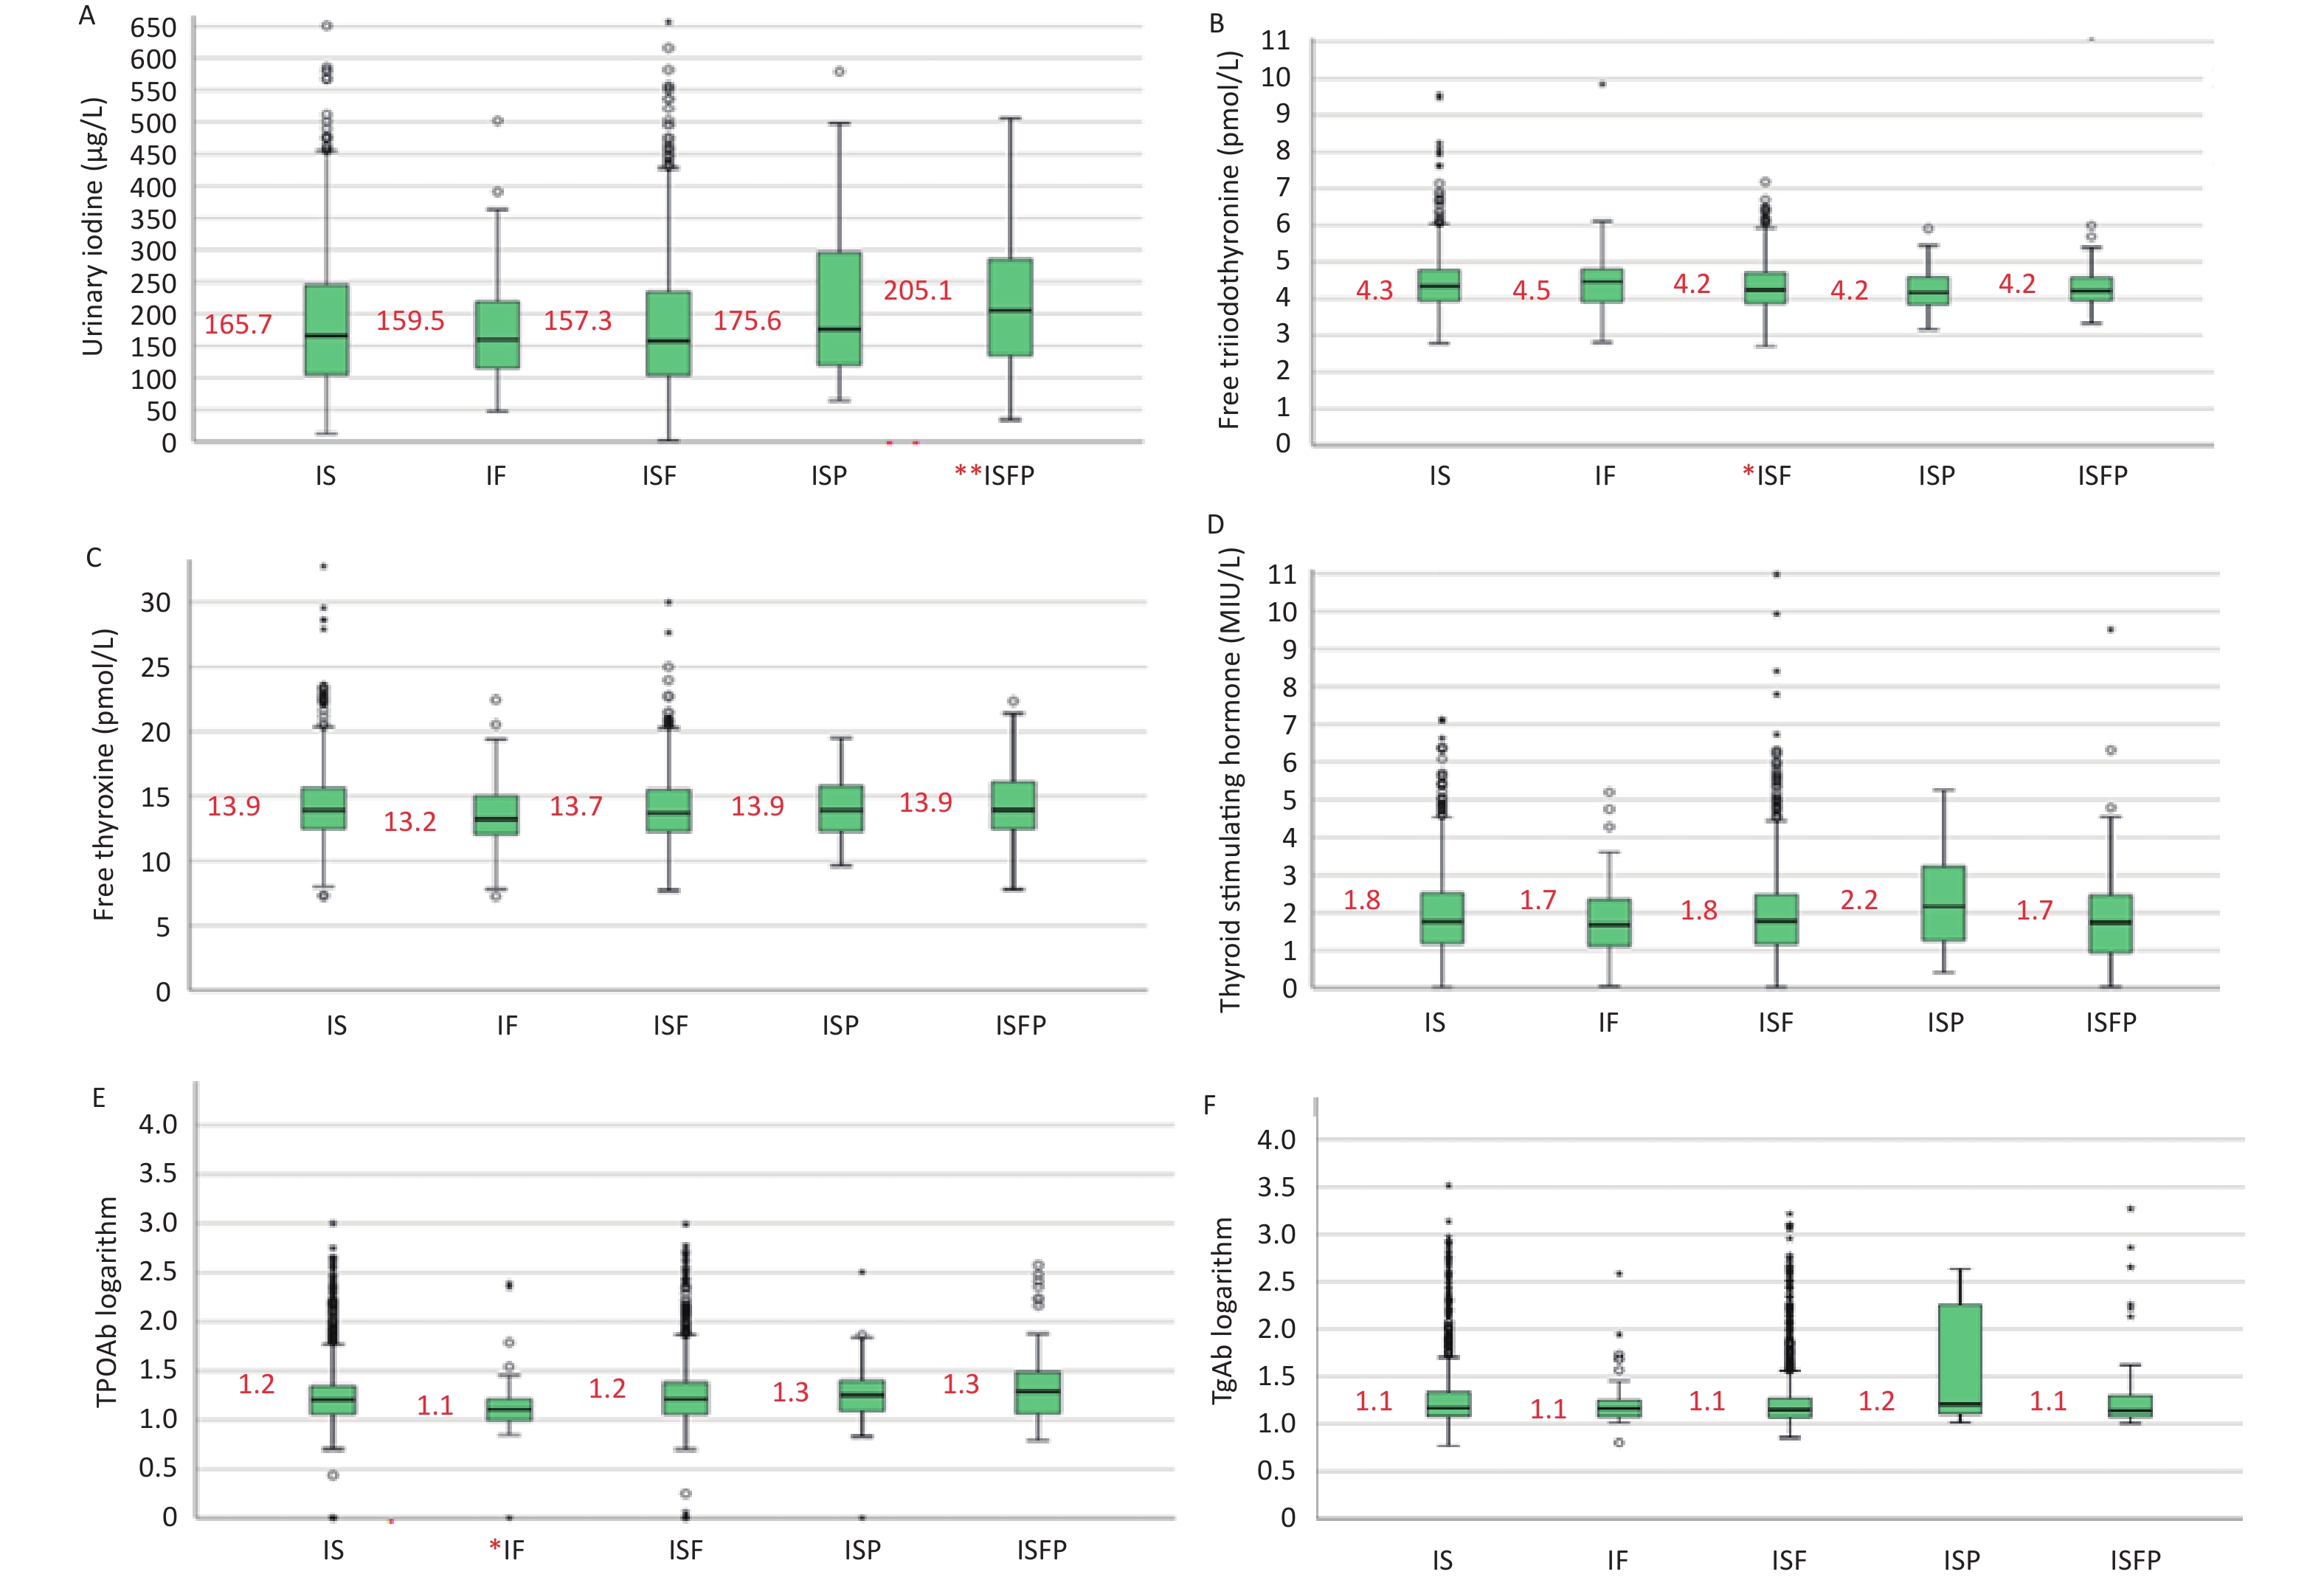
Indication Classification Normal group1 and high group1 β SE Wald χ2 OR 95% CI P2 TPOAb Age 30−40 years old −0.068 0.123 0.308 0.934 0.734, 1.188 0.579 Gestation Middle trimester −0.323 0.176 3.359 0.645 0.466, 0.892 0.008 Last trimester 0.014 0.185 0.006 1.010 0.720, 1.417 0.955 Habitation Urban −0.069 0.140 0.244 0.937 0.716, 1.227 0.638 Annual income, yuan 20,000−29,999 −0.445 0.254 3.058 0.629 0.383, 1.033 0.067 30,000−59,999 −1.189 0.343 12.027 0.409 0.209, 0.802 0.009 60,000−100,000 −1.116 0.373 8.946 0.400 0.193, 0.830 0.014 > 100,000 −1.640 0.580 8.008 0.228 0.075, 0.701 0.010 Pregnancy vomiting reaction Slight 0.856 0.285 9.037 1.666 0.946, 2.935 0.077 Moderate 1.026 0.632 2.640 1.572 0.461, 5.357 0.470 Serious −0.410 1.375 0.089 0.271 0.019, 3.855 0.335 Dietary habit Four meals a day 0.025 0.256 0.010 1.534 0.929, 2.533 0.095 Five or six meals a day −0.053 0.588 0.008 1.463 0.475, 4.508 0.508 Rule-less 1.656 1.200 1.905 9.583 0.923, 99.493 0.058 TgAb Age 30−40 years old −0.055 0.158 0.122 0.946 0.695, 1.289 0.727 Gestation Middle trimester −0.251 0.226 1.226 0.674 0.453, 1.005 0.053 Last trimester −0.208 0.245 0.718 0.763 0.493, 1.181 0.225 Habitation Urban −0.112 0.185 0.364 0.820 0.578, 1.165 0.269 Annual income, Yuan 20,000−29,999 0.027 0.296 0.008 0.798 0.452, 1.407 0.435 30,000−59,999 0.078 0.481 0.026 1.103 0.444, 2.739 0.833 60,000−100,000 −0.078 0.524 0.022 0.917 0.341, 2.466 0.864 > 100,000 0.059 0.774 0.006 0.721 0.173, 3.010 0.653 Pregnancy vomiting reaction Slight −0.421 0.411 1.047 0.613 0.279, 1.351 0.225 Moderate −1.462 0.997 2.152 0.231 0.036, 1.502 0.125 Serious −20.132 47.560 0.000 0.000 0.000, 3.997 0.997 Dietary habit Four meals a day 0.210 0.324 0.421 1.682 0.914, 3.097 0.095 Five or six meals a day 1.203 0.914 1.734 3.471 0.627, 19.225 0.154 Rule-less 19.462 59.660 0.000 0.000 0.000, 5.991 0.997 Note. 1Normal and high group, TPOAb or TgAb is within and greater than the normal range, respectively. 2Multivariate Binary logistic regression. By comparing different iodine supplementation measures, iodine supplementation in ISFP group (MUIC of 205.1 μg/L) resulted in significantly improved iodine nutrition in pregnant women (Figure 1A). Compared with other iodine supplementation measures, the IF group had significantly reduced TPOAb values (P < 0.01, Figure 1E), While, the ISP group had the highest TgAb levels (Figure 1F). For thyroid-related diseases, different measures affected the prevalence of sub-hyperthyroidism and antibody status (Table 2). Among these, the IF group had the lowest prevalence of TPOAb-positive (5.48%) and TgAb-positive (1.37%). However, the ISP group had the highest prevalence of TgAb-positive (23.81%), followed by the ISFP group; furthermore, and the positive rate of TPOAb was highest in the ISFP group (24.14%). In addition, the prevalence of sub-hyperthyroidism in the ISF group was the highest (8.59%).
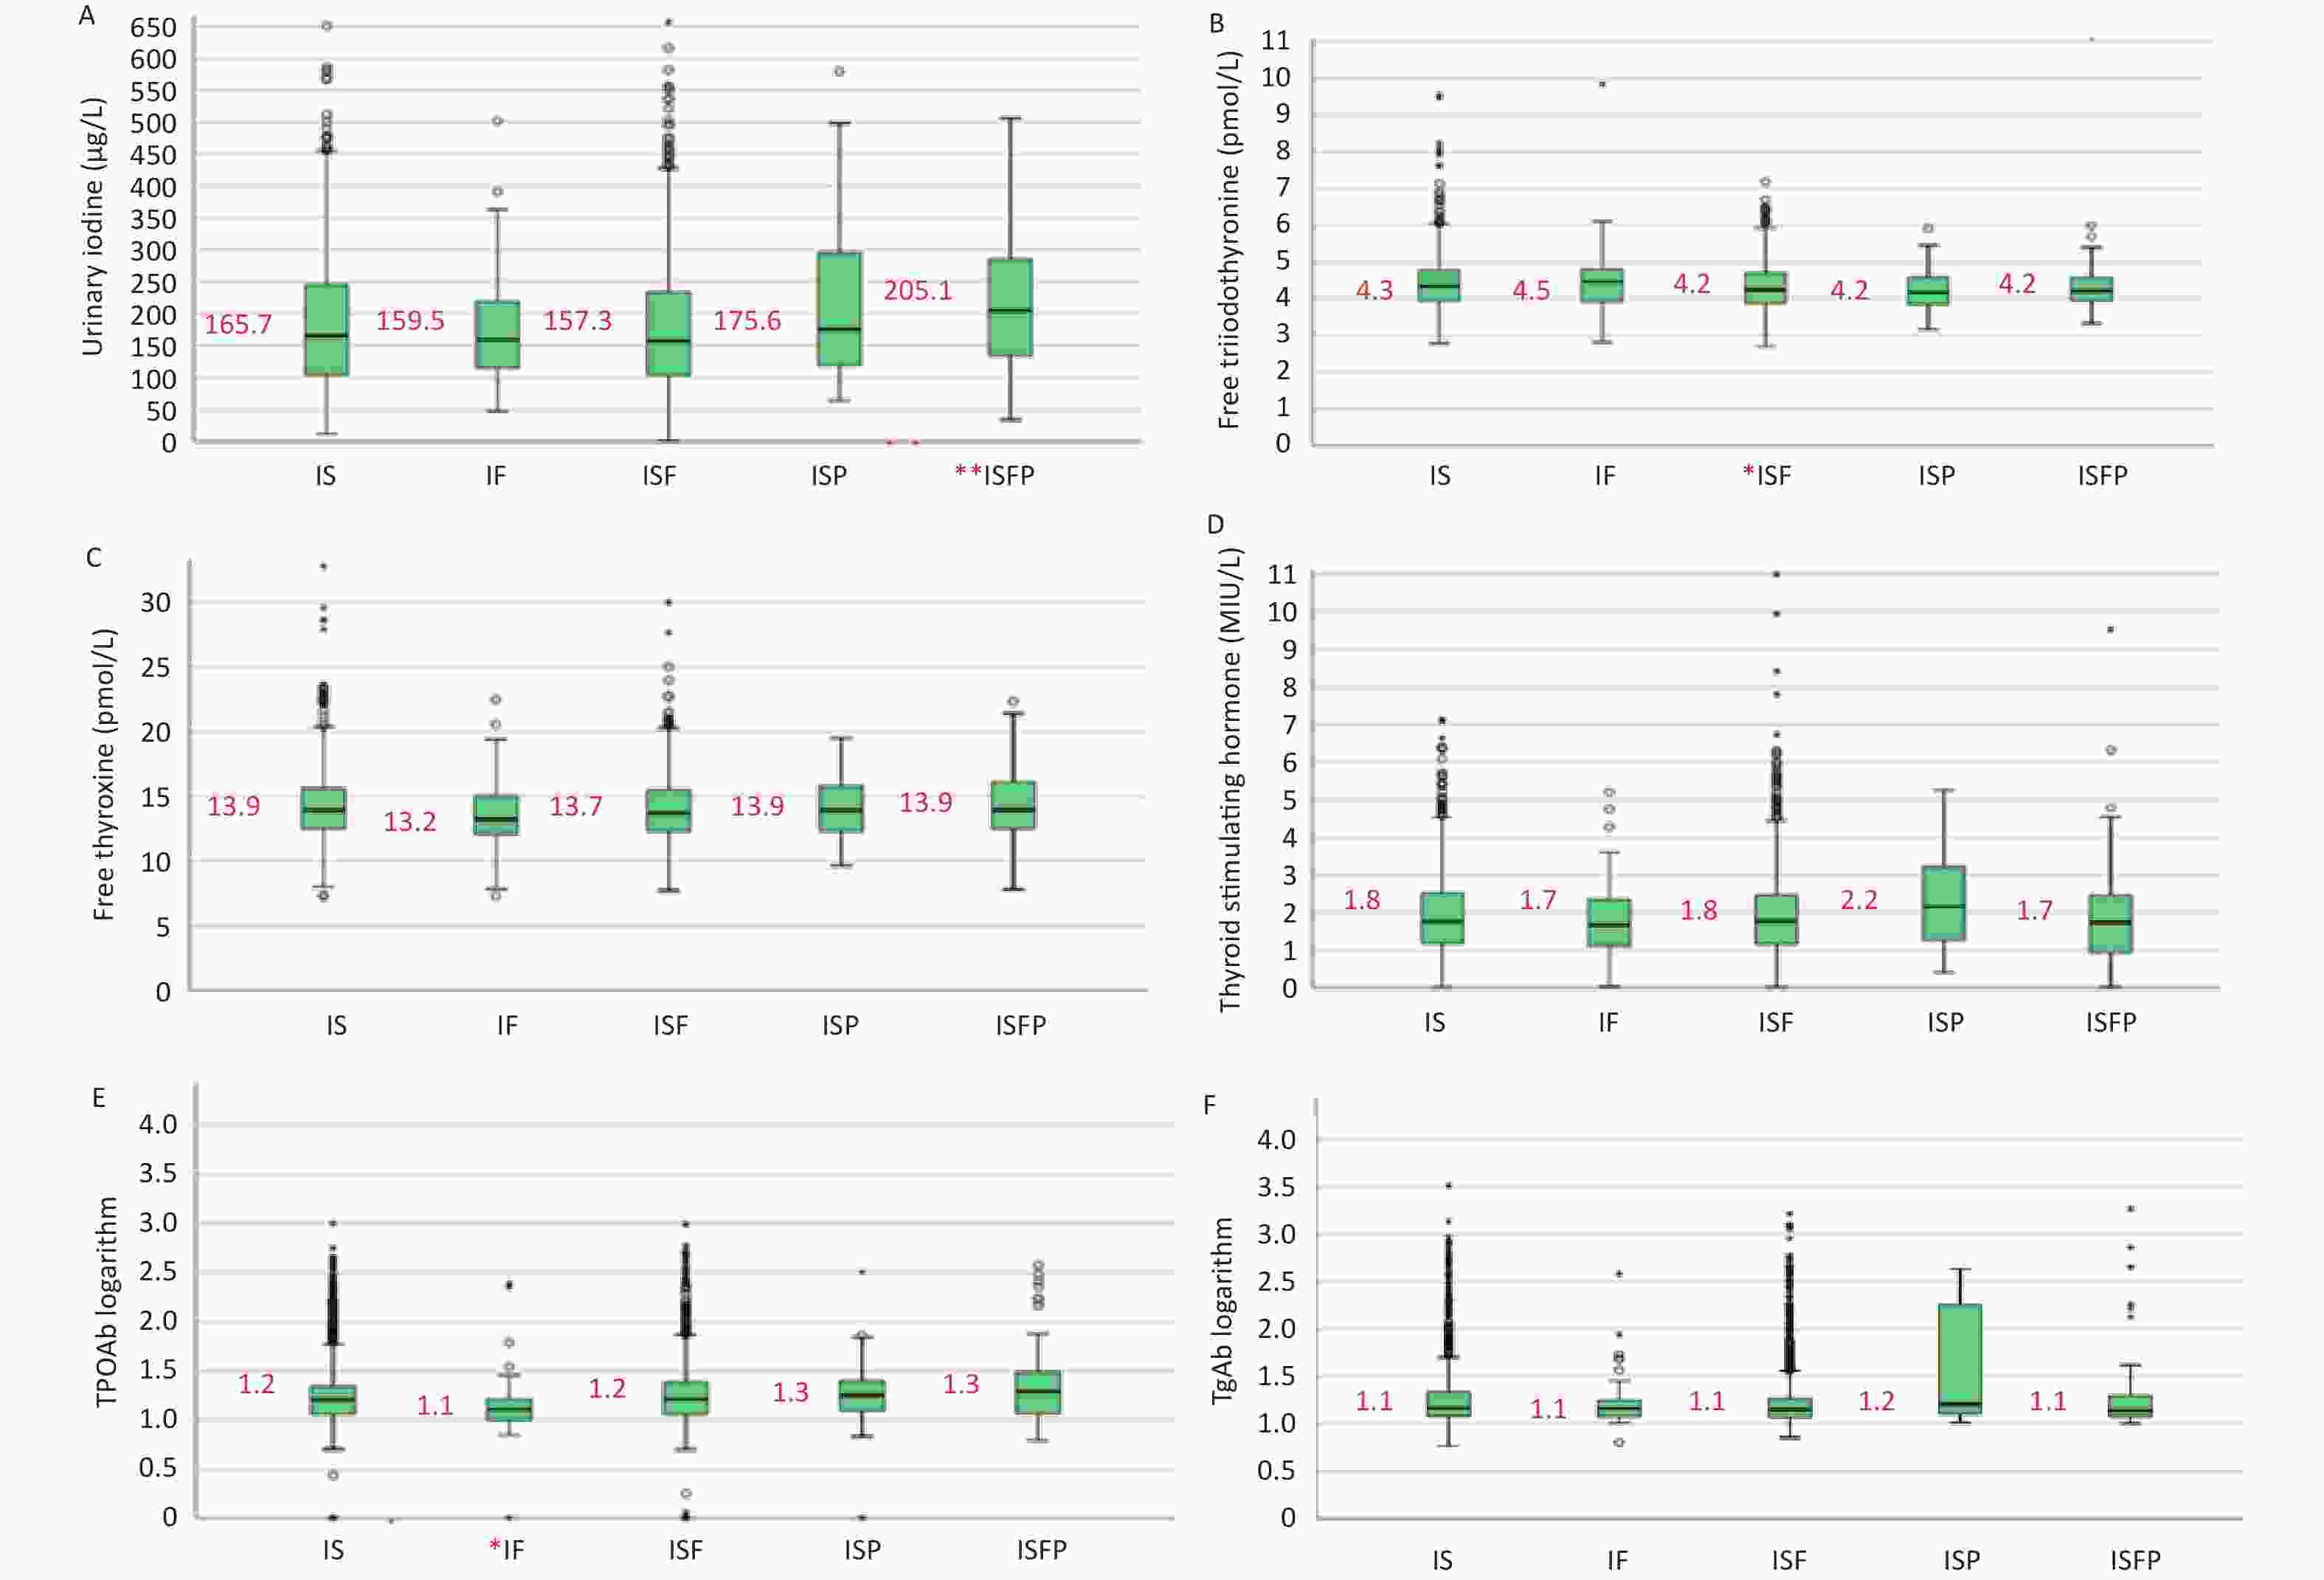
Figure 1. Urinary iodine and thyroid function of pregnant women with different iodine supplementation measures. All data are presented as median and interquartile range. (A) urinary iodine; (B) FT3 levels; (C) FT4 levels; (D) TSH levels; (E) TPOAb levels; (F) TgAb levels. IS, iodized salt; IF, iodine rich food; ISF, iodized salt + iodine rich food; ISP, iodized salt + iodine supplement pills; ISFP, iodized salt + iodine rich food + iodine supplement pills. *Represents that the indicator in this group was the lowest level in all groups; **represents that the indicator in this group was the highest level in all groups.
Table 2. Effect of iodine supplementation measures on thyroid diseases
Indication Classification Iodine supplement measures Value
(χ2/Fisher)P6 IS1
n = 1,066IF2
n = 73ISF3
n = 1,164ISP4
n = 42ISFP5
n = 58Hypothyroidism Yes 9 0 5 0 0 1.602 0.750 No 1,057 73 1,159 42 58 Rate (%) 0.84 0 0.43 0 0 Sub-
hypothyroidismYes 42 3 45 1 1 0.457 0.975 No 1,024 70 1,119 41 57 Rate (%) 3.94 4.11 3.87 2.38 1.72 Hyperthyroidism Yes 18 2 16 1 1 2.458 0.532 No 1,048 71 1,148 41 57 Rate (%) 1.69 2.74 1.37 2.44 1.72 Sub-
hyperthyroidismYes 23 2 10 1 1 8.647 0.047 No 1,043 71 1,154 41 57 Rate (%) 2.16 2.74 8.59 2.44 1.72 TPOAb-
positiveYes 129 4 137 4 14 104.261 0.000 No 937 69 1,027 38 44 Rate (%) 12.10 5.48 11.77 9.52 24.14 TgAb-
positiveYes 76 1 62 10 6 28.806 0.000 No 990 72 1,102 32 52 Rate (%) 7.13 1.37 5.33 23.81 10.34 Double antibody
positiveYes 54 1 43 0 4 6.293 0.152 No 1,012 72 1,121 42 54 Rate (%) 5.07 1.37 3.69 0 6.90 Goiter Yes 8 0 81 0 0 0.142 1.000 No 1,034 73 1,143 35 58 Rate (%) 0.77 0 0.70 0 0 Nodules Yes 152 18 196 8 6 8.621 0.071 No 903 55 960 33 52 Rate (%) 14.41 24.66 16.96 19.51 10.34 Note. 1IS, iodine salt. 2IF, iodine rich food. 3ISF, iodine salt + iodine rich food. 4ISP, iodine salt + Iodine preparations. 5ISFP, iodine salt + iodine rich food + iodine preparations. 6Chi-square test and Fisher’s exact test. Accessing appropriate iodine supplementation measures promotes the health of pregnant women. Gao CH et al.[8] found that iodine-rich herbs such as kelp and seaweed had positive effects on the recovery of iodine deficiency goiter, and in this study, pregnant women supplementing iodine in the IF group had a lower prevalence of thyroid antibody-positive conditions. Bai JJ et al. confirmed that the intake of meat, milk, seafood, and other food also had an impact on the iodine nutrition of pregnant women[9], which is consistent with the findings of the study. Iodine supplementation in the ISFP group was the best approach for pregnant women to improve iodine nutrition, but attention should be paid to excessive iodine intake; furthermore, ISF and ISFP approaches to iodine supplementation may increase the prevalence of antibody-positive thyroid disease. In addition, our study found that higher MUIC (150–249 μg/L) increased the risk of autoimmune and sub-hypothyroidism, which may result from excess iodine consumption leading to autoimmune activity that further causes hypothyroidism[10]. However, it is misunderstood that pregnant women should decrease iodine intake; pregnant women with MUIC in the range of 100–150 μg/L have increased risk of goiter. Through this study, we found that different iodine supplements had different effects on thyroid function and iodine nutrition, and the effects varied from person to person. Therefore, iodine should be supplemented using scientific approaches.
In this study, the food weighing method was not used, and the food frequency questionnaire may have resulted in some bias, although every investigator was trained to ensure the accuracy of survey results. Due to time limitations, our investigation ignored some information, which may have resulted in an incomplete assessment of influencing factors and interactions. As China has a high coverage of USI, the numbers of iodine supplementation with IF, ISP, and ISFP approaches were relatively few, which would make some stratified analysis difficult and limit the analysis of results. Therefore, future studies should aim to expand the sample size. Moreover, the changes of various indicators of the same subject during the whole pregnancy period were not observed, and a cohort study will be conducted if future opportunities allow.
Many factors can affect iodine nutrition status and thyroid function in pregnant women, such as habitation (urban/rural), gestation, family annual income, pregnancy vomiting reaction, dietary habits, and iodine supplementation measures. Iodine should be supplemented scientifically, and our findings suggest that iodine supplementation with ISFP is the most effective measure to improve iodine nutrition in pregnant women if the iodine is not excess. In the case of adequate iodine nutrition, iodine supplementation only with iodine-rich food can significantly reduce the positive rate of antibodies and reduce the incidence of autoimmune disease. Accessing appropriate iodine supplementation measures promotes the healthy development of pregnant women.
Acknowledgements We thank all participants in this study and the staff working with the indicator examinations in provincial CDC.
Conflicts of Interest No competing financial interests exist.
Authorship PL designed the study; LZ, WDL, QZJ, JHW, JSL, ZHC, and BYZ carried out the research; RS, TTQ, LCL, MZ, and WJC analyzed the data; and RS wrote the paper. RS and TTQ held primary responsibility for the final content. All authors read and approved the final manuscript.
Data Availability Data described in the manuscript, code book, and analytic code will not be made available.
doi: 10.3967/bes2022.083
Effect of Iodine Supplementation on Iodine Nutrition and Thyroid Function in Pregnant Women: A Cross-Sectional Study
-
&These authors contributed equally to this work.
注释: -
Figure 1. Urinary iodine and thyroid function of pregnant women with different iodine supplementation measures. All data are presented as median and interquartile range. (A) urinary iodine; (B) FT3 levels; (C) FT4 levels; (D) TSH levels; (E) TPOAb levels; (F) TgAb levels. IS, iodized salt; IF, iodine rich food; ISF, iodized salt + iodine rich food; ISP, iodized salt + iodine supplement pills; ISFP, iodized salt + iodine rich food + iodine supplement pills. *Represents that the indicator in this group was the lowest level in all groups; **represents that the indicator in this group was the highest level in all groups.
S1. Basic information of pregnant women in seven provinces
Indication Classification Number Proportion (%) Habitation Village 1,518 63.3 Urban 879 36.7 Gestation First trimester 428 17.6 Middle trimester 1,102 45.2 Last trimester 907 37.2 Level of education Primary school 114 4.8 Junior high school 850 35.5 Senior high school 534 22.3 Junior college 564 23.5 Bachelor degree 314 13.1 Master degree or above 21 0.8 Household
annual income, yuan a year< 20,000 349 14.6 20,000−29,999 403 16.8 30,000−59,999 685 28.6 60,000−100,000 651 27.2 > 100,000 309 12.8 Pregnancy vomiting reaction No 600 25.0 Slight 1,171 48.9 Moderate 420 17.5 Serious 206 8.6 Dietary habit Three meals a day 1,537 64.1 Four meals a day 300 12.5 Five or six meals a day 395 16.5 Rule-less 165 6.9 Total 2,397 100.0  下载: 导出CSV
Table 1. Iodine nutrition and iodine supplementation measures in pregnant women
Province Number MUIC* (μg /L) Sources of iodine intake (μg/d)
(contribution rate, %)3Iodine supplement (%) Iodized
salt, MeanFood,
meanPreparations,
meanDrinking
water, medianIodine
supplement
rate1Consumption
rate of qualified
iodized salt2Fujian 329 132.9 121.3 (51.49) 98.6 (39.74) 17.5 (7.41) 2.4 (2.40) 99.0 93.6 Liaoning 369 127.1 98.9 (48.41) 84.9 (44.41) 6.1 (2.96) 6.5 (4.22) 99.0 90.7 Shanxi 401 155.6 100.7 (49.15) 84.5 (47.39) 1.3 (0.47) 5.0 (2.99) 99.8 97.1 Sichuan 360 192.7 117.0 (50.56) 98.4 (38.23) 18.9 (8.33) 1.7 (2.88) 99.8 88.5 Xinjiang 367 229.8 117.9 (22.93) 102.8 (17.10) 312.5 (59.34) 3.1 (1.17) 100.0 90.1 Anhui 386 156.8 135.8 (57.59) 114.5 (41.28) 1.8 (0.75) 1.5 (0.38) 100.0 97.5 Hubei 321 175.0 100.2 (48.68) 104.9 (46.77) 6.8 (3.31) 2.0 (1.24) 99.5 96.3 Total 2,533 164.3 113.1 (42.93) 98.3 (35.44) 47.7 (19.78) 3.1 (1.85) 99.0 89.7 Note. *MUIC, population median urinary iodine concentration. 1Iodine supplement rate, the proportion of pregnant women who took iodized salt, iodine supplement preparations and iodine-rich foods. 2Consumption rate of qualified iodized salt, salt samples with iodine of 18–33 mg/kg / total number of samples. 3Contribution rate, iodine intake in drinking water, food, iodine preparations, or salt / all amounts of iodine intake.
下载: 导出CSV
S2. Comparison of thyroid diseases prevalence grouped by counties and individual with different MUIC1 or UI2
Kind of disease Rate (%) grouped by
median urinary iodine
(counties, μg/L)P3 Rate (%) grouped by
urinary iodine
(individual, μg/L)P3 100−149 150−249 < 150 150−249 250−499 Hypothyroidism 0.46 0.50 0.888 0.27 0.87 0.78 0.174 Sub-hypothyroidism 2.46 5.38 0.000 2.67 5.24 3.72 0.014 Hyperthyroidism 1.55 1.65 0.842 1.42 1.50 2.94 0.078 Sub-hyperthyroidism 1.55 1.82 0.616 1.96 1.62 2.94 0.351 TPOAb positive 8.95 13.78 0.004 11.39 11.66 16.38 0.011 TgAb positive 6.19 6.69 0.623 6.35 6.13 7.71 0.489 Double antibody positive 3.78 5.48 0.034 4.41 3.44 5.39 0.188 Goiter 1.02 0.41 0.027 1.10 0.50 4.90 0.000 Nodules 16.44 17.15 0.646 17.10 15.30 14.40 0.321 Note. 1MUIC, population median urinary iodine concentration. 2UI, personal urinary iodine concentration. 3Chi-square test and Fisher’s exact test.
下载: 导出CSV
S3. Prevalence of thyroid diseases for pregnant women in different provinces
Provinces Number Prevalence of thyroid function related diseases (%) Goiter1
rate
(%)Thyroid
nodule2
rate
(%)Hypo-
thyroidism3Subclinical
hypo-
thyroidism4Hyper-
thyroidism5Subclinical
hyper-
thyroidism6TPOAb
positive7TgAb
positive8Double
antibody
positive9Total Xinjiang 365 1.65 3.56 0.82 0.82 10.96 5.21 1.10 22.47 0.00 8.22 Sichuan 359 0.56 7.24 1.95 1.39 25.63 7.24 5.57 33.98 0.25 10.07 Shanxi 394 0.76 4.31 0.51 2.54 10.15 9.14 6.09 17.01 0.46 22.74 Liaoning 367 0.27 3.27 4.36 0.27 10.35 8.99 4.63 17.71 3.25 20.80 Fujian 318 0.31 1.26 2.52 3.46 7.55 3.14 2.20 15.09 0.52 14.25 Anhui 401 0.50 2.74 0.75 3.24 11.22 6.23 4.49 15.96 0.00 16.67 Hubei 321 0.31 3.74 0.62 1.25 10.28 4.98 4.98 15.89 0.50 16.54 Total 2,525 0.67 3.76 1.62 1.86 12.36 6.53 4.20 19.76 0.72 15.75 Note. 1Goiter, thyroid volume is beyond the upper limit of the normal range. 2Thyroid nodule, pathological changes caused by local abnormal growth of thyroid cells. 3Hypothyroidism, TSH is greater than the upper limit of the normal range, and FT4 is less than the lower limit of the normal range. 4Subclinical hypothyroidism, TSH is greater than the upper limit of the normal range, and FT4 is within the normal range. 5 Hyperthyroidism, TSH is less than the lower limit of the normal range, and FT4 is greater than the upper limit of the normal range. 6Subclinical hyperthyroidism, TSH is less than the lower limit of the normal range, and FT4 is within the normal range. 7TPOAb positive, TPOAb is greater than the upper limit of the normal range. 8TgAb positive, TgAb is greater than the upper limit of the normal range. 9Double Antibody positive, both TPOAb and TgAb are greater than the upper limit of the normal rang.
下载: 导出CSV
S4. Factors affecting pregnant women’s urinary iodine
Classification Normal group1 and low group2 Normal group and high group3 β SE Wald χ2 OR 95% CI P4 β SE Wald χ2 OR 95% CI P4 Age 30−40 years old 0.006 0.091 0.004 1.006 0.842, 1.201 0.952 0.020 0.111 0.032 1.020 0.821, 1.268 0.858 Gestation Middle trimester 0.095 0.137 0.482 0.905 0.705, 1.162 0.434 0.043 0.159 0.073 1.000 0.743, 1.347 0.999 Last trimester 0.095 0.148 0.412 0.893 0.680, 1.171 0.412 −0.113 0.170 0.439 0.862 0.621, 1.195 0.372 Habitation Urban 0.494 0.106 21.679 0.704 0.575, 0.862 0.001 −0.041 0.129 0.104 1.186 0.915, 1.536 0.198 Annual income, Yuan 20,000−29,999 0.218 0.191 1.302 1.145 0.793, 1.653 0.469 −0.356 0.230 2.394 0.997 0.639, 1.555 0.988 30,000−59,999 −0.089 0.280 0.100 1.749 1.016, 3.013 0.044 −0.173 0.343 0.255 0.859 0.441, 1.671 0.654 60,000−100,000 0.267 0.303 0.778 1.342 0.748, 2.407 0.325 0.048 0.377 0.016 1.268 0.614, 2.620 0.521 > 100,000 0.509 0.424 1.441 1.449 0.646, 3.248 0.368 −0.452 0.577 0.614 1.515 0.501, 4.584 0.462 Pregnancy vomiting reaction Slight 0.055 0.234 0.055 0.678 0.427, 1.076 0.099 0.086 0.298 0.083 1.137 0.637, 2.030 0.663 Moderate 0.006 0.456 0.000 0.534 0.224, 1.277 0.159 0.242 0.610 0.158 0.984 0.311, 3.117 0.978 Serious −0.578 0.728 0.630 0.695 0.180, 2.692 0.599 0.505 0.988 0.262 0.652 0.101, 4.193 0.653 Dietary habit Four meals a day −0.470 0.189 6.207 2.207 1.514, 3.217 0.000 −0.659 0.236 7.832 0.565 0.352, 0.908 0.018 Five or six meals a day −0.322 0.406 0.629 1.807 0.844, 3.869 0.128 −0.400 0.545 0.538 0.870 0.315, 2.403 0.788 Rule-less 0.341 0.560 0.369 0.884 0.310, 2.522 0.818 −0.150 0.187 0.637 0.750 0.191, 2.942 0.680 Note. 1Normal group, urinary iodine concentration is within the range of 150−249 μg/L. 2Low group, urinary iodine concentration is less than the 150 μg/L. 3High group, urinary iodine concentration is greater than the 249 μg/L. 4Multivariate Binary logistic regression.
下载: 导出CSV
S5. Factors affecting pregnant women’s thyroid function
Indicator Classification Normal group and low group1 Normal group and high group1 β SE Waldχ2 OR 95% CI P2 β SE Waldχ2 OR 95% CI P2 FT4 Age 30−40 years old −0.137 0.210 0.427 0.872 0.577, 1.316 0.513 0.053 0.138 0.148 1.055 0.804, 1.383 0.700 Gestation Middle trimester −2.219 0.278 63.644 0.120 0.075, 0.193 0.000 −0.102 0.330 0.096 1.154 0.622, 2.143 0.649 Last trimester −2.056 0.330 38.854 0.151 0.081, 0.281 0.000 2.470 0.307 64.679 14.683 8.201, 26.288 0.000 Habitation Urban 0.174 0.236 2.542 1.715 1.101, 2.670 0.017 0.322 0.156 4.260 1.049 0.766, 1.436 0.766 Annual income, Yuan 20,000−29,999 −0.338 0.408 0.683 0.810 0.395, 1.662 0.566 −0.032 0.295 0.012 1.046 0.563, 1.943 0.888 30,000−59,999 0.514 0.866 0.352 2.948 0.590, 14.724 0.188 0.703 0.495 2.015 3.361 1.258, 8.981 0.016 60,000−100,000 −0.100 0.891 0.012 2.485 0.461, 13.388 0.289 1.825 0.537 11.547 8.097 2.820, 23.248 0.000 > 100,000 −2.070 1.281 2.611 0.334 0.024, 4.699 0.417 2.310 0.663 12.132 7.212 1.997, 26.045 0.003 Pregnancy vomiting reaction Slight −1.041 0.819 1.616 0.191 0.042, 0.875 0.033 −1.300 0.425 9.367 0.270 0.118, 0.621 0.002 Moderate 1.865 1.158 2.591 1.994 0.199, 19.949 0.557 −2.707 0.863 9.835 0.087 0.016, 0.464 0.004 Serious −7.750 1.017 0.986 41.291 0.752, 66.017 0.069 −5.462 1.442 14.339 0.012 0.001, 0.132 0.000 Dietary habit Four meals a day −1.022 0.479 4.554 0.759 0.329, 1.747 0.516 0.388 0.314 1.530 1.642 0.884, 3.051 0.117 Five or six meals a day −2.074 0.967 4.601 0.187 0.028, 1.248 0.083 0.542 0.759 0.510 1.563 0.359, 6.809 0.552 Rule-less −9.373 1.227 0.823 36.800 0.109, 52.238 0.995 3.526 1.285 7.528 17.754 2.197, 143.491 0.007 TSH Age 30−40 years old 0.030 0.202 0.022 1.031 0.694, 1.531 0.881 0.203 0.247 0.676 1.225 0.755, 1.986 0.411 Gestation Middle trimester 0.100 0.347 0.083 1.485 0.785, 2.810 0.224 0.283 0.523 0.292 1.059 0.429, 2.611 0.901 Last trimester 1.352 0.346 15.245 5.216 2.739, 9.933 0.000 1.487 0.502 8.788 4.673 1.988, 10.988 0.000 Habitation Urban 0.445 0.232 3.669 1.267 0.809, 1.986 0.301 0.256 0.281 0.828 1.898 1.139, 3.163 0.014 Annual income, Yuan 20,000−29,999 −0.193 0.467 0.171 0.608 0.254, 1.456 0.264 0.120 0.551 0.047 1.521 0.551, 4.195 0.418 30,000−59,999 0.999 0.876 1.299 3.867 0.708, 21.124 0.118 0.365 0.748 0.238 2.837 0.689, 11.672 0.149 60,000−100,000 2.102 0.896 5.500 9.375 1.650, 53.285 0.012 0.323 0.858 0.142 2.664 0.513, 13.823 0.244 > 100,000 2.310 1.147 4.054 11.675 1.196, 113.932 0.035 −2.184 1.937 1.271 0.853 0.015, 47.781 0.938 Pregnancy vomiting reaction Slight −1.148 0.793 2.094 0.247 0.051, 1.186 0.081 0.002 0.605 0.000 0.440 0.135, 1.431 0.172 Moderate −1.333 1.158 1.325 0.167 0.017, 1.615 0.122 −15.466 47.167 0.000 0.000 0.000, 1.978 0.997 Serious −1.778 1.856 0.918 0.232 0.008, 6.846 0.397 −12.652 57.168 0.000 0.000 0.000, 1.325 0.998 Dietary habit Four meals a day −0.043 0.372 0.013 1.036 0.500, 2.147 0.925 −0.619 0.677 0.837 1.886 0.582, 6.116 0.290 Five or six meals a day −1.709 0.864 3.906 0.167 0.031, 0.904 0.038 15.136 44.163 0.000 0.000 0.000, 5.348 0.997 Rule-less −1.214 1.403 0.749 0.278 0.027, 2.909 0.285 13.819 37.167 0.000 0.000 0.000, 7.616 0.998 Note. 1Normal, low and high group, FT4 or TSH is within, below and above the normal range, respectively. 2Multivariate Binary logistic regression.
下载: 导出CSV
S6. Factors affecting pregnant women’s thyroid related antibodies
Indication Classification Normal group1 and high group1 β SE Wald χ2 OR 95% CI P2 TPOAb Age 30−40 years old −0.068 0.123 0.308 0.934 0.734, 1.188 0.579 Gestation Middle trimester −0.323 0.176 3.359 0.645 0.466, 0.892 0.008 Last trimester 0.014 0.185 0.006 1.010 0.720, 1.417 0.955 Habitation Urban −0.069 0.140 0.244 0.937 0.716, 1.227 0.638 Annual income, yuan 20,000−29,999 −0.445 0.254 3.058 0.629 0.383, 1.033 0.067 30,000−59,999 −1.189 0.343 12.027 0.409 0.209, 0.802 0.009 60,000−100,000 −1.116 0.373 8.946 0.400 0.193, 0.830 0.014 > 100,000 −1.640 0.580 8.008 0.228 0.075, 0.701 0.010 Pregnancy vomiting reaction Slight 0.856 0.285 9.037 1.666 0.946, 2.935 0.077 Moderate 1.026 0.632 2.640 1.572 0.461, 5.357 0.470 Serious −0.410 1.375 0.089 0.271 0.019, 3.855 0.335 Dietary habit Four meals a day 0.025 0.256 0.010 1.534 0.929, 2.533 0.095 Five or six meals a day −0.053 0.588 0.008 1.463 0.475, 4.508 0.508 Rule-less 1.656 1.200 1.905 9.583 0.923, 99.493 0.058 TgAb Age 30−40 years old −0.055 0.158 0.122 0.946 0.695, 1.289 0.727 Gestation Middle trimester −0.251 0.226 1.226 0.674 0.453, 1.005 0.053 Last trimester −0.208 0.245 0.718 0.763 0.493, 1.181 0.225 Habitation Urban −0.112 0.185 0.364 0.820 0.578, 1.165 0.269 Annual income, Yuan 20,000−29,999 0.027 0.296 0.008 0.798 0.452, 1.407 0.435 30,000−59,999 0.078 0.481 0.026 1.103 0.444, 2.739 0.833 60,000−100,000 −0.078 0.524 0.022 0.917 0.341, 2.466 0.864 > 100,000 0.059 0.774 0.006 0.721 0.173, 3.010 0.653 Pregnancy vomiting reaction Slight −0.421 0.411 1.047 0.613 0.279, 1.351 0.225 Moderate −1.462 0.997 2.152 0.231 0.036, 1.502 0.125 Serious −20.132 47.560 0.000 0.000 0.000, 3.997 0.997 Dietary habit Four meals a day 0.210 0.324 0.421 1.682 0.914, 3.097 0.095 Five or six meals a day 1.203 0.914 1.734 3.471 0.627, 19.225 0.154 Rule-less 19.462 59.660 0.000 0.000 0.000, 5.991 0.997 Note. 1Normal and high group, TPOAb or TgAb is within and greater than the normal range, respectively. 2Multivariate Binary logistic regression.
下载: 导出CSV
Table 2. Effect of iodine supplementation measures on thyroid diseases
Indication Classification Iodine supplement measures Value
(χ2/Fisher)P6 IS1
n = 1,066IF2
n = 73ISF3
n = 1,164ISP4
n = 42ISFP5
n = 58Hypothyroidism Yes 9 0 5 0 0 1.602 0.750 No 1,057 73 1,159 42 58 Rate (%) 0.84 0 0.43 0 0 Sub-
hypothyroidismYes 42 3 45 1 1 0.457 0.975 No 1,024 70 1,119 41 57 Rate (%) 3.94 4.11 3.87 2.38 1.72 Hyperthyroidism Yes 18 2 16 1 1 2.458 0.532 No 1,048 71 1,148 41 57 Rate (%) 1.69 2.74 1.37 2.44 1.72 Sub-
hyperthyroidismYes 23 2 10 1 1 8.647 0.047 No 1,043 71 1,154 41 57 Rate (%) 2.16 2.74 8.59 2.44 1.72 TPOAb-
positiveYes 129 4 137 4 14 104.261 0.000 No 937 69 1,027 38 44 Rate (%) 12.10 5.48 11.77 9.52 24.14 TgAb-
positiveYes 76 1 62 10 6 28.806 0.000 No 990 72 1,102 32 52 Rate (%) 7.13 1.37 5.33 23.81 10.34 Double antibody
positiveYes 54 1 43 0 4 6.293 0.152 No 1,012 72 1,121 42 54 Rate (%) 5.07 1.37 3.69 0 6.90 Goiter Yes 8 0 81 0 0 0.142 1.000 No 1,034 73 1,143 35 58 Rate (%) 0.77 0 0.70 0 0 Nodules Yes 152 18 196 8 6 8.621 0.071 No 903 55 960 33 52 Rate (%) 14.41 24.66 16.96 19.51 10.34 Note. 1IS, iodine salt. 2IF, iodine rich food. 3ISF, iodine salt + iodine rich food. 4ISP, iodine salt + Iodine preparations. 5ISFP, iodine salt + iodine rich food + iodine preparations. 6Chi-square test and Fisher’s exact test.
下载: 导出CSV
-
[1] Bassett JHD, Williams GR. Role of thyroid hormones in skeletal development and bone maintenance. Endocr Rev, 2016; 37, 135−87. doi: 10.1210/er.2015-1106 [2] Wu M. Study on appropriate threshold value of urinary iodine during pregnancy. Chinese Center for Disease Control and Prevention. 2017. (In Chinese) [3] Chen BN. A study on the urinary iodine and thyroid function during pregnancy. Fujian Medical University. 2016. (In Chinese) [4] Zbigniew S. Iodine prophylaxis in the lights of the last recommendation of WHO on reduction of daily salt intake. Recent Pat Endocr Metab Immune Drug Discov, 2017; 11, 39−42. [5] Shen HM, Liu SJ, Sun DJ, et al. Geographical distribution of drinking-water with high iodine level and association between high iodine level in drinking-water and goitre: a Chinese national investigation. Br J Nutr, 2011; 106, 243−7. doi: 10.1017/S0007114511000055 [6] Ad Hoc Writing Committee for Guidelines on Diagnosis and Management of Thyroid Diseases During Pregnancy and Postpartum, Chinese Society of Endocrinology, Chinese Medical Association, et al. Guideline on diagnosis and management of thyroid diseases during pregnancy and postpartum (2nd edition). Chin J Endocrinol Metab, 2019; 35, 636−65. (In Chinese [7] Li M, Wang R, Cheng XQ, et al. Thyroid function for Chinese pregnant women in 2010-2012. J Hyg Res, 2018; 47, 728−32. (In Chinese [8] Gao CH, Qu JQ, Zhou XY, et al. Iodine-rich herbs and potassium iodate have different effects on the oxidative stress and differentiation of TH17 cells in iodine-deficient NOD. H-2h4 Mice. Biol Trace Elem Res, 2018; 183, 114−22. doi: 10.1007/s12011-017-1115-y [9] Bai JJ, Liu XY, Wu Y. Analysis on the status of iodine nutrition and urinary iodine concentration in 594 pregnant women. Mater Child Health Care China, 2016; 31, 4373−5. (In Chinese [10] Laurberg P, Bülow Pedersen I, Knudsen N, et al. Environmental iodine intake affects the type of nonmalignant thyroid disease. Thyroid, 2001; 11, 457−69. doi: 10.1089/105072501300176417 -
 22090Supplementary Materials.pdf

-

 点击查看大图
计量
- 文章访问数: 2037
- HTML全文浏览量: 1243
- PDF下载量: 259
- 被引次数: 0

 Quick Links