

 下载:
下载:


-
Cardiovascular disease (CVD) is the leading cause of death worldwide[1]. Arterial sclerosis (AS) and hypertension are the main risk factors and pathological bases of CVD. Higher pulse wave velocity (PWV) measurements could reflect early progression of atherosclerosis. Based on the structure-function properties of the vascular wall and hemodynamics, strong evidence suggests that any increase in blood pressure levels can mechanically impair the ability of the endothelium to maintain vascular homeostasis[2]. High levels of blood pressure parameters, such as systolic blood pressure (SBP), diastolic blood pressure (DBP), pulse pressure (PP), and mean arterial pressure (MAP) have been identified as essential risk biomarkers for atherosclerosis.
There is powerful evidence of heterogeneity between male and female patients in terms of the potential mechanisms, symptoms, and prognosis of CVD[3]. Due to differences in hormones, body composition, and lifestyle, males and females often exhibit distinct levels of blood pressure and stiffness[4]. Estrogen protects blood vessels and reduces arterial stiffness in premenopausal females; however, after menopause women experience faster increases in arterial stiffness, narrowing the gap between males and females. Based on these factors, we hypothesized that the effect of blood pressure on AS might differ in male and female populations.
To date, most studies have targeted the effect of AS on hypertension, with few exploring any sex difference in the association between blood pressure and AS. To fill this knowledge gap and to provide epidemiological evidence for both precise prevention measures and specific interventions for atherosclerosis and related CVD, we therefore conducted a cross-sectional study to explore the role of sex in the association between blood pressure and AS risk.
The Rural Chinese Cohort Study (RCCS) is an ongoing, community-based prospective cohort study[5]. During the 2019 follow-up survey, we tested 2092 study participants for brachial-ankle pulse wave velocity (baPWV) using the convenience sampling method. Participants with missing blood pressure data and extreme baPWV values were excluded. Finally, 1991 participants were included in the present analysis. The protocol was approved by the Medical Ethics Committee of Shenzhen University. Written informed consent was obtained from all participants.
Blood pressure was measured on the right arm using an electronic sphygmomanometer (HEM-770AFuzzy, Omron) three times at 30-second intervals, with the average value used for analysis. PP is the difference between SBP and DBP, while MAP obtained by the Omron diagnostic device represents the average pressure through one cardiac cycle.
Ankle-brachial index (ABI) and baPWV were measured with an arteriosclerosis diagnostic device (BP-203 RPE III, Omron) in a comfortable and quiet environment. The measurements of baPWV on both left and right sides were taken, and the higher baPWV values selected for analysis. BaPWV higher than 1800 cm/s was considered as AS.
Demographic information, lifestyle data (including physical activity, cigarette smoking, and alcohol drinking behavior), and individual and familial histories of chronic disease were obtained through a questionnaire-based interview. Anthropometric parameters such as height and weight were measured according to standardized procedures. Body mass index (BMI) was calculated as weight (kg) divided by the square of height (m2). Blood samples were collected in the morning after an overnight fast of 8–10 hours. Automatic biochemical analyzers were used to assess the levels of fasting plasma glucose (FPG), triglyceride (TG), total cholesterol (TC), low-density lipoprotein cholesterol (LDL-C), and high-density lipoprotein cholesterol (HDL-C).
We used generalized linear models to assess the association of blood pressure parameters (SBP, DBP, PP, and MAP) with baPWV levels, and the β and 95% standard error (SE) were reported. Two models were constructed in the present study, with model 1 adjusted for age, and model 2 adjusted for age, sex, education level, physical activity, tobacco, alcohol drinking, BMI, FPG, TC, TG, and history of hypertension medication. Restricted cubic splines with four knots at the 5th, 25th, 75th and 95th percentiles were used to model the different patterns in associations between blood pressure and AS risk by sex. Generalized linear models were applied to visualize the interaction between sex and blood pressure parameters (SBP, DBP, PP, and MAP) in relation to AS risk after adjusting for potential confounders. A plot of coefficient estimates of sex with 95% CIs was produced by Interplot function in a two-way interaction conditioned by blood pressure levels. Statistical plots were produced using R 4.2.2 (R Foundation), while other statistical analyses were conducted using SAS v.9.4 (SAS Institute, Cary, NC). A two-sided P value of less than 0.05 was considered statistically significant.
The characteristics of the study participants are summarized in Supplementary Table S1 (available in www.besjournal.com). The prevalence of AS was 19.99% in this population. According to AS status, there was no statistical difference in the sex distribution between the two groups (P = 0.551), with 584 (36.66%) males among AS individuals and 147 (35.08%) males among non-AS individuals. All physical and clinical indicators, except for lipid-related indices, showed significant differences between AS and non-AS participants (P < 0.05).
Table S1. Baseline characteristics of eligible study participants
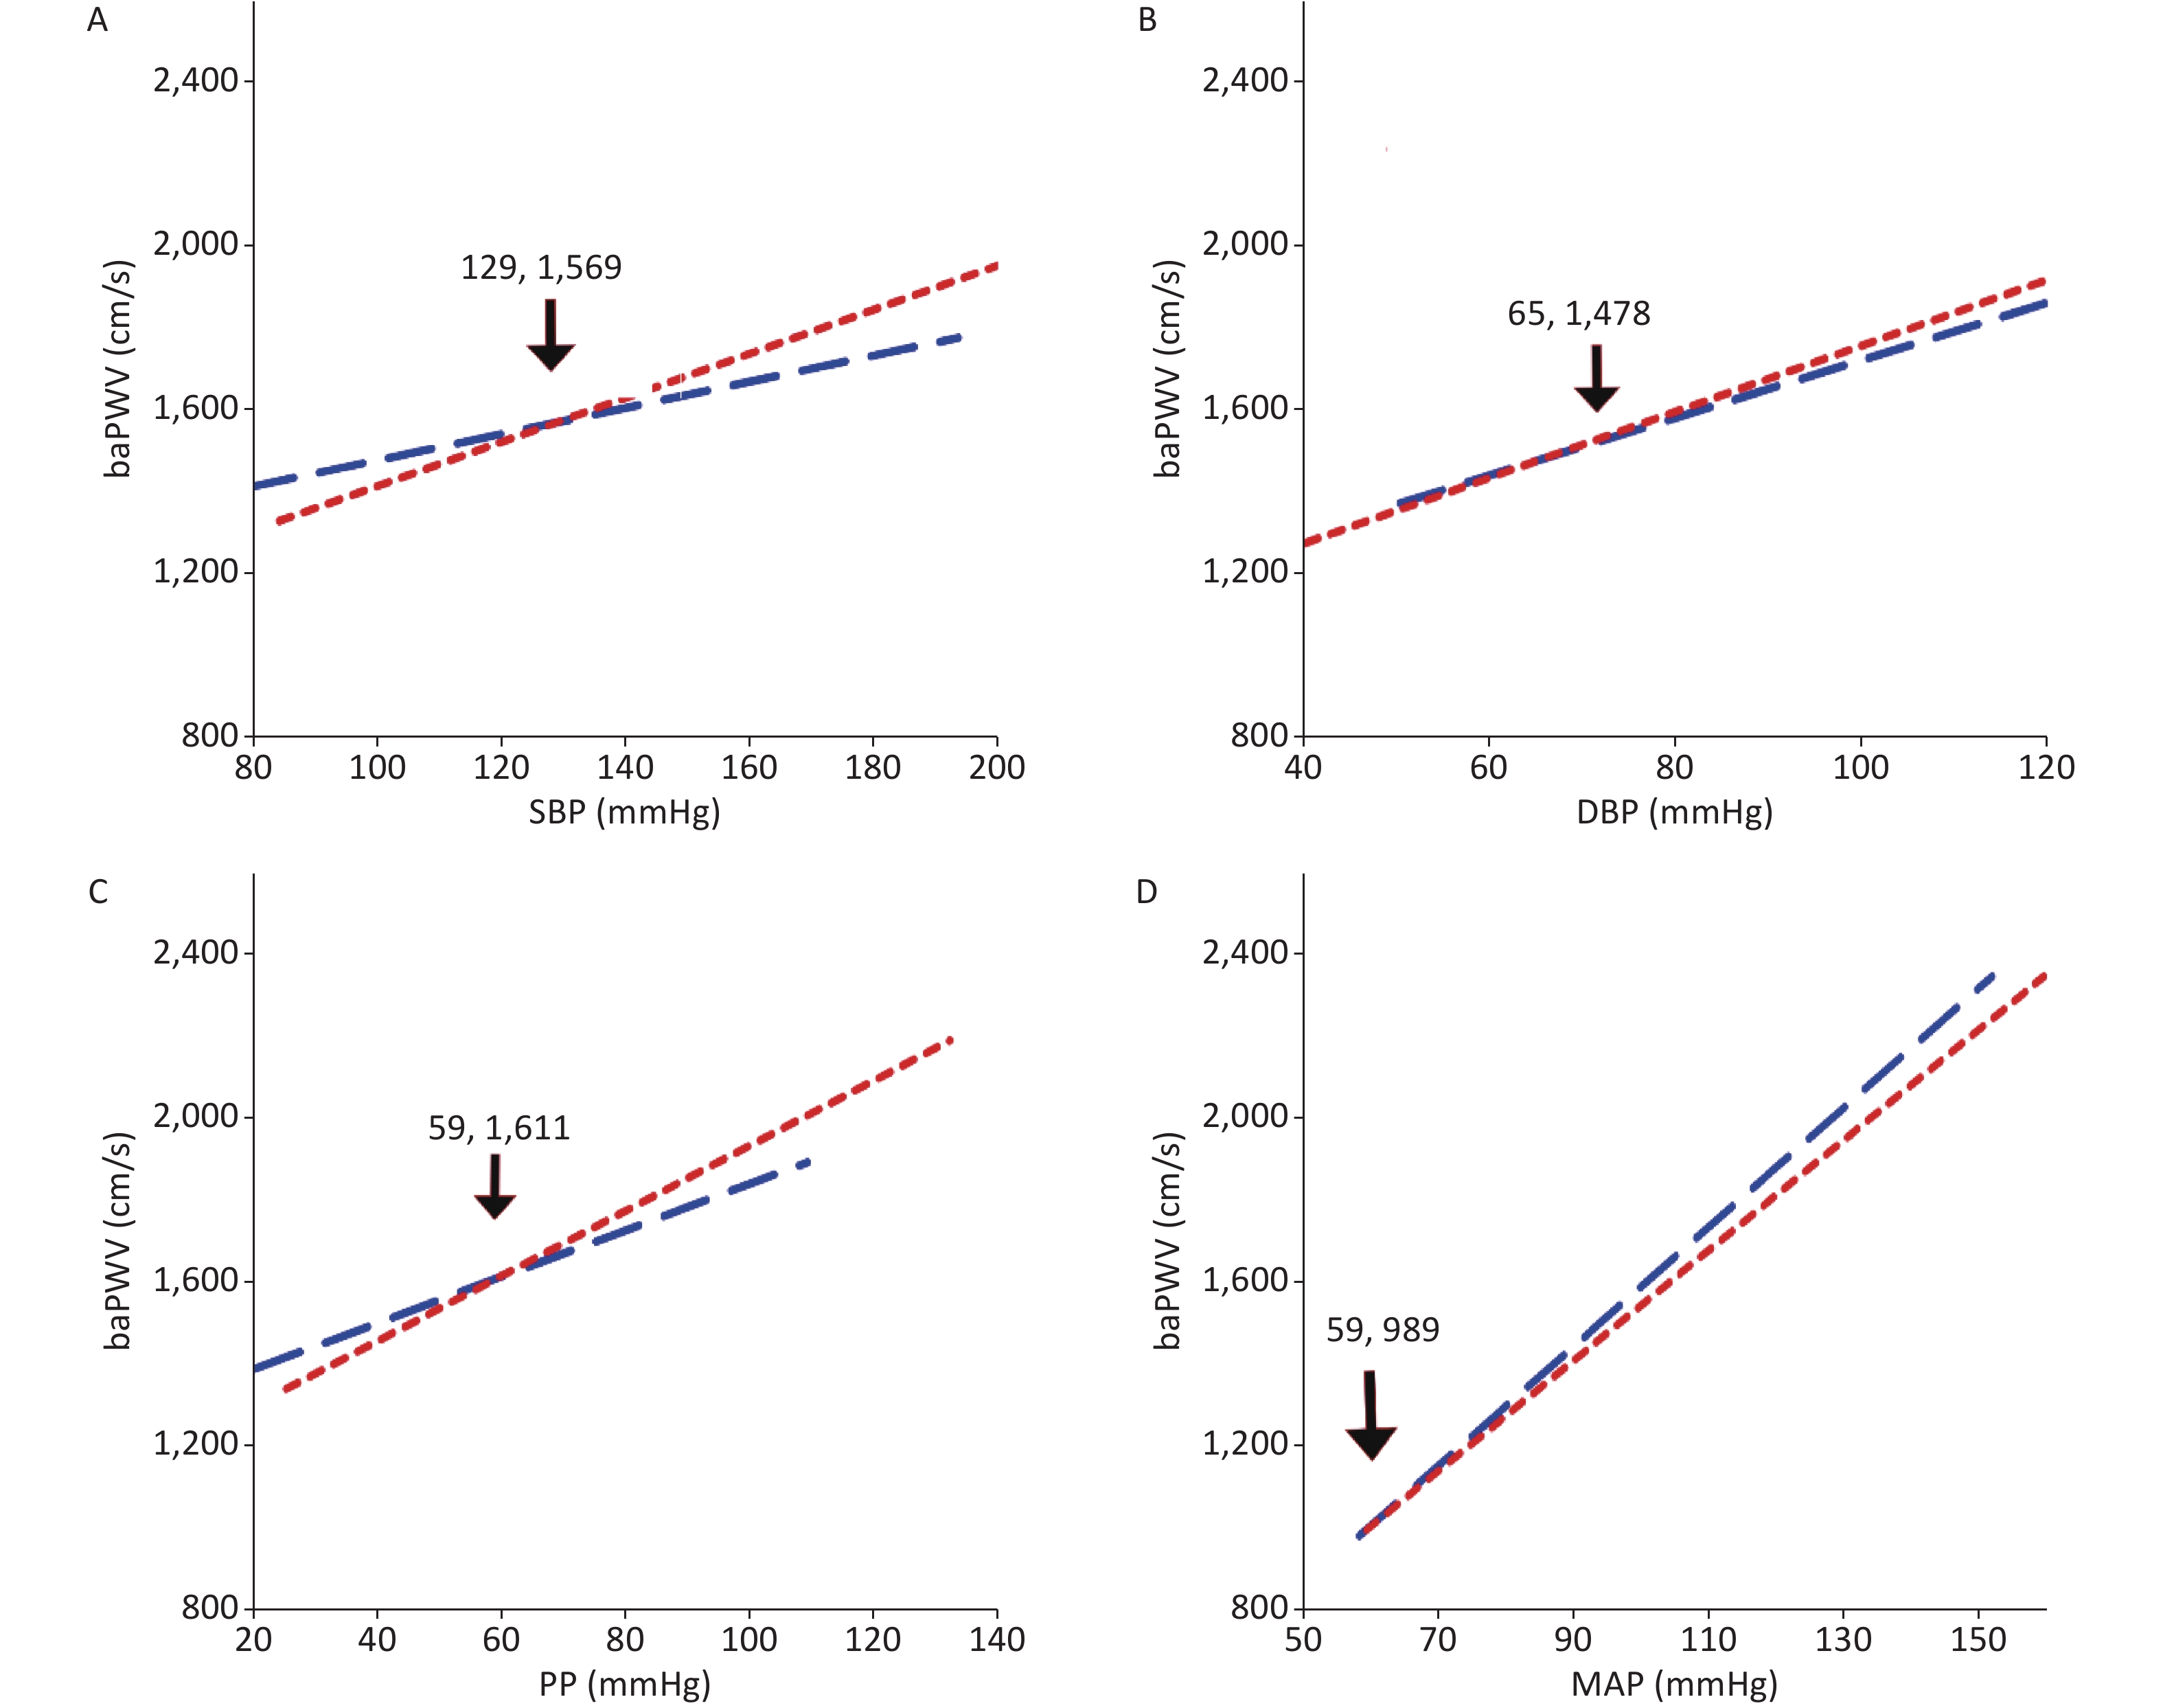
Characteristics Non-AS (N = 1,593) AS (N = 398) Statistics P value Male, n (%) 584 (36.66) 139 (34.92) 0.415 0.520 High school or above, n (%) 165 (10.47) 28 (7.22) 3.716 0.054 Smoking, n (%) 7.143 0.028 Never 1,139 (72.32) 286 (73.71) Ever 160 (10.16) 52 (13.40) Currently 276 (17.52) 50 (12.89) Alcohol drinking, n (%) 195 (12.42) 24 (6.19) 12.168 0.001 Physical activity (MET min/week) 8361.75 (4,863–1,3440) 5047.5 (2624.12–7862.17) 127.941 < 0.001 Hypertension (%) 654 (41.05) 322 (80.90) 202.251 < 0.001 Age (years) 58.06 (51.31–66.35) 69.78 (64.4–75.01) 312.297 < 0.001 FPG (mmol/L) 5.39 (5.09–5.98) 5.61 (5.15–6.39) 16.268 < 0.001 BMI (kg/m2) 25.36 (22.80–27.89) 24.81 (22.60–27.18) 7.529 0.006 SBP (mmHg) 121.33 (111.33–133.00) 141.00 (128.67–151.33) 291.235 < 0.001 DBP (mmHg) 73.33 (67.00–80.67) 78.33 (70.33–85.00) 53.100 < 0.001 PP (mmHg) 46.33 (40.67–54.67) 60.33 (52.00–71.33) 306.255 < 0.001 MAP (mmHg) 94.98 (87.55–104.18) 111.09 (103.80–120.05) 381.282 < 0.001 TC (mmol/L) 4.37 (3.81–4.96) 4.35 (3.77–5.07) 0.144 0.704 TG (mmol/L) 1.46 (1.07–2.13) 1.52 (1.11–2.28) 3.762 0.052 HDL-C (mmol/L) 1.32 (1.11–1.56) 1.32 (1.12–1.53) 0.001 0.970 LDL-C (mmol/L) 2.42 (1.99–2.85) 2.40 (1.95–2.99) 0.081 0.777 baPWV (cm/s) 1,436 (1,286–1,586) 1979.5 (1,887–2,111) 954.843 < 0.001 ABI 1.10 (1.05–1.14) 1.12 (1.07–1.17) 27.346 < 0.001 Note. AS, Arterial sclerosis; SBP, systolic blood pressure; DBP, diastolic blood pressure; PP, pulse pressure; MAP, mean arterial pressure; FPG, fasting plasma glucose; TC, total cholesterol; TG, triglycerides; HDL-C, high-density lipoprotein cholesterol; LDL-C, low-density lipoprotein cholesterol; baPWV, brachial-ankle pulse wave velocity; ABI, ankle-brachial index. The linear analysis results of our study suggested a significant interaction between sex and blood pressure in the development of AS. The linear fitting plots showed that baPWV increased with augmentation of blood pressure parameters both in male and female participants (Supplementary Figure S1, available in www.besjournal.com). The lines of SBP, DBP, PP and MAP for males and females intersected at points (129, 1,569), (65, 1,478), (59, 1,611), and (59, 989), respectively. The linear associations between blood pressure measurements and baPWV are shown in Table 1. After adjustment for age, the levels of SBP, DBP, PP and MAP were positively related to increments in baPWV among total participants, and among both female and male participants; however, we observed no significant interaction between blood pressure and sex (P > 0.05). In the fully adjusted model, the blood pressure parameter remained strongly positively correlated with baPWV, while the interaction between MAP and sex became marginally related (P = 0.065).
Table 1. Linear Regression analysis of the relationship between blood pressure and baPWV in both males and females
Variables Model 1 Model 2 β SE P value Pinteraction β SE P value Pinteraction SBP Total 7.057 0.269 < 0.001 6.981 0.296 < 0.001 Male 6.978 0.468 < 0.001 0.674 7.386 0.524 < 0.001 0.567 Female 6.990 0.335 < 0.001 6.706 0.363 < 0.001 DBP Total 9.593 0.487 < 0.001 9.262 0.522 < 0.001 Male 9.823 0.838 < 0.001 0.365 9.613 0.895 < 0.001 0.185 Female 9.440 0.594 < 0.001 9.055 0.643 < 0.001 PP Total 7.823 0.415 < 0.001 7.045 0.437 < 0.001 Male 8.443 0.755 < 0.001 0.901 8.240 0.826 < 0.001 0.414 Female 7.418 0.516 < 0.001 6.395 0.524 < 0.001 MAP Total 11.539 0.310 < 0.001 11.779 0.340 < 0.001 Male 12.539 0.532 < 0.001 0.088 12.929 0.581 < 0.001 0.065 Female 11.006 0.387 < 0.001 11.146 0.418 < 0.001 Note. SBP, systolic blood pressure; DBP, diastolic blood pressure; PP, pulse pressure; MAP, mean arterial pressure; SE, standard error; baPWV, brachial-ankle pulse wave velocity. Model 1, adjusted for age. Model 2, adjusted for age, sex, smoking, alcohol drinking, physical activity, education level, history of hypertension treatment, body mass index, fasting plasma glucose, total cholesterol, and triglycerides. 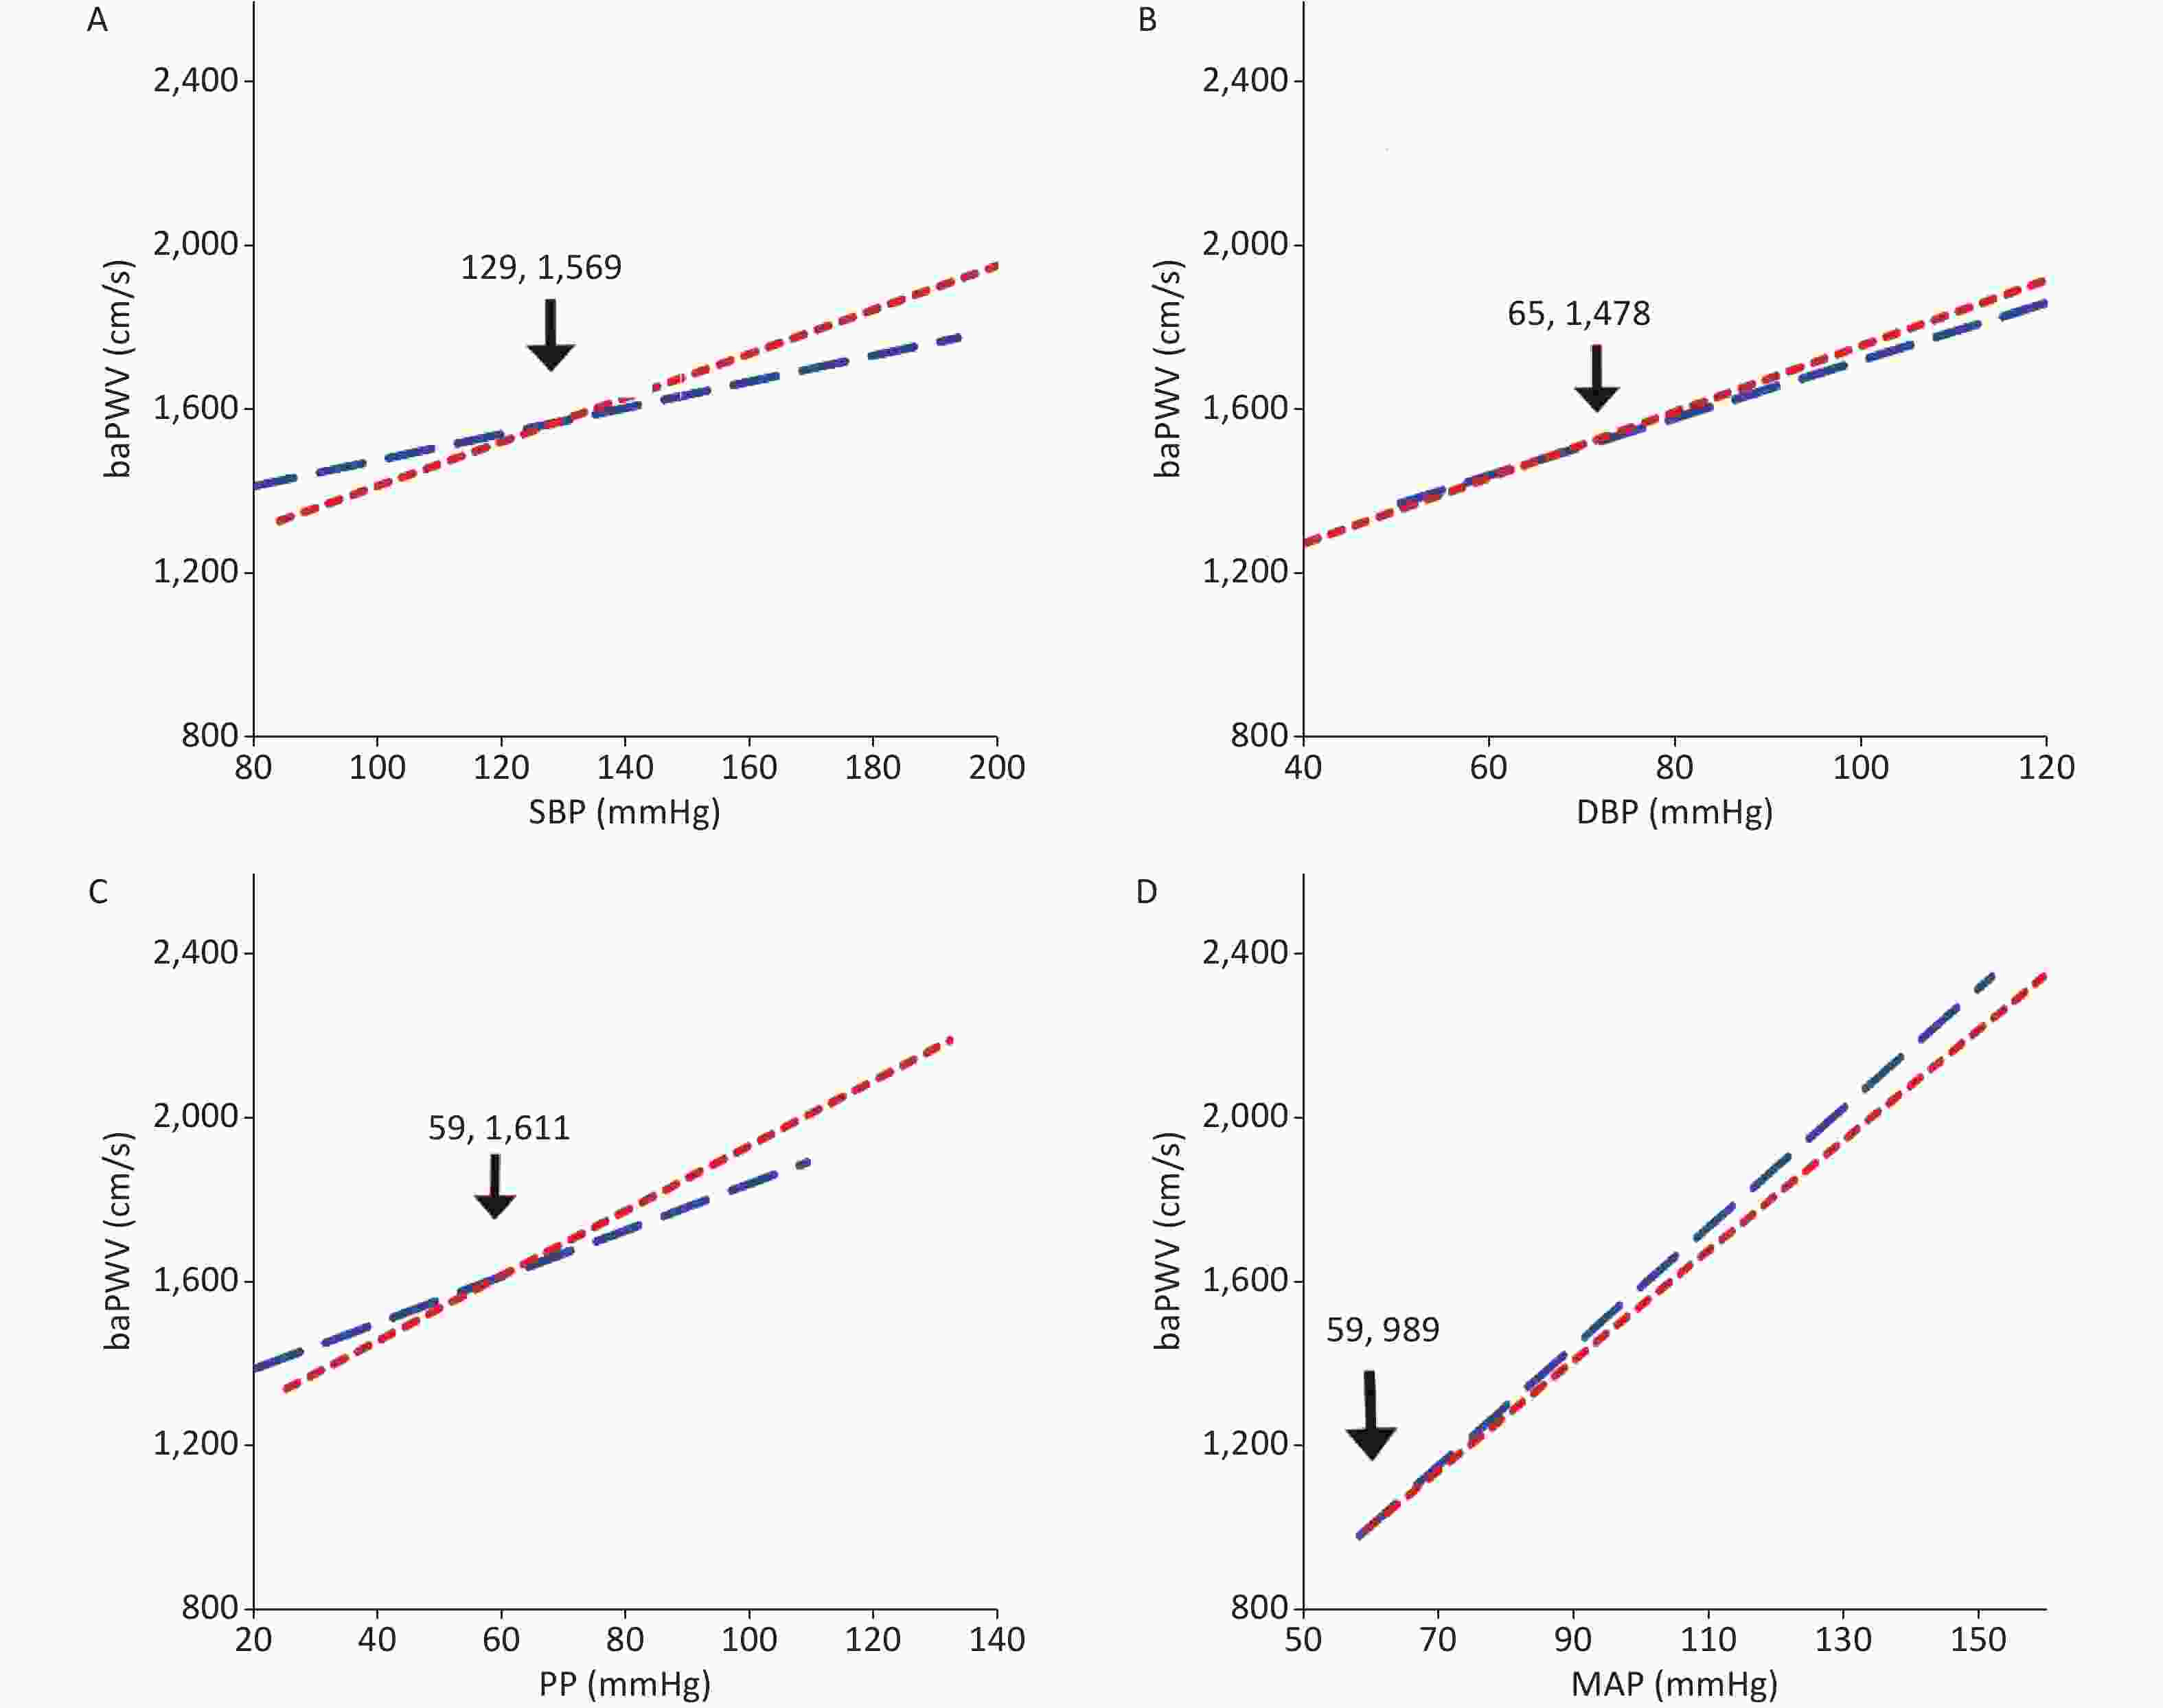
Figure S1. Linear interaction between sex and blood pressures at baPWV levels.
Current research evidence hints at a sex difference in cardiovascular disease. Females appear to be more susceptible to coronary microvascular dysfunction and pulmonary hypertension than males, with about 70% of coronary microvascular dysfunction patients and 77% of pulmonary hypertension patients being female[6,7]. Further, a prevailing perception is that the development of atherosclerosis in females is delayed compared to its development in males[8], but the sex differences in the association between blood pressure parameters and AS risk need further research.
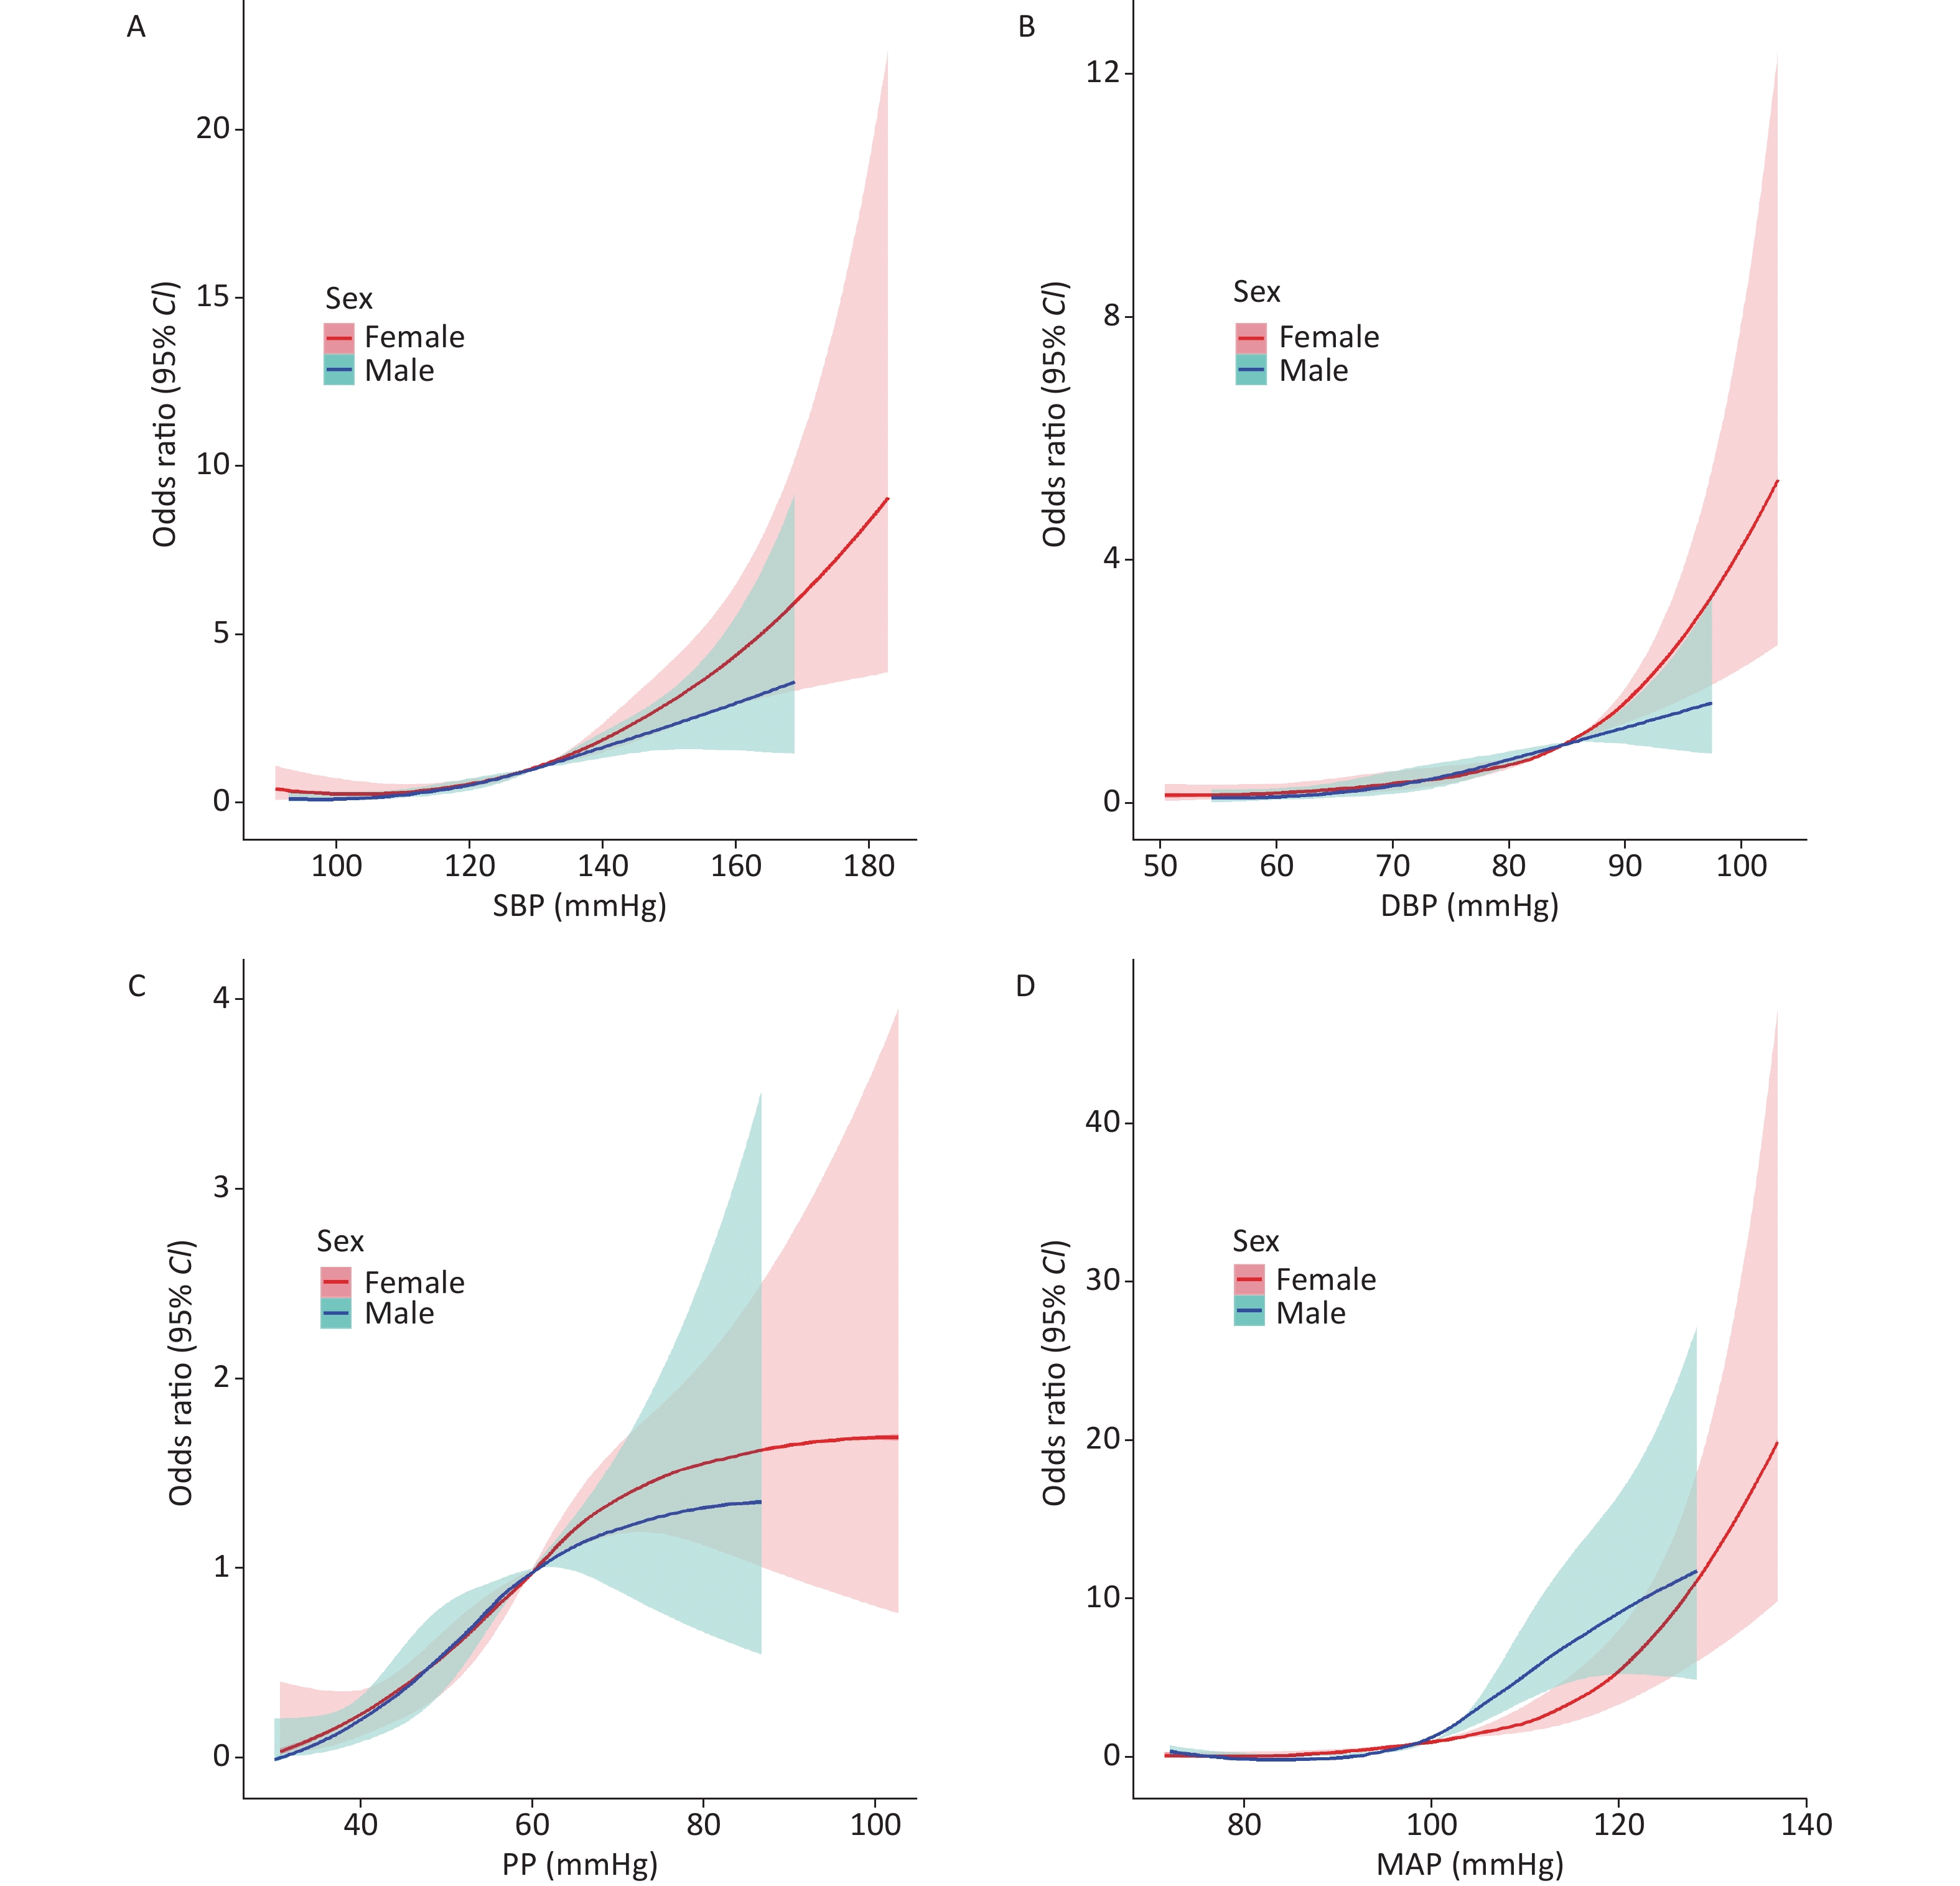
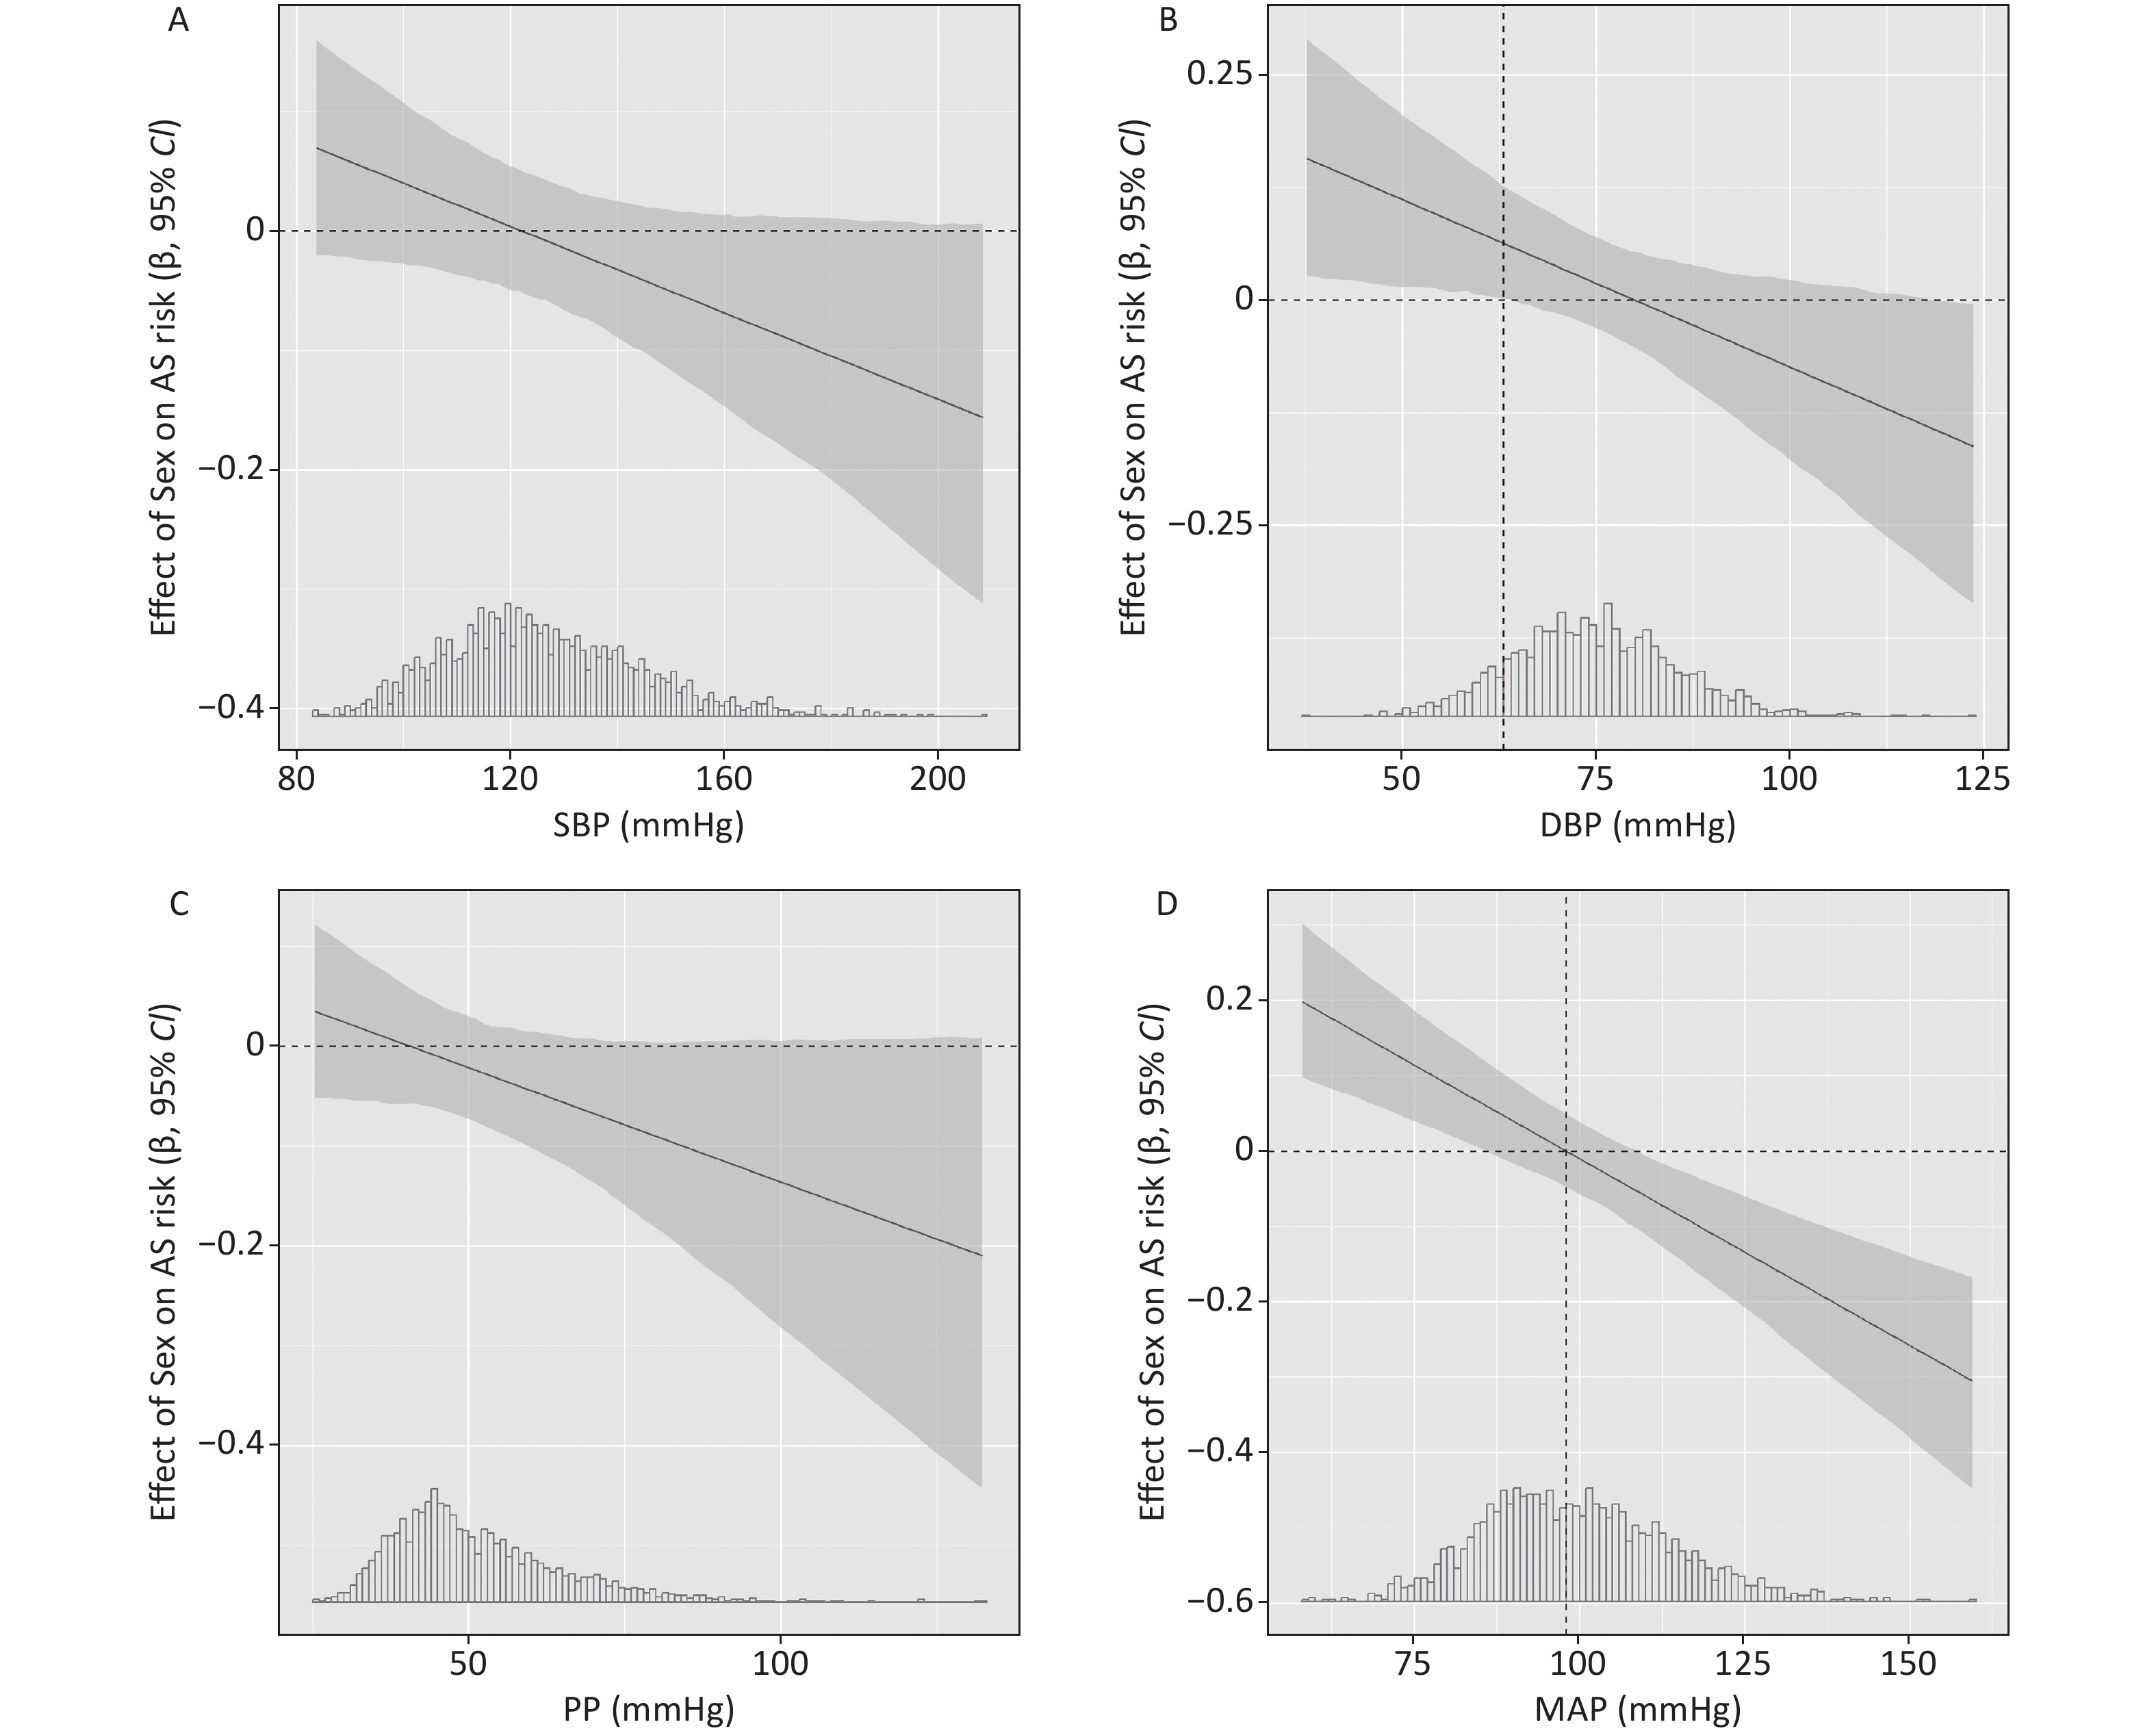
In the present study, we found a linear dose response association of SBP and DBP with AS risk in both males and females, with the association appearing stronger in females than in males at high levels of SBP and DBP (Figure 1A–B). To compare the strength of the association by sex (females versus males), we used generalized linear models and interaction plots to visualize the effect of sex on AS risk with increasing blood pressure, as shown in Figure 2A–B, but we did not find significant differences between males and females when SBP ≥ 130 mmHg or DBP ≥ 85 mmHg. Although the association was stronger in females than males when DBP < 63 mmHg (β > 0), the results may not be robust given the small size of this subpopulation (12.2% of the total population), so we have not discussed this result in the study.
Figure 1. The sex-stratified association between blood pressure and arterial sclerosis risk.
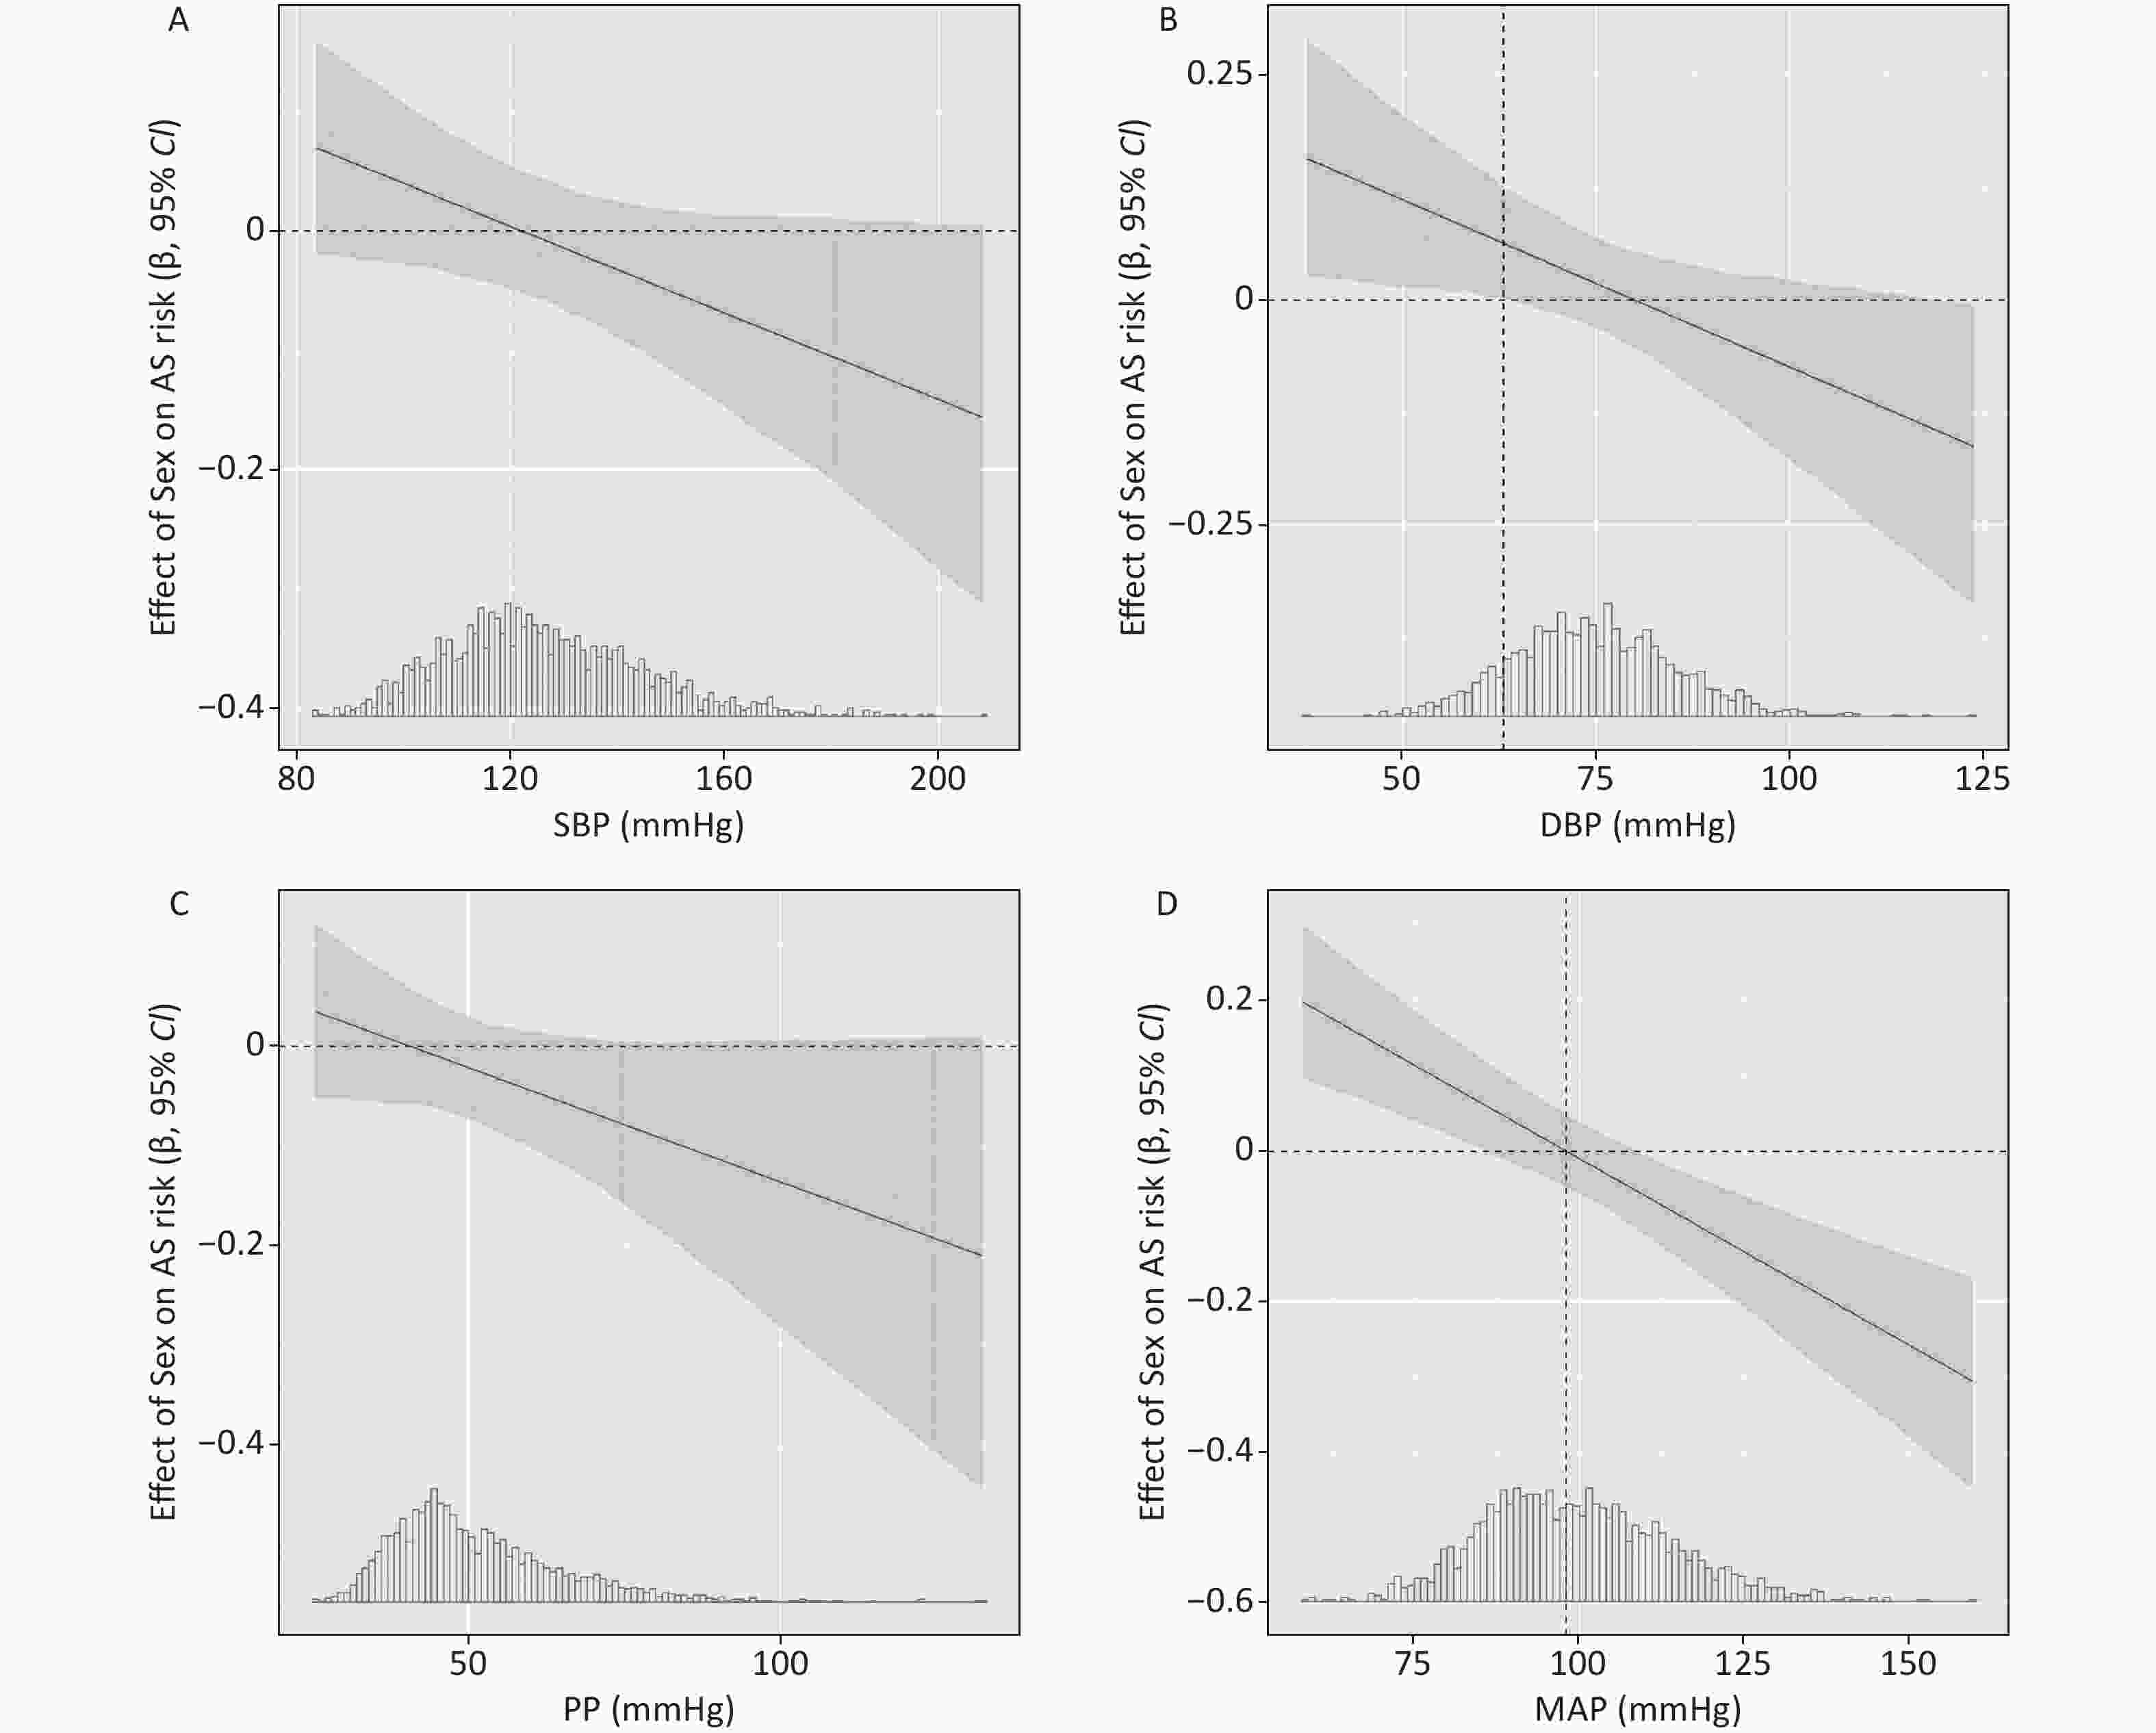
Figure 2. The interaction of general linear regression between sex and blood pressure on AS risk.
In addition, there was a nonlinear dose response association of PP with AS risk both in males and females (Figure 1C), with the association appearing stronger in females than in males at high levels of PP; however, we did not observe a significant interaction between sex and PP levels on AS risk based on the interaction plot in Figure 2C. As for the association of MAP with AS risk, we found a nonlinear dose response association in males (Pnonlinearity < 0.001, Figure 1D) and a linear dose response association in females (Pnonlinearity = 0.446). As shown in the interaction plot, a significant interaction between sex and MAP was observed (Figure 2D), with a stronger association in males than in females at high levels of MAP (≥ 98 mmHg) but a weaker association in males than in females at low levels of MAP (< 98 mmHg). Previous evidence has indicated that sex hormones might mediate the sex disparities in the association between MAP and AS. One possible explanation for this divergence might be that the protective effect of estrogen on the cardiovascular systems of females is more pronounced when blood pressure is abnormal. Although the pathophysiological basis has not been fully explored, evidence from clinical studies suggests that estrogen therapy helps to reduce LDL-C and lipoprotein(a) levels and increase HDL-C levels, thereby protecting blood vessels from atherosclerotic lesions[9].
Several limitations should be noted here. First, the baPWV was used in the present study to measure the degree of arteriosclerosis rather than the carotid-femoral aortic PWV (cfPWV, a gold standard for AS), which may have introduced measurement bias and led to the nondifferential misclassification of AS assessment. Second, although this study employed non-random sampling methods, the age and gender distribution of the participants closely matched that of the cohort population; hence, it can be regarded as an unbiased subset of the cohort sample. Third, given the limited sample size and cross-sectional design of this study, the interaction between sex and blood pressure requires further validation in larger samples and prospective studies.
In conclusion, although the degree of AS increased with blood pressure in both male and female participants, MAP showed sex differences in its association with AS risk. The risk of AS was greater in males with high MAP levels (≥ 98 mmHg), but weaker in males with low MAP levels (< 98 mmHg). Understanding sex differences in AS risk could facilitate the development of sex-specific treatments and prevention measures for CVD.
doi: 10.3967/bes2024.093
Sex Disparities in the Association of Blood Pressure Parameters and Arterial Sclerosis Risk
-
&These authors contributed equally to this work.
注释: -
S1. Linear interaction between sex and blood pressures at baPWV levels.
SBP, systolic blood pressure; DBP, diastolic blood pressure; PP, pulse pressure; MAP, mean arterial pressure; baPWV, brachial-ankle pulse wave velocity. The dashed blue line represents the male and the dashed red line represents the female.
Figure 1. The sex-stratified association between blood pressure and arterial sclerosis risk.
SBP, systolic blood pressure; DBP, diastolic blood pressure; PP, pulse pressure; MAP, mean arterial pressure.
Figure 2. The interaction of general linear regression between sex and blood pressure on AS risk.
AS, arterial sclerosis; SBP, systolic blood pressure; DBP, diastolic blood pressure; PP, pulse pressure; MAP, mean arterial pressure. Adjusted for age, sex, smoking, alcohol drinking, physical activity, education level, history of hypertension treatment, body mass index, total cholesterol, and triglycerides.
S1. Baseline characteristics of eligible study participants
Characteristics Non-AS (N = 1,593) AS (N = 398) Statistics P value Male, n (%) 584 (36.66) 139 (34.92) 0.415 0.520 High school or above, n (%) 165 (10.47) 28 (7.22) 3.716 0.054 Smoking, n (%) 7.143 0.028 Never 1,139 (72.32) 286 (73.71) Ever 160 (10.16) 52 (13.40) Currently 276 (17.52) 50 (12.89) Alcohol drinking, n (%) 195 (12.42) 24 (6.19) 12.168 0.001 Physical activity (MET min/week) 8361.75 (4,863–1,3440) 5047.5 (2624.12–7862.17) 127.941 < 0.001 Hypertension (%) 654 (41.05) 322 (80.90) 202.251 < 0.001 Age (years) 58.06 (51.31–66.35) 69.78 (64.4–75.01) 312.297 < 0.001 FPG (mmol/L) 5.39 (5.09–5.98) 5.61 (5.15–6.39) 16.268 < 0.001 BMI (kg/m2) 25.36 (22.80–27.89) 24.81 (22.60–27.18) 7.529 0.006 SBP (mmHg) 121.33 (111.33–133.00) 141.00 (128.67–151.33) 291.235 < 0.001 DBP (mmHg) 73.33 (67.00–80.67) 78.33 (70.33–85.00) 53.100 < 0.001 PP (mmHg) 46.33 (40.67–54.67) 60.33 (52.00–71.33) 306.255 < 0.001 MAP (mmHg) 94.98 (87.55–104.18) 111.09 (103.80–120.05) 381.282 < 0.001 TC (mmol/L) 4.37 (3.81–4.96) 4.35 (3.77–5.07) 0.144 0.704 TG (mmol/L) 1.46 (1.07–2.13) 1.52 (1.11–2.28) 3.762 0.052 HDL-C (mmol/L) 1.32 (1.11–1.56) 1.32 (1.12–1.53) 0.001 0.970 LDL-C (mmol/L) 2.42 (1.99–2.85) 2.40 (1.95–2.99) 0.081 0.777 baPWV (cm/s) 1,436 (1,286–1,586) 1979.5 (1,887–2,111) 954.843 < 0.001 ABI 1.10 (1.05–1.14) 1.12 (1.07–1.17) 27.346 < 0.001 Note. AS, Arterial sclerosis; SBP, systolic blood pressure; DBP, diastolic blood pressure; PP, pulse pressure; MAP, mean arterial pressure; FPG, fasting plasma glucose; TC, total cholesterol; TG, triglycerides; HDL-C, high-density lipoprotein cholesterol; LDL-C, low-density lipoprotein cholesterol; baPWV, brachial-ankle pulse wave velocity; ABI, ankle-brachial index.  下载: 导出CSV
Table 1. Linear Regression analysis of the relationship between blood pressure and baPWV in both males and females
Variables Model 1 Model 2 β SE P value Pinteraction β SE P value Pinteraction SBP Total 7.057 0.269 < 0.001 6.981 0.296 < 0.001 Male 6.978 0.468 < 0.001 0.674 7.386 0.524 < 0.001 0.567 Female 6.990 0.335 < 0.001 6.706 0.363 < 0.001 DBP Total 9.593 0.487 < 0.001 9.262 0.522 < 0.001 Male 9.823 0.838 < 0.001 0.365 9.613 0.895 < 0.001 0.185 Female 9.440 0.594 < 0.001 9.055 0.643 < 0.001 PP Total 7.823 0.415 < 0.001 7.045 0.437 < 0.001 Male 8.443 0.755 < 0.001 0.901 8.240 0.826 < 0.001 0.414 Female 7.418 0.516 < 0.001 6.395 0.524 < 0.001 MAP Total 11.539 0.310 < 0.001 11.779 0.340 < 0.001 Male 12.539 0.532 < 0.001 0.088 12.929 0.581 < 0.001 0.065 Female 11.006 0.387 < 0.001 11.146 0.418 < 0.001 Note. SBP, systolic blood pressure; DBP, diastolic blood pressure; PP, pulse pressure; MAP, mean arterial pressure; SE, standard error; baPWV, brachial-ankle pulse wave velocity. Model 1, adjusted for age. Model 2, adjusted for age, sex, smoking, alcohol drinking, physical activity, education level, history of hypertension treatment, body mass index, fasting plasma glucose, total cholesterol, and triglycerides.
下载: 导出CSV
-
[1] GBD 2017 Causes of Death Collaborators. Global, regional, and national age-sex-specific mortality for 282 causes of death in 195 countries and territories, 1980-2017: a systematic analysis for the Global Burden of Disease Study 2017. Lancet, 2018; 392, 1736−88. doi: 10.1016/S0140-6736(18)32203-7 [2] Poredos P, Jezovnik MK. Endothelial dysfunction and venous thrombosis. Angiology, 2018; 69, 564−7. doi: 10.1177/0003319717732238 [3] Connelly PJ, Azizi Z, Alipour P, et al. The importance of gender to understand sex differences in cardiovascular disease. Can J Cardiol, 2021; 37, 699−710. doi: 10.1016/j.cjca.2021.02.005 [4] Peruta CD, Lozanoska-Ochser B, Renzini A, et al. Sex differences in inflammation and muscle wasting in aging and disease. Int J Mol Sci, 2023; 24, 4651. doi: 10.3390/ijms24054651 [5] Zhang M, Zhao Y, Sun L, et al. Cohort profile: the rural Chinese cohort study. Int J Epidemiol, 2021; 50, 723−4l. doi: 10.1093/ije/dyaa204 [6] Dean J, Cruz SD, Mehta PK, et al. Coronary microvascular dysfunction: sex-specific risk, diagnosis, and therapy. Nat Rev Cardiol, 2015; 12, 406−14. doi: 10.1038/nrcardio.2015.72 [7] Thenappan T, Shah SJ, Gomberg-Maitland M, et al. Clinical characteristics of pulmonary hypertension in patients with heart failure and preserved ejection fraction. Circ Heart Fail, 2011; 4, 257−65. doi: 10.1161/CIRCHEARTFAILURE.110.958801 [8] Arnold AP, Cassis LA, Eghbali M, et al. Sex hormones and sex chromosomes cause sex differences in the development of cardiovascular diseases. Arterioscler Thromb Vasc Biol, 2017; 37, 746−56. doi: 10.1161/ATVBAHA.116.307301 [9] Enkhmaa B, Berglund L. Non-genetic influences on lipoprotein(a) concentrations. Atherosclerosis, 2022; 349, 53−62. doi: 10.1016/j.atherosclerosis.2022.04.006 -
 23399+Supplementary Materials.pdf

-

 点击查看大图
计量
- 文章访问数: 1149
- HTML全文浏览量: 477
- PDF下载量: 49
- 被引次数: 0

 Quick Links