

 下载:
下载:


-
As a typical heavy metal contaminant in food, cadmium (Cd) easily enters the human food chain via crop production, and therefore, threatens human health[1]. Intestinal absorption is the principal route for Cd entry into the body, and therefore, intestinal tissue become the primary target for Cd toxicity[2]. Previous studies showed that acute Cd exposure damaged intestinal tight junctions, resulting in gut barrier destruction and alterations in gut microbiota[3]. Thus, the effective prevention of Cd-induced intestinal damage has become a major research challenge.
The gut microbiota is considered an important target of Cd, and therefore, affects gut microbiota diversity[4]. A previous study reported that Cd exposure significantly altered the mouse gut microbiome and significantly decreased microbial diversity in the gut[5]. However, it is unclear how to efficiently alleviate the adverse effects of Cd.
Recent studies indicated that oyster protein hydrolysates (OPs) exhibited various biological and pharmacological functions, including maintaining the gut microbiota and intestinal barrier[6]. However, the effects of OPs on Cd-induced intestinal damage and gut microbiota dysbiosis are unknown. In view of the potential protective effects of bioactive oyster proteins against Cd, we investigated the alleviating effect of OPs on intestinal damage and gut microbiota in Cd-exposed mice.
We obtained 168 specific pathogen-free (SPF) mice (Kunming strain, 25–35 g) from Changsha Tianqin Biotechnology (Changsha, China), and maintained animals at the Guangdong Ocean University Animal Center under a controlled light (12 h light and dark) and temperature (25 °C) environment. Mice were supplied standard commercial mouse food and water. Animal studies were approved by the Guangdong Ocean University Animal Welfare Committee (Approval No. GDOU-LAE-2020-009). A completely randomized treatment study design was used.
For toxicity tests, 36 mice of similar weight were randomly divided into six groups (n = 6/group). The experimental design is shown in Supplementary Table S1 (available in www.besjournal.com). Grouping schemes and treatments were based on previous studies[7,8]. After 7 days of continuous treatment, mice were humanely sacrificed using ether anesthesia, and heart, liver, spleen, lung, and kidney organs removed and stored at −80 °C for further analysis. The intestines were excised, washed in saline solution, and fixed in 10% formalin for histopathological studies.
Table S1. Animal experimental protocol
Groups Samples 7 days treatments Control n = 6 Mice were given drinking water Cd n = 6 Drinking water containing 100 mg/L of CdCl2 Cd+EDTA n = 6 Drinking water containing 100 mg/L of CdCl2 and orally administered with 100 mg/kg per day of EDTA Cd+Milk n = 6 Drinking water containing 100 mg/L of CdCl2 and orally administered with 100 mg/kg per day of milk Cd+L-OPs n = 6 Drinking water containing 100 mg/L of CdCl2 and orally administered with 100 mg/kg per day of OPs Cd+H-OPs n = 6 Drinking water containing 100 mg/L of CdCl2 and orally administered with 300 mg/kg per day of OPs To evaluate the protective effects of amino acids on critical gut microbiota in-Cd exposed mice, 132 SPF mice were randomly divided into 22 groups (n = 6/group). The experimental design is shown in Supplementary Table S2 (available in www.besjournal.com).
Table S2. Animal experimental protocol
Group Samples 7 days Treatments Control n = 6 Mice were given drinking water Cd n = 6 Drinking water containing 100 mg/L of CdCl2 Cd+Ala(A) n = 6 Drinking water containing 100 mg/L of CdCl2 and orally administered with 40 mmol/kg per day of Ala Cd+Cys(C) n = 6 Drinking water containing 100 mg/L of CdCl2 and orally administered with 40 mmol/kg per day of Cys Cd+Asp(D) n = 6 Drinking water containing 100 mg/L of CdCl2 and orally administered with 40 mmol/kg per day of Asp Cd+Glu(E) n = 6 Drinking water containing 100 mg/L of CdCl2 and orally administered with 40 mmol/kg per day of Glu Cd+Phe(F) n = 6 Drinking water containing 100 mg/L of CdCl2 and orally administered with 40 mmol/kg per day of Phe Cd+Gly(G) n = 6 Drinking water containing 100 mg/L of CdCl2 and orally administered with 40 mmol/kg per day of Gly Cd+His(H) n = 6 Drinking water containing 100 mg/L of CdCl2 and orally administered with 40 mmol/kg per day of His Cd+Ile(I) n = 6 Drinking water containing 100 mg/L of CdCl2 and orally administered with 40 mmol/kg per day of Ile Cd+Lys(K) n = 6 Drinking water containing 100 mg/L of CdCl2 and orally administered with 40 mmol/kg per day of Lys Cd+Leu(L) n = 6 Drinking water containing 100 mg/L of CdCl2 and orally administered with 40 mmol/kg per day of Leu Cd+Met(M) n = 6 Drinking water containing 100 mg/L of CdCl2 and orally administered with 40 mmol/kg per day of Met Cd+Asn(N) n = 6 Drinking water containing 100 mg/L of CdCl2 and orally administered with 40 mmol/kg per day of Asn Cd+Pro(P) n = 6 Drinking water containing 100 mg/L of CdCl2 and orally administered with 40 mmol/kg per day of Pro Cd+Gln(Q) n = 6 Drinking water containing 100 mg/L of CdCl2 and orally administered with 40 mmol/kg per day of Gln Cd+Arg(R) n = 6 Drinking water containing 100 mg/L of CdCl2 and orally administered with 40 mmol/kg per day of Arg Cd+Ser(S) n = 6 Drinking water containing 100 mg/L of CdCl2 and orally administered with 40 mmol/kg per day of Ser Cd+Thr(T) n = 6 Drinking water containing 100 mg/L of CdCl2 and orally administered with 40 mmol/kg per day of Thr Cd+Val(V) n = 6 Drinking water containing 100 mg/L of CdCl2 and orally administered with 40 mmol/kg per day of Val Cd+Trp(W) n = 6 Drinking water containing 100 mg/L of CdCl2 and orally administered with 40 mmol/kg per day of Trp Cd+Tyr(Y) n = 6 Drinking water containing 100 mg/L of CdCl2 and orally administered with 40 mmol/kg per day of Tyr OPs were prepared as previously described[8]. The oyster (Crassostrea hongkongensis) of Hong Kong, China was homogenized in distilled water (1:3 w/w) and ground three times at 4,000 ×g for 5 min. The homogenate was centrifuged (4 ℃) at 12,000 ×g for 20 min. Homogenized oyster was hydrolyzed with a neutral protease (Pangbo Biotech, Nanning, China, 2 × 10⁵ U/g) at a protease/substrate ratio of 2.0% (w/v) (pH 7.0). After a 4 h incubation with the neutral protease at 50 ℃, the protease was inactivated at 100 ℃ for 15 min, and the enzymatic hydrolysate centrifuged at 15,000 ×g at 4 ℃ for 20 min to generate a supernatant. Samples were freeze-dried (FD-551, EYELA, Tokyo, Japan) for subsequent studies.
To assess the alleviating effects of OPs on Cd-induced intestinal damage, serum tumor necrosis factor alpha (TNF-α) and lipopolysaccharide (LPS) were tested as indicators of intestinal damage. The epithelial barrier absorbs nutrients and effectively prevents the invasion of pathogens and LPS[9]. Intestinal damage was observed by microscopy after samples were stained in hematoxylin and eosin (H&E). Gut barrier related gene (ZO-1, occludin, and plakophilin-1, primer sequences are shown in Supplementary Table S3, available in www.besjournal.com) levels were measured by quantitative real-time PCR (qRT-PCR). β-actin was used as an internal reference housekeeping gene. qRT-PCR was performed on a CFX Real-Time System (CFX96, Bio-Rad, Hercules, CA, USA). All samples were analyzed in triplicate, and the 2−ΔΔCt method was used to analyze gene expression levels.
Table S3. Primer sequences of target genes
Gene name Product length (bp) Primer sequence (5´–3´) ZO-1 192 Forward: CTGCACGATTTCTGCTTCCTC
Reverse: CCTCCATTGCTGTGCTAGTGAOccludin 252 Forward: CTAAATTGGCATCCAGCCCAG
Reverse: TCCTTTCCACTCGGGCTCAPlakophilin-1 274 Forward: ACTATGACTGCCCACTCCCT
Reverse: CCTGATTCCCGCACCACATCβ-actin 101 Forward: TGTCCACCTTCCAGCAGATGT
Reverse: AGCTCAGTAACAGTCCGCCTAGATo assess the alleviating effects of OPs on Cd-induced gut microbiota dysbiosis using 16S rRNA sequencing, we used 515F (5'-GTGCCAGCMGCCGCGGTAA-3') and 806R (5'-GGACTACHVGGGTWTCTAAT-3') primer sequences, and sequencing data were used to identify species. Sequence data analyses were mainly performed in QIIME and R packages (v3.2.0). Operating taxonomic unit (OTU) α-diversity indices (Chao, ACE, and Shannon) were calculated in QIIME. We also performed β-diversity analyses to investigate structural variations in microbial communities across samples using UniFrac distance metrics. PICRUSt was used to predict functional profiles in microbial communities according to Kyoto Encyclopedia of Genes and Genomes (KEGG) database functional categories. To identify key amino acids used by OPs in modulating gut microbiota, the effects of each amino acid on key gut microbiota were evaluated using 16S rRNA sequencing.
The amino acid composition and content of OPs and milk were measured by liquid chromatography with tandem mass spectrometry (LC-MS/MS) using the AB SCIEX QTRAP® 4000 System as previously described[10].
Data were expressed as the mean ± standard deviation. JMP Pro 13 was used for statistical analyses. A P < 0.05 value was considered statistically significant.
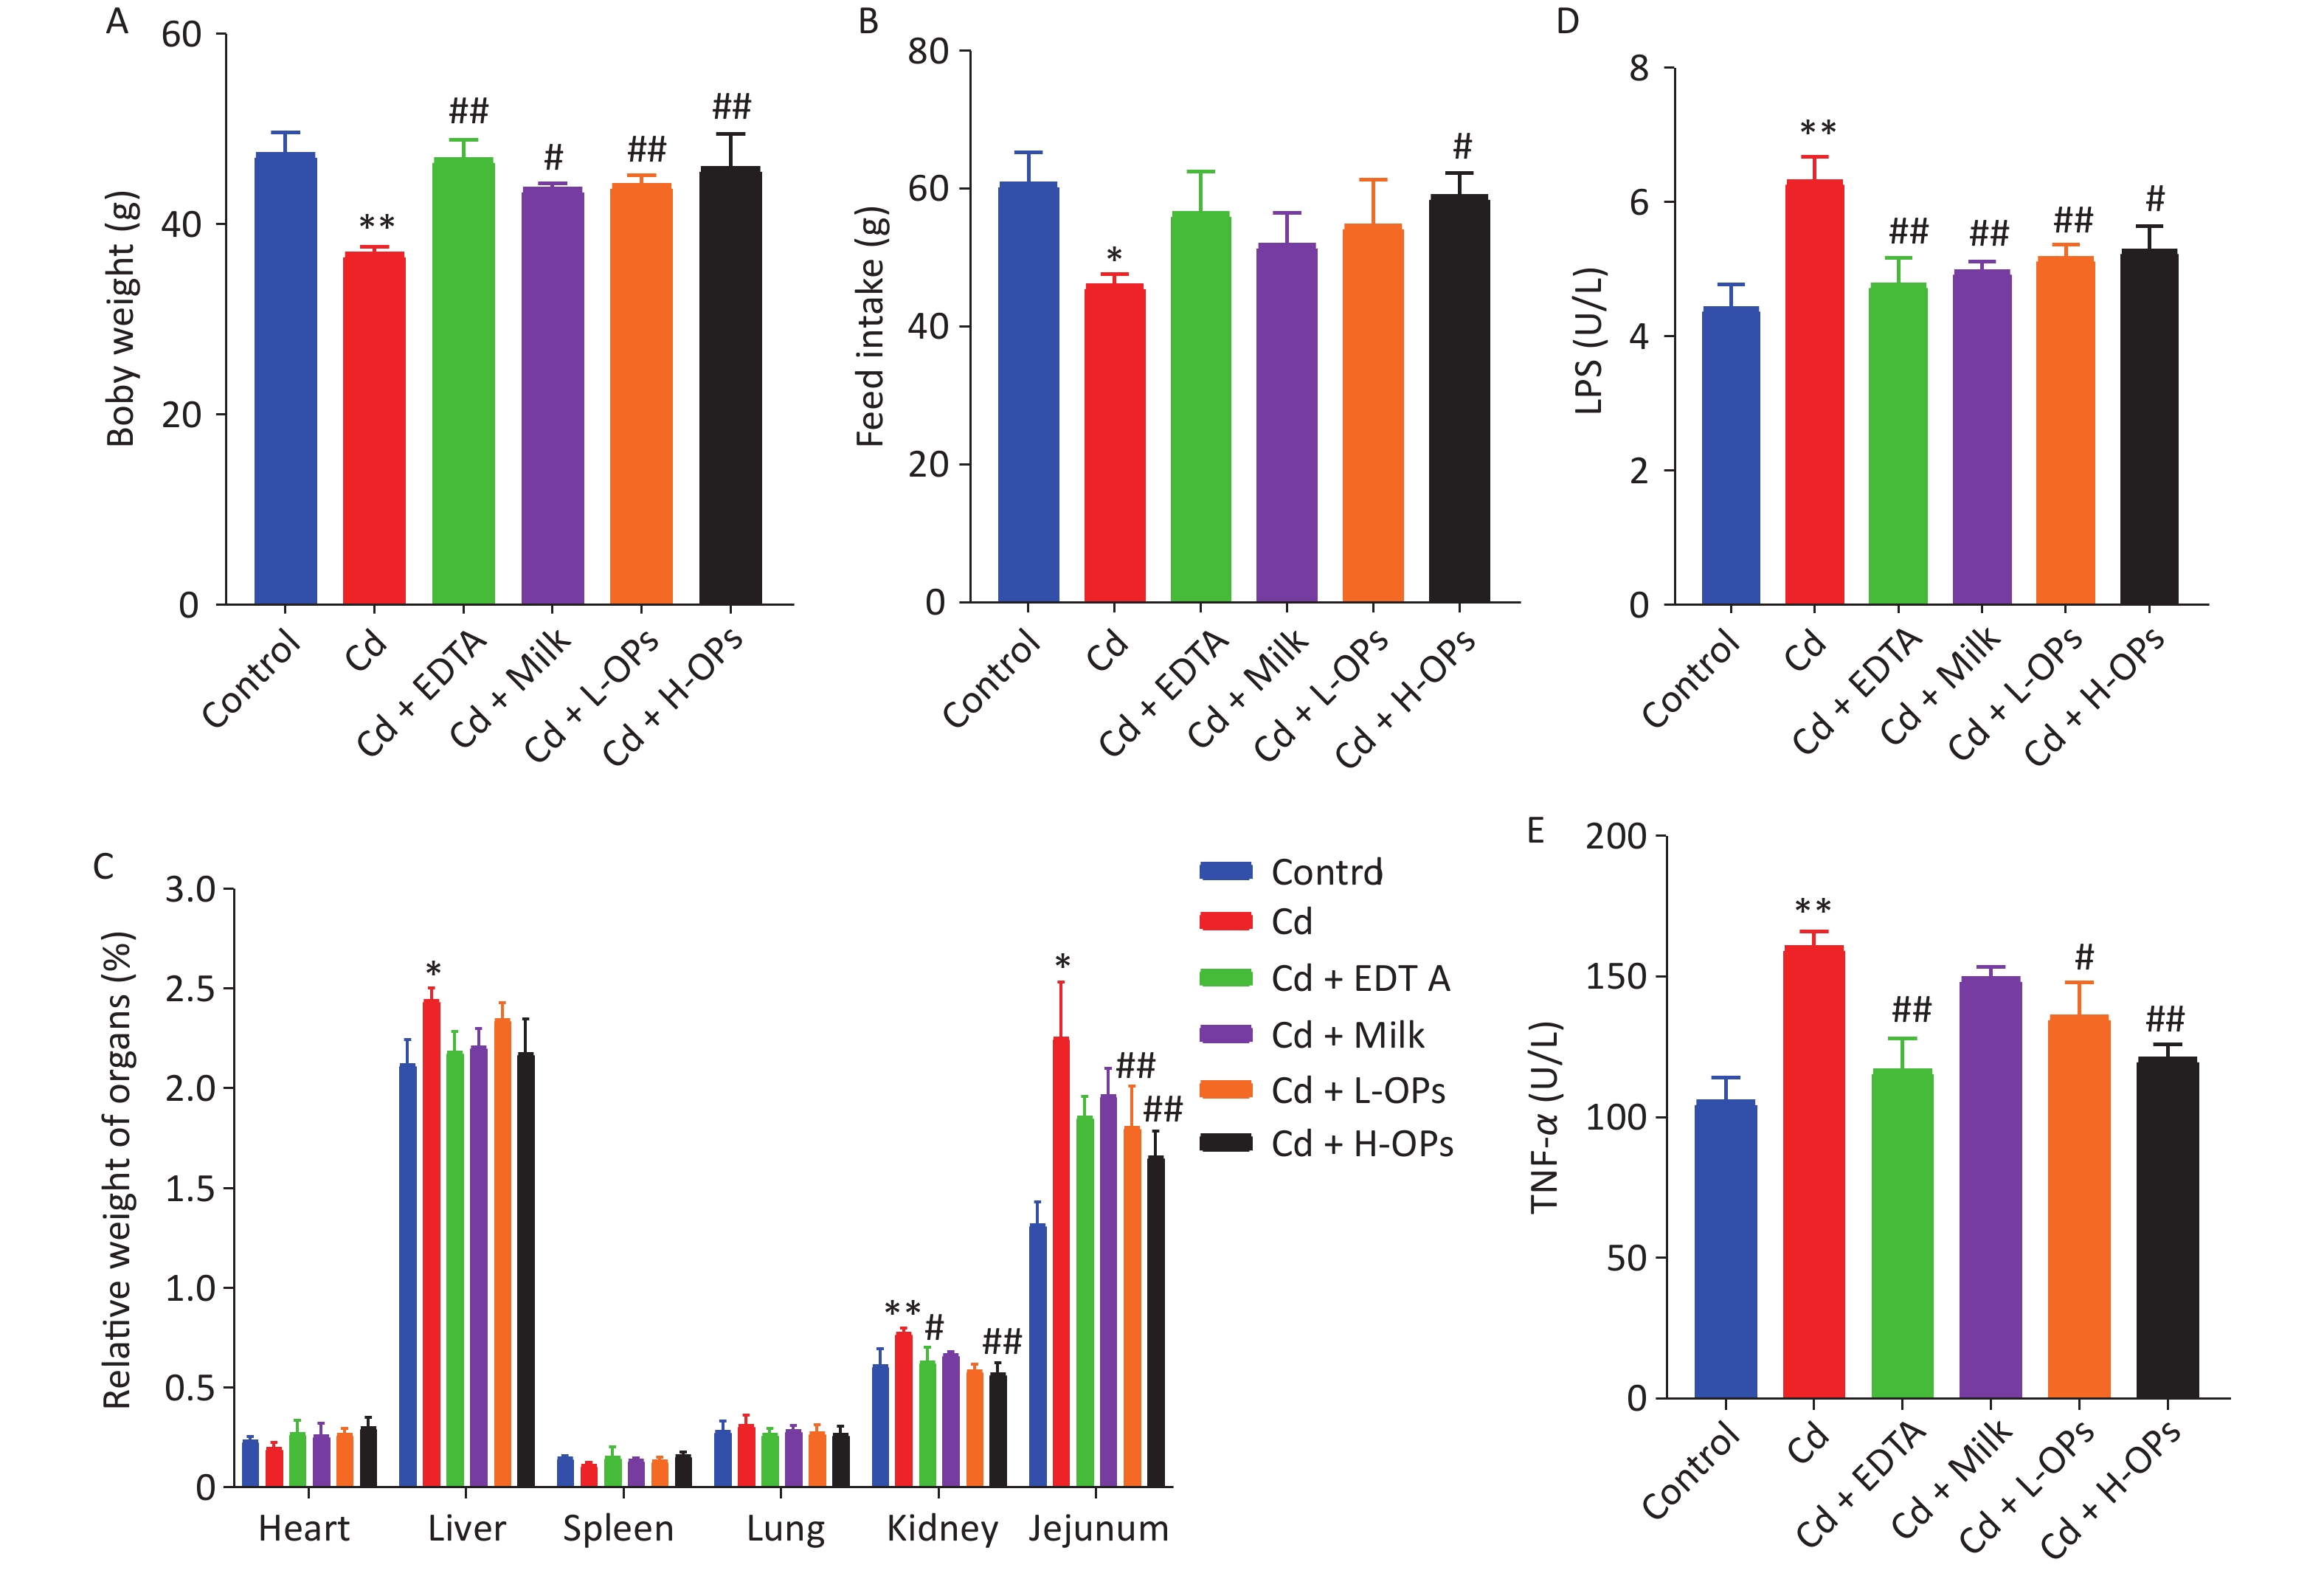
We observed that Cd-exposure exerted adverse effects on the growth performance of mice (weight gain and feed intake). Additionally, OPs significantly reduced increases in relative weight of the liver and intestine (jejunum) in Cd-exposed mice (Figure 1A–C).
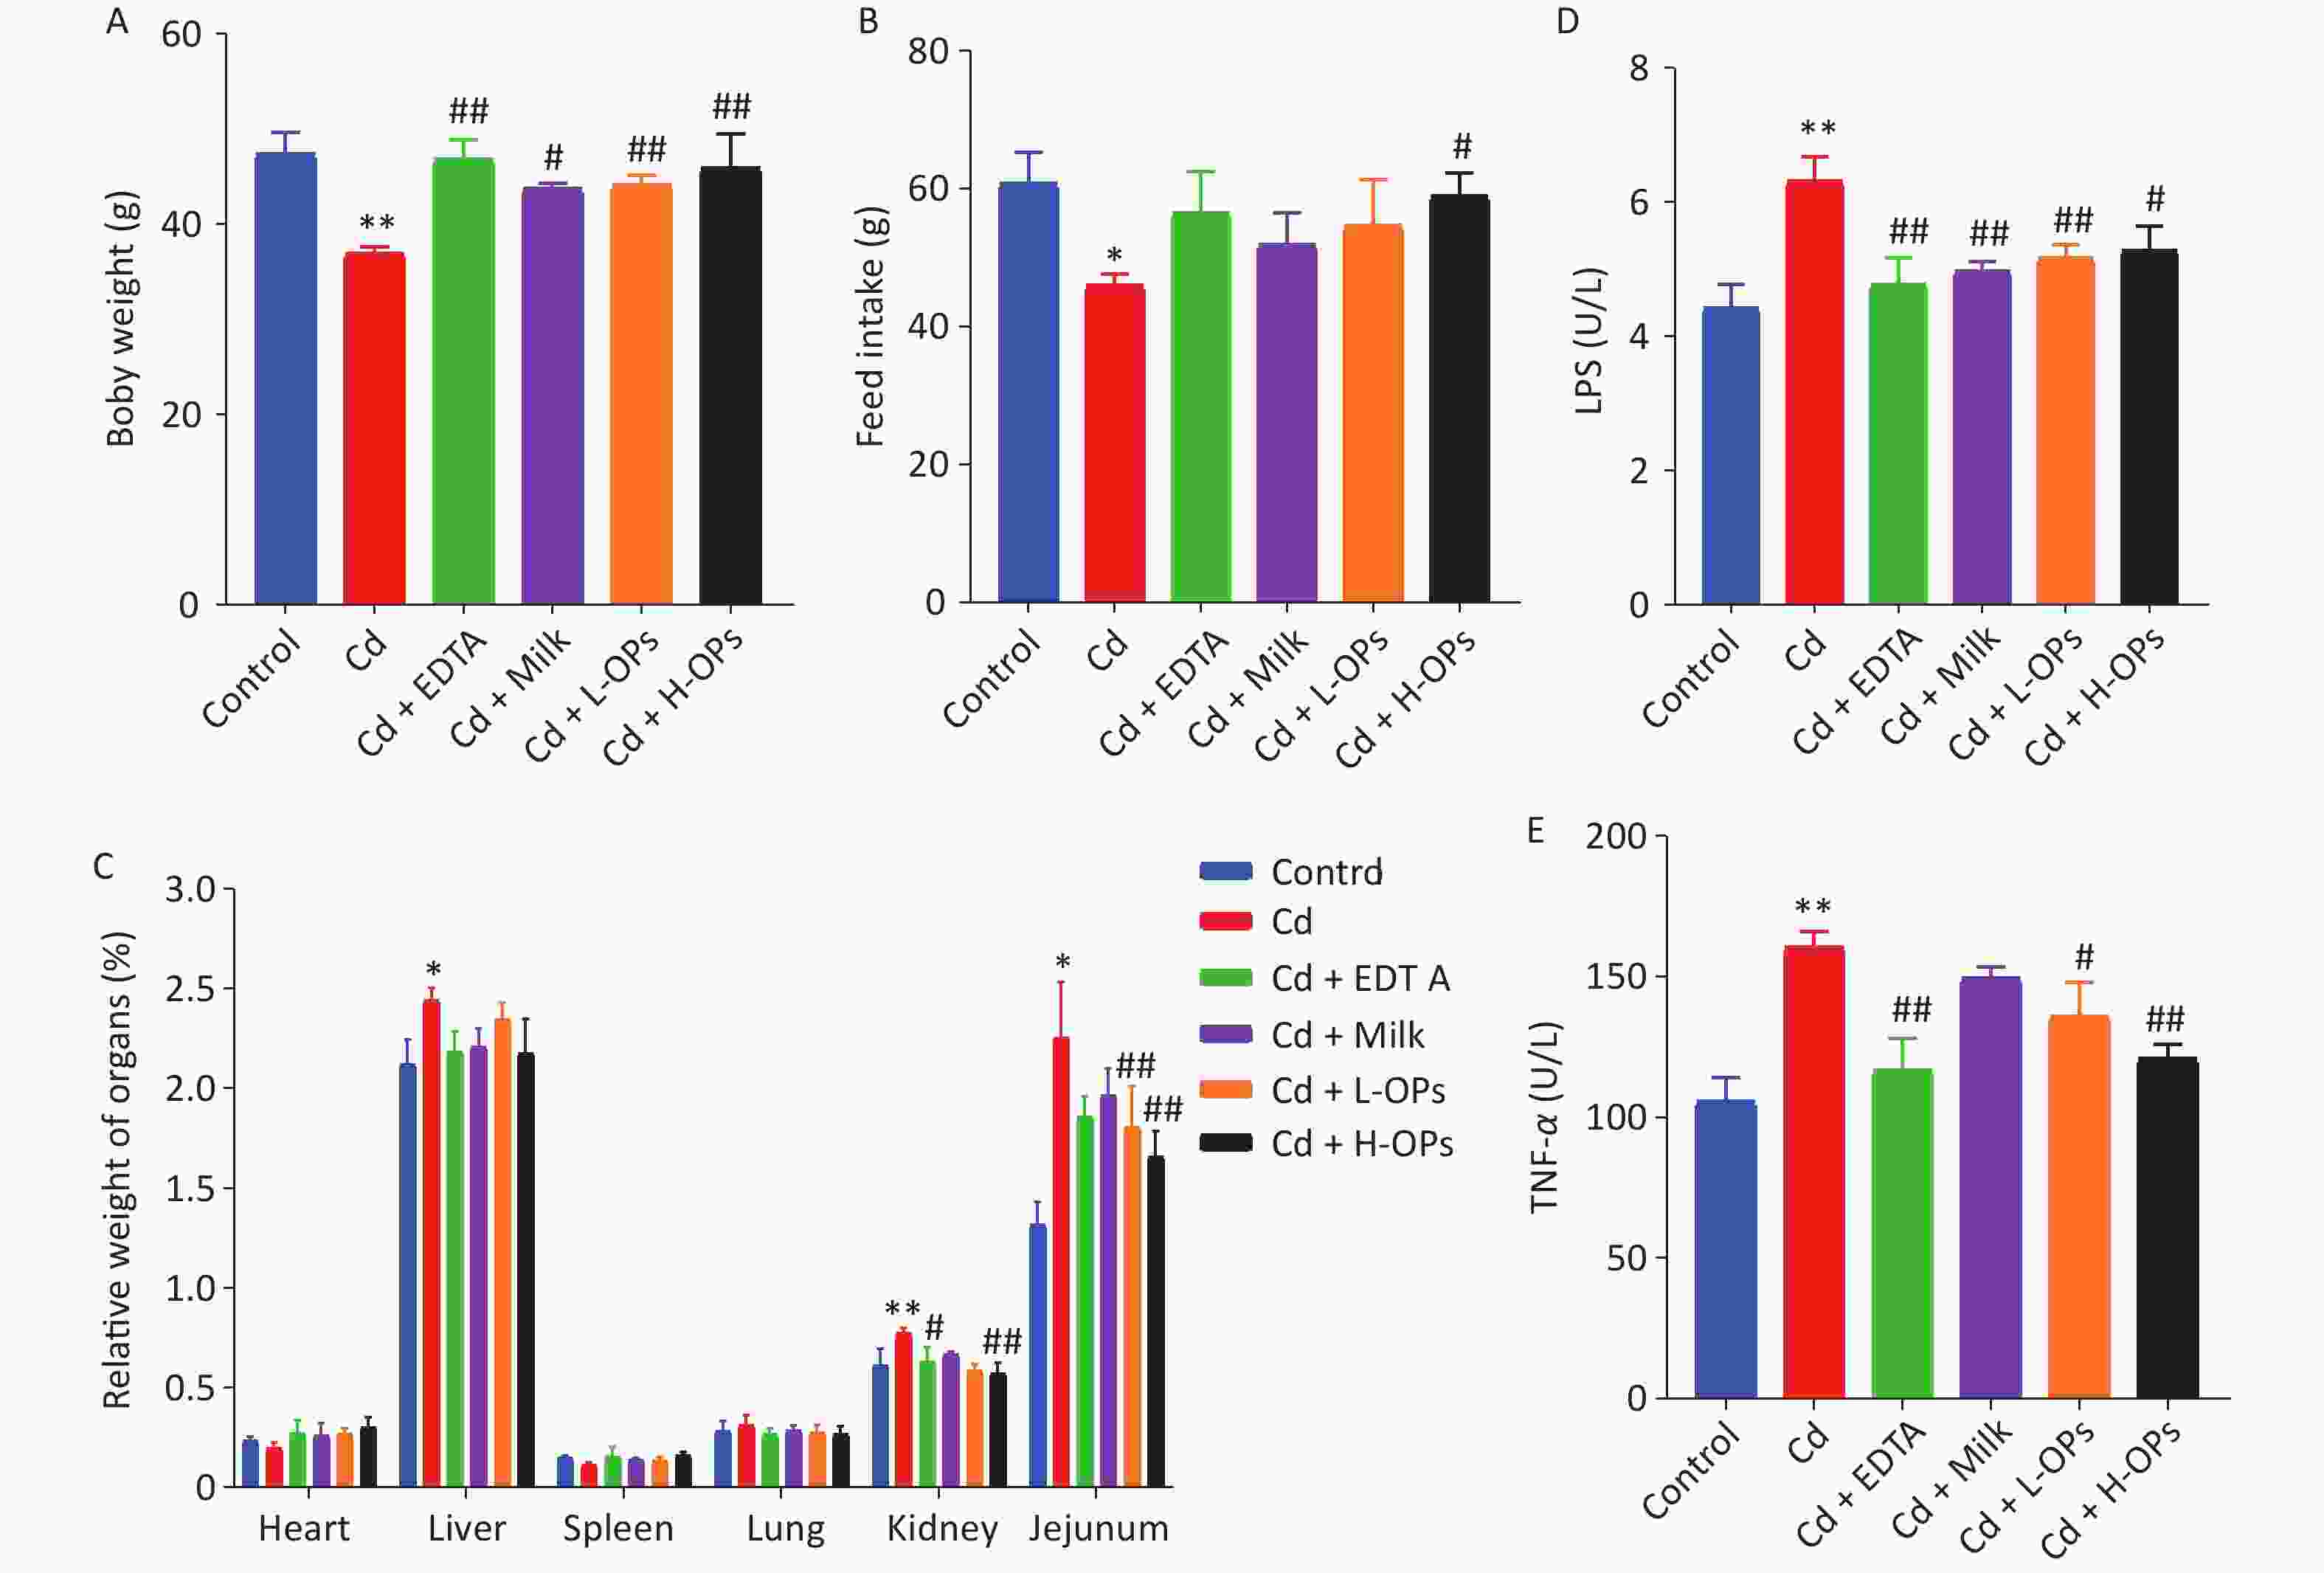
Figure 1. The influence of OPs on weight gain (A), feed intake (B), and relative organ weight (C) in Cd-treated mice. Serum inflammatory cytokine, LPS (D) and TNF-α (E), concentrations were determined by enzyme-linked immunosorbent assay. *P < 0.05 and **P < 0.01; significant difference from the control group. #P < 0.05 and ##P < 0.01; significant difference from the Cd-treated group. LPS, lipopolysaccharide
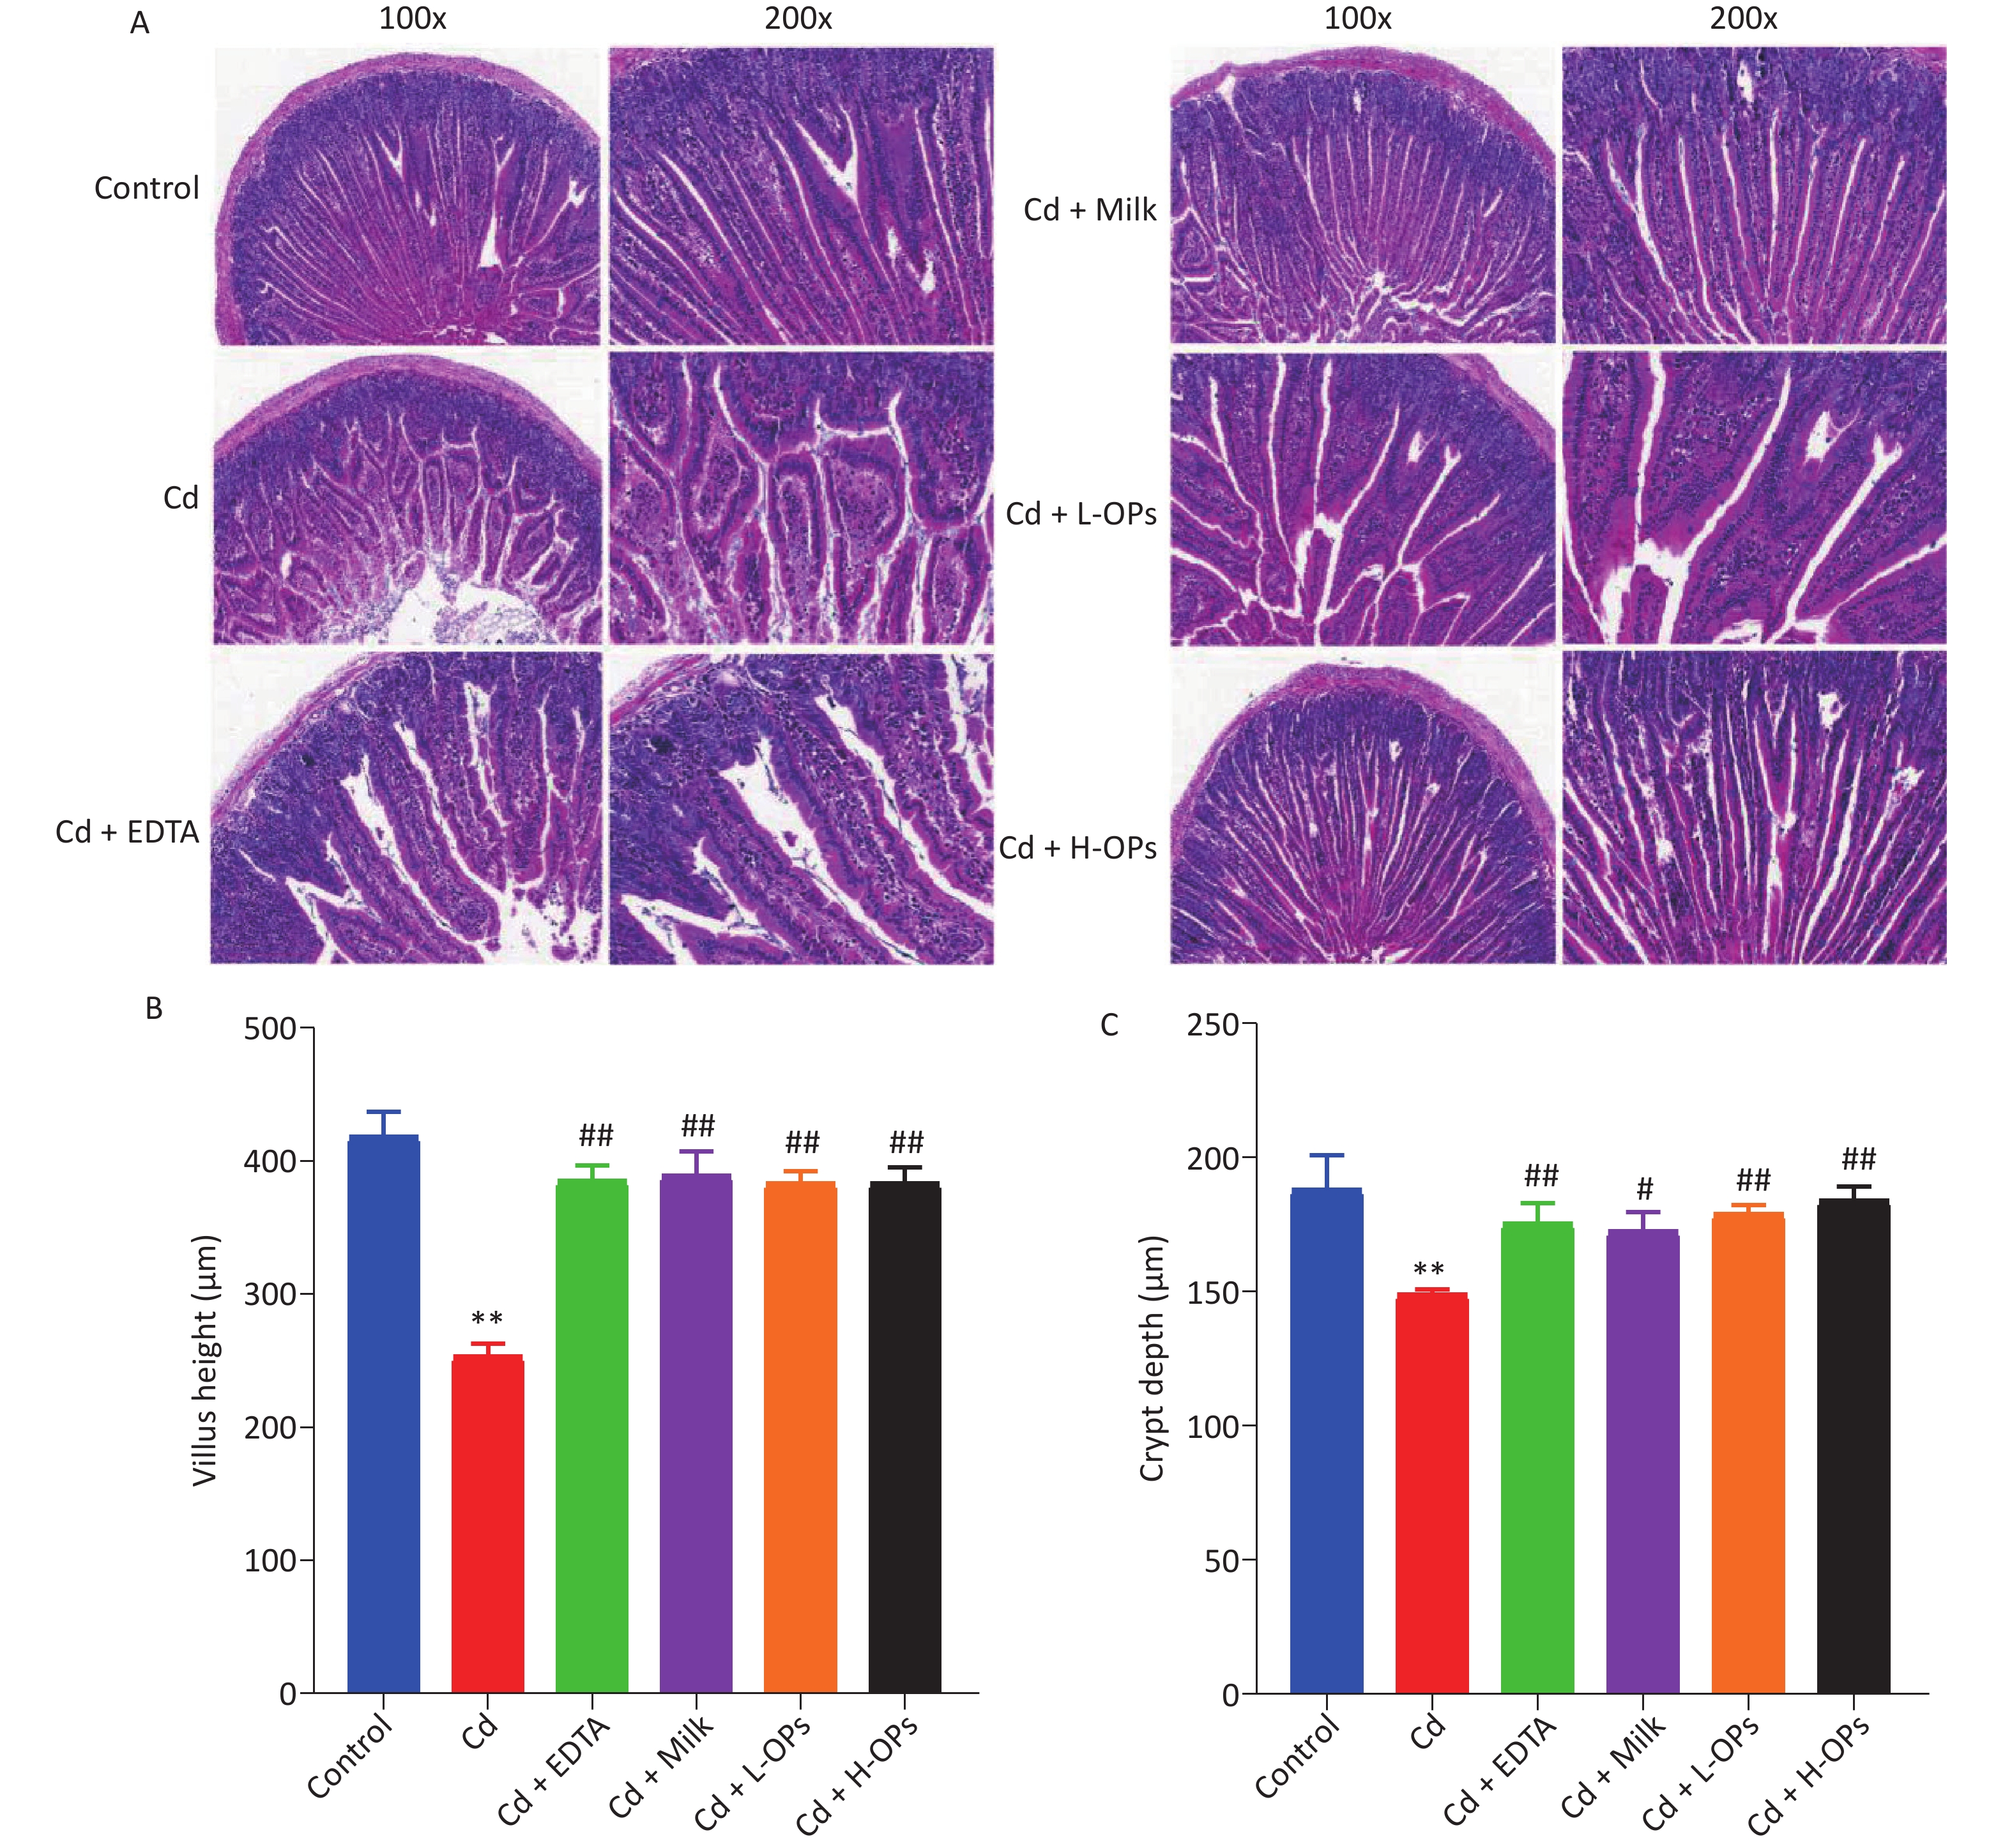
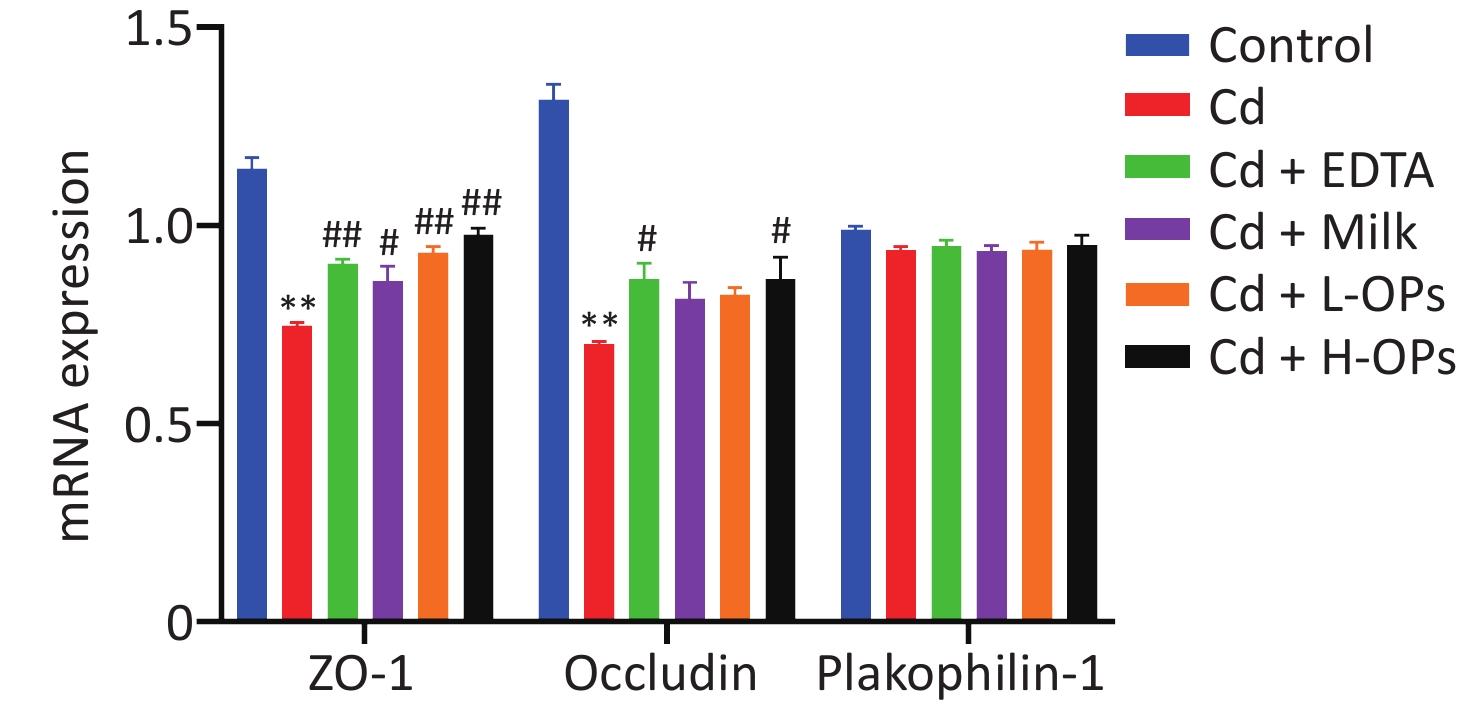
Next, we tested the alleviating effects of OPs on Cd-induced intestine injury. OP administration markedly reduced serum TNF-α and LPS levels in Cd-exposed mice (Figure 1D, E). Microscopic examinations showed that OPs restored villus height and crypt depth to approximate control group levels (Figure 2A–C). Thus, OPs exerted significant protective effects against Cd-induced intestinal damage. High serum LPS levels are usually caused by increased barrier permeability and broken tight junctions[11]. Cd significantly inhibited occludin and ZO-1 mRNA expression levels, and as expected, OPs restored this expression. No significant changes in mRNA expression levels were observed for plakophilin-1 (Supplementary Figure S1, available in www.besjournal.com).
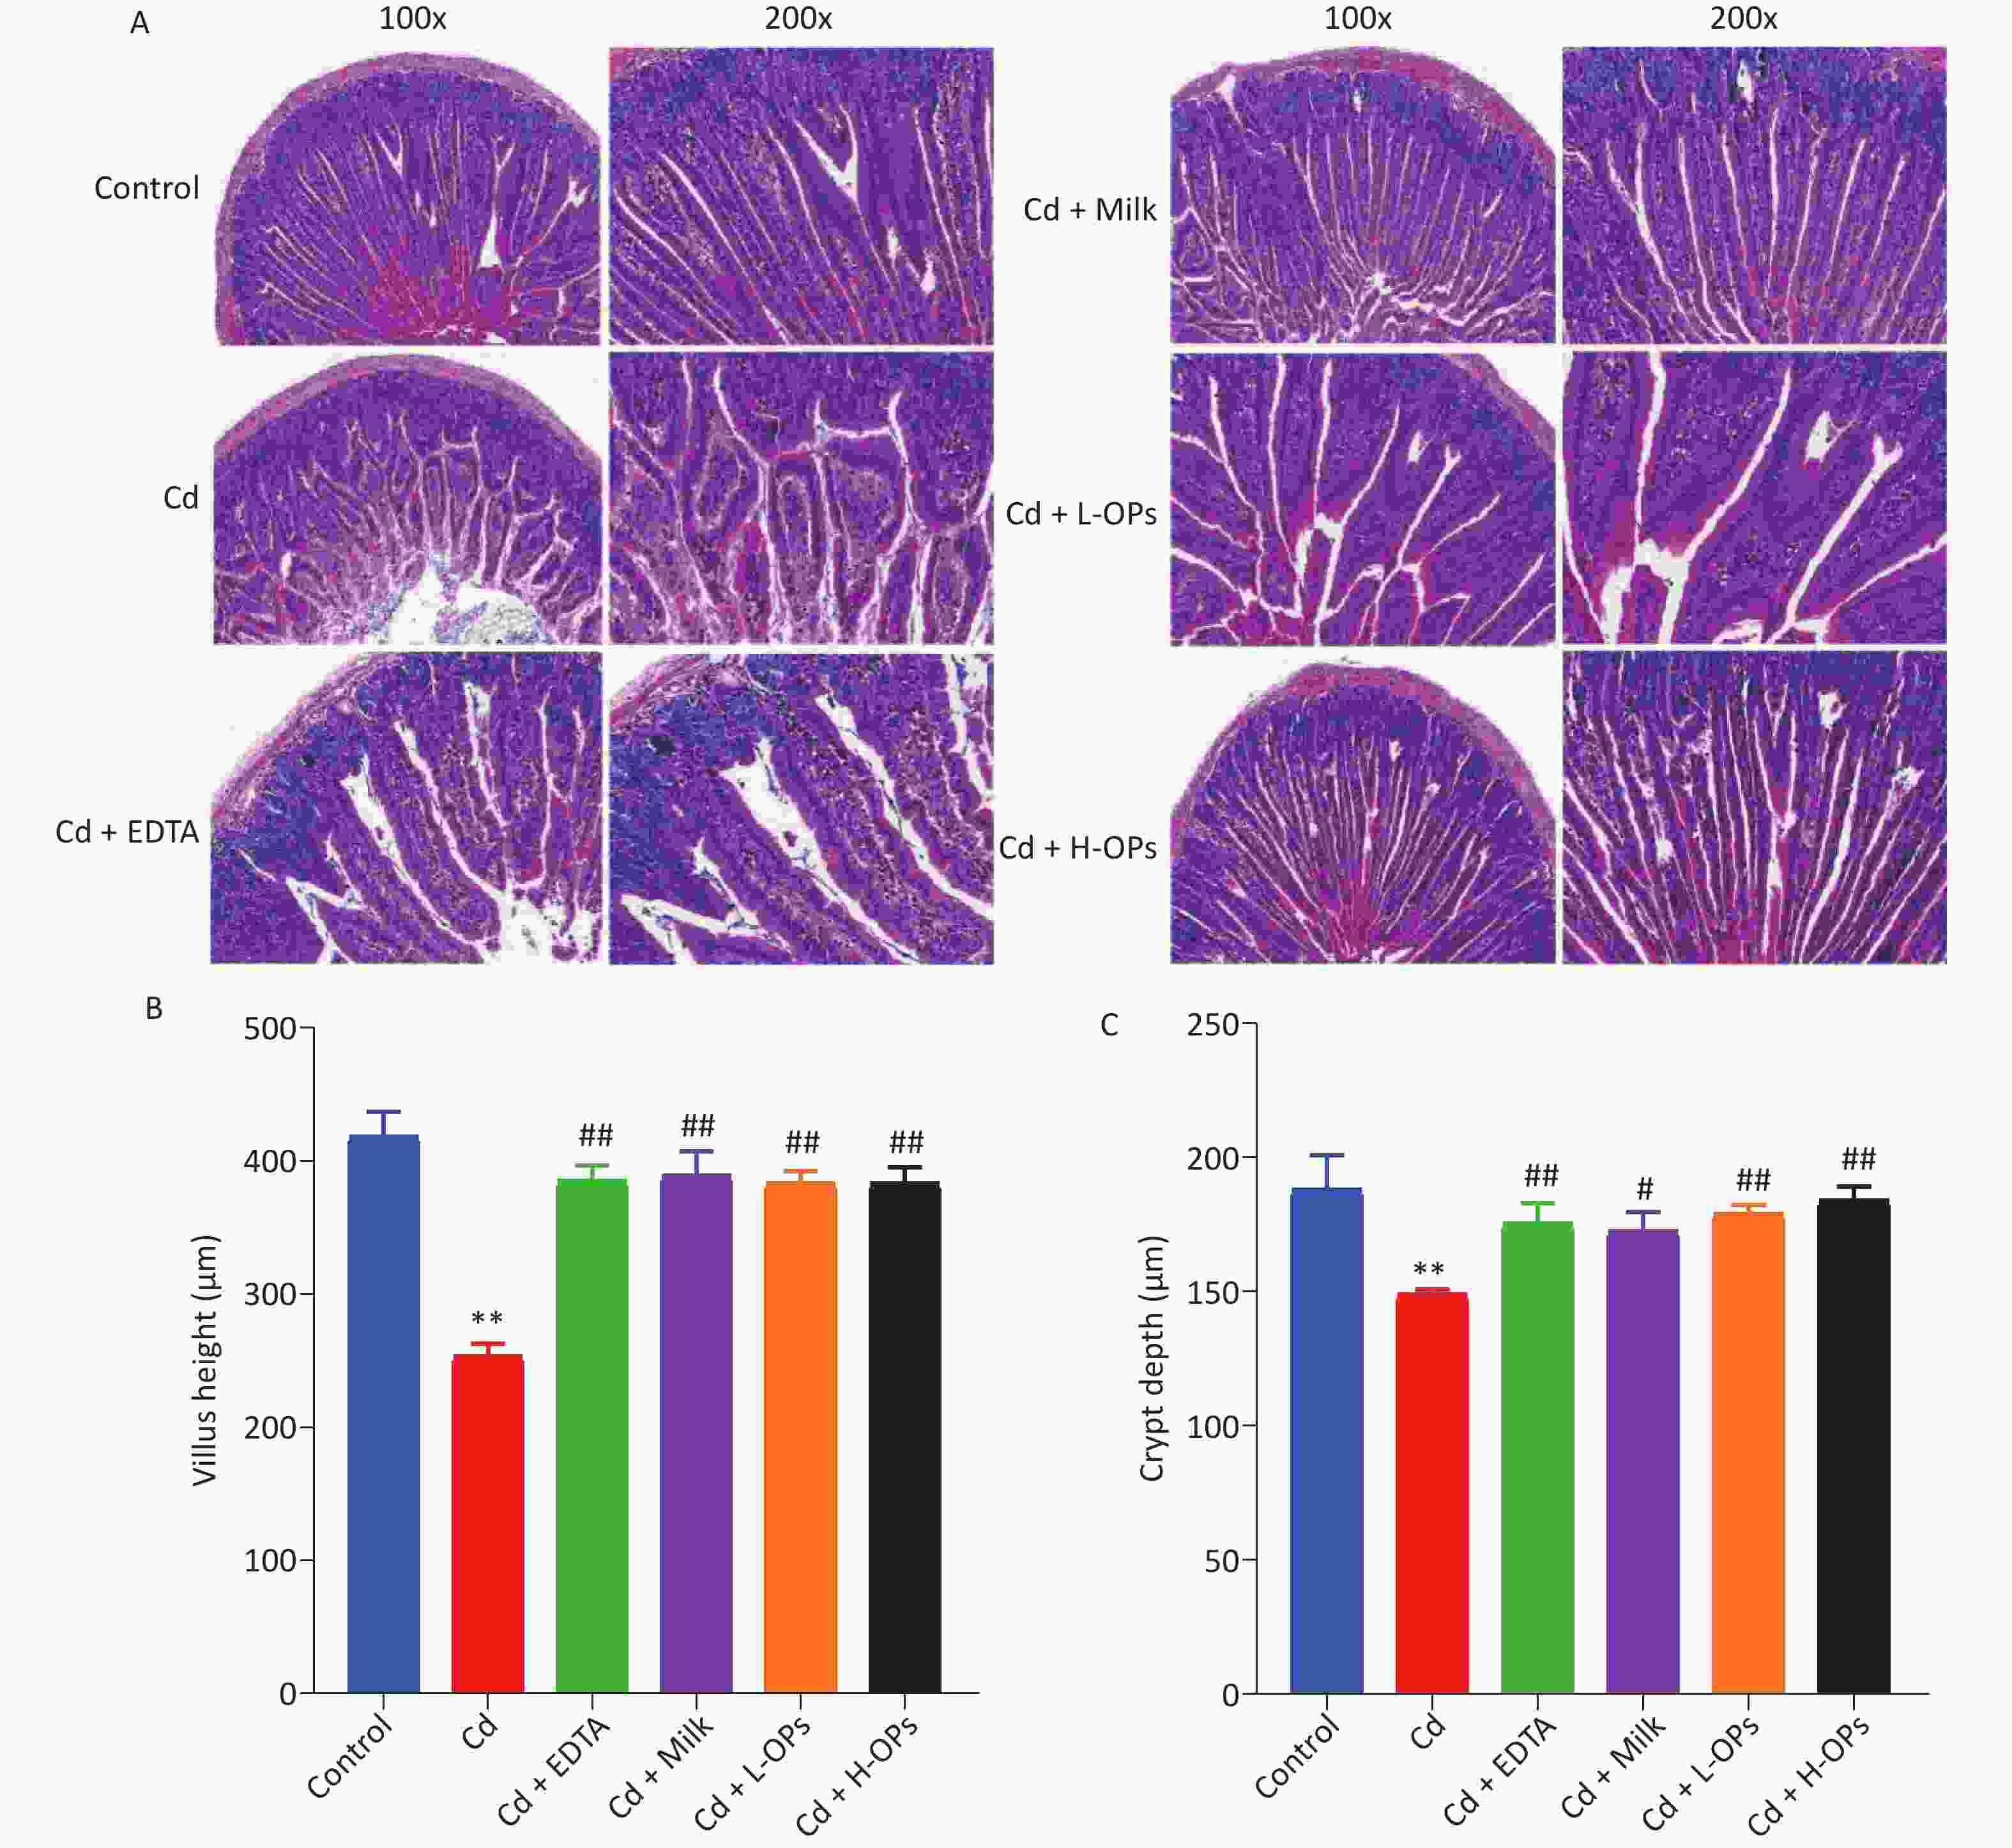
Figure 2. The effects of OPs on Cd-induced histological changes in mouse intestines. (A) Representative histological image sections of the jejunum (magnification at 100× and 200×; (B) villus height; (C) crypt depth; **P < 0.01; significant difference from the control group. #P < 0.05 and ##P < 0.01; significant difference from the Cd-treated group.
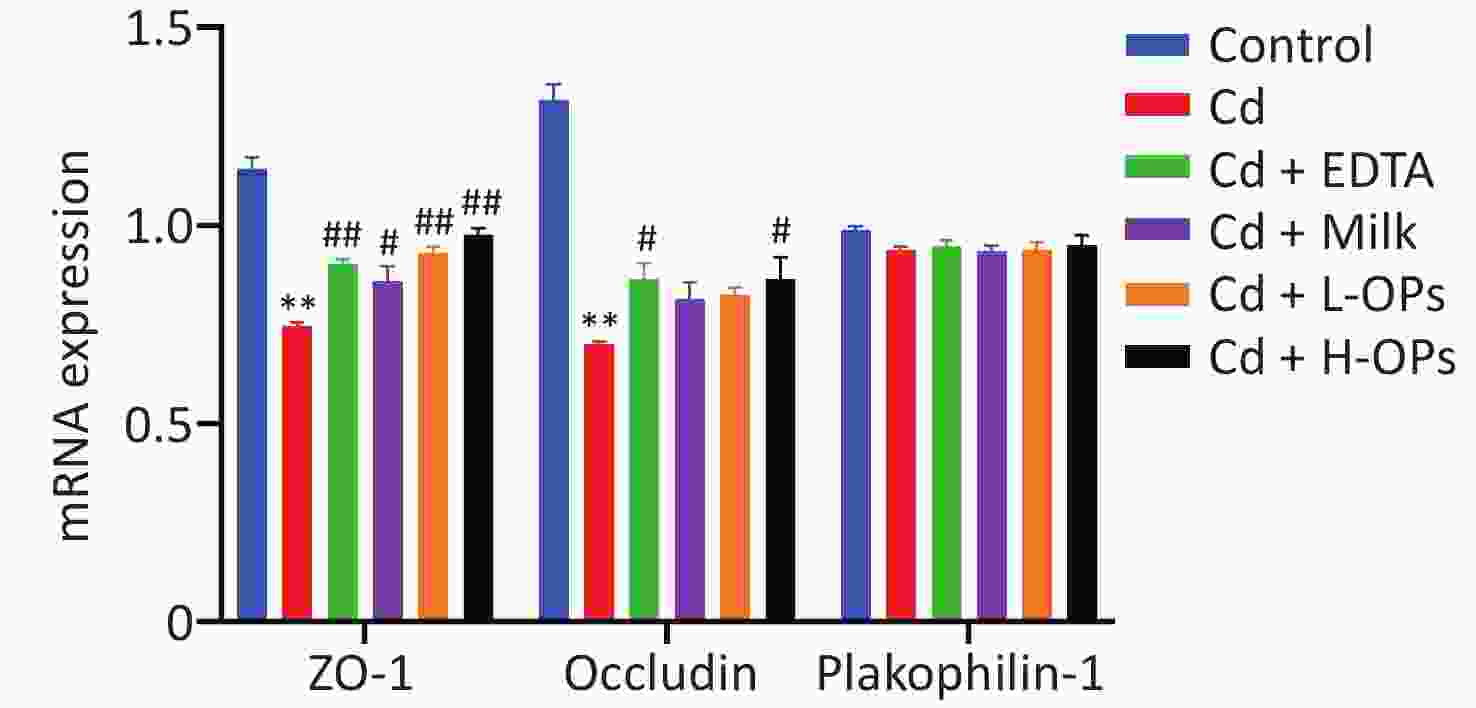
Figure S1. Gut mRNA levels of tight junction genes (occludin, ZO-1, and plakophilin-1) determined by quantitative real-time PCR. ZO-1 (zonula occludens-1). **P < 0.01; significant difference from the control group. #P < 0.05 and ##P < 0.01; significant difference from the Cd-treated group.
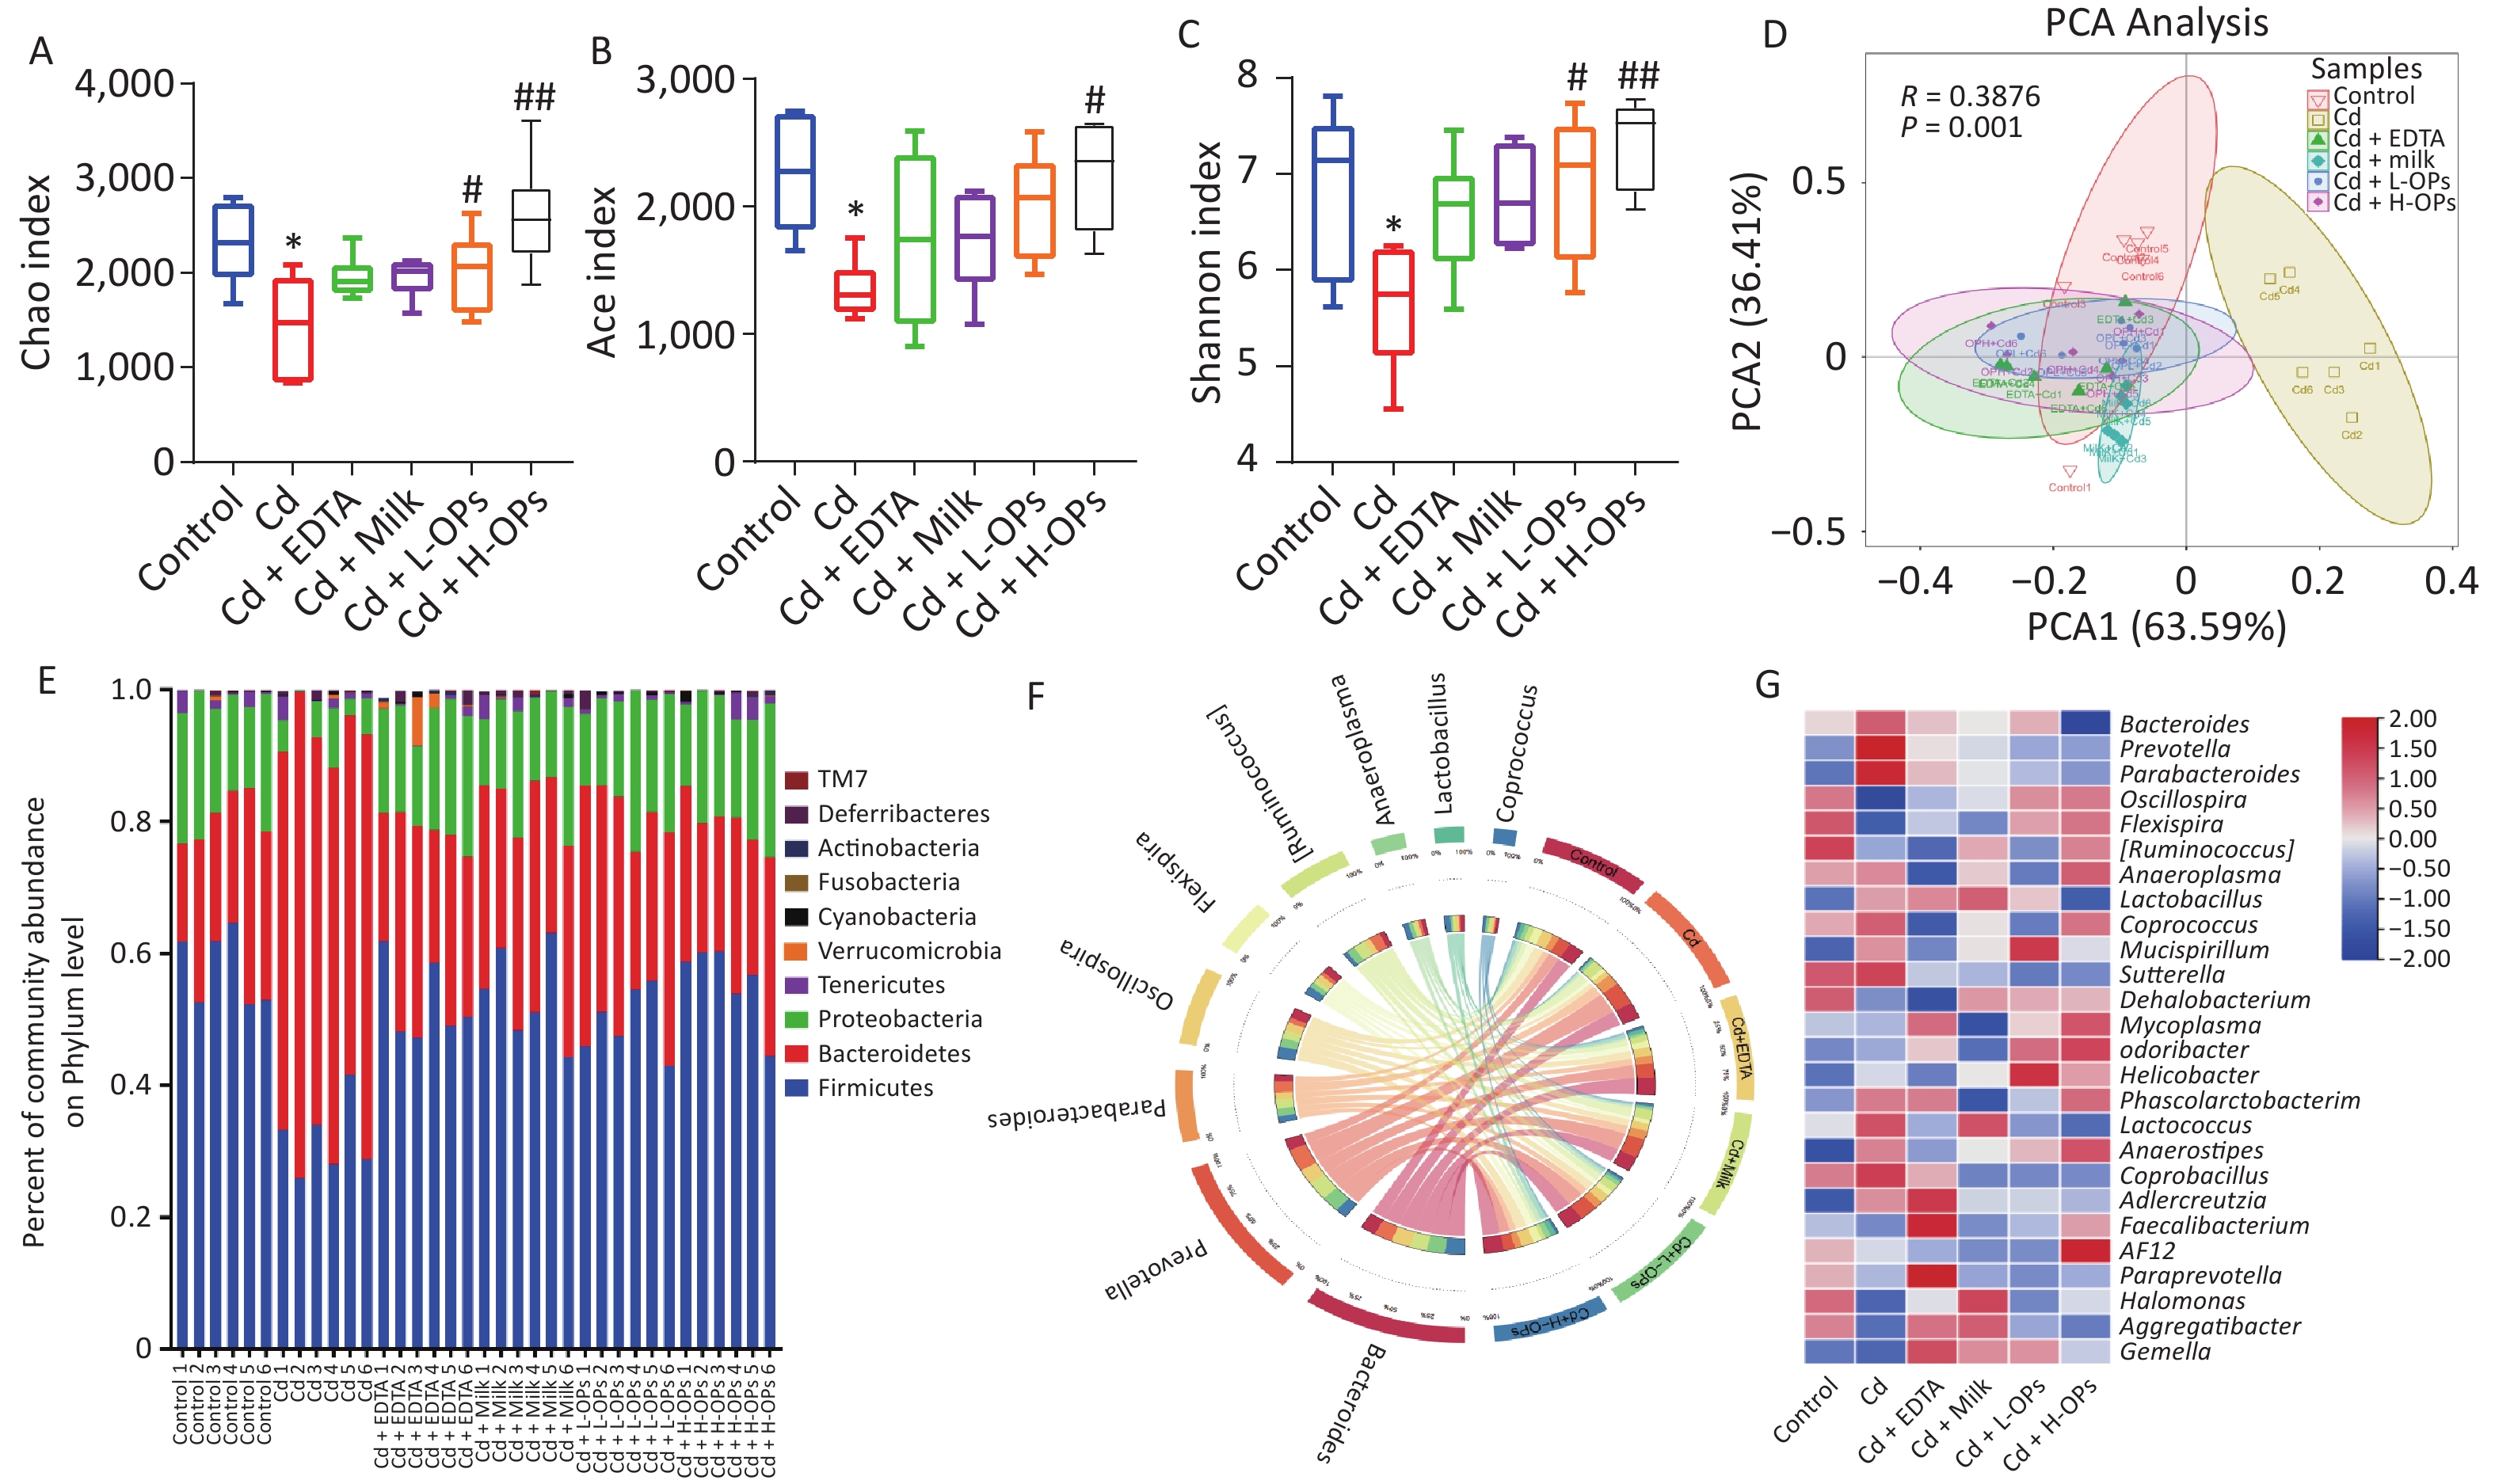
We further tested the alleviating effects of OPs on gut microbiota dysbiosis in Cd-exposed mice. Richness indices (Chao and Ace) and the diversity index (Shannon) were significantly recovered in a dose-dependent manner after OP supplementation to Cd-exposed mice (Figure 3A–C). Principal component analysis showed that the control group was well separated from the Cd-treatment group. These results suggested OPs may alleviate Cd toxicity by effectively restoring gut microbiota richness and diversity in Cd-exposed mice. OPs supplementation restored Firmicutes and Proteobacteria abundance and inhibited the increase of Bacteroidetes by Cd. At the genus level, when compared with the control group, Prevotella and Parabacteroides were significantly increased in the Cd group. In contrast, Oscillospira and Flexispira were significantly decreased in the Cd group, while the OP supplementation group had the best recovery (Figure 3D–F). These data demonstrated that OPs putatively alleviated intestinal damage and barrier function by reversing gut microbiota dysbiosis in Cd-exposed mice.
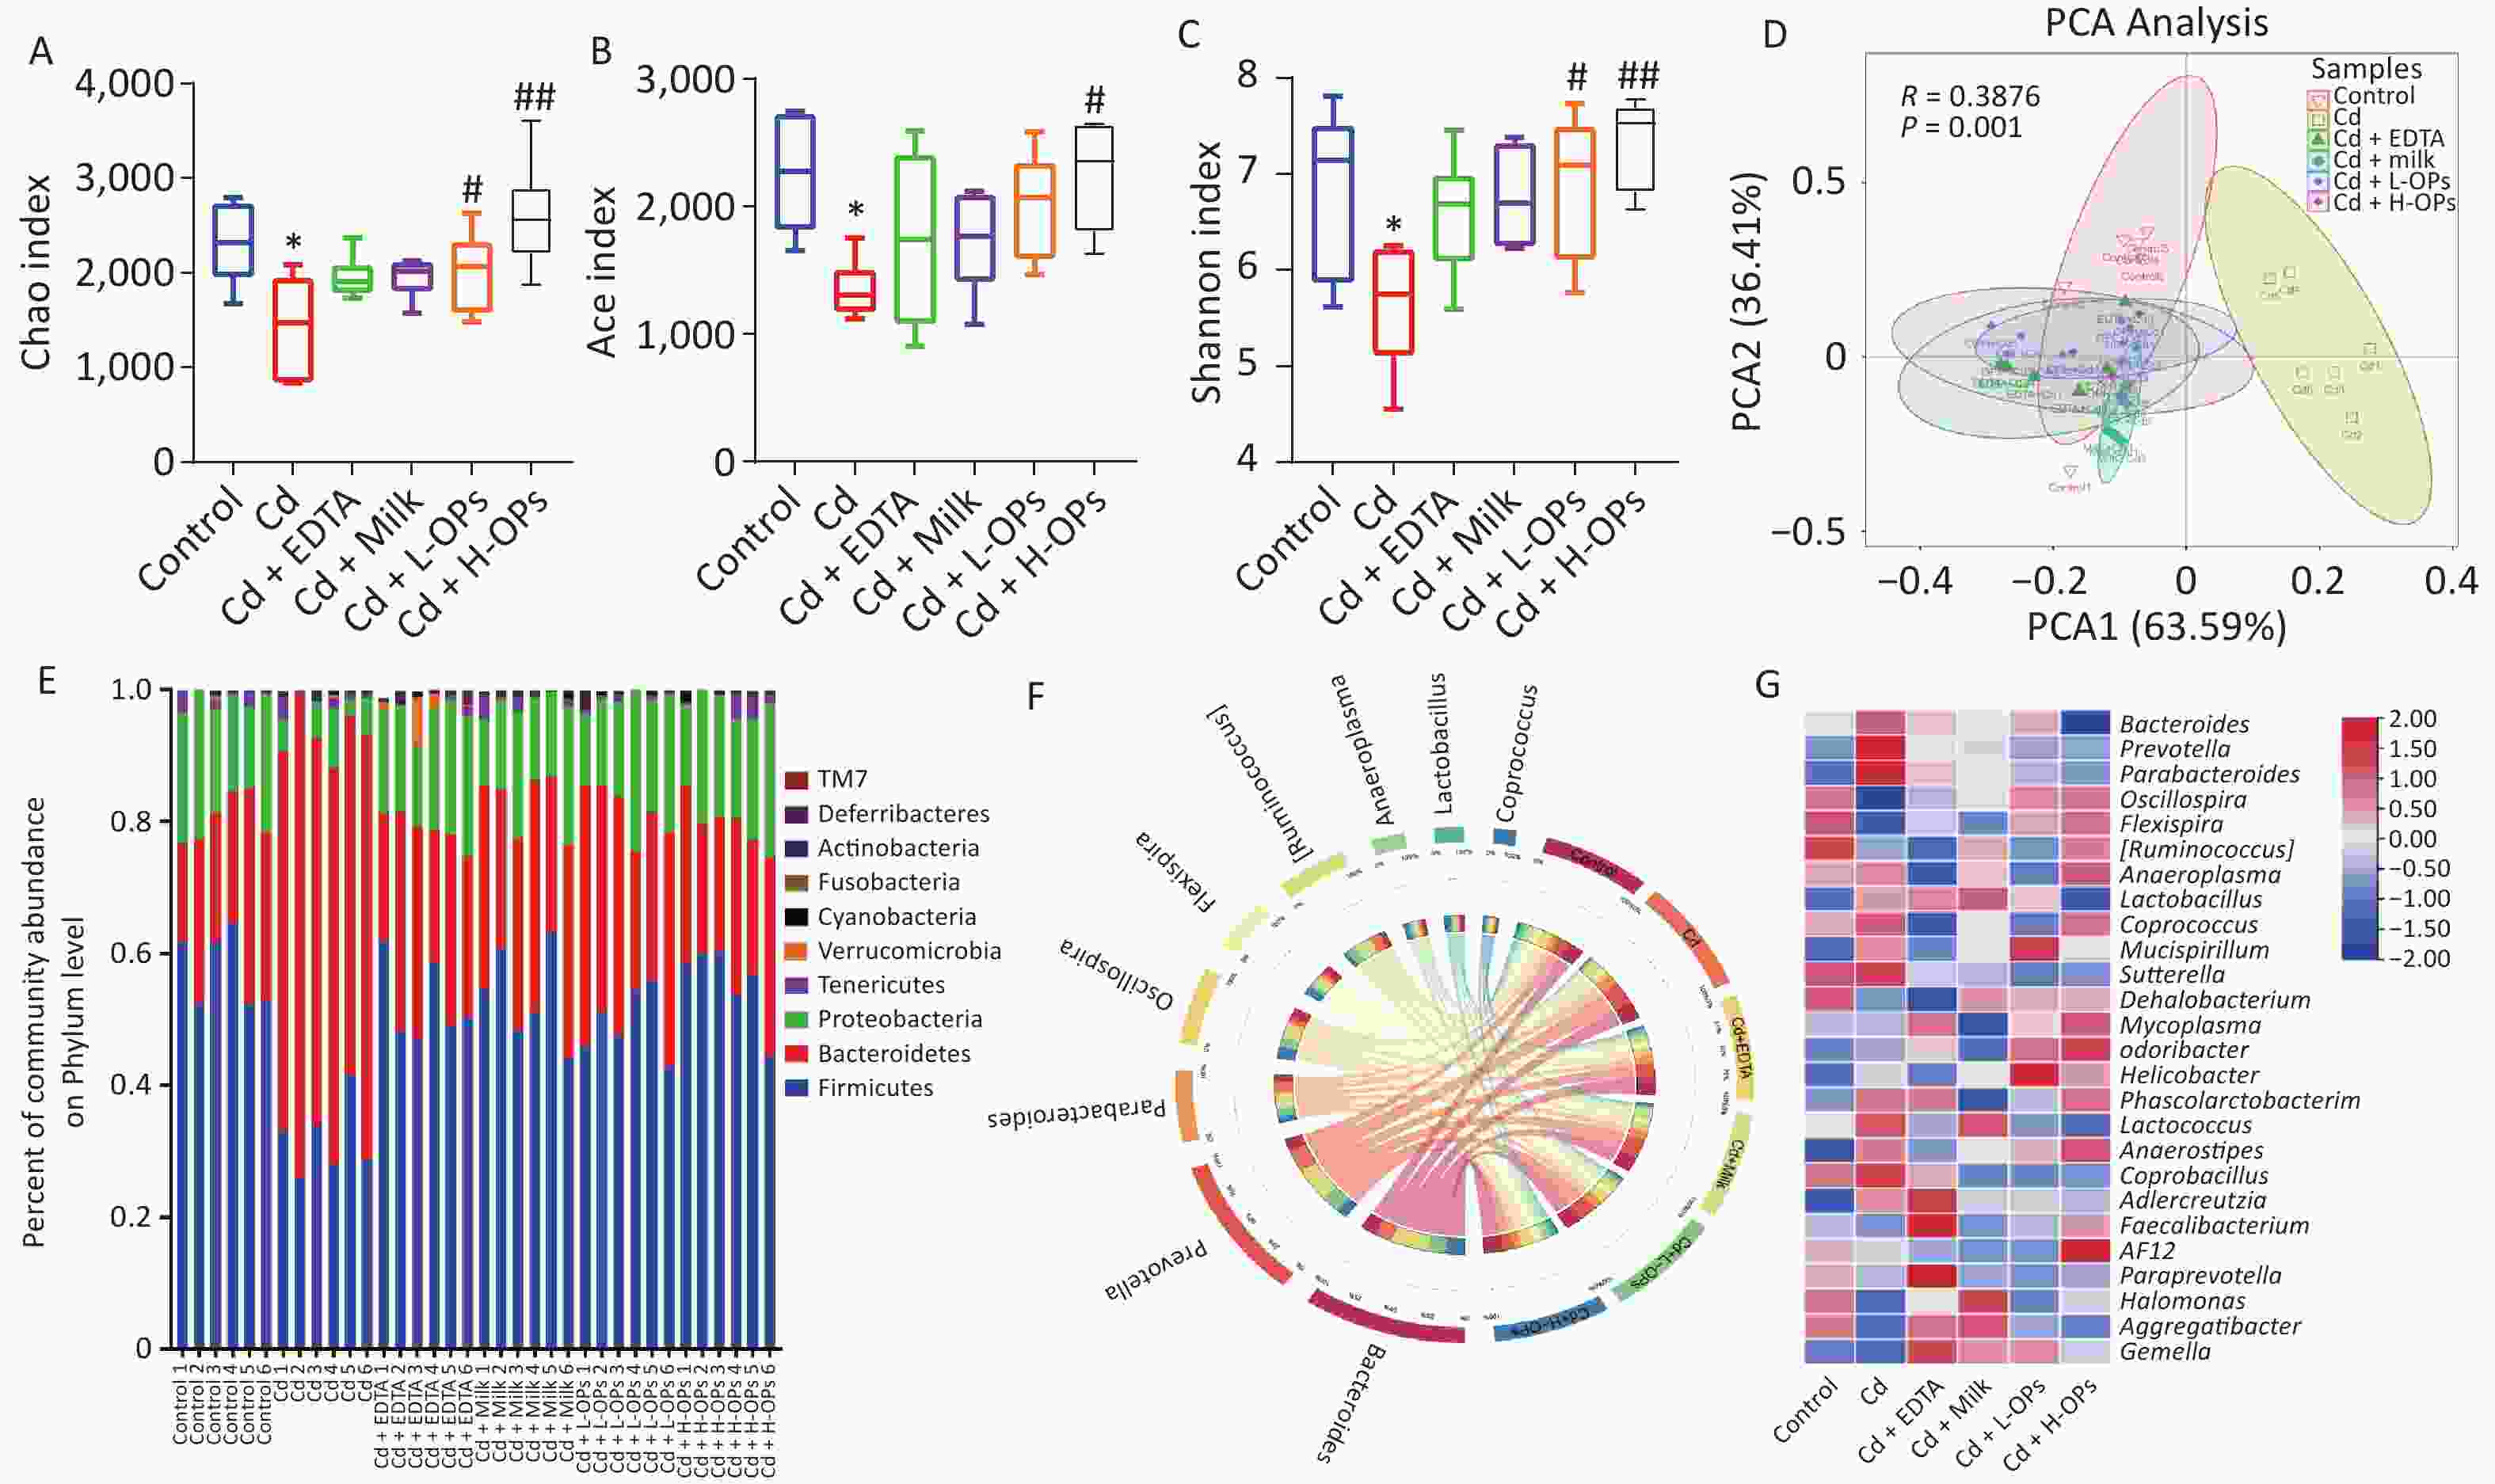
Figure 3. Comparing diversity and relative abundance of gut microbial communities between mouse groups. (A) Chao index for richness; (B) Ace index for richness; (C) Shannon index for diversity; (D) Gut microbiome patterns by principal component analysis. (E) Relative abundance of significantly altered gut bacteria taxa classified at the phylum level. (F) Circos graph representing gut microbiota composition at the genus level. (G) Microbial abundance heatmap at the genus level. *P < 0.05 and **P < 0.01; significant difference from the control group. #P < 0.05 and ##P < 0.01; significant difference from the Cd-treated group.
We then investigated the modulating mechanisms of OPs on gut microbiota dysbiosis in Cd-exposed mice and compared gut microbiota functional profiles between groups using PICRUSt computation analysis. As shown in Supplementary Table S4 (available in www.besjournal.com), most enriched KEGG pathways were associated with metabolic function. Amongst pathways, the relative proportion of metabolic pathways, such as amino acid metabolism, carbohydrate metabolism, energy metabolism, and glycan biosynthesis and metabolism were significantly up-regulated (Welch's t-test, P < 0.05) after exposure to Cd. In a previous study, acute Cd-exposure potentially induced stress responses in gut microbiota and up-regulated pathways associated with amino acid metabolism to supplement the amino acids that Cd had consumed, such as glutathione[3]. Prevotella was closely associated with amino acid metabolism and its growth was affected by amino acids such as aspartate.
Table S4. PICTUSt predicted KEGG pathways of the gut microbial community in different groups
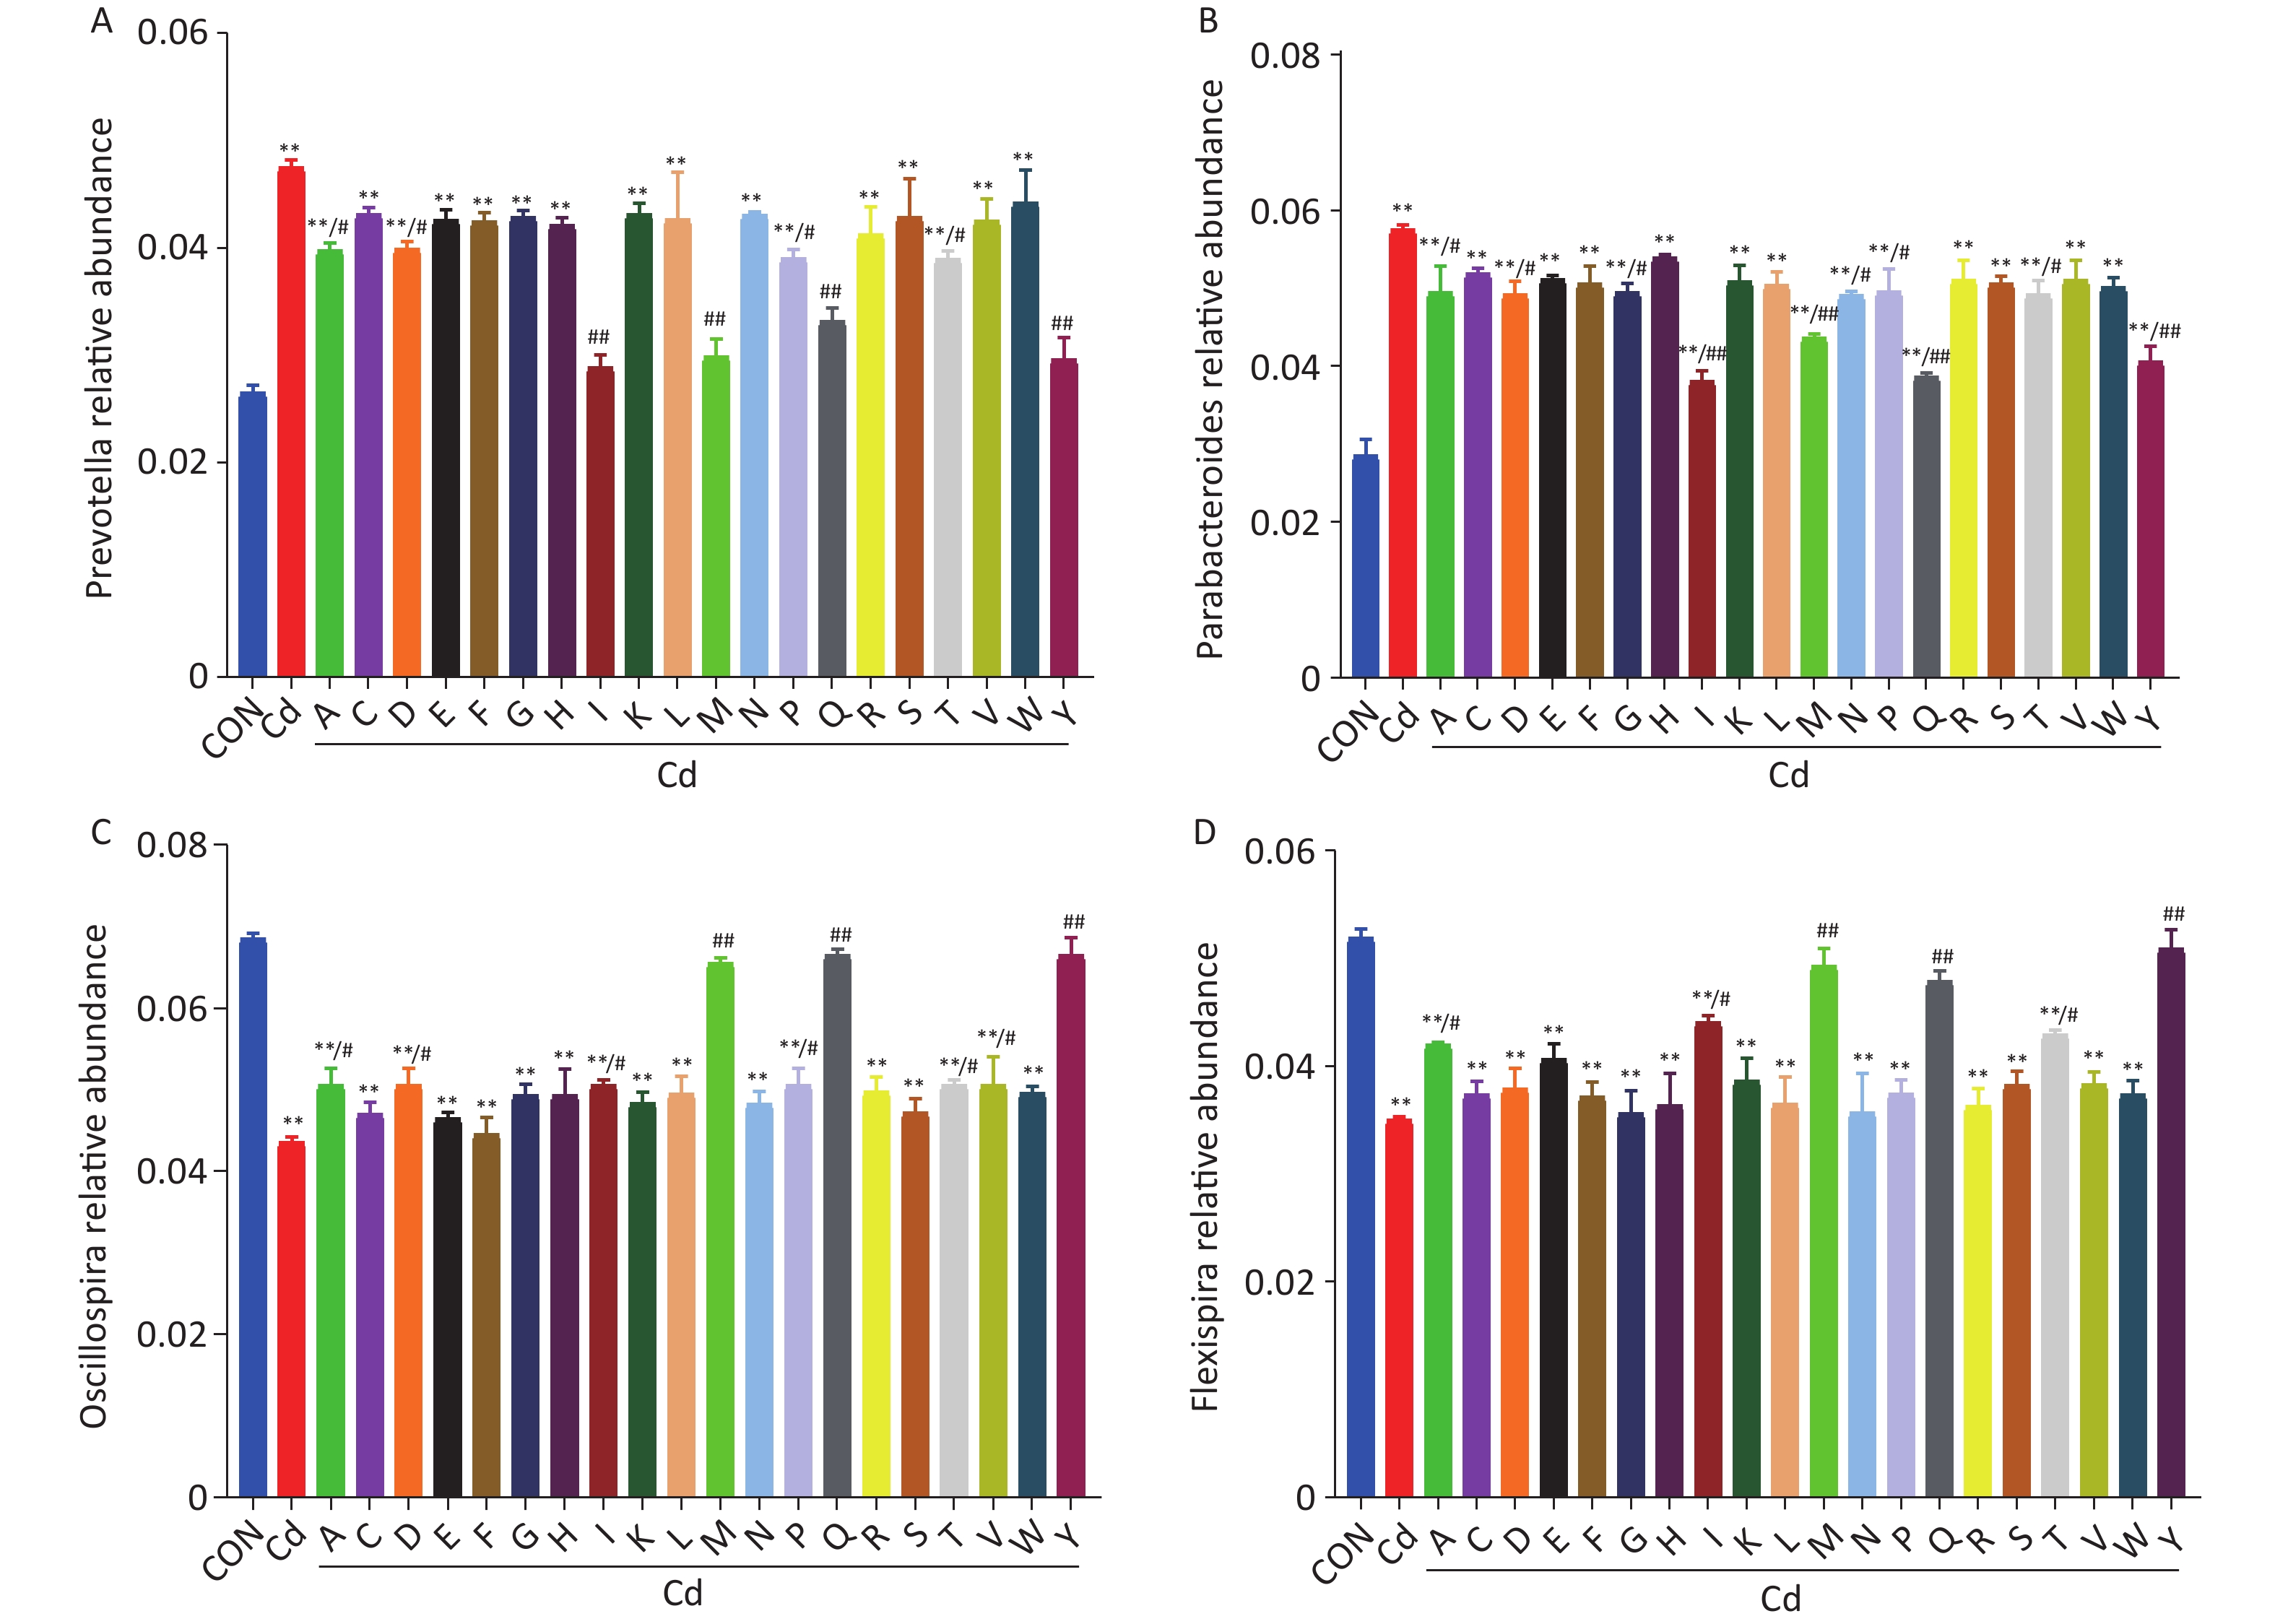
Function type KEGG pathways Relative abundance (%) Control Cd Cd+EDTA Cd+Milk Cd+L-OPs Cd+H-OPs Metabolism Amino Acid Metabolism 7.20 9.23* 8.65 8.84 8.12 7.94# Carbohydrate Metabolism 7.20 8.78* 8.32# 8.34# 7.87# 7.73# Xenobiotics Biodegradation and Metabolism 7.63 7.23 7.42 7.54 7.78 7.72 Lipid Metabolism 8.89 9.12 8.94 8.97 8.83 8.81 Energy Metabolism 4.24 4.94* 4.42# 4.46# 4.34# 4.32# Glycan Biosynthesis and Metabolism 5.08 5.34* 5.28 5.29 5.18 5.14 Metabolism of Cofactors and Vitamins 5.93 5.96 5.88 5.92 5.76# 5.74# Metabolism of Terpenoids and Polyketides 4.66 4.89 4.77 4.82 4.74 4.72 Metabolism of Other Amino Acids 3.81 4.24 4.18 4.14 4.08 3.97# Biosynthesis of Other Secondary Metabolites 5.08 5.17 5.14 5.16 5.12 5.10 Human Diseases Infectious Diseases 0.43 0.41 0.44 0.45 0.42 0.46 Neurodegenerative Diseases 0.24 0.32 0.25 0.26 0.23 0.22 Genetic Information Processing Translation 3.82 4.18* 3.84# 3.92 3.88# 3.83# Folding, Sorting and Degradation 2.96 3.44* 3.21# 3.35 3.18# 3.16# Note. *Significant difference from the control group at P < 0.05. #Significant difference from the Cd-exposed group at P < 0.05. As major components of OPs, amino acids have key roles modulating gut microbiota dysbiosis in Cd-exposed mice. To identify such amino acids, we evaluated the effects of each amino acid on key gut microbiota (Prevotella, Parabacteroides, Oscillospira, and Flexispira) using 16S rRNA sequencing. Of the amino acids which potentially regulated gut microbiota, tyrosine (Y), methionine (M), and glutamine (Q) exhibited extremely significant (P < 0.01) effects in restoring the relative abundance of key gut microbiota in Cd-exposed mice (Supplementary Figure S2, available in www.besjournal.com). The amino acid composition of OPs and milk was analyzed by LC-MS/MS. As shown (Supplementary Table S5 available in www.besjournal.com), OPs were particularly rich in free tyrosine (10,236.49 ± 270.07 μg/g), isoleucine (8,964.73 ± 489.29 μg/g), methionine (4,899.66 ± 148.11 μg/g), glutamine (2,327.62 ± 96.69 μg/g), and threonine (820.61 ± 43.03 μg/g), and levels were approximately 1000-fold higher than in milk. A previous study reported that methionine decreased the relative abundances of Prevotella but increased the relative abundances of Flexispira in steers[12]. Thus, OPs may reduce Cd-induced stress responses, down-regulate pathways associated with amino acid metabolism in gut microbial communities, and decrease Prevotella abundance and other related gut microbiota by providing amino acids.
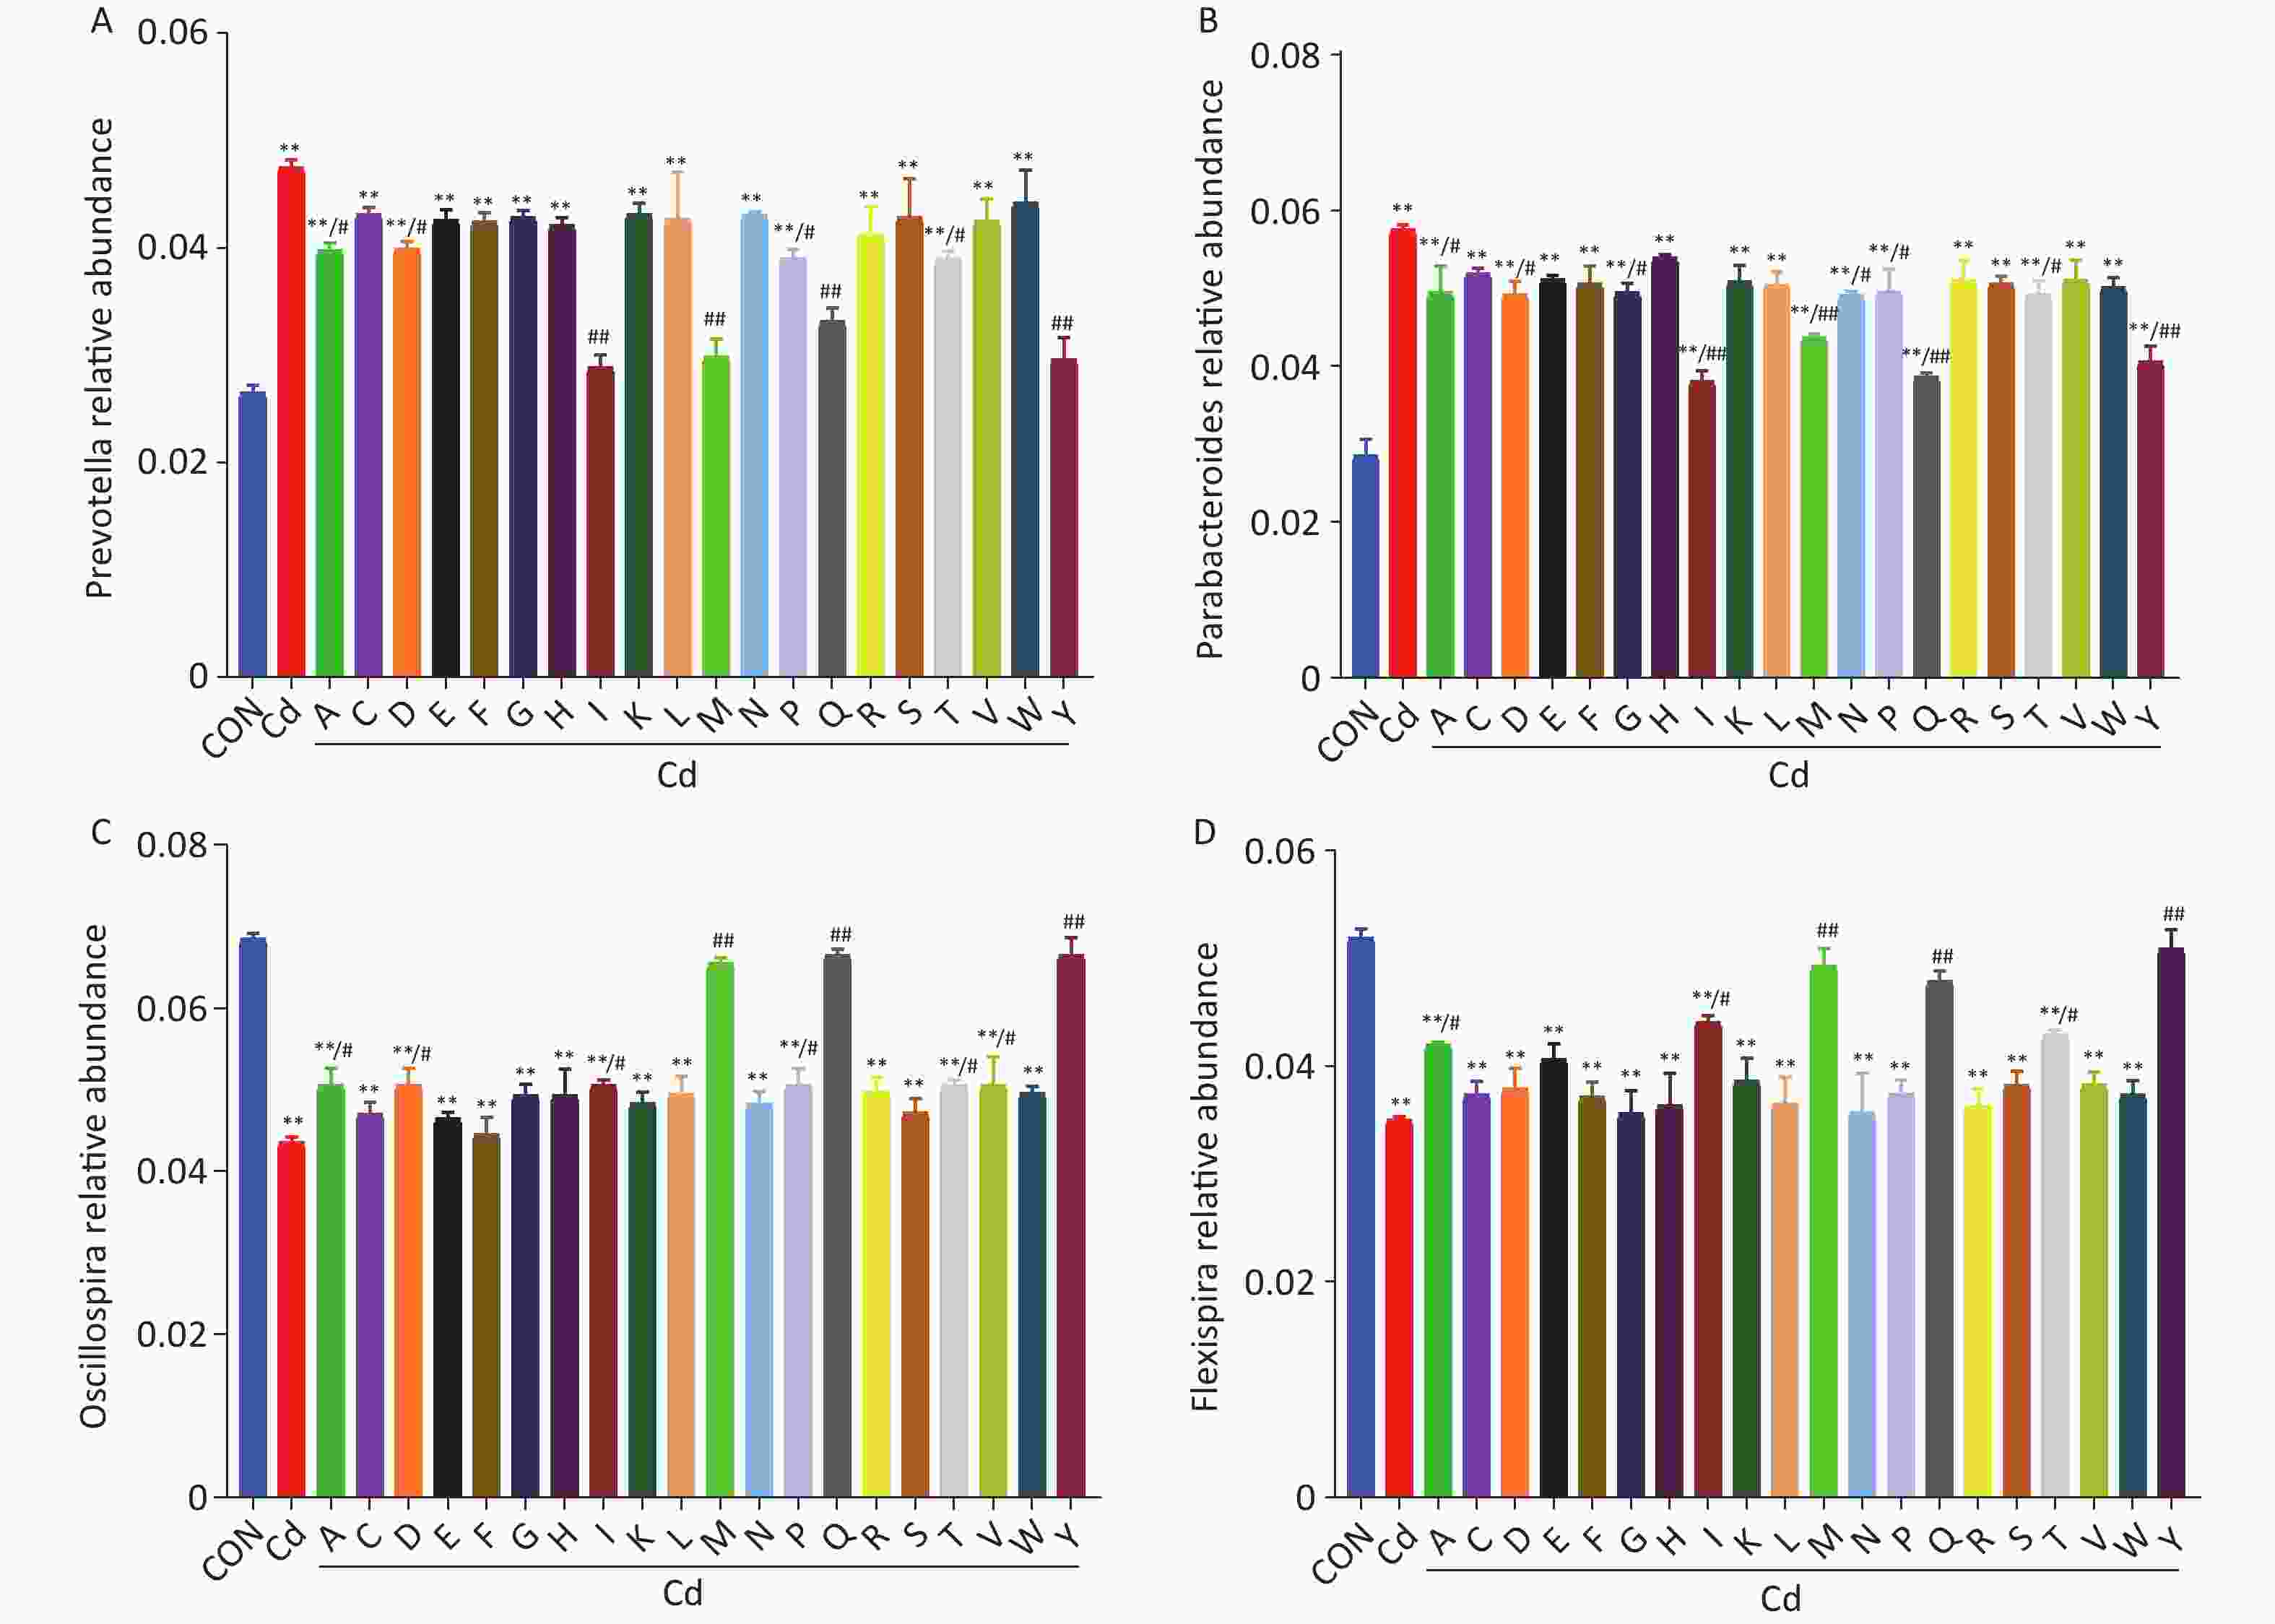
Figure S2. Effects of amino acids on the relative abundance of key gut microbiota (A–D: Prevotella, Parabacteroides, Oscillospira, and Flexispira) in mice. A (Alanine); C (Cysteine); D (Aspartic acid); E (Glutamic acid); F (Phenylalanine); G (Glycine) ; H (Histidine); I (Isoleucine); K (Lysine); L (leucine); M (Methionine); N (Asparagine); P (Proline); Q (Glutamine); R (Arginine); S (Serine); T (Threonine); V (Valine); W (Tryptophan); Y (Tyrosine). **P < 0.01; significant difference from the control group. #P < 0.05 and ##P < 0.01; significant difference from the Cd-treated group.
Table S5. Composition and contents of amino acids of OPs and milk (μg/g)
Amino acids Contents in milk Contents in OPs Ala# 3.45 ± 0.14 1499.88 ± 119.08 Cys ND 24.24 ± 10.71 Asp 0.47 ± 0.08 136.22 ± 10.71 Glu 13.98 ± 0.01 1267.78 ± 72.61 Phe*# 2.27 ± 0.05 1652.84 ± 176.83 Gly ND ND His 3.83 ± 0.17 1463.54 ± 86.01 Ile*# 3.86 ± 0.05 8964.73 ± 489.29 Lys* 6.17 ± 0.11 598.17 ± 301.07 Leu*# 4.91 ± 0.11 991.21 ± 26.48 Met*# 0.88 ± 0.01 4899.66 ± 148.11 Asn 6.84 ± 0.02 529.08 ± 63.47 Pro# 3.18 ± 0.08 1409.75 ± 32.95 Gln 1.61 ± 0.04 2327.62 ± 96.69 Arg 1.46 ± 0.02 ND Ser 0.51 ± 0.01 288.53 ± 35.01 Thr* 0.32 ± 0.02 820.61 ± 43.03 Val*# 8.89 ± 0.26 877.9 ± 134.03 Trp 1.69 ± 0.03 1142.69 ± 28.61 Tyr# 6.12 ± 0.27 10236.49 ± 270.07 Total amino acids 70.55 ± 0.91 39131.02 ± 2083.37 Essential amino acid 27.35 ± 0.37 18805.14+1265.91 Hydrophobic amino acids 33.60 ± 0.84 30532.49 ± 1343.91 Note. *Essential amino acid. #Hydrophobic amino acids. In conclusion, OPs may alleviate Cd toxicity by restoring Cd-induced gut microbiota dysbiosis via its abundance of the free amino acids tyrosine, methionine, and glutamine.
Conflicts of Interest The authors declare none.
doi: 10.3967/bes2022.088
Oyster Protein Hydrolysate Alleviates Cadmium Toxicity by Restoring Cadmium-Induced Intestinal Damage and Gut Microbiota Dysbiosis in Mice via Its Abundance of Methionine, Tyrosine, and Glutamine
-
-
Figure 1. The influence of OPs on weight gain (A), feed intake (B), and relative organ weight (C) in Cd-treated mice. Serum inflammatory cytokine, LPS (D) and TNF-α (E), concentrations were determined by enzyme-linked immunosorbent assay. *P < 0.05 and **P < 0.01; significant difference from the control group. #P < 0.05 and ##P < 0.01; significant difference from the Cd-treated group. LPS, lipopolysaccharide
Figure 2. The effects of OPs on Cd-induced histological changes in mouse intestines. (A) Representative histological image sections of the jejunum (magnification at 100× and 200×; (B) villus height; (C) crypt depth; **P < 0.01; significant difference from the control group. #P < 0.05 and ##P < 0.01; significant difference from the Cd-treated group.
S1. Gut mRNA levels of tight junction genes (occludin, ZO-1, and plakophilin-1) determined by quantitative real-time PCR. ZO-1 (zonula occludens-1). **P < 0.01; significant difference from the control group. #P < 0.05 and ##P < 0.01; significant difference from the Cd-treated group.
Figure 3. Comparing diversity and relative abundance of gut microbial communities between mouse groups. (A) Chao index for richness; (B) Ace index for richness; (C) Shannon index for diversity; (D) Gut microbiome patterns by principal component analysis. (E) Relative abundance of significantly altered gut bacteria taxa classified at the phylum level. (F) Circos graph representing gut microbiota composition at the genus level. (G) Microbial abundance heatmap at the genus level. *P < 0.05 and **P < 0.01; significant difference from the control group. #P < 0.05 and ##P < 0.01; significant difference from the Cd-treated group.
S2. Effects of amino acids on the relative abundance of key gut microbiota (A–D: Prevotella, Parabacteroides, Oscillospira, and Flexispira) in mice. A (Alanine); C (Cysteine); D (Aspartic acid); E (Glutamic acid); F (Phenylalanine); G (Glycine) ; H (Histidine); I (Isoleucine); K (Lysine); L (leucine); M (Methionine); N (Asparagine); P (Proline); Q (Glutamine); R (Arginine); S (Serine); T (Threonine); V (Valine); W (Tryptophan); Y (Tyrosine). **P < 0.01; significant difference from the control group. #P < 0.05 and ##P < 0.01; significant difference from the Cd-treated group.
S1. Animal experimental protocol
Groups Samples 7 days treatments Control n = 6 Mice were given drinking water Cd n = 6 Drinking water containing 100 mg/L of CdCl2 Cd+EDTA n = 6 Drinking water containing 100 mg/L of CdCl2 and orally administered with 100 mg/kg per day of EDTA Cd+Milk n = 6 Drinking water containing 100 mg/L of CdCl2 and orally administered with 100 mg/kg per day of milk Cd+L-OPs n = 6 Drinking water containing 100 mg/L of CdCl2 and orally administered with 100 mg/kg per day of OPs Cd+H-OPs n = 6 Drinking water containing 100 mg/L of CdCl2 and orally administered with 300 mg/kg per day of OPs  下载: 导出CSV
S2. Animal experimental protocol
Group Samples 7 days Treatments Control n = 6 Mice were given drinking water Cd n = 6 Drinking water containing 100 mg/L of CdCl2 Cd+Ala(A) n = 6 Drinking water containing 100 mg/L of CdCl2 and orally administered with 40 mmol/kg per day of Ala Cd+Cys(C) n = 6 Drinking water containing 100 mg/L of CdCl2 and orally administered with 40 mmol/kg per day of Cys Cd+Asp(D) n = 6 Drinking water containing 100 mg/L of CdCl2 and orally administered with 40 mmol/kg per day of Asp Cd+Glu(E) n = 6 Drinking water containing 100 mg/L of CdCl2 and orally administered with 40 mmol/kg per day of Glu Cd+Phe(F) n = 6 Drinking water containing 100 mg/L of CdCl2 and orally administered with 40 mmol/kg per day of Phe Cd+Gly(G) n = 6 Drinking water containing 100 mg/L of CdCl2 and orally administered with 40 mmol/kg per day of Gly Cd+His(H) n = 6 Drinking water containing 100 mg/L of CdCl2 and orally administered with 40 mmol/kg per day of His Cd+Ile(I) n = 6 Drinking water containing 100 mg/L of CdCl2 and orally administered with 40 mmol/kg per day of Ile Cd+Lys(K) n = 6 Drinking water containing 100 mg/L of CdCl2 and orally administered with 40 mmol/kg per day of Lys Cd+Leu(L) n = 6 Drinking water containing 100 mg/L of CdCl2 and orally administered with 40 mmol/kg per day of Leu Cd+Met(M) n = 6 Drinking water containing 100 mg/L of CdCl2 and orally administered with 40 mmol/kg per day of Met Cd+Asn(N) n = 6 Drinking water containing 100 mg/L of CdCl2 and orally administered with 40 mmol/kg per day of Asn Cd+Pro(P) n = 6 Drinking water containing 100 mg/L of CdCl2 and orally administered with 40 mmol/kg per day of Pro Cd+Gln(Q) n = 6 Drinking water containing 100 mg/L of CdCl2 and orally administered with 40 mmol/kg per day of Gln Cd+Arg(R) n = 6 Drinking water containing 100 mg/L of CdCl2 and orally administered with 40 mmol/kg per day of Arg Cd+Ser(S) n = 6 Drinking water containing 100 mg/L of CdCl2 and orally administered with 40 mmol/kg per day of Ser Cd+Thr(T) n = 6 Drinking water containing 100 mg/L of CdCl2 and orally administered with 40 mmol/kg per day of Thr Cd+Val(V) n = 6 Drinking water containing 100 mg/L of CdCl2 and orally administered with 40 mmol/kg per day of Val Cd+Trp(W) n = 6 Drinking water containing 100 mg/L of CdCl2 and orally administered with 40 mmol/kg per day of Trp Cd+Tyr(Y) n = 6 Drinking water containing 100 mg/L of CdCl2 and orally administered with 40 mmol/kg per day of Tyr
下载: 导出CSV
S3. Primer sequences of target genes
Gene name Product length (bp) Primer sequence (5´–3´) ZO-1 192 Forward: CTGCACGATTTCTGCTTCCTC
Reverse: CCTCCATTGCTGTGCTAGTGAOccludin 252 Forward: CTAAATTGGCATCCAGCCCAG
Reverse: TCCTTTCCACTCGGGCTCAPlakophilin-1 274 Forward: ACTATGACTGCCCACTCCCT
Reverse: CCTGATTCCCGCACCACATCβ-actin 101 Forward: TGTCCACCTTCCAGCAGATGT
Reverse: AGCTCAGTAACAGTCCGCCTAGA
下载: 导出CSV
S4. PICTUSt predicted KEGG pathways of the gut microbial community in different groups
Function type KEGG pathways Relative abundance (%) Control Cd Cd+EDTA Cd+Milk Cd+L-OPs Cd+H-OPs Metabolism Amino Acid Metabolism 7.20 9.23* 8.65 8.84 8.12 7.94# Carbohydrate Metabolism 7.20 8.78* 8.32# 8.34# 7.87# 7.73# Xenobiotics Biodegradation and Metabolism 7.63 7.23 7.42 7.54 7.78 7.72 Lipid Metabolism 8.89 9.12 8.94 8.97 8.83 8.81 Energy Metabolism 4.24 4.94* 4.42# 4.46# 4.34# 4.32# Glycan Biosynthesis and Metabolism 5.08 5.34* 5.28 5.29 5.18 5.14 Metabolism of Cofactors and Vitamins 5.93 5.96 5.88 5.92 5.76# 5.74# Metabolism of Terpenoids and Polyketides 4.66 4.89 4.77 4.82 4.74 4.72 Metabolism of Other Amino Acids 3.81 4.24 4.18 4.14 4.08 3.97# Biosynthesis of Other Secondary Metabolites 5.08 5.17 5.14 5.16 5.12 5.10 Human Diseases Infectious Diseases 0.43 0.41 0.44 0.45 0.42 0.46 Neurodegenerative Diseases 0.24 0.32 0.25 0.26 0.23 0.22 Genetic Information Processing Translation 3.82 4.18* 3.84# 3.92 3.88# 3.83# Folding, Sorting and Degradation 2.96 3.44* 3.21# 3.35 3.18# 3.16# Note. *Significant difference from the control group at P < 0.05. #Significant difference from the Cd-exposed group at P < 0.05.
下载: 导出CSV
S5. Composition and contents of amino acids of OPs and milk (μg/g)
Amino acids Contents in milk Contents in OPs Ala# 3.45 ± 0.14 1499.88 ± 119.08 Cys ND 24.24 ± 10.71 Asp 0.47 ± 0.08 136.22 ± 10.71 Glu 13.98 ± 0.01 1267.78 ± 72.61 Phe*# 2.27 ± 0.05 1652.84 ± 176.83 Gly ND ND His 3.83 ± 0.17 1463.54 ± 86.01 Ile*# 3.86 ± 0.05 8964.73 ± 489.29 Lys* 6.17 ± 0.11 598.17 ± 301.07 Leu*# 4.91 ± 0.11 991.21 ± 26.48 Met*# 0.88 ± 0.01 4899.66 ± 148.11 Asn 6.84 ± 0.02 529.08 ± 63.47 Pro# 3.18 ± 0.08 1409.75 ± 32.95 Gln 1.61 ± 0.04 2327.62 ± 96.69 Arg 1.46 ± 0.02 ND Ser 0.51 ± 0.01 288.53 ± 35.01 Thr* 0.32 ± 0.02 820.61 ± 43.03 Val*# 8.89 ± 0.26 877.9 ± 134.03 Trp 1.69 ± 0.03 1142.69 ± 28.61 Tyr# 6.12 ± 0.27 10236.49 ± 270.07 Total amino acids 70.55 ± 0.91 39131.02 ± 2083.37 Essential amino acid 27.35 ± 0.37 18805.14+1265.91 Hydrophobic amino acids 33.60 ± 0.84 30532.49 ± 1343.91 Note. *Essential amino acid. #Hydrophobic amino acids.
下载: 导出CSV
-
[1] Chunhabundit R. Cadmium exposure and potential health risk from foods in contaminated area, Thailand. Toxicol Res, 2016; 32, 65−72. [2] Rani A, Kumar A, Lal A, et al. Cellular mechanisms of cadmium-induced toxicity: a review. Int J Environ Health Res, 2014; 24, 378−99. [3] He XW, Qi ZD, Hou H, et al. Structural and functional alterations of gut microbiome in mice induced by chronic cadmium exposure. Chemosphere, 2020; 246, 125747. [4] Assefa S, Köhler G. Intestinal microbiome and metal toxicity. Curr Opin Toxicol, 2020; 19, 21−7. [5] Yang JS, Chen W, Sun Y, et al. Effects of cadmium on organ function, gut microbiota and its metabolomics profile in adolescent rats. Ecotoxicol Environ Saf, 2021; 222, 112501. [6] Xiang XW, Zheng HZ, Wang R, et al. Ameliorative effects of peptides derived from oyster (Crassostrea gigas) on immunomodulatory function and gut microbiota structure in cyclophosphamide-treated mice. Mar Drugs, 2021; 19, 456. [7] Zhai QX, Wang G, Zhao JX, et al. Protective effects of Lactobacillus plantarum CCFM8610 against chronic cadmium toxicity in mice indicate routes of protection besides intestinal sequestration. Appl Environ Microbiol, 2014; 80, 4063−71. [8] Zhang XY, Peng ZL, Zheng HN, et al. The potential protective effect and possible mechanism of peptides from oyster (Crassostrea hongkongensis) hydrolysate on triptolide-induced testis injury in male mice. Mar Drugs, 2021; 19, 566. [9] Liu L, Dong WX, Wang SN, et al. Deoxycholic acid disrupts the intestinal mucosal barrier and promotes intestinal tumorigenesis. Food Funct, 2018; 9, 5588−97. [10] Huang LR, Fang ZJ, Gao J, et al. Protective role of L-threonine against cadmium toxicity in Saccharomyces cerevisiae. J Basic Microbiol, 2021; 61, 339−50. [11] Chen WY, Wang M, Zhang JW, et al. Acrolein disrupts tight junction proteins and causes endoplasmic reticulum stress-mediated epithelial cell death leading to intestinal barrier dysfunction and permeability. Am J Pathol, 2017; 187, 2686−97. [12] Zhao YC, Xie B, Gao J, et al. Dietary supplementation with sodium sulfate improves rumen fermentation, fiber digestibility, and the plasma metabolome through modulation of rumen bacterial communities in steers. Appl Environ Microbiol, 2020; 86, e01412−20. -
 22061Supplementary Materials.pdf

-

 点击查看大图
计量
- 文章访问数: 1087
- HTML全文浏览量: 471
- PDF下载量: 92
- 被引次数: 0

 Quick Links