-
The pervasive utilization of industrial substances has escalated human exposure to cadmium (Cd), a metal associated with long-term negative health outcomes such as renal dysfunction, neurological disorders, and various cancers[1]. Once ingested by humans, Cd interacts with cysteine-rich metallothioneins (MTs) which have metal-binding and antioxidant properties and is subsequently transported to the kidney[2]. Several isoforms of MTs exist, including MT1 (encompassing MT1A, MT1B, MT1E, MT1F, MT1G, MT1H, MT1M, and MT1X), MT2 (specifically MT2A), MT3, and MT4, all of which are located on chromosome 16q13. Actually, these isoforms exhibit tissue-specific and cell-specific alternative splicing, leading to differences in expression efficiency[3]. MT1A upregulation has been observed to reestablish mitochondrial functionality and decrease ROS generation in Parkinson’s disease cell culture models[4]. In addition, antioxidants have been demonstrated to guard human keratinocytes from Cd-induced apoptosis by amplifying MT2A mRNA levels[5]. However, the precise mechanism regarding how specific MT isoforms operate in Cd-induced kidney injury remains to be elucidated.
Specifically, metallothionein 1E (MT1E), a variant of the MT1 isoforms, has been recognized as a prognostic indicator for cancers such as thyroid carcinoma and malignant melanoma[6,7]. Its operational role in cancer is diverse and largely depends on the specific type of cancer and its cellular environment. The potential protective capacity of MT1E against Cd-induced renal damage, juxtaposed with its carcinogenic risk, is yet to be clarified.
Of note, the proximal tubular epithelium, due to its active role in Cd reabsorption and vulnerability to oxidative stress, is primarily affected by Cd-induced nephrotoxicity. Hence, this study introduced a stable MT1E overexpression in the human proximal tubular epithelial cell line (HK-2) to investigate its impact on renal toxicity post-Cd exposure, with an aim to propose theoretical countermeasures against Cd-related renal cytotoxicity.
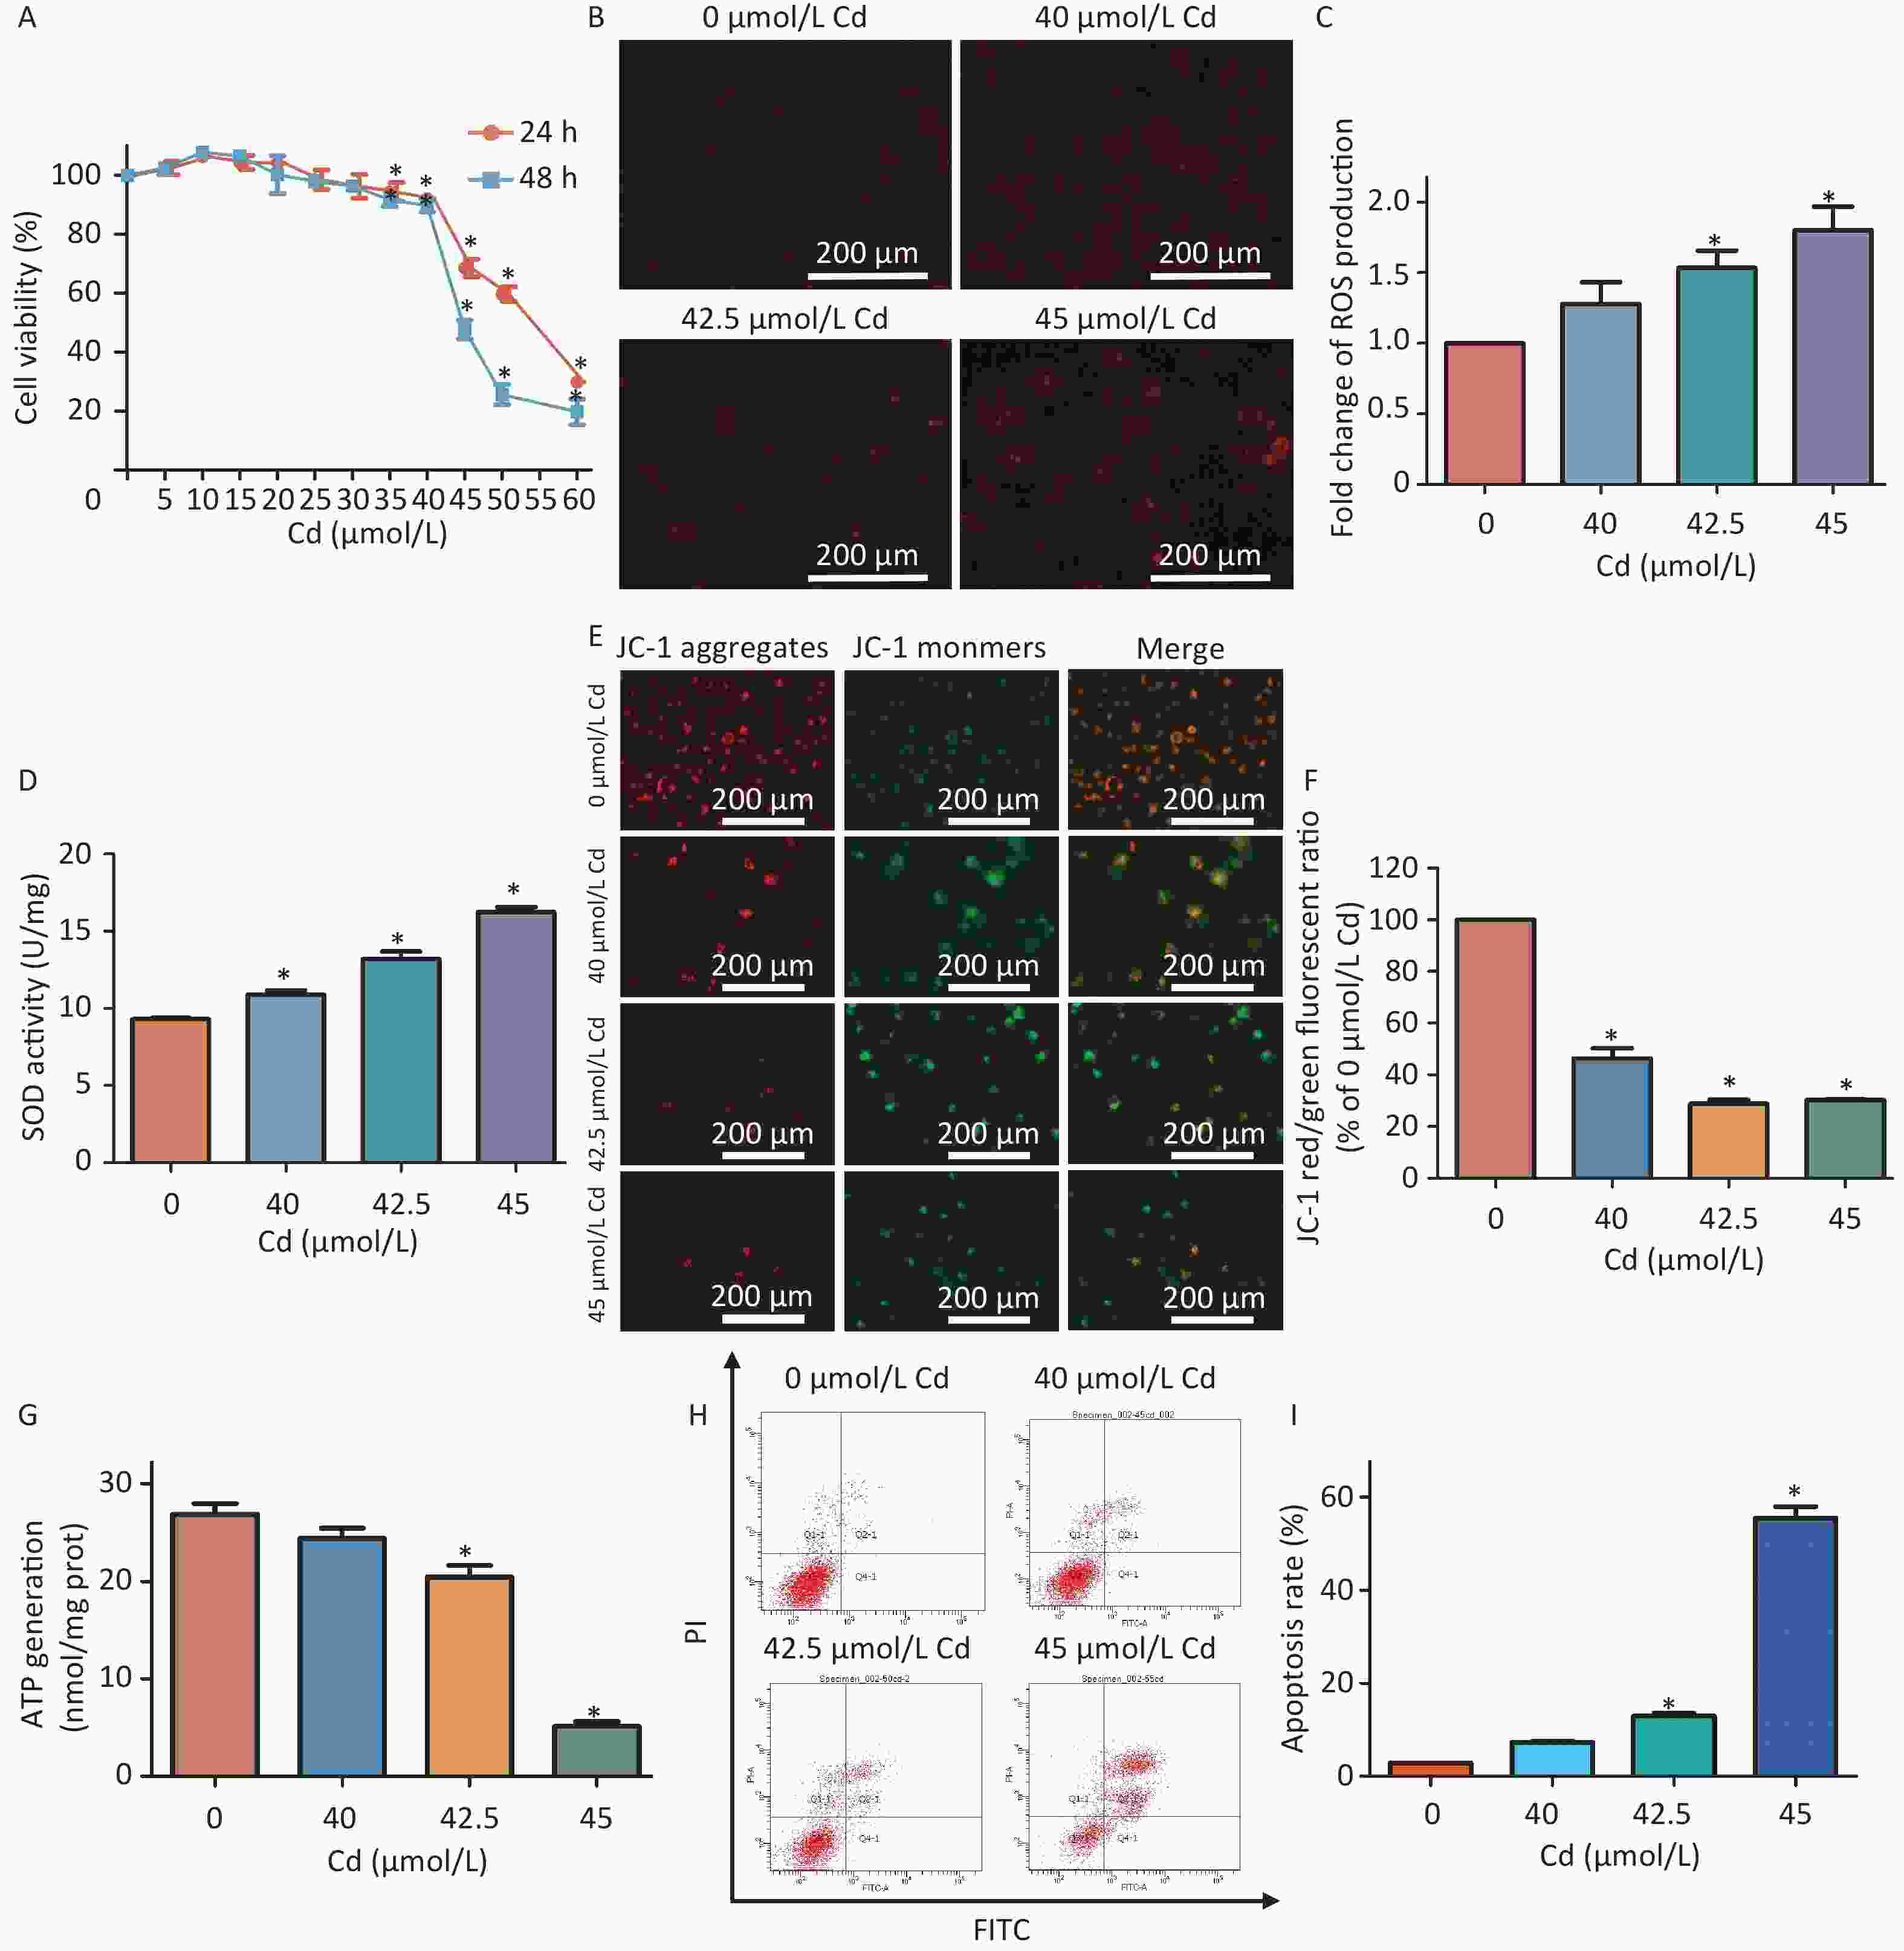
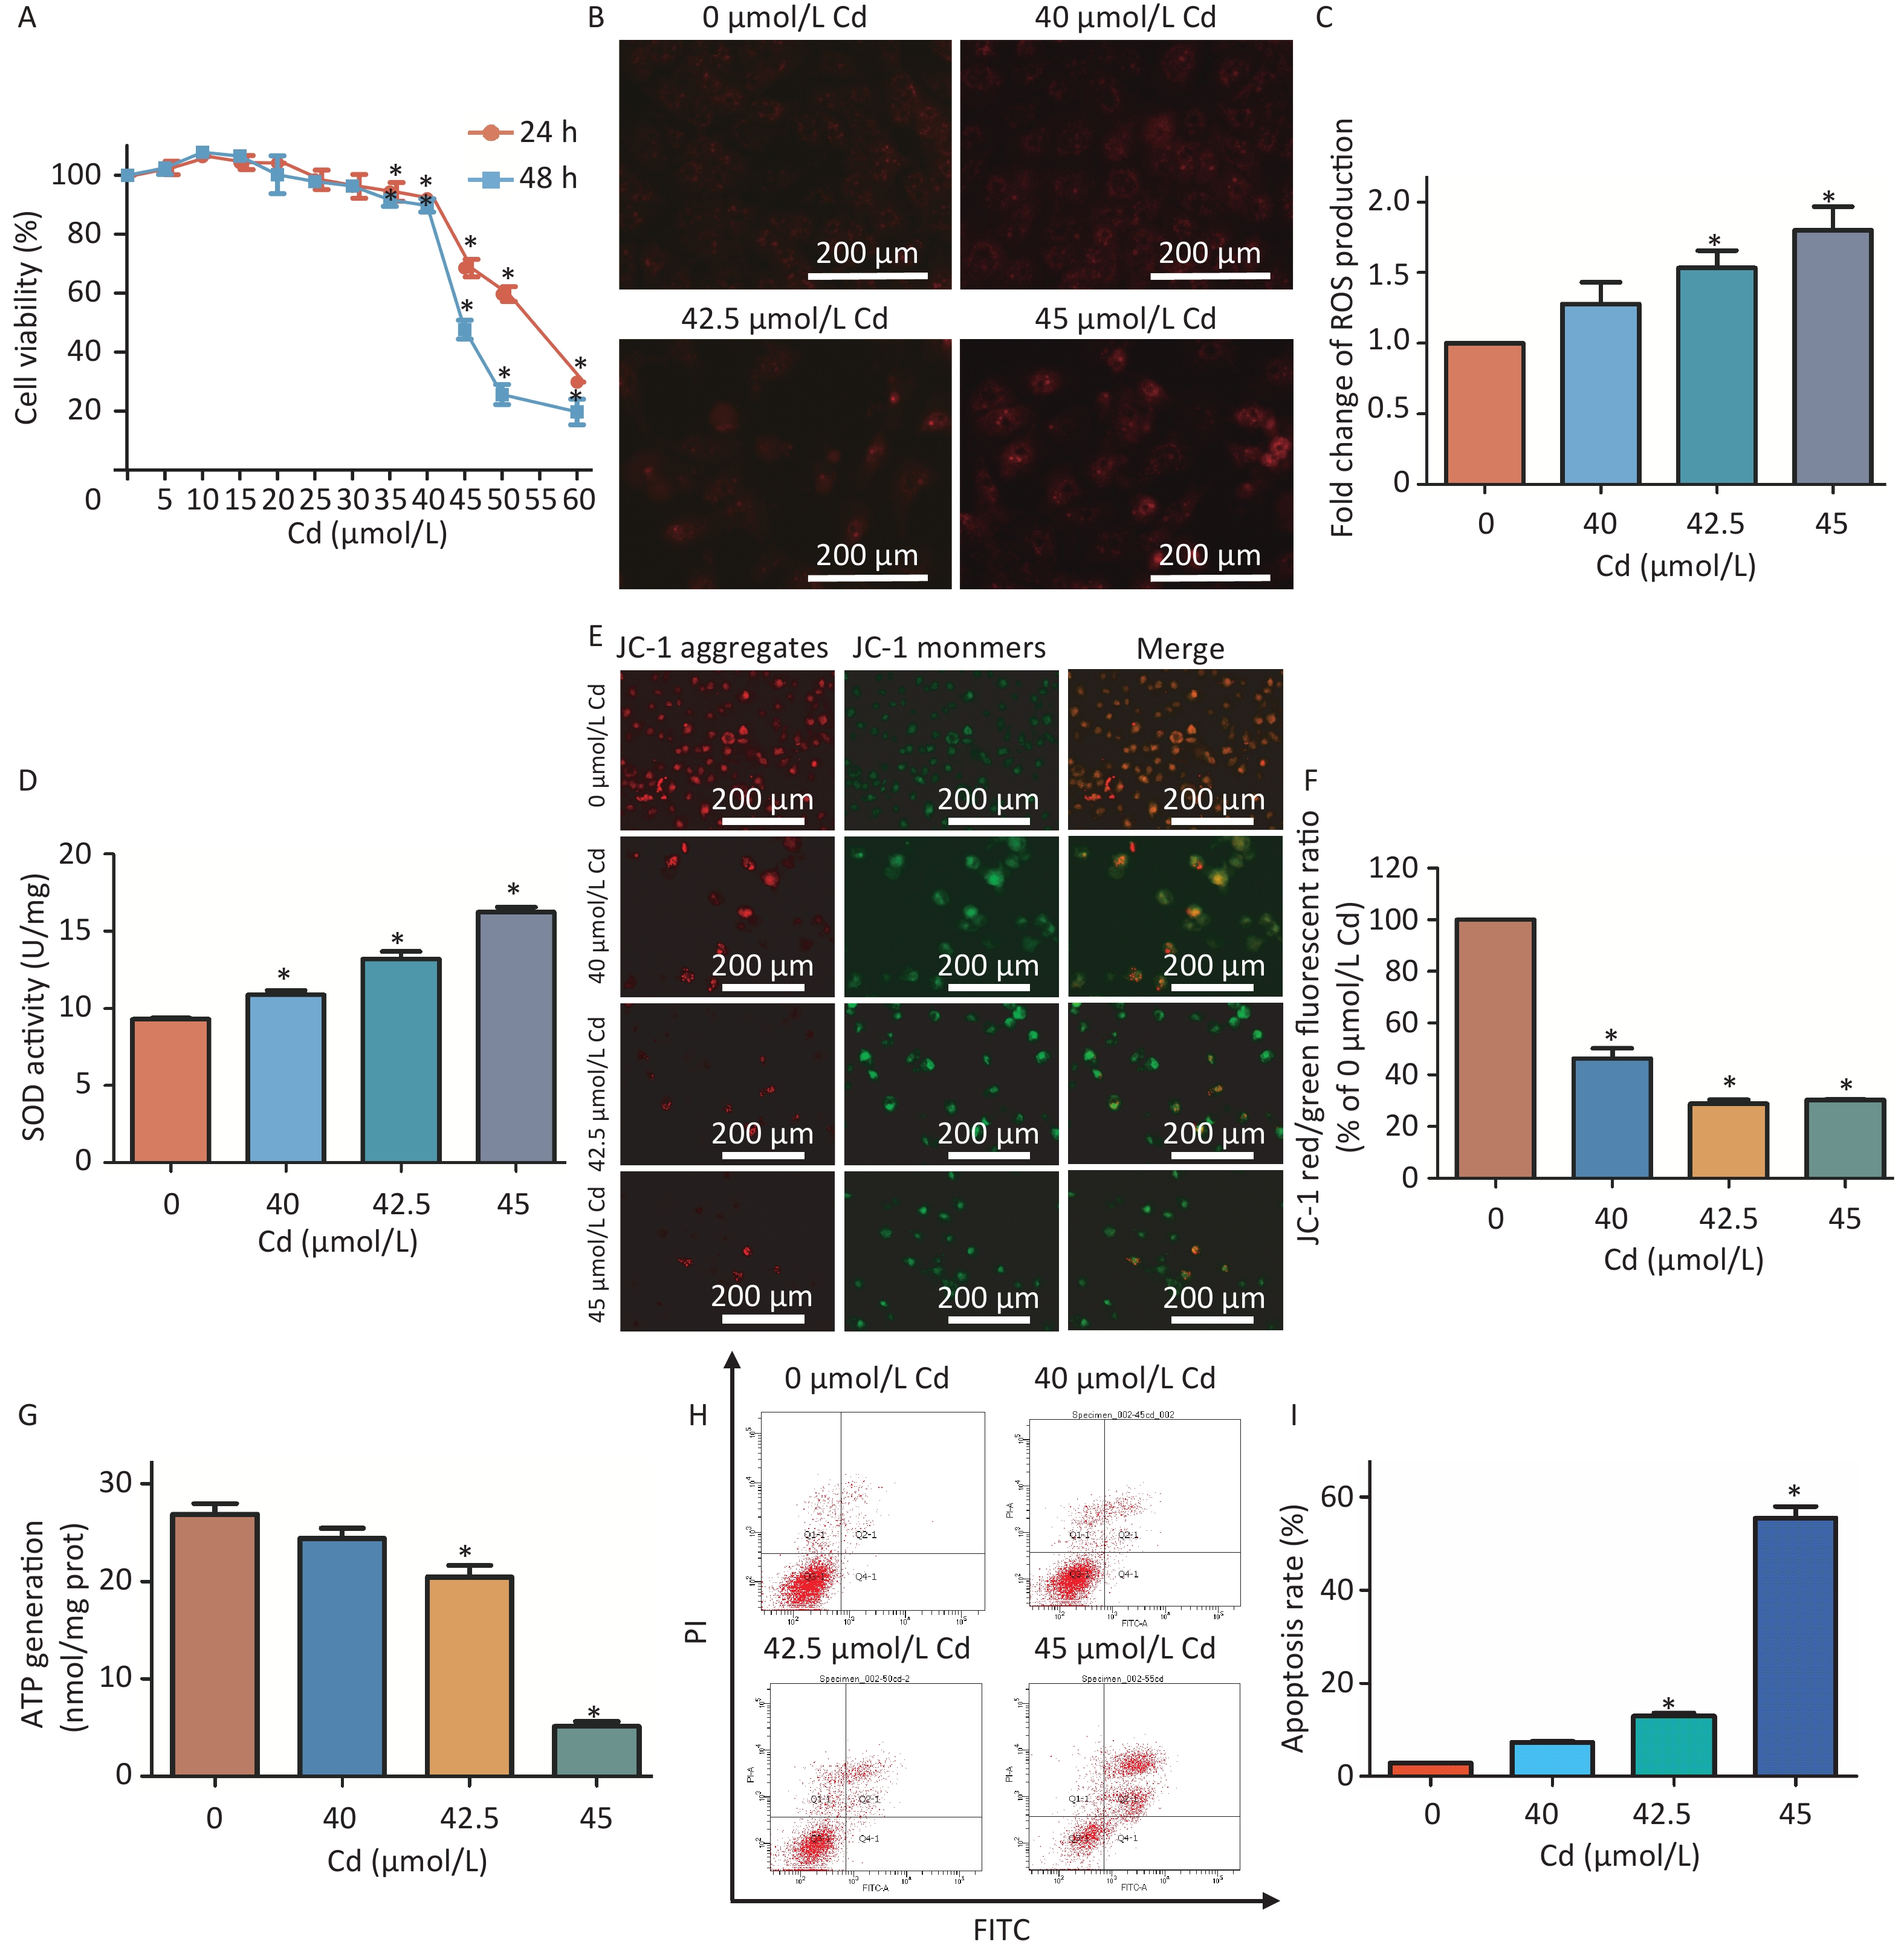
Experimental data revealed that increasing concentrations of Cd (ranging from 0–60 μmol/L) progressively inhibited HK-2 cell viability (Supplementary Figure S1A, available in www.besjournal.com). Cd-induced oxidative stress manifested through elevated reactive oxygen species (ROS) production and heightened antioxidant activity of the superoxide dismutase (SOD) enzyme (Supplementary Figure S1B–D). Concurrently, a noticeable reduction in mitochondrial membrane potential and ATP generation was observed in the Cd-treated groups relative to controls (Supplementary Figure S1E–G). Exposure to 42.5 μmol/L and 45 μmol/L of Cd further instigated an increase in mitochondria-dependent apoptosis (Supplementary Figure S1H–I).
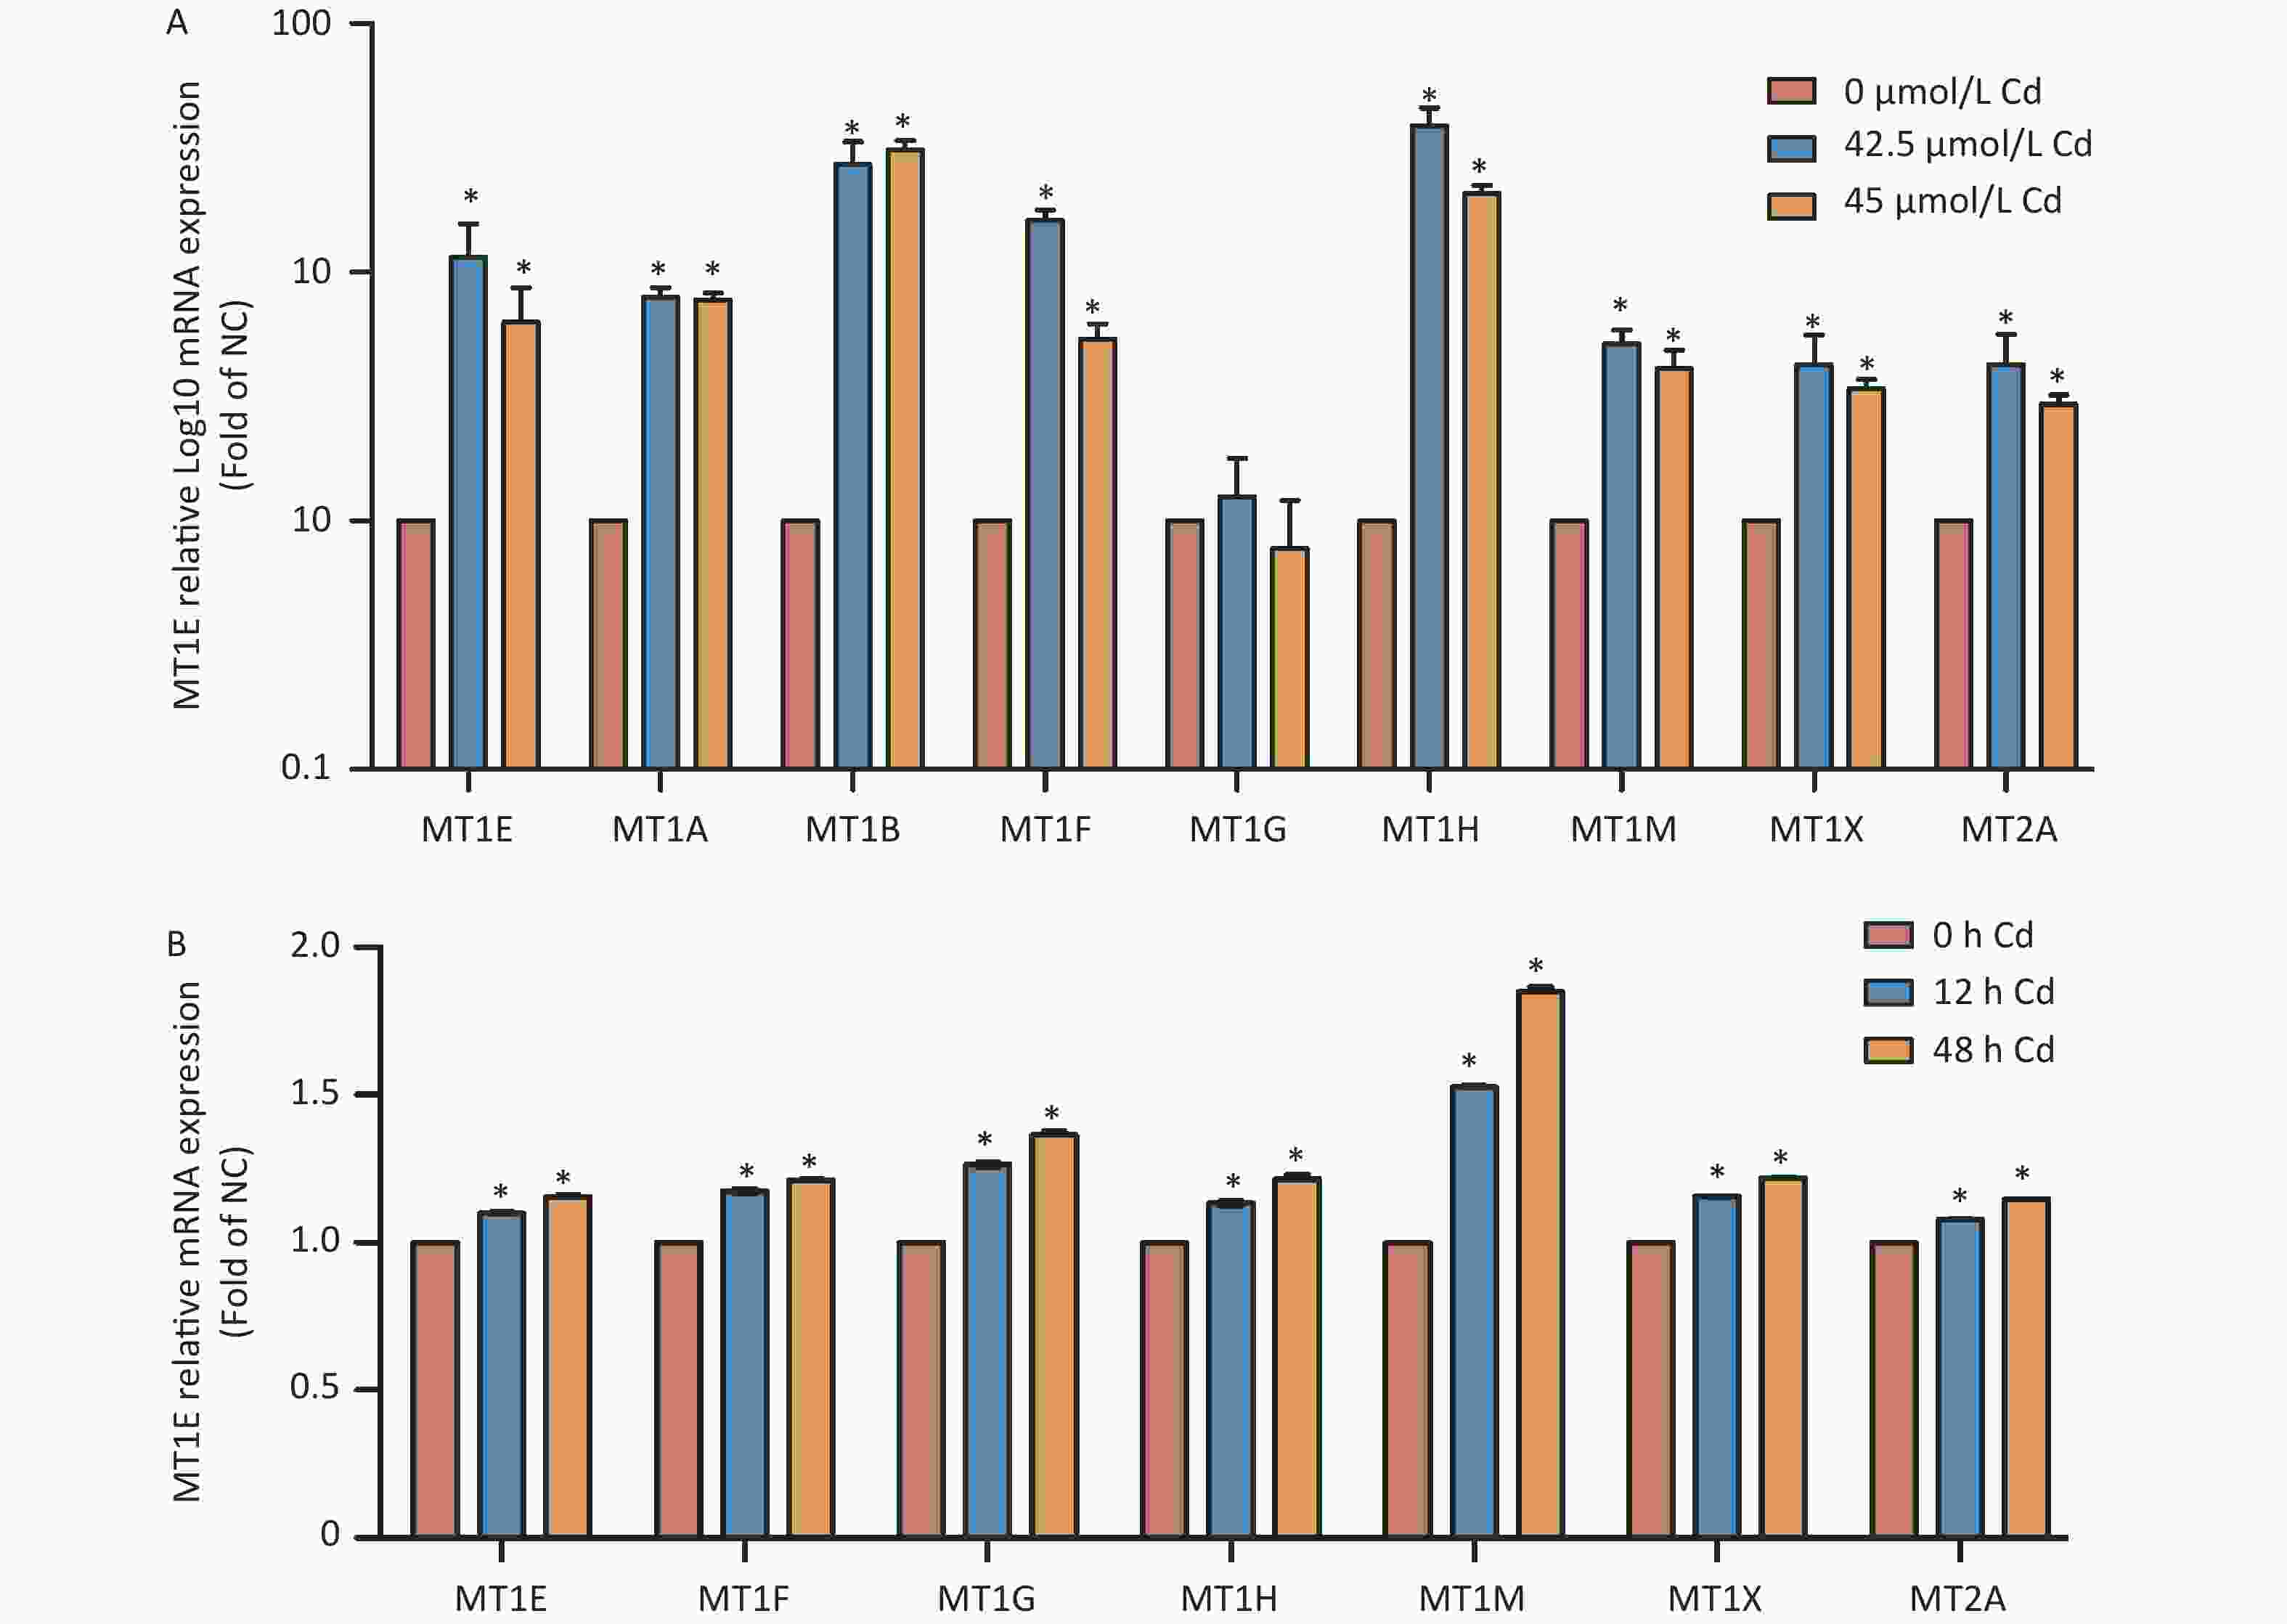
It is known that MTs modulate metal ion balance and influence cellular proliferation and differentiation. Despite their protective role against Cd-induced nephrotoxicity, the specific function of individual MTs isoforms in relation to Cd remains uncertain. An initial assessment revealed changes in the mRNA expression of MT isoforms post-Cd exposure. Except for MT1G, a surge in mRNA expression levels of MT isoforms was noted in Cd-treated HK-2 cells (Supplementary Figure S2A, available in www.besjournal.com). Bioinformatics data, sourced from the Gene Expression Omnibus database (GSE27211, www.ncbi.nlm.nih.gov/geo), indicated an up-regulation in mRNA expression for all MT isoforms in HK-2 cells subjected to Cd treatment for both 12 h and 48 h durations (Supplementary Figure S2B). Based on these findings, discerning which isoform is most affected by Cd exposure is challenging. This prompted a closer examination of the relationship between MT isoforms and kidney cancer, the eventual consequence of prolonged Cd-induced renal injury.
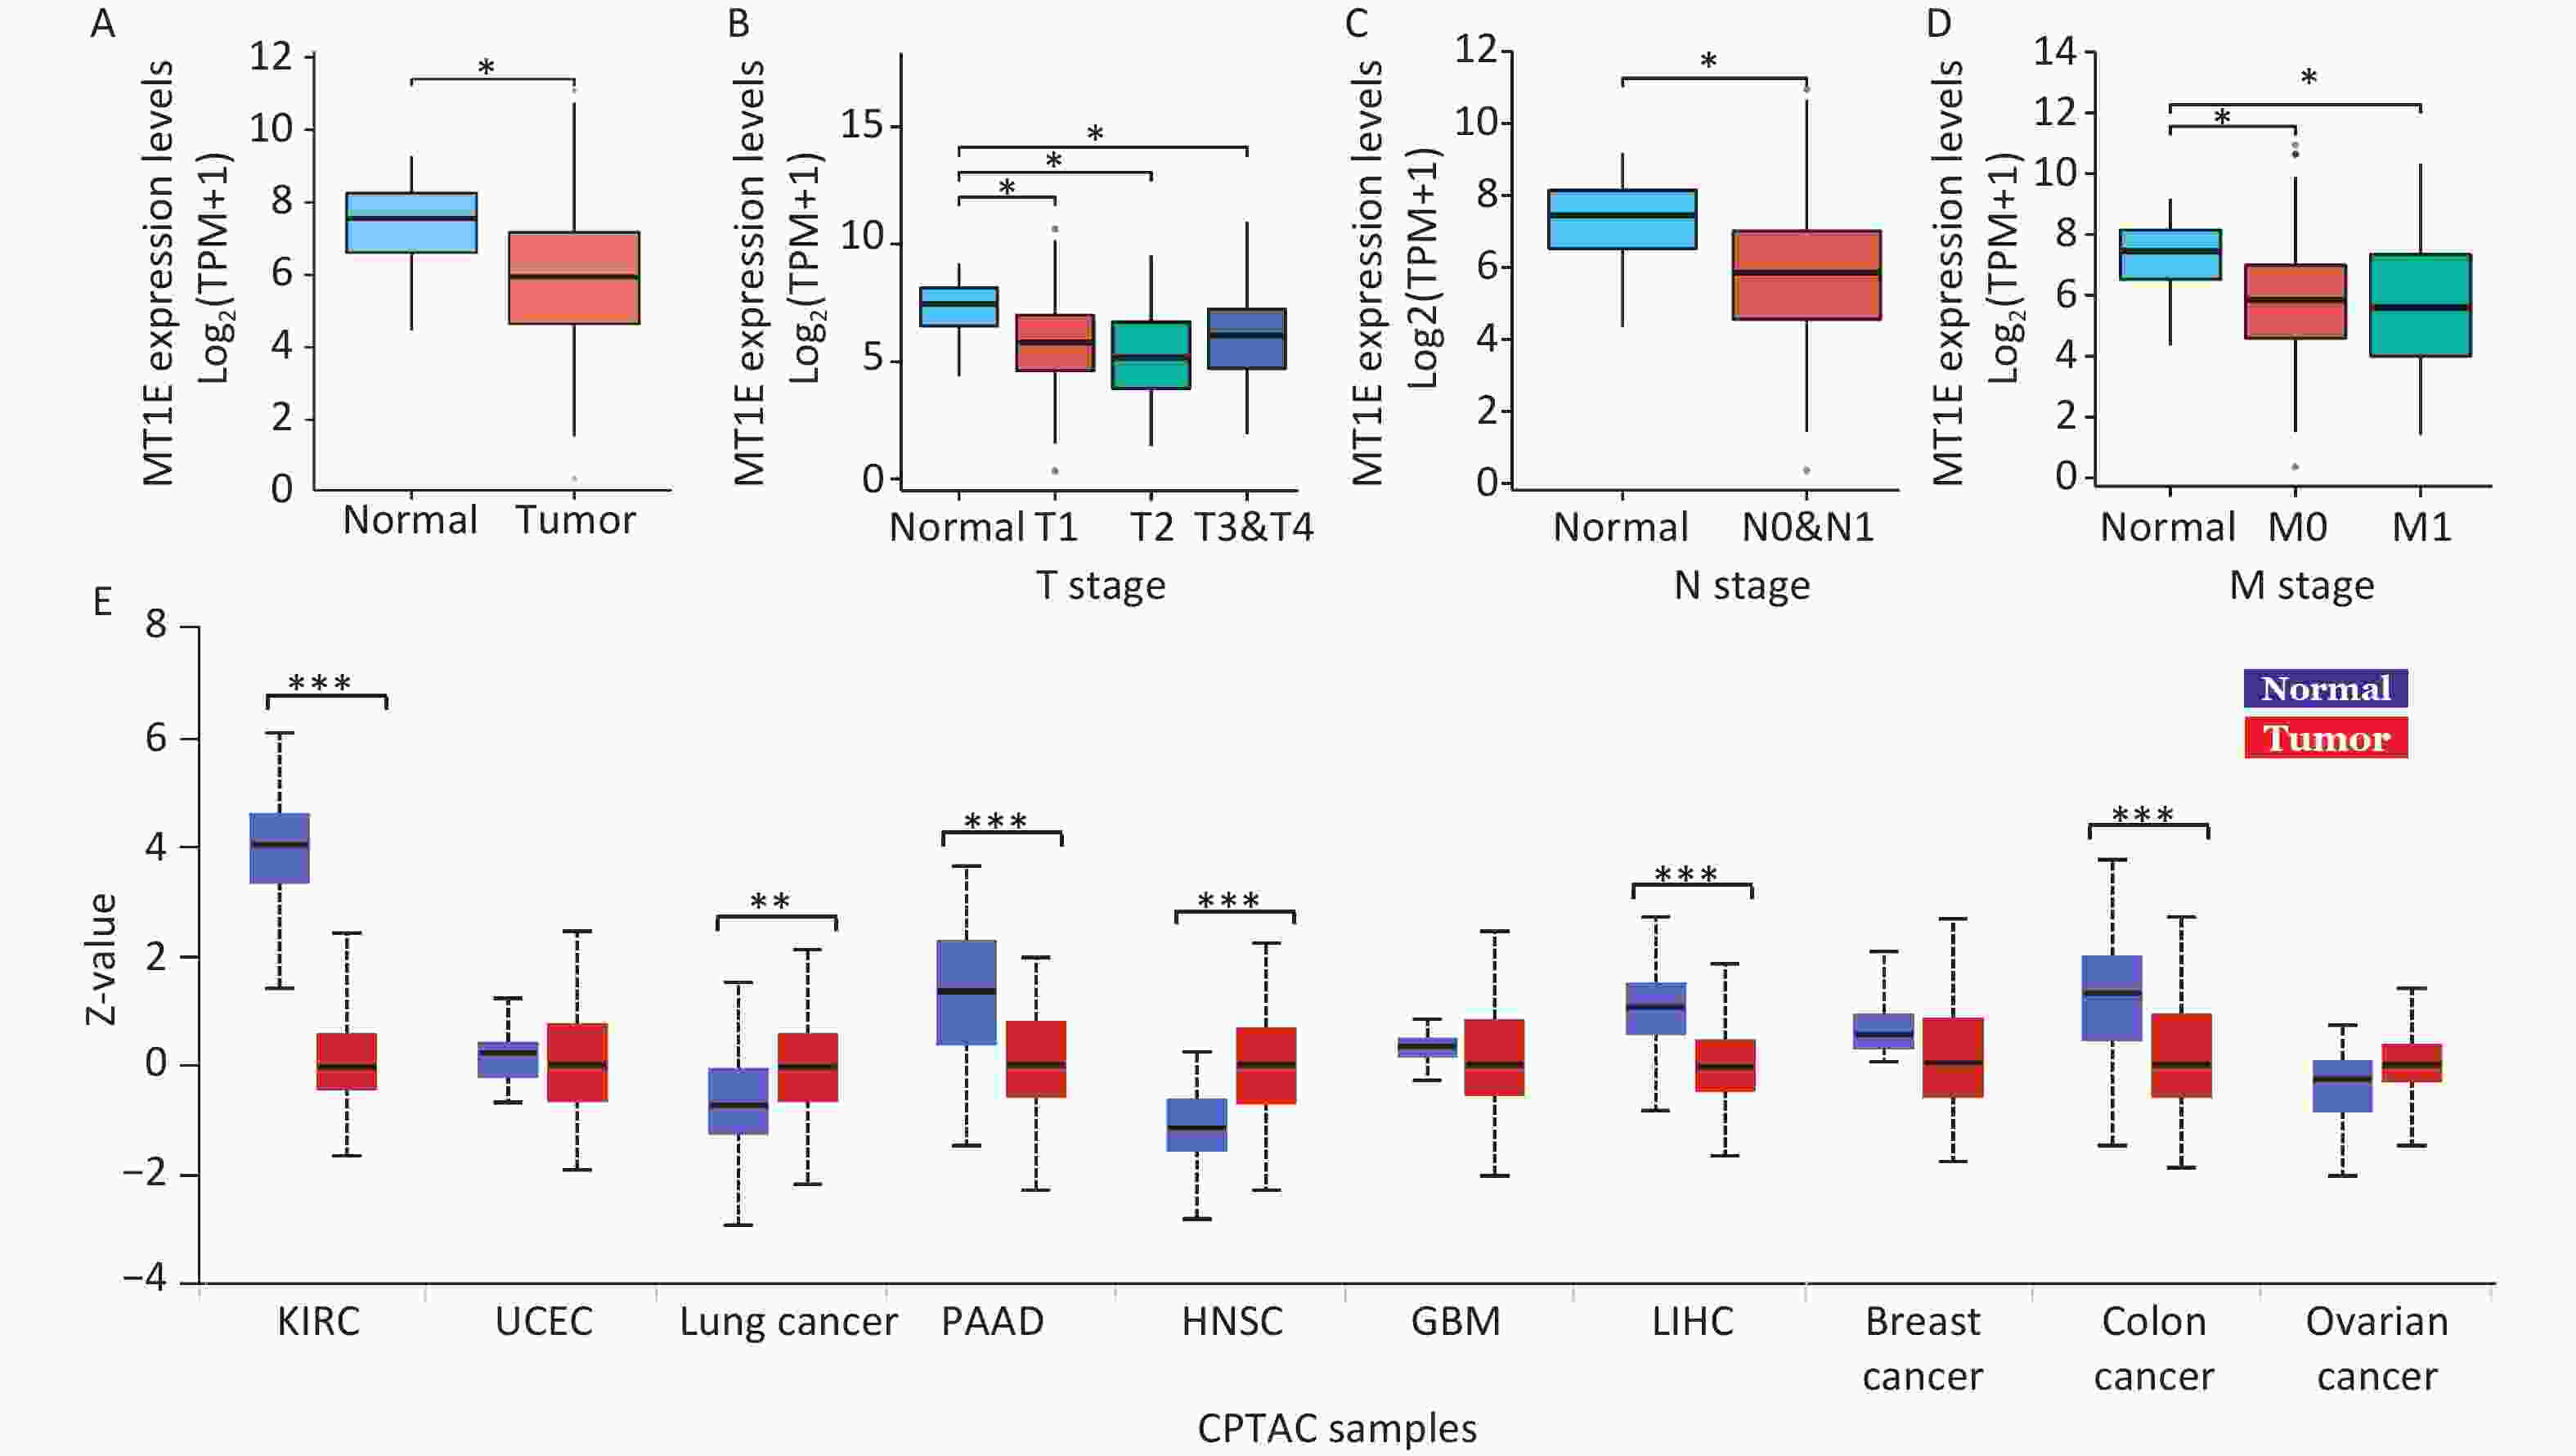
Within the MTs isoforms, MT1E has recently been implicated in both the tumorigenesis and prognosis of kidney cancer. Decreased MT1E mRNA expression has been attributed to elevated MT1E promoter methylation in clear cell renal cell carcinoma[8]. An RNA-seq assay utilizing a kidney renal clear cell carcinoma (KIRC) cohort highlighted a notable down-regulation of MT1E in KIRC samples in comparison to normal kidney tissues (Supplementary Figure S3A, available in www.besjournal.com). Furthermore, a decline in the MT1E signature was observed in kidney cancer patients with advanced TNM stages relative to controls (Supplementary Figure S3B–D). Data from the Clinical Proteomic Tumor Analysis Consortium (CPTAC) also indicated diminished MT1E protein expression in KIRC samples (Supplementary Figure S3E). These observations collectively suggest a tumor-suppressive role for MT1E in kidney cancer, making it relevant in Cd-induced kidney injuries.
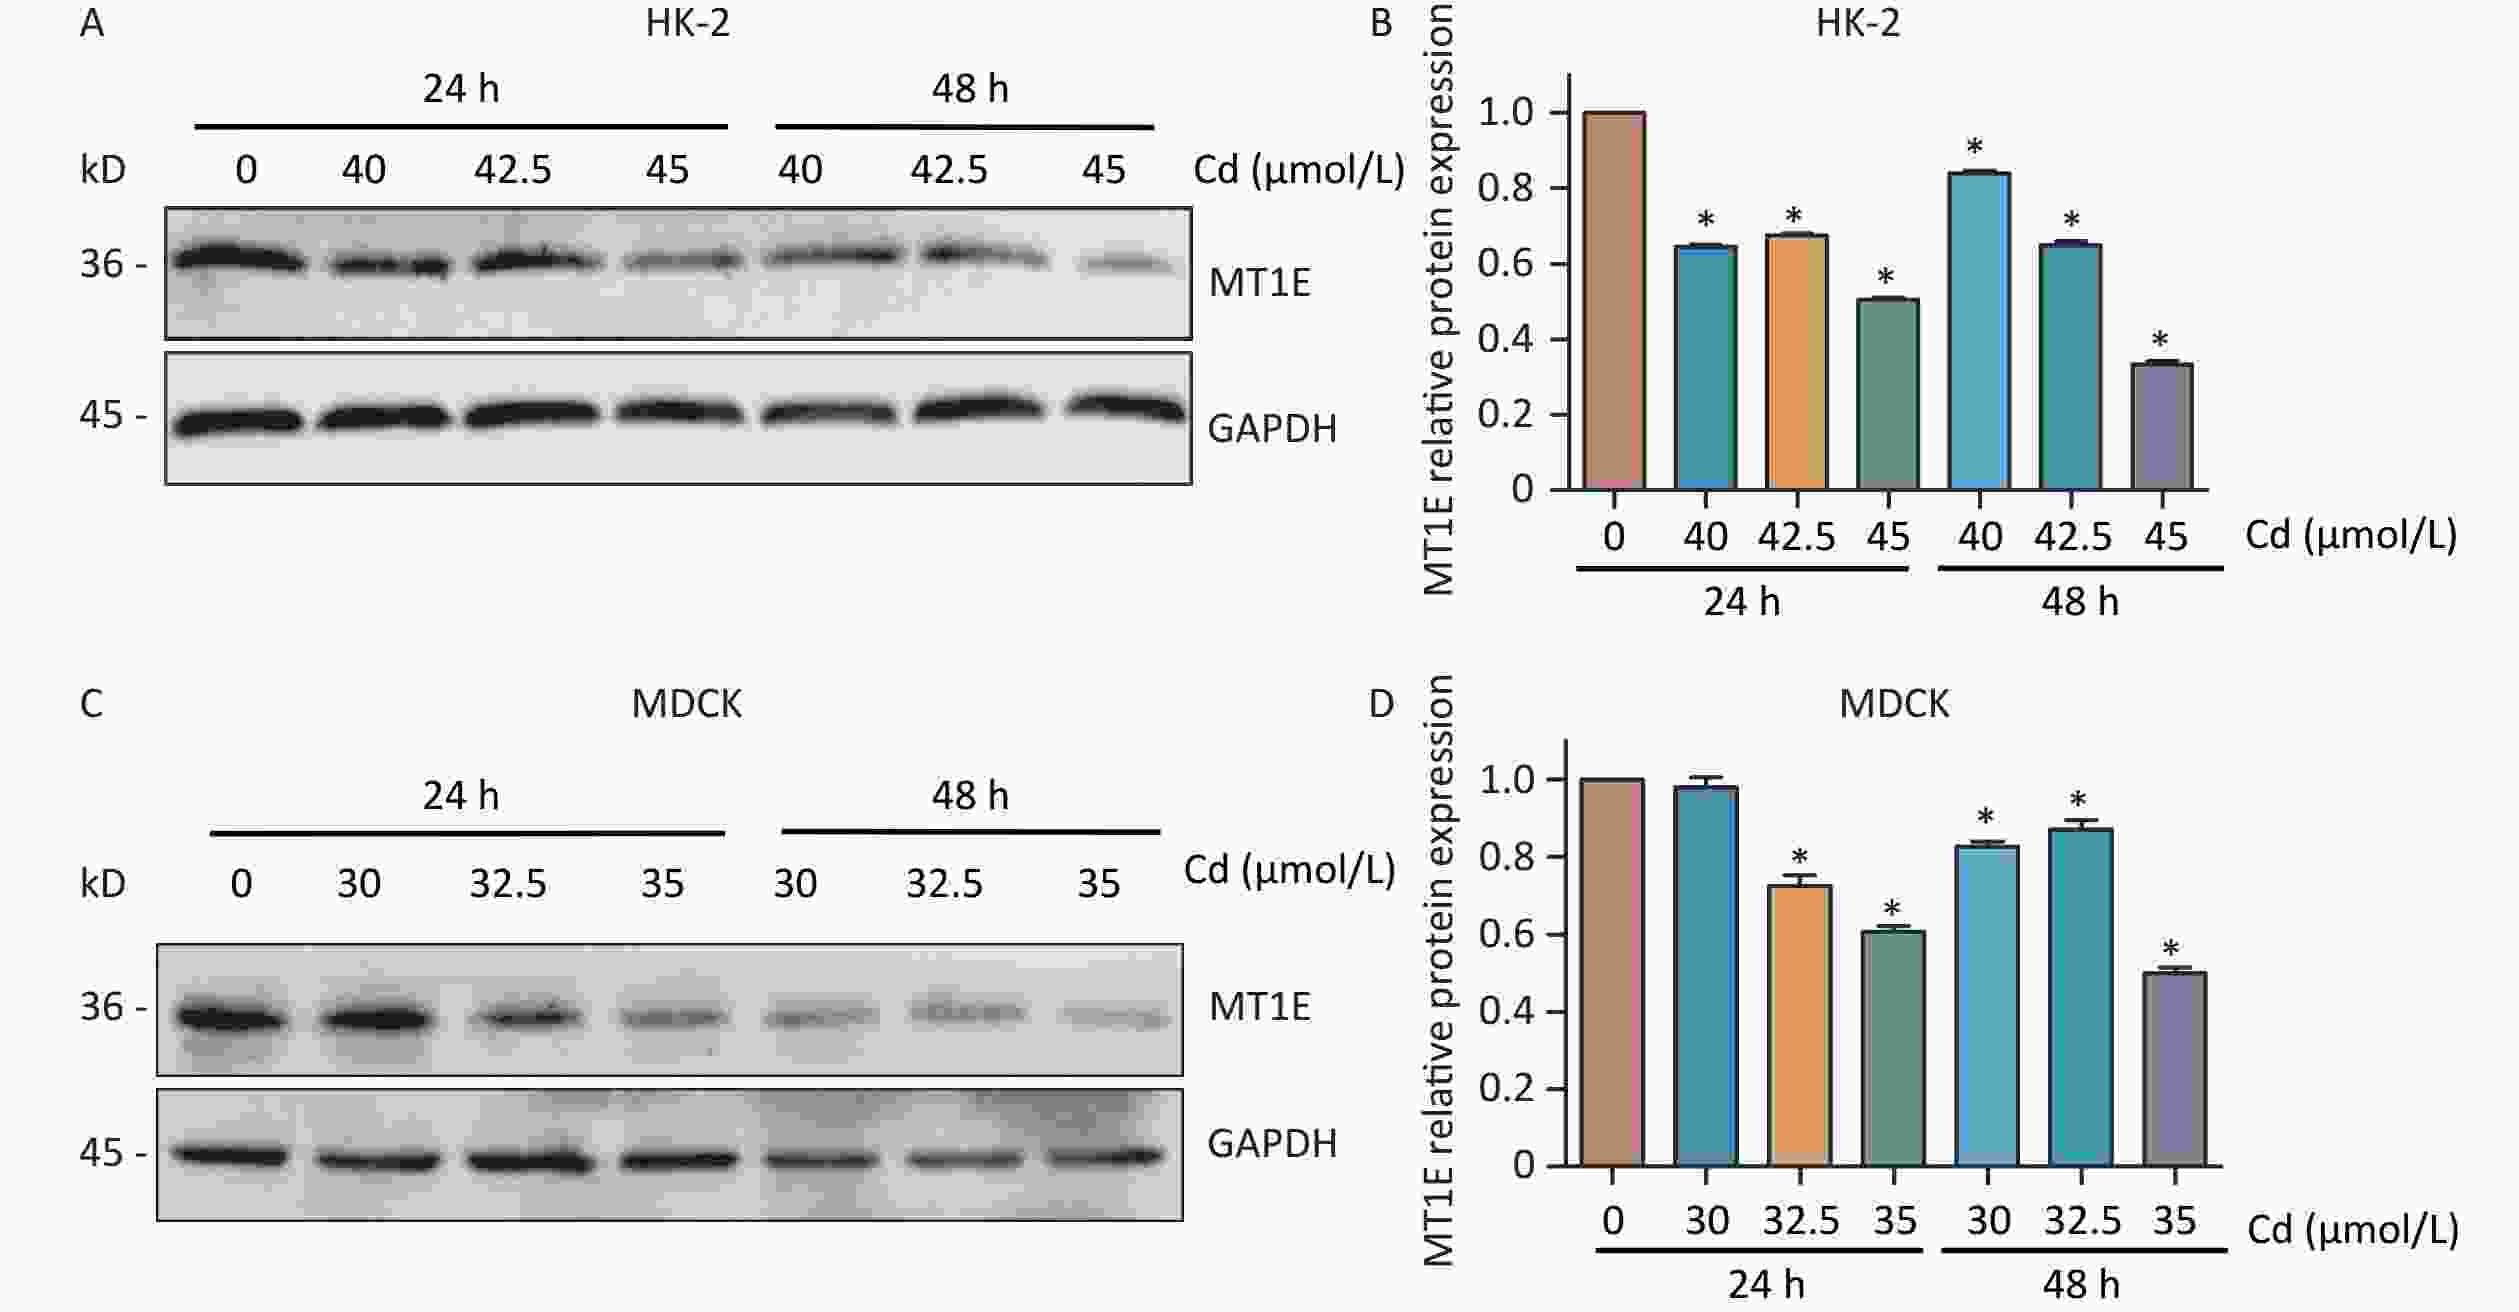
The changes of MT1E expression differs in different organs of the human body after metal exposure. The osteoporosis patients exposed to heavy metals had significantly decreased MT1E mRNA expression in plasma[9]. Interestingly, despite the upregulation of MT1E mRNA content observed in the RT-PCR assay (Supplementary Figure S2A), a decline in MT1E protein expression was noted in both HK-2 cells and Madin-Darbey Canine Kidney (MDCK) cells, occurring in both time- and dose-dependent manners, even with the mRNA increase in HK-2 cells (Figure 1A–D). This discrepancy could be attributed to the higher affinity of the MT1E antibody for the unbound MT1E protein compared to the Cd-MT1E complex. Thus, it’s postulated that MT1E remains bound with Cd post entry into HK-2 cells, and free MT1E protein may mitigate Cd-induced renal cytotoxicity.
To elucidate the underlying mechanism of MT1E's protective role against Cd cytotoxicity, we established an MT1E overexpression cellular model. HK-2 cells were transfected using the recombinant lentivirus LV-5 (EF-1a/CopGFP & Puro) vector as a control (LV-NC) or with MT1E overexpression (LV-MT1E) lentiviral supernatants. The overexpression of wild-type MT1E in HK-2 cells was confirmed through RT-PCR and Western blot assays (Supplementary Figure S4A–C, available in www.besjournal.com). Upon Cd treatment (40-60 μmol/L), the viability of LV-MT1E cells exceeded that of the control-plasmid transfected group (LV-NC), suggesting that MT1E overexpression could counteract Cd-induced renal cytotoxicity (Figure 2A). ROS production was observed to be decreased in LV-MT1E cells treated with 50 μmol/L Cd for 48 h when juxtaposed with LV-NC cells under identical conditions (Figure 2B–C). Concurrently, elevated SOD enzyme activity was noted in the LV-NC group compared to the LV-MT1E group, indicating that MT1E overexpression relieved Cd-induced oxidative stress (Figure 2D). Given that oxidative stress can directly instigate DNA damage, the effects of MT1E overexpression on Cd-induced DNA damage were further analyzed by assessing the formation of the DNA damage marker γH2AX foci. Cells exhibiting pronounced γH2AX foci were diminished in the LV-MT1E group treated with 50 μmol/L Cd relative to the LV-NC group subjected to the same treatment (Figure 2E–F).
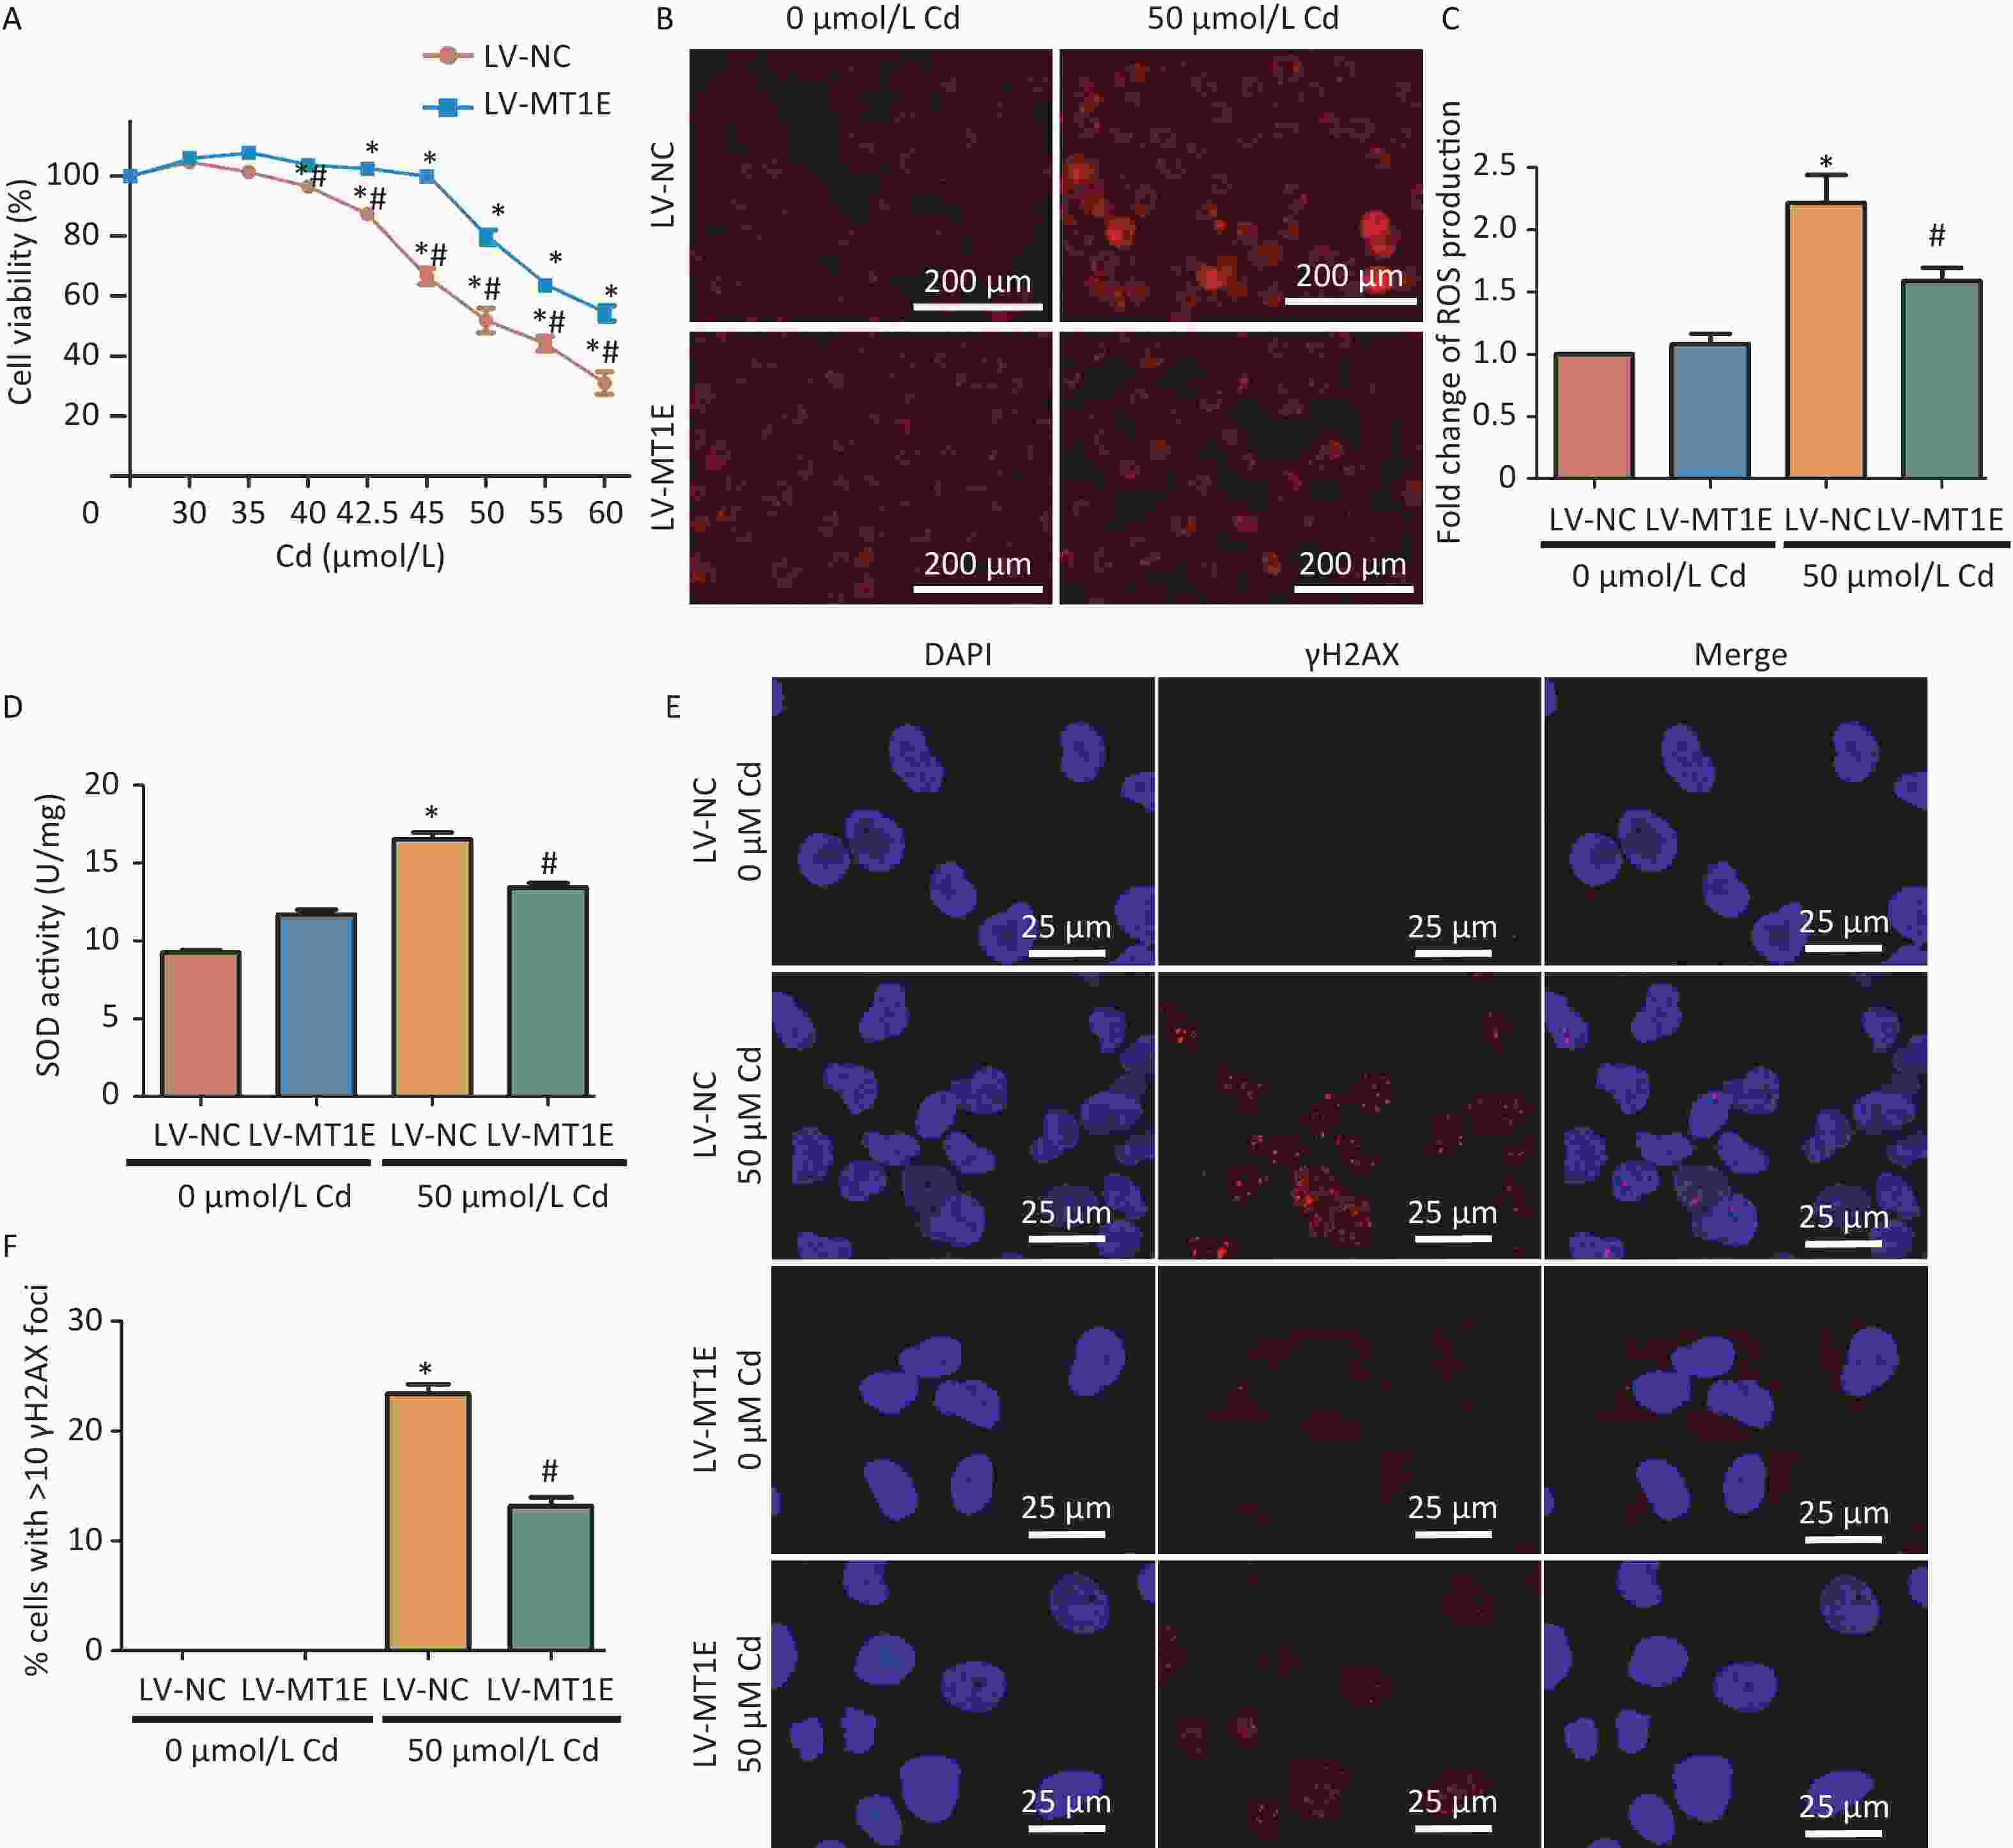
Figure 2. Assessment of oxidative stress and DNA damage in Cd-treated HK-2 cells with LV-MT1E expression.
Additionally, a comparative study of mitochondrial function between LV-NC and LV-MT1E cells post-Cd treatment revealed a diminished mitochondrial membrane potential in Cd-treated LV-NC cells. However, MT1E overexpression in the LV-MT1E group restored this potential post Cd treatment (Figure 3A–B). In light of the potential mitochondrial damage induced by Cd, intracellular ATP production was also assessed. ATP production in LV-MT1E cells exposed to Cd markedly surpassed that of LV-NC cells post Cd exposure (Figure 3C).
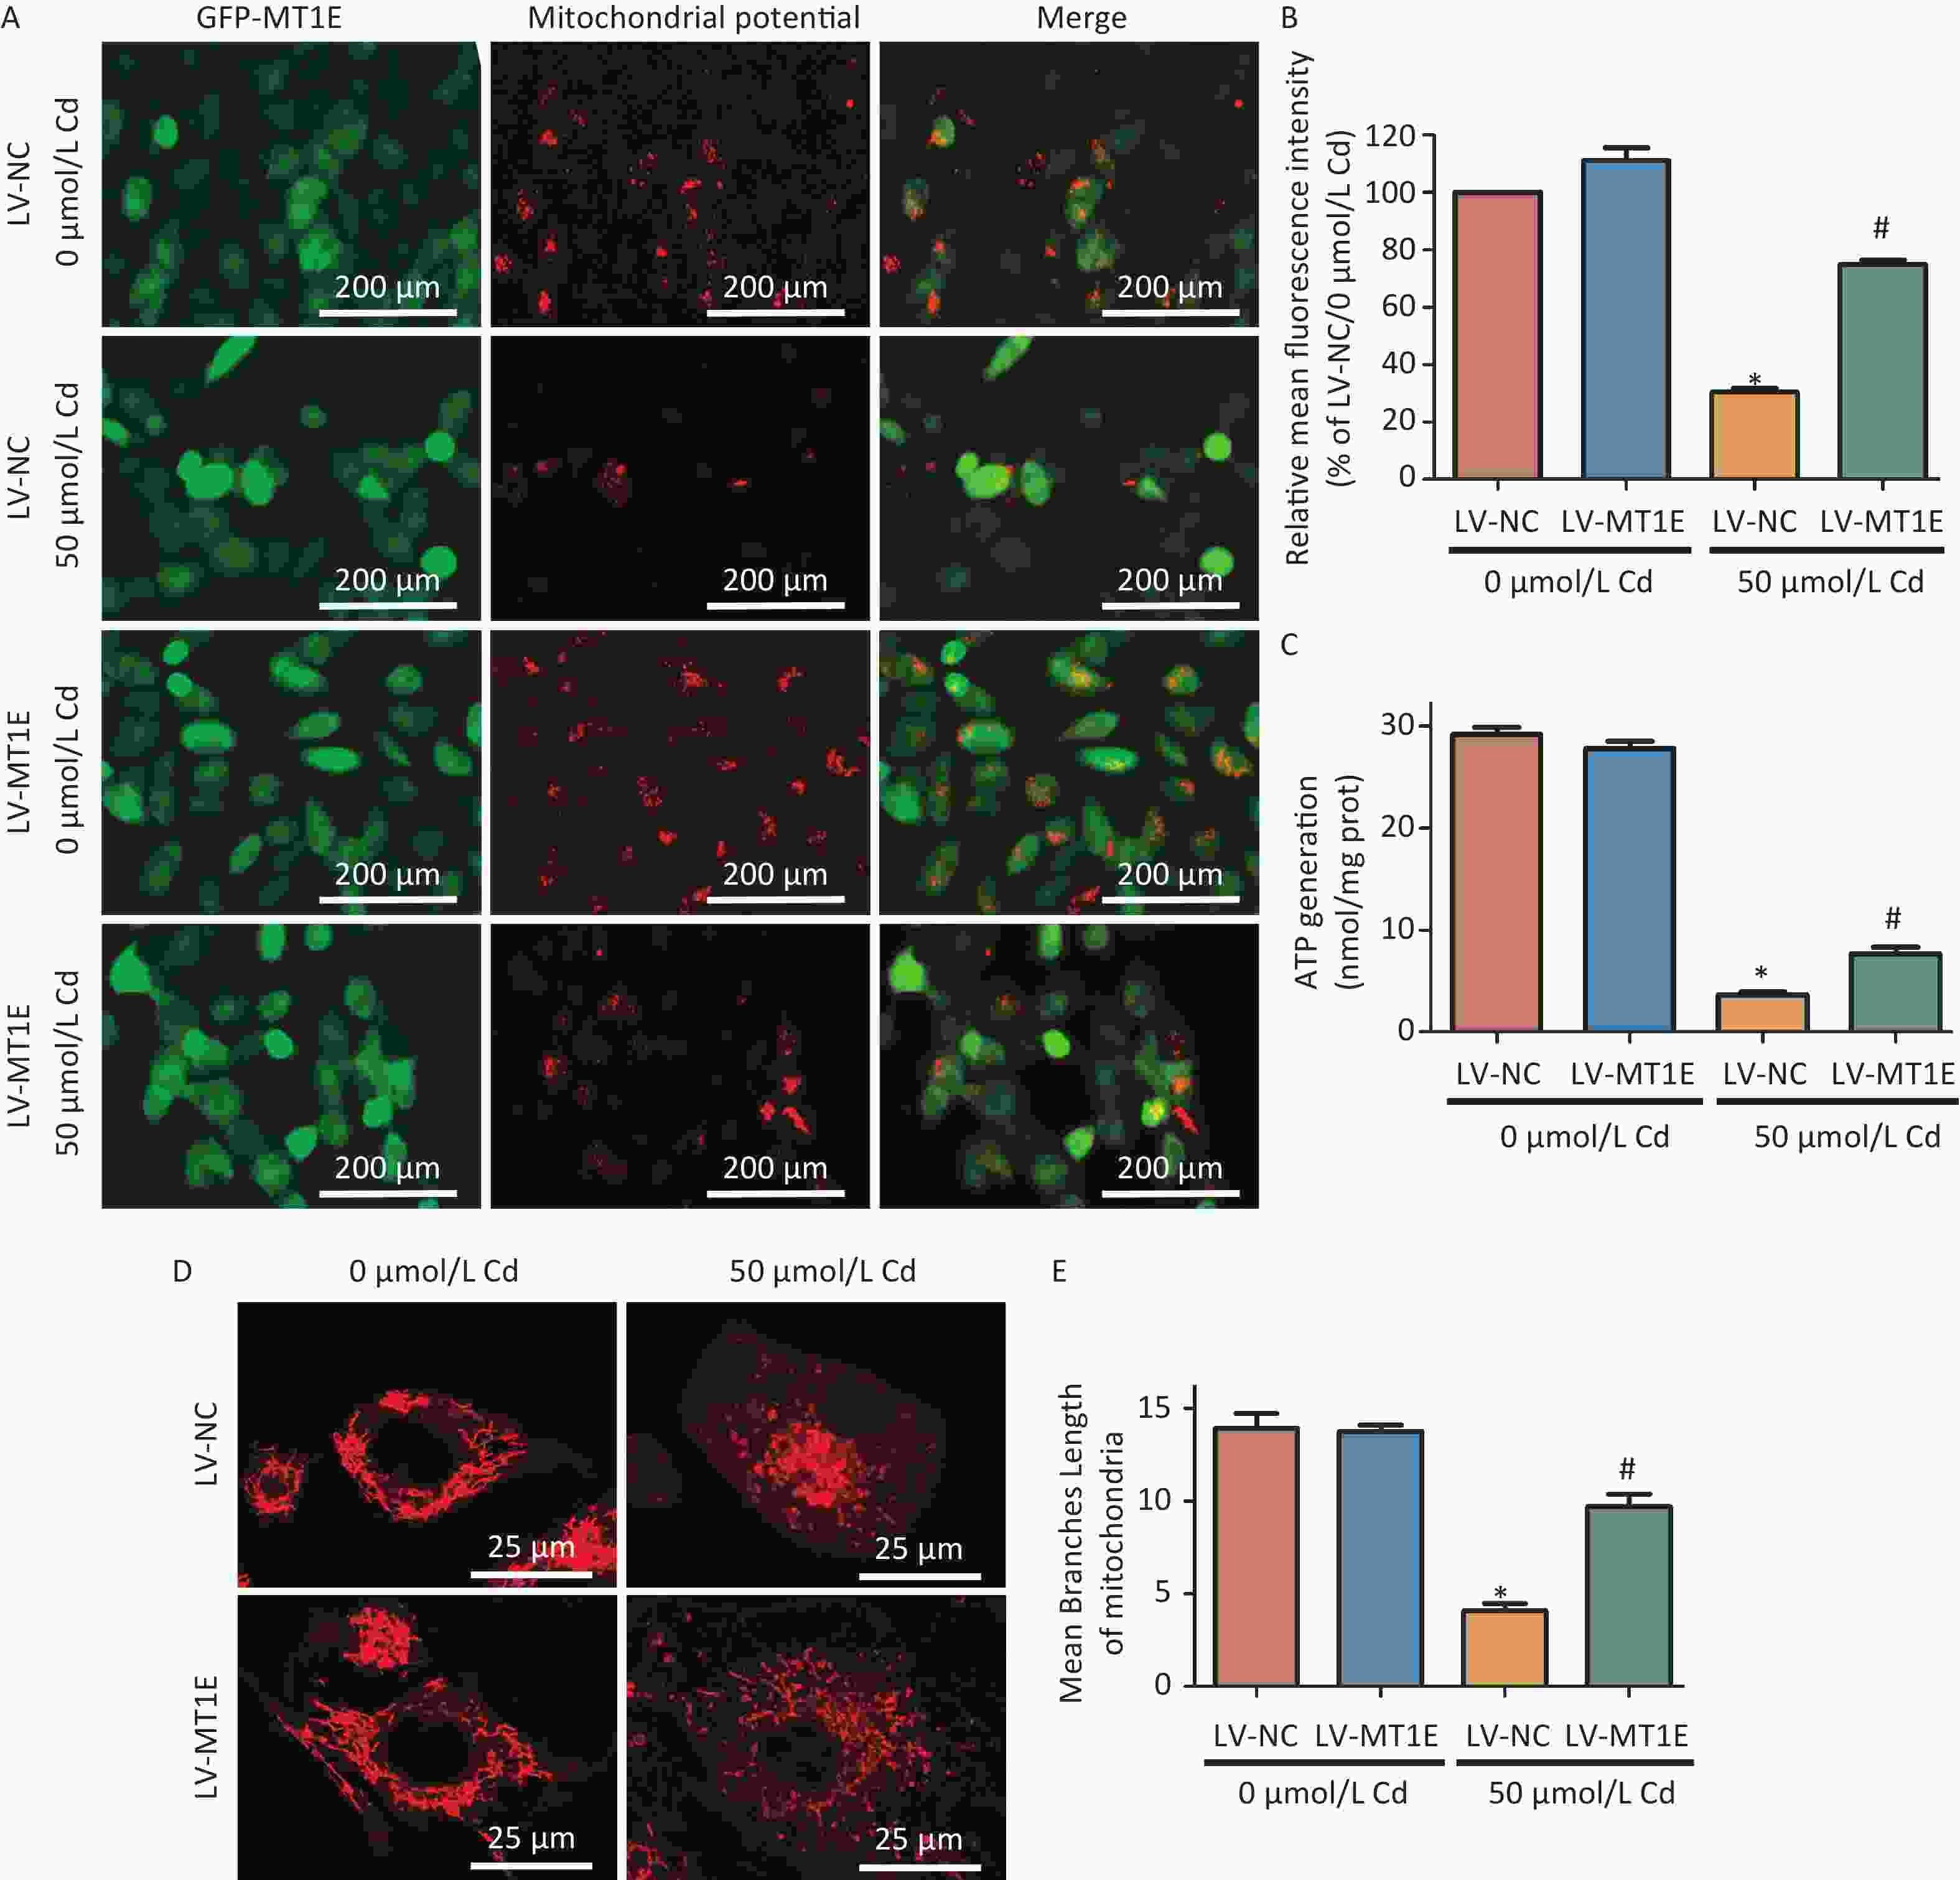
Figure 3. Analysis of mitochondrial morphology and function in HK-2 cells post combined treatment with LV-MT1E and Cd.
Prior research indicates that Cd facilitates the translocation of dynamin-related protein 1 (Drp1) to mitochondria, leading to mitochondrial fission and an imbalance in mitochondrial dynamics[10]. We further examined mitochondrial morphological alterations in MT1E-overexpressing cells. Utilizing the MiNA script for mitochondrial network analysis within the Fiji software, we identified a transition from the typical tubular mitochondrial configuration to a more granulated morphology post Cd exposure. Overexpression of MT1E rectified the mitochondrial fission and the reduced median branch length prompted by Cd treatment (Figure 3D–E). The specific mechanisms, whether they involve the curtailment of mitochondrial fission, activation of mitophagy, or a combination of both, have yet to be discerned. This constitutes a limitation of our study and merits subsequent exploration.
To summarize, this research elucidates the counteractive mechanism of the MT1E isoform, a specific MTs variant, against Cd-induced renal toxicity. Cd induces oxidative injury and apoptosis in HK-2 cells. Upon MT1E incorporation into renal cells, its binding to Cd leads to a time- and dose-dependent reduction in the free MT1E protein content. Elevating MT1E levels affords protection against Cd-mediated renal toxicity, evidenced by the reduction in oxidative stress and DNA damage, alongside the reestablishment of mitochondrial morphology, function, and energy potential. This investigation underscores the protective capacity of MT1E in mitigating Cd-induced renal harm in HK-2 cells, highlighting the importance of mitochondrial functional restoration. This deepens our comprehension of the safeguarding role of the specific metallothionein isoform protein and offers potential preventive approaches for addressing health risks associated with Cd exposure.
WEN Si Hui conceived the design, XIE Ying and LUO Lei supervised the study. LI Lu Bei and HUANG Hui Dan performed part of molecular biology experiments. WEN Si Hui wrote the manuscript. XIE Ying and LUO Lei reviewed the manuscript.
doi: 10.3967/bes2024.011
Metallothionein 1E Alleviates Cadmium-induced Renal Cytotoxicity through Promoting Mitochondrial Functional Recovery
-
-
S1. Evaluating oxidative stress and mitochondrial impairment in HK-2 cells exposed to Cd.
(A) Survival rate of HK-2 cells treated with 0−60 µmol/L Cd for either 24 h or 48 h, measured using CCK-8, compared to controls. (B–C) Fluorescent images showing ROS in HK-2 cells exposed to 0, 40, 42.5, and 45 µmol/L Cd for 48 h (ROS emits red fluorescence). Quantitative analysis for ROS production was conducted. Scale bar represents 200 µm. (D) SOD activity was quantitatively assessed. (E–F) Mitochondrial membrane potential represented by the JC-1 red/green fluorescence ratio with corresponding quantification. Scale bar equals 200 µm. (G) Quantitative analysis for ATP levels. (H–I) Rates of apoptosis were ascertained using Annexin V-FITC flow cytometry (vs. control group, *P < 0.05).
S2. Analysis of MTs isoform mRNA expression post Cd treatment.
(A) mRNA expression levels of MTs isoforms, following exposure to 42.5 and 45 µmol/L Cd for 48 h, were evaluated using RT-PCR. (B) Bioinformatic investigation pertaining to the mRNA expression of MTs isoforms based on the GSE27211 database, featuring HK-2 cells subjected to Cd treatment (concentration unspecified) at intervals of 12 h and 48 h (vs. control group, *P < 0.05).
S3. Examination of MT1E expression trends in KIRC via TCGA and CPTAC datasets.
(A) mRNA expression levels of MT1E in both normal and tumor tissues were assessed, derived from 613 kidney renal clear cell carcinoma (KIRC) specimens as recorded in the TCGA database. (B–D) MT1E expression patterns across different KIRC-TNM stages, according to the TCGA dataset. (E) Protein expression metrics for MT1E across various cancers were ascertained using the CPTAC database (vs. normal group, *P < 0.05, **P < 0.01, ***P < 0.001).
Figure 1. Cd-induced variations in MT1E protein levels in HK-2 and MDCK cells.
(A–B) MT1E protein expression in HK-2 cells exposed to 0, 40, 42.5, 45 µmol/L Cd over 24 h or 48 h, quantified using Image J. (C–D) MT1E protein expression in MDCK cells following exposure to 0, 30, 32.5, 35 µmol/L Cd for 24 h or 48 h, analyzed through Image J (vs. control group, *P < 0.05).
Figure 2. Assessment of oxidative stress and DNA damage in Cd-treated HK-2 cells with LV-MT1E expression.
(A) Viability of LV-NC and LV-MT1E cells after 48 h exposure to varying Cd concentrations (0–60 µmol/L). (B–C) Utilizing 50 µmol/L Cd for 48 h, ROS levels were determined with the DCFH-DA probe, and a quantitative analysis of fluorescence intensity was conducted. Scale bar denotes 200 µm. (D) Quantitative evaluation of SOD activity. (E–F) Visualization of γH2AX foci signal via immunofluorescence. Cells displaying > 10 γH2AX foci were classified as positive. Scale bar is 25 µm (vs. LV-NC group, *P < 0.05).
S4. Confirmation of the MT1E overexpression cellular model.
(A) Quantitative RT-PCR was employed to analyze the expression in cells transfected with lentiviral plasmids stably expressing MT1E. (B–C) Western blot methodology was utilized to validate MT1E overexpression, with subsequent quantitative analysis executed via Image J (vs. control group, *P < 0.05).
Figure 3. Analysis of mitochondrial morphology and function in HK-2 cells post combined treatment with LV-MT1E and Cd.
(A) Fluorescent imaging depicting changes in mitochondrial membrane potential in LV-NC and LV-MT1E cells after 50 µmol/L Cd treatment for 48 h. The red fluorescence of JC-1 dye signifies intact mitochondria, whereas it changes to green in depolarized mitochondria. Scale bar indicates 200 µm. (B) Quantitative evaluation of the relative fluorescence intensity pertaining to mitochondrial membrane potential. (C) Quantitative assessment of ATP synthesis. (D) Visualization of mitochondrial structures using the Mito Tracker red probe. Scale bar equals 25 µm. (E) The Median mitochondrial branch length was determined using Mitochondrial network analyses (MiNA) (vs. LV-NC group, *P < 0.05; vs. LV-NC + 50 µmol/L Cd group, #P < 0.05).
-
[1] Ma YG, Su QC, Yue CG, et al. The effect of oxidative stress-induced autophagy by cadmium exposure in kidney, liver, and bone damage, and neurotoxicity. Int J Mol Sci, 2022; 23, 13491. doi: 10.3390/ijms232113491 [2] Nordberg M, Nordberg GF. Metallothionein and cadmium toxicology—historical review and commentary. Biomolecules, 2022; 12, 360. doi: 10.3390/biom12030360 [3] Mehus AA, Muhonen WW, Garrett SH, et al. Quantitation of human metallothionein isoforms: a family of small, highly conserved, cysteine-rich proteins. Mol Cell Proteomics, 2014; 13, 1020−33. doi: 10.1074/mcp.M113.033373 [4] Kang YC, Son M, Kang S, et al. Cell-penetrating artificial mitochondria-targeting peptide-conjugated metallothionein 1A alleviates mitochondrial damage in Parkinson's disease models. Exp Mol Med, 2018; 50, 1−13. [5] Wahyudi LD, Yu SH, Cho MK. The effect of curcumin on the cadmium-induced mitochondrial apoptosis pathway by metallothionein 2A regulation. Life Sci, 2022; 310, 121076. doi: 10.1016/j.lfs.2022.121076 [6] Wojtczak B, Pula B, Gomulkiewicz A, et al. Metallothionein isoform expression in benign and malignant thyroid lesions. Anticancer Res, 2017; 37, 5179−85. [7] Liu QC, Lu F, Chen Z. Identification of MT1E as a novel tumor suppressor in hepatocellular carcinoma. Pathol Res Pract, 2020; 216, 153213. doi: 10.1016/j.prp.2020.153213 [8] Maleckaite R, Zalimas A, Bakavicius A, et al. DNA methylation of metallothionein genes is associated with the clinical features of renal cell carcinoma. Oncol Rep, 2019; 41, 3535−44. [9] Visconti VV, Gasperini B, Greggi C, et al. Plasma heavy metal levels correlate with deregulated gene expression of detoxifying enzymes in osteoporotic patients. Sci Rep, 2023; 13, 10641. doi: 10.1038/s41598-023-37410-8 [10] Xu S, Pi H, Chen Y, et al. Cadmium induced Drp1-dependent mitochondrial fragmentation by disturbing calcium homeostasis in its hepatotoxicity. Cell Death Dis, 2013; 4, e540. doi: 10.1038/cddis.2013.7 -
 23225+Supplementary Materials.pdf

-


 下载:
下载:



 Quick Links