

 下载:
下载:


-
According to the 2017 Global Burden of Disease Study[1], smoking is among the four leading risk factors contributing to deaths and disability-adjusted life years (DALYs) in China. In the past 20 years, there has been a substantial increase in the number of studies focusing on the association between tobacco exposure and disease. Our group conducted a systematic review of articles to analyze the risk of various diseases caused by smoking in a Chinese population[2]. The results indicated that most studies were observational studies, especially the case-control studies. Therefore, the quality of tobacco research is in need of assessment. There are some common tools for assessing observational research, including the Newcastle-Ottawa Scale (NOS), the Critical Appraisal Skill Program checklist, and the Strengthening the Reporting of Observational Studies in Epidemiology statement[3, 4]. Among the tools, the NOS is commonly used for quality assessment for case-control studies, and is recommended by the Cochrane Collaboration[5].
These tools focus on assessing the methodologic quality of the study, but not on the statistical power for the effect sizes. The statistical power of a study is defined as 1-β, which means the null hypothesis is not rejected when it should have been, occurring with a probability, β[6]. For studies with low statistical power, a meta-analysis might overestimate the true effect, and make non-existent effects significant[7]. Therefore, the post-hoc power was calculated in our study by using the observed effect size to determine if the power of those negative results would or would not be sufficient. The aim of this study was to assess the quality of case-control studies on the risk of tobacco-induced diseases for a Chinese population by using NOS and post-hoc power values of statistical tests, which could help to provide some ideas for evaluating the quality of published case-control studies.
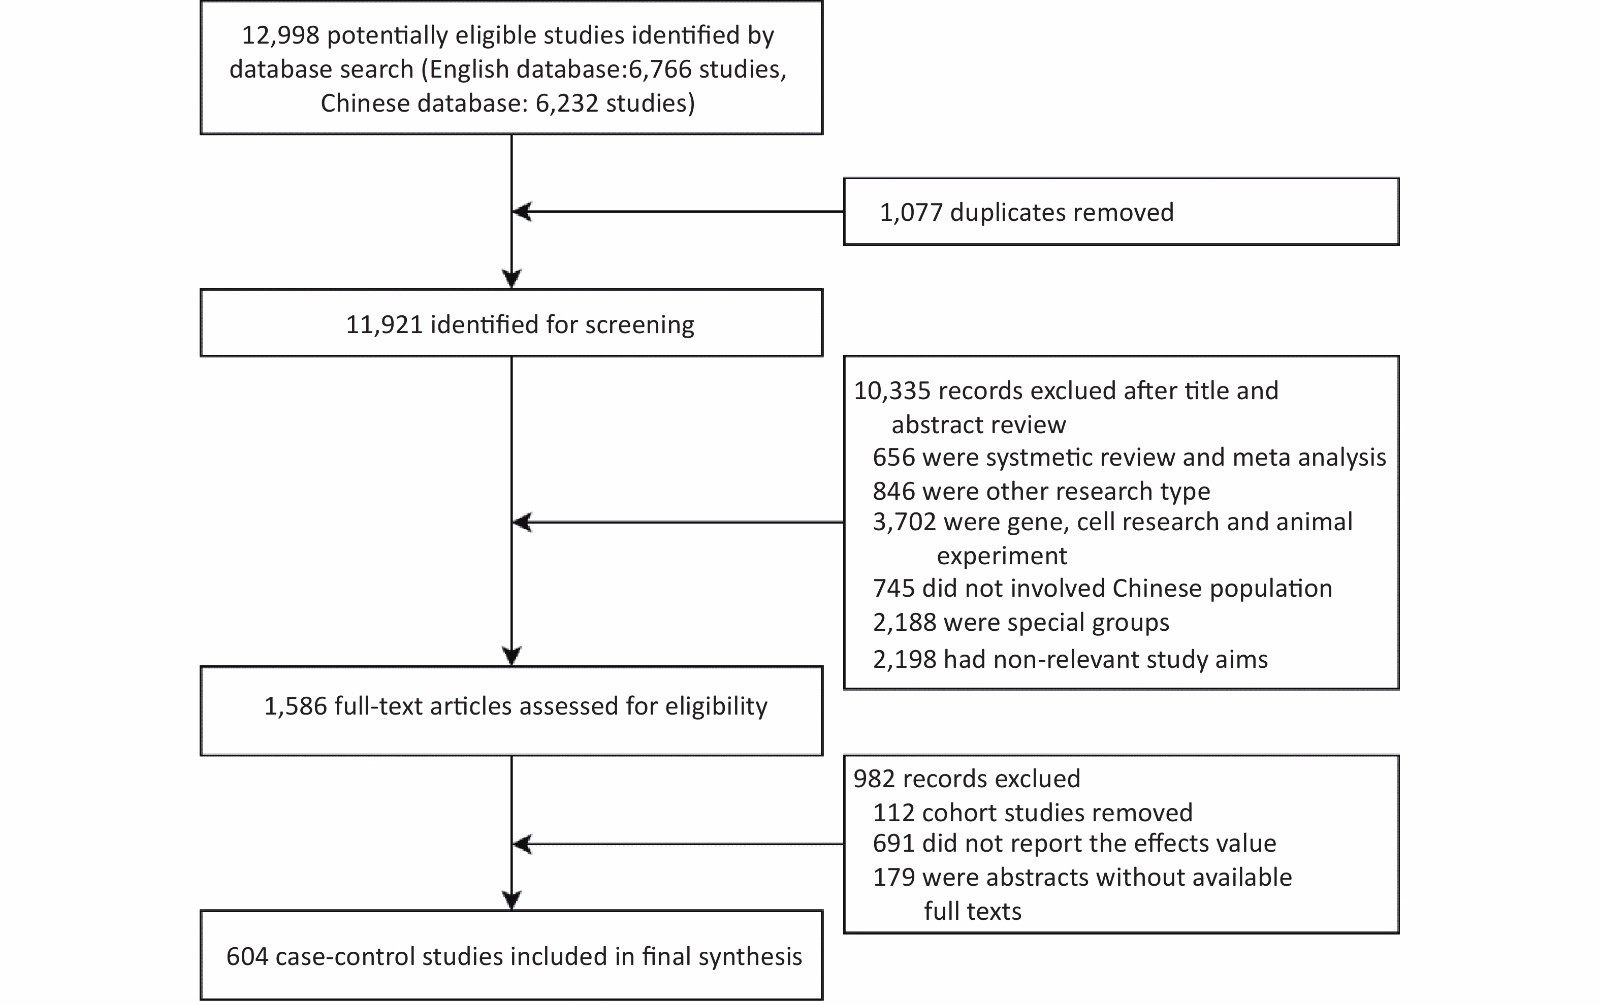
According to the search strategy developed by the Cochrane Collaboration, we searched PubMed, Web of Science, EMBASE, National Knowledge Infrastructure, the China Science and Technology Journal Database, and Wanfang databases for studies published before July 2021. There was no search limitation on publication dates. The search results were not limited by language, but all included studies were written in English or Chinese. The database search was supplemented by screening the references of the retrieved articles. The inclusion and exclusion criteria were as follows (Supplementary Figure S1, available in www.besjournal.com):
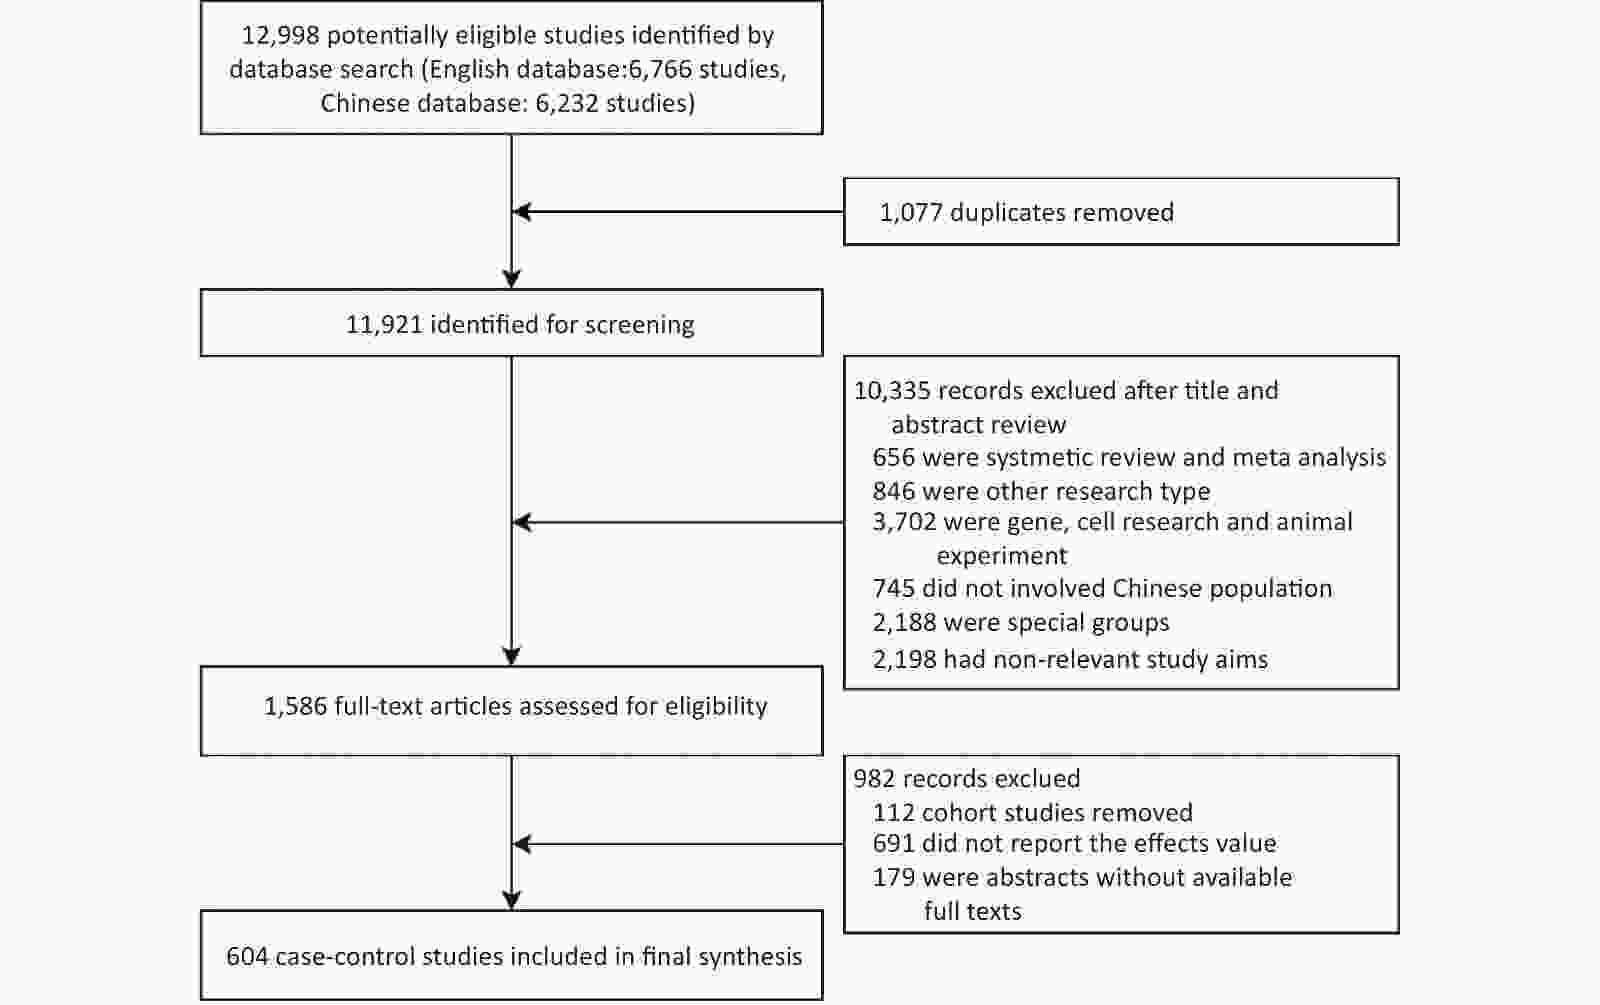
Figure S1. Preferred reporting items for systematic review flow diagram.
The inclusion criteria were as follows: 1) original research; if a secondary study, such as a systematic review or meta-analysis, the original literature was traced back; 2) research was carried out in a Chinese population and the research population was representative of China; 3) case-control or cohort study; and 4) research reporting the effect of tobacco exposure and diseases [odds ratios (ORs)]. The exclusion criteria were as follows: 1) duplicate article or abstract without available full texts; 2) gene or cell research and animal experiment; 3) the study population involved a Chinese population, but the data of other countries were excluded when the study included population data from multiple countries; 4) special groups, such as coal miners, pregnant women, and newborns; and 5) the outcome of the study was symptoms rather than diseases, such as elevated blood glucose.
The NOS was used to assess the methodologic quality of the included case-control studies. The NOS consists of eight items, categorized into three dimensions, including selection of study groups (item 1: case definition, item 2: representativeness of the cases, item 3: selection of controls, item 4: definition of controls), comparability of groups (item 5: comparability of cases and controls), and ascertainment of exposure and outcomes (item 6: ascertainment of exposure, item 7: method of ascertainment for cases and controls, and item 8: non-response rate). The NOS is based on a star scoring system (0–9 stars). Except for item 5, which has 2 stars, the other items only have 1 star. A score of > 6 was considered high quality for case-control studies.
Smoking status, smoking dose categories, and second-hand smoke (SHS) exposure history were the exposure categories of main interest in our analysis. Smoking status included never, current, ever, and former smokers. Smoking dose categories referred to two ordinal categorical variables [number of cigarettes per day and cigarette pack-years (the product of cigarette packs smoked per day and smoking duration in years)]. SHS exposure history was a binary variable, including SHS exposure and non-exposure. Because the smoking dose categories always had more than two dose groups in the included articles, multiple ORs were reported by using never smokers as a reference group. Accordingly, multiple post-hoc powers were calculated, and the smallest power was taken as the final statistical power for each study.
The post-hoc power was calculated backward through the sample size calculation formula of the case-control study. The formulae are shown below.
Unmatched or frequency matched case-control study:
$$ {Z}_{\beta }=\sqrt{\frac{n{({p}_{1}-{p}_{0})}^{2}}{(1+1/C)\overline{p}(1-\overline{p})}}-{Z}_{\alpha /2} $$ (1) Individual matching (1:C, C > 1) case-control study:
$$ {Z}_{\beta }=\frac{n\left|{p}_{1}-{p}_{0}\right|-{Z}_{\alpha /2}\sqrt{(1+1/C)\overline{p}(1-\overline{p})}}{\sqrt{{p}_{0}(1-{p}_{1})+{p}_{1}(1-{p}_{0})}} $$ (2) Individual matching (1:1) case-control study:
$$ {Z}_{\beta }=\frac{n\left|p-1/2\right|\sqrt{{p}_{0}(1-{p}_{1})+{p}_{1}(1-{p}_{0})}-{Z}_{\alpha /2}/2}{\sqrt{p(1-p)}} $$ (3) $$\begin{split} {\rm{For}}\;{\rm{all}}\;{\rm{formulas}}:\;&p_{1}=\frac{OR\times {p}_{0}}{(1-{p}_{0}+OR\times {p}_{0})};\\ &{\overline{p}}=\frac{{p}_{1}+{C\times p}_{0}}{1+C};P=\frac{OR}{1+OR}\end{split} $$ (4) where po is the exposure rate of the control group, p1 is the exposure rate of the case group, and OR is the reported effect size.
Frequencies and percentages were calculated for categorical variables, and the median and interquartile range (IQR) were calculated for quantitative variables. Differences between groups were compared with the Wilcoxon rank-test, chi-square test, or Fisher exact test. All tests were two-tailed, and P values < 0.05 were considered statistically significant. Data were analyzed using SAS 9.4 software (SAS Institute Inc.).
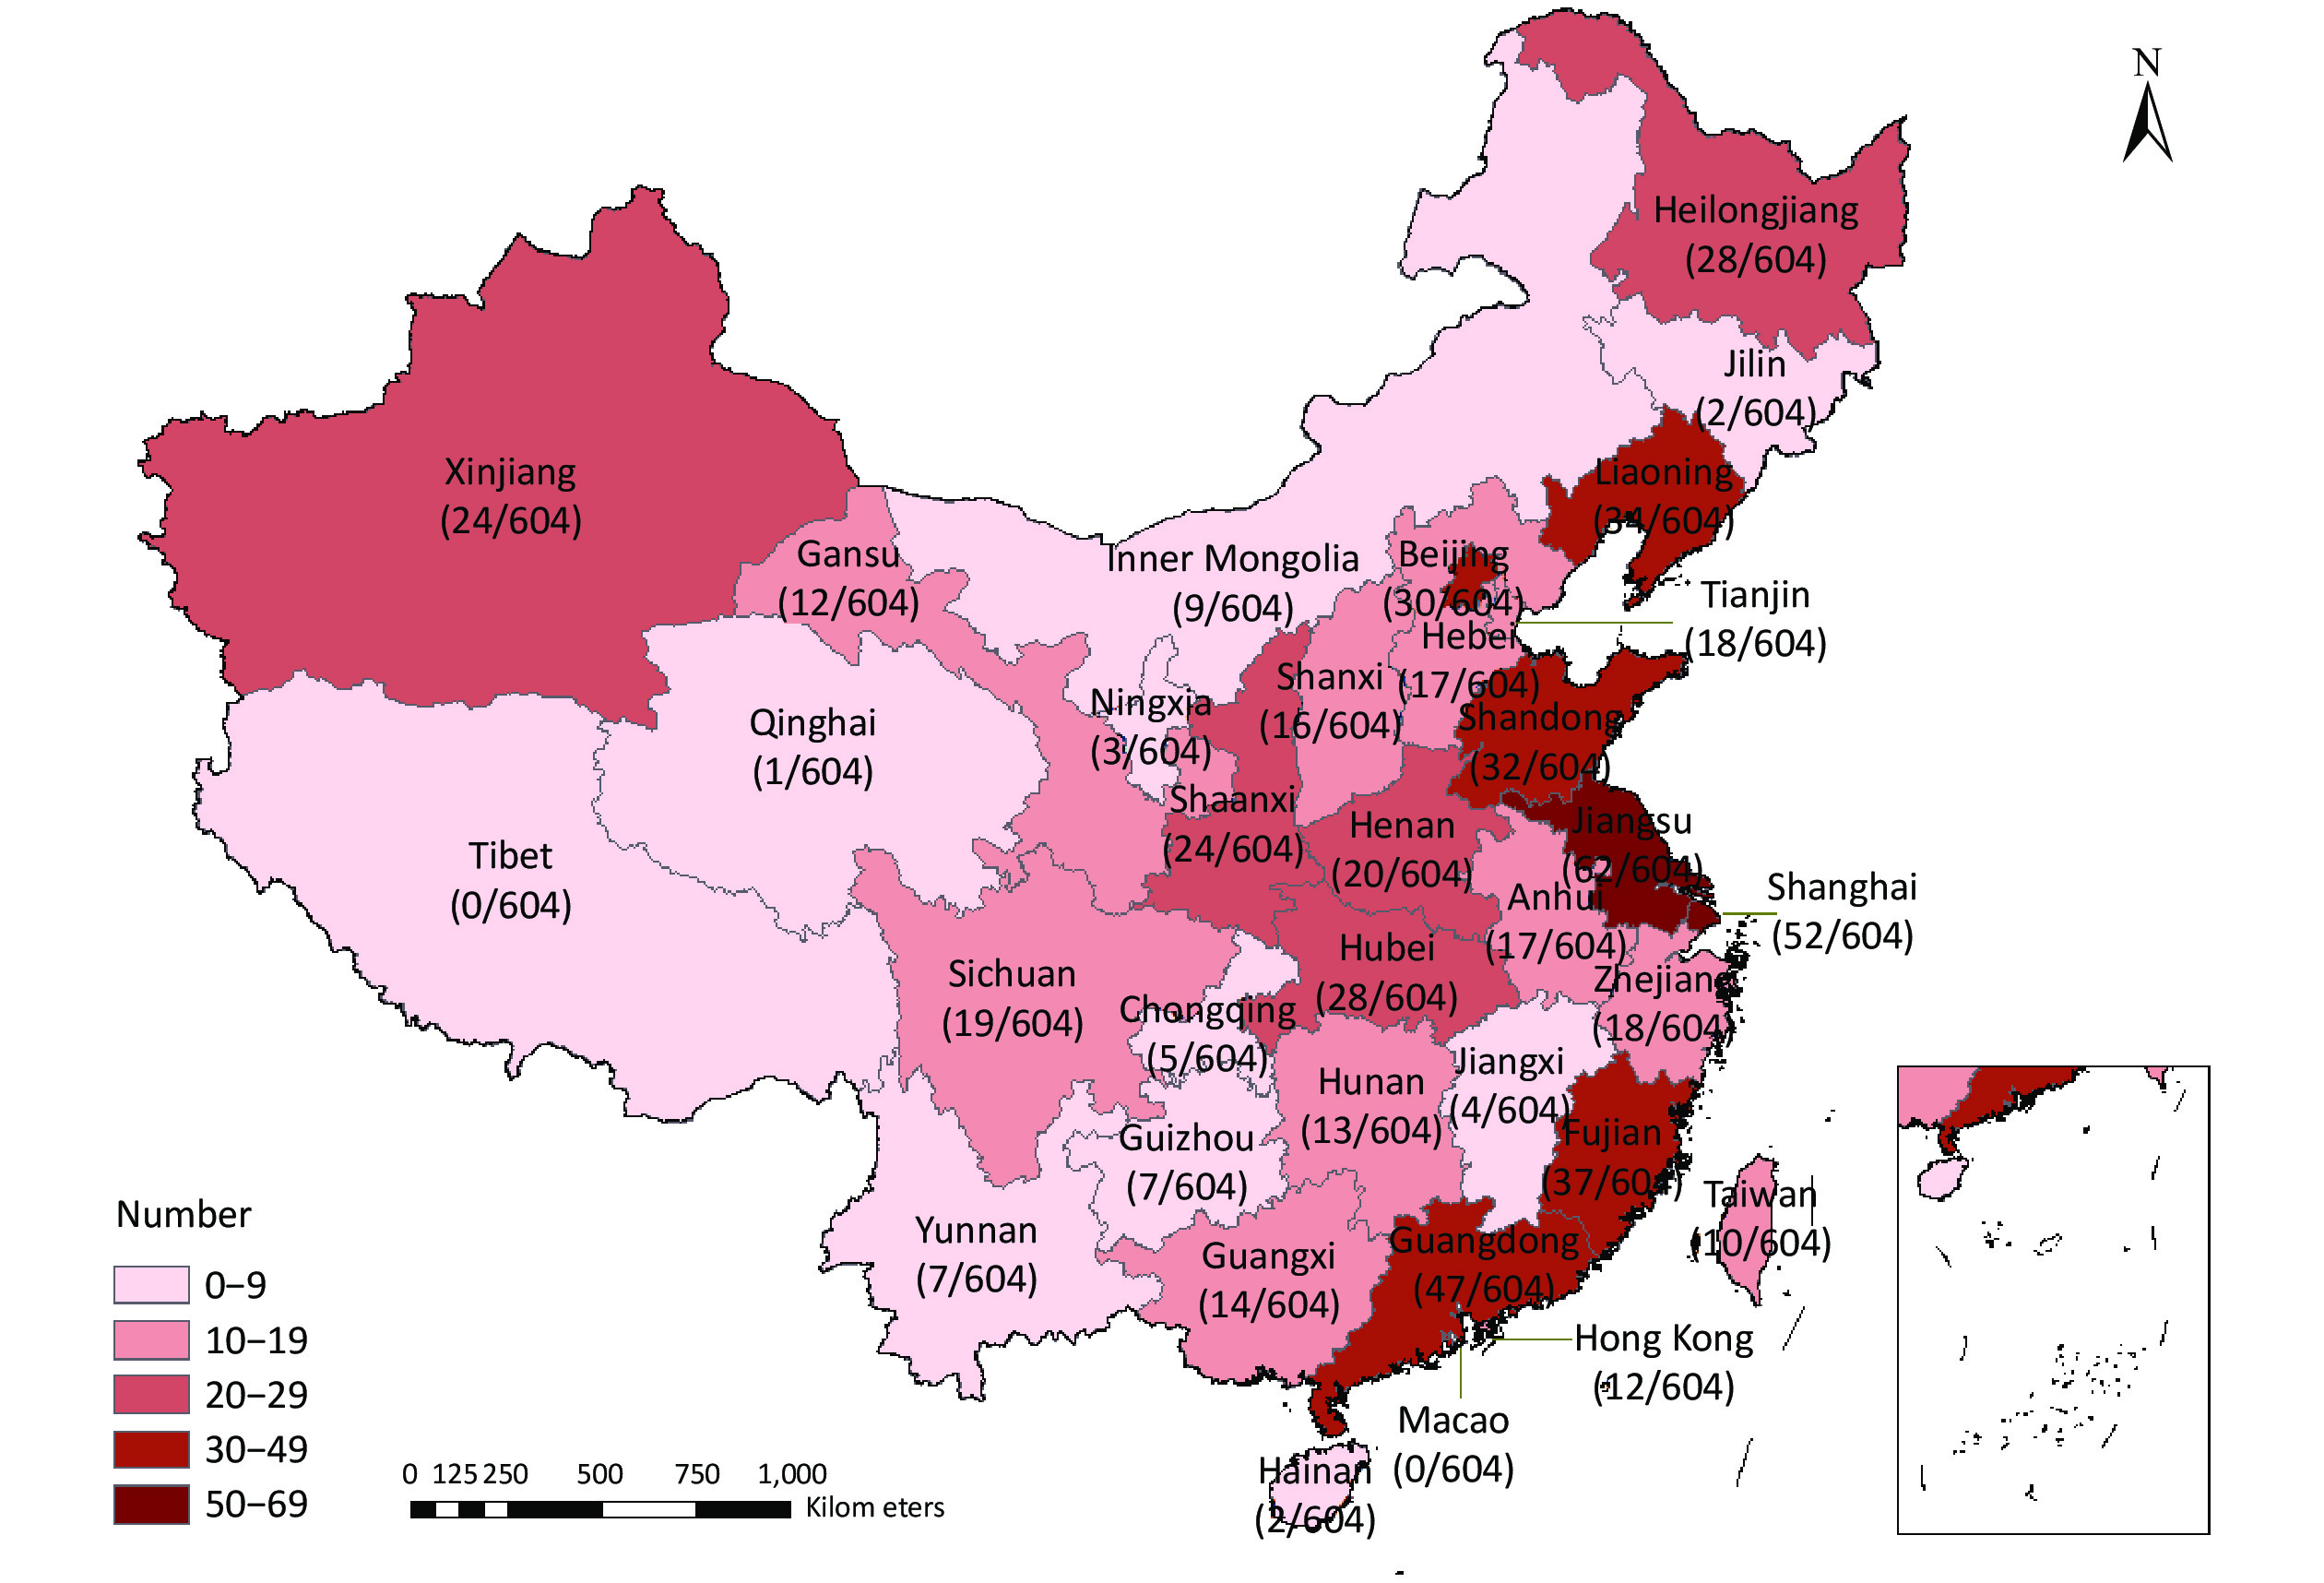
The literature search identified 12,998 articles published from 1987–2021, of which 604 case-control studies met the inclusion criteria and were included in the analysis. The study participants were disproportionately distributed across 31 provincial-level administrative regions in China, but were mainly (61.8%) clustered along the Chinese coastal regions (Supplementary Figure S2, available in www.besjournal.com). Nearly 10% (n = 62) of the published studies were based on data obtained from Jiangsu province. Research on western China is weak. One possible explanation for this difference is that the Chinese economic barycenter has shifted southward along the coastal region, where governments and research institutes have invested more funds to support basic medical research in recent years. Ultimately, this difference in economic levels led to an uneven geographic distribution of study sites. Therefore, more research should be conducted in the western region in the future.
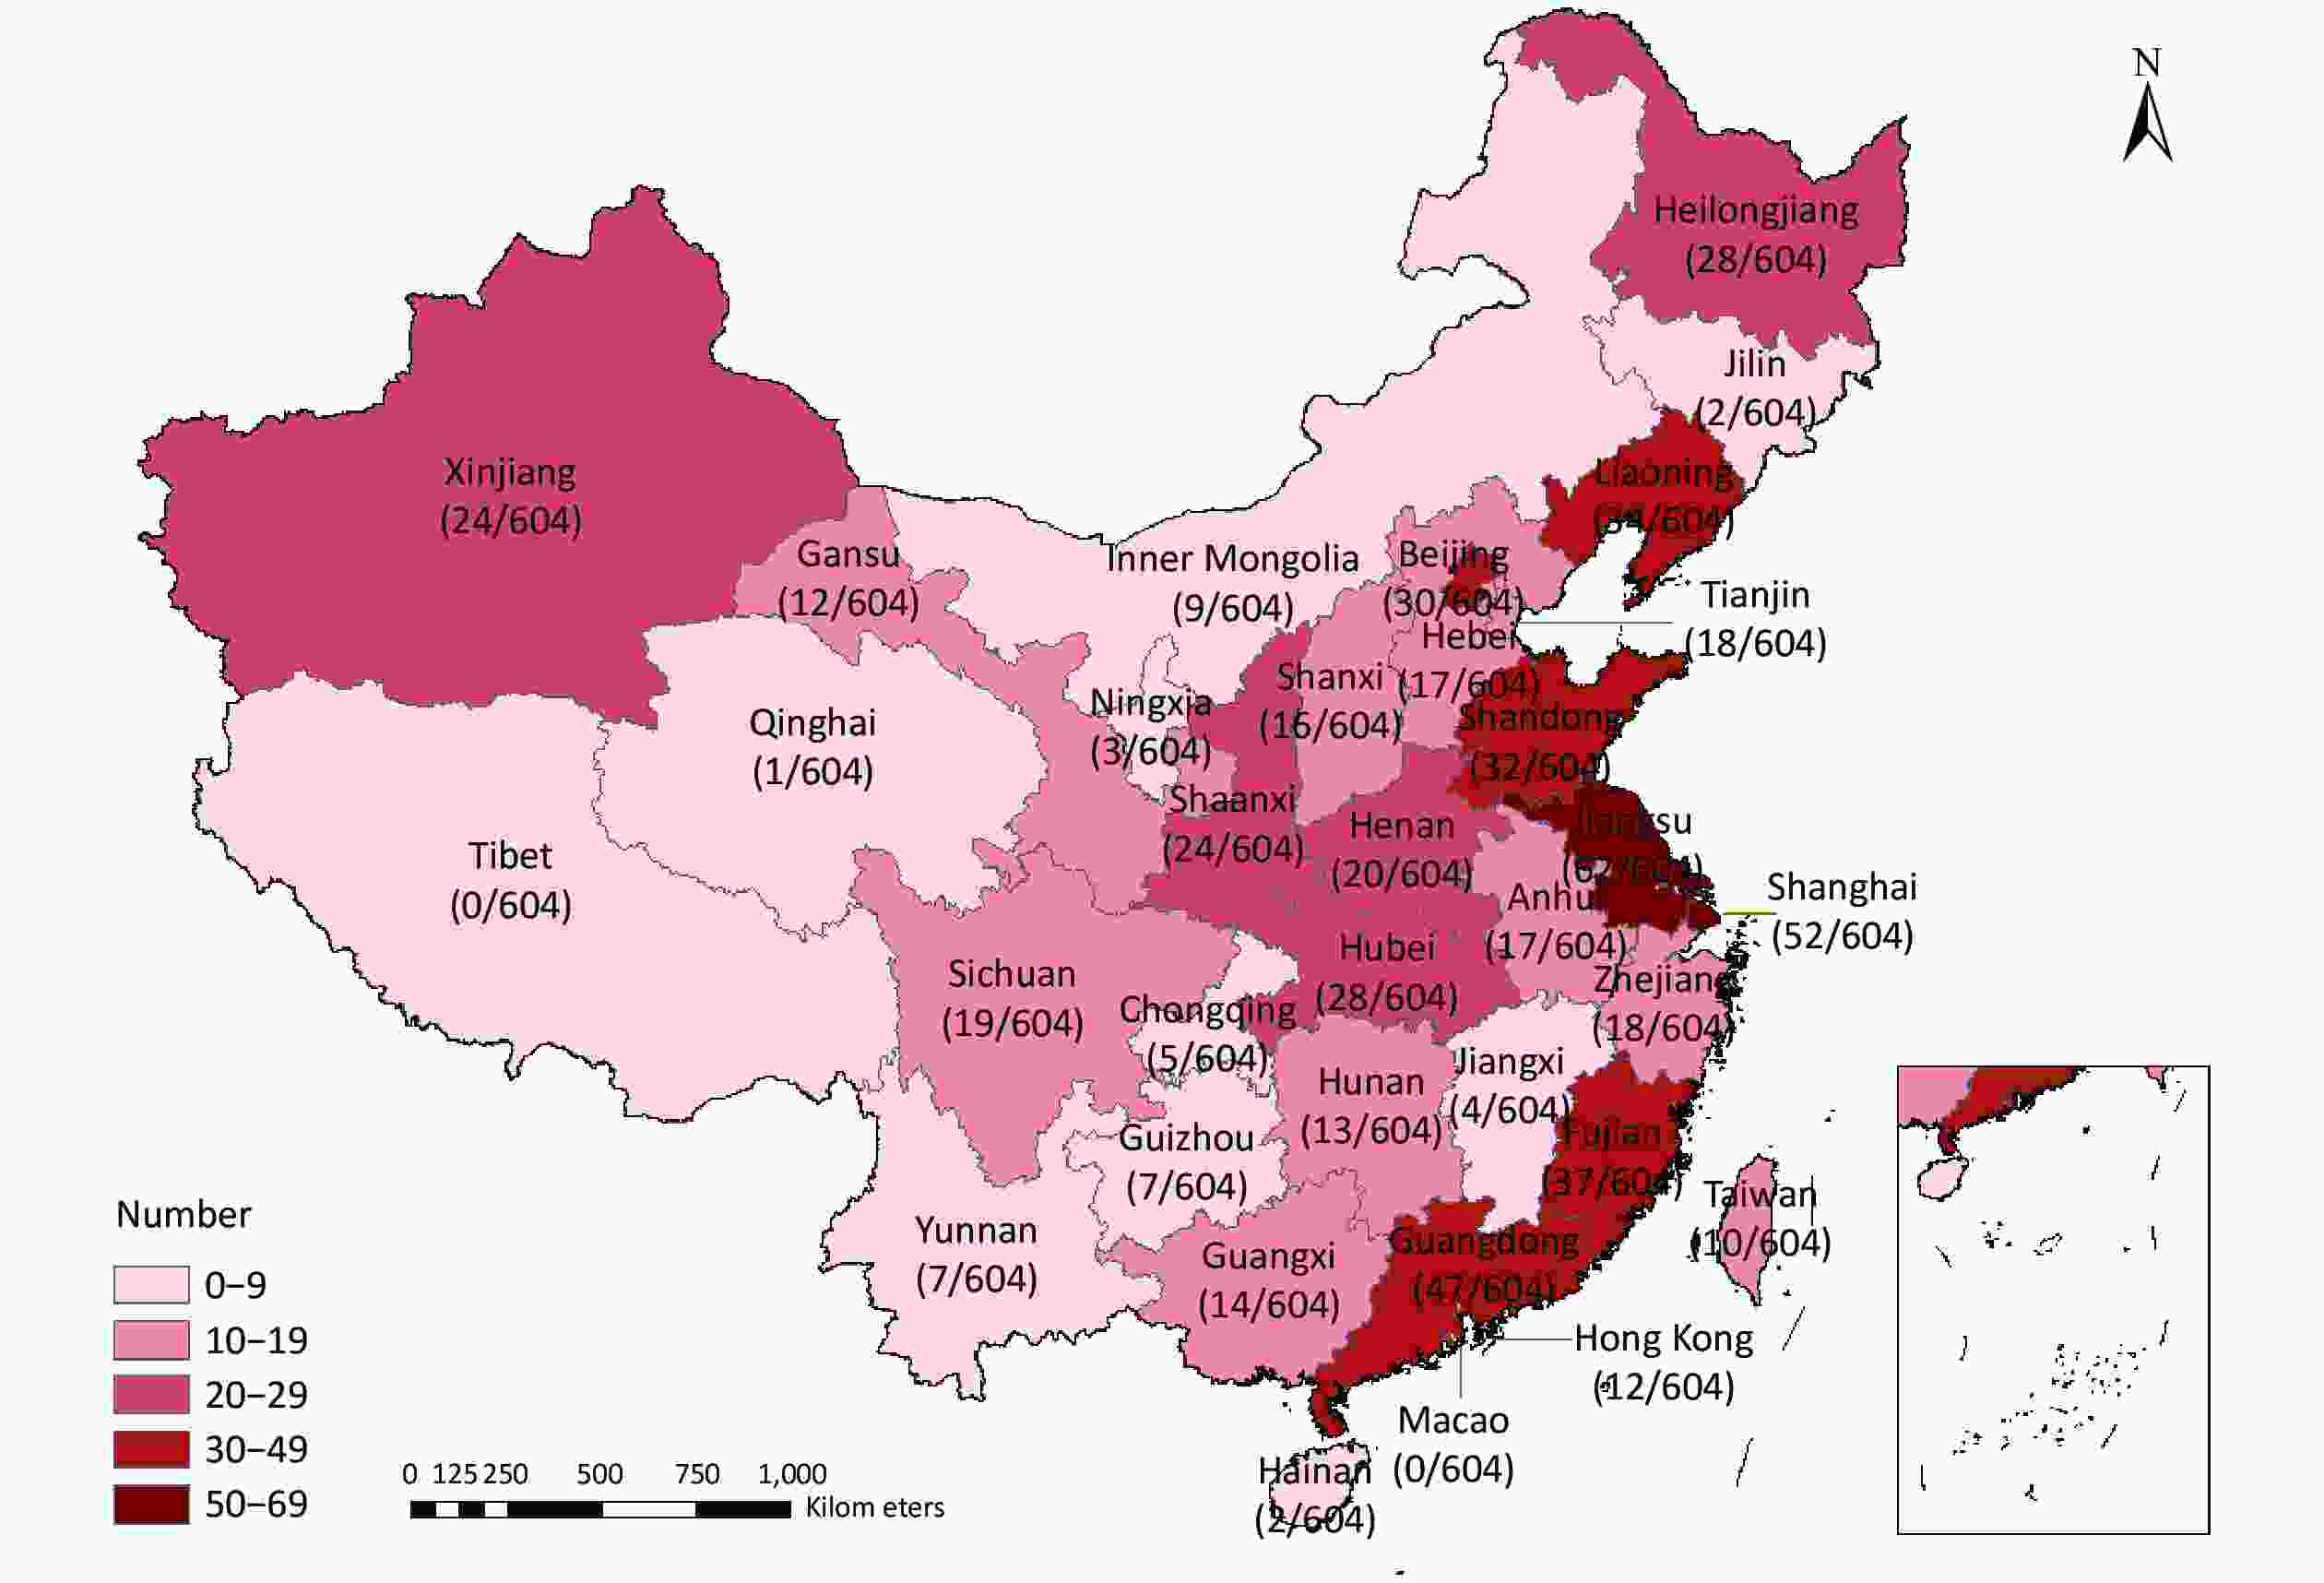
Figure S2. The provincial distribution of the study area in China. This map was generated by ArcGIS, version 10.2.
Of the 604 articles, 25.5% were published in journals written in English. The top three Chinese journals with the number of publications were the Modern Preventive Medicine (26 articles), the Chinese Journal of Public Health (25 articles), and the Chinese Journal of Prevention and Control of Chronic Diseases (21 articles). The publications written in English were mainly related to cancer, including the International Journal of Cancer (15 articles), the Cancer Causes Control (10 articles), and the Asian Pacific Journal of Cancer Prevention (9 articles). Greater than 110 different diseases were reported in these articles. Among the top 10 reported diseases, 6 (259 articles) were related to cancer. The greatest number of studies involved lung cancer [87 (14.4%)]. Five hundred sixteen studies (85.4%) focused on active smoking. Four hundred fifty-two studies (74.8%) included smoking status, with 406 (67.2%) involving ever smokers. Few studies included smoking dose categories, and only 49 articles (8.1%) reported the association between pack-years and disease. Less than one-fifth of the literature (19.2%) focused on the risk of SHS exposure (Table 1). The dose-response relationship for smoking is an important parameter during global burden of disease estimation, so we suggest this area of research should be strengthened.
Table 1. Basic information of the included literature
Basic information Number (n = 604) Proportion (%) Publication language Chinese journal 450 Modern Preventive Medicine 26 5.8 Chinese Journal of Public Health 25 5.5 Chinese Journal of Prevention and Control of Chronic Diseases 21 4.7 Other 378 84.0 Journal written in English 154 International Journal of Cancer 15 9.7 Cancer Causes Control 10 6.5 Asian Pacific Journal of Cancer Prevention 9 5.8 Other 120 77.9 Disease Lung cancer 87 14.4 Esophageal cancer 59 9.8 Gastric cancer 50 8.3 Breast cancer 29 4.8 Asthma 23 3.8 Liver cancer 21 3.5 Pulmonary tuberculosis 18 3.0 Ischemic stroke 17 2.8 Arteriosclerotic heart disease 20 3.3 Cervical cancer 13 2.2 Other 267 44.2 Tobacco exposure Only active smoking 488 80.8 Only SHS 88 14.6 Active smoking and SHS 28 4.6 Tobacco exposure variables* Smoking status 452 74.8 Ever smoker 406 67.2 Former smoker 52 8.6 Current smoker 58 9.6 Pack-years 49 8.1 No. of cigarettes/d 75 12.4 Second-hand smoke 116 19.2 Note. *Sum of the number from different exposure variables might not add up to the category sum or overall total because the number of studies providing risk estimates for different tobacco exposure variables differed. The percentage of adequately reported NOS items for articles published in Chinese journals and journals written in English are presented in Figure 1. Item 5 had the highest reporting percentage [89.1% of articles (91.6% in English and 88.2% in Chinese)] getting two stars, and only two Chinese articles did not control any confounding factors (no star). The adequate reporting rate for items 1, 4, and 7 was all > 80%. Thus, most researchers scientifically and strictly formulated the inclusion and exclusion criteria of cases and controls, and used the same structured scales to ensure consistency on ascertain exposure to reduce survey bias. Greater than two-thirds of the literature was not scored based on ‘representativeness of the cases’ and ‘selection of controls.’ One possible explanation is that considering the availability and compliance of the recruited subjects, researchers often conduct hospital-based case control studies. Thus, samples may be underrepresented, which leads to multiple selection biases and poor extrapolation of the results[8]. In addition, < 5.8% of the articles reported non-response rates for the case and control groups. This finding suggested that investigators need to introduce the assessment of non-responders and adjust the non-response rate between case and control groups during data collection and analysis in the future, which would improve the authenticity of the results and avoid bias[9]. The journals written in English reported items 2, 3, 6, 7, and 8 more adequately than Chinese journals and the difference was statistically significant (P < 0.05). In addition, less than one-half (41.5%) of the literature was of high-quality (NOS ≥ 6) in 604 articles (Supplementary Table S1, available at www.besjournal.com). Among the studies, the proportion of high-quality studies in journals written in English (54.6%) was higher than the Chinese journals (37.1%). This difference was statistically significant (P < 0.05). These findings were in agreement with the results of research on the cohort studies by our group, which also showed that the quality of the literature written in English was relatively high, especially in comparing two groups and the adequacy of follow-up[10]. Therefore, Chinese journals should actively learn from the review system of international mainstream journals, and strengthen the quality assessment of accepted manuscript content.
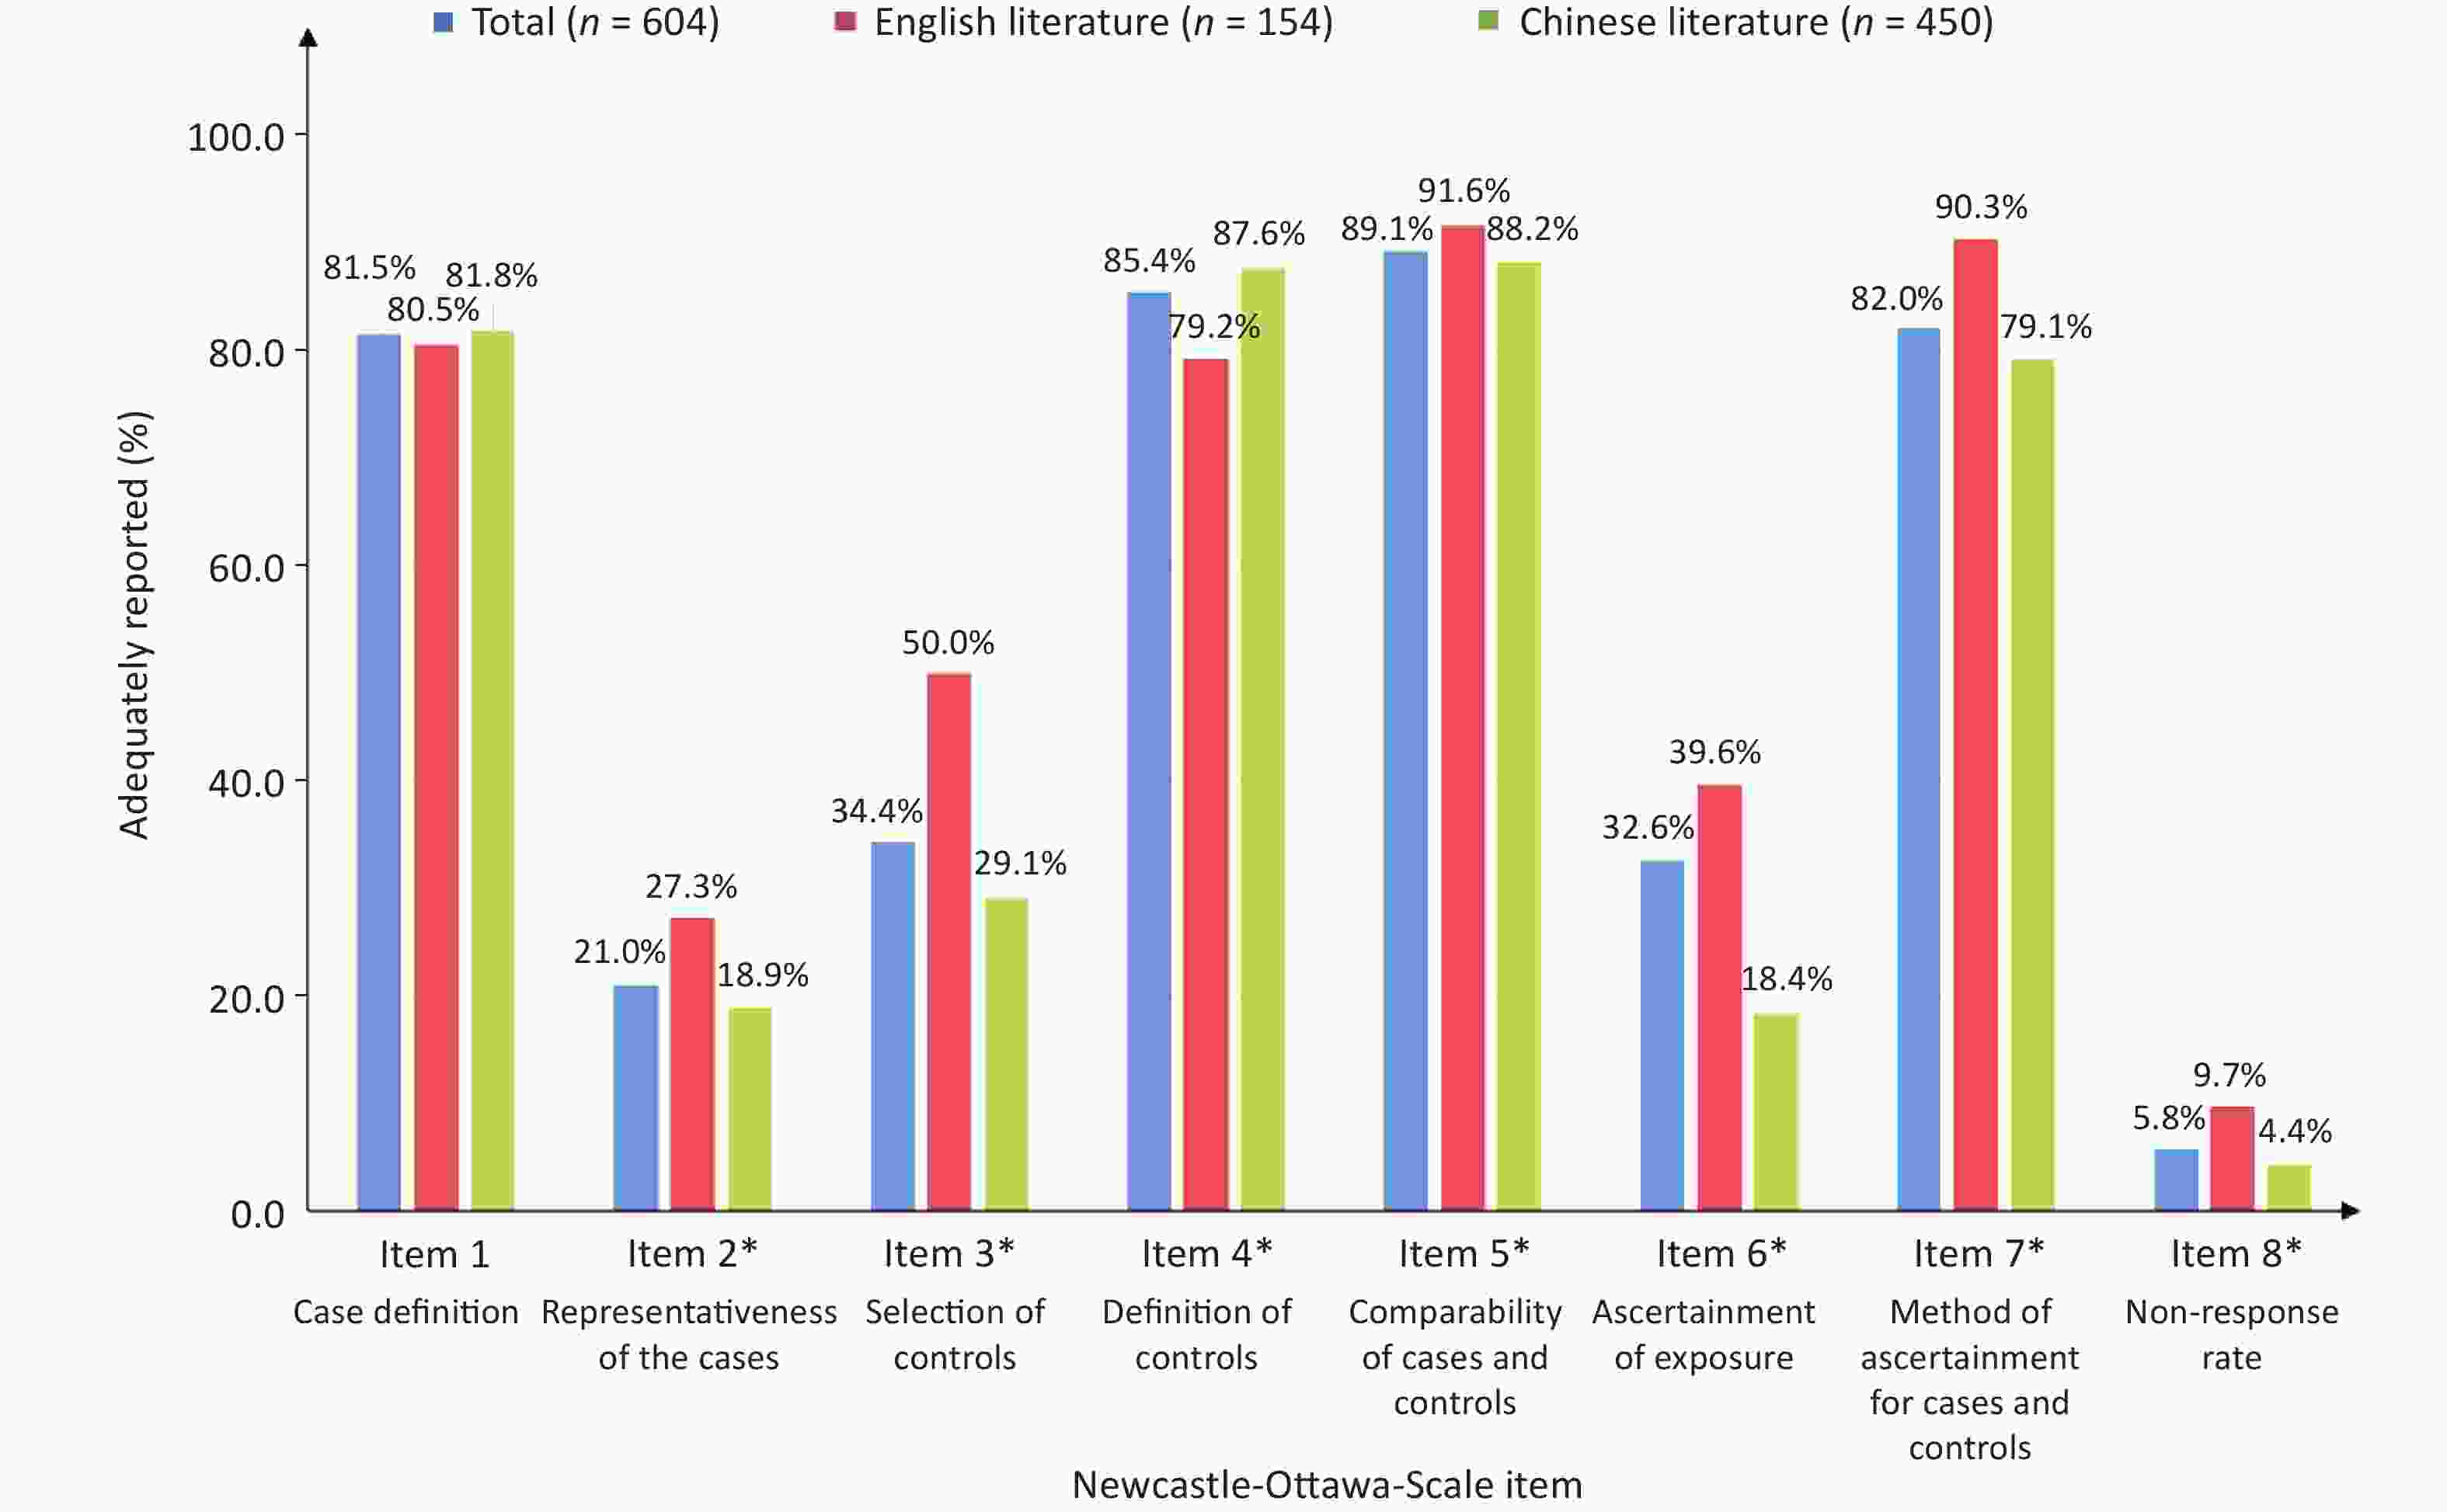
Figure 1. Adequately reported NOS items. Items highlighted with a * are statistically significant between the Chinese journals and journals written in English.
The NOS assigns a lower score to case-control studies in which the case data originate from record linkage (e.g., ICD codes in the database). We are of the opinion that this item is too obscure without a clear explanation. The record data with ICD codes from some surveillance systems should get a low score, which may be too arbitrary. In fact, there are some high-quality databases in China. For example, the National Central Cancer Registry of China, which was established in 2002, is responsible for the collection, management, and analysis of the nationwide cancer registry data in China. These data are submitted to local cancer registries from multiple sources, including local hospitals and community health centers, as well as the Urban Resident Basic Medical Insurance program and the New Rural Cooperative Medical Scheme. The quality of cancer diagnoses data for each local cancer registry was assessed and checked by the International Agency for Research on Cancer/International Association of Cancer Registries (IARC/IACR) data-quality criteria and the Guidelines for Chinese Cancer Registration[11]. Therefore, some data from some surveillance points have high quality. Some studies have even argued that the NOS, with low inter-rater reliability, is a disputable tool for quality assessment[12]. Therefore, NOS needs to be improved by giving more clear direction for each item scoring.
In addition, the NOS is too strict in ascertainment of exposure, and requires that exposure factors must be reliably recorded (e.g., surgical records). For example, some behavioral risk factors (e.g., smoking and alcohol consumption) with lag effects cannot be objectively recorded as in prospective studies, and can only be obtained based on the recollection of the respondents. In addition, the NOS gives a higher score to studies with blind procedure reporting for case and control groups in item 6. Blinding is not always possible because in the real world blinding cannot be realized or permitted. In such circumstances, we recommend that if the data collectors performed high-standardized interviews, NOS should give a higher score for the item.
Regardless of the language used, greater than one-half of the results (English: 57.3%; Chinese: 57.7%) involving ever smokers had high post-hoc power values (> 0.8; Supplementary Table S2, available in www.besjournal.com). Similar results were also found for current smokers. In our study, greater than one half of the post-hoc power values for tobacco exposure variables were insufficient. Most of these studies focused on the association of cancer or cardiovascular diseases with tobacco exposure, including lung cancer, esophagus cancer, gastric cancer, nasopharynx cancer, and coronary heart disease. According to the Surgeon General Report, there is robust evidence that smoking is a risk factor for the above diseases[1]. Therefore, the conclusions that there is no relationship between smoking and these diseases with such low post-hoc power values should also be questioned. Some possible explanation for this problem is that during the design procedure, some studies might regard tobacco exposure variables only as covariates which had not been calculated as the required sample size. Some studies may follow a smallest sample size estimation principle which is approximately 10 outcome events (e.g., illness and death) per variable for the building regression model[13]. Therefore, we suggest that researchers should check the reliability of the results by calculating the power before the study commences.
Table S2. The distribution for post-hoc power values by the language and variables
Language Variables All, n Post hoc power (%) 1−β < 0.5 0.5 ≤ 1−β < 0.8 1−β ≥ 0.8 All Ever smoker 406 109 (26.8) 63 (15.5) 240 (59.1) Current smoker 58 12 (20.7) 8 (13.8) 38 (65.5) Former smoker 52 27 (51.9) 6 (11.5) 19 (36.6) Pack-year 49 33 (67.3) 5 (10.2) 11 (22.5) No. of cigarettes/d 75 51 (68.0) 8 (10.7) 16 (21.3) SHS 116 27 (23.3) 30 (25.9) 59 (50.8) English Ever smoker 103 33 (32.0) 11 (10.7) 59 (57.3) Current smoker 36 6 (16.7) 5 (13.9) 25 (69.4) Former smoker 35 19 (54.3) 5 (14.3) 11 (31.4) Pack-year 39 24 (61.5) 5 (12.8) 10 (25.7) No. of cigarettes/d 51 34 (66.7) 4 (7.8) 13 (25.5) SHS 26 13 (50.0) 7 (26.9) 6 (23.1) Chinese Ever smoker 303 76 (25.1) 52 (17.2) 175 (57.7) Current smoker 22 6 (27.3) 3 (13.6) 13 (59.1) Former smoker 17 8 (47.1) 1 (6.9) 8 (47.1) Pack-year 10 9 (90.0) 0 (0.0) 1 (10.0) No. of cigarettes/d 24 17 (70.8) 4 (16.7) 3 (12.5) SHS 90 14 (15.6) 23 (25.5) 53 (58.9) The NOS was always used to estimate the quality of the included observational studies in the meta-analysis; however, we found that the post-hoc median power values of high-quality studies were not higher than studies with low quality (P > 0.05), and the agreement between the NOS scores and the post-hoc power was poor (Table 2). Therefore, the NOS has some limitations as a quality assessment tool.
Table 2. Agreement between NOS scores and the post-hoc powers of statistical outcome for different tobacco exposure variables
Variables All, n Post-hoc power Z value P value Median IQR Ever smoker NOS ≥ 6 162 0.93 0.48−1.00 0.54 0.59 NOS < 6 244 0.88 0.46−1.00 Current smoker NOS ≥ 6 36 0.97 0.56−1.00 0.73 0.47 NOS < 6 22 0.99 0.76−1.00 Former smoker NOS ≥ 6 35 0.43 0.11−0.96 0.73 0.46 NOS < 6 17 0.63 0.21−1.00 Pack-year NOS ≥ 6 30 0.30 0.12−0.64 −0.08 0.93 NOS < 6 19 0.30 0.10−0.88 No. of cigarettes/d NOS ≥ 6 41 0.42 0.13−0.84 −1.57 0.12 NOS < 6 34 0.23 0.06−0.52 SHS NOS ≥ 6 53 0.73 0.43−0.97 −0.78 0.44 NOS < 6 63 0.82 0.59−0.98 Note. NOS, Newcastle-Ottawa Scale; IQR, interquartile range; SHS, second-hand smoke. This study had some limitations. First, for studies in which key information was unclear (e.g., tobacco exposure prevalence was not reported in the control groups), we were unable to contact the authors for confirmation. Thus, the same gender- and age-specific tobacco prevalence in national tobacco epidemiologic surveys had to be used instead. Second, the quality of studies assessed by NOS was not exactly equal to the quality of the design and implementation because some articles had incomplete reporting of study details in the text due to journal space limitations, which may also limit the representativeness of the results of this study.
Contributors WAN Xia designed the study. SHI Yu Lin managed data, implemented methods, and wrote the first draft of the paper. All other authors obtained the original data, and checked and verified the data used in the analysis. WAN Xia and SHI Yu Lin contributed to the revision and finalization of the paper, and had full access to all data used in this study. The corresponding author was responsible for submitting the article for publication. All authors read and approved the final manuscript. We have no conflicts of interest to disclose.
Table S1. The distribution of NOS scores by different tobacco exposure variables
Variables All English journals Chinese journals P value n % n % n % All* NOS ≥ 6 251 41.5 84 54.6 167 37.1 0.01 NOS < 6 353 58.4 70 45.4 283 62.9 Ever smoker NOS ≥ 6 162 39.9 50 50.0 112 36.6 0.02 NOS < 6 244 60.1 50 50.0 194 63.4 Current smoker NOS ≥ 6 36 62.1 26 70.3 10 47.6 0.10 NOS < 6 22 37.9 11 29.1 11 52.4 Former smoker NOS ≥ 6 35 67.3 10 58.8 25 71.4 0.53 NOS < 6 17 32.7 7 41.2 10 28.6 Pack-year NOS ≥ 6 30 38.8 23 59.0 7 56.8 0.72** NOS < 6 19 61.2 16 41.0 3 43.2 Number of cigarettes/d NOS ≥ 6 41 54.7 29 56.9 12 50.0 0.63 NOS < 6 34 45.3 22 43.1 12 50.0 SHS NOS ≥ 6 53 45.7 18 69.2 35 38.9 0.01 NOS < 6 63 54.3 8 30.7 55 61.1 Note. *Sum of number from different exposure variable might not add up to the category sum or overall total due to the number of studies providing risk estimates for different tobacco exposure variable differed. **Fisher exact probability test.
doi: 10.3967/bes2022.110
Evaluating the Quality of Case-control Studies involving the Association between Tobacco Exposure and Diseases in a Chinese Population based on the Newcastle-Ottawa Scale and Post-hoc Power
-
-
S2. The provincial distribution of the study area in China. This map was generated by ArcGIS, version 10.2.
Figure 1. Adequately reported NOS items. Items highlighted with a * are statistically significant between the Chinese journals and journals written in English.
Table 1. Basic information of the included literature
Basic information Number (n = 604) Proportion (%) Publication language Chinese journal 450 Modern Preventive Medicine 26 5.8 Chinese Journal of Public Health 25 5.5 Chinese Journal of Prevention and Control of Chronic Diseases 21 4.7 Other 378 84.0 Journal written in English 154 International Journal of Cancer 15 9.7 Cancer Causes Control 10 6.5 Asian Pacific Journal of Cancer Prevention 9 5.8 Other 120 77.9 Disease Lung cancer 87 14.4 Esophageal cancer 59 9.8 Gastric cancer 50 8.3 Breast cancer 29 4.8 Asthma 23 3.8 Liver cancer 21 3.5 Pulmonary tuberculosis 18 3.0 Ischemic stroke 17 2.8 Arteriosclerotic heart disease 20 3.3 Cervical cancer 13 2.2 Other 267 44.2 Tobacco exposure Only active smoking 488 80.8 Only SHS 88 14.6 Active smoking and SHS 28 4.6 Tobacco exposure variables* Smoking status 452 74.8 Ever smoker 406 67.2 Former smoker 52 8.6 Current smoker 58 9.6 Pack-years 49 8.1 No. of cigarettes/d 75 12.4 Second-hand smoke 116 19.2 Note. *Sum of the number from different exposure variables might not add up to the category sum or overall total because the number of studies providing risk estimates for different tobacco exposure variables differed.  下载: 导出CSV
S2. The distribution for post-hoc power values by the language and variables
Language Variables All, n Post hoc power (%) 1−β < 0.5 0.5 ≤ 1−β < 0.8 1−β ≥ 0.8 All Ever smoker 406 109 (26.8) 63 (15.5) 240 (59.1) Current smoker 58 12 (20.7) 8 (13.8) 38 (65.5) Former smoker 52 27 (51.9) 6 (11.5) 19 (36.6) Pack-year 49 33 (67.3) 5 (10.2) 11 (22.5) No. of cigarettes/d 75 51 (68.0) 8 (10.7) 16 (21.3) SHS 116 27 (23.3) 30 (25.9) 59 (50.8) English Ever smoker 103 33 (32.0) 11 (10.7) 59 (57.3) Current smoker 36 6 (16.7) 5 (13.9) 25 (69.4) Former smoker 35 19 (54.3) 5 (14.3) 11 (31.4) Pack-year 39 24 (61.5) 5 (12.8) 10 (25.7) No. of cigarettes/d 51 34 (66.7) 4 (7.8) 13 (25.5) SHS 26 13 (50.0) 7 (26.9) 6 (23.1) Chinese Ever smoker 303 76 (25.1) 52 (17.2) 175 (57.7) Current smoker 22 6 (27.3) 3 (13.6) 13 (59.1) Former smoker 17 8 (47.1) 1 (6.9) 8 (47.1) Pack-year 10 9 (90.0) 0 (0.0) 1 (10.0) No. of cigarettes/d 24 17 (70.8) 4 (16.7) 3 (12.5) SHS 90 14 (15.6) 23 (25.5) 53 (58.9)
下载: 导出CSV
Table 2. Agreement between NOS scores and the post-hoc powers of statistical outcome for different tobacco exposure variables
Variables All, n Post-hoc power Z value P value Median IQR Ever smoker NOS ≥ 6 162 0.93 0.48−1.00 0.54 0.59 NOS < 6 244 0.88 0.46−1.00 Current smoker NOS ≥ 6 36 0.97 0.56−1.00 0.73 0.47 NOS < 6 22 0.99 0.76−1.00 Former smoker NOS ≥ 6 35 0.43 0.11−0.96 0.73 0.46 NOS < 6 17 0.63 0.21−1.00 Pack-year NOS ≥ 6 30 0.30 0.12−0.64 −0.08 0.93 NOS < 6 19 0.30 0.10−0.88 No. of cigarettes/d NOS ≥ 6 41 0.42 0.13−0.84 −1.57 0.12 NOS < 6 34 0.23 0.06−0.52 SHS NOS ≥ 6 53 0.73 0.43−0.97 −0.78 0.44 NOS < 6 63 0.82 0.59−0.98 Note. NOS, Newcastle-Ottawa Scale; IQR, interquartile range; SHS, second-hand smoke.
下载: 导出CSV
S1. The distribution of NOS scores by different tobacco exposure variables
Variables All English journals Chinese journals P value n % n % n % All* NOS ≥ 6 251 41.5 84 54.6 167 37.1 0.01 NOS < 6 353 58.4 70 45.4 283 62.9 Ever smoker NOS ≥ 6 162 39.9 50 50.0 112 36.6 0.02 NOS < 6 244 60.1 50 50.0 194 63.4 Current smoker NOS ≥ 6 36 62.1 26 70.3 10 47.6 0.10 NOS < 6 22 37.9 11 29.1 11 52.4 Former smoker NOS ≥ 6 35 67.3 10 58.8 25 71.4 0.53 NOS < 6 17 32.7 7 41.2 10 28.6 Pack-year NOS ≥ 6 30 38.8 23 59.0 7 56.8 0.72** NOS < 6 19 61.2 16 41.0 3 43.2 Number of cigarettes/d NOS ≥ 6 41 54.7 29 56.9 12 50.0 0.63 NOS < 6 34 45.3 22 43.1 12 50.0 SHS NOS ≥ 6 53 45.7 18 69.2 35 38.9 0.01 NOS < 6 63 54.3 8 30.7 55 61.1 Note. *Sum of number from different exposure variable might not add up to the category sum or overall total due to the number of studies providing risk estimates for different tobacco exposure variable differed. **Fisher exact probability test.
下载: 导出CSV
-
[1] Zhou MG, Wang HD, Zeng XY, et al. Mortality, morbidity, and risk factors in China and its provinces, 1990-2017: A systematic analysis for the global burden of disease study 2017. Lancet, 2019; 394, 1145−58. doi: 10.1016/S0140-6736(19)30427-1 [2] Hu KR, Wang YT, Shi YL, et al. Meta analysis on the relative risk of tobacco-related diseases in China. China Prev Med, 2021; 22, 250−6. (In Chinese [3] Wells GA, Shea B, O’Connell D, et al. The Newcastle-Ottawa scale (NOS) for assessing the quality of nonrandomised studies in meta-analyses. http://www.Ohri.Ca/programs/clinical_epidemiology/oxford.Asp [2022-3-4]. [4] Von Elm E, Altman DG, Egger M, et al. The strengthening the reporting of observational studies in epidemiology (STROBE) statement: guidelines for reporting observational studies. Lancet, 2007; 370, 1453−7. doi: 10.1016/S0140-6736(07)61602-X [5] Oremus M, Oremus C, Hall GB, et al. Inter-rater and test-retest reliability of quality assessments by novice student raters using the Jadad and Newcastle-Ottawa scales. BMJ Open, 2012; 2, e001368. doi: 10.1136/bmjopen-2012-001368 [6] Rosner B. Fundamentals of biostatistics. 8th ed. Cengage Learning. 2015. [7] Stanley TD, Doucouliagos H, Ioannidis JPA. Retrospective median power, false positive meta-analysis and large-scale replication. Res Synth Methods, 2022; 13, 88−108. doi: 10.1002/jrsm.1529 [8] Grimes DA, Schulz KF. Compared to what? Finding controls for case-control studies. Lancet, 2005; 365, 1429−33. doi: 10.1016/S0140-6736(05)66379-9 [9] Fejer R, Hartvigsen J, Kyvik KO, et al. The Funen neck and chest pain study: Analysing non-response bias by using national vital statistic data. Eur J Epidemiol, 2006; 21, 171−80. doi: 10.1007/s10654-006-0006-x [10] Ai FL, Hu KR, Shi YL, et al. Quality assessment of cohort studies literature on Chinese smoking by using Newcastle-Ottawa-Scale. Chin J Dis Control Prev, 2021; 25, 722−9. (In Chinese [11] Wei WQ, Zeng HM, Zheng RS, et al. Cancer registration in China and its role in cancer prevention and control. Lancet Oncol, 2020; 21, e342−9. doi: 10.1016/S1470-2045(20)30073-5 [12] Liu XH, Min XC, Ma Z, et al. Laparoscopic hepatectomy produces better outcomes for hepatolithiasis than open hepatectomy: an updated systematic review and meta-analysis. Int J Surg, 2018; 51, 151−63. doi: 10.1016/j.ijsu.2018.01.016 [13] Ma L, Zhang L, Gao XH, et al. Dietary factors and smoking as risk factors for PD in a rural population in China: a nested case-control study. Acta Neurol Scand, 2006; 113, 278−81. doi: 10.1111/j.1600-0404.2005.00571.x -
 22110+Supplementary Materials.pdf

-

 点击查看大图
计量
- 文章访问数: 1866
- HTML全文浏览量: 1101
- PDF下载量: 75
- 被引次数: 0


 Quick Links