

 下载:
下载:


-
Infertility has become an important public health issue with the decline of the global fertility rate. According to the latest report from the World Health Organization (WHO), approximately 17.5% of the adult population are affected by infertility worldwide[1], with nearly 50% of cases attributed to male factors, primarily poor semen quality[2,3]. Over the past few years, considerable evidence has shown a decrease in semen quality worldwide[4–6]. For example, an updated retrospective study of 119,972 men from 2002 to 2017 revealed that the sperm count has decreased by about 10% in the past 16 years[7]. Additionally, a 15-year study conducted in China revealed a downward trend in semen quality, particularly in terms of sperm concentration, sperm count, and progressive motility, among 30,636 young Chinese men[8]. According to previous studies, some individual factors including obesity, smoking, drinking, and chronic diseases (e.g., diabetes, hypertension, and metabolic syndrome) are associated with the poor semen quality[4,9,10]. However, these factors may not be sufficient to fully explain the dramatic decrease of semen quality over a short period of time. Thus, the reasons for the decline in semen quality remain unclear. Recently, an increasing number of studies have linked environmental factors such as air pollution and climate change to reduced semen quality[11–14].
According to a recent study, climate change will be the biggest environmental threat to human health in the 21st century[15]. Nighttime temperatures are continuing to rise as global warming accelerates[16]. In the future, the intensity of nighttime warming is projected to exceed that of daytime warming[17]. Moreover, because people will fail to achieve a good nocturnal rest, heat stress will be exacerbated at night[18]. Therefore, the health effects of heat exposure during nighttime need to be investigated. Temperature is a crucial factor for sperm development, with the optimum temperature being between 2 °C and 4 °C below the core body temperature[19]. Several epidemiological studies have related exposure to high environmental temperatures to decreased semen quality[20–22]. However, most existing studies on the effects of ambient temperature on male reproductive health have focused on daily average temperatures[20,22]. To the best of our knowledge, there is few evidence showing the potential effects of nighttime warming on semen quality[12]. Moreover, most previous studies on semen quality were conducted in a single geographical region with relatively small sample sizes[11,14,20], which may limit the generalizability of their findings. Furthermore, ambient temperature varies spatially. Thus, more studies involving different geographical regions with distinct meteorological conditions are needed to comprehensively explore the associations between hot night exposure and human semen quality.
To fill these gaps, we performed a large-scale population-based study involving 6,640 men attending 6 fertility centers during 2014–2020 to analyze the adverse effects of hot night exposure on human semen quality. In particular, we aimed to explore and quantify the integrated exposure-response relationship of nocturnal temperature to semen quality in terms of the intensity and duration of hot nights, taking into account the different meteorological conditions in different geographical regions. In the context of global climate change and decreasing semen quality, our study would inform the development and implementation of public health policies.
-
Semen samples from men were gathered from various regions in China (including Guangdong, Sichuan, Henan, Shanxi, Zhejiang, and Hubei) from 2014 to 2020. These provinces have varying socioeconomic and meteorological conditions. Initially, 97,451 semen samples corresponding to 49,374 donors were recorded in the study period. The process of selecting and assessing sperm donation volunteers was performed in accordance with the standard protocol outlined in the Fifth Edition of the WHO Laboratory Manual for the Testing and Processing of Human Semen[23]. Briefly, sperm donors would be excluded if they have hereditary diseases; infectious diseases; mental illnesses; or diseases associated with poor semen quality, including varicocele, azoospermia, or cryptorchidism. In addition, those who fail routine semen screening tests would be excluded. Moreover, 5,671 men who did not comply with the 2–7 days abstinence requirement were excluded, considering that abstinence periods might be implicated in abnormal semen quality. Besides, some covariates with unreasonable or missing values were also excluded (n = 888), including ethnicity (n = 1), residential address (n = 434), and semen parameters (except for the absence of total motility in Sichuan and Shanxi provinces) (n = 453). Another 139 participants were excluded because their semen was tested out of the fertile age range of 19–45 years. We also eliminated 9,442 subjects living outside the study area to minimize exposure errors. Finally, since human sperm development takes roughly 90 days, we focused on the 90 days prior to the sperm donation date as the exposure window[24]. We identified all semen samples with exposure windows between May and September, which represent the five hottest months of the year, to investigate nighttime heat exposure[25]. More specifically, semen samples with donation dates not within July 30–September 30 were excluded from the analysis because they did not have complete hot night exposure data. Ultimately, 13,501 semen samples collected from 6,640 donors between 2014 and 2020 were incorporated into this large-scale retrospective cohort study (Figure 1), with 32.5% of donors donating sperm multiple times.

Figure 1. Study flow chart for selection of sperm donors in 6 geographic regions of China during the period of 2014–2020.
-
Once sperm donation volunteers completed the abstinence period and met the requirements, they masturbated and placed the semen in special sterile containers[11,26]. This multicentric study collected and evaluated semen quality parameters such as sperm concentration (× 106/mL), sperm count (× 106), and sperm motility (both progressive motility and total motility, %). As reported in our earlier studies, these parameters were selected as the primary indicators to assess semen quality[11,26,27]. Information on sperm total motility data was unavailable in Sichuan and Shanxi provinces. The testing of semen quality parameters was performed in strict accordance with the Fifth Edition of the WHO Laboratory Manual for the Testing and Processing of Human Semen[23]. Any personal information was made anonymous. Moreover, laboratory quality control technicians were regularly trained.
-
During the study period, the ERA5-Land dataset, a global reanalysis dataset for state-of-the-art land-based applications with a spatial resolution of 0.1° × 0.1°, provided hourly gridded meteorological data for the 6 regions[28]. Previous studies have found a high correlation between ERA5-Land and stations’ temperature data (with a median Pearson’s correlation coefficient of 0.987 and 94% of cities above 0.9) by comparing the effect estimates from ERA5-Land data with those based on observations, confirming the validity of gridded data[29,30]. We extracted hourly air temperature and dew point temperature for all grids within 6 regions in China between 2014 and 2020, and we used the dew point temperature to calculate the relative humidity (RH)[31]. A multiple imputation algorithm was used to impute missing values representing less than 0.5% of the data using the “mice” package within R software.
Daily 24-h average aerodynamic fine particulate matter with a diameter of ≤ 2.5 μm (PM2.5, μg/m3) at a spatial resolution of 0.01° × 0.01° and gaseous pollutants including daily maximum 8-h average ozone (O3, μg/m3) and daily 24-h average nitrogen dioxide (NO2, μg/m3) at a spatial resolution of 0.1° × 0.1° were obtained from the China High Air Pollutant (CHAP) dataset. Previous studies have demonstrated the validity of this approach, which takes into account the spatial and temporal heterogeneity of air pollution[32–34]. Individual exposure levels to RH, PM2.5, NO2, and O3 of sperm donors throughout spermatogenesis were estimated by averaging the daily concentrations for 0–90 days prior to semen donation.
-
Hot night excess (HNE) and hot night duration (HND) were used to quantify the intensity and duration of hot night[35], respectively. HND was calculated by summing the excess of nighttime high temperature hours, and HNE was the excess sum of nighttime high temperature. Specifically, the formulas are as follows:
$$ HNE = \displaystyle\sum\nolimits_{j = 1}^{{n_{j}}} {({t_{ij}} - {T_{thr}})} \times {I_{{T_{thr}}}}({t_{ij}}) $$ (1) $$ HND = \frac{{\displaystyle\sum\nolimits_{j = 1}^{{n_j}} {{I_{{T_{thr}}}}({t_{ij}})} }}{n_j} \times 100 $$ (2) $$ \begin{aligned} & {I_{{T_{thr}}}}({t_{ij}}) = \left\{ \begin{aligned} & 0 \quad if \quad {t_{ij}} < {T_{thr}} \\ & 1 \quad if \quad {t_{ij}} \geqslant {T_{thr}} \end{aligned} \right. \end{aligned} $$ (3) where nj represents the number of night hours on day j, tij represents the hourly temperature at hour I on day j, ITthr represents a conditional function of {x ε R | x ≥ Tthr}, and Tthr is the local temperature threshold.
As suggested in previous studies[25,36], the temperature threshold was defined as the 95th percentile of daily minimum temperatures (Tmin) (°C) for historical periods (2014–2020) in our main analysis, reflecting regional acclimation to ambient temperature[37]. To account for the potential influence of different temperature adaptations and to ensure the reliability of the findings, two definitions of temperature thresholds were used: the 90th and 97.5th percentiles of the Tmin distribution during the warmer seasons[25]. Night is the time between sundown on day i and dawn on day i+1[35]. The local sunrise and sunset time across regions during the study period was calculated by using the “maptools” package within R software.
-
As the present study involved repeated measurements, multivariate linear mixed models incorporating subject–specific random intercepts[38] were used to evaluate the nighttime warming-semen quality relationship. For descriptive analyses, the means (x) and standard deviations (s) of semen parameters were calculated based on age (< 30 years, 30–39 years, or ≥ 40 years), ethnicity (Han, or others), and abstinence period (2–3 days, 4–5 days, or 6–7 days). Moreover, intergroup comparisons of numerical variables were made using the Wilcoxon rank sum test. In the main analysis, we first performed a Box Cox transformation of semen quality parameters, making them satisfy or approximately satisfy a normal distribution[39]. Then, the semen quality parameters were normalized making all s and variances equal to 1 and comparable[26]. Thus, the regression coefficients of the linear mixed model allowed the impact of exposure to hot nights on the change in s of the outcome to be estimated.
In the primary analysis of our study, we used a multivariate model and incorporated center-specific random intercepts, following earlier studies that considered potential geographical heterogeneity across regions[40,41]. The potential confounding variables that may affect semen quality including abstinence period (2–3 days, 4–5 days, or 6–7 days), age (< 30 years, 30–39 years, or ≥ 40 years), and ethnicity (Han or others), were adjusted in all models. Moreover, we controlled for additional time-varying variables including the month of semen donation, mean RH, average PM2.5 concentration, and average NO2 concentration during the exposure window. For the purpose of better comparison, we also applied the same model parameter settings for average nighttime temperature at lag 0–90 days. The three nighttime temperature indices were modeled separately and the combined regression coefficients (β) together with the 95% confidence intervals (CIs) of the four semen parameters were estimated for a unit increase in nighttime heat exposure (HNE: °C, HND: %, nighttime temperature: °C). Additionally, we defined the natural cubic B–spline function of HND and HNE with two internal nodes at the 50th and 90th percentiles of each hot night index distribution to plot the exposure-response curves[25], and conducted nonlinearity tests with analysis of variance.
We performed several sensitivity analyses to obtain reliable results. First, based on the WHO’s standard[23], we only included subjects with sperm concentration ≥ 15 × 106/mL, sperm count ≥ 39 × 106, total motility ≥ 40%, and progressive motility ≥ 32% to avoid the influence of other unmeasured factors on poor semen quality. Then, we used the same model for reanalysis. Second, we readjusted the setting of the internal knots for the natural cubic B-spline function when plotting exposure-response curves. Building on previous studies[25,42], we defined the natural cubic B-spline function by replacing the two internal nodes at the 50th and 90th percentiles of each hot night index distribution with the 50th and 75th percentiles. Third, the model was additionally adjusted for the average temperature (in quartiles) during the exposure window to rule out the impact of ambient temperature at other times. Fourth, the model was adjusted for the occupation type of study subjects to assess the influence of occupation on human semen quality during hot nights. According to a recent study[43], occupations were categorized into two types including outdoor workers (traffic police and open-air workers) and indoor workers (students and indoor workers). Following the exclusion of samples with missing or implausible data for this covariate, the sensitivity analysis included 9,678 semen samples. Finally, based on prior studies[20,25], we additionally adjusted the daily O3 concentration in our model. Moreover, we analyzed duplicate samples from sperm donation volunteers separately to mitigate the potential bias introduced by individual factors and provide more reliable and accurate results.
Statistical analysis was performed using R (version 4.2.1; R Foundation for Statistical Computing; Vienna, Austria). The ArcGIS platform (version 10.2; Esri; Redlands, CA, USA) was used for geospatial visualization analysis. A two-sided test was used for all statistical tests, and statistical significance was considered at P < 0.05.
-
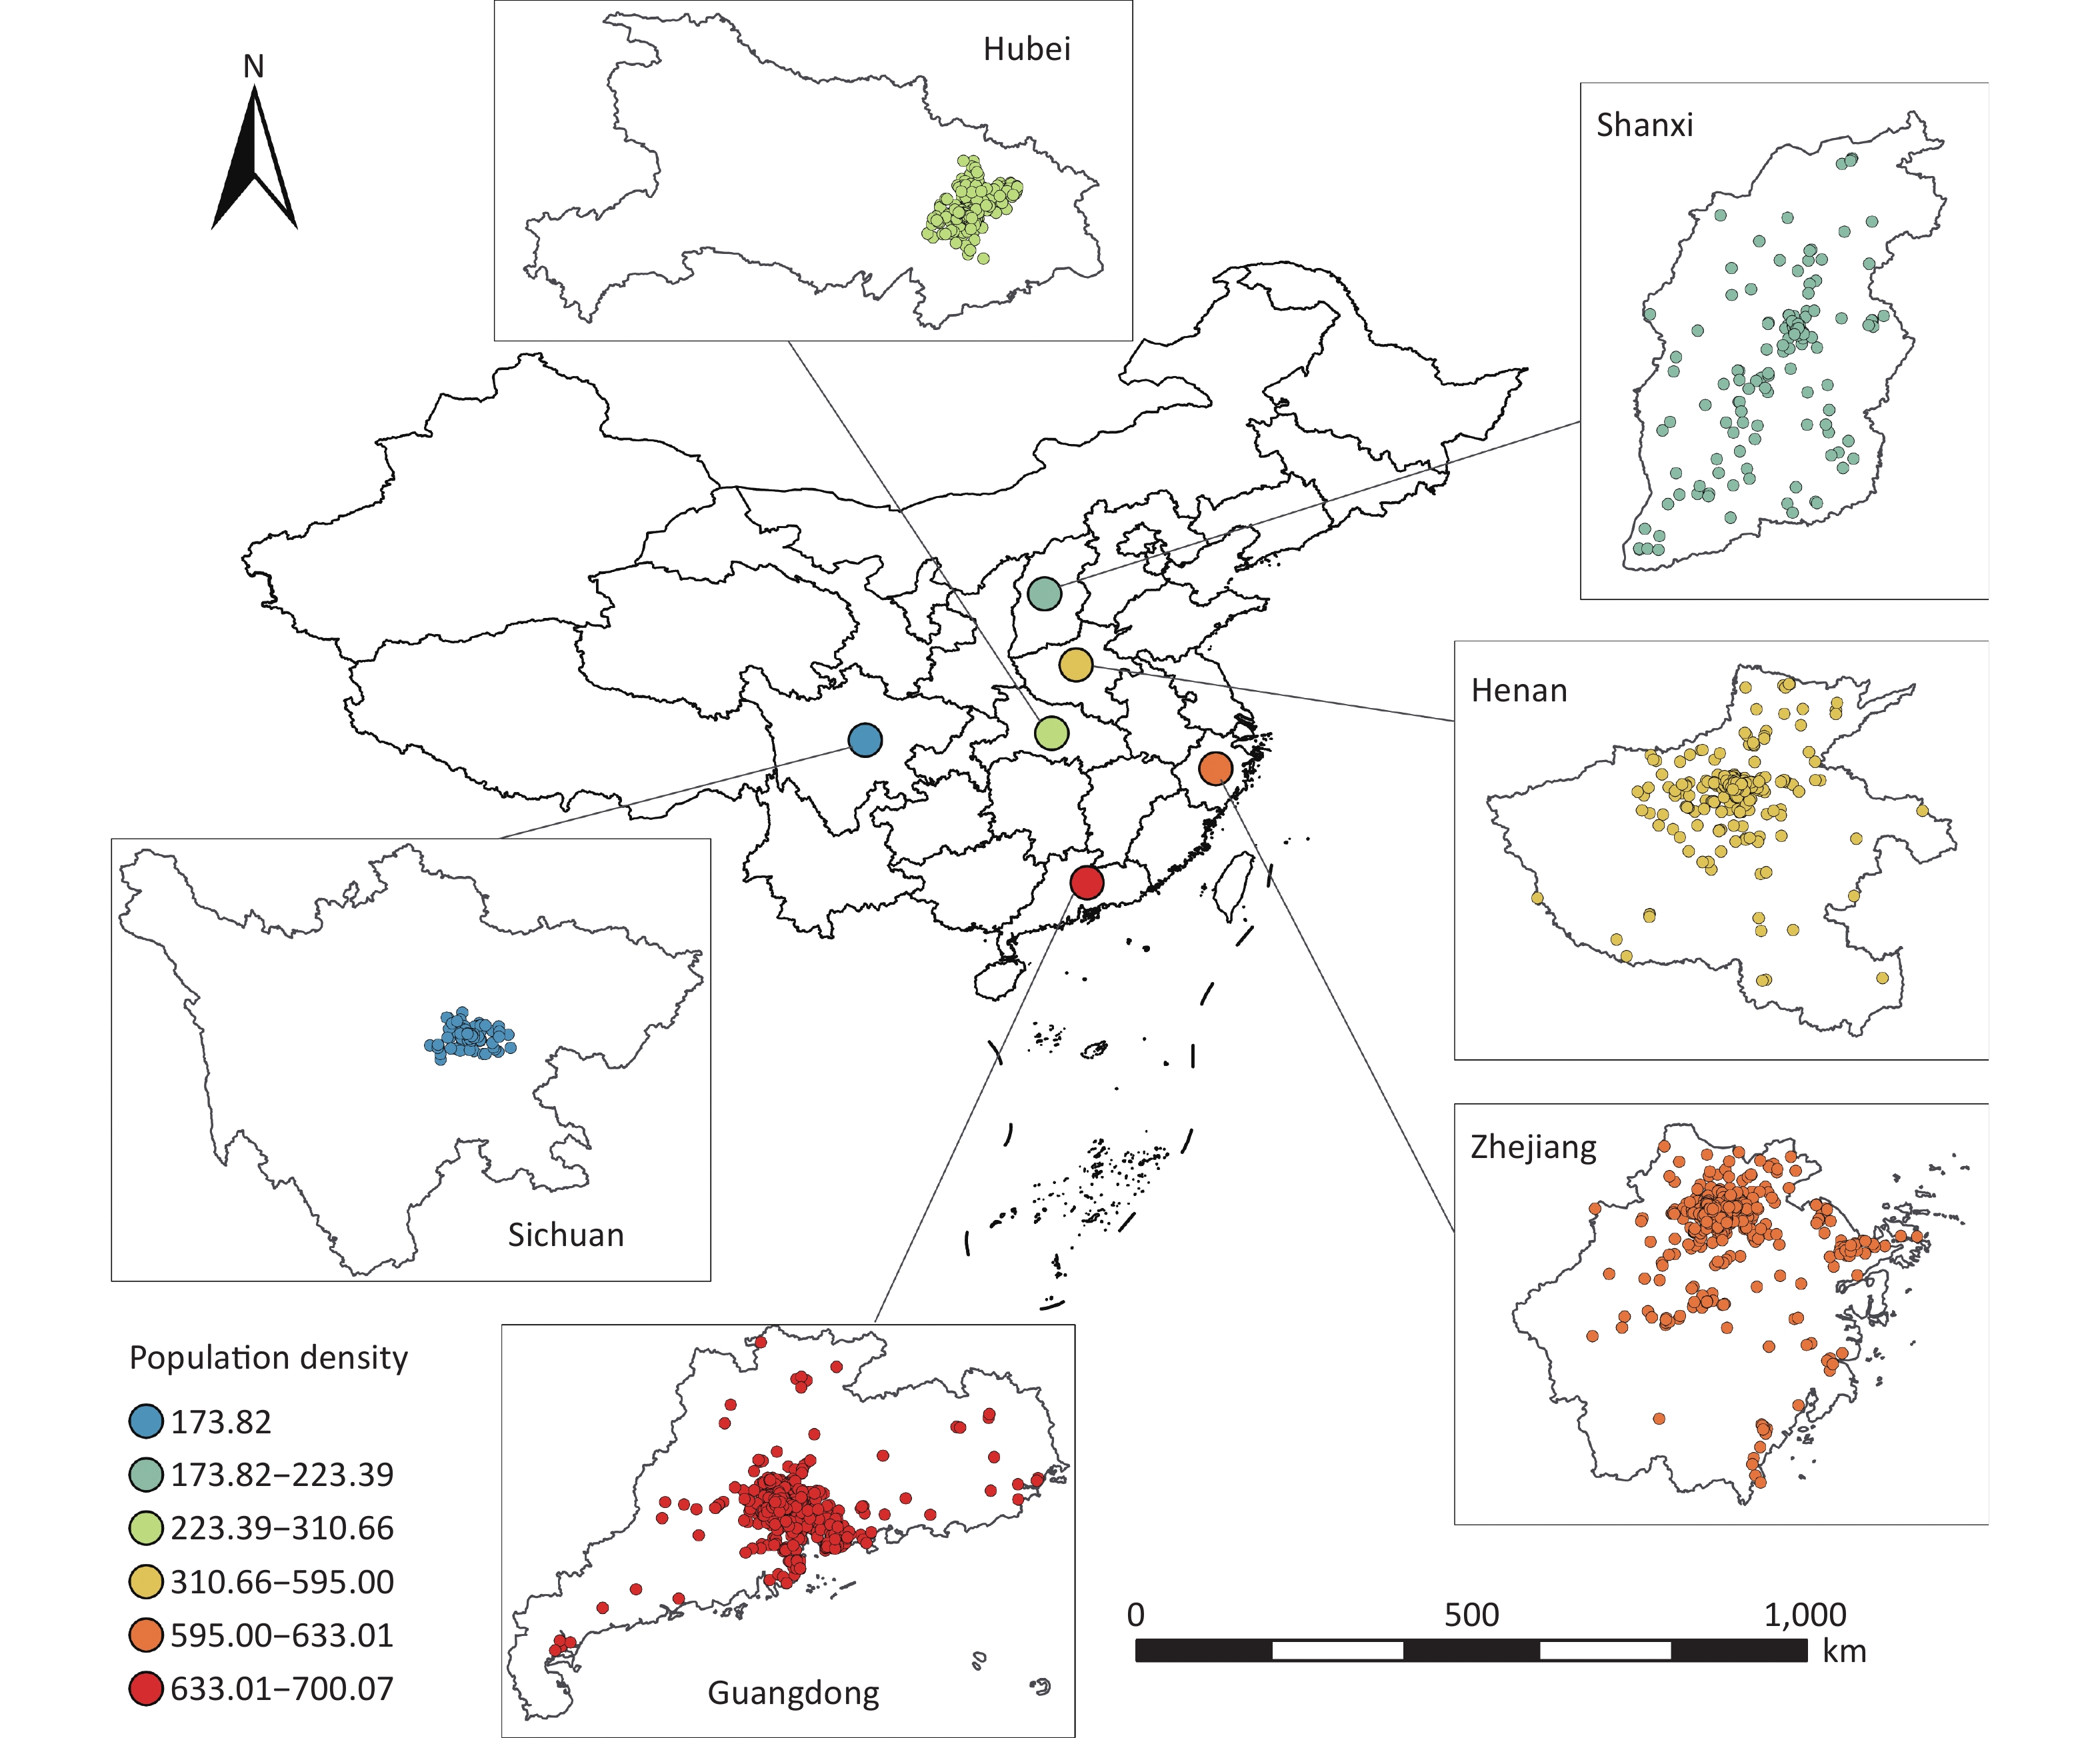
Figure 2 shows the geographical distribution of sperm donors and population density by region. In this study, the number of regional semen samples was approximately in line with the population density.
Supplementary Table S1 shows baseline temperatures and semen samples from the study area for the five hottest months. The highest daily mean temperature and nighttime temperature were observed in Guangdong (26.22 °C and 24.50 °C, respectively), and the lowest were detected in Sichuan (15.40 °C and 14.35 °C, respectively). The temperature threshold (95th percentile of Tmin) ranged from 22.90 °C in Sichuan to 26.55 °C in Hubei (Supplementary Table S1), reflecting geographical consistency as it depicts several geographical and landscape units of the study area, especially the influence of regional climate characteristics (subtropical monsoon climate, thermo-monsoon climate, and plateau-mountainous climate).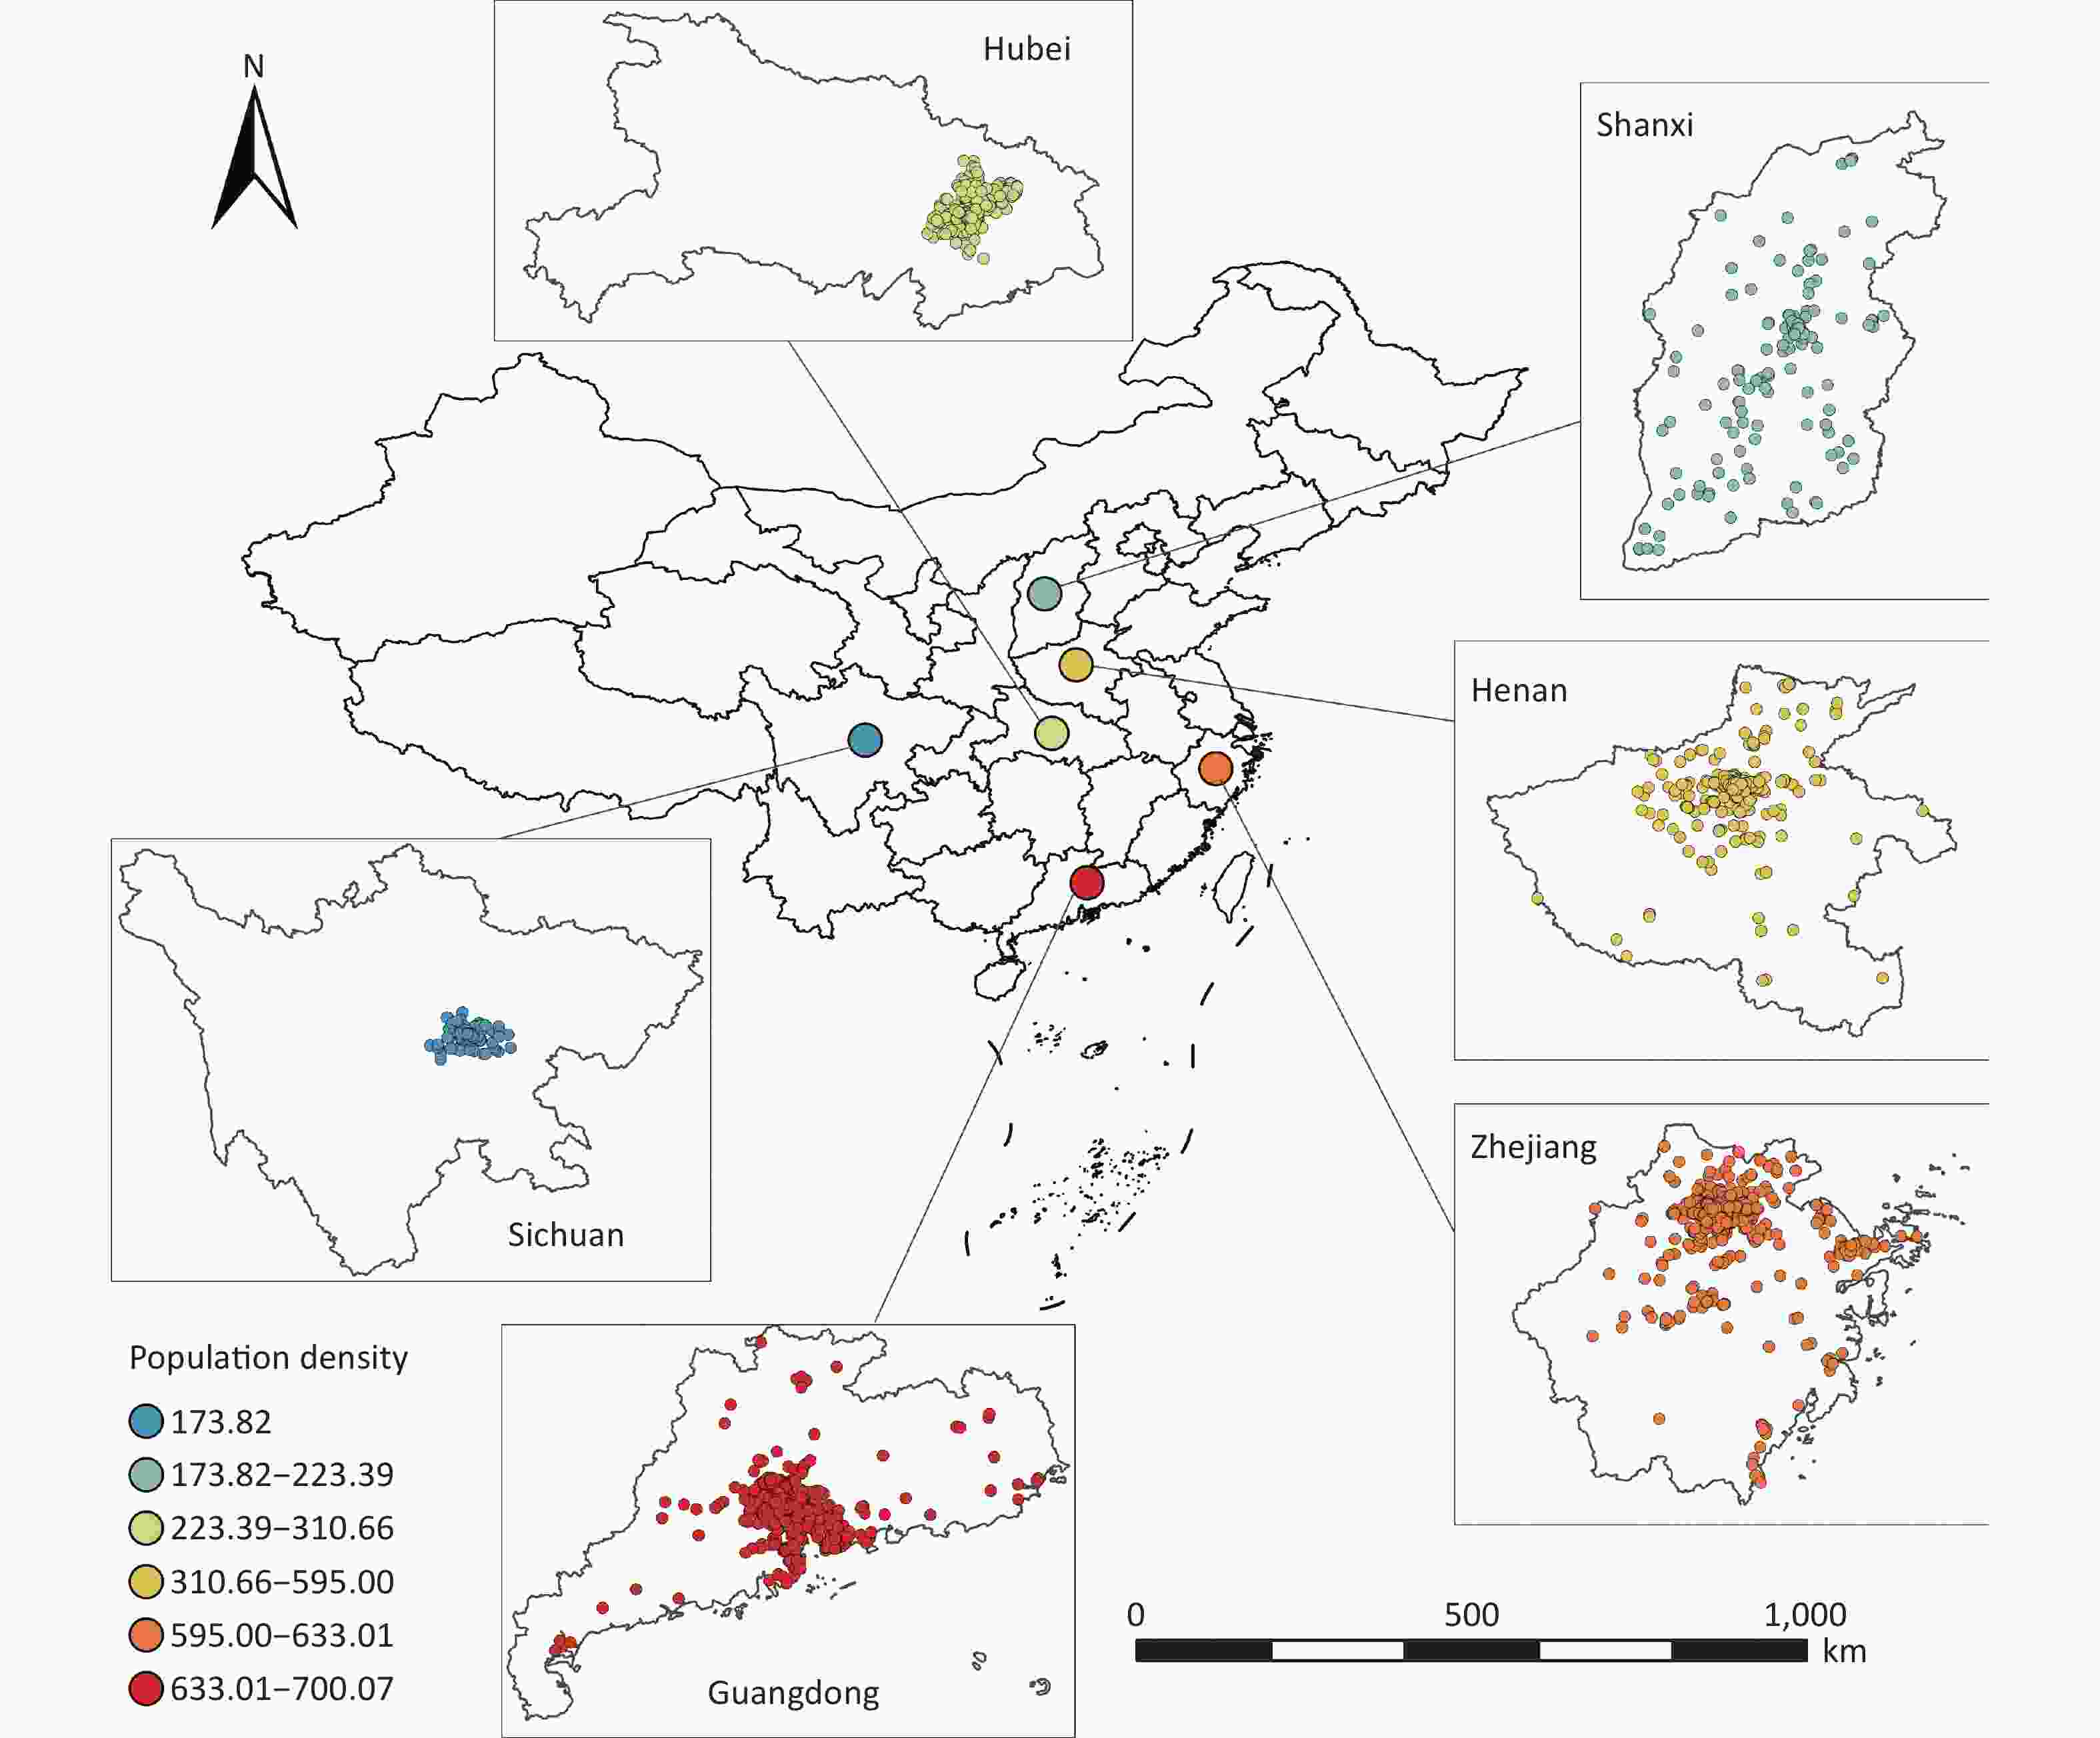
Figure 2. Geographical distributions of the study subjects and the population density of the 7th census in 6 regions of China during the study period 2014–2020. Map approval number: GS (2024) 0650.
Table 1 summarizes the baseline characteristics of semen parameters during 2014–2020. This multicenter study included 6,640 sperm donors with 13,501 semen samples from 6 provincial-level male reproductive centers in China. The mean values (± s) of sperm concentration, sperm count, progressive motility, and total motility of all participants were 72.80 ± 37.91 (× 106/mL), 254.43 ± 158.17 (× 106), 50.57 ± 14.10 (%), and 55.27 ± 13.12 (%), respectively. The mean age of all subjects was 27.0 years, and 71.8% of subjects were under 30 years of age. Most participants were Han ethnicity. Approximately 71.1% of semen specimens were collected and examined after four or more days of abstinence. Supplementary Table S2 presents the basic demographic characteristics of excluded subjects whose sperm donation dates fell outside the study period. The basic demographic characteristics of the excluded subjects were generally similar to those of the included subjects (Table 1).
Table 1. Characteristics of the study population and the distribution of semen parameters
Characteristics n (%) Semen quality (mean ± SD) Sperm concentration,
× 106/mLP-valuea Sperm count,
× 106P-valuea Progressive
motility, %P-valuea Total
motility, %P-valuea All Observations 13,501 (100) 72.80 ± 37.91 254.43 ± 158.17 50.57 ± 14.10 55.27 ± 13.12 Age, years < 0.001 0.389 0.003 < 0.001 < 30 9,694 (71.8) 71.16 ± 36.44 253.00 ± 156.64 50.72 ± 13.64 55.17 ± 12.92 30–39 3,313 (24.5) 76.49 ± 40.73 257.28 ± 159.99 50.52 ± 14.97 55.83 ± 13.41 ≥ 40 494 (3.7) 80.42 ± 43.47 263.13 ± 174.64 47.94 ± 16.66 53.33 ± 14.93 Ethnicity < 0.001 < 0.001 < 0.001 0.006 Han 13,116 (97.1) 72.52 ± 37.94 253.36 ± 158.27 50.48 ± 14.14 55.21 ± 13.15 Other 385 (2.9) 80.35 ± 35.32 290.87 ± 150.54 53.63 ± 12.51 57.24 ± 12.04 Abstinence period, days < 0.001 < 0.001 < 0.001 < 0.001 2–3 3,905 (28.9) 70.83 ± 36.61 222.00 ± 144.68 52.90 ± 14.20 57.68 ± 13.16 4–5 7,025 (52.0) 74.18 ± 37.98 262.41 ± 154.03 50.86 ± 13.63 55.20 ± 12.73 6–7 2,571 (19.1) 72.03 ± 39.46 281.85 ± 179.59 46.25 ± 14.27 51.72 ± 13.30 Note. Data were given as n (%) or mean ± SD as indicated. Column percentages may not add up to 100 due to rounding. SD, standardized deviation. aP-value was estimated using Wilcoxon rank sum test for intergroup comparisons of numerical variables. -
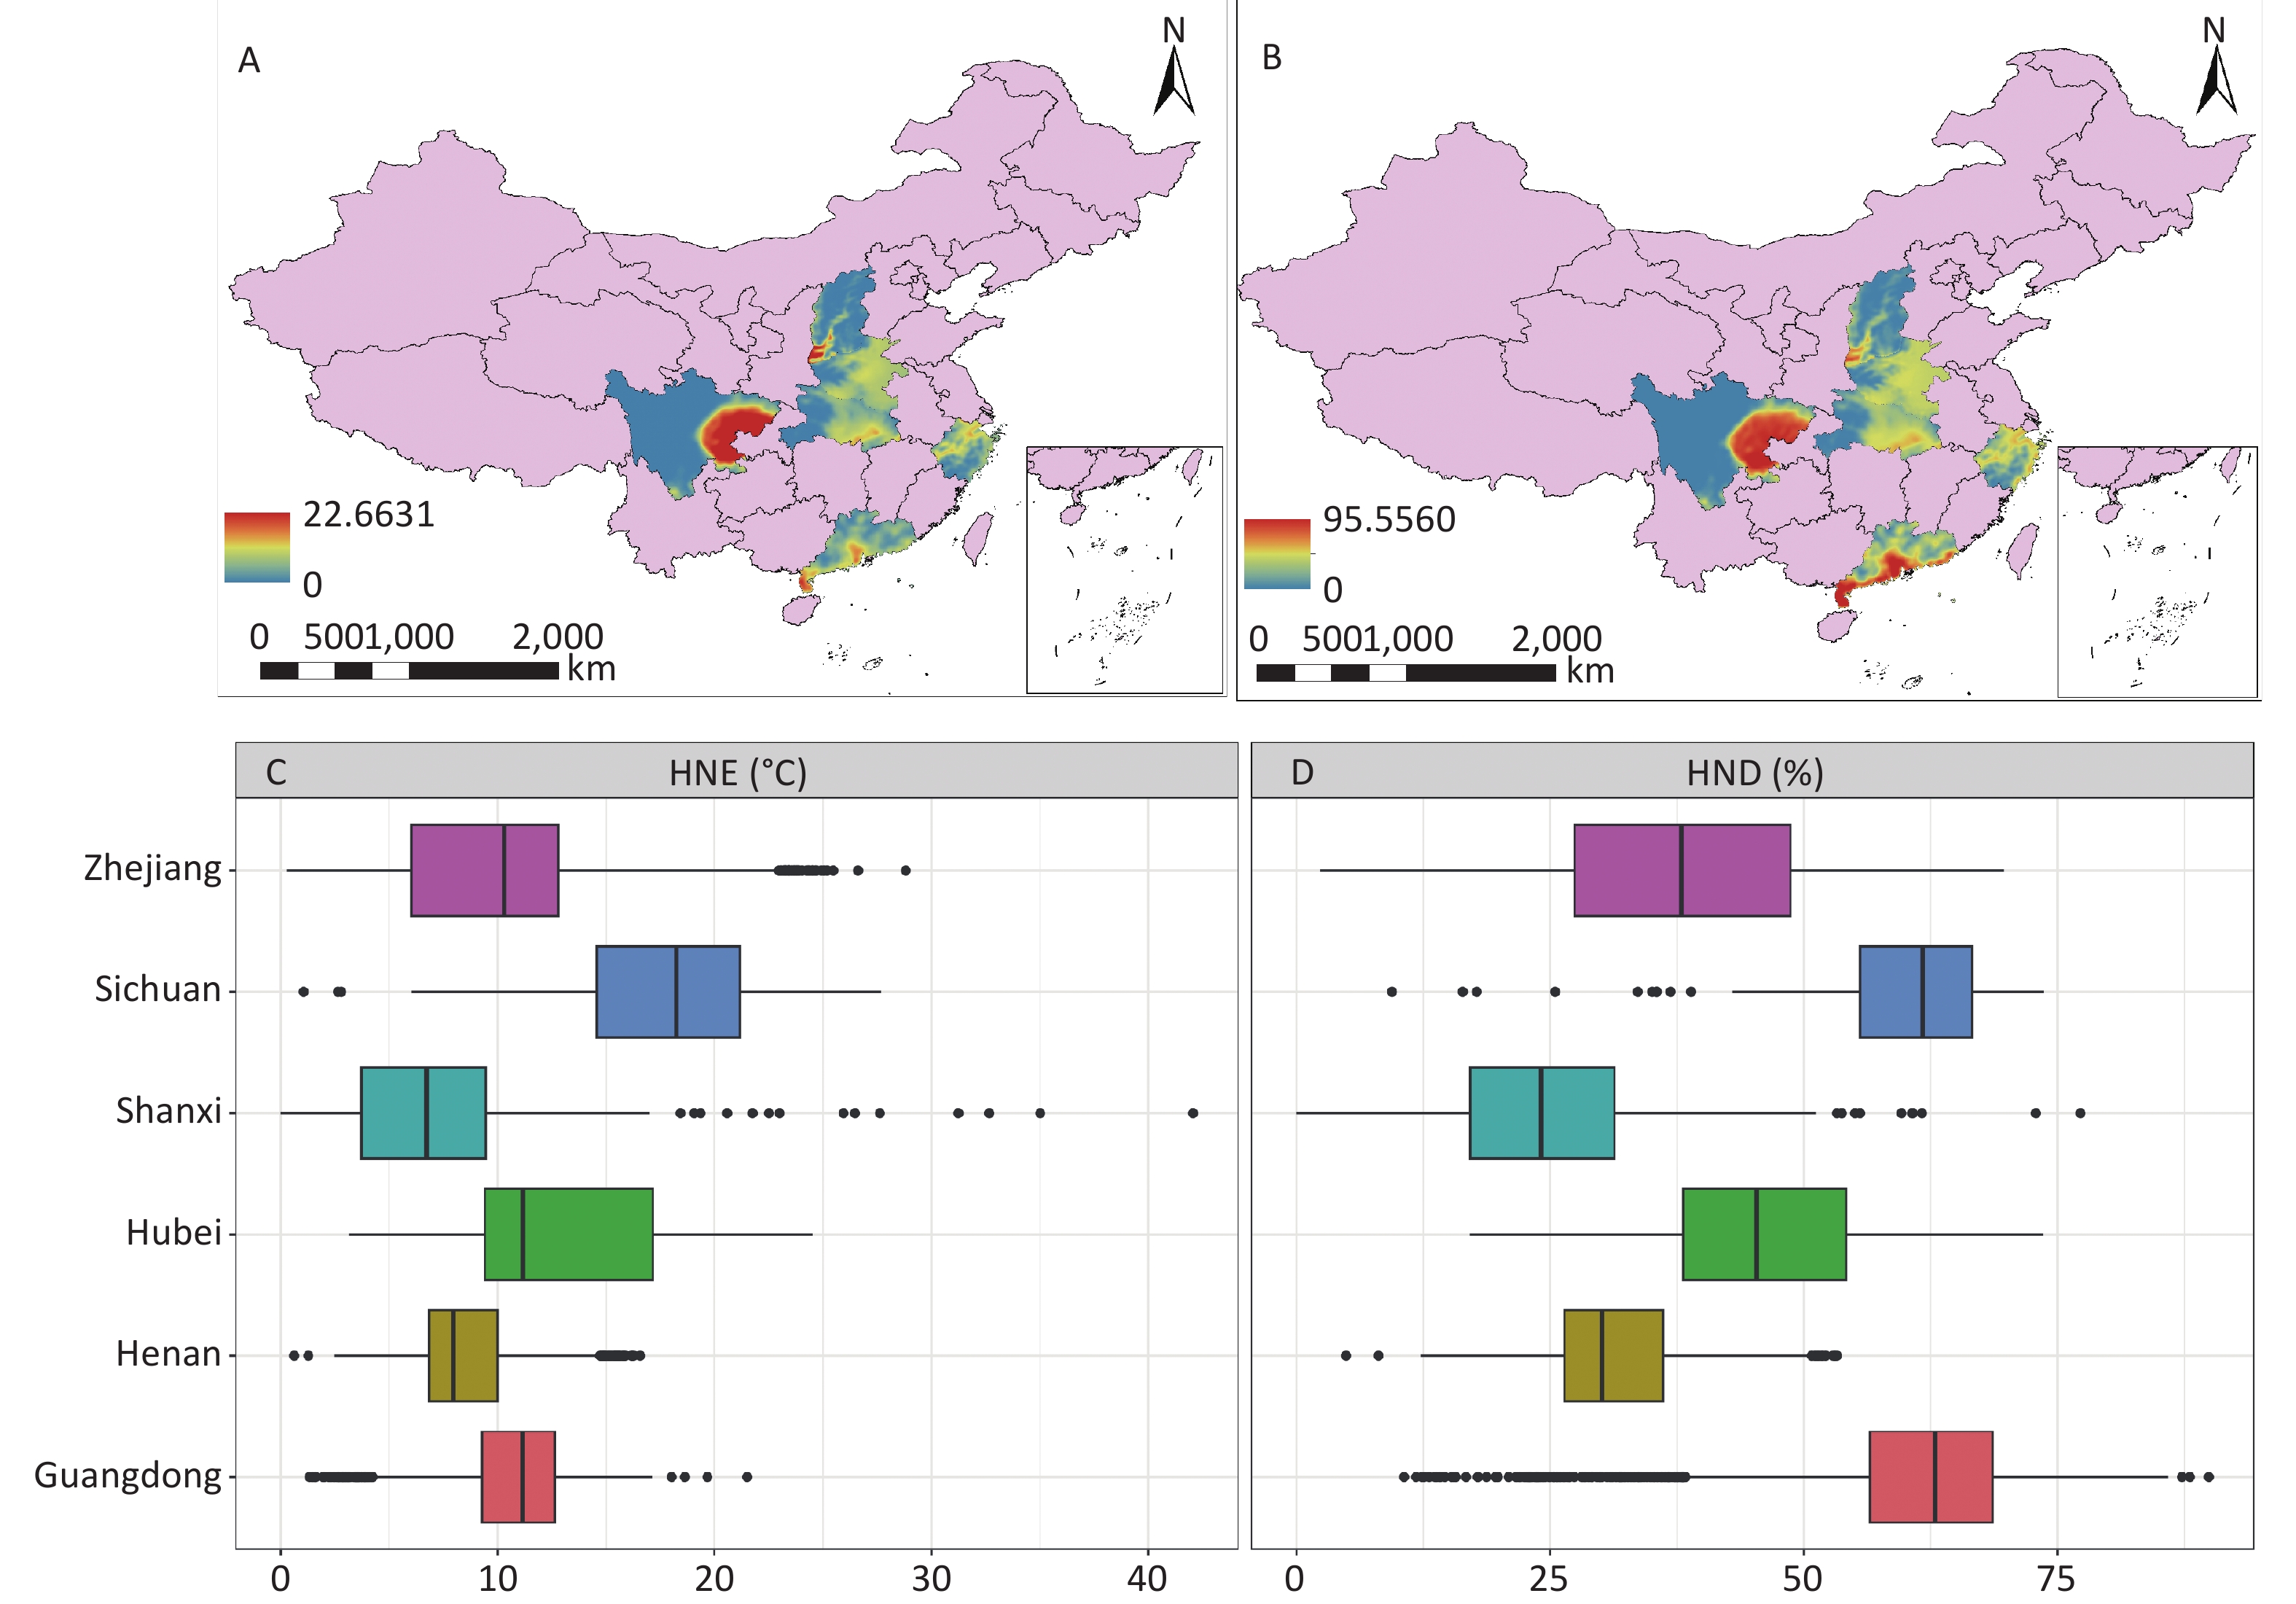
The distributions of daily average HNE (Figure 3A) and HND (Figure 3B) for all analyzed regions during the study period suggested consistent variations because of climate differences. The HNE and HND values were not as high as expected in subtropical areas such as Guangdong, which may explain the higher temperature thresholds for regional adaptation to temperatures. Of note, high HND values do not necessarily lead to nighttime excess, possibly because of slight variations in nighttime and thresholds across regions.
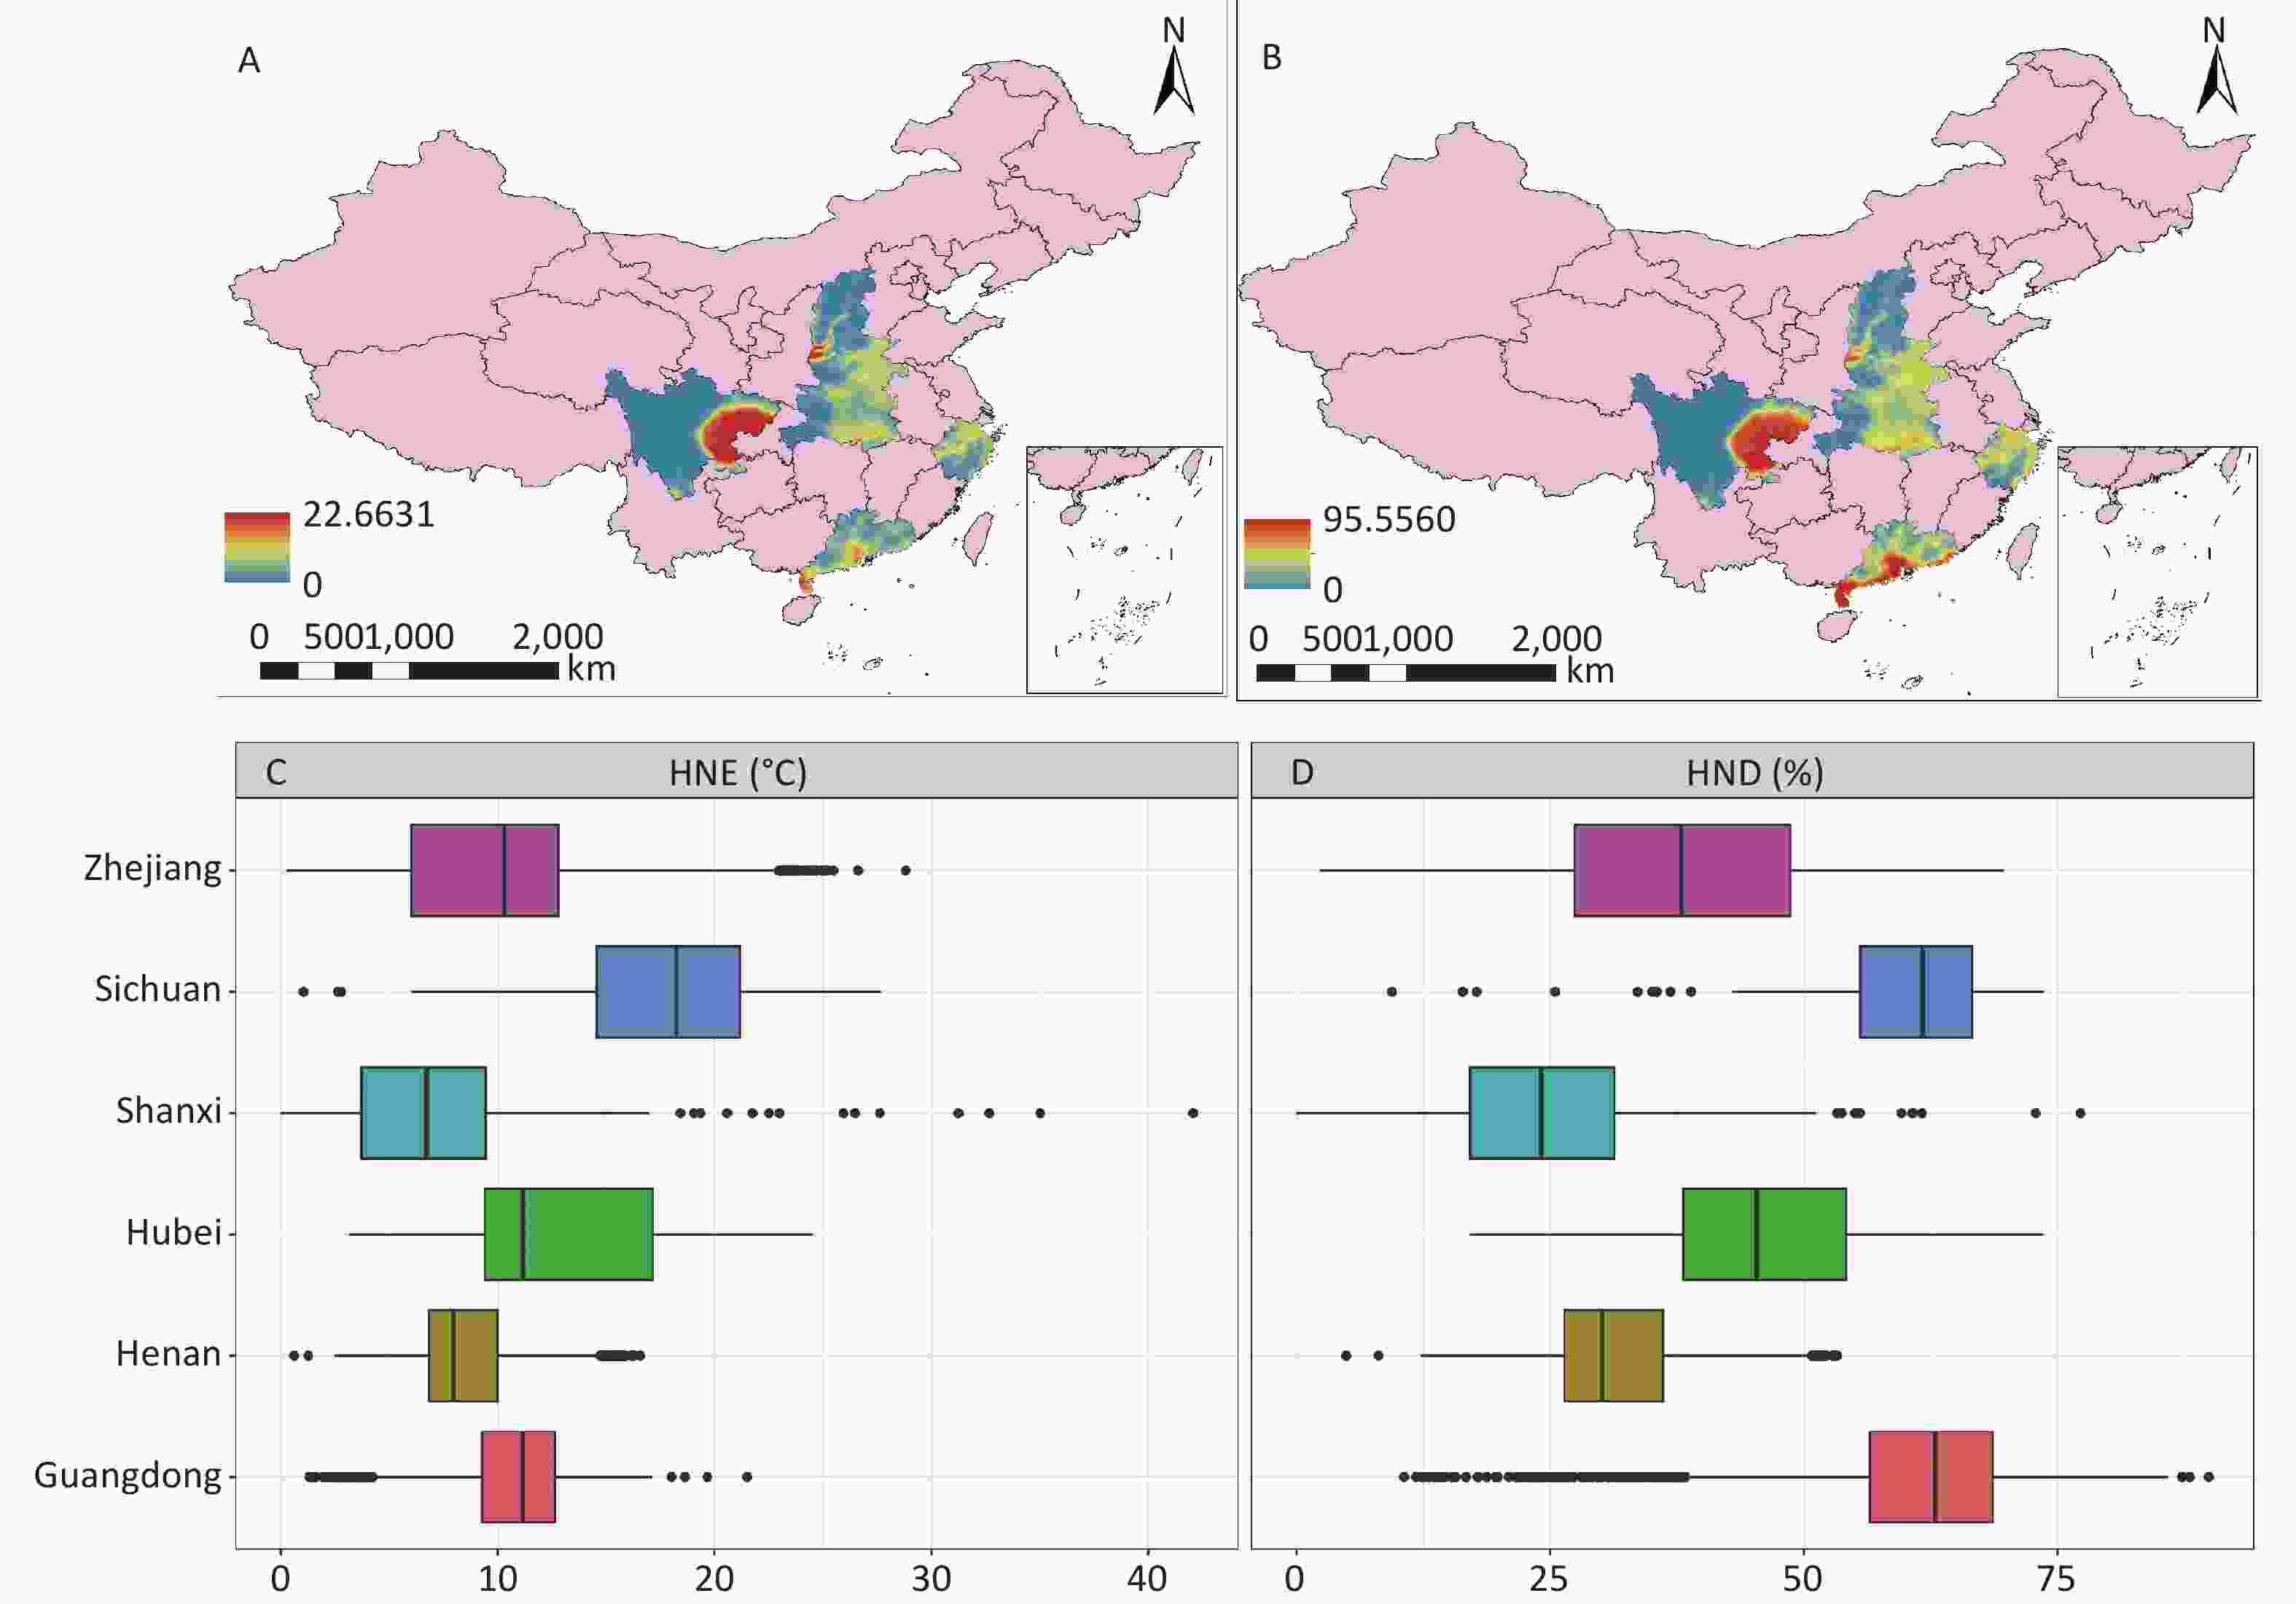
Figure 3. The spatial distributions of daily average HNE (A) and HND (B) in the study area during the study period, and the distributions of mean HNE (C) and HND (D) of sperm donors with 0–90 lag days. HND, hot night duration; HNE, hot night excess. Map approval number: GS (2024) 0650.
Figure 3C shows the mean HNE distribution over 0–90 lag days prior to semen collection for subjects in the study area. The median HNE varied between 6.7 °C and 18.2 °C. The highest (42.1 °C) and lowest HNE values (0 °C) were observed in Shanxi because of its vulnerability to climate change (located at the northwestern edge of the monsoon region). For the results of mean HND at 0–90 lag days (Figure 3D), the median values ranged from 24.1% to 62.9%, with higher values in Guangdong and Sichuan. The HNE and HND values were higher in Sichuan province, which may be related to the complex and diverse climate characteristics and the alternating influence of different monsoon circulations. Table 2 shows the quartile distributions of heat night exposure in the study population at different temperature thresholds during the 90 days prior to sperm donation. When the temperature threshold was set to the 95th percentile of the Tmin distribution, the mean HNE and HND values were 10.5765 (s: 3.8651) and 48.9744 (s: 16.5553), respectively.
Table 2. Distribution of hot night exposure during 0–90 days prior to sperm donation of study participants
Variable Mean ± SD Quartile of hot night exposure Q1 Q2 Q3 Q4 HNE (°C) HNE90a 12.9430 ± 4.7319 0–9.5506 9.5507–12.9231 12.9232–15.6891 15.6892–47.2843 HNE95b 10.5765 ± 3.8651 0–7.8751 7.8752–10.5329 10.5330–12.6927 12.6928–42.0644 HNE97.5c 7.3327 ± 2.9759 0–5.2674 5.2675–7.2767 7.2768–8.9288 8.9289–27.7664 HND (%) HND90a 64.6921 ± 20.9569 0–45.8809 45.8810–68.1413 68.1414–84.2827 84.2828–100.0000 HND95b 48.9744 ± 16.5553 0–34.1657 34.1658–51.1987 51.1988–62.7205 62.7206–89.9088 HND97.5c 37.3311 ± 13.0241 0–26.2487 26.2488–38.9360 38.9361–47.7855 47.7856–83.7624 Note. Data were given as mean ± SD or quartile (Q1, Q2, Q3, Q4) of hot night exposure as indicated. SD, standardized deviation; HNE, hot night excess; HND, hot night duration. aThe HNE90 (or HND90) values were calculated using the 90th percentile of the daily minimum temperature as the temperature thresholds. bThe HNE95 (or HND95) values were calculated using the 95th percentile of the daily minimum temperature as the temperature thresholds. cThe HNE97.5 (or HND97.5) values were calculated using the 97.5th percentile of the daily minimum temperature as the temperature thresholds. -
Table 3 shows the overall regression coefficients of semen quality in relation to per-unit increases in HNE and HND in 6 regional areas of China under different heat thresholds. Compared with non-hot nights, 1 °C increase in HNE was associated with a 0.0090 (95% CI: –0.0147, –0.0033) decline in progressive motility and a 0.0094 (95% CI: –0.0160, –0.0029) decline in total motility at temperature thresholds of 95% of Tmin. Moreover, a 1% increase in HND was associated with a 0.0021 (95% CI: –0.0040, –0.0003) and 0.0023 (95% CI: –0.0043, –0.0002) decline in progressive and total sperm motility, respectively. Consistent results were found regarding the association of HNE and HND calculated at other thermal thresholds of hot nights with semen quality. A higher temperature threshold exhibited more pronounced effects of HNE and HND on sperm motility. We also observed that nighttime temperature during the warm season had an obvious detrimental effect on the progressive motility (β: –0.0242, 95% CI: –0.0465, –0.0018) and total motility (β: –0.0267, 95% CI: –0.0522, –0.0012) of sperm throughout semen development. However, we did not observe a statistically significant association of the three nighttime temperature indices with sperm count and sperm concentration.
Table 3. The pooled regression coefficient of semen quality associated with hot nights at different temperature thresholds during 0–90 days before the date of semen cexamination
Variable Sperm concentration,
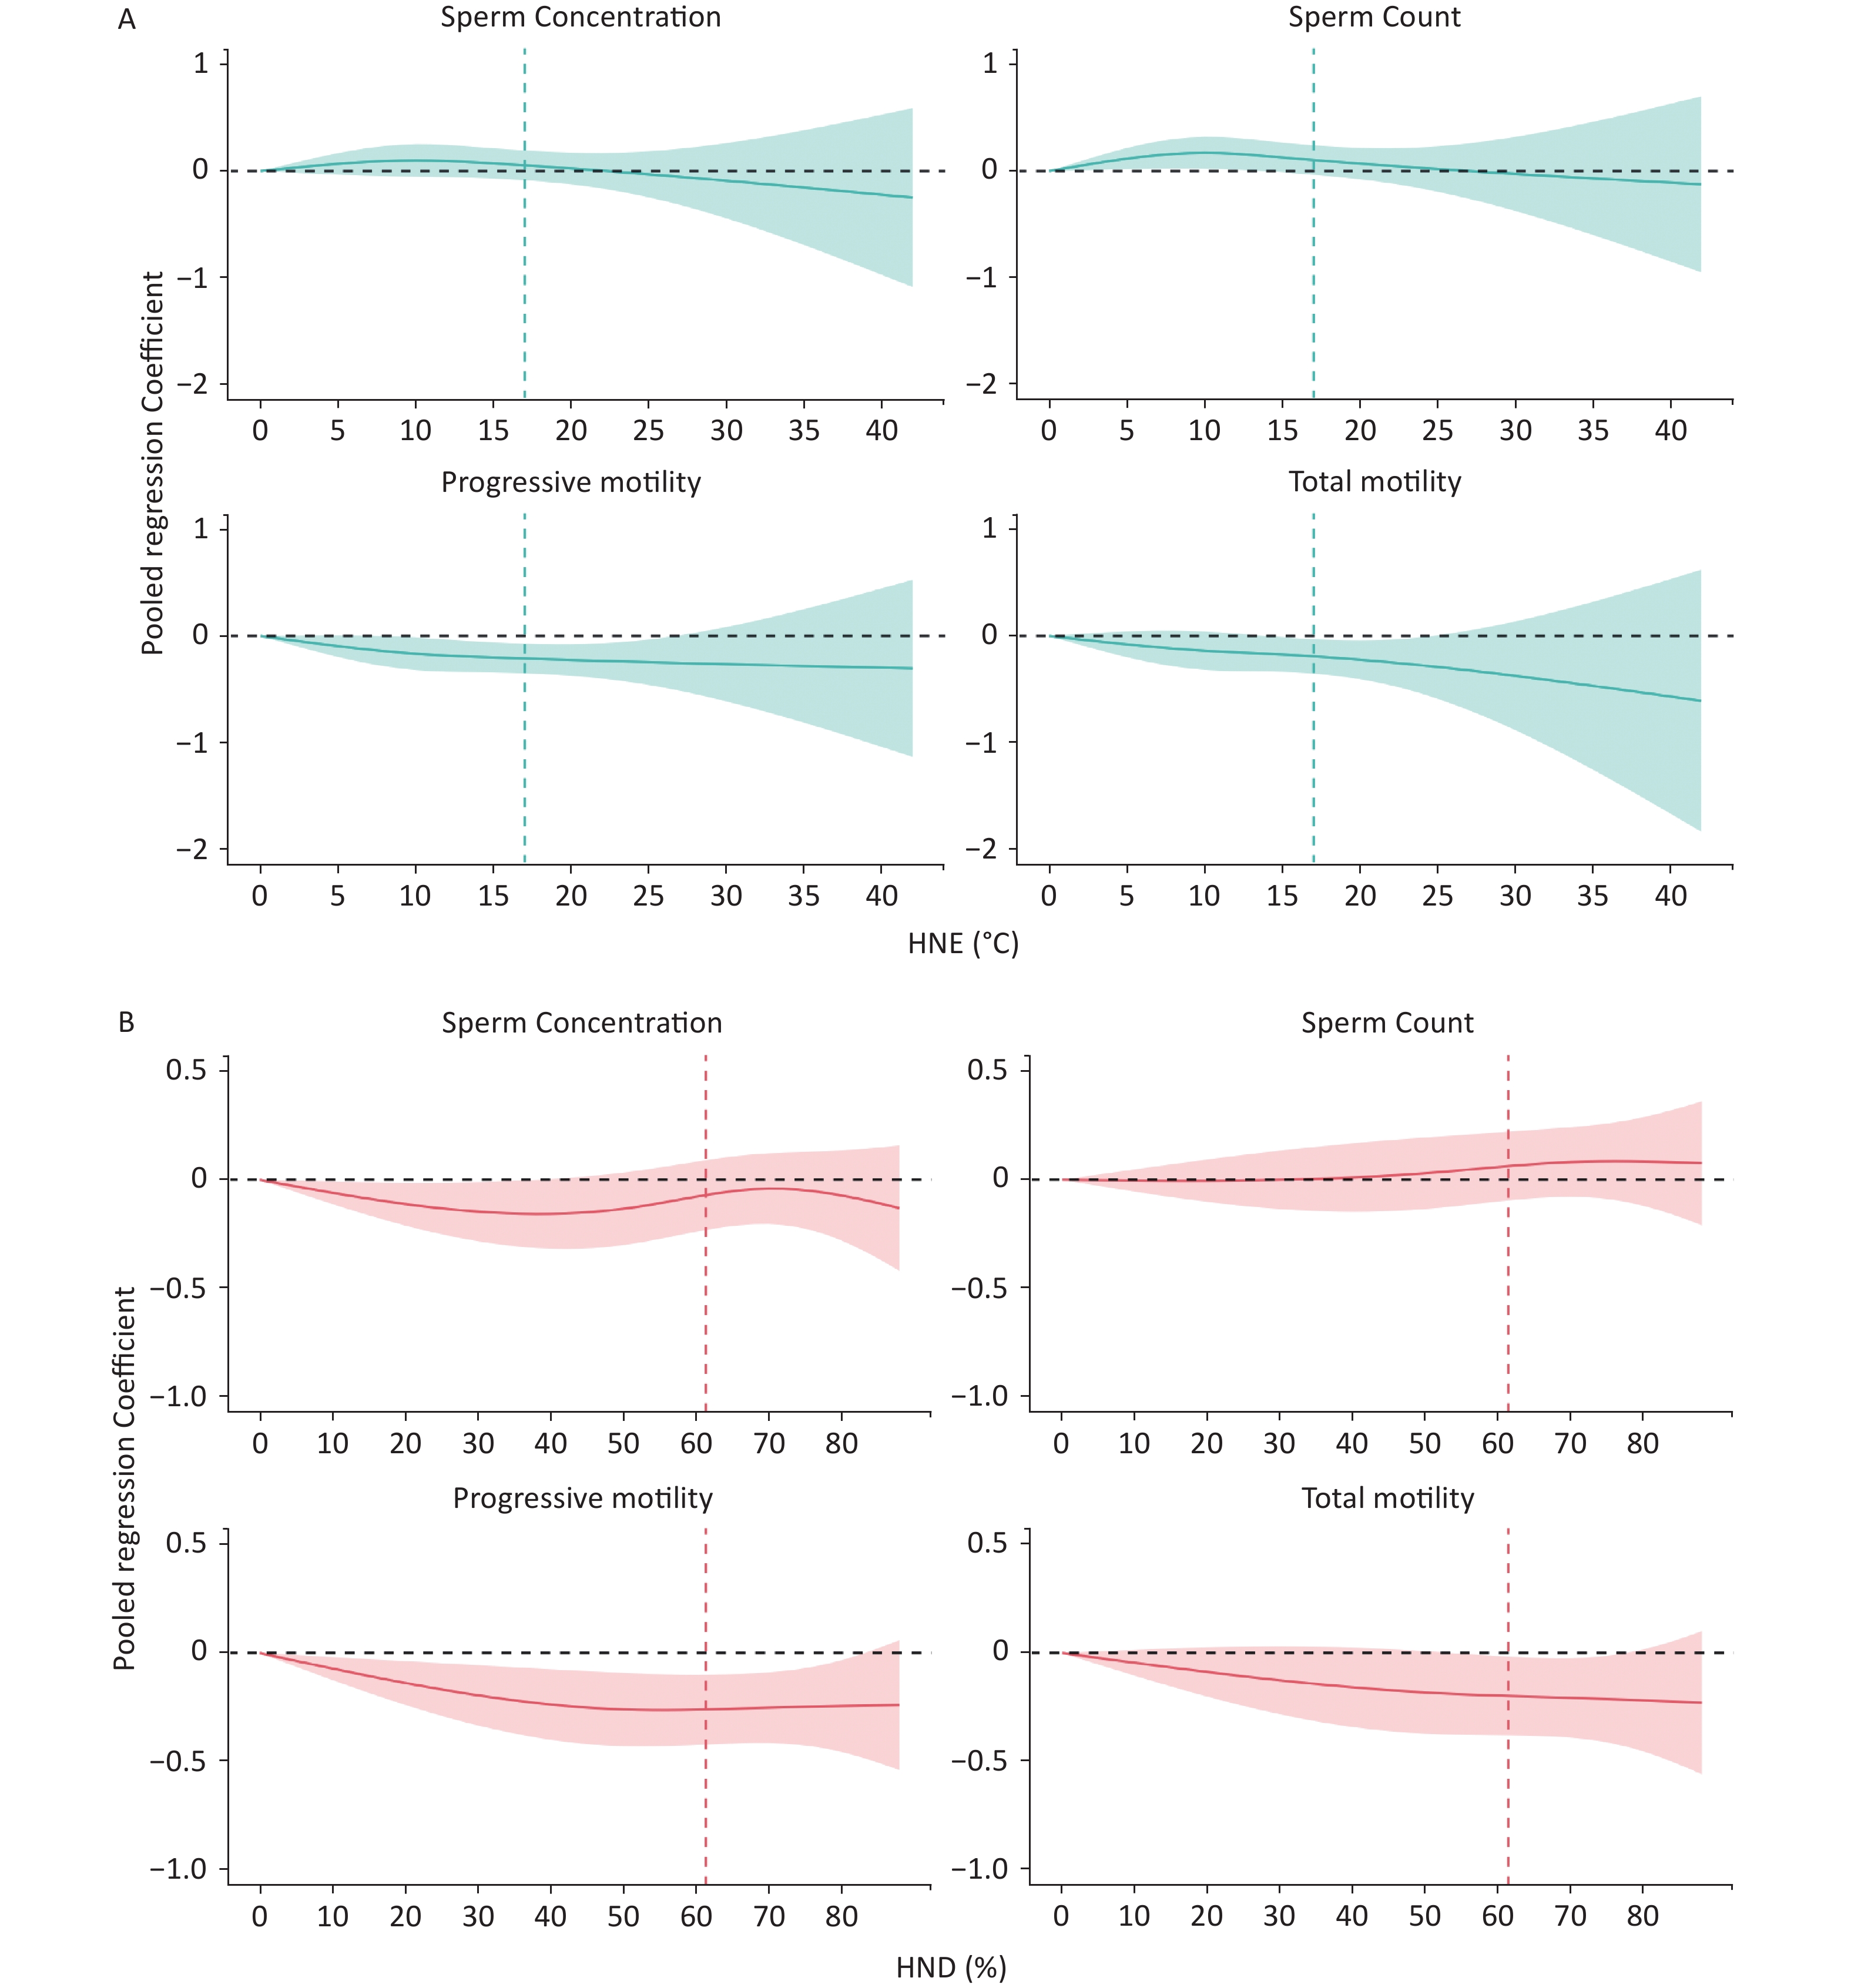
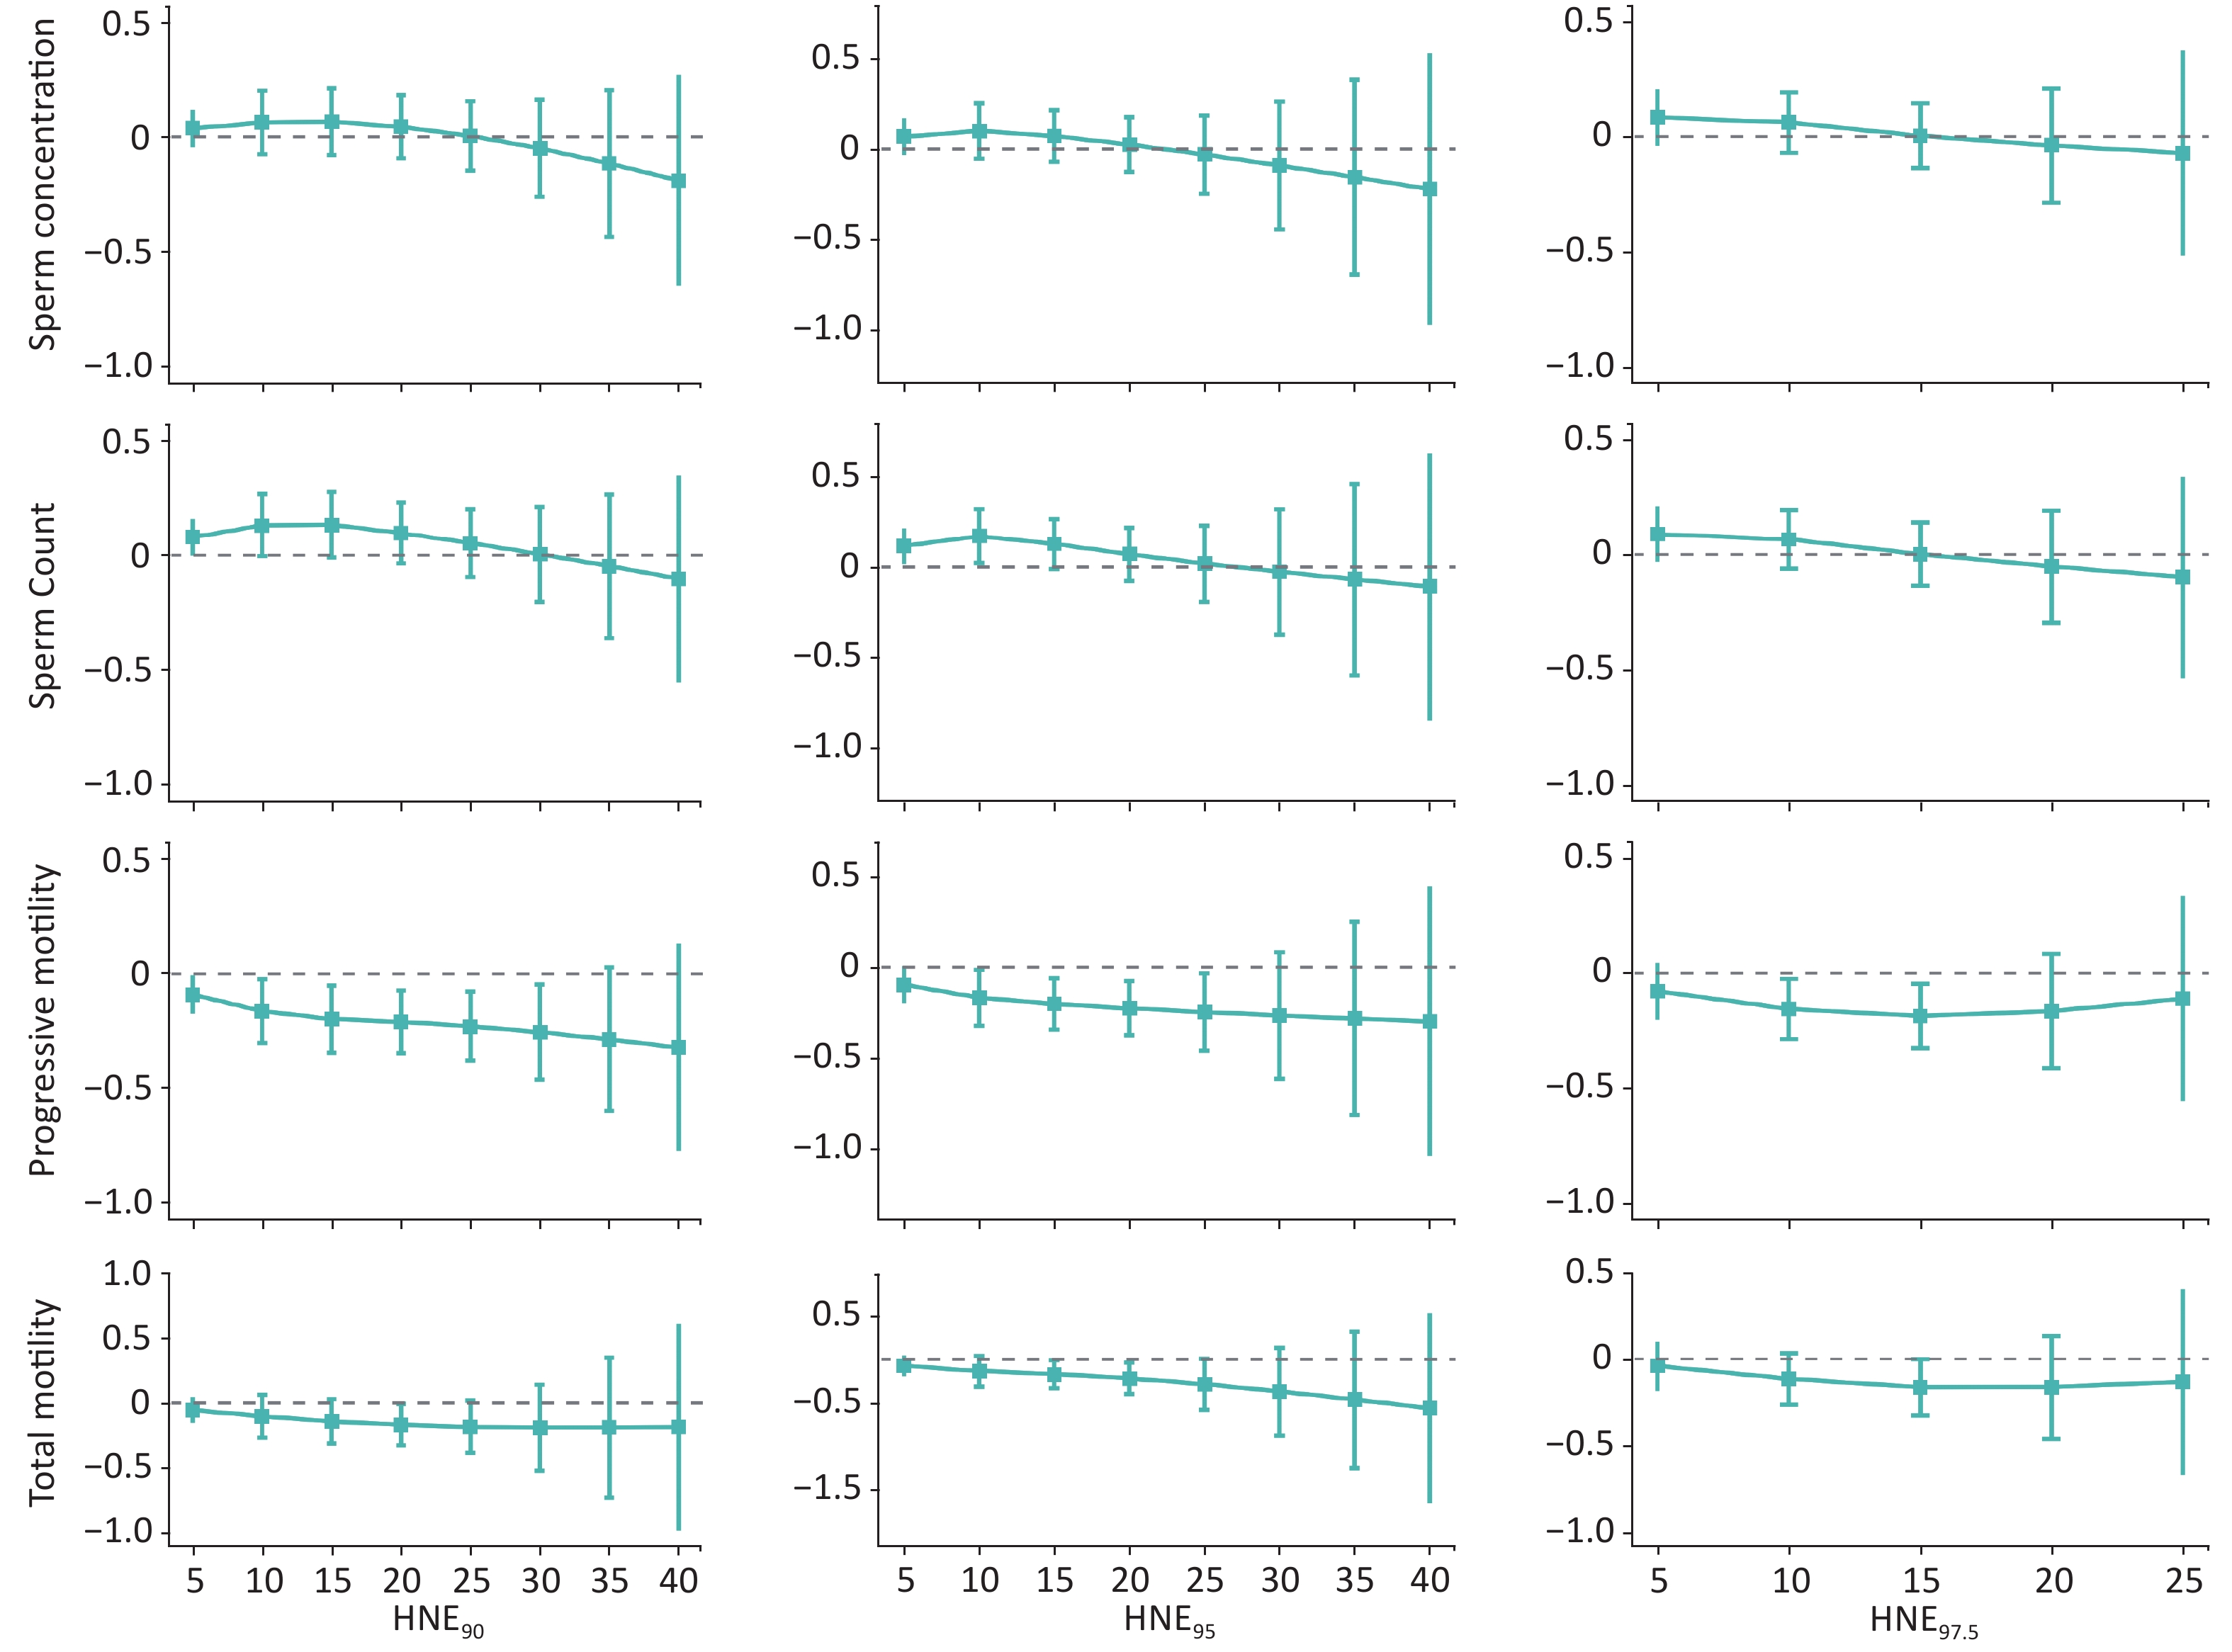
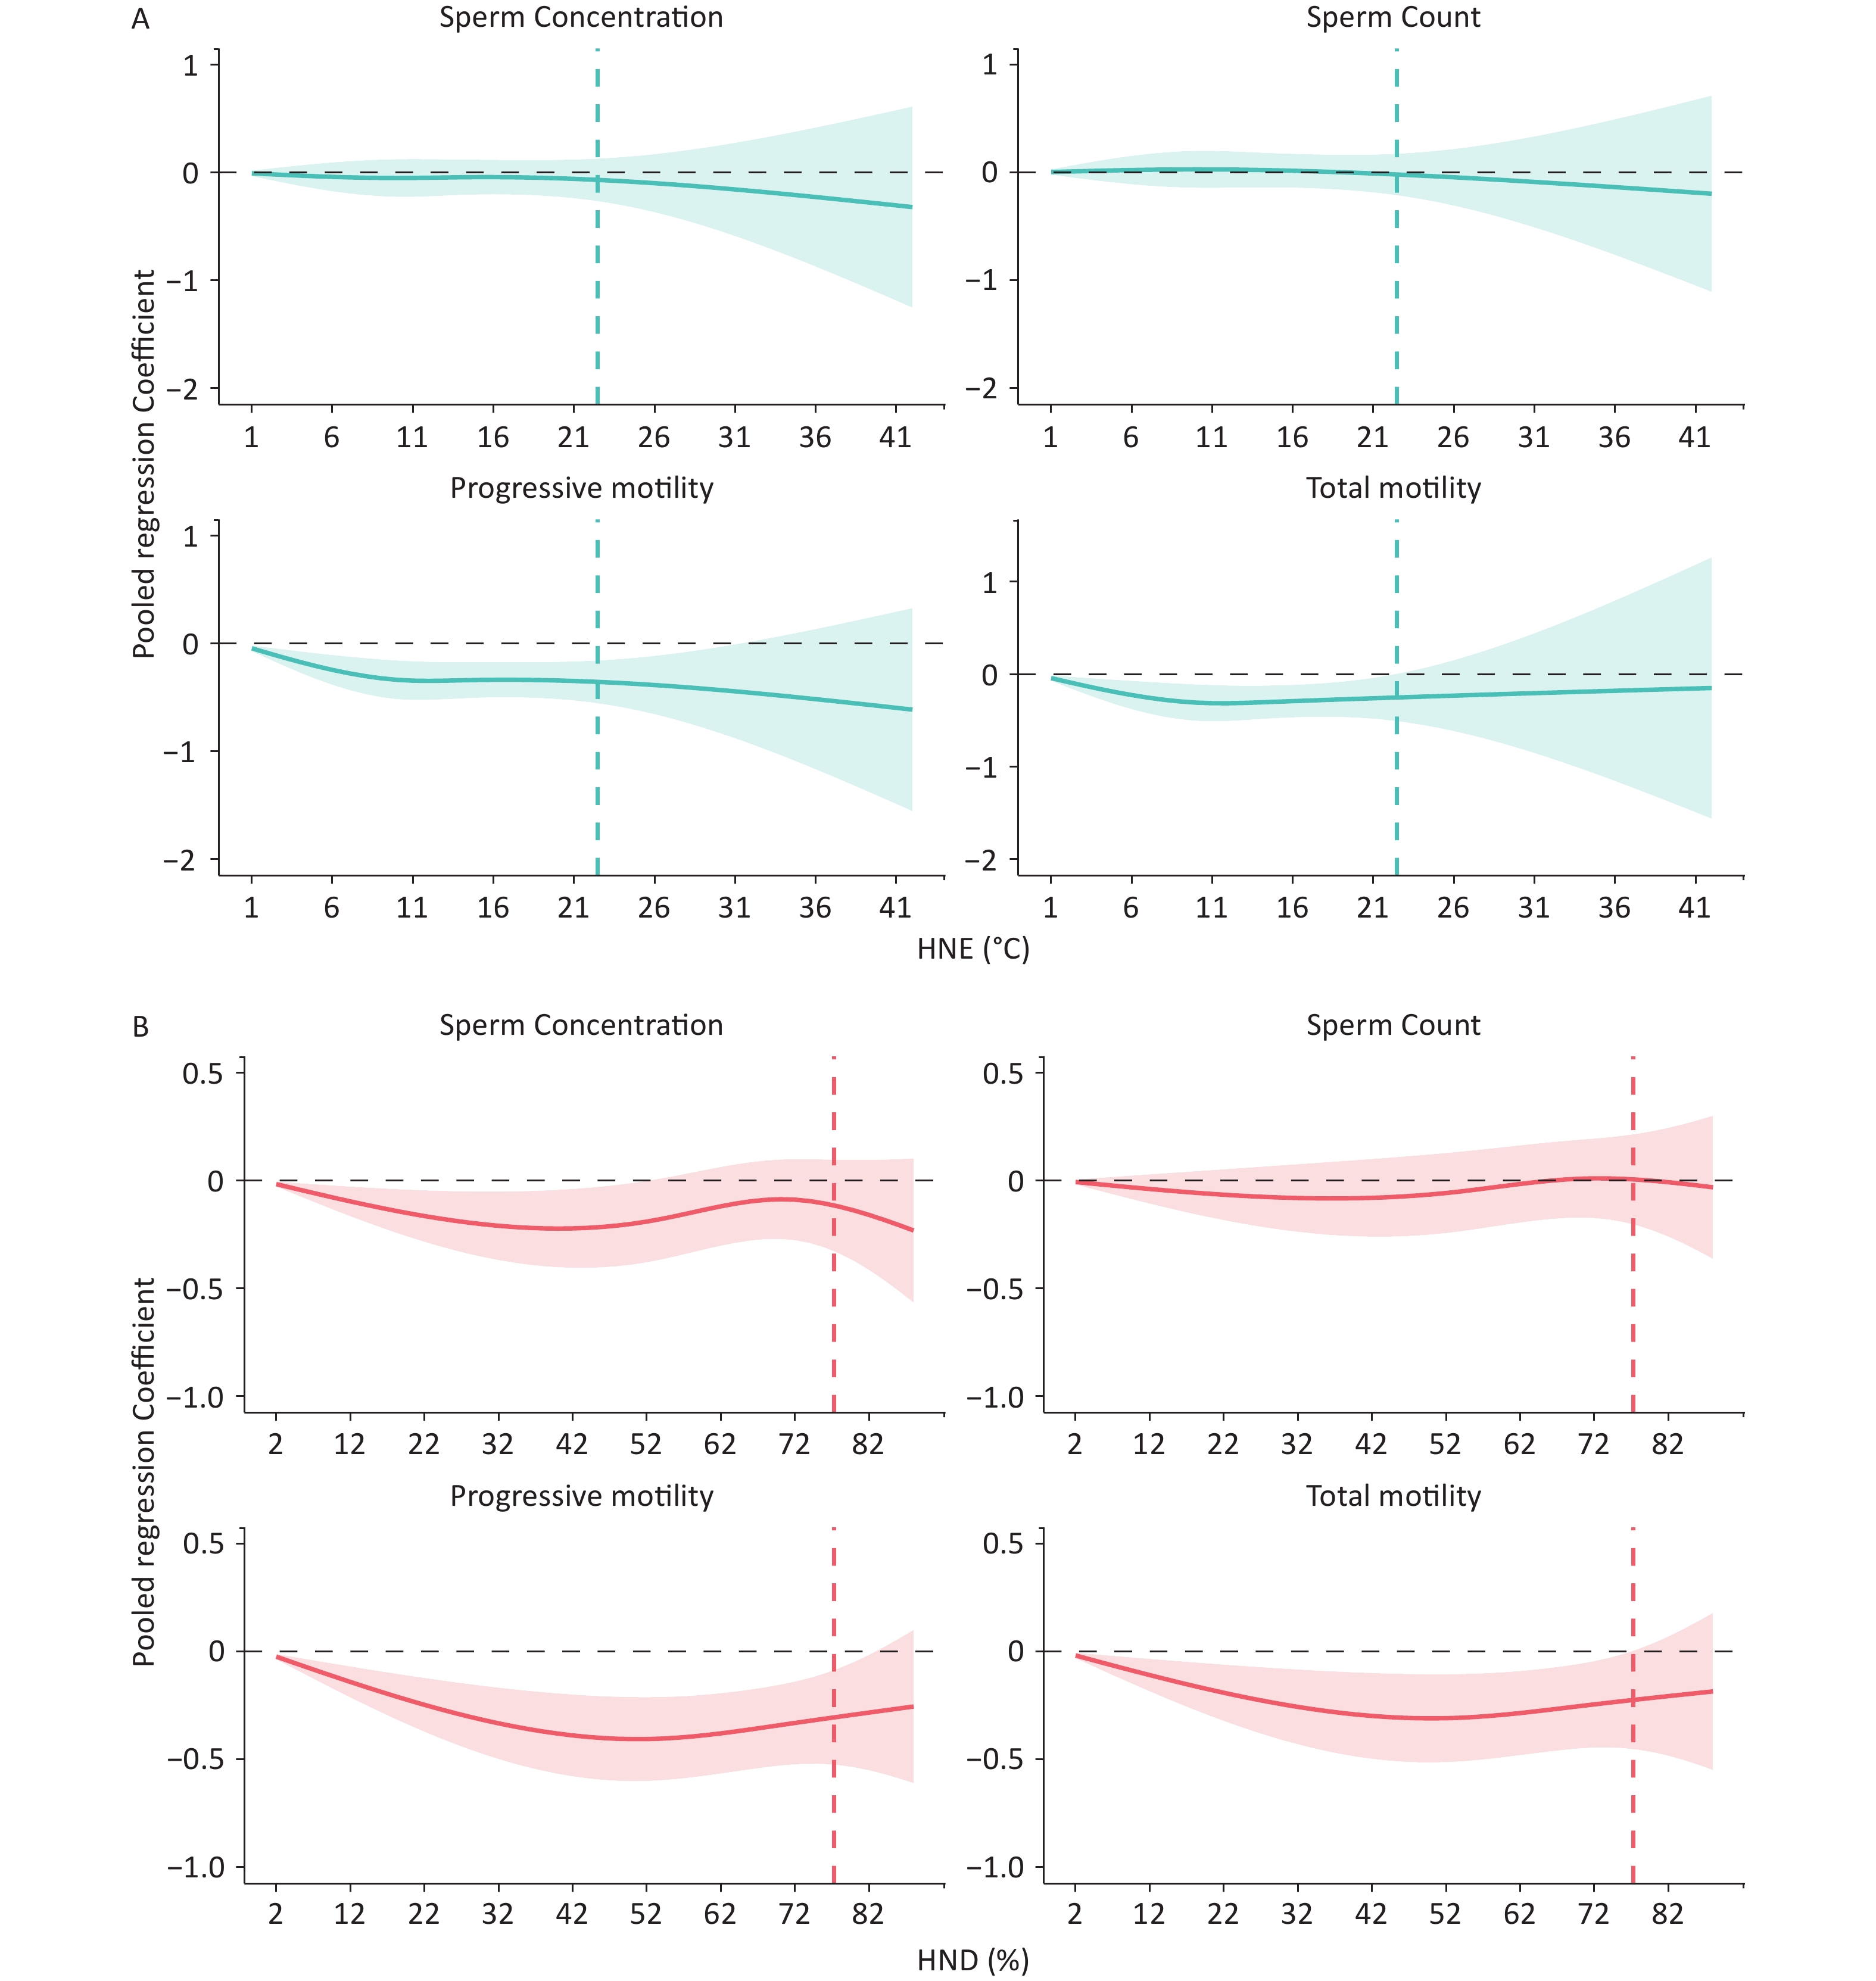
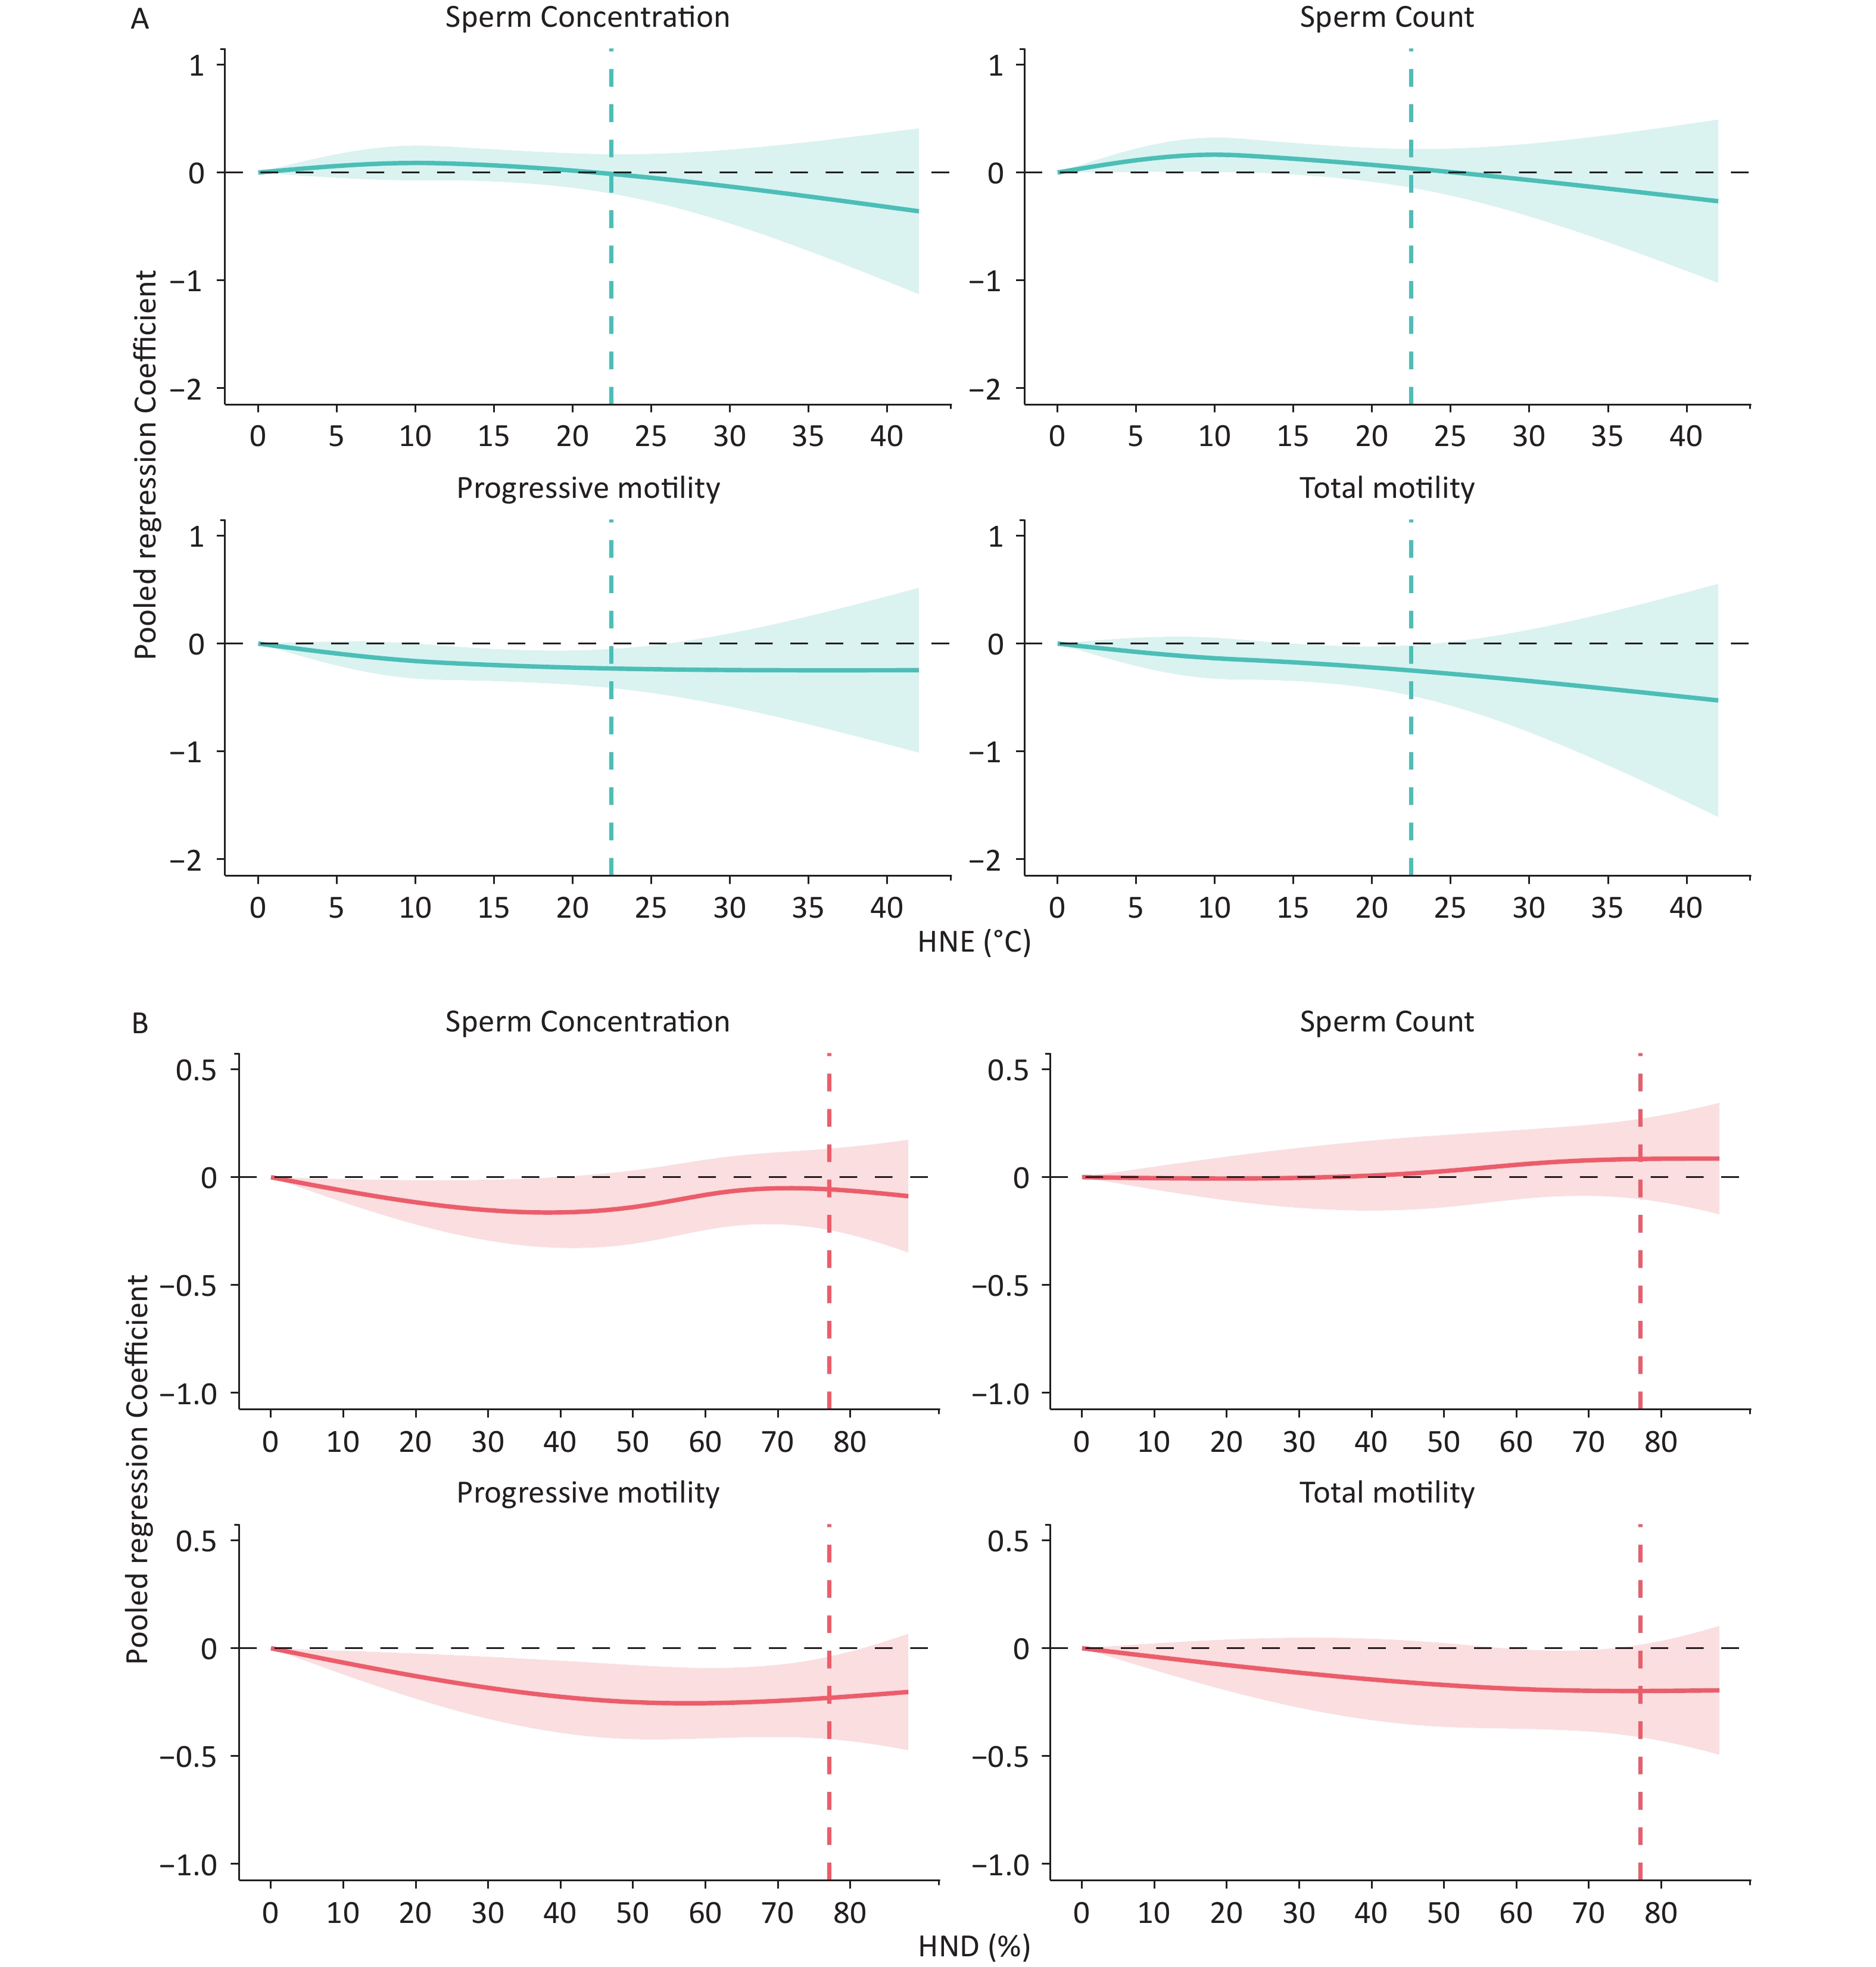
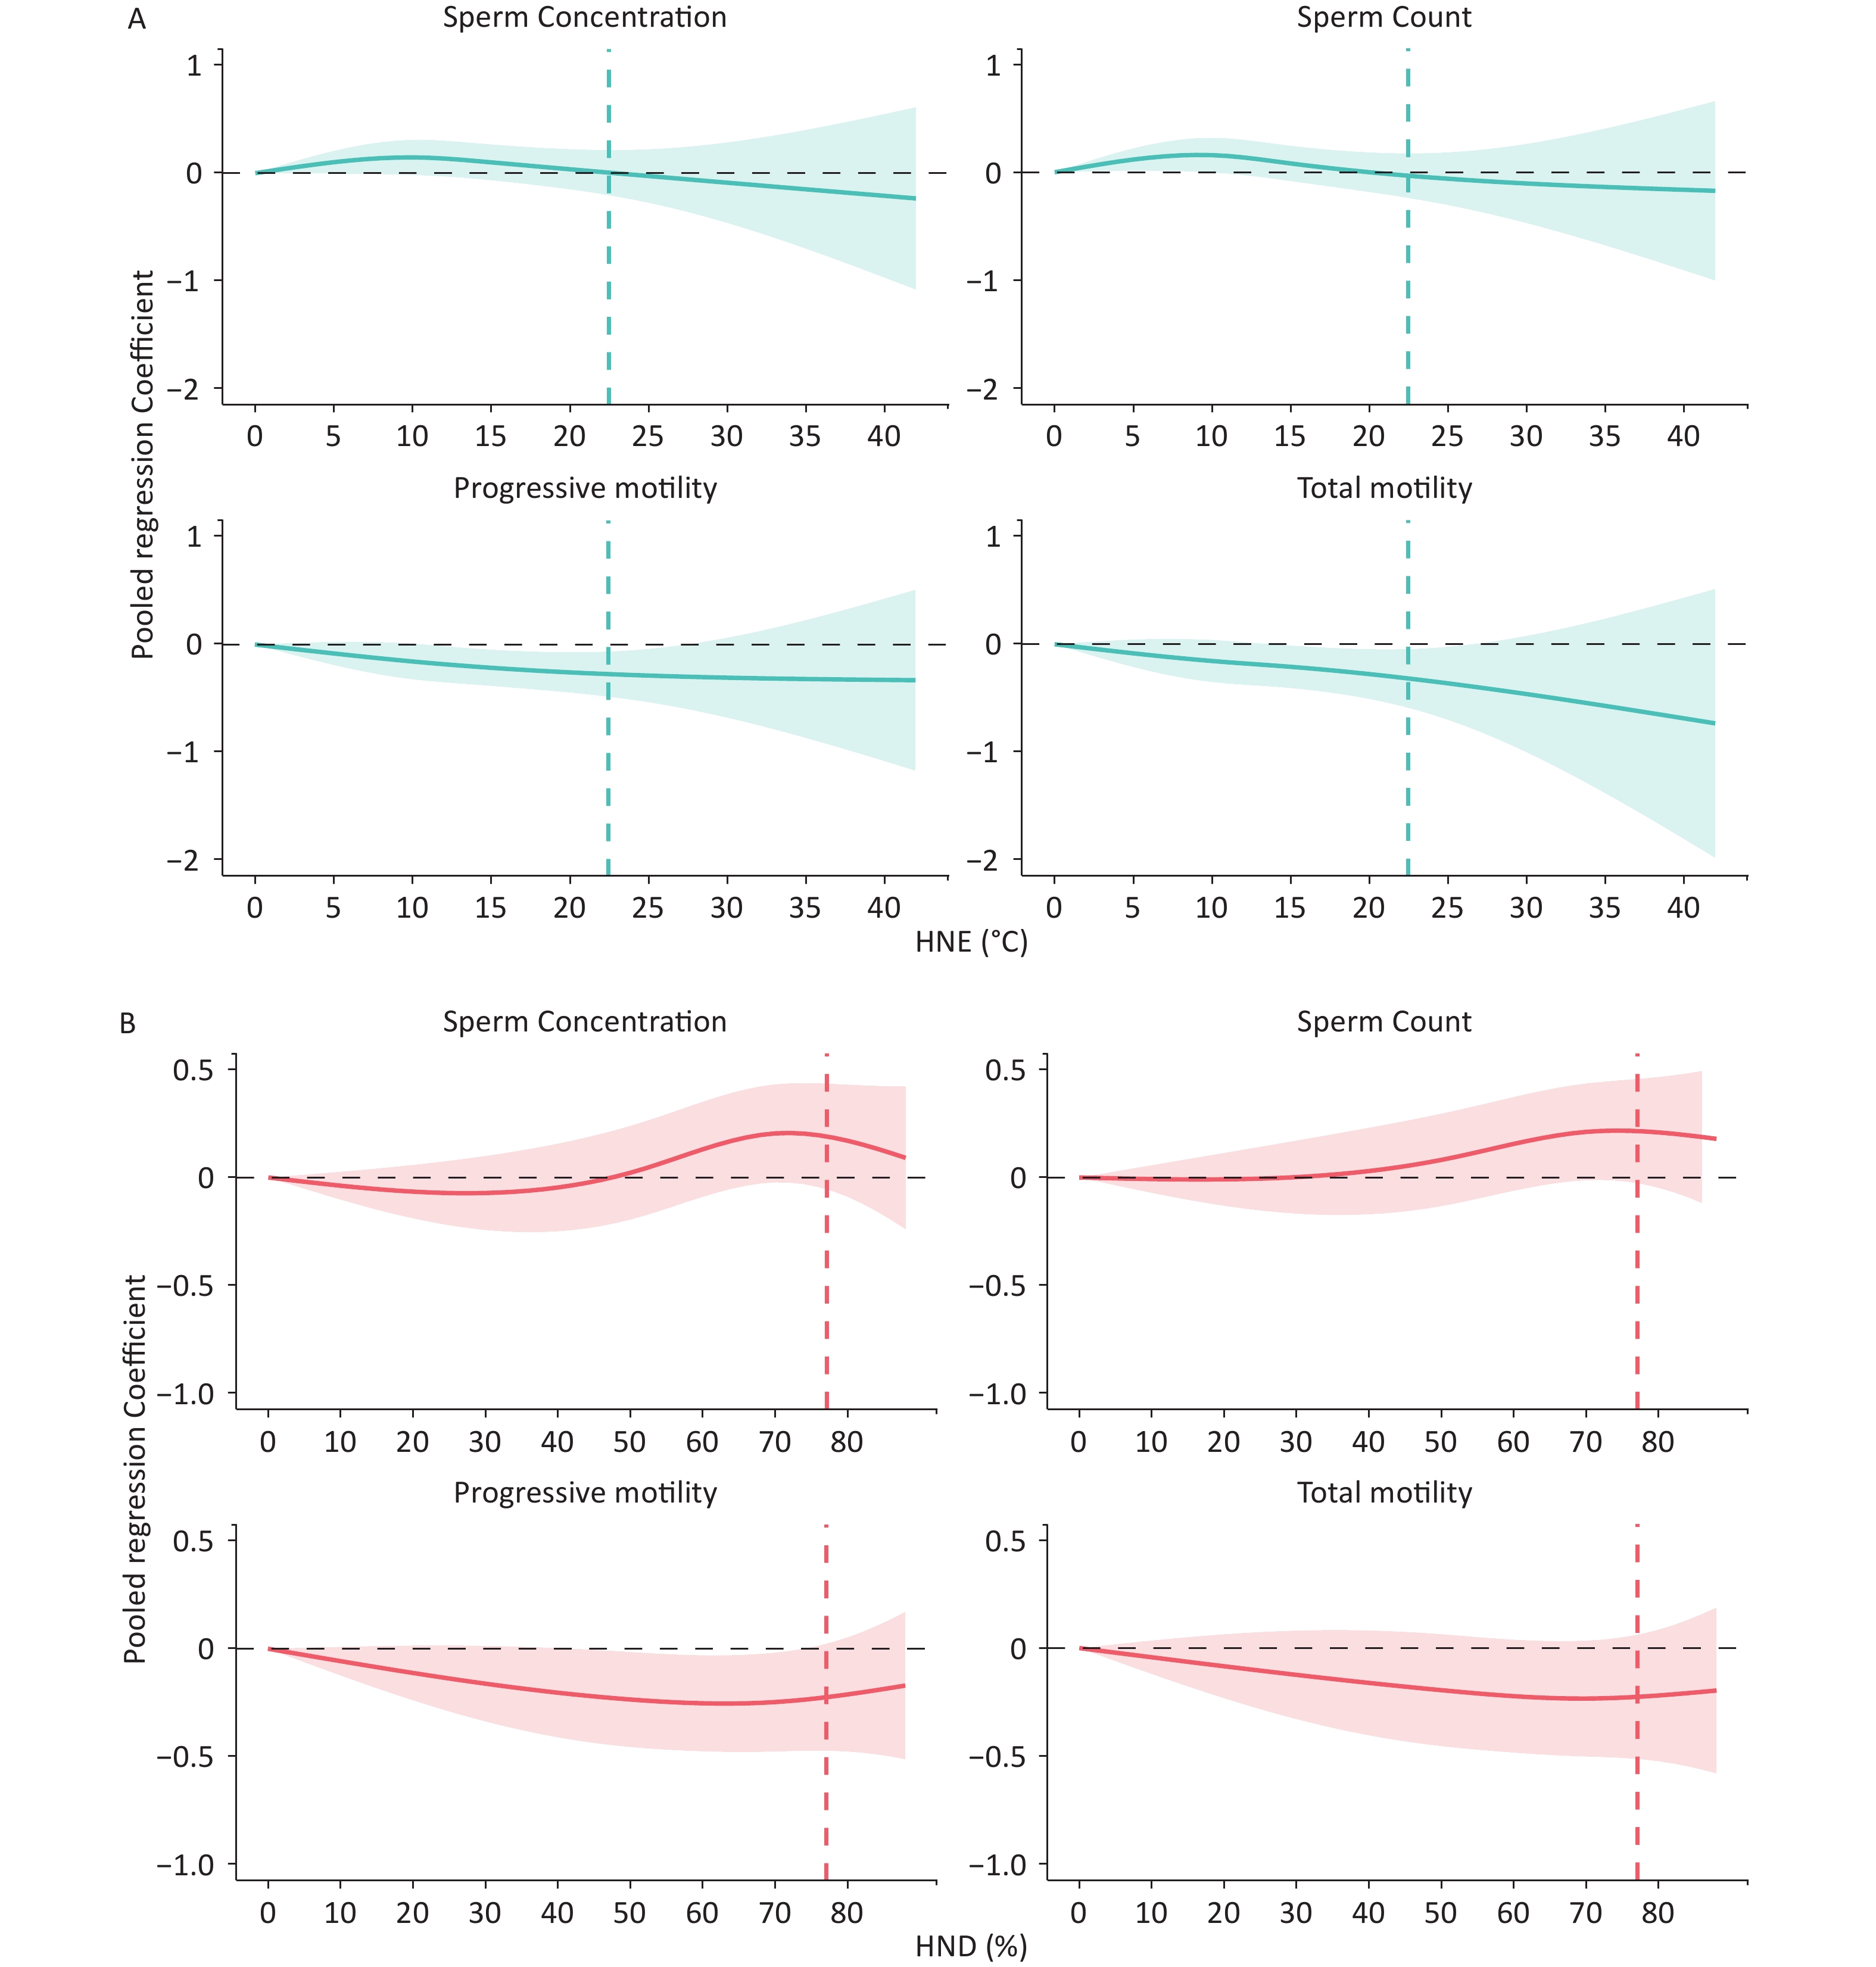
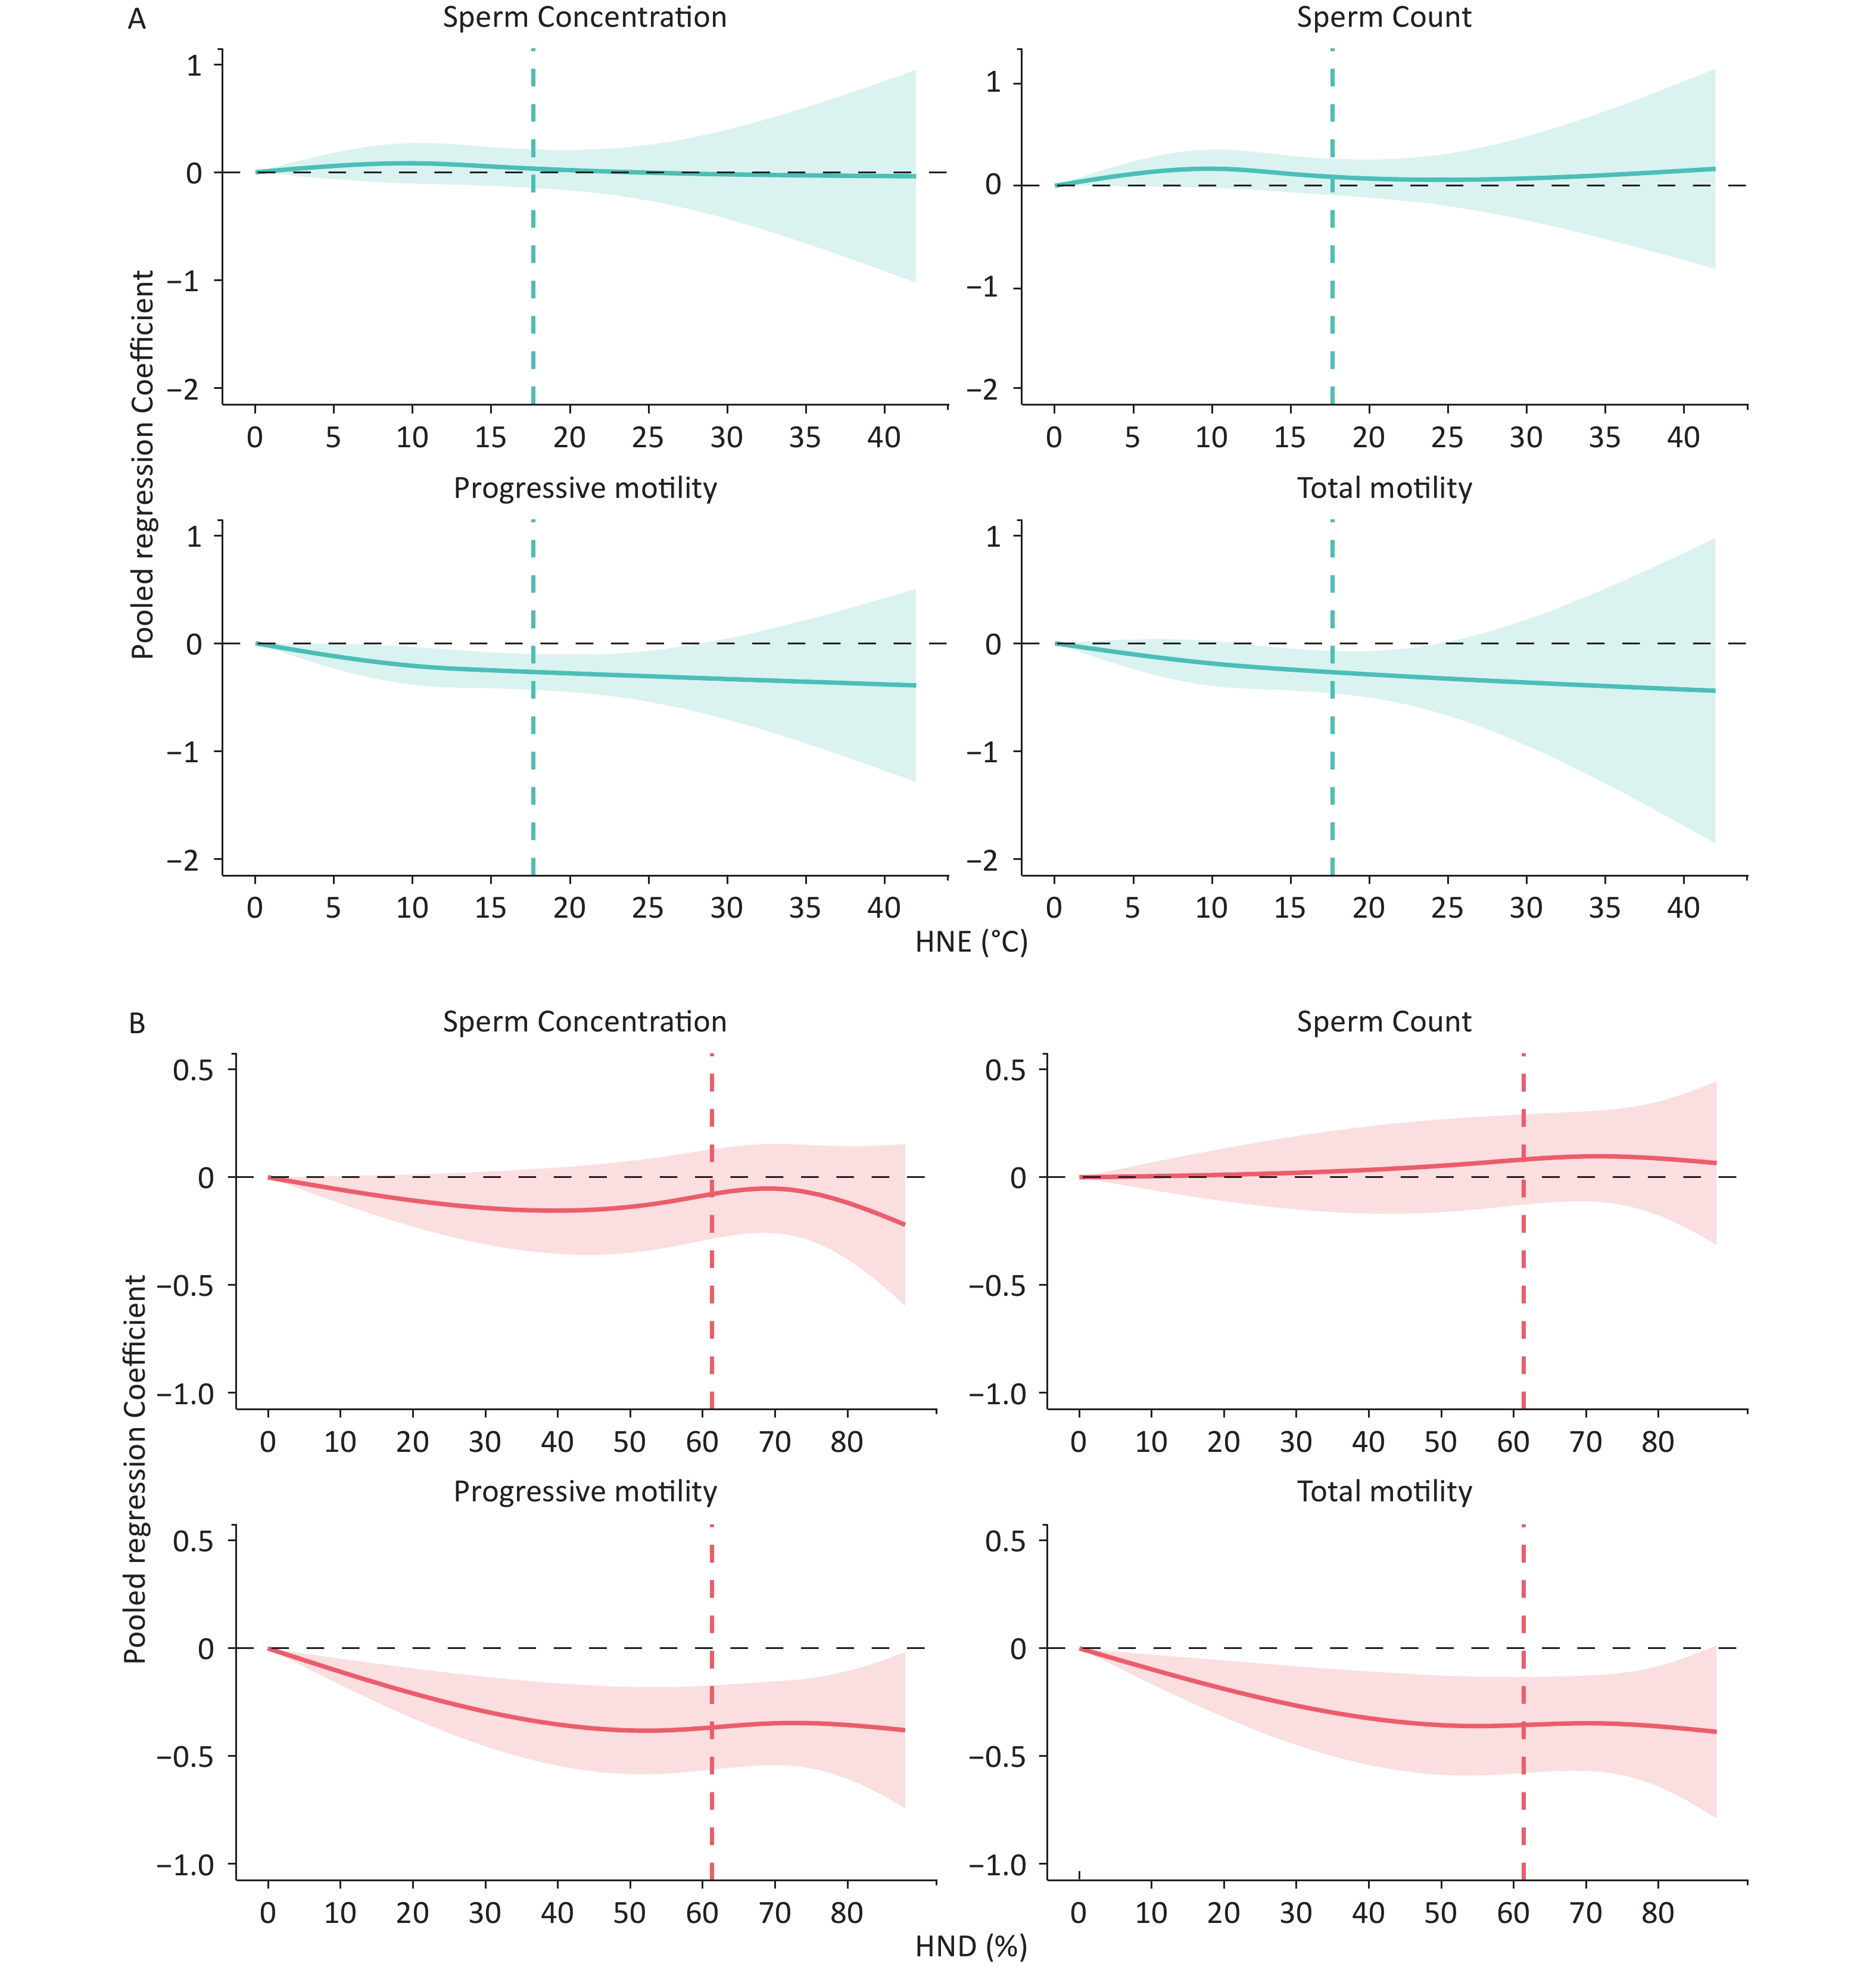
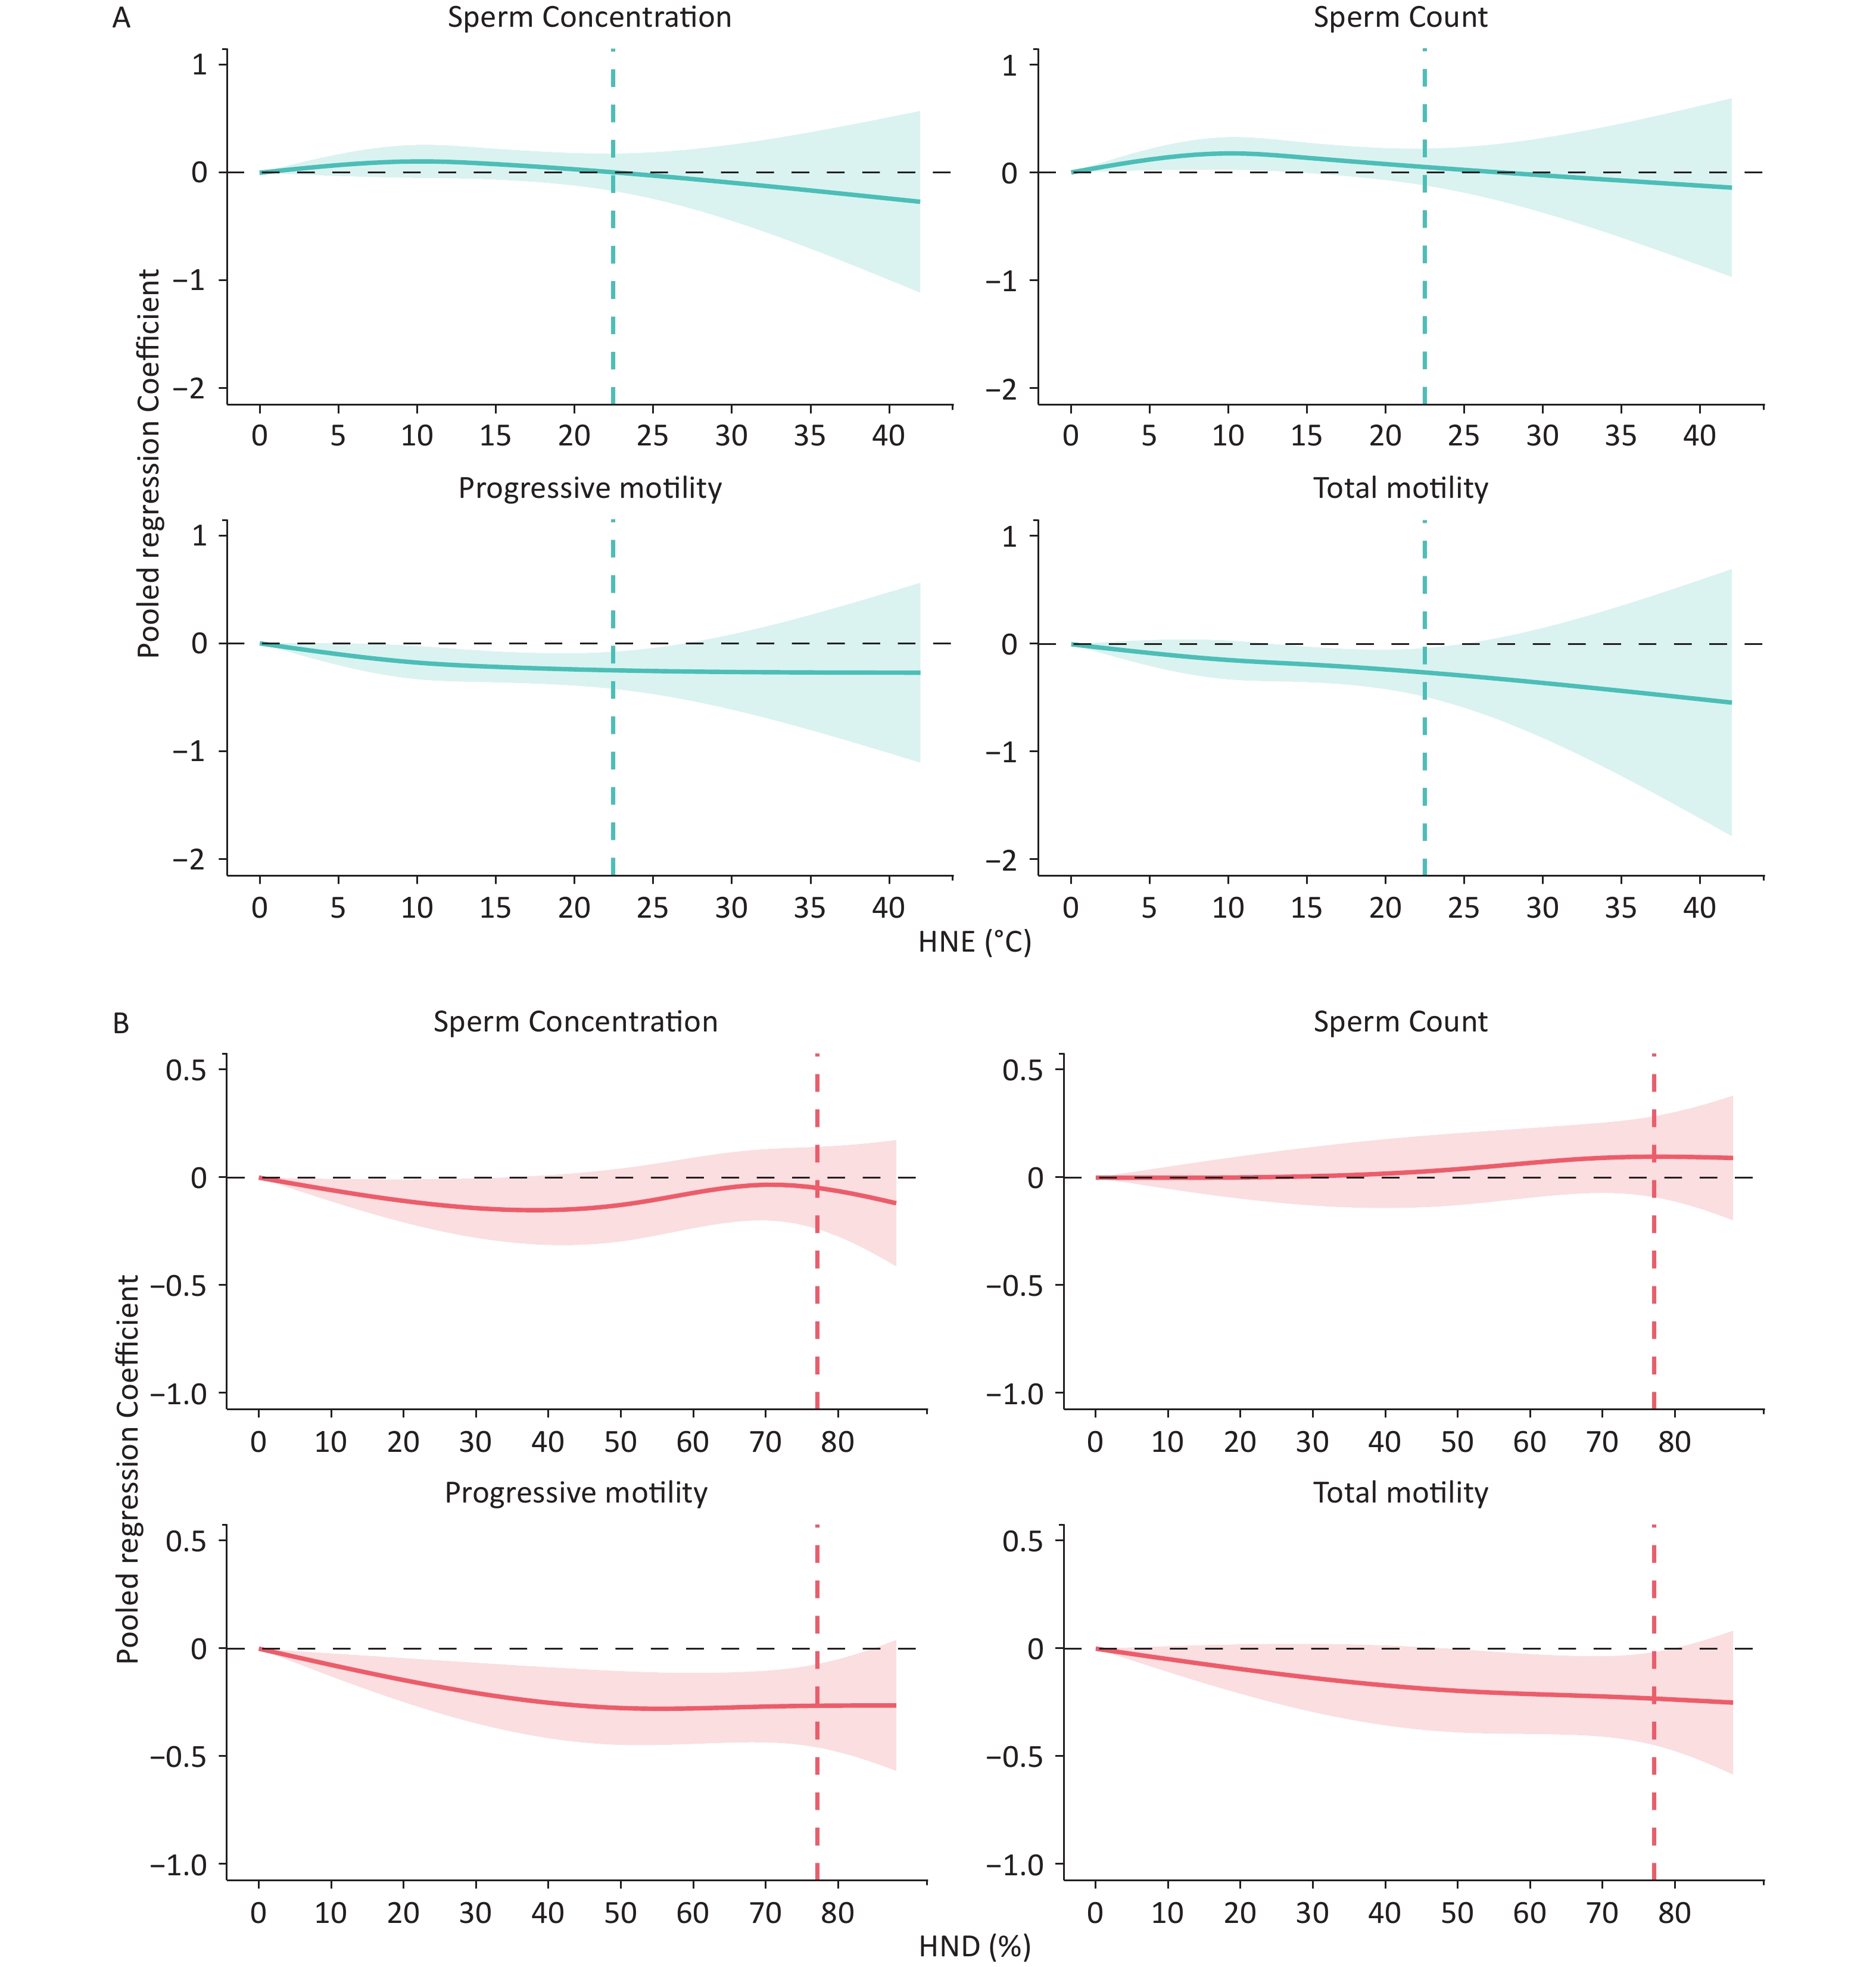
× 106/mLSemen quality parameter (95% CIs) Sperm count, × 106 Progressive motility, % Total motility, % Nighttime temperature (°C) –0.0161 (–0.0380, 0.0059) 0.0006 (–0.0211, 0.0223) –0.0242 (–0.0465, –0.0018) –0.0267 (–0.0522, –0.0012) HNE (°C) HNE90a –0.0010 (–0.0058, 0.0039) –0.0008 (–0.0056, 0.0039) –0.0069 (–0.0116, –0.0021) –0.0071 (–0.0125, –0.0016) HNE95b –0.0023 (–0.0081, 0.0036) –0.0023 (–0.0080, 0.0035) –0.0090 (–0.0147, –0.0033) –0.0094 (–0.0160, –0.0029) HNE97.5c –0.0041 (–0.0117, 0.0035) –0.0045 (–0.0120, 0.0030) –0.0124 (–0.0198, –0.0050) –0.0126 (–0.0210, –0.0042) HND (%) HND90a 0.0008 (–0.0007, 0.0024) 0.0014 (–0.0002, 0.0029) –0.0016 (–0.0032, –0.0001) –0.0019 (–0.0036, –0.0002) HND95b 0.0015 (–0.0003, 0.0034) 0.0018 (–0.0001, 0.0036) –0.0021 (–0.0040, –0.0003) –0.0023 (–0.0043, –0.0002) HND97.5c 0.0011 (–0.0010, 0.0033) 0.0011 (–0.0010, 0.0032) –0.0027 (–0.0048, –0.0006) –0.0029 (–0.0052, –0.0005) Note. The combined regression coefficients and corresponding 95% confidence intervals (CIs) were estimated using linear mixed models, adjusting for abstinence period, age, ethnicity, month of semen sample, as well as average PM2.5 concentration, average NO2 concentration, and mean relative humidity during 0–90 days before the date of semen collection. HNE, hot night excess; HND, hot night duration; aThe HNE90 (or HND90) values were calculated using the 90th percentile of the daily minimum temperature as the temperature thresholds. bThe HNE95 (or HND95) values were calculated using the 95th percentile of the daily minimum temperature as the temperature thresholds. cThe HNE97.5 (or HND97.5) values were calculated using the 97.5th percentile of the daily minimum temperature as the temperature thresholds. As shown in Figure 4, the exposure–response relationship between hot night exposure and semen quality showed that semen parameters tended to decrease or remained constant with increasing HNE and HND. A linear reduction in HNE–related progressive motility and total motility was observed (both Pnonlinear < 0.05). By contrast, total motility decreased nonlinearly throughout the HND distribution (Pnonlinear > 0.05) (Table 4). More specifically, the overall estimated changes of HNE at the 99th percentile on progressive motility and total motility decreased by 0.2357 (95% CI: –0.4072, –0.0642) and 0.2545 (95% CI: –0.4804, –0.0286), respectively. Moreover, elevated HND at the 99th percentile was significantly related to reduced progressive motility (β: –0.2462, 95% CI: –0.4358, –0.0566) and total motility (β: –0.2147, 95% CI: –0.4269, –0.0025) (Table 4). Figures 5 and 6 further provide comparisons of the exposure-response relationship for semen parameters corresponding to a 5 °C increase in HNE and a 10% increase in HND at different temperature thresholds, respectively. The associations between HNE (or HND) and semen parameters calculated using temperature thresholds of the 90th and 97.5th percentiles of the Tmin distribution were comparable to those of the 95th percentile. Notably, a statistically significant negative relationship was observed between HND and sperm concentration when the temperature threshold was set to the 90th percentile of the Tmin distribution.
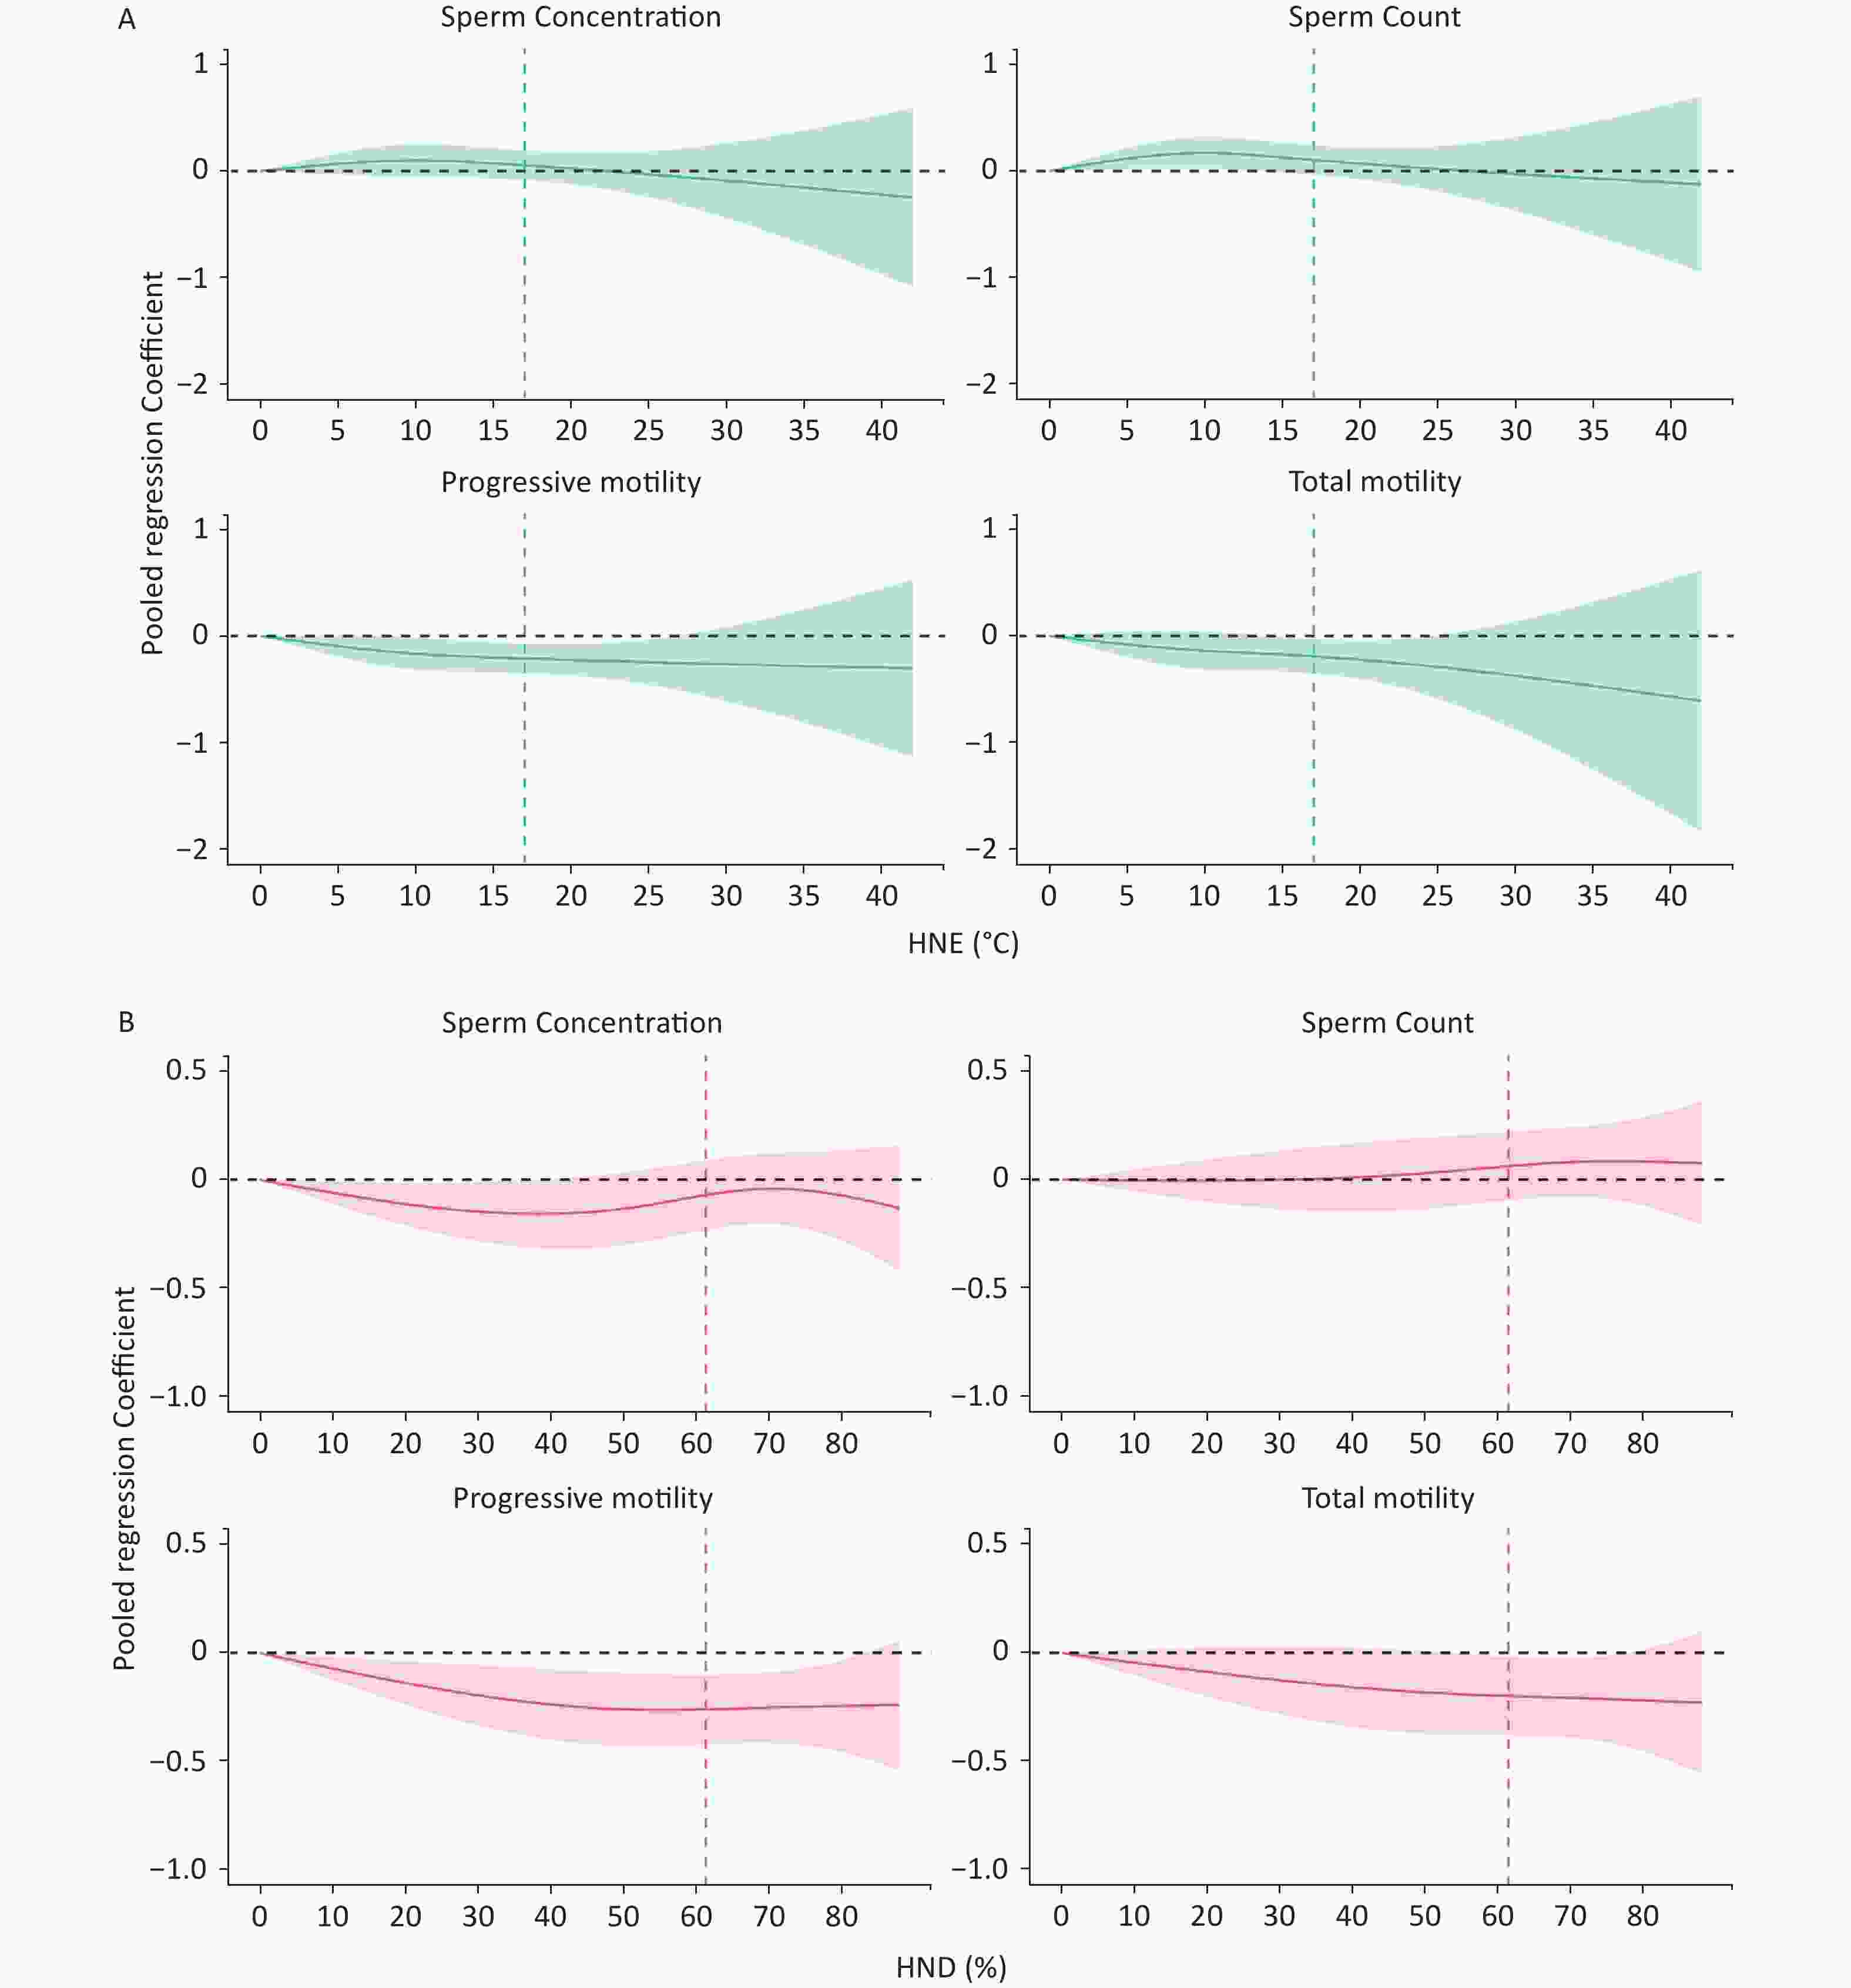
Figure 4. Pooled exposure-response relationships between hot night indices (A) hot night excess [HNE], (B) hot night duration [HND]) and semen quality in 6 regions China. The estimated associations between 0–90 days hot night indices (HNE or HND) and semen quality parameters by including the natural cubic B–spline function with two internal nodes at the 50th and 90th percentiles of HNE and HND distributions in the linear mixed model, and adjusted for age, ethnicity, abstinence period, month of semen sample, as well as average PM2.5 concentration, average NO2 concentration, and mean relative humidity during 0–90 days before the date of semen collection. HNE, hot night excess; HND, hot night duration; CIs, confidence intervals. The vertical dotted lines indicate the 99th percentile of regional warm-season hot night duration (HND) and hot night excess (HNE). Shaded areas represent corresponding 95% CIs.
Table 4. The estimated changesof semen parameters associated with the hot night duration (HND) and hot night excess (HNE) at the 99th percentile in 6 geographical regions of China at 0–90 lag days
Semen quality parameter HNE (°C) HND (%) β (95% CIs) Pnonlineard β (95% CIs) Pnonlineard Threshold = 90% of the Tmin a Sperm concentration, × 106/mL –0.0185 (–0.1908, 0.1537) 0.4098 –0.1356 (–0.3227, 0.0516) 0.0019 Sperm count, × 106 0.0314 (–0.1382, 0.2009) 0.0938 0.0077 (–0.1770, 0.1924) 0.0579 Progressive motility, % –0.2386 (–0.4085, –0.0687) 0.0179 –0.2189(–0.4101, –0.0276) 0.0626 Total motility, % –0.1868 (–0.4371, 0.0635) 0.0749 –0.2254 (–0.4398, –0.0109) 0.1731 Threshold = 95% of the Tmin b Sperm concentration, × 106/mL –0.0014 (–0.1748, 0.1720) 0.1986 –0.0566 (–0.2439, 0.1307) 0.0077 Sperm count, × 106 0.0447 (–0.1260, 0.2154) 0.0235 0.0857 (–0.0990, 0.2705) 0.2425 Progressive motility, % –0.2357 (–0.4072, –0.0642) 0.0118 –0.2462 (–0.4358, –0.0566) 0.0150 Total motility, % –0.2545 (–0.4804, –0.0286) 0.0422 –0.2147 (–0.4269, –0.0025) 0.1366 Threshold = 97.5% of the Tmin c Sperm concentration, × 106/mL –0.0143 (–0.1850, 0.1564) 0.1906 –0.0091 (–0.1825, 0.1644) 0.2950 Sperm count, × 106 –0.0103 (–0.1883, 0.1478) 0.1129 0.1053 (–0.0656, 0.2762) 0.6496 Progressive motility, % –0.1825 (–0.3517, –0.0132) 0.0065 –0.2644 (–0.4375, –0.0912) 0.0040 Total motility, % –0.1685 (–0.3692, 0.0321) 0.0270 –0.2239 (–0.4188, –0.0289) 0.0584 Note. The estimated changes of semen quality were accessed by including a natural cubic B-spline of hot night indices (HNE or HND), and adjusted for abstinence period, age, ethnicity, month of semen sample, as well as average PM2.5 concentration, average NO2 concentration, and mean relative humidity during 0–90 days before the date of semen collection. HNE, hot night excess; HND, hot night duration; CIs, confidence intervals; Tmin, daily minimum temperature. aThe heat threshold of hot nights was defined as the 90th percentile of daily minimum temperatures. bThe heat threshold of hot nights was defined as the 95th percentile of daily minimum temperatures. cThe heat threshold of hot nights was defined as the 97.5th percentile of daily minimum temperatures. dPnonlinear means nonlinear test of exposure-response curves. 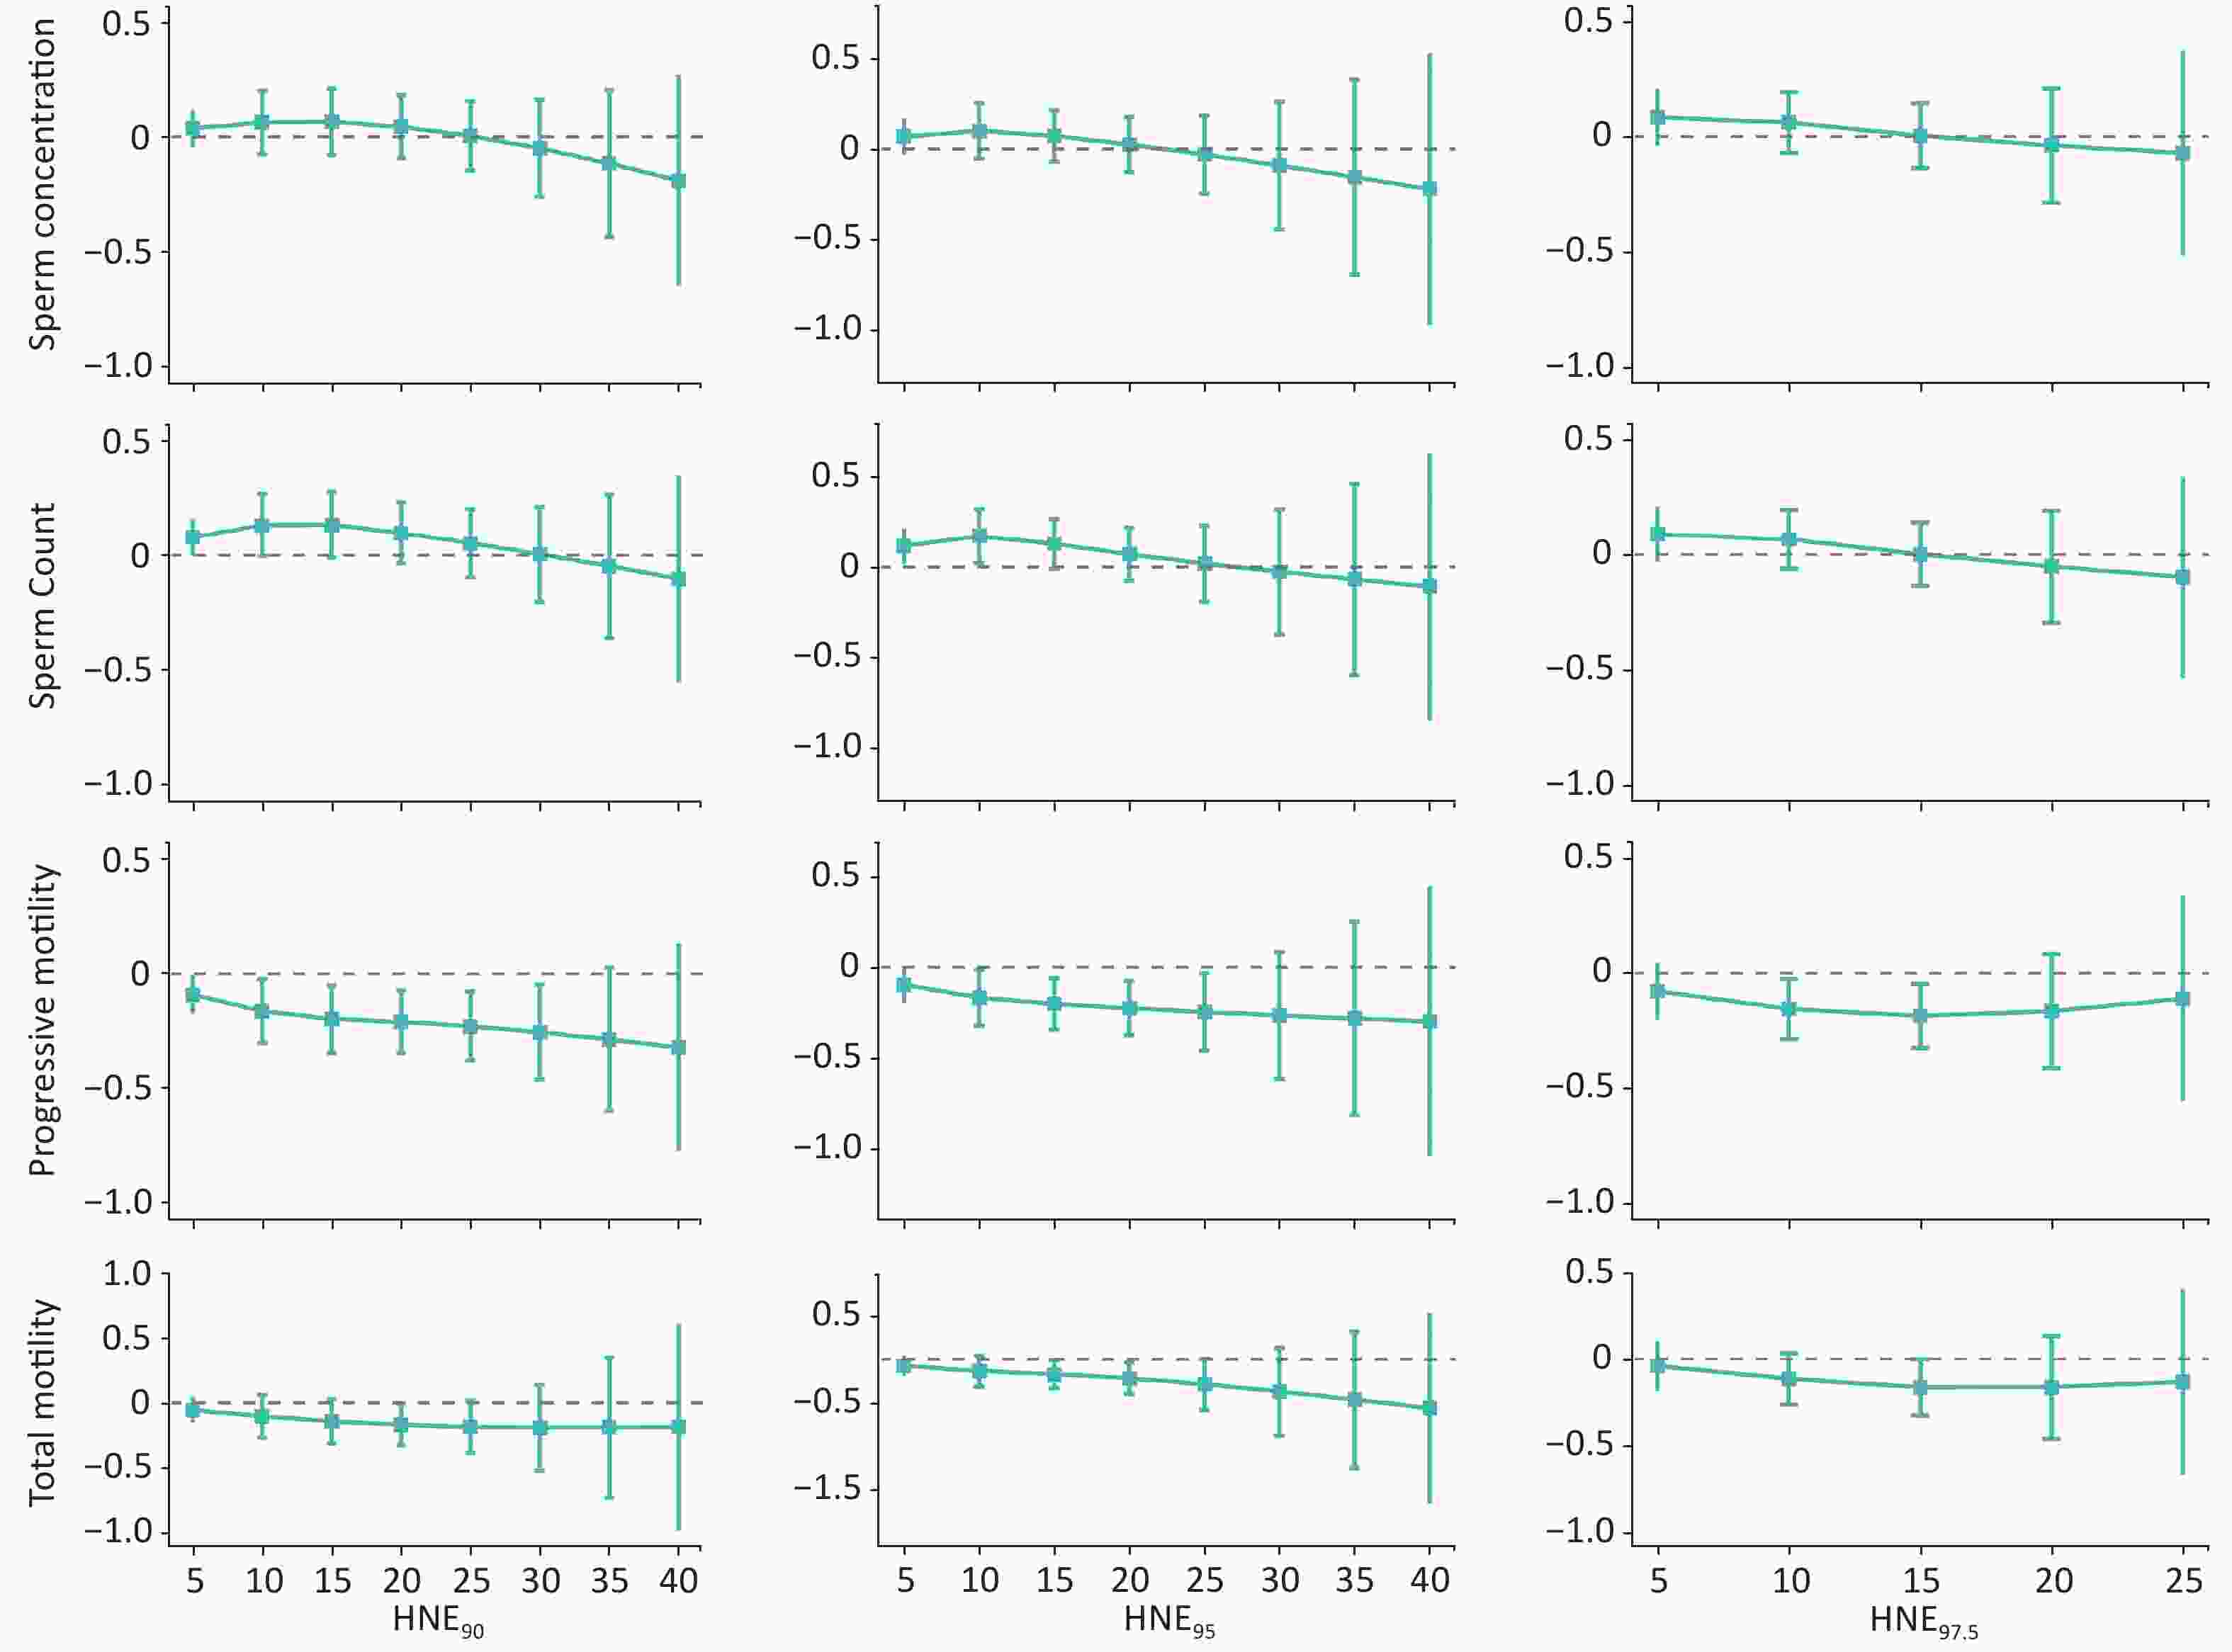
Figure 5. Relationships between hot night excess (HNE) and semen parameters at different temperature thresholds. The estimated changes of semen quality were accessed by including a natural cubic B-spline of HNE, and were adjusted for abstinence period, age, ethnicity, month of semen sample, as well as average PM2.5 concentration, average NO2 concentration, and mean relative humidity during 0–90 days before the date of semen collection.
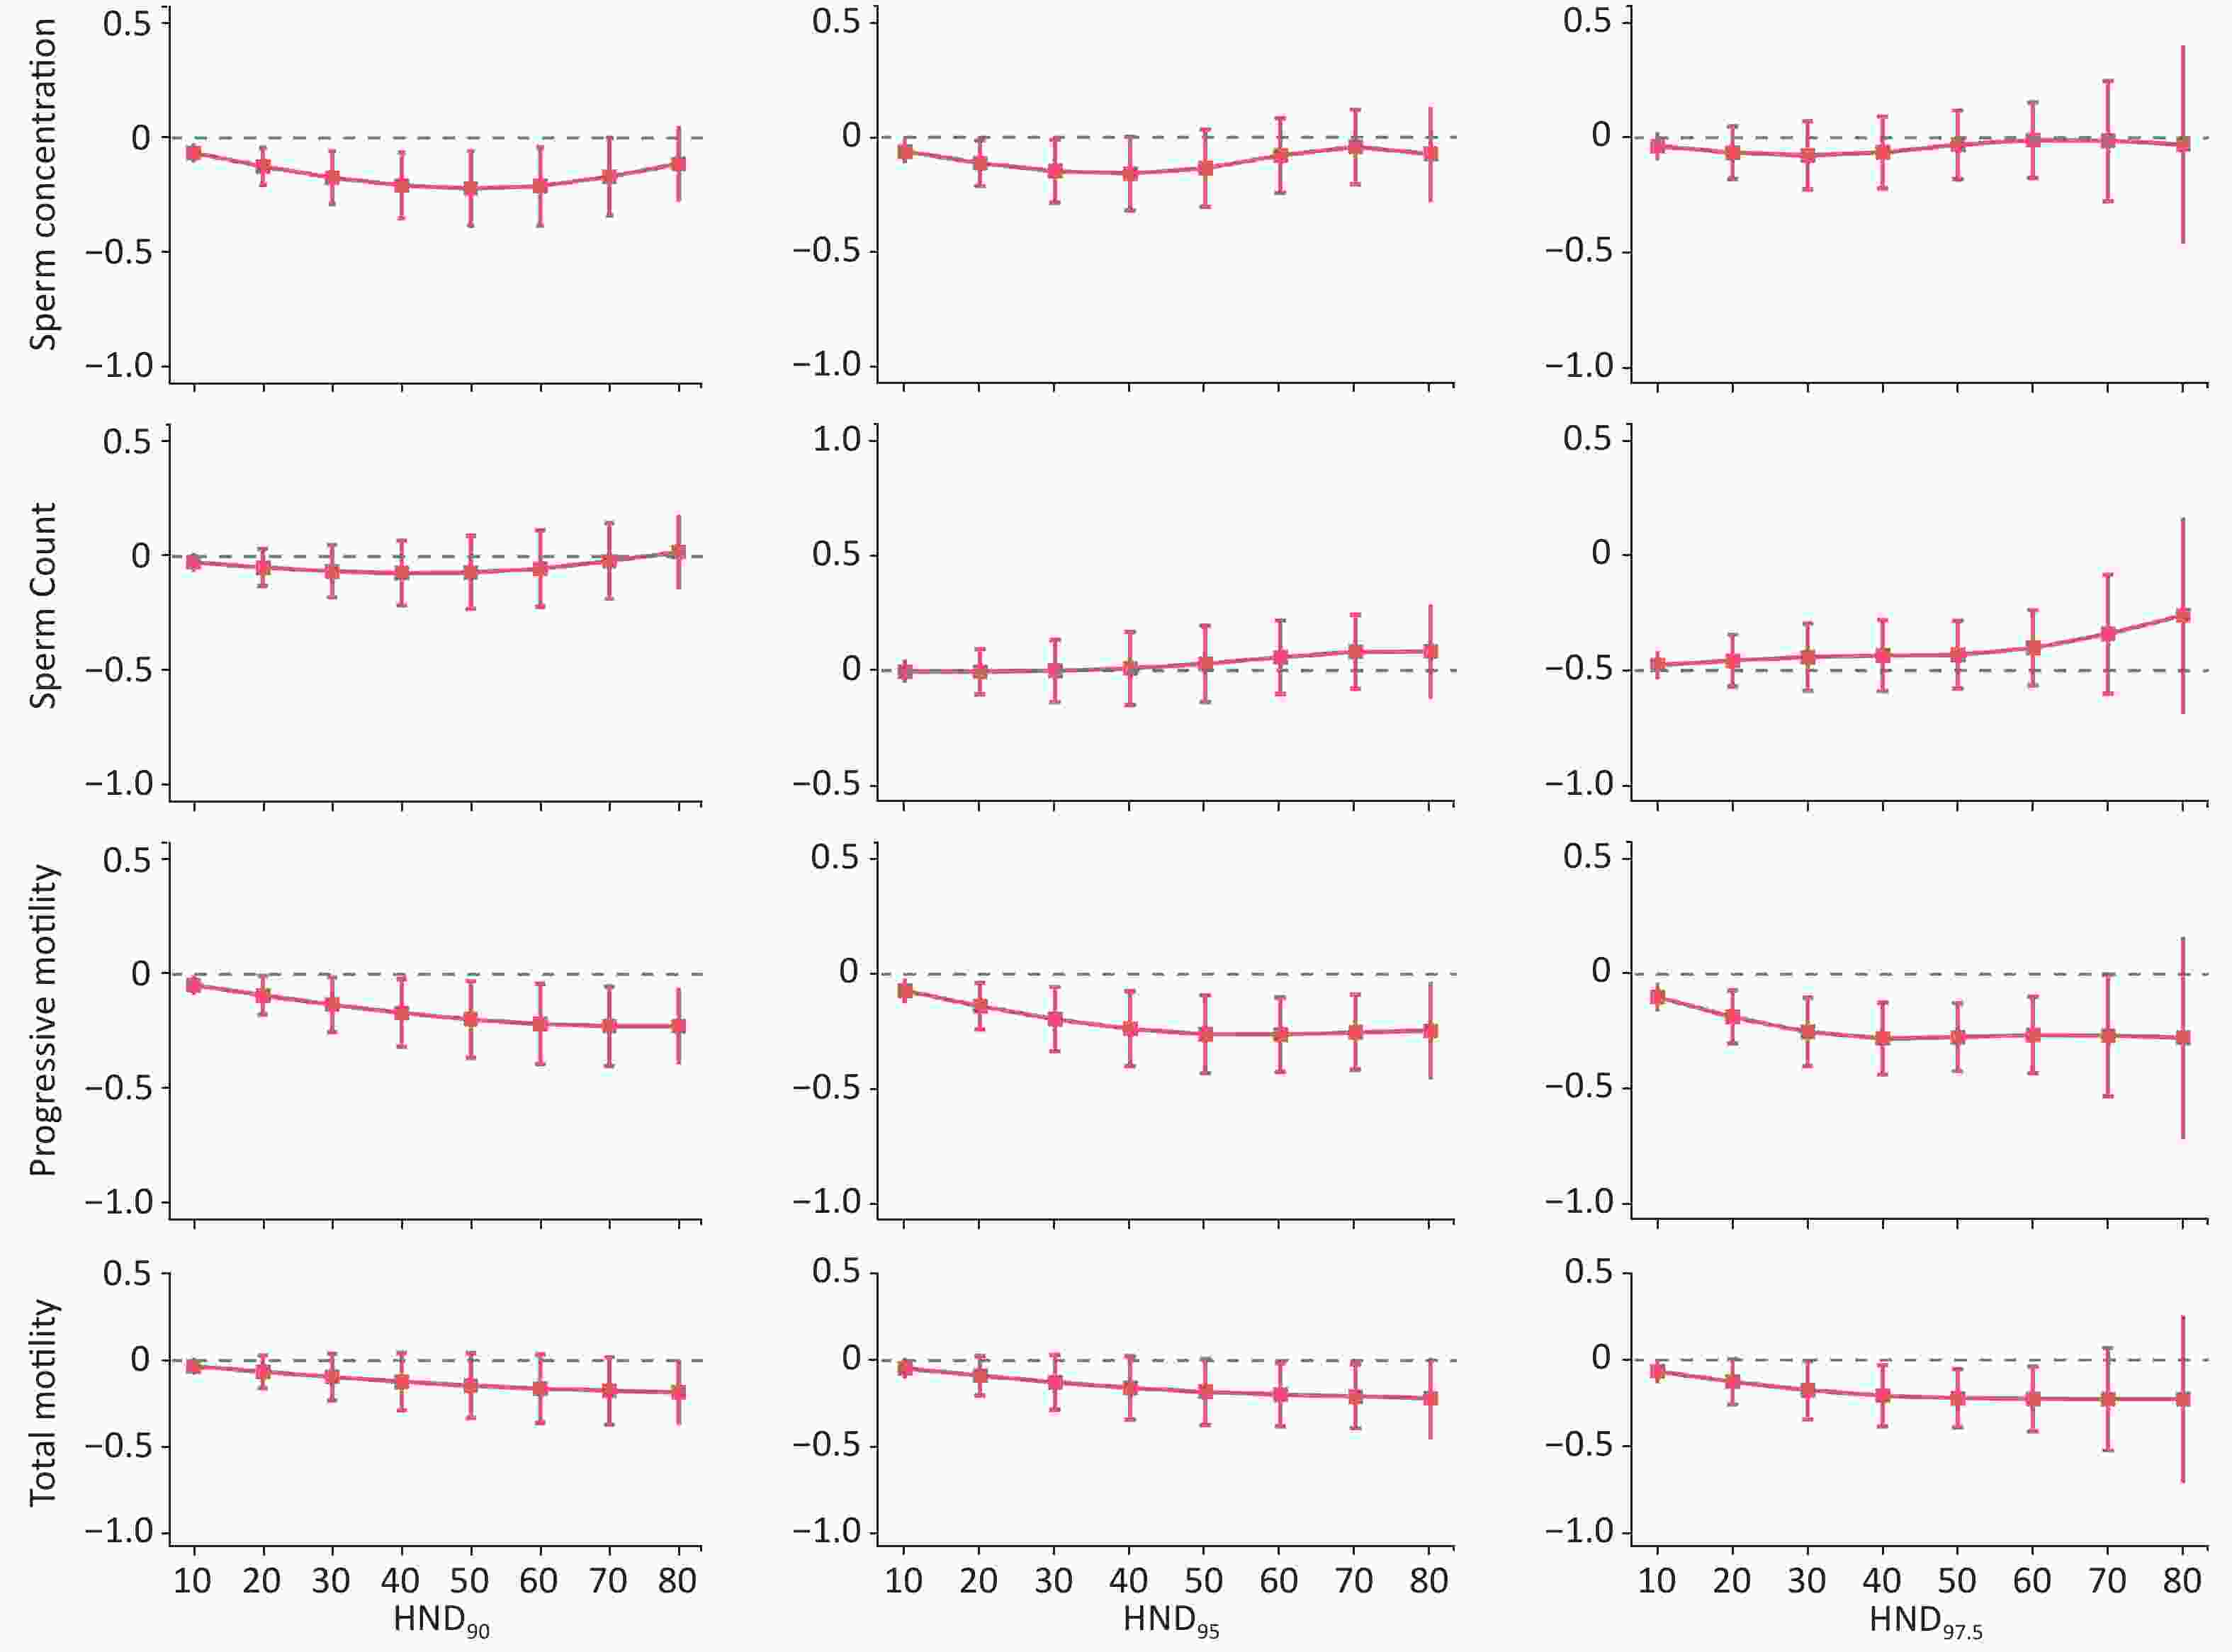
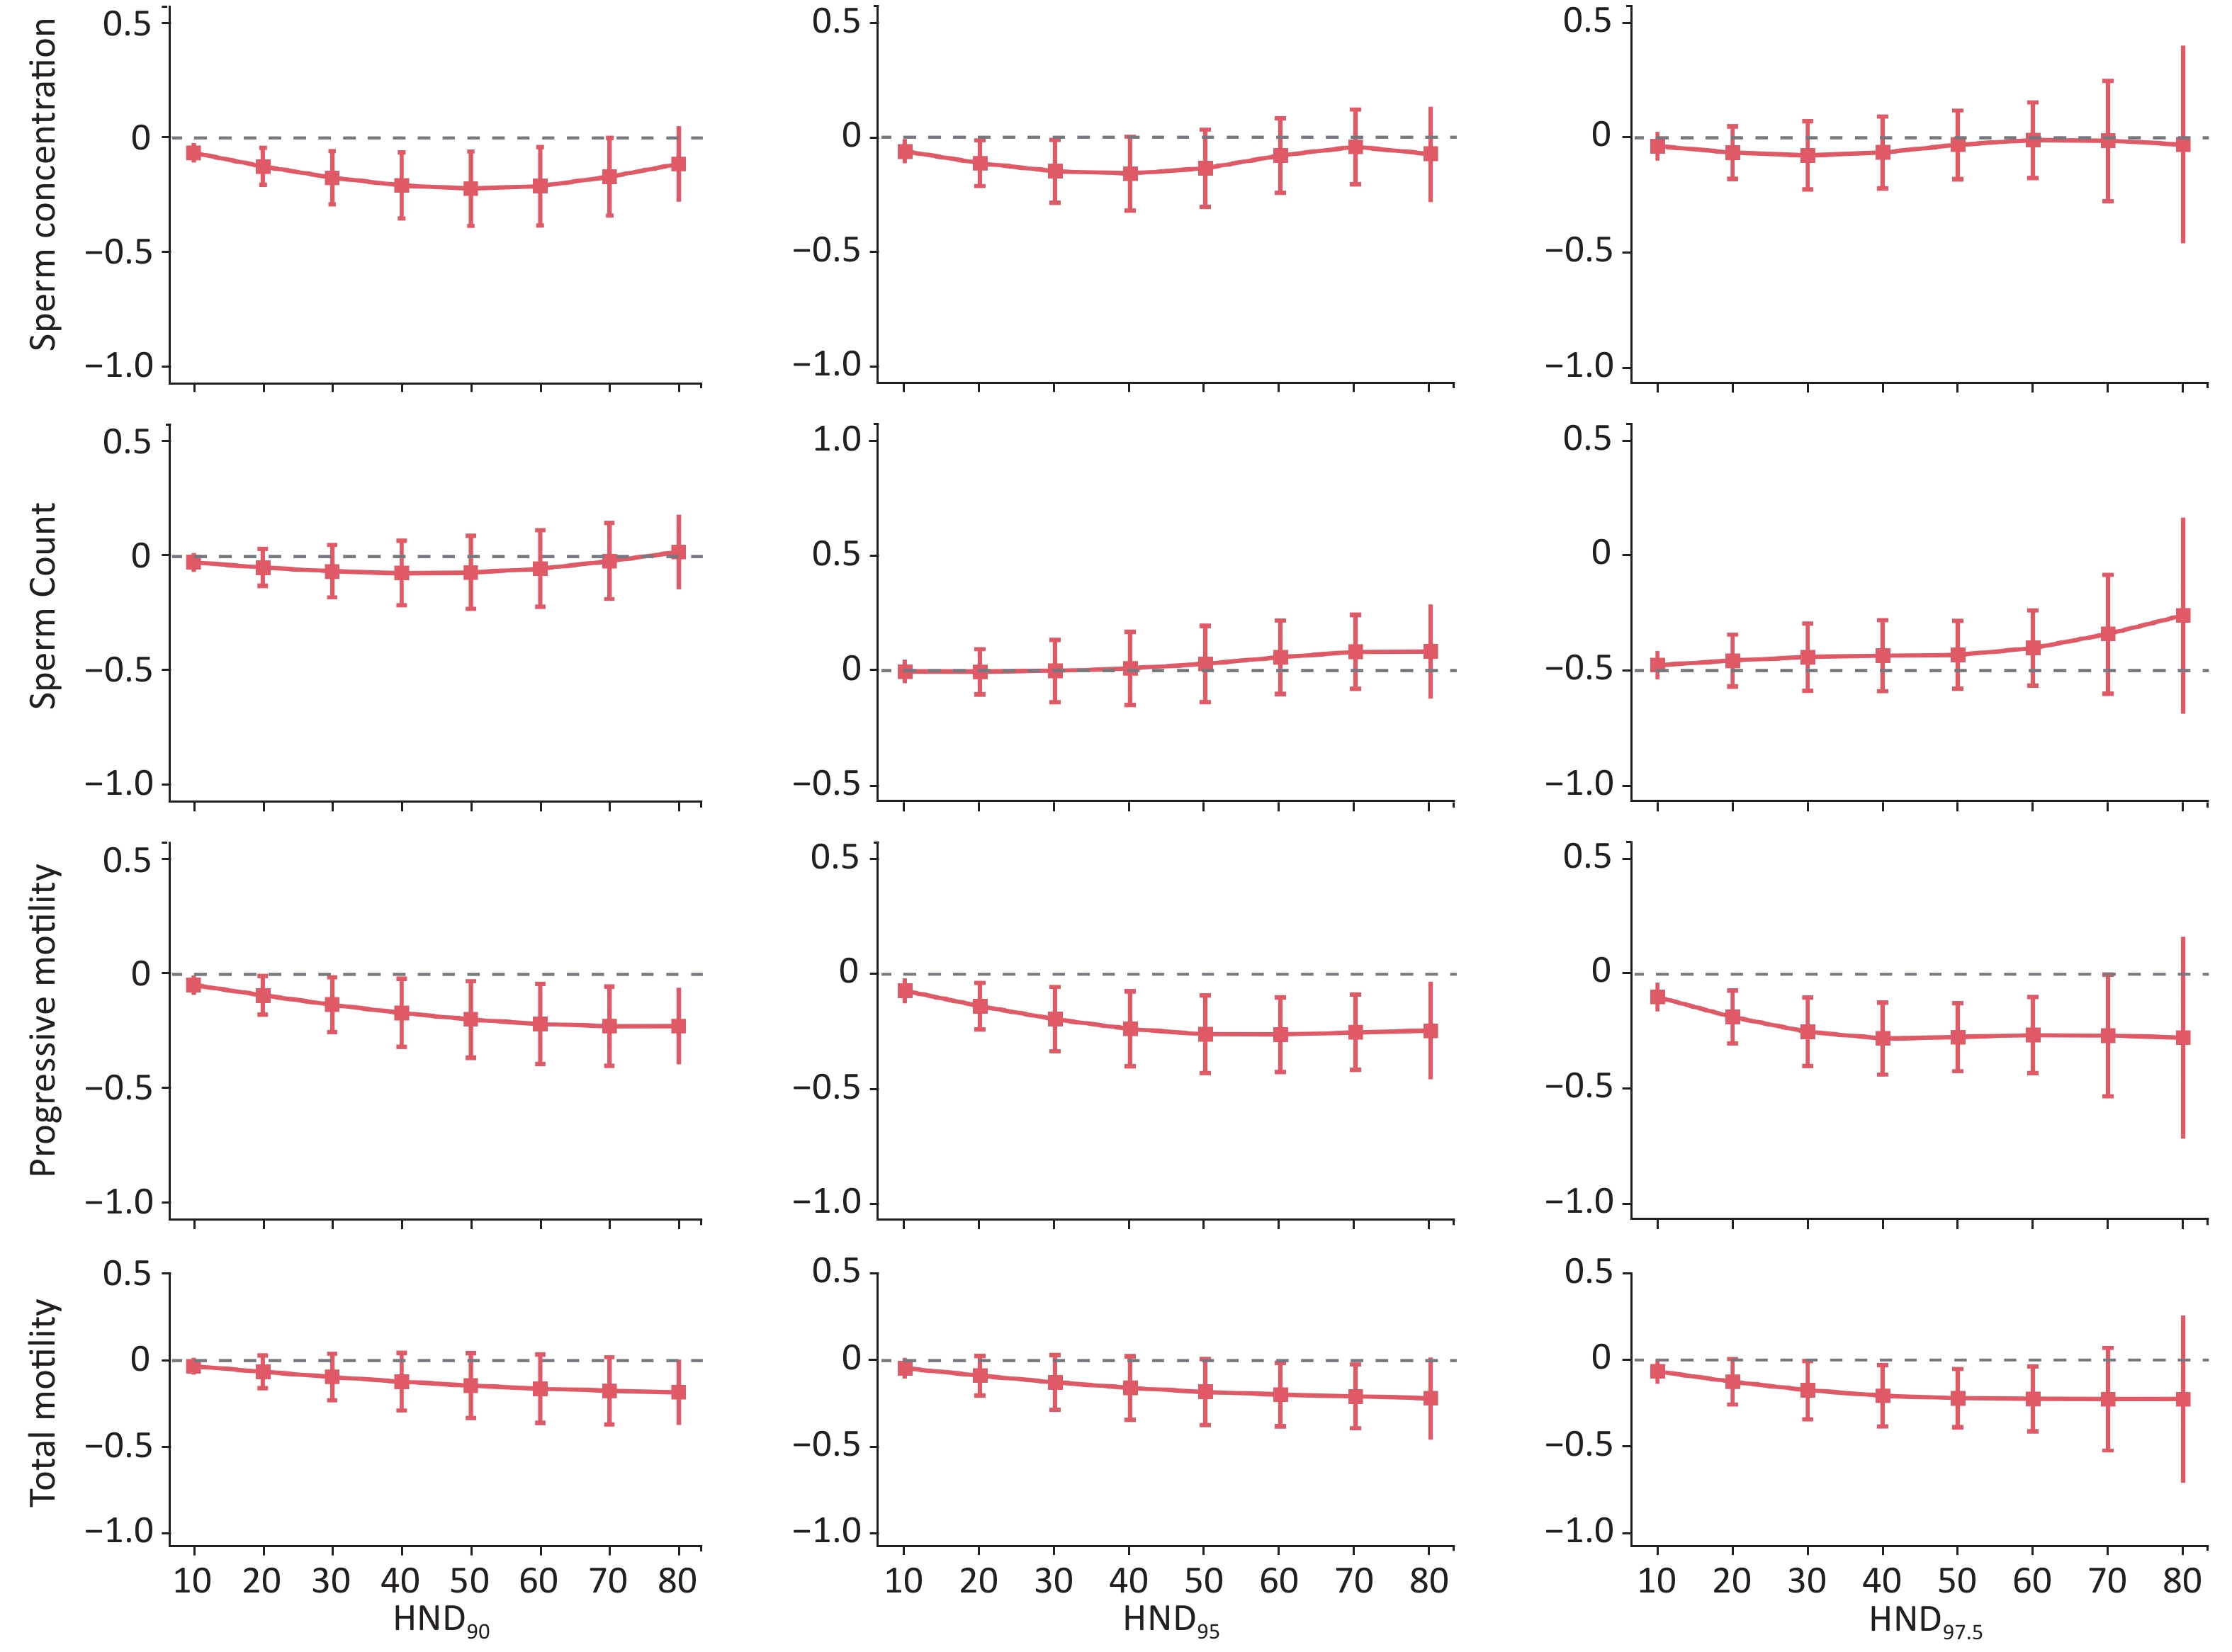
Figure 6. Relationships between hot night duration (HND) and semen parameters at different temperature thresholds. The estimated changes of semen quality were accessed by including a natural cubic B-spline of HND, and were adjusted for abstinence period, age, ethnicity, month of semen sample, as well as average PM2.5 concentration, average NO2 concentration, and mean relative humidity during 0–90 days before the date of semen collection.
-
The pooled estimated changes in semen parameters remained robust in the main analysis for the results of several sensitivity analyses associated with elevated nighttime temperature exposure (Supplementary Tables S4–5). More specifically, when sperm donors who had abnormal sperm quality parameters as defined by the WHO criteria were excluded (Supplementary Table S3), the parameter estimates only showed a statistically significant association between hot night exposure and progressive motility (Supplementary Table S4). However, the exposure–response curves responded with a stronger descending trend in semen parameters (Supplementary Figure S1). After modifying the internal node settings of the natural cubic B–spline function that defines HND and HNE, it still showed a comparable correlation with slightly reduced estimates of semen parameters (Supplementary Figure S2). In addition, similar exposure–response relationships were obtained when we additionally adjusted for daily average temperature, occupational factors, and daily average O3 concentration (Supplementary Figures S3–S5) separately in the model. In particular, hot night exposure had more pronounced effects on sperm motility (both progressive motility and total motility) with slightly higher parameter estimates (Supplementary Tables S4–S5). Supplementary Table S6 shows the regression coefficients with 95% CIs for the remeasurement data. In comparison with the primary analysis in Table 3, the results of repeated–measures analyses were robust, with a negative association being observed between thermal night exposure and sperm motility (all P < 0.05).
Table S4. The regression coefficient (95% CIs) of semen quality associated with hot nights in sensitivity analyses at 0–90 lag days
Semen quality parameter HNE (°C) HND (%) Nighttime temperature (°C) β (95% CIs) β (95% CIs) β (95% CIs) Subgroupa Sperm concentration, × 106/mL –0.0013 (–0.0082, 0.0057) 0.0014 (–0.0007, 0.0036) –0.0131 (–0.0388, 0.0125) Sperm count, × 106 –0.0011 (–0.0079, 0.0056) 0.0015 (–0.0006, 0.0036) 0.0027 (–0.0225, 0.0280) Progressive motility, % –0.0102 (–0.0171, –0.0033) –0.0019 (–0.0041, 0.0003) –0.0348 (–0.0615, –0.0081) Total motility, % –0.0071 (–0.0145, 0.0003) –0.0011 (–0.0034, 0.0011) –0.0231 (–0.0519, 0.0056) Adjusted for Tmeanb Sperm concentration, × 106/mL –0.0051 (–0.0130, 0.0028) 0.0032 (0.0004, 0.0061) –0.0208 (–0.0545, 0.0128) Sperm count, × 106 –0.0071 (–0.0148, 0.0007) 0.0027 (–0.0001, 0.0056) –0.0042 (–0.0375, 0.0290) Progressive motility, % –0.0104 (–0.0182, –0.0027) –0.0030 (–0.0059, –0.0001) –0.0151 (–0.0498, 0.0197) Total motility, % –0.0134 (–0.0236, –0.0031) –0.0034 (–0.0068, 0.0001) –0.0262 (–0.0694, 0.0170) Adjusted for occupationc Sperm concentration, × 106/mL –0.0023 (–0.0100, 0.0053) 0.0013 (–0.0010, 0.0037) –0.0204 (–0.0484, 0.0076) Sperm count, × 106 –0.0026 (–0.0103, 0.0050) 0.0017 (–0.0006, 0.0041) –0.0028 (–0.0312, 0.0255) Progressive motility, % –0.0108 (–0.0178, –0.0038) –0.0022 (–0.0044, 0.0000) –0.0352 (–0.0622, –0.0082) Total motility, % –0.0128 (–0.0212, –0.0045) –0.0026 (–0.0050, –0.0002) –0.0462 (–0.0775, –0.0150) Adjusted for O3d Sperm concentration, × 106/mL –0.0020 (–0.0080, 0.0039) 0.0017 (–0.0002, 0.0036) –0.0156 (–0.0377, 0.0065) Sperm count, × 106 –0.0021 (–0.0080, 0.0037) 0.0019 (0.0000, 0.0037) 0.0012 (–0.0207, 0.0230) Progressive motility, % –0.0097 (–0.0155, –0.0038) –0.0023 (–0.0041, –0.0004) –0.0253 (–0.0479, –0.0027) Total motility, % –0.0101 (–0.0168, –0.0034) –0.0024 (–0.0045, –0.0003) –0.0277 (–0.0535, –0.0020) Note. The combined regression coefficients and corresponding 95% confidence intervals (CIs) were estimated using linear mixed models, adjusting for abstinence period, age, ethnicity, month of semen sample, as well as average PM2.5 concentration, average NO2 concentration, and mean relative humidity during 0–90 days before the date of semen collection. HNE, hot night excess; HND, hot night duration; CIs, confidence intervals; Tmean, daily average temperature. aThe subgroup only included subjects with normal sperm concentration, sperm count, and motility according to the WHO reference levels for human semen parameters. bAdditionally adjusted for the average temperature (categorical variable) in the main model. cAdditionally adjusted for occupational factors in the main model. dAdditionally adjusted for the average O3 exposure concentration at 0–90 lag days in the main model. Table S3. Characteristics of the study subjects and the distribution of semen parameters in subgroupa
Characteristics n (%) Sperm quality (x ± s) Sperm concentration, × 106/mL
P–valuebSperm count,
× 106
P–valuebProgressive motility,
%
P–valuebTotal motility,
%
P–valuebAll Observations 11,205 (100) 77.37 ± 35.74 271.92 ± 148.60 55.07 ± 9.53 58.73 ± 9.57 Age, years < 0.001 0.008 < 0.001 < 0.001 < 30 8,151 (72.7) 75.42 ± 34.24 269.83 ± 147.11 54.76 ± 9.44 58.41 ± 9.52 30–39 2,686 (24.0) 81.74 ± 38.82 275.36 ± 150.19 55.92 ± 9.67 59.70 ± 9.63 ≥ 40 368 (3.3) 88.64 ±39.81 293.06 ± 167.13 55.64 ± 10.08 59.15 ± 9.94 Ethnicity < 0.001 < 0.001 0.035 0.145 Han 10,856 (96.9) 77.16 ± 35.78 271.07 ± 148.61 55.04 ± 9.51 58.71 ± 9.56 other 349 (3.1) 84.02 ± 33.76 298.41 ± 146.29 56.09 ± 9.94 59.38 ± 10.00 Abstinence period, days 0.052 < 0.001 < 0.001 < 0.001 2–3 3,310 (29.5) 75.70 ± 33.51 239.99 ± 131.80 56.94 ± 9.88 60.68 ± 9.88 4–5 5,941 (53.0) 78.29 ± 36.24 279.00 ± 146.52 54.92 ± 9.35 58.46 ± 9.36 6–7 1,954 (17.5) 77.42 ± 37.71 304.48 ± 170.34 52.36 ± 8.73 56.20 ± 8.95 Note. Data were given as n (percent) or x ± s as indicated. Column percentages may not add up to 100 due to rounding. x, mean value; s, standardized deviation. aThe subgroup only included subjects with normal sperm concentration, sperm count, and motility according to the WHO reference levels for human semen parameters. bP–value was estimated using Wilcoxon rank sum test for intergroup comparisons of numerical variables. 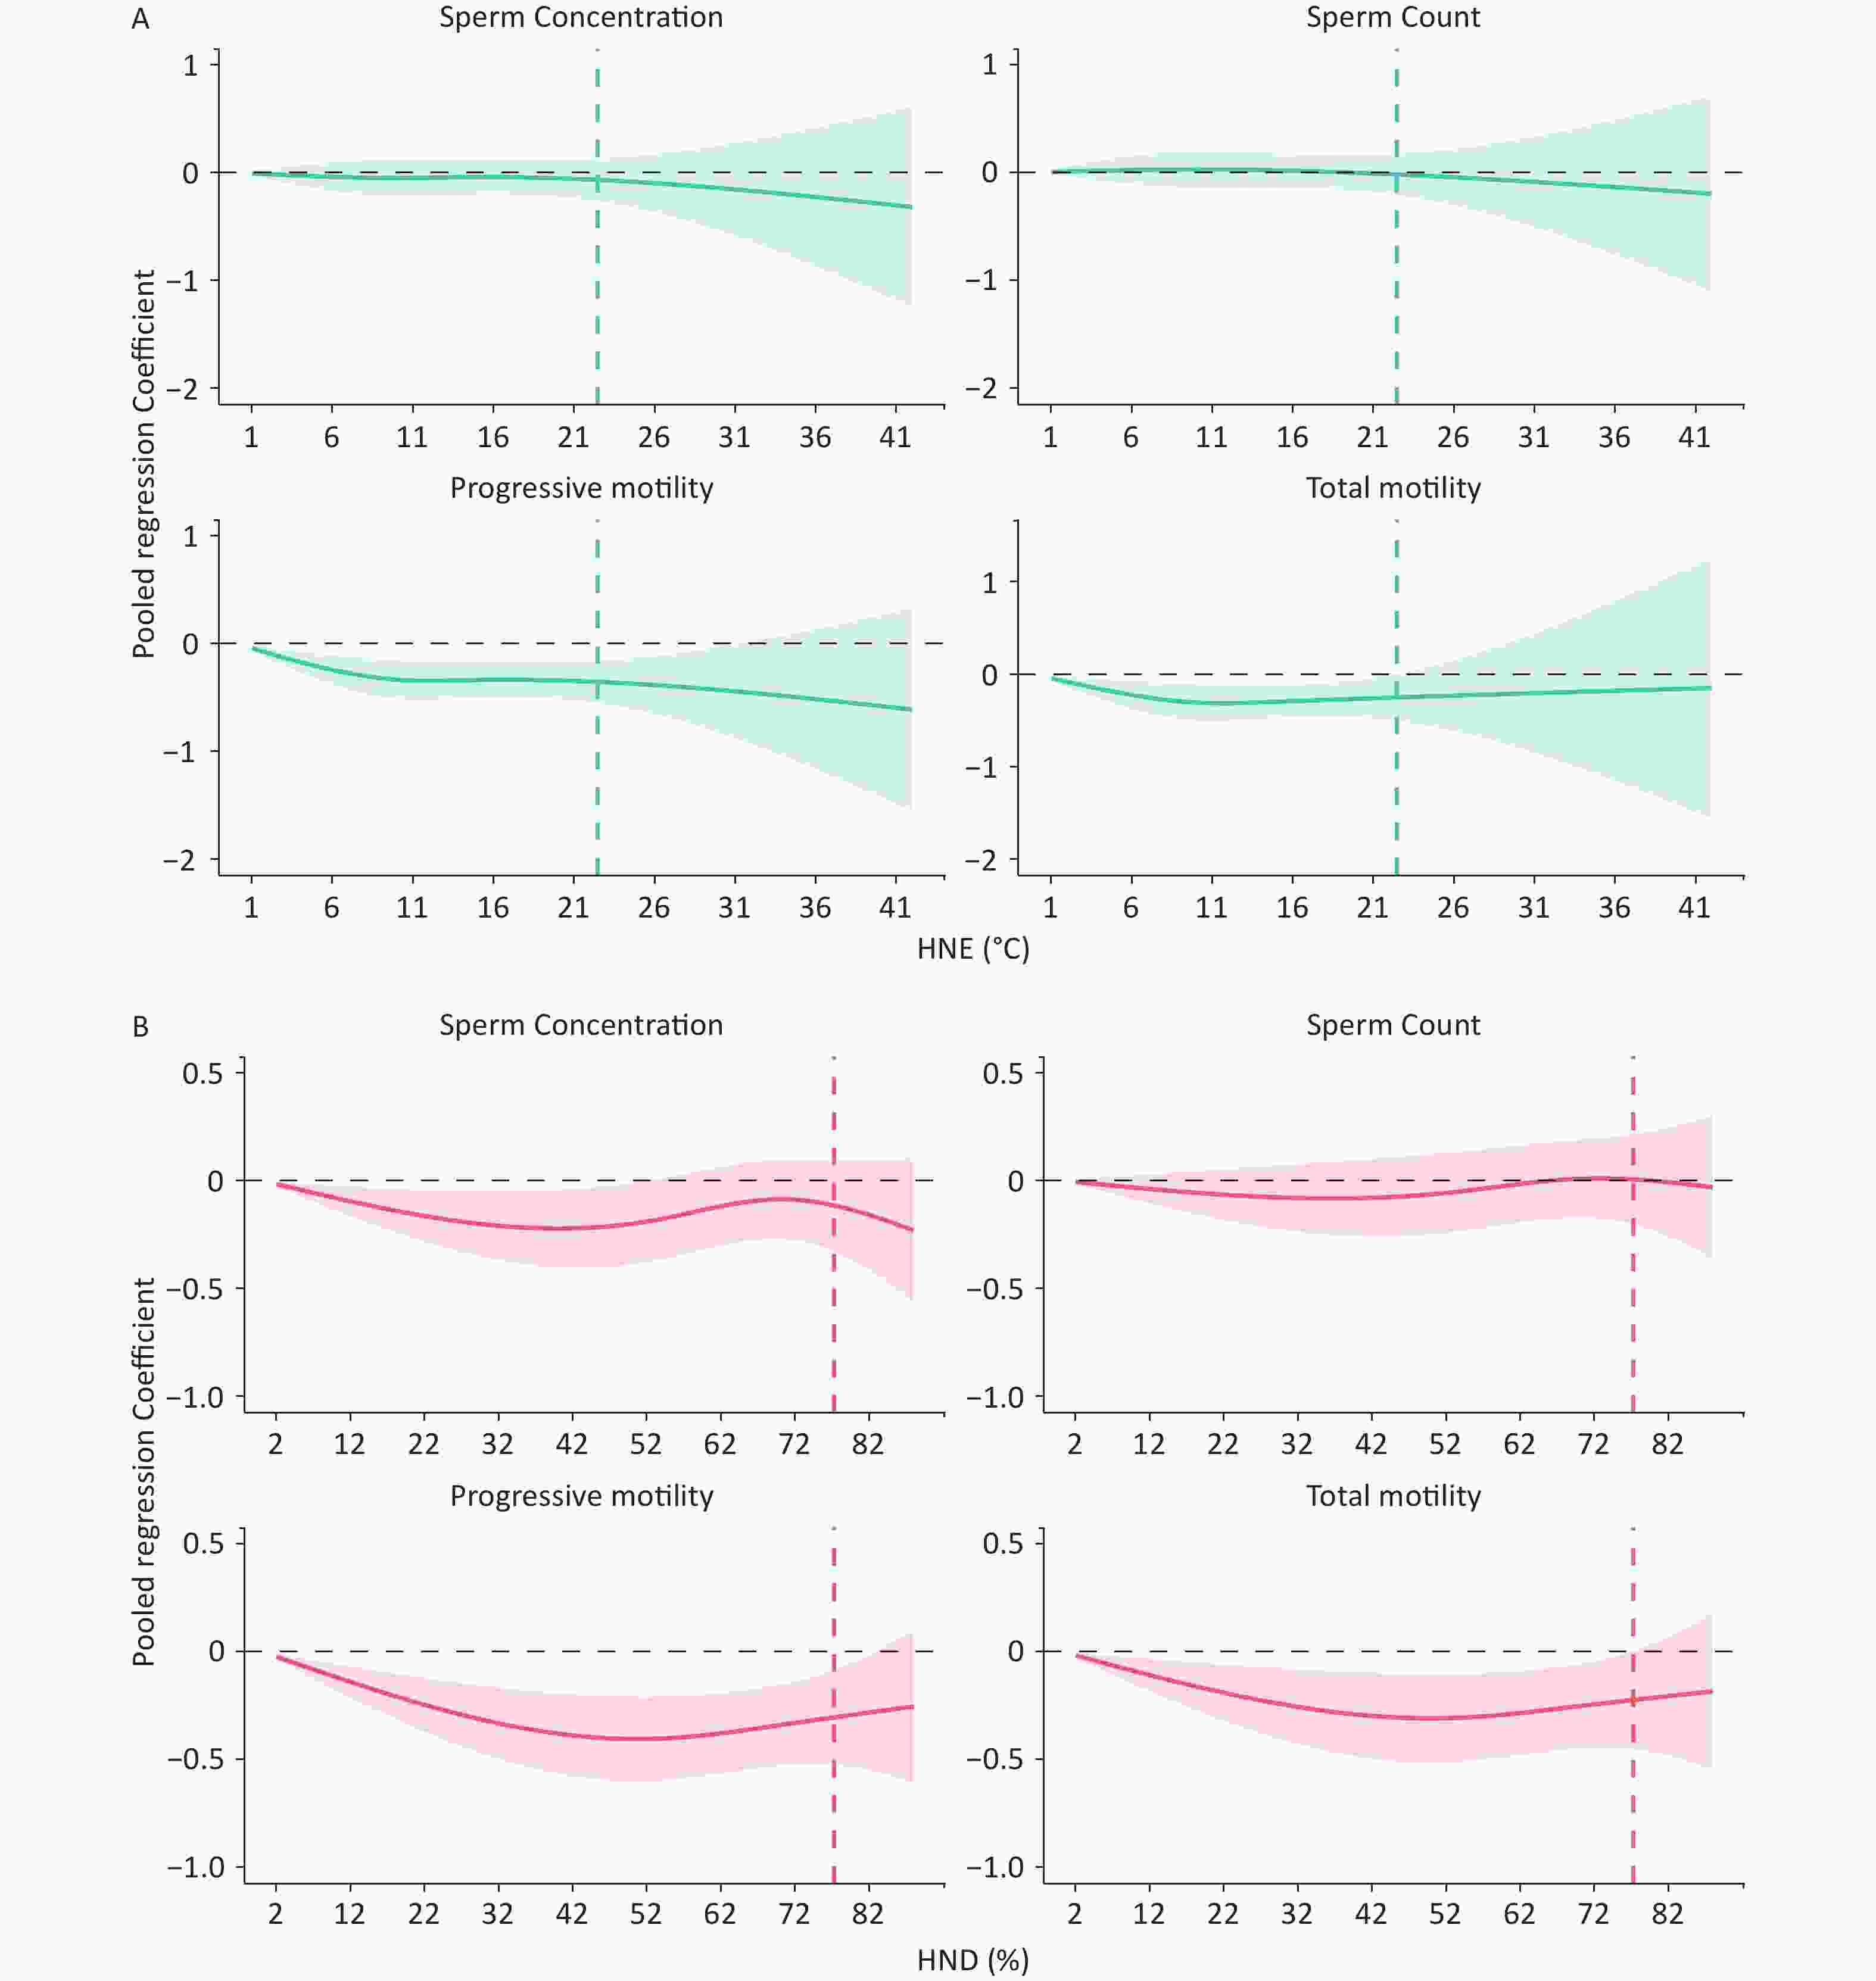
Figure S1. Relationships between hot night indices (A) HNE, (B) HND and semen parameters in subgroup. The estimated changes of semen quality were accessed by including a natural cubic B–spline of hot night excess (HNE), and were adjusted for abstinence period, age, ethnicity, month of semen sample, as well as average PM2.5 concentration, average NO2 concentration, and mean relative humidity during 0–90 days before the date of semen collection. The subgroup only included subjects with normal sperm concentration, sperm count, and motility according to the WHO reference levels for human semen parameters.
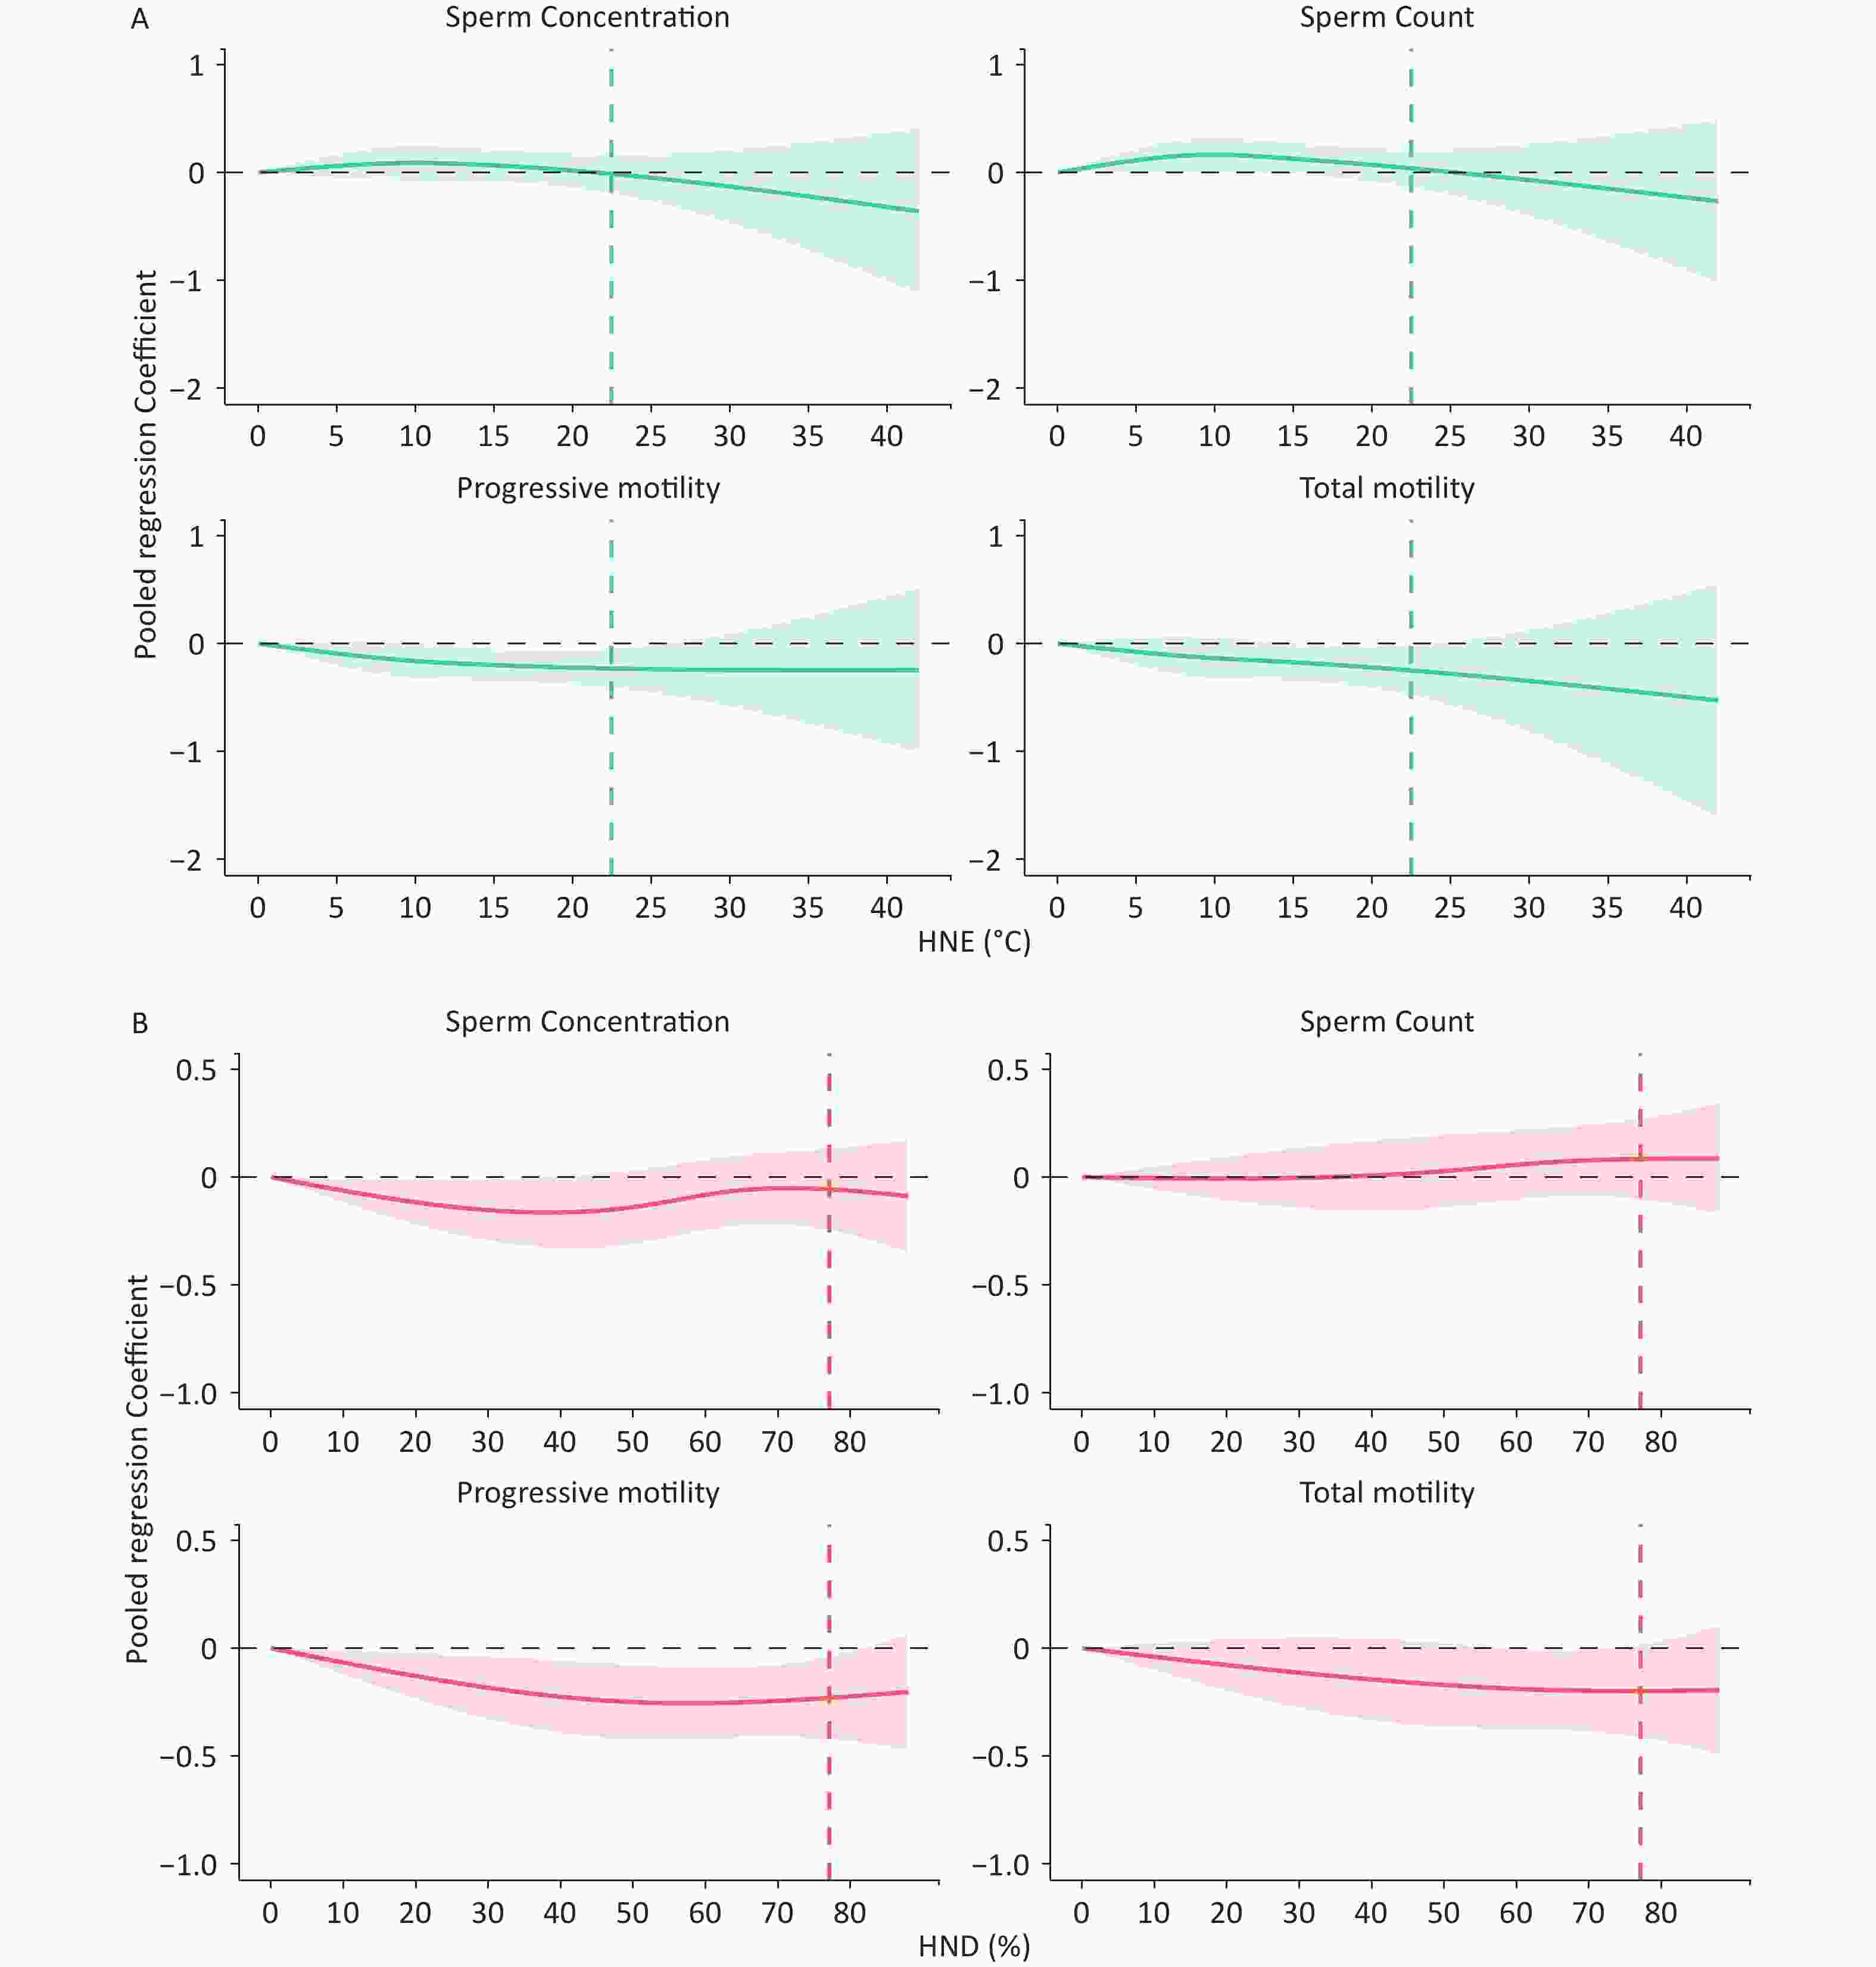
Figure S2. The exposure–response associations between semen quality and hot night indices (A) HNE (B) HND, adjusted for the two internal nodes at the 50th and 75th percentiles. The estimated changes of semen quality were accessed by including a natural cubic B–spline of hot night indices (HNE or HND), and were adjusted for abstinence period, age, ethnicity, month of semen sample, as well as average PM2.5 concentration, average NO2 concentration, and mean relative humidity during 0–90 days before the date of semen collection. HNE, hot night excess; HND, hot night duration; CIs, confidence intervals. The vertical dotted lines indicate the 99th percentile of regional warm–season hot night excess (HNE) and hot night duration (HND). Shaded areas represent corresponding 95% CIs.
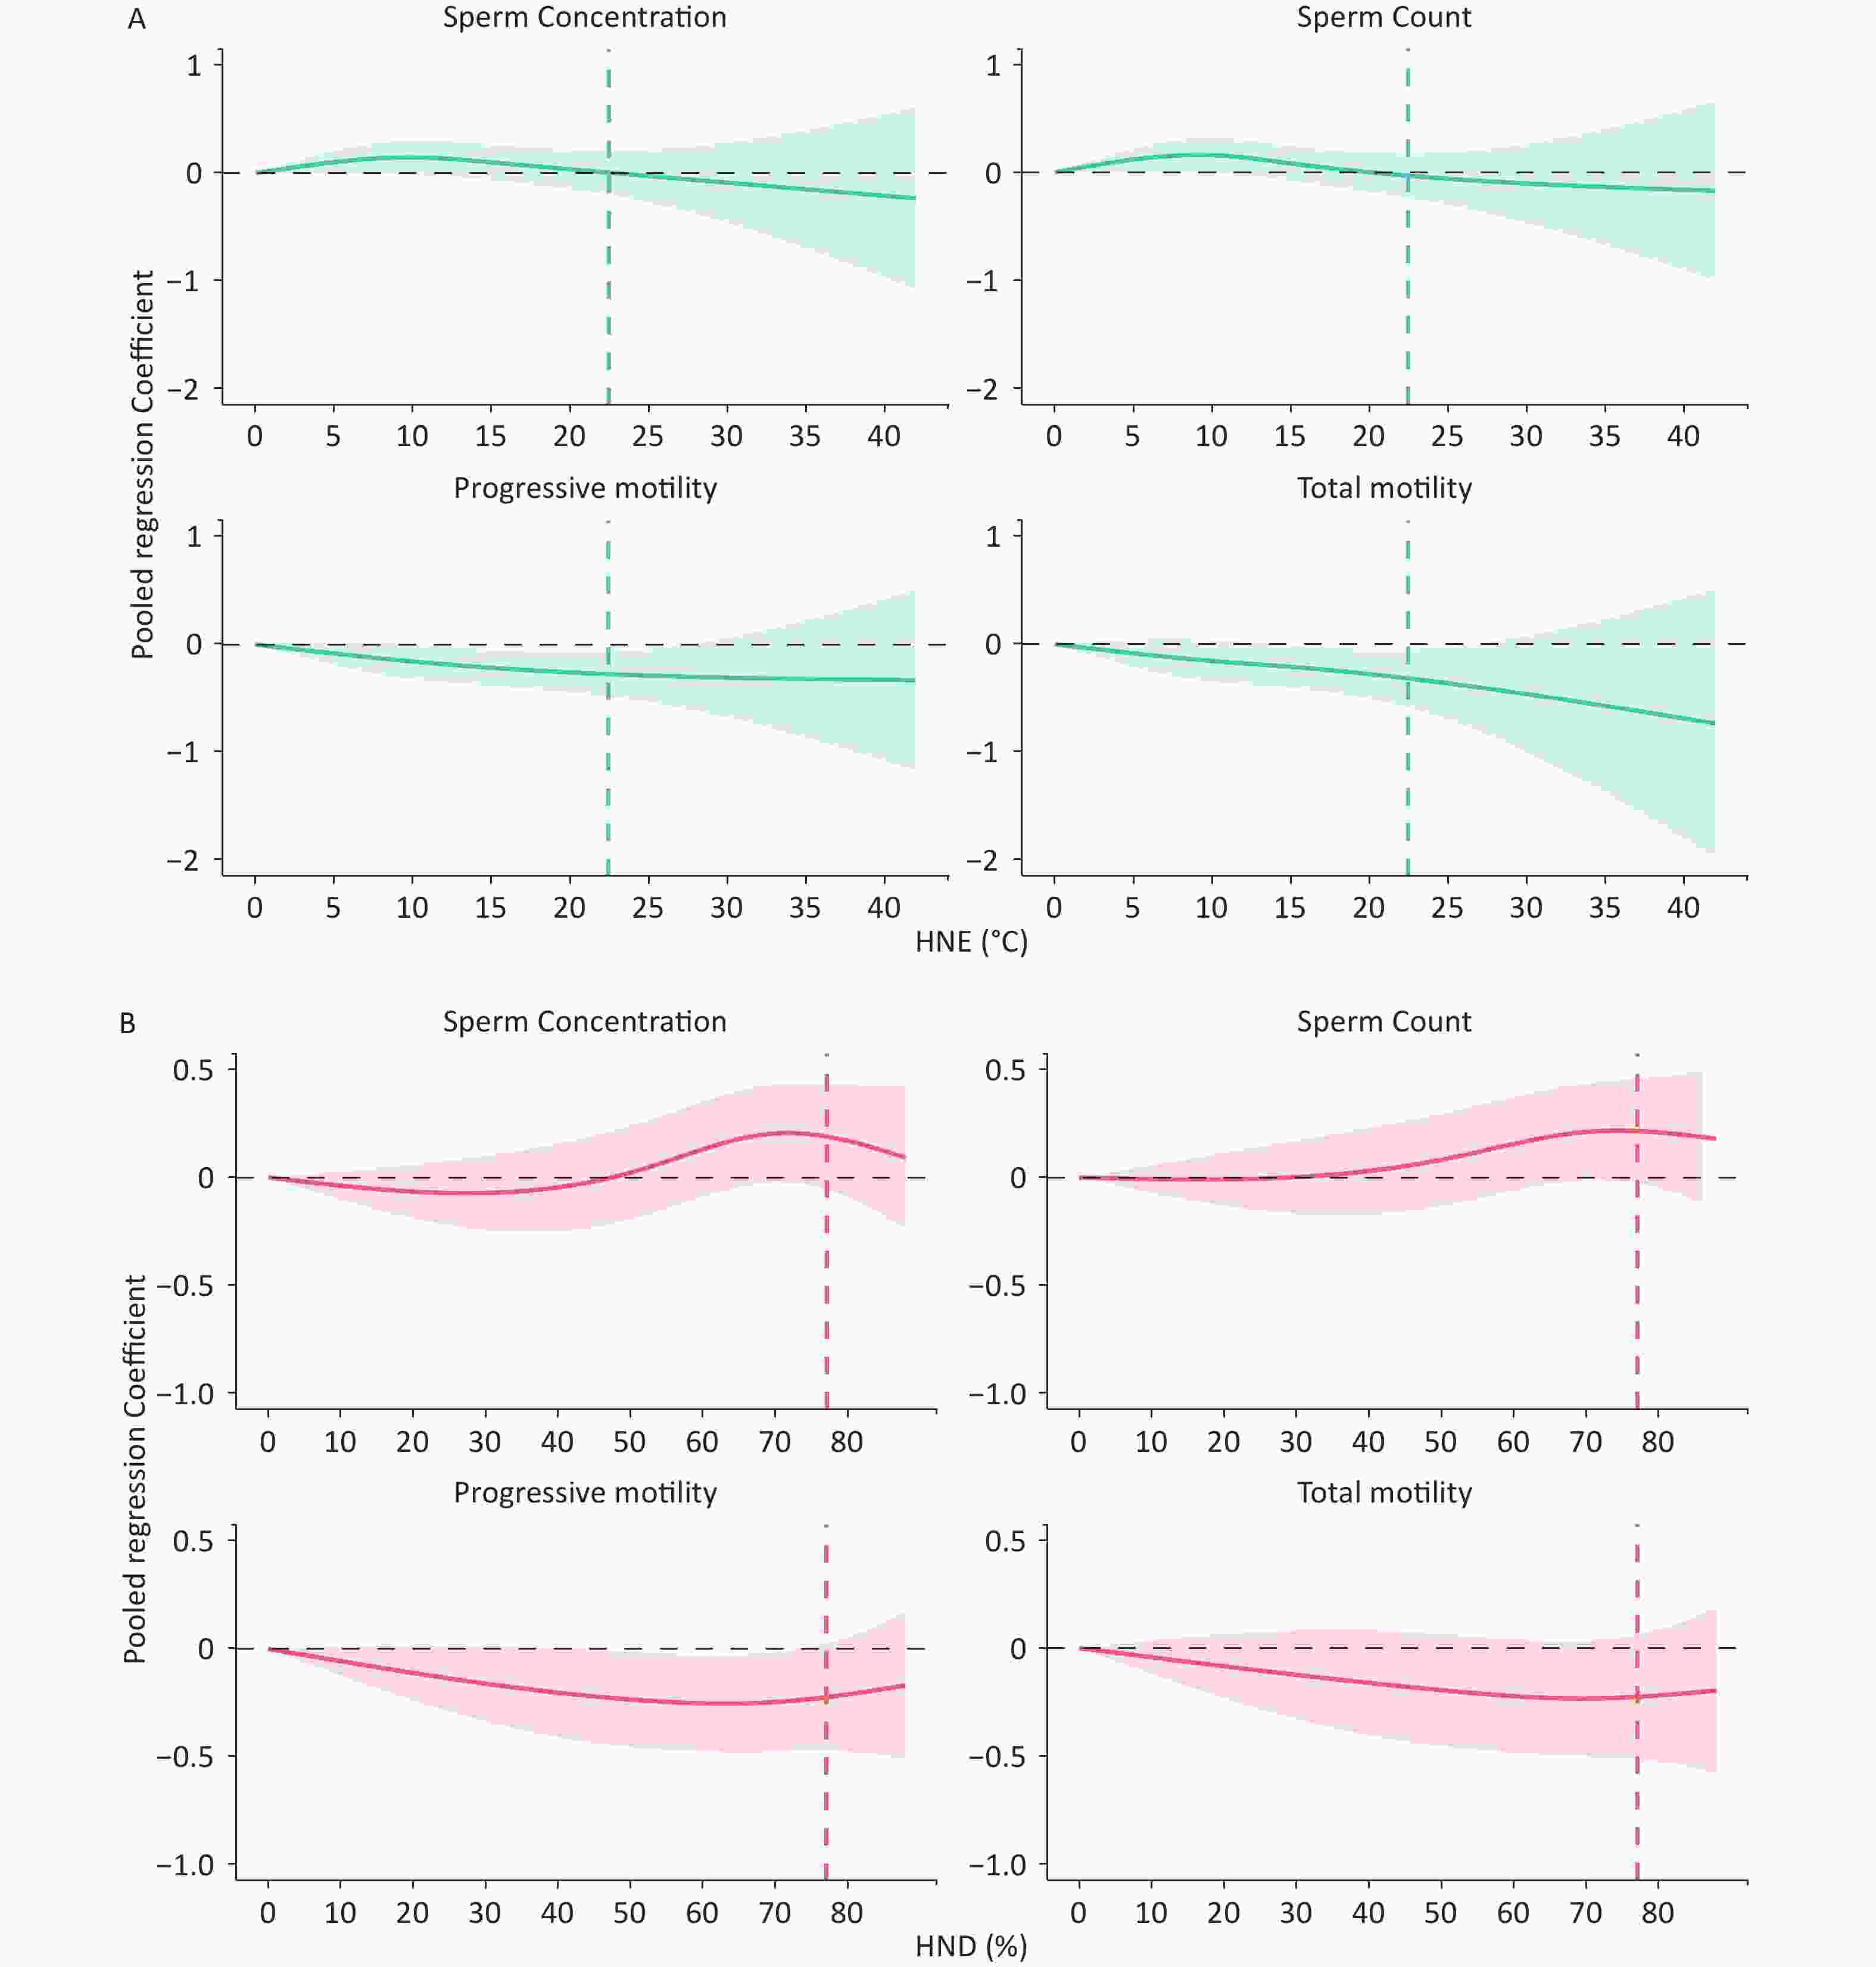
Figure S3. The exposure–response relationships between hot night indices (A) HNE, (B) HND and semen quality adjusting for daily average temperature during 0–90 lag days. The estimated changes of semen quality were accessed by including a natural cubic B–spline of hot night indices (HNE or HND), and were adjusted for abstinence period, age, ethnicity, month of semen sample, as well as average PM2.5 concentration, average NO2 concentration, and mean relative humidity during 0–90 days before the date of semen collection. HNE, hot night excess; HND, hot night duration; CIs, confidence intervals. The vertical dotted lines indicate the 99th percentile of regional warm–season hot night excess (HNE) and hot night duration (HND). Shaded areas represent corresponding 95% CIs.
Table S6. Repeated measurement data with regression coefficients (95% CIs) of semen quality associated with hot nights in six regions of China during 2014–2020
Semen quality parameter HNE HND Nighttime temperature β (95% CIs) P–value β (95% CIs) P–value β (95% CIs) P–value Sperm concentration, × 106/mL –0.0024
(–0.0122, 0.0074)0.6343 0.0012
(–0.0015, 0.0040)0.3694 –0.0388
(–0.0730, –0.0047)0.0259 Sperm count, × 106 0.0037
(–0.0062, 0.0135)0.4649 0.0026
(0.0000, 0.0053)0.0552 –0.0086
(–0.0432, 0.0260)0.6275 Progressive motility, % –0.0198
(–0.0293, –0.0103)< 0.0001 –0.0046
(–0.0072, –0.0019)0.0007 –0.0685
(–0.1028, –0.0342)0.0001 Total motility, % –0.0195
(–0.0289, –0.0100)0.0001 –0.0048
(–0.0074, –0.0022)0.0003 –0.0679
(–0.1021, –0.0337)0.0001 Note. The combined regression coefficients and corresponding 95% confidence intervals (CIs) were estimated using linear mixed models, adjusting for abstinence period, age, ethnicity, month of semen sample, as well as average PM2.5 concentration, average NO2 concentration, and mean relative humidity during 0–90 days before the date of semen collection. HNE, hot night excess; HND, hot night duration; CIs, confidence intervals. -
We investigated the effects of hot nights during spermatogenesis on semen quality in this multicenter population-based study involving 6,640 male sperm donors from 6 provincial–level reproductive centers across different geographical regions in China. The findings showed that hot night exposure during sperm development may have detrimental effects on semen quality. This study provides new evidence showing a negative association between nighttime warming and semen quality.
Our study showed that higher nighttime temperatures and elevated HNE and HND were associated with decreased sperm motility over the warmer summer months, suggesting that hot nights might have detrimental effects on semen quality. More specifically, HNE, HND and nocturnal temperature were found to have a significant inverse relationship with sperm motility (both progressive motility and total motility), whereas sperm count and sperm concentration were not significantly associated. In addition, sperm motility was more susceptible to higher nighttime temperatures. Consistent results were found regarding the relationship between semen quality and HNE (or HND) calculated at different heat thresholds on hot nights. Furthermore, the results of sensitivity analysis of the model remained generally robust after additional adjustments for other variables, including daily average temperature or occupational factors.
Under global warming, the relationship between nighttime warming and health has received increasing attention. Aside from the effects of light and noise, ambient temperature plays a crucial role in enhancing sleep quality[44]. High nighttime temperatures accompanied by high daytime temperatures would result in prolonged heat stress. Prolonged heat stress could hinder nocturnal rest as hot nights ensuing hot days may restrict the capacity to regain from daytime exposure[45]. Several studies have examined the relationship between nighttime temperatures and health outcomes, including mortality and preterm births[18,25,35,45]. The results showed that elevated nighttime temperatures were more strongly related to preterm births than daytime temperatures[46]. However, there is limited evidence regarding the effects of hot nights on semen quality. It was for this reason that we conducted this study, which aimed to determine whether there is a relationship between nighttime warming and semen quality. Currently, only a few studies have examined the relationship of ambient temperature to semen quality. Wang et al. found a threshold effect between temperature and semen quality, with semen quality showing a significant reduction when the temperature exceeded the threshold[20]. In a population-based study in Wuhan, China, Zhou et al. found that every 5 °C increase in temperature when the ambient temperature was higher than 13 °C was related to decreased total motility and progressive motility[22]. Increased ambient temperatures were shown to be associated with reduced sperm count and progressive motility in a longitudinal analysis performed in Guangdong, China[21]. These studies suggest that higher ambient temperatures might have detrimental effects on semen quality. In agreement with previous studies regarding the effects of high temperature on semen quality, we found that hot nights during spermatogenesis adversely affected progressive motility and total motility. Our findings have vital public health implications in light of global climate warming, suggesting that the harmful effects of increased nocturnal temperatures should not be ignored to maintain optimal semen quality.
The underlying biological mechanism behind the effects of hot nights on semen quality remains unclear. Nevertheless, several hypotheses have been put forth, including heat stress and sleep deprivation. First, high ambient temperatures are widely regarded to affect testicular thermoregulation, which plays a crucial role in ensuring an optimal testicular temperature[47]. Previous studies have demonstrated that exposure to high ambient temperatures could negatively affect testicular thermoregulation, as higher testicular and epididymal temperatures impair spermatogenesis and affect the quality of sperm DNA[48–50]. Similarly, elevated nighttime temperatures could lead to increased testicular temperature, inducing testicular heat stress[51]. Moreover, testicular heat stress could lead to germ cell apoptosis and DNA damage, which may result in sperm suppression and reduced semen quality[52–55]. Second, exposure to high temperatures at night may cause sleep disruption by interfering with the thermoregulatory process[56], thereby affecting semen quality. Some studies have demonstrated that sleep quality may affect semen quality. For example, Chen et al. found that sleep loss was detrimental to semen quality[57]. Furthermore, Du et al concluded that poor sleep quality was related to reduced semen parameters including sperm concentration, sperm count, and sperm motility[58]. These studies implied that poor sleep quality has adverse effects on semen quality. Further studies are warranted to better understand the detailed biological mechanisms behind the effects of hot nights on semen quality.
Our research has significant public health implications. Recently, infertility has received widespread attention as global fertility rates have declined[59]. Previous studies have shown that nearly 50% of infertility is attributed to male problems[60]. Poor semen quality is not only identified as the most common cause of male infertility, but also affects reproductive health[61]. With regard to global climate warming, the health effects of increasing nocturnal temperature are receiving increasing attention. In the present study, we provided new evidence that hot nights may adversely affect semen quality, suggesting that we should pay more attention to elevated nighttime temperature, especially during spermatogenesis before ejaculation, to maintain better semen quality. In addition, our results suggested the necessity of taking proactive measures, including increasing the coverage of greenness and using renewable energy, which might mitigate the potential impacts of climate change on human semen quality[62,63]. Moreover, we could take some adaptation measures, including using electric fans or air conditioning to mitigate the effects of hot nights[56].
This large-scale study presents distinct strengths. First, the key advantage is that we examined the relationship of hot nights and semen quality in terms of the intensity and duration of nocturnal thermal temperatures using two indices (HNE and HND) rather than conventional indicators such as daily or nocturnal mean temperatures, providing new evidence regarding the effect of nighttime warming on semen quality. Second, our study included 6 regions that are well representative of different climatic zones, spatial distribution, and demographic characteristics in China, which may help provide more convincing results. Third, we used a large sample size of 6,640 participants with 13,501 sperm samples, which allowed us to investigate the relationships between hot nights and semen quality with sufficient statistical power. Fourth, we estimated HNE and HND based on a high–resolution gridded climate dataset, which may reduce measurement errors in exposure. Moreover, HNE and HND can reflect the intensity and duration of nighttime heat instead of single moment temperature, such as maximum temperature, making it possible to examine the effect of nighttime warming on semen quality more accurately. Finally, we observed consistent results in several sensitivity analyses compared with the main analyses, indicating that our results are robust and reliable.
However, our study has some limitations. First, although the present study analyzed four semen parameters in relation to high nocturnal temperatures with adjustment for all available possible confounding factors, we were unable to investigate other semen parameters in relation to hot nights (e.g., normal sperm morphology) given the lack of information. Additionally, residual confounding cannot be completely ruled out as no adjustment was made for the behavioral factors of sperm donors (e.g., physical activity, smoking, and alcohol consumption) because of the unavailability of data. Second, although we used grid meteorological data with high spatial resolution to aggregate estimates of exposure on hot nights, this may not fully reflect the true exposure levels of individuals. Because some factors are not currently available, this study did not consider the indoor exposure and behaviors of subjects that reduce indoor temperature at night, including the use of air conditioning. Therefore, future prospective studies are needed to measure indoor temperature exposure to minimize the potential for exposure misclassification and increase the validity of the study results. Third, considering that this multicenter study was conducted in China, the generalization of our results to other areas should be made with caution, as hot nights may have different effects depending on the distribution of exposure in different areas. However, the impact on the generalizability of the reported results will be minimal given the large sample size, different population characteristics, and heterogeneity of hot night exposure. Finally, some factors, including sleep quality, may modulate the effect of nocturnal warming on semen quality, and the mediating role of these factors should be further investigated in the future.
-
This multicenter population-based study found that hot nights during spermatogenesis may deteriorate semen quality, especially progressive motility and total motility. Our study identified the significant exposure-response relationship between nighttime warming and decreased semen parameters. Given the obvious warming trend in the current global climate and declining trends in human semen quality, our findings have significant public health implications. The results of our study suggested that some protective measures should be implemented during spermatogenesis to prevent exposure to hot nights from negatively affecting semen quality in men.
-
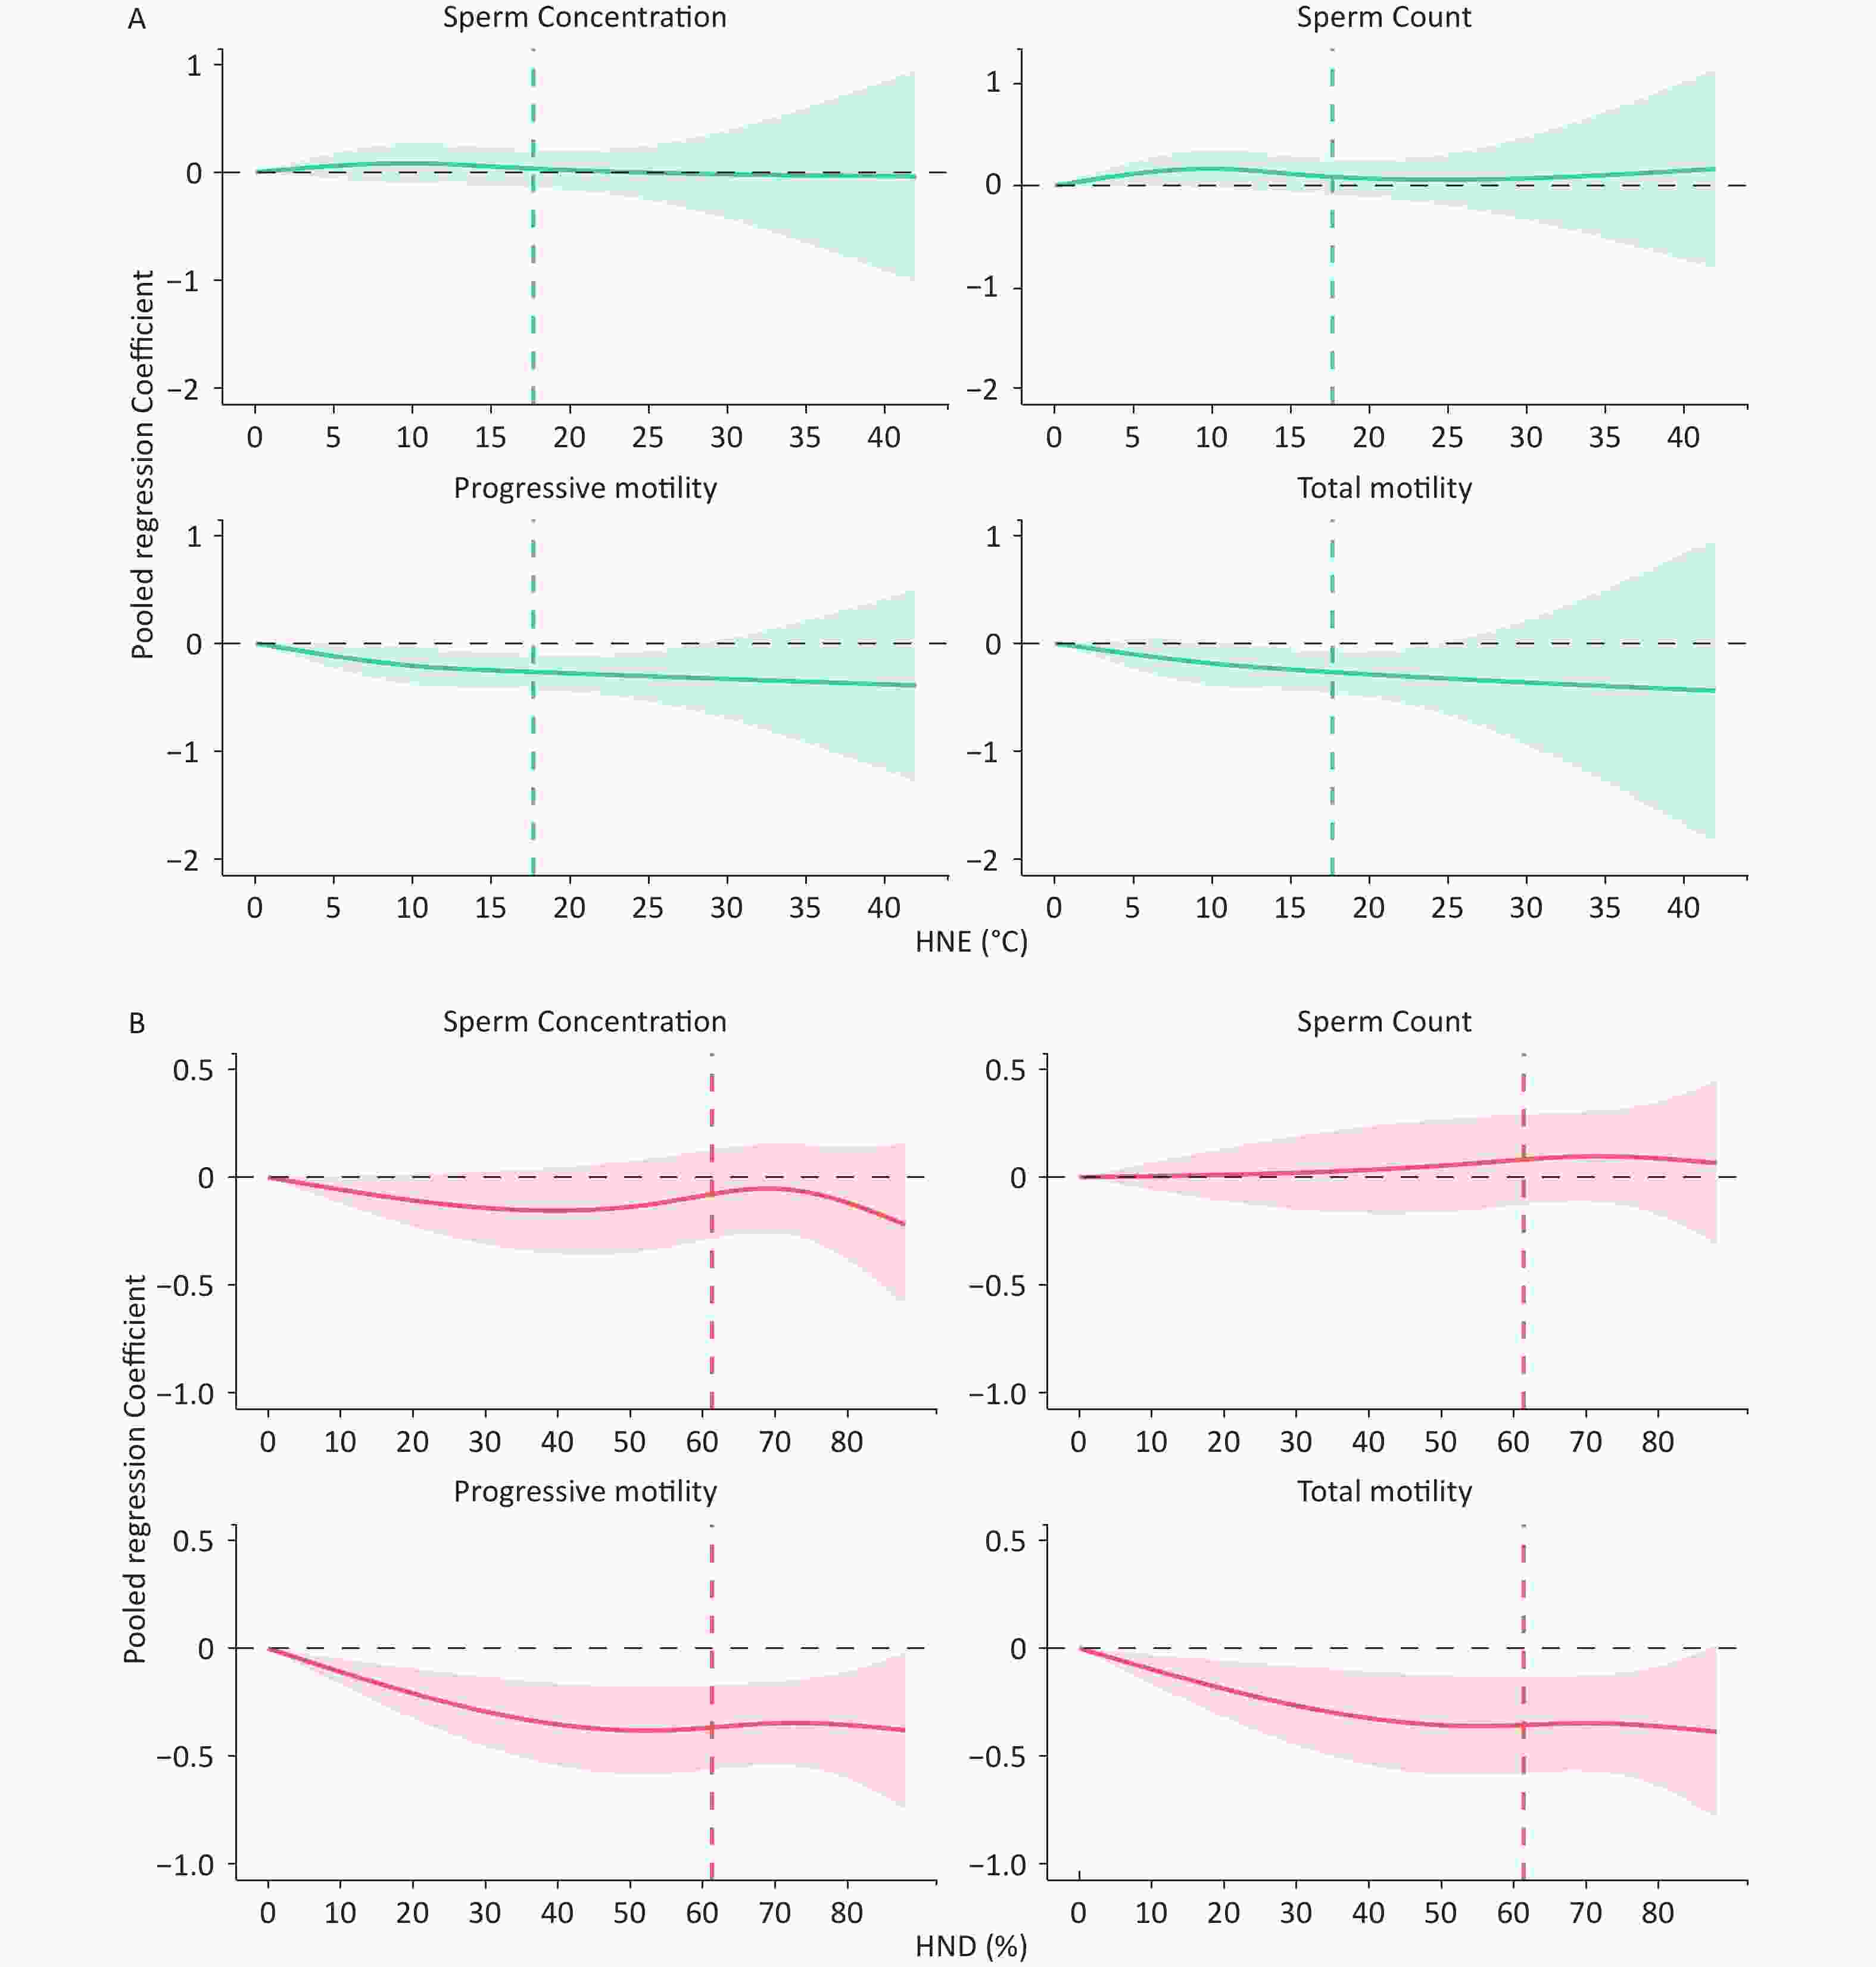
Figure S4. The exposure–response relationships between hot night indices (A) HNE, (B) HND and semen quality adjusting for occupational factors at 0–90 lag days. The estimated changes of semen quality were accessed by including a natural cubic B–spline of hot night indices (HNE or HND), and were adjusted for abstinence period, age, ethnicity, month of semen sample, as well as average PM2.5 concentration, average NO2 concentration, and mean relative humidity during 0–90 days before the date of semen collection. HNE, hot night excess; HND, hot night duration; CIs, confidence intervals. The vertical dotted lines indicate the 99th percentile of regional warm–season hot night excess (HNE) and hot night duration (HND). Shaded areas represent corresponding 95% CIs.
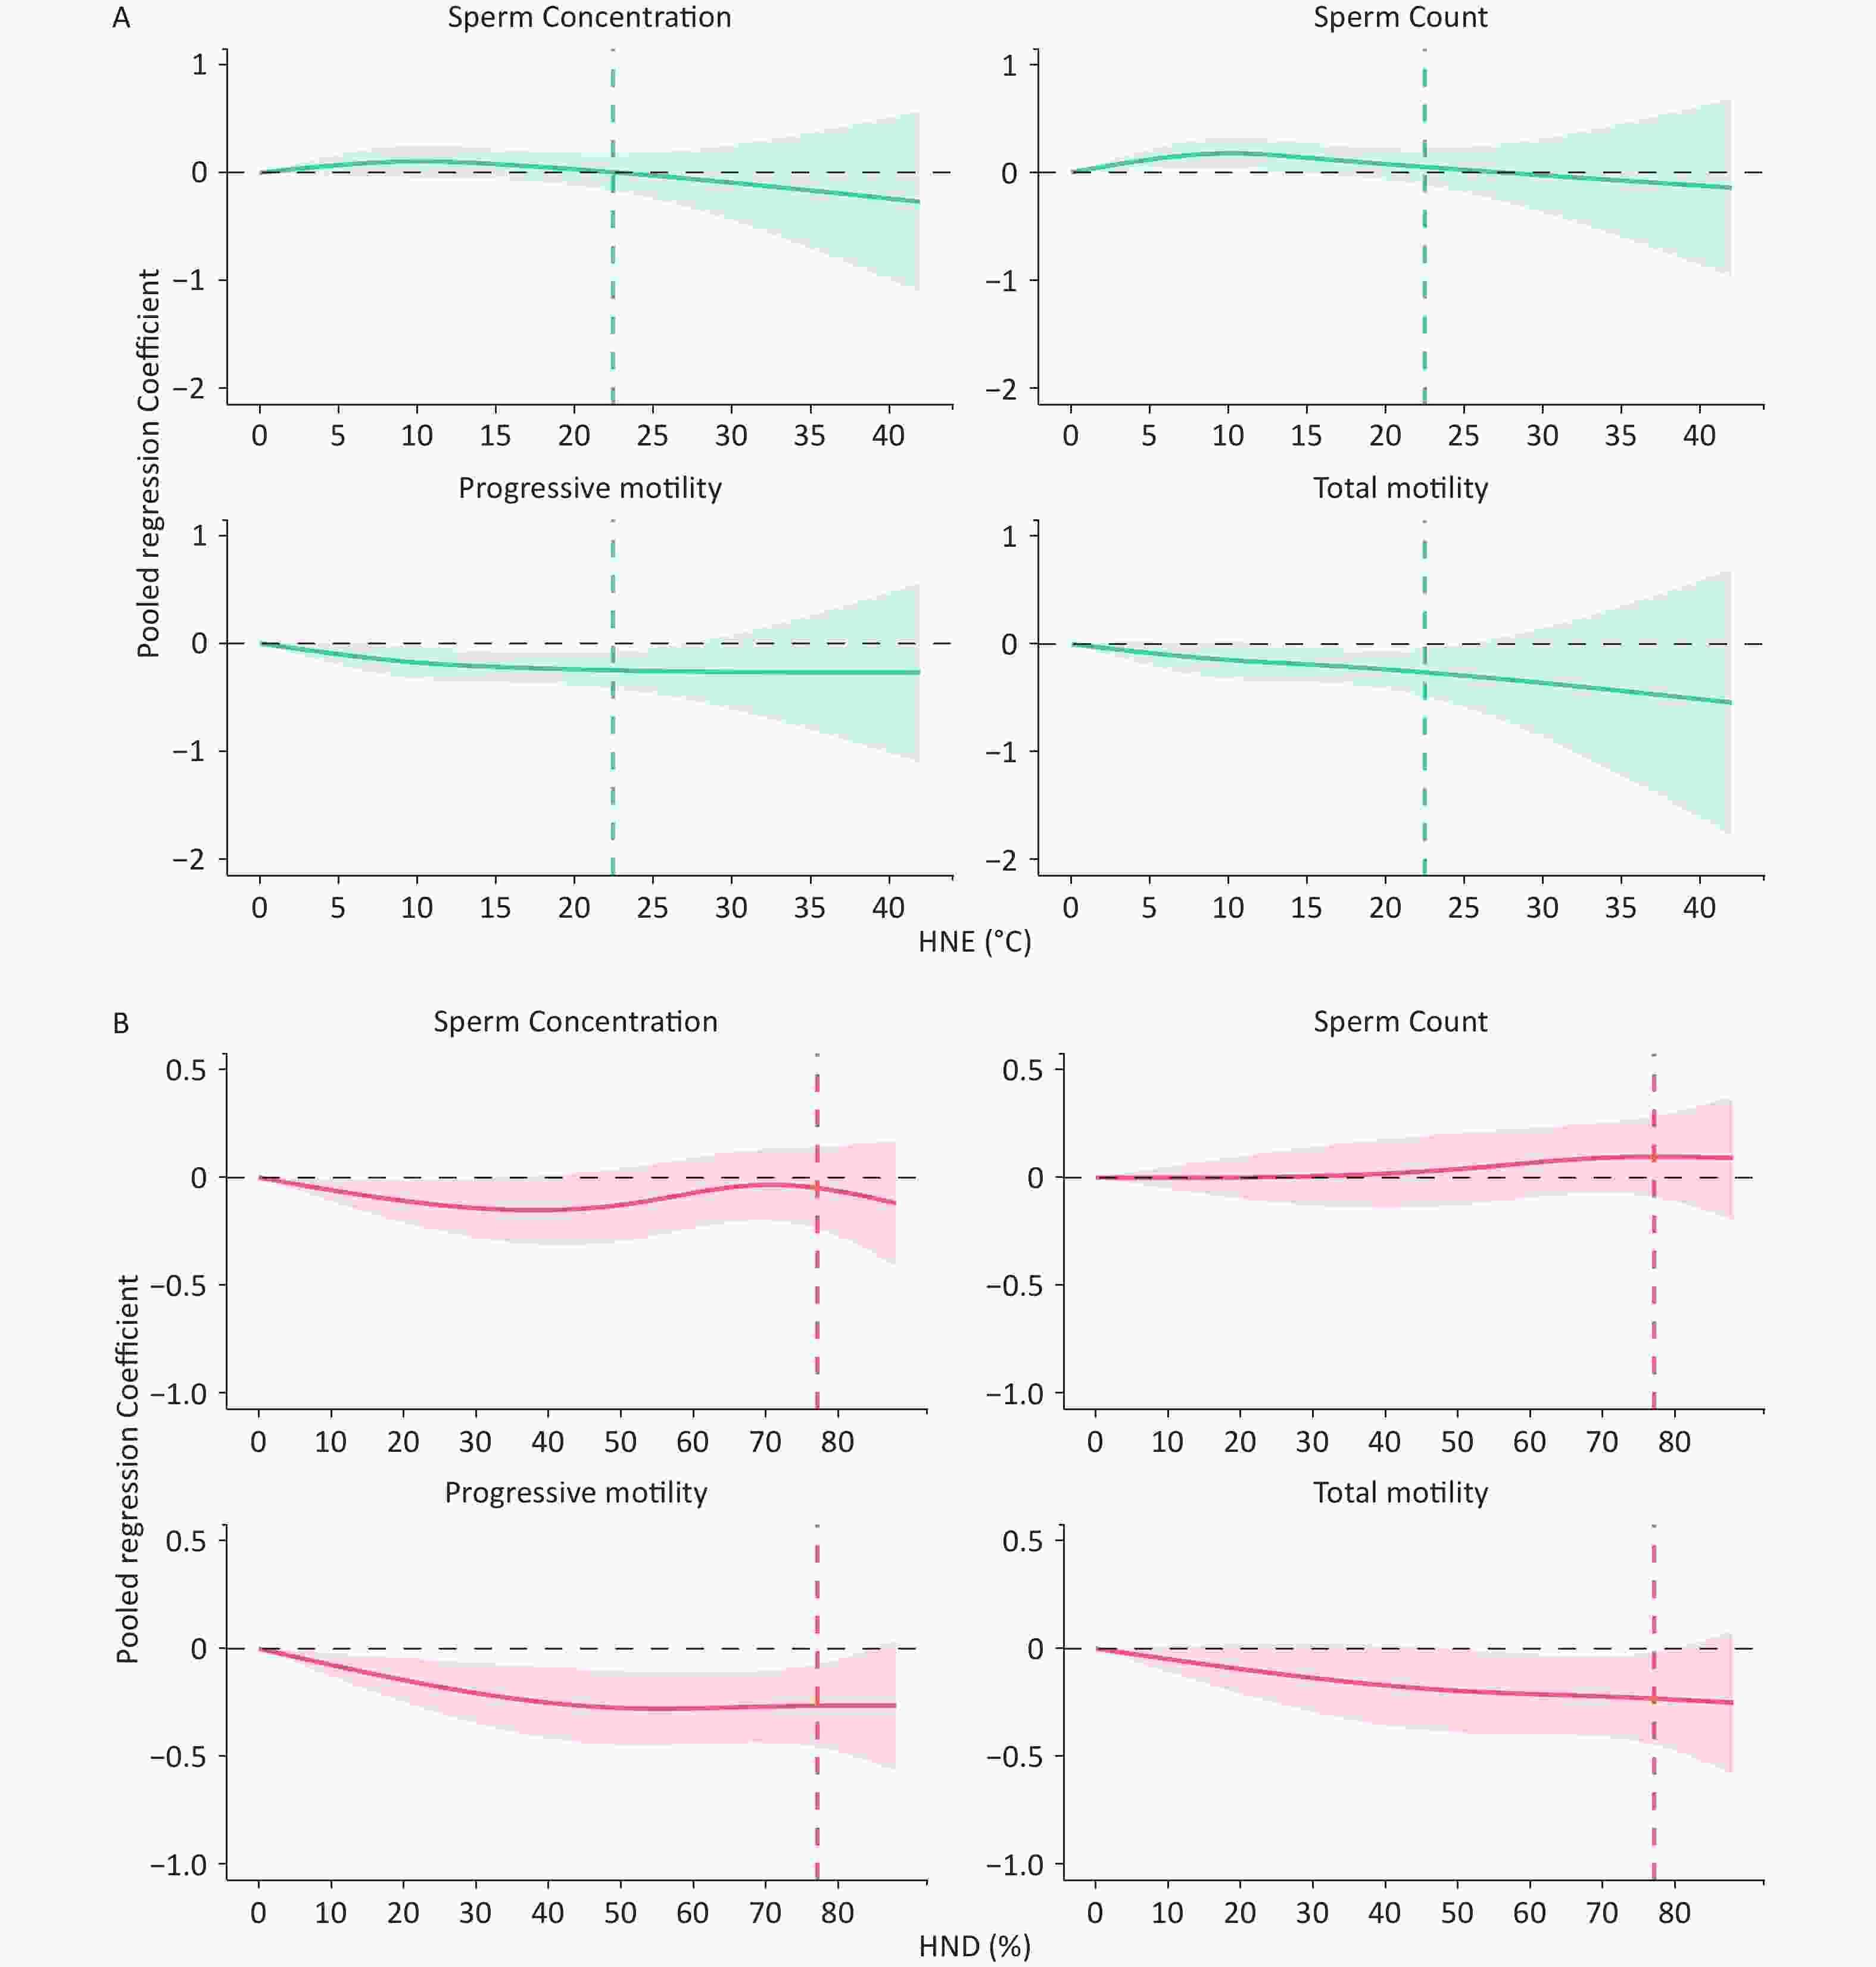
Figure S5. The exposure–response relationships between hot night indices (A) HNE, (B) HND and semen quality with adjustment for average O3 concentration at 0–90 lag days. The estimated changes of semen quality were accessed by including a natural cubic B–spline of hot night indices (HNE or HND), and were adjusted for abstinence period, age, ethnicity, month of semen sample, as well as average PM2.5 concentration, average NO2 concentration, and mean relative humidity during 0–90 days before the date of semen collection. HNE, hot night excess; HND, hot night duration; CIs, confidence intervals. The vertical dotted lines indicate the 99th percentile of regional warm–season hot night excess (HNE) and hot night duration (HND). Shaded areas represent corresponding 95% CIs.
Table S1. Descriptions of the baseline temperature conditions and semen samples from the study regions during the five warmest months during 2014–2020
Region Time period Total Observations Daily mean temperature (Median [IQR]) 95th percentile of Tmin 90th percentile of Tmin 97.5th percentile of Tmin Guangdong 2016–2018 6319 26.22 (24.84, 27.31) 26.04 25.45 26.60 Hubei 2014–2018 504 23.78 (20.93, 26.49) 26.55 25.35 27.30 Henan 2014–2018 1588 24.07 (21.21, 26.77) 25.97 25.17 26.80 Sichuan 2014–2019 181 15.40 (8.97, 21.19) 22.90 21.33 24.07 Shanxi 2014–2019 176 20.85 (17.5, 24.01) 23.43 21.79 24.65 Zhejiang 2014–2020 4733 24.48 (22.02, 26.97) 25.99 25.17 26.68 Note. IQR, interquartile range; Tmin, daily minimum temperature in region’s historical period. Table S2. Characteristics and distribution of semen parameters in unincluded study subjects
Characteristics n (%) Sperm quality (x ± s) Sperm concentration, × 106/mL P–valuea Sperm count,
× 106P–valuea Progressive motility,
%P–valuea Total motility,
%P–valuea All Observations 65,451 (100.0) 72.46 ± 38.24 253.40 ± 158.85 50.71 ± 14.25 55.41 ± 13.24 Age, years < 0.001 0.041 < 0.001 < 0.001 < 30 47,185 (72.1) 71.18 ± 37.11 253.51 ± 156.93 50.97 ± 13.87 55.47 ± 13.04 30–39 16,157 (24.7) 75.01 ± 40.22 252.71 ± 163.34 50.18 ± 15.12 55.42 ± 13.72 ≥ 40 2,109 (3.2) 81.58 ± 44.80 256.32 ± 166.65 48.94 ± 15.50 53.93 ± 13.87 Ethnicity < 0.001 < 0.001 < 0.001 0.011 Han 63,891 (97.6) 72.32 ± 38.21 252.56 ± 158.68 50.66 ± 14.26 55.38 ± 13.25 other 1,560 (2.4) 78.20 ± 39.02 288.04 ± 161.96 52.55 ± 13.53 56.49 ± 12.67 Abstinence period, days < 0.001 < 0.001 < 0.001 < 0.001 2–3 18,167 (27.8) 69.07 ± 35.97 217.30 ± 135.90 52.66 ± 14.50 57.41 ± 13.27 4–5 33,592 (51.3) 74.31 ± 37.97 264.76 ± 156.13 51.23 ± 13.67 55.55 ± 12.87 6–7 13,692 (20.9) 72.45 ± 41.36 273.44 ± 184.05 46.84 ± 14.56 52.38 ± 13.54 Note. Data were given as n (percent) or x ± s as indicated. Column percentages may not add up to 100 due to rounding. x, mean value; s, standardized deviation. aP–value was estimated using Wilcoxon rank sum test for intergroup comparisons of numerical variables. Table S5. The combined estimated changes and corresponding 95% confidence intervals (CIs) of semen quality associated with hot nights at the 99th percentile in sensitivity analyses
Semen quality parameter HNE (°C) HND (%) β (95% CIs) Pnonlinearf β (95% CIs) Pnonlinearf Subgroupa Sperm concentration, × 106/mL –0.0689 (–0.2664, 0.1287) 0.9044 –0.1157 (–0.3279, 0.0965) 0.0028 Sperm count, × 106 –0.0188 (–0.2117, 0.1740) 0.8845 0.0052 (–0.2037, 0.2141) 0.1721 Progressive motility, % –0.3562 (–0.5549, –0.1574) 0.0009 –0.3052 (–0.5244, –0.0859) 0.0002 Total motility, % –0.2502 (–0.5071, 0.0067) 0.0070 –0.2242 (–0.4524, 0.0039) 0.0104 Nodes settingb Sperm concentration, × 106/mL –0.0134 (–0.1967, 0.1700) 0.2236 –0.0564 (–0.2452, 0.1325) 0.0085 Sperm count, × 106 0.0386 (–0.1419, 0.2191) 0.0320 0.0843 (–0.1020, 0.2706) 0.2412 Progressive motility, % –0.2311 (–0.4130, –0.0492) 0.0124 –0.2299 (–0.4211, –0.0386) 0.0157 Total motility, % –0.2495 (–0.4838, –0.0152) 0.0436 –0.1981 (–0.4126, 0.0164) 0.1367 Adjusted for Tmeanc Sperm concentration, × 106/mL 0.0048 (–0.0256, 0.2152) 0.0511 0.1900 (–0.0552, 0.4352) 0.0005 Sperm count, × 106 –0.0321 (–0.02393, 0.1751) 0.0061 0.2149 (–0.0270, 0.4568) 0.0235 Progressive motility, % –0.2744 (–0.4843, –0.0644) 0.0425 –0.2247 (–0.4728, 0.0234) 0.1381 Total motility, % –0.3173 (–0.5902, –0.0046) 0.0986 –0.2259 (–0.5143, 0.0624) 0.3564 Adjusted for occupationd Sperm concentration, × 106/mL 0.0057 (–0.2102, 0.2217) 0.5873 –0.0895(–0.3256, 0.1466) 0.0643 Sperm count, × 106 0.0607 (–0.1563, 0.2777) 0.1524 0.0928 (–0.1456, 0.3312) 0.5139 Progressive motility, % –0.2931 (–0.4912, –0.0949) 0.0113 –0.3494 (–0.5728, –0.1260) 0.0029 Total motility, % –0.3099 (–0.5792, –0.0406) 0.0223 –0.3547 (–0.6070, –0.1024) 0.0204 Adjusted for O3e Sperm concentration, × 106/mL 0.0045 (–0.1699, 0.1790) 0.1908 –0.0477 (–0.2380, 0.1426) 0.0077 Sperm count, × 106 0.0499 (–0.1218, 0.2216) 0.0223 0.0968 (–0.0910, 0.2845) 0.2190 Progressive motility, % –0.2499 (–0.4229, –0.0769) 0.0064 –0.2645 (–0.4577, –0.0713) 0.0104 Total motility, % –0.2614 (–0.4878, –0.0351) 0.0289 –0.2314 (–0.4471, –0.0156) 0.1077 Note. The estimated changes of semen quality were accessed by including a natural cubic B–spline of hot night indices (HNE or HND), and adjusted for abstinence period, age, ethnicity, month of semen sample, as well as average PM2.5 concentration, average NO2 concentration, and mean relative humidity during 0–90 days before the date of semen collection. HNE, hot night excess; HND, hot night duration; CIs, confidence intervals; Tmean, daily average temperature. aThe subgroup only included subjects with normal sperm concentration, sperm count, and motility according to the WHO reference levels for human semen parameters. bAdjusting the cross–basis function with two internal nodes at the 50th and 75th percentiles of HNE and HND distributions referring to relevant studies; cAdditionally adjusted for the average temperature (categorical variable) in the main model. dAdditionally adjusted for occupational factors in the main model. eAdditionally adjusted for the average O3 exposure concentration at 0–90 lag days in the main model. fP nonlinear means non-linear test of exposure-response curves.
doi: 10.3967/bes2024.131
Effects of Hot Night Exposure on Human Semen Quality: A Multicenter Population-Based Study
-
Abstract:
Objective To explore and quantify the association of hot night exposure during the sperm development period (0–90 lag days) with semen quality. Methods A total of 6,640 male sperm donors from 6 human sperm banks in China during 2014–2020 were recruited in this multicenter study. Two indices (i.e., hot night excess [HNE] and hot night duration [HND]) were used to estimate the heat intensity and duration during nighttime. Linear mixed models were used to examine the association between hot nights and semen quality parameters. Results The exposure-response relationship revealed that HNE and HND during 0–90 days before semen collection had a significantly inverse association with sperm motility. Specifically, a 1 °C increase in HNE was associated with decreased sperm progressive motility of 0.0090 (95% confidence interval [CI]: –0.0147, –0.0033) and decreased total motility of 0.0094 (95% CI: –0.0160, –0.0029). HND was significantly associated with reduced sperm progressive motility and total motility of 0.0021 (95% CI: –0.0040, –0.0003) and 0.0023 (95% CI: –0.0043, –0.0002), respectively. Consistent results were observed at different temperature thresholds on hot nights. Conclusion Our findings highlight the need to mitigate nocturnal heat exposure during spermatogenesis to maintain optimal semen quality. -
Key words:
- Climate change /
- Exposure-response relationship /
- Hot night exposure /
- Human semen quality /
- Multicenter study
The authors declare that they have no known competing financial interests or personal relationships that could have appeared to influence the work reported in this paper.
The study was reviewed and approved by the Research Ethics Committee of the Guangdong Institute of Reproductive Sciences, with the approval number: [2021] (13).
&These authors contributed equally to this work.
注释:1) Authors’ Contributions: 2) Competing Interests: 3) Ethics: -
Figure 1. Study flow chart for selection of sperm donors in 6 geographic regions of China during the period of 2014–2020.
Figure 2. Geographical distributions of the study subjects and the population density of the 7th census in 6 regions of China during the study period 2014–2020. Map approval number: GS (2024) 0650.
Figure 3. The spatial distributions of daily average HNE (A) and HND (B) in the study area during the study period, and the distributions of mean HNE (C) and HND (D) of sperm donors with 0–90 lag days. HND, hot night duration; HNE, hot night excess. Map approval number: GS (2024) 0650.
Figure 4. Pooled exposure-response relationships between hot night indices (A) hot night excess [HNE], (B) hot night duration [HND]) and semen quality in 6 regions China. The estimated associations between 0–90 days hot night indices (HNE or HND) and semen quality parameters by including the natural cubic B–spline function with two internal nodes at the 50th and 90th percentiles of HNE and HND distributions in the linear mixed model, and adjusted for age, ethnicity, abstinence period, month of semen sample, as well as average PM2.5 concentration, average NO2 concentration, and mean relative humidity during 0–90 days before the date of semen collection. HNE, hot night excess; HND, hot night duration; CIs, confidence intervals. The vertical dotted lines indicate the 99th percentile of regional warm-season hot night duration (HND) and hot night excess (HNE). Shaded areas represent corresponding 95% CIs.
Figure 5. Relationships between hot night excess (HNE) and semen parameters at different temperature thresholds. The estimated changes of semen quality were accessed by including a natural cubic B-spline of HNE, and were adjusted for abstinence period, age, ethnicity, month of semen sample, as well as average PM2.5 concentration, average NO2 concentration, and mean relative humidity during 0–90 days before the date of semen collection.
Figure 6. Relationships between hot night duration (HND) and semen parameters at different temperature thresholds. The estimated changes of semen quality were accessed by including a natural cubic B-spline of HND, and were adjusted for abstinence period, age, ethnicity, month of semen sample, as well as average PM2.5 concentration, average NO2 concentration, and mean relative humidity during 0–90 days before the date of semen collection.
S1. Relationships between hot night indices (A) HNE, (B) HND and semen parameters in subgroup. The estimated changes of semen quality were accessed by including a natural cubic B–spline of hot night excess (HNE), and were adjusted for abstinence period, age, ethnicity, month of semen sample, as well as average PM2.5 concentration, average NO2 concentration, and mean relative humidity during 0–90 days before the date of semen collection. The subgroup only included subjects with normal sperm concentration, sperm count, and motility according to the WHO reference levels for human semen parameters.
S2. The exposure–response associations between semen quality and hot night indices (A) HNE (B) HND, adjusted for the two internal nodes at the 50th and 75th percentiles. The estimated changes of semen quality were accessed by including a natural cubic B–spline of hot night indices (HNE or HND), and were adjusted for abstinence period, age, ethnicity, month of semen sample, as well as average PM2.5 concentration, average NO2 concentration, and mean relative humidity during 0–90 days before the date of semen collection. HNE, hot night excess; HND, hot night duration; CIs, confidence intervals. The vertical dotted lines indicate the 99th percentile of regional warm–season hot night excess (HNE) and hot night duration (HND). Shaded areas represent corresponding 95% CIs.
S3. The exposure–response relationships between hot night indices (A) HNE, (B) HND and semen quality adjusting for daily average temperature during 0–90 lag days. The estimated changes of semen quality were accessed by including a natural cubic B–spline of hot night indices (HNE or HND), and were adjusted for abstinence period, age, ethnicity, month of semen sample, as well as average PM2.5 concentration, average NO2 concentration, and mean relative humidity during 0–90 days before the date of semen collection. HNE, hot night excess; HND, hot night duration; CIs, confidence intervals. The vertical dotted lines indicate the 99th percentile of regional warm–season hot night excess (HNE) and hot night duration (HND). Shaded areas represent corresponding 95% CIs.
S4. The exposure–response relationships between hot night indices (A) HNE, (B) HND and semen quality adjusting for occupational factors at 0–90 lag days. The estimated changes of semen quality were accessed by including a natural cubic B–spline of hot night indices (HNE or HND), and were adjusted for abstinence period, age, ethnicity, month of semen sample, as well as average PM2.5 concentration, average NO2 concentration, and mean relative humidity during 0–90 days before the date of semen collection. HNE, hot night excess; HND, hot night duration; CIs, confidence intervals. The vertical dotted lines indicate the 99th percentile of regional warm–season hot night excess (HNE) and hot night duration (HND). Shaded areas represent corresponding 95% CIs.
S5. The exposure–response relationships between hot night indices (A) HNE, (B) HND and semen quality with adjustment for average O3 concentration at 0–90 lag days. The estimated changes of semen quality were accessed by including a natural cubic B–spline of hot night indices (HNE or HND), and were adjusted for abstinence period, age, ethnicity, month of semen sample, as well as average PM2.5 concentration, average NO2 concentration, and mean relative humidity during 0–90 days before the date of semen collection. HNE, hot night excess; HND, hot night duration; CIs, confidence intervals. The vertical dotted lines indicate the 99th percentile of regional warm–season hot night excess (HNE) and hot night duration (HND). Shaded areas represent corresponding 95% CIs.
Table 1. Characteristics of the study population and the distribution of semen parameters
Characteristics n (%) Semen quality (mean ± SD) Sperm concentration,
× 106/mLP-valuea Sperm count,
× 106P-valuea Progressive
motility, %P-valuea Total
motility, %P-valuea All Observations 13,501 (100) 72.80 ± 37.91 254.43 ± 158.17 50.57 ± 14.10 55.27 ± 13.12 Age, years < 0.001 0.389 0.003 < 0.001 < 30 9,694 (71.8) 71.16 ± 36.44 253.00 ± 156.64 50.72 ± 13.64 55.17 ± 12.92 30–39 3,313 (24.5) 76.49 ± 40.73 257.28 ± 159.99 50.52 ± 14.97 55.83 ± 13.41 ≥ 40 494 (3.7) 80.42 ± 43.47 263.13 ± 174.64 47.94 ± 16.66 53.33 ± 14.93 Ethnicity < 0.001 < 0.001 < 0.001 0.006 Han 13,116 (97.1) 72.52 ± 37.94 253.36 ± 158.27 50.48 ± 14.14 55.21 ± 13.15 Other 385 (2.9) 80.35 ± 35.32 290.87 ± 150.54 53.63 ± 12.51 57.24 ± 12.04 Abstinence period, days < 0.001 < 0.001 < 0.001 < 0.001 2–3 3,905 (28.9) 70.83 ± 36.61 222.00 ± 144.68 52.90 ± 14.20 57.68 ± 13.16 4–5 7,025 (52.0) 74.18 ± 37.98 262.41 ± 154.03 50.86 ± 13.63 55.20 ± 12.73 6–7 2,571 (19.1) 72.03 ± 39.46 281.85 ± 179.59 46.25 ± 14.27 51.72 ± 13.30 Note. Data were given as n (%) or mean ± SD as indicated. Column percentages may not add up to 100 due to rounding. SD, standardized deviation. aP-value was estimated using Wilcoxon rank sum test for intergroup comparisons of numerical variables.  下载: 导出CSV
Table 2. Distribution of hot night exposure during 0–90 days prior to sperm donation of study participants
Variable Mean ± SD Quartile of hot night exposure Q1 Q2 Q3 Q4 HNE (°C) HNE90a 12.9430 ± 4.7319 0–9.5506 9.5507–12.9231 12.9232–15.6891 15.6892–47.2843 HNE95b 10.5765 ± 3.8651 0–7.8751 7.8752–10.5329 10.5330–12.6927 12.6928–42.0644 HNE97.5c 7.3327 ± 2.9759 0–5.2674 5.2675–7.2767 7.2768–8.9288 8.9289–27.7664 HND (%) HND90a 64.6921 ± 20.9569 0–45.8809 45.8810–68.1413 68.1414–84.2827 84.2828–100.0000 HND95b 48.9744 ± 16.5553 0–34.1657 34.1658–51.1987 51.1988–62.7205 62.7206–89.9088 HND97.5c 37.3311 ± 13.0241 0–26.2487 26.2488–38.9360 38.9361–47.7855 47.7856–83.7624 Note. Data were given as mean ± SD or quartile (Q1, Q2, Q3, Q4) of hot night exposure as indicated. SD, standardized deviation; HNE, hot night excess; HND, hot night duration. aThe HNE90 (or HND90) values were calculated using the 90th percentile of the daily minimum temperature as the temperature thresholds. bThe HNE95 (or HND95) values were calculated using the 95th percentile of the daily minimum temperature as the temperature thresholds. cThe HNE97.5 (or HND97.5) values were calculated using the 97.5th percentile of the daily minimum temperature as the temperature thresholds.
下载: 导出CSV
Table 3. The pooled regression coefficient of semen quality associated with hot nights at different temperature thresholds during 0–90 days before the date of semen cexamination
Variable Sperm concentration,
× 106/mLSemen quality parameter (95% CIs) Sperm count, × 106 Progressive motility, % Total motility, % Nighttime temperature (°C) –0.0161 (–0.0380, 0.0059) 0.0006 (–0.0211, 0.0223) –0.0242 (–0.0465, –0.0018) –0.0267 (–0.0522, –0.0012) HNE (°C) HNE90a –0.0010 (–0.0058, 0.0039) –0.0008 (–0.0056, 0.0039) –0.0069 (–0.0116, –0.0021) –0.0071 (–0.0125, –0.0016) HNE95b –0.0023 (–0.0081, 0.0036) –0.0023 (–0.0080, 0.0035) –0.0090 (–0.0147, –0.0033) –0.0094 (–0.0160, –0.0029) HNE97.5c –0.0041 (–0.0117, 0.0035) –0.0045 (–0.0120, 0.0030) –0.0124 (–0.0198, –0.0050) –0.0126 (–0.0210, –0.0042) HND (%) HND90a 0.0008 (–0.0007, 0.0024) 0.0014 (–0.0002, 0.0029) –0.0016 (–0.0032, –0.0001) –0.0019 (–0.0036, –0.0002) HND95b 0.0015 (–0.0003, 0.0034) 0.0018 (–0.0001, 0.0036) –0.0021 (–0.0040, –0.0003) –0.0023 (–0.0043, –0.0002) HND97.5c 0.0011 (–0.0010, 0.0033) 0.0011 (–0.0010, 0.0032) –0.0027 (–0.0048, –0.0006) –0.0029 (–0.0052, –0.0005) Note. The combined regression coefficients and corresponding 95% confidence intervals (CIs) were estimated using linear mixed models, adjusting for abstinence period, age, ethnicity, month of semen sample, as well as average PM2.5 concentration, average NO2 concentration, and mean relative humidity during 0–90 days before the date of semen collection. HNE, hot night excess; HND, hot night duration; aThe HNE90 (or HND90) values were calculated using the 90th percentile of the daily minimum temperature as the temperature thresholds. bThe HNE95 (or HND95) values were calculated using the 95th percentile of the daily minimum temperature as the temperature thresholds. cThe HNE97.5 (or HND97.5) values were calculated using the 97.5th percentile of the daily minimum temperature as the temperature thresholds.
下载: 导出CSV
Table 4. The estimated changesof semen parameters associated with the hot night duration (HND) and hot night excess (HNE) at the 99th percentile in 6 geographical regions of China at 0–90 lag days
Semen quality parameter HNE (°C) HND (%) β (95% CIs) Pnonlineard β (95% CIs) Pnonlineard Threshold = 90% of the Tmin a Sperm concentration, × 106/mL –0.0185 (–0.1908, 0.1537) 0.4098 –0.1356 (–0.3227, 0.0516) 0.0019 Sperm count, × 106 0.0314 (–0.1382, 0.2009) 0.0938 0.0077 (–0.1770, 0.1924) 0.0579 Progressive motility, % –0.2386 (–0.4085, –0.0687) 0.0179 –0.2189(–0.4101, –0.0276) 0.0626 Total motility, % –0.1868 (–0.4371, 0.0635) 0.0749 –0.2254 (–0.4398, –0.0109) 0.1731 Threshold = 95% of the Tmin b Sperm concentration, × 106/mL –0.0014 (–0.1748, 0.1720) 0.1986 –0.0566 (–0.2439, 0.1307) 0.0077 Sperm count, × 106 0.0447 (–0.1260, 0.2154) 0.0235 0.0857 (–0.0990, 0.2705) 0.2425 Progressive motility, % –0.2357 (–0.4072, –0.0642) 0.0118 –0.2462 (–0.4358, –0.0566) 0.0150 Total motility, % –0.2545 (–0.4804, –0.0286) 0.0422 –0.2147 (–0.4269, –0.0025) 0.1366 Threshold = 97.5% of the Tmin c Sperm concentration, × 106/mL –0.0143 (–0.1850, 0.1564) 0.1906 –0.0091 (–0.1825, 0.1644) 0.2950 Sperm count, × 106 –0.0103 (–0.1883, 0.1478) 0.1129 0.1053 (–0.0656, 0.2762) 0.6496 Progressive motility, % –0.1825 (–0.3517, –0.0132) 0.0065 –0.2644 (–0.4375, –0.0912) 0.0040 Total motility, % –0.1685 (–0.3692, 0.0321) 0.0270 –0.2239 (–0.4188, –0.0289) 0.0584 Note. The estimated changes of semen quality were accessed by including a natural cubic B-spline of hot night indices (HNE or HND), and adjusted for abstinence period, age, ethnicity, month of semen sample, as well as average PM2.5 concentration, average NO2 concentration, and mean relative humidity during 0–90 days before the date of semen collection. HNE, hot night excess; HND, hot night duration; CIs, confidence intervals; Tmin, daily minimum temperature. aThe heat threshold of hot nights was defined as the 90th percentile of daily minimum temperatures. bThe heat threshold of hot nights was defined as the 95th percentile of daily minimum temperatures. cThe heat threshold of hot nights was defined as the 97.5th percentile of daily minimum temperatures. dPnonlinear means nonlinear test of exposure-response curves.
下载: 导出CSV
S4. The regression coefficient (95% CIs) of semen quality associated with hot nights in sensitivity analyses at 0–90 lag days
Semen quality parameter HNE (°C) HND (%) Nighttime temperature (°C) β (95% CIs) β (95% CIs) β (95% CIs) Subgroupa Sperm concentration, × 106/mL –0.0013 (–0.0082, 0.0057) 0.0014 (–0.0007, 0.0036) –0.0131 (–0.0388, 0.0125) Sperm count, × 106 –0.0011 (–0.0079, 0.0056) 0.0015 (–0.0006, 0.0036) 0.0027 (–0.0225, 0.0280) Progressive motility, % –0.0102 (–0.0171, –0.0033) –0.0019 (–0.0041, 0.0003) –0.0348 (–0.0615, –0.0081) Total motility, % –0.0071 (–0.0145, 0.0003) –0.0011 (–0.0034, 0.0011) –0.0231 (–0.0519, 0.0056) Adjusted for Tmeanb Sperm concentration, × 106/mL –0.0051 (–0.0130, 0.0028) 0.0032 (0.0004, 0.0061) –0.0208 (–0.0545, 0.0128) Sperm count, × 106 –0.0071 (–0.0148, 0.0007) 0.0027 (–0.0001, 0.0056) –0.0042 (–0.0375, 0.0290) Progressive motility, % –0.0104 (–0.0182, –0.0027) –0.0030 (–0.0059, –0.0001) –0.0151 (–0.0498, 0.0197) Total motility, % –0.0134 (–0.0236, –0.0031) –0.0034 (–0.0068, 0.0001) –0.0262 (–0.0694, 0.0170) Adjusted for occupationc Sperm concentration, × 106/mL –0.0023 (–0.0100, 0.0053) 0.0013 (–0.0010, 0.0037) –0.0204 (–0.0484, 0.0076) Sperm count, × 106 –0.0026 (–0.0103, 0.0050) 0.0017 (–0.0006, 0.0041) –0.0028 (–0.0312, 0.0255) Progressive motility, % –0.0108 (–0.0178, –0.0038) –0.0022 (–0.0044, 0.0000) –0.0352 (–0.0622, –0.0082) Total motility, % –0.0128 (–0.0212, –0.0045) –0.0026 (–0.0050, –0.0002) –0.0462 (–0.0775, –0.0150) Adjusted for O3d Sperm concentration, × 106/mL –0.0020 (–0.0080, 0.0039) 0.0017 (–0.0002, 0.0036) –0.0156 (–0.0377, 0.0065) Sperm count, × 106 –0.0021 (–0.0080, 0.0037) 0.0019 (0.0000, 0.0037) 0.0012 (–0.0207, 0.0230) Progressive motility, % –0.0097 (–0.0155, –0.0038) –0.0023 (–0.0041, –0.0004) –0.0253 (–0.0479, –0.0027) Total motility, % –0.0101 (–0.0168, –0.0034) –0.0024 (–0.0045, –0.0003) –0.0277 (–0.0535, –0.0020) Note. The combined regression coefficients and corresponding 95% confidence intervals (CIs) were estimated using linear mixed models, adjusting for abstinence period, age, ethnicity, month of semen sample, as well as average PM2.5 concentration, average NO2 concentration, and mean relative humidity during 0–90 days before the date of semen collection. HNE, hot night excess; HND, hot night duration; CIs, confidence intervals; Tmean, daily average temperature. aThe subgroup only included subjects with normal sperm concentration, sperm count, and motility according to the WHO reference levels for human semen parameters. bAdditionally adjusted for the average temperature (categorical variable) in the main model. cAdditionally adjusted for occupational factors in the main model. dAdditionally adjusted for the average O3 exposure concentration at 0–90 lag days in the main model.
下载: 导出CSV
S3. Characteristics of the study subjects and the distribution of semen parameters in subgroupa
Characteristics n (%) Sperm quality (x ± s) Sperm concentration, × 106/mL
P–valuebSperm count,
× 106
P–valuebProgressive motility,
%
P–valuebTotal motility,
%
P–valuebAll Observations 11,205 (100) 77.37 ± 35.74 271.92 ± 148.60 55.07 ± 9.53 58.73 ± 9.57 Age, years < 0.001 0.008 < 0.001 < 0.001 < 30 8,151 (72.7) 75.42 ± 34.24 269.83 ± 147.11 54.76 ± 9.44 58.41 ± 9.52 30–39 2,686 (24.0) 81.74 ± 38.82 275.36 ± 150.19 55.92 ± 9.67 59.70 ± 9.63 ≥ 40 368 (3.3) 88.64 ±39.81 293.06 ± 167.13 55.64 ± 10.08 59.15 ± 9.94 Ethnicity < 0.001 < 0.001 0.035 0.145 Han 10,856 (96.9) 77.16 ± 35.78 271.07 ± 148.61 55.04 ± 9.51 58.71 ± 9.56 other 349 (3.1) 84.02 ± 33.76 298.41 ± 146.29 56.09 ± 9.94 59.38 ± 10.00 Abstinence period, days 0.052 < 0.001 < 0.001 < 0.001 2–3 3,310 (29.5) 75.70 ± 33.51 239.99 ± 131.80 56.94 ± 9.88 60.68 ± 9.88 4–5 5,941 (53.0) 78.29 ± 36.24 279.00 ± 146.52 54.92 ± 9.35 58.46 ± 9.36 6–7 1,954 (17.5) 77.42 ± 37.71 304.48 ± 170.34 52.36 ± 8.73 56.20 ± 8.95 Note. Data were given as n (percent) or x ± s as indicated. Column percentages may not add up to 100 due to rounding. x, mean value; s, standardized deviation. aThe subgroup only included subjects with normal sperm concentration, sperm count, and motility according to the WHO reference levels for human semen parameters. bP–value was estimated using Wilcoxon rank sum test for intergroup comparisons of numerical variables.
下载: 导出CSV
S6. Repeated measurement data with regression coefficients (95% CIs) of semen quality associated with hot nights in six regions of China during 2014–2020
Semen quality parameter HNE HND Nighttime temperature β (95% CIs) P–value β (95% CIs) P–value β (95% CIs) P–value Sperm concentration, × 106/mL –0.0024
(–0.0122, 0.0074)0.6343 0.0012
(–0.0015, 0.0040)0.3694 –0.0388
(–0.0730, –0.0047)0.0259 Sperm count, × 106 0.0037
(–0.0062, 0.0135)0.4649 0.0026
(0.0000, 0.0053)0.0552 –0.0086
(–0.0432, 0.0260)0.6275 Progressive motility, % –0.0198
(–0.0293, –0.0103)< 0.0001 –0.0046
(–0.0072, –0.0019)0.0007 –0.0685
(–0.1028, –0.0342)0.0001 Total motility, % –0.0195
(–0.0289, –0.0100)0.0001 –0.0048
(–0.0074, –0.0022)0.0003 –0.0679
(–0.1021, –0.0337)0.0001 Note. The combined regression coefficients and corresponding 95% confidence intervals (CIs) were estimated using linear mixed models, adjusting for abstinence period, age, ethnicity, month of semen sample, as well as average PM2.5 concentration, average NO2 concentration, and mean relative humidity during 0–90 days before the date of semen collection. HNE, hot night excess; HND, hot night duration; CIs, confidence intervals.
下载: 导出CSV
S1. Descriptions of the baseline temperature conditions and semen samples from the study regions during the five warmest months during 2014–2020
Region Time period Total Observations Daily mean temperature (Median [IQR]) 95th percentile of Tmin 90th percentile of Tmin 97.5th percentile of Tmin Guangdong 2016–2018 6319 26.22 (24.84, 27.31) 26.04 25.45 26.60 Hubei 2014–2018 504 23.78 (20.93, 26.49) 26.55 25.35 27.30 Henan 2014–2018 1588 24.07 (21.21, 26.77) 25.97 25.17 26.80 Sichuan 2014–2019 181 15.40 (8.97, 21.19) 22.90 21.33 24.07 Shanxi 2014–2019 176 20.85 (17.5, 24.01) 23.43 21.79 24.65 Zhejiang 2014–2020 4733 24.48 (22.02, 26.97) 25.99 25.17 26.68 Note. IQR, interquartile range; Tmin, daily minimum temperature in region’s historical period.
下载: 导出CSV
S2. Characteristics and distribution of semen parameters in unincluded study subjects
Characteristics n (%) Sperm quality (x ± s) Sperm concentration, × 106/mL P–valuea Sperm count,
× 106P–valuea Progressive motility,
%P–valuea Total motility,
%P–valuea All Observations 65,451 (100.0) 72.46 ± 38.24 253.40 ± 158.85 50.71 ± 14.25 55.41 ± 13.24 Age, years < 0.001 0.041 < 0.001 < 0.001 < 30 47,185 (72.1) 71.18 ± 37.11 253.51 ± 156.93 50.97 ± 13.87 55.47 ± 13.04 30–39 16,157 (24.7) 75.01 ± 40.22 252.71 ± 163.34 50.18 ± 15.12 55.42 ± 13.72 ≥ 40 2,109 (3.2) 81.58 ± 44.80 256.32 ± 166.65 48.94 ± 15.50 53.93 ± 13.87 Ethnicity < 0.001 < 0.001 < 0.001 0.011 Han 63,891 (97.6) 72.32 ± 38.21 252.56 ± 158.68 50.66 ± 14.26 55.38 ± 13.25 other 1,560 (2.4) 78.20 ± 39.02 288.04 ± 161.96 52.55 ± 13.53 56.49 ± 12.67 Abstinence period, days < 0.001 < 0.001 < 0.001 < 0.001 2–3 18,167 (27.8) 69.07 ± 35.97 217.30 ± 135.90 52.66 ± 14.50 57.41 ± 13.27 4–5 33,592 (51.3) 74.31 ± 37.97 264.76 ± 156.13 51.23 ± 13.67 55.55 ± 12.87 6–7 13,692 (20.9) 72.45 ± 41.36 273.44 ± 184.05 46.84 ± 14.56 52.38 ± 13.54 Note. Data were given as n (percent) or x ± s as indicated. Column percentages may not add up to 100 due to rounding. x, mean value; s, standardized deviation. aP–value was estimated using Wilcoxon rank sum test for intergroup comparisons of numerical variables.
下载: 导出CSV
S5. The combined estimated changes and corresponding 95% confidence intervals (CIs) of semen quality associated with hot nights at the 99th percentile in sensitivity analyses
Semen quality parameter HNE (°C) HND (%) β (95% CIs) Pnonlinearf β (95% CIs) Pnonlinearf Subgroupa Sperm concentration, × 106/mL –0.0689 (–0.2664, 0.1287) 0.9044 –0.1157 (–0.3279, 0.0965) 0.0028 Sperm count, × 106 –0.0188 (–0.2117, 0.1740) 0.8845 0.0052 (–0.2037, 0.2141) 0.1721 Progressive motility, % –0.3562 (–0.5549, –0.1574) 0.0009 –0.3052 (–0.5244, –0.0859) 0.0002 Total motility, % –0.2502 (–0.5071, 0.0067) 0.0070 –0.2242 (–0.4524, 0.0039) 0.0104 Nodes settingb Sperm concentration, × 106/mL –0.0134 (–0.1967, 0.1700) 0.2236 –0.0564 (–0.2452, 0.1325) 0.0085 Sperm count, × 106 0.0386 (–0.1419, 0.2191) 0.0320 0.0843 (–0.1020, 0.2706) 0.2412 Progressive motility, % –0.2311 (–0.4130, –0.0492) 0.0124 –0.2299 (–0.4211, –0.0386) 0.0157 Total motility, % –0.2495 (–0.4838, –0.0152) 0.0436 –0.1981 (–0.4126, 0.0164) 0.1367 Adjusted for Tmeanc Sperm concentration, × 106/mL 0.0048 (–0.0256, 0.2152) 0.0511 0.1900 (–0.0552, 0.4352) 0.0005 Sperm count, × 106 –0.0321 (–0.02393, 0.1751) 0.0061 0.2149 (–0.0270, 0.4568) 0.0235 Progressive motility, % –0.2744 (–0.4843, –0.0644) 0.0425 –0.2247 (–0.4728, 0.0234) 0.1381 Total motility, % –0.3173 (–0.5902, –0.0046) 0.0986 –0.2259 (–0.5143, 0.0624) 0.3564 Adjusted for occupationd Sperm concentration, × 106/mL 0.0057 (–0.2102, 0.2217) 0.5873 –0.0895(–0.3256, 0.1466) 0.0643 Sperm count, × 106 0.0607 (–0.1563, 0.2777) 0.1524 0.0928 (–0.1456, 0.3312) 0.5139 Progressive motility, % –0.2931 (–0.4912, –0.0949) 0.0113 –0.3494 (–0.5728, –0.1260) 0.0029 Total motility, % –0.3099 (–0.5792, –0.0406) 0.0223 –0.3547 (–0.6070, –0.1024) 0.0204 Adjusted for O3e Sperm concentration, × 106/mL 0.0045 (–0.1699, 0.1790) 0.1908 –0.0477 (–0.2380, 0.1426) 0.0077 Sperm count, × 106 0.0499 (–0.1218, 0.2216) 0.0223 0.0968 (–0.0910, 0.2845) 0.2190 Progressive motility, % –0.2499 (–0.4229, –0.0769) 0.0064 –0.2645 (–0.4577, –0.0713) 0.0104 Total motility, % –0.2614 (–0.4878, –0.0351) 0.0289 –0.2314 (–0.4471, –0.0156) 0.1077 Note. The estimated changes of semen quality were accessed by including a natural cubic B–spline of hot night indices (HNE or HND), and adjusted for abstinence period, age, ethnicity, month of semen sample, as well as average PM2.5 concentration, average NO2 concentration, and mean relative humidity during 0–90 days before the date of semen collection. HNE, hot night excess; HND, hot night duration; CIs, confidence intervals; Tmean, daily average temperature. aThe subgroup only included subjects with normal sperm concentration, sperm count, and motility according to the WHO reference levels for human semen parameters. bAdjusting the cross–basis function with two internal nodes at the 50th and 75th percentiles of HNE and HND distributions referring to relevant studies; cAdditionally adjusted for the average temperature (categorical variable) in the main model. dAdditionally adjusted for occupational factors in the main model. eAdditionally adjusted for the average O3 exposure concentration at 0–90 lag days in the main model. fP nonlinear means non-linear test of exposure-response curves.
下载: 导出CSV
-
[1] WHO. Infertility prevalence estimates, 1990-2021. World Health Organization. 2023. [2] Agarwal A, Mulgund A, Hamada A, et al. A unique view on male infertility around the globe. Reprod Biol Endocrinol, 2015; 13, 37. doi: 10.1186/s12958-015-0032-1 [3] Vander Borght M, Wyns C. Fertility and infertility: definition and epidemiology. Clin Biochem, 2018; 62, 2−10. doi: 10.1016/j.clinbiochem.2018.03.012 [4] Mann U, Shiff B, Patel P. Reasons for worldwide decline in male fertility. Curr Opin Urol, 2020; 30, 296−301. doi: 10.1097/MOU.0000000000000745 [5] Mishra P, Negi MPS, Srivastava M, et al. Decline in seminal quality in Indian men over the last 37 years. Reprod Biol Endocrinol, 2018; 16, 103. doi: 10.1186/s12958-018-0425-z [6] Liu JJ, Dai YP, Li YS, et al. A longitudinal study of semen quality among Chinese sperm donor candidates during the past 11 years. Sci Rep, 2020; 10, 10771. doi: 10.1038/s41598-020-67707-x [7] Tiegs AW, Landis J, Garrido N, et al. Total motile sperm count trend over time: evaluation of semen analyses from 119, 972 men from subfertile couples. Urology, 2019; 132, 109−16. doi: 10.1016/j.urology.2019.06.038 [8] Huang C, Li BS, Xu KR, et al. Decline in semen quality among 30, 636 young Chinese men from 2001 to 2015. Fertil Steril, 2017; 107, 83-8. e2. [9] Sansone A, Di Dato C, de Angelis C, et al. Smoke, alcohol and drug addiction and male fertility. Reprod Biol Endocrinol, 2018; 16, 3. doi: 10.1186/s12958-018-0320-7 [10] Sharma R, Harlev A, Agarwal A, et al. Cigarette smoking and semen quality: a new meta-analysis examining the effect of the 2010 World Health Organization laboratory methods for the examination of human semen. Eur Urol, 2016; 70, 635−45. doi: 10.1016/j.eururo.2016.04.010 [11] Huang GH, Zhang Q, Wu HS, et al. Sperm quality and ambient air pollution exposure: a retrospective, cohort study in a Southern province of China. Environ Res, 2020; 188, 109756. doi: 10.1016/j.envres.2020.109756 [12] Santi D, Magnani E, Michelangeli M, et al. Seasonal variation of semen parameters correlates with environmental temperature and air pollution: a big data analysis over 6 years. Environ Pollut, 2018; 235, 806−13. doi: 10.1016/j.envpol.2018.01.021 [13] Verón GL, Tissera AD, Bello R, et al. Association between meteorological variables and semen quality: a retrospective study. Int J Biometeorol, 2021; 65, 1399−414. doi: 10.1007/s00484-021-02112-1 [14] Xiao LN, Wang QL, Ni HB, et al. Effect of ambient temperature variability on sperm quality: a retrospective population-based cohort study. Sci Total Environ, 2022; 851, 158245. doi: 10.1016/j.scitotenv.2022.158245 [15] Watts N, Amann M, Arnell N, et al. The 2020 report of The Lancet Countdown on health and climate change: responding to converging crises. Lancet, 2021; 397, 129−70. doi: 10.1016/S0140-6736(20)32290-X [16] Donat MG, Alexander LV, Yang H, et al. Updated analyses of temperature and precipitation extreme indices since the beginning of the twentieth century: the HadEX2 dataset. J Geophys Res Atmos, 2013; 118, 2098−118. doi: 10.1002/jgrd.50150 [17] Zhuang YH, Zhang JY. Diurnal asymmetry in future temperature changes over the main Belt and Road regions. Ecosyst Health Sust, 2020; 6, 1749530. doi: 10.1080/20964129.2020.1749530 [18] Zhang HH, Zhang XA, Feng DM, et al. Interaction effects of night-time temperature and PM2.5 on preterm birth in Huai River Basin, China. Environ Int, 2023; 171, 107729. doi: 10.1016/j.envint.2023.107729 [19] Ivell R. Lifestyle impact and the biology of the human scrotum. Reprod Biol Endocrinol, 2007; 5, 15. doi: 10.1186/1477-7827-5-15 [20] Wang XC, Tian XJ, Ye B, et al. The association between ambient temperature and sperm quality in Wuhan, China. Environ Health, 2020; 19, 44. doi: 10.1186/s12940-020-00595-w [21] Zhang XZ, Fan ZY, Wang QL, et al. Association between ambient temperature and semen quality among sperm donation volunteers in South China. Environ Int, 2023; 173, 107809. doi: 10.1016/j.envint.2023.107809 [22] Zhou Y, Meng TQ, Wu L, et al. Association between ambient temperature and semen quality: a longitudinal study of 10 802 men in China. Environ Int, 2020; 135, 105364. doi: 10.1016/j.envint.2019.105364 [23] WHO. WHO laboratory manual for the examination and processing of human semen. 5th ed. World Health Organization. 2010. [24] Johnson L, Welsh Jr TH, Curley Jr KO, et al. Anatomy and physiology of the male reproductive system and potential targets of toxicants. Compr Toxicol, 2010; 11, 5−59. [25] He C, Kim H, Hashizume M, et al. The effects of night-time warming on mortality burden under future climate change scenarios: a modelling study. Lancet Planet Health, 2022; 6, e648−57. doi: 10.1016/S2542-5196(22)00139-5 [26] Wu HS, Yu XL, Wang QL, et al. Beyond the mean: quantile regression to differentiate the distributional effects of ambient PM2.5 constituents on sperm quality among men. Chemosphere, 2021; 285, 131496. doi: 10.1016/j.chemosphere.2021.131496 [27] Yu XL, Wang QL, Wei J, et al. Impacts of traffic-related particulate matter pollution on semen quality: a retrospective cohort study relying on the random forest model in a megacity of South China. Sci Total Environ, 2022; 851, 158387. doi: 10.1016/j.scitotenv.2022.158387 [28] Muñoz-Sabater J, Dutra E, Agustí-Panareda A, et al. ERA5-Land: a state-of-the-art global reanalysis dataset for land applications. Earth Syst Sci Data, 2021; 13, 4349−83. doi: 10.5194/essd-13-4349-2021 [29] Mistry MN, Schneider R, Masselot P, et al. Comparison of weather station and climate reanalysis data for modelling temperature-related mortality. Sci Rep, 2022; 12, 5178. doi: 10.1038/s41598-022-09049-4 [30] Urban A, Di Napoli C, Cloke HL, et al. Evaluation of the ERA5 reanalysis-based Universal Thermal Climate Index on mortality data in Europe. Environ Res, 2021; 198, 111227. doi: 10.1016/j.envres.2021.111227 [31] Alduchov OA, Eskridge RE. Improved Magnus form approximation of saturation vapor pressure. J Appl Meteor, 1996; 35, 601−9. doi: 10.1175/1520-0450(1996)035<0601:IMFAOS>2.0.CO;2 [32] Wei J, Li ZQ, Li K, et al. Full-coverage mapping and spatiotemporal variations of ground-level ozone (O3) pollution from 2013 to 2020 across China. Remote Sens Environ, 2022; 270, 112775. doi: 10.1016/j.rse.2021.112775 [33] Wei J, Li ZQ, Lyapustin A, et al. Reconstructing 1-km-resolution high-quality PM2.5 data records from 2000 to 2018 in China: spatiotemporal variations and policy implications. Remote Sens Environ, 2021; 252, 112136. doi: 10.1016/j.rse.2020.112136 [34] Wei J, Liu S, Li ZQ, et al. Ground-level NO2 surveillance from space across china for high resolution using interpretable spatiotemporally weighted artificial intelligence. Environ Sci Technol, 2022; 56, 9988−98. doi: 10.1021/acs.est.2c03834 [35] Royé D, Sera F, Tobías A, et al. Effects of hot nights on mortality in Southern Europe. Epidemiology, 2021; 32, 487−98. doi: 10.1097/EDE.0000000000001359 [36] Royé D. The effects of hot nights on mortality in Barcelona, Spain. Int J Biometeorol, 2017; 61, 2127−40. doi: 10.1007/s00484-017-1416-z [37] Hanna EG, Tait PW. Limitations to thermoregulation and acclimatization challenge human adaptation to global warming. Int J Environ Res Public Health, 2015; 12, 8034−74. doi: 10.3390/ijerph120708034 [38] Gumedze FN, Dunne TT. Parameter estimation and inference in the linear mixed model. Linear Algebra Appl, 2011; 435, 1920−44. doi: 10.1016/j.laa.2011.04.015 [39] Guerrero VM. Time-series analysis supported by power transformations. J Forecast, 1993; 12, 37−48. doi: 10.1002/for.3980120104 [40] Cai J, Zhao Y, Kan JL, et al. Prenatal exposure to specific PM2.5 chemical constituents and preterm birth in China: a nationwide cohort study. Environ Sci Technol, 2020; 54, 14494−501. doi: 10.1021/acs.est.0c02373 [41] Liu LJ, Zhang YY, Yang ZM, et al. Long-term exposure to fine particulate constituents and cardiovascular diseases in Chinese adults. J Hazard Mater, 2021; 416, 126051. doi: 10.1016/j.jhazmat.2021.126051 [42] Gasparrini A, Guo YM, Hashizume M, et al. Mortality risk attributable to high and low ambient temperature: a multicountry observational study. Lancet, 2015; 386, 369−75. doi: 10.1016/S0140-6736(14)62114-0 [43] Cai XY, Ni HB, Wang QL, et al. Sperm quality decline associated with gaseous pollutant exposure: evidence from a large cohort multicenter study. J Hazard Mater, 2023; 460, 132330. doi: 10.1016/j.jhazmat.2023.132330 [44] Joshi SS, Lesser TJ, Olsen JWW, et al. The importance of temperature and thermoregulation for optimal human sleep. Energy Build, 2016; 131, 153−7. doi: 10.1016/j.enbuild.2016.09.020 [45] Murage P, Hajat S, Kovats RS. Effect of night-time temperatures on cause and age-specific mortality in London. Environ Epidemiol, 2017; 1, e005. doi: 10.1097/EE9.0000000000000005 [46] Hough I, Rolland M, Guilbert A, et al. Early delivery following chronic and acute ambient temperature exposure: a comprehensive survival approach. Int J Epidemiol, 2023; 52, 761−73. doi: 10.1093/ije/dyac190 [47] Durairajanayagam D, Agarwal A, Ong C. Causes, effects and molecular mechanisms of testicular heat stress. Reprod BioMed Online, 2015; 30, 14−27. doi: 10.1016/j.rbmo.2014.09.018 [48] Abdelhamid MHM, Walschaerts M, Ahmad G, et al. Mild experimental increase in testis and epididymis temperature in men: effects on sperm morphology according to spermatogenesis stages. Transl Androl Urol, 2019; 8, 651−65. doi: 10.21037/tau.2019.11.18 [49] Abdelhamid MHM, Esquerre-Lamare C, Walschaerts M, et al. Experimental mild increase in testicular temperature has drastic, but reversible, effect on sperm aneuploidy in men: a pilot study. Reprod Biol, 2019; 19, 189−94. doi: 10.1016/j.repbio.2019.06.001 [50] Ahmad G, Moinard N, Esquerré-Lamare C, et al. Mild induced testicular and epididymal hyperthermia alters sperm chromatin integrity in men. Fertil Steril, 2012; 97, 546−53. doi: 10.1016/j.fertnstert.2011.12.025 [51] Gao YY, Wang C, Wang KX, et al. The effects and molecular mechanism of heat stress on spermatogenesis and the mitigation measures. Syst Biol Reprod Med, 2022; 68, 331−47. doi: 10.1080/19396368.2022.2074325 [52] Ikeda M, Kodama H, Fukuda J, et al. Role of radical oxygen species in rat testicular germ cell apoptosis induced by heat stress. Biol Reprod, 1999; 61, 393−9. doi: 10.1095/biolreprod61.2.393 [53] Lue YH, Sinha Hikim AP, Swerdloff RS, et al. Single exposure to heat induces stage-specific germ cell apoptosis in rats: role of intratesticular testosterone on stage specificity. Endocrinology, 1999; 140, 1709−17. doi: 10.1210/endo.140.4.6629 [54] Morrell JM. Heat stress and bull fertility. Theriogenology, 2020; 153, 62−7. doi: 10.1016/j.theriogenology.2020.05.014 [55] Shahat AM, Rizzoto G, Kastelic JP. Amelioration of heat stress-induced damage to testes and sperm quality. Theriogenology, 2020; 158, 84−96. doi: 10.1016/j.theriogenology.2020.08.034 [56] Altena E, Baglioni C, Sanz-Arigita E, et al. How to deal with sleep problems during heatwaves: practical recommendations from the European Insomnia Network. J Sleep Res, 2022; 32, e13704. [57] Chen HG, Sun B, Chen YJ, et al. Sleep duration and quality in relation to semen quality in healthy men screened as potential sperm donors. Environ Int, 2020; 135, 105368. doi: 10.1016/j.envint.2019.105368 [58] Du CQ, Yang YY, Chen J, et al. Association between sleep quality and semen parameters and reproductive hormones: a cross-sectional study in Zhejiang, China. Nat Sci Sleep, 2020; 12, 11−8. doi: 10.2147/NSS.S235136 [59] GBD 2019 Demographics Collaborators. Global age-sex-specific fertility, mortality, healthy life expectancy (HALE), and population estimates in 204 countries and territories, 1950-2019: a comprehensive demographic analysis for the Global Burden of Disease Study 2019. Lancet, 2020; 396, 1160−203. doi: 10.1016/S0140-6736(20)30977-6 [60] Chu KY, Patel P, Ramasamy R. Consideration of gender differences in infertility evaluation. Curr Opin Urol, 2019; 29, 267−71. doi: 10.1097/MOU.0000000000000590 [61] Tamrakar SR, Bastakoti R. Determinants of infertility in couples. J Nepal Health Res Counc, 2019; 17, 85−9. doi: 10.33314/jnhrc.v17i01.1827 [62] Deka A, Cavusoglu B, Dube S. Does renewable energy use enhance exchange rate appreciation and stable rate of inflation? Environ Sci Pollut Res Int, 2022; 29, 14185-94. [63] Zhao J, Xiang KL, Wu ZT, et al. Varying responses of vegetation greenness to the diurnal warming across the global. Plants (Basel), 2022; 11, 2648. -
 24190+Supplementary Materials.pdf

-

 点击查看大图
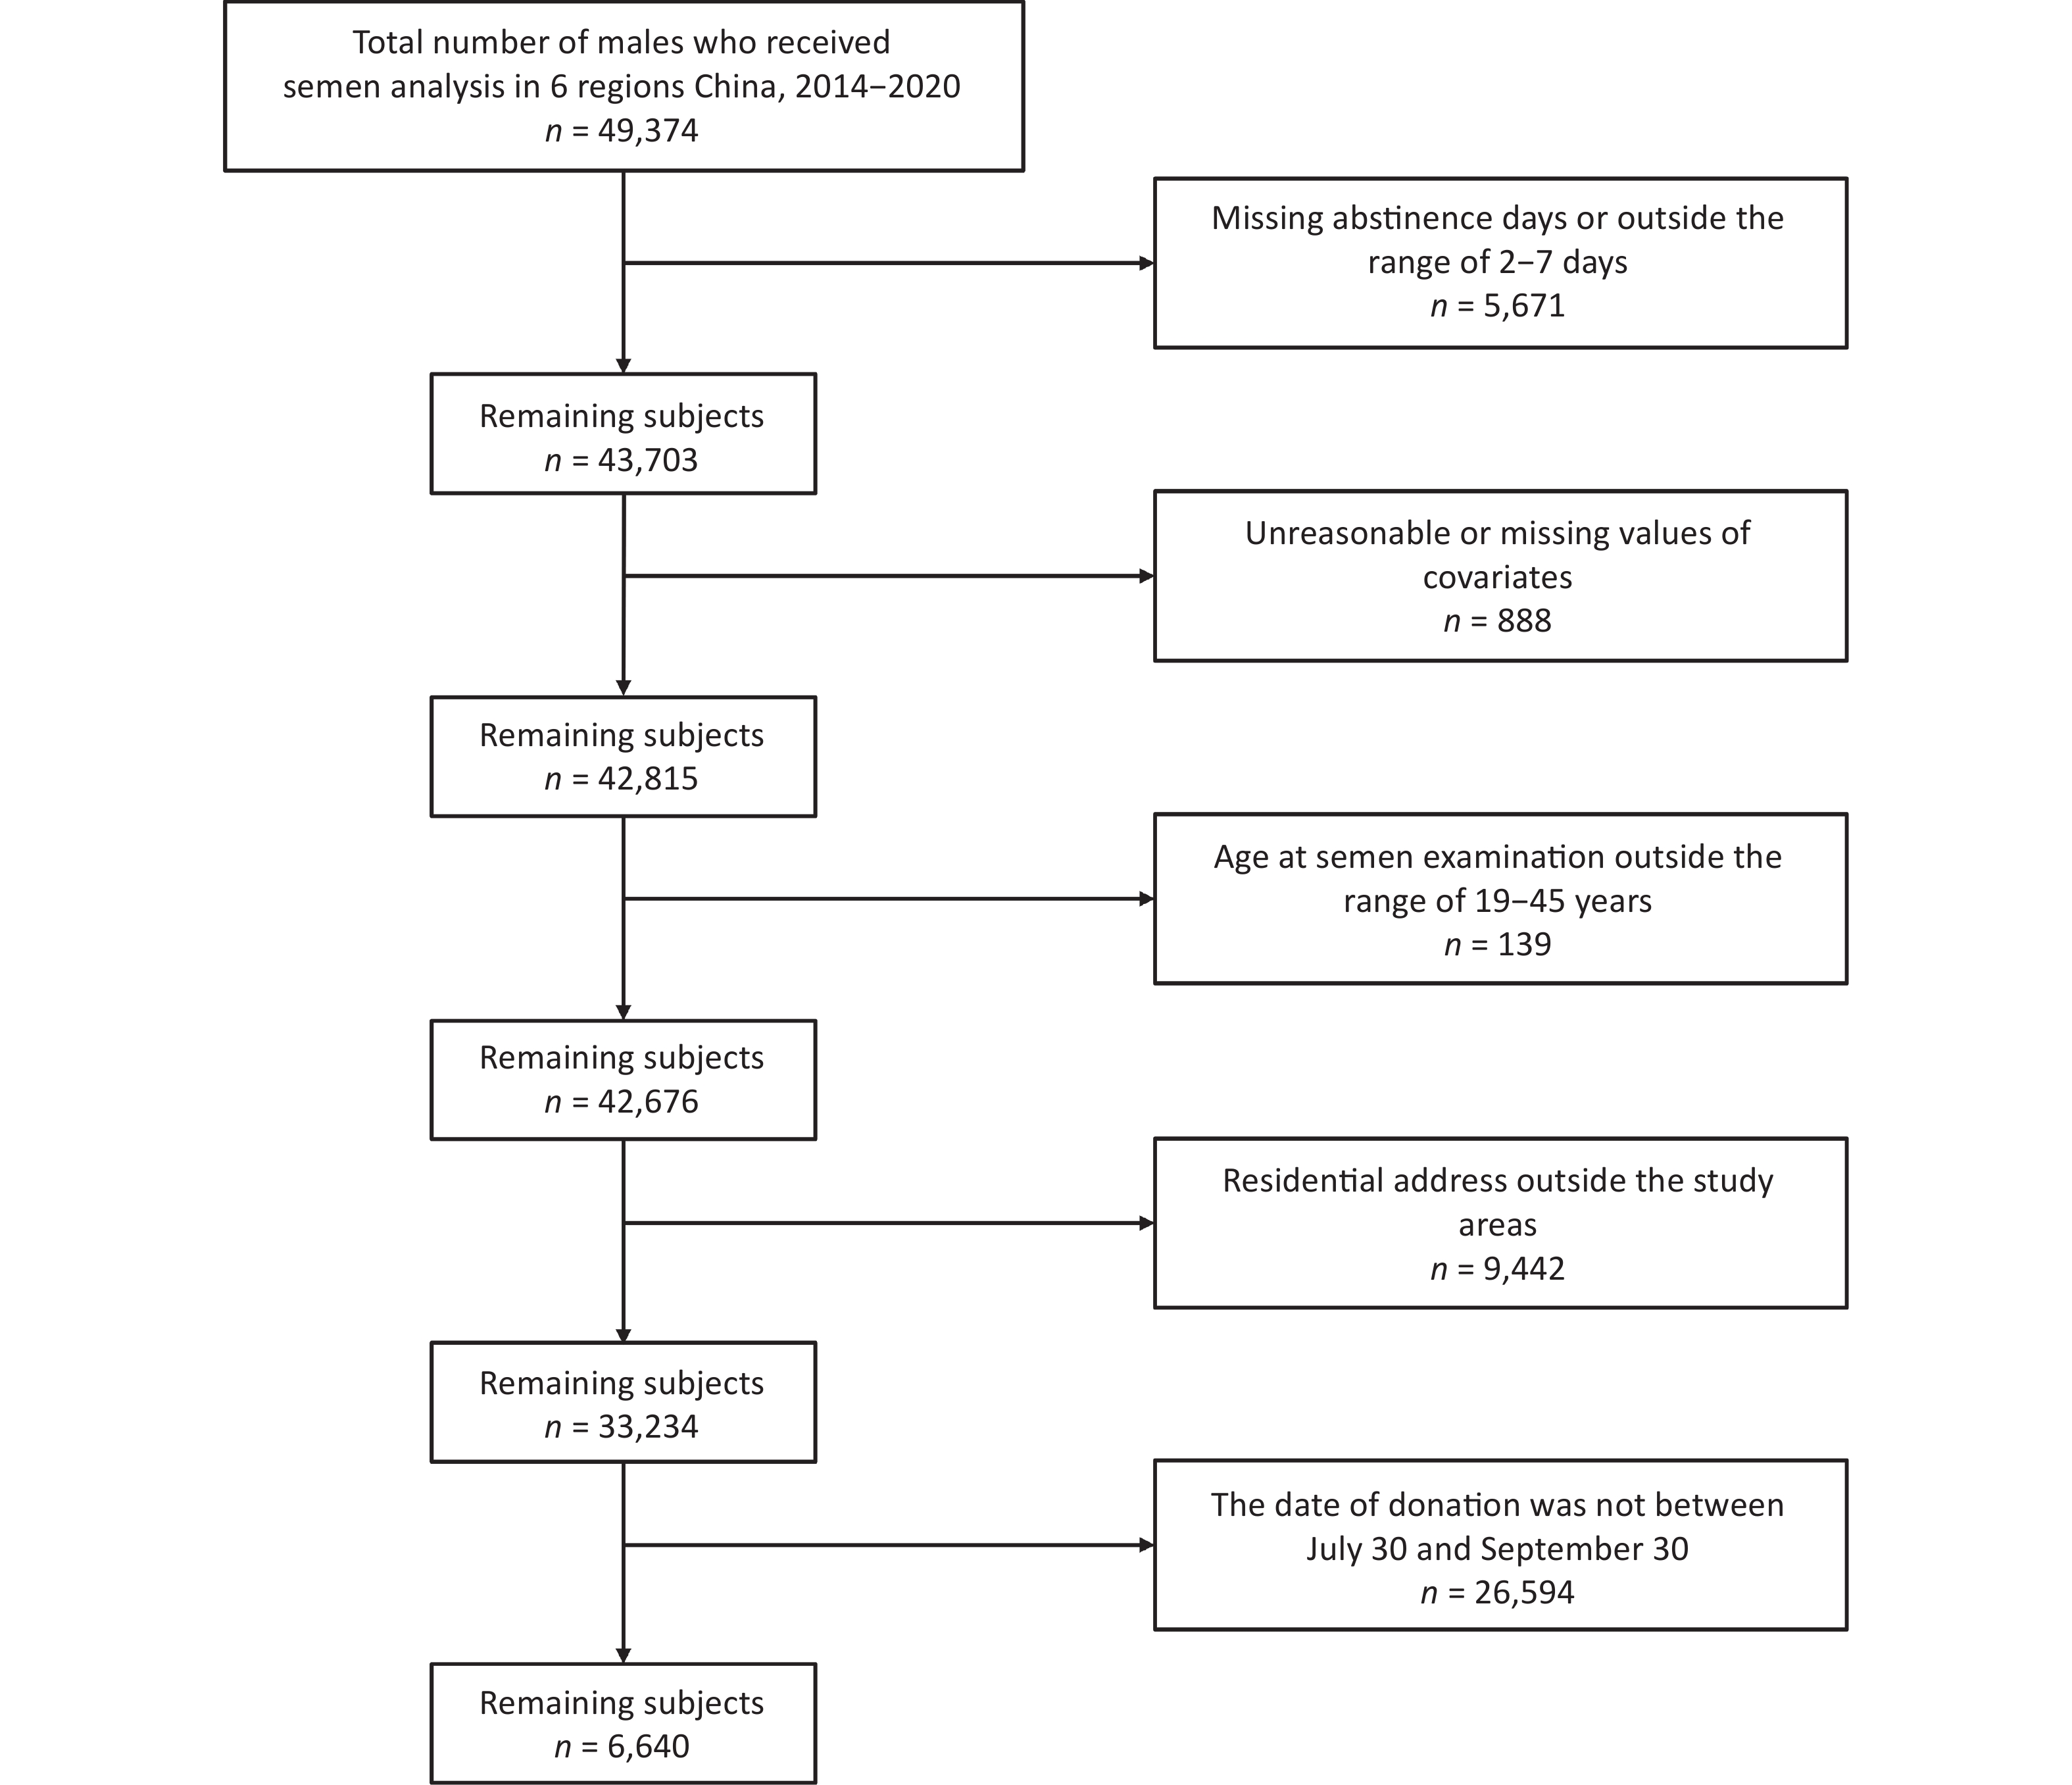
计量
- 文章访问数: 312
- HTML全文浏览量: 135
- PDF下载量: 20
- 被引次数: 0

 Quick Links