

 下载:
下载:


-
Stress urinary incontinence (SUI) is a symptom of uncontrolled urine outflow that affects millions of women worldwide[1]. SUI is a significant healthcare issue that affects the quality of life of women across numerous domains, including social activities, physical health, mental well-being, employment, and sexual life. This is commonly referred to as “social cancer”. Conservative treatment can improve symptoms in patients with mild SUI; however, patients must adhere to the treatment plan over an extended period. As a standard procedure for the treatment of SUI, the recurrence rate of urethral suspension ranges from 5% to 20%[1]. To a certain extent, the cost of surgery has increased the economic burden on patients and society. Although SUI has consistently affected the quality of life of women and increased their economic burden, adult women are largely unaware of the prevention of SUI. Therefore, a high-quality SUI prediction model may be helpful. As indicated in the literature, vaginal delivery is the primary cause of female SUI[2]. However, women who did not give birth also experienced SUI. Other factors, including body mass index (BMI), chronic cough, and family history may also be independent risk factors for SUI[3]. Additionally, the risk factors for SUI may vary based on regional differences. For instance, in developed countries, age and obesity may be the primary risk factors for SUI, whereas in less-developed countries, heavy physical labor and vaginal delivery may be more significant contributors. Molecular studies on the pathogenesis of SUI have demonstrated that genetic susceptibility and family history may be independent risk factors for SUI[4]. Consequently, the research population for this topic encompassed postpartum patients, those who had undergone surgery, and older women. The primary population was adult women aged > 20 years residing in Henan Province. A total of 22 factors were considered, including family history, education level, and economic status, to establish a prediction model for adult women in Henan Province and identify the high-risk population for SUI. This will help local high-risk women become aware of prevention and early treatment, thereby improving their quality of life.
Data were collected retrospectively. Cases in this study were based on strict inclusion criteria and exclusion criteria. Inclusion criteria: (1) women 20 years or older; (2) non-pregnancy or lactation; (3) complete clinical data. Exclusion criteria: (1) suffering from or having combined other types of UI; (2) urinary tract infection or other urinary system diseases; (3) combined malignant tumor; (4) incomplete clinical data. The clinical data of women (n = 1,031) in the Third Affiliated Hospital of Zhengzhou University between May 2020 and April 2022 were selected as the training dataset. According to the International Continence Society (ICS), SUI refers to the symptoms of involuntary urine leakage when the abdominal pressure is increased by coughing, sneezing, or lifting heavy objects. The independent risk factors of SUI in women were screened through univariate and multivariate logistic analysis, and the prediction model was constructed and verified internally. The clinical data of women (n = 300) between May 2022 and July 2022 were collected as the validation dataset for external verification of the prediction model. All non-SUI patients who met the inclusion criteria were selected from the same hospital within the same period and within the same age range. The Ethics Committee of the Third Affiliated Hospital of Zhengzhou University approved this study (approval No. 108; December 25, 2019). SPSS 26.0, and R language (version 4.0.5) were employed for statistical analyses. The measurement data subject to normal distribution were represented as mean (standard deviation), and the comparison between groups was performed using a t-test. Categorical data were tested by χ2 or Fisher’s exact test. Univariate analysis was performed to evaluate the significance of each variable. All variables related to the SUI level (P < 0.05) were candidate variables for progressive multivariate analysis. Moreover, independent risk factors for SUI were screened. A logistic regression model was then established. The rms package in R was used to convert the established prediction model into an intuitive nomogram. The discrimination and calibration of the model were evaluated by the area under the receiver operating characteristic (ROC) curve (AUC) and calibration curve, respectively. The bootstrap sampling method was used to conduct internal verification of the prediction model for 1000 repeated sampling times. P-value < 0.05 was considered statistically significant.
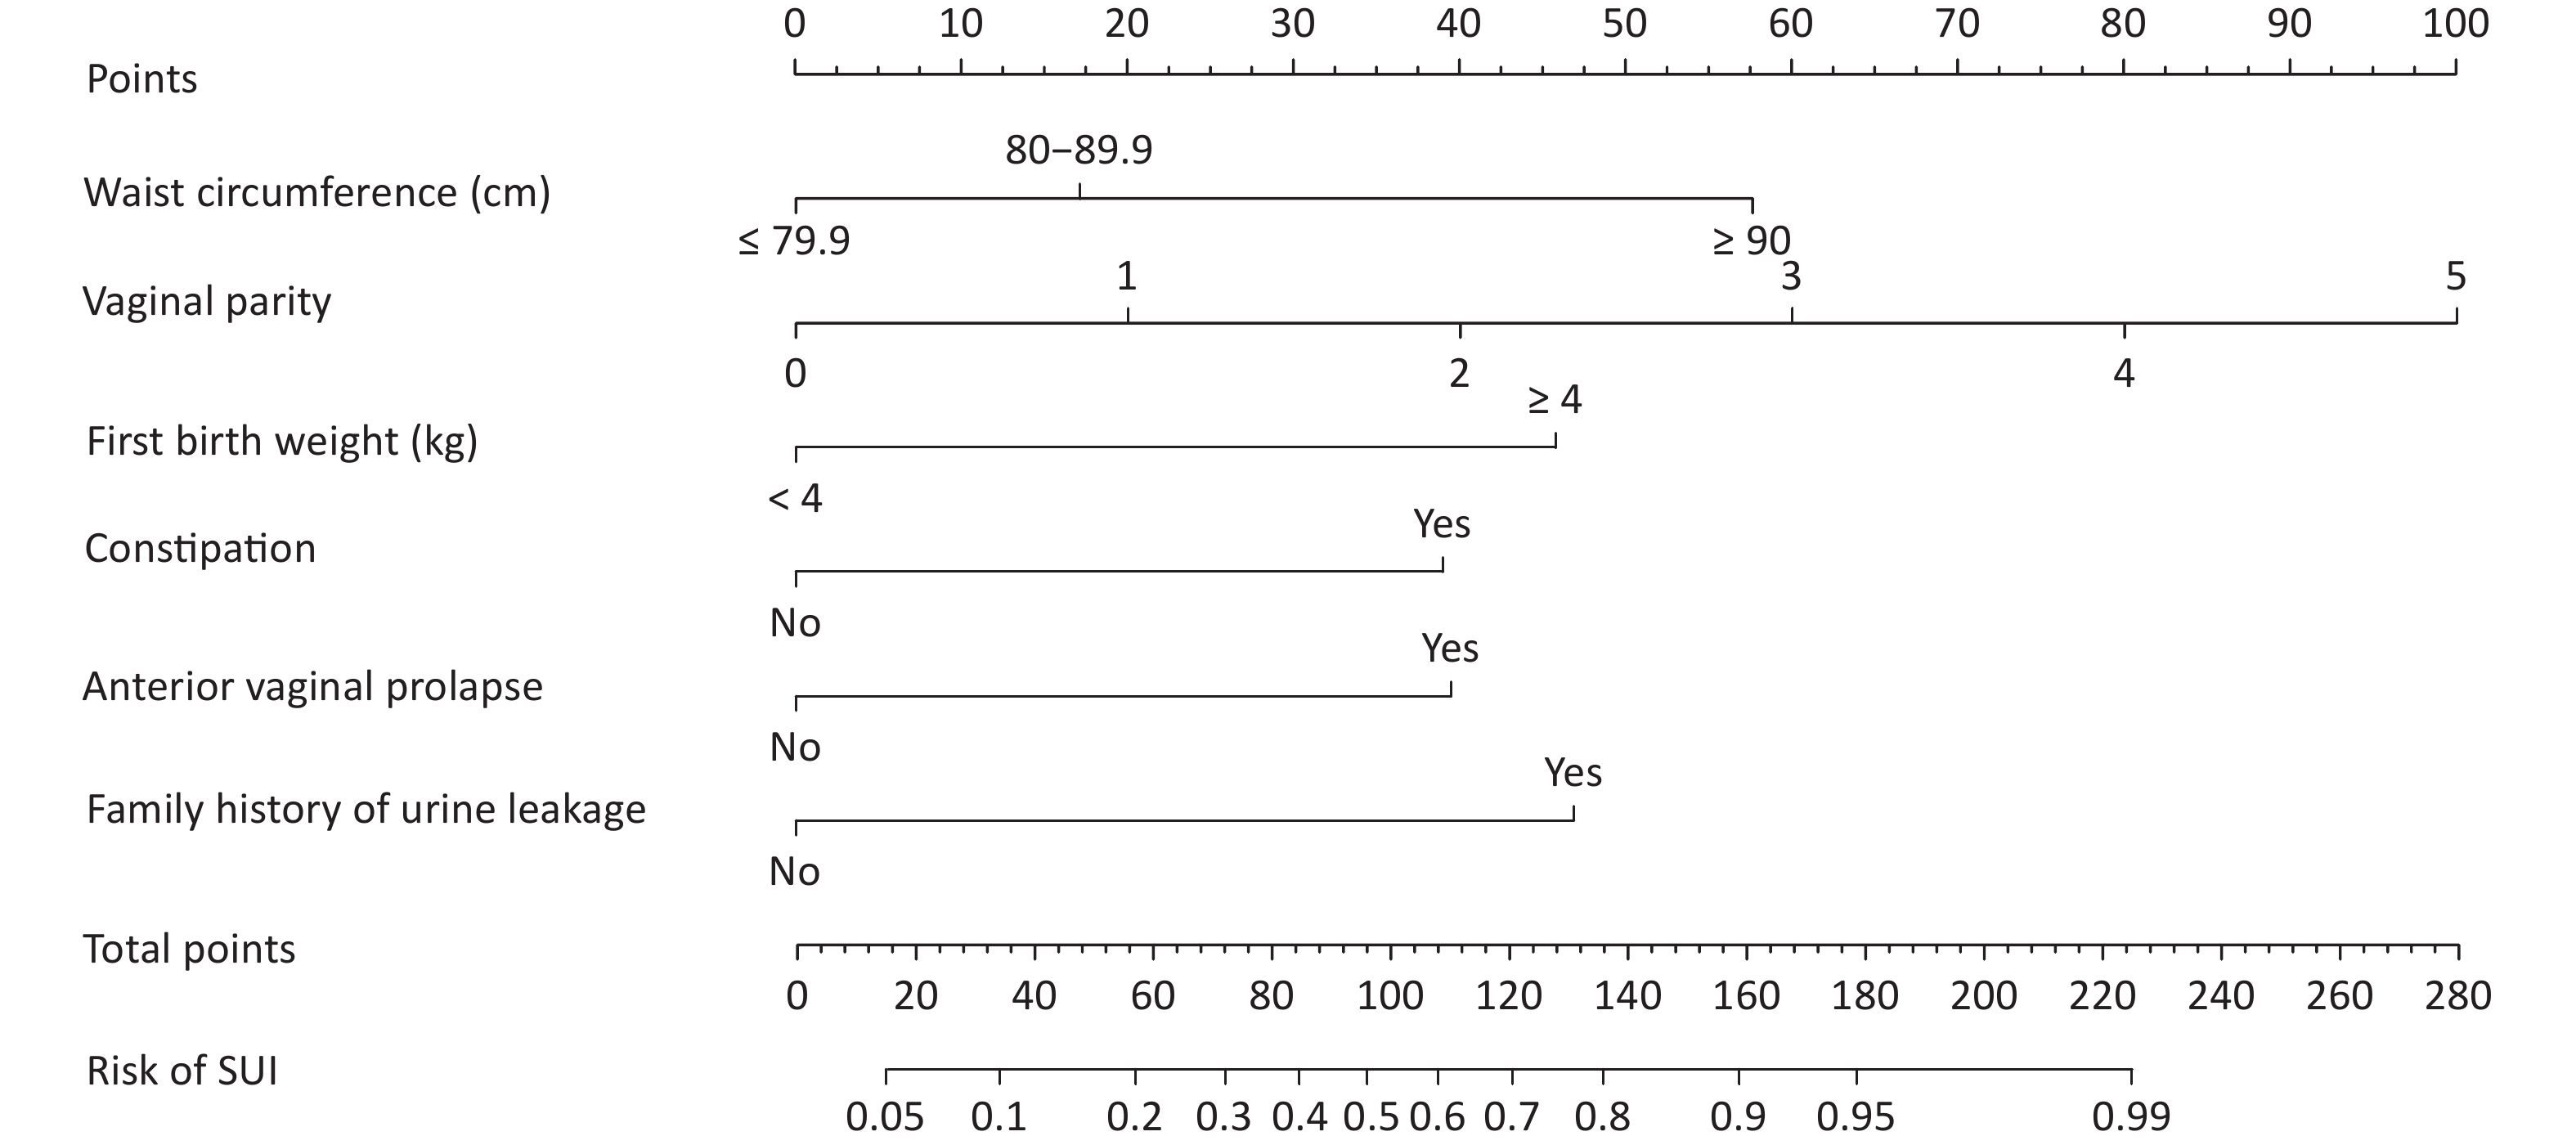
A total of 1,331 patients were enrolled according to the inclusion and exclusion criteria. The training and validation datasets included 1,031 and 300 cases, respectively. No significant differences were observed in the clinical data between the training and validation datasets (Table 1). The incidence of SUI in training and validation datasets was 37.5% (387/1,031) and 35.5% (105/300), respectively. Initially, we conducted a univariate analysis. Differences were identified in age, education, BMI, waist circumference, region, heavy physical labor, gravidity, mode of first birth, vaginal parity, age of first birth, and first birth weight, hypertension, dyslipidemia, heart disease, constipation, anterior vaginal prolapse, uterine prolapse, posterior vaginal prolapse, perineal laceration and family history of urinary leakage between groups (P < 0.05) (Table 1). Multivariate logistic regression analysis was performed on the factors with statistical significance in the univariate analysis (P < 0.05). The results demonstrated that SUI’s independent risk factors in women were waist circumference, vaginal parity, first birth weight, constipation, anterior vaginal prolapse, and family history of urine leakage (Table 2). Establishing a logistic regression model: Logist (p) = –3.519 + 0.707 × waist circumference (≤ 79.9 cm = 0, 80–89.9 cm = 1) + 1.978 × waist circumference (≤ 79.9 cm = 0, ≥ 90 cm = 1) + 0.718 × vaginal parity + 1.617 × first birth weight (< 4 kg = 0, ≥ 4 kg = 1) + 1.445 × constipation (No = 0, Yes = 1) + 1.416 × anterior vaginal prolapse (No = 0, Yes = 1) + 1.702 × family history of urinary leakage (No = 0, Yes = 1). Using the R language, the complex logistic regression model was transformed into a simple nomogram (Figure 1). The ROC curve of the prediction model was plotted, and AUC was 0.87 (95% confidence interval [CI], 0.85–0.90) (Supplementary Figure S1, available in www.besjournal.com), which indicated that the prediction model had good discrimination. The calibration curve demonstrated good agreement between the predicted and actual values (Supplementary Figure S2, available in www.besjournal.com), indicating that the model was accurate. Bootstrap sampling was used for internal verification, which indicated that the prediction model was relatively stable (Supplementary Table S1, available in www.besjournal.com). The validation dataset was used for external verification of the prediction model. The ROC curve of the validation dataset was drawn, and AUC was 0.84 (95% CI, 0.80–0.88) (Supplementary Figure S3, available in www.besjournal.com). A good calibration curve was obtained (Supplementary Figure S4, available in www.besjournal.com). The Youden index, specificity, sensitivity, positive likelihood ratio, and negative likelihood ratio of the prediction models are presented in Supplementary Table S2 (available in www.besjournal.com). The two clinical examinations used to validate the model are presented in Supplementary Table S3 (available in www.besjournal.com).
Table 1. Comparison between training and validation datasets and univariate analysis in training dataset
Variables Comparison between training and validation datasets Univariate analysis intraining dataset (n = 1,031) Training dataset
(n = 1,031)Validation dataset
(n = 300)P Non-SUI = 0
(n = 644)SUI = 1
(n = 387)OR (95% CI) P Age (y), mean (SD) 40.58 (8.65) 40.41 (8.09) 0.76 38.55 (8.550) 43.97 (8.078) 0.925 (0.910–0.940) < 0.001 Ethnicity, n (%) 0.90 Han 1,014 (98.35) 296 (98.67) 630 (97.83) 384 (99.22) Reference Minority 17 (1.65) 4 (1.33) 14 (2.17) 3 (0.78) 0.352 (0.100–1.231) 0.102 Education, n (%) 0.39 Primary school and below 141 (13.68) 49 (16.33) 41 (6.36) 100 (25.84) Reference Junior middle school 249 (24.15) 79 (26.33) 130 (20.19) 119 (30.75) 0.375 (0.242–0.583) < 0.001 Senior school 311 (30.16) 78 (26.00) 217 (33.70) 94 (24.29) 0.178 (0.115–0.275) < 0.001 College or above 330 (32.01) 94 (31.33) 256 (39.75) 74 (19.12) 0.119 (0.076–0.185) < 0.001 BMI (kg/m2), n (%) 0.85 ≤ 24.9 725 (70.32) 216 (72.00) 501 (77.80) 224 (57.88) Reference 25.0–27.9 211 (20.46) 58 (19.33) 101 (15.68) 110 (28.42) 2.236 (1.690–2.958) < 0.001 ≥ 28.0 95 (9.21) 26 (8.67) 42 (6.52%) 53 (13.70) 3.045 (1.967–4.713) < 0.001 Waist circumference (cm), n (%) 0.08 ≤ 79.9 298 (28.90) 87 (29.00) 232 (36.02) 66 (17.05) Reference 80.0–89.9 499 (48.40) 162 (54.00) 340 (52.80) 159 (41.09) 1.644 (1.179–2.291) 0.003 ≥ 90.0 234 (22.70) 51 (17.00) 72 (11.18) 162 (41.86) 7.909 (5.357–11.678) < 0.001 Region, n (%) 0.20 Town 780 (75.65) 216 (72.00) 531 (82.45) 249 (64.34) Reference Rural area 251 (24.35) 84 (28.00) 113 (17.55) 138 (35.66) 0.417 (0.310–0.559) < 0.001 Heavy physical labor, n (%) 0.40 No 873 (84.68) 248 (82.67) 559 (86.80) 314 (81.14) Reference Yes 158 (15.32) 52 (17.33) 85 (13.20) 73 (18.86) 1.529 (1.086–2.152) 0.015 Gravidity (y), mean (SD) 3.00 (1.62) 3.03 (1.51) 0.81 2.66 (1.436) 3.58(1.698) 1.438 (1.321–1.565) <0.001 Mode of first birth, n (%) 0.22 Cesarean section 220 (21.34) 74 (24.67) 465 (72.20) 346 (89.41) Reference Vaginal delivery 811 (78.66) 226 (75.33) 179 (27.80) 41 (10.59) 0.308 (0.213–0.444) < 0.001 Vaginal parity, mean (SD) 1.37 (0.95) 1.35 (0.95) 0.87 1.11 (0.891) 1.89 (1.062) 0.463 (0.403–0.533) < 0.001 Age at first birth, mean (SD) 24.69 (2.82) 24.71 (3.30) 0.09 25.00 (2.739) 24.16 (2.885) 1.099 (1.054–1.147) < 0.001 First birth weight (kg), n (%) 0.14 < 4 955 (92.63) 270 (90.00) 618 (95.96) 337 (87.08) Reference ≥ 4 76 (7.33) 30 (10.00) 26 (4.04) 50 (12.92) 3.527 (2.156–5.769) < 0.001 Hypertension, n (%) 0.36 No 953 (92.43) 282 (94.00) 617 (95.81) 336 (86.82) Reference Yes 78 (7.57) 18 (6.00) 27 (4.19) 51 (13.18) 3.469 (2.136–5.634) < 0.001 Diabetes, n (%) 0.67 No 1,015 (98.45) 297 (99.00) 641 (99.53) 374 (96.64) Reference Yes 16 (1.55) 3 (1.00) 3 (0.47) 13 (3.36) 7.427 (2.103–26.231) 0.002 Dyslipidemia, n (%) 0.51 No 1,007 (97.67) 291 (97.00) 638 (99.07) 369 (95.35) Reference Yes 24 (2.33) 9 (3.00) 6 (0.93) 18 (4.65) 5.187 (2.041–13.183) < 0.001 Heart disease, n (% ) 0.51 No 1,013 (98.25) 293 (97.67) 637 (98.91) 376 (97.16) Reference Yes 18 (1.75) 7 (2.33) 7 (1.09) 11 (2.84) 2.662 (1.023–6.926) 0.045 Constipation, n (%) 1.00 No 739 (71.68) 215 (71.67) 541 (84.01) 198 (51.16) Reference Yes 292 (28.32) 85 (28.33) 103 (15.99) 189 (48.84) 0.199 (0.149–0.267) < 0.001 Pelvic surgery history, n (%) 0.25 No 940 (91.17) 267 (92.00) 592 (91.93) 348 (89.92) Reference Yes 91 (8.83) 33 (8.00) 52 (8.07) 39 (10.08) 1.276 (0.825–1.973) 0.273 Anterior vaginal prolapse, n (%) 0.38 No 841 (81.57) 238 (79.33) 597 (92.70) 244 (63.05) Reference Yes 190 (18.43) 62 (20.67) 47 (7.30) 143 (36.95) 7.444 (5.185–10.687) < 0.001 Uterine prolapse, n (%) 0.34 No 943 (91.46) 269 (89.67) 606 (94.10) 337 (87.08) Reference Yes 88 (8.54) 31 (10.33) 38 (5.90) 50 (12.92) 2.366 (1.520–3.682) < 0.001 Posterior vaginal prolapse, n (%) 0.10 No 986 (95.64) 280 (93.33) 631 (97.98) 355 (91.73) Reference Yes 45 (4.36) 20 (6.67) 13 (2.02) 32 (8.27) 4.375 (2.267–8.445) < 0.001 Perineal laceration, n (%) 0.84 No 969 (93.99) 281 (93.67) 634 (98.45) 335 (86.56) Reference Yes 62 (6.01) 19 (6.33) 10 (1.55) 52 (13.44) 9.841 (4.938–19.613) < 0.001 Family history of urine leakage, n (%) 0.38 No 877 (85.06) 249 (83.00) 595 (92.39) 282 (72.87) Reference  Yes
Yes154 (14.94) 51 (17.00) 49 (7.61) 105 (27.13) 4.521 (3.131–6.529) < 0.001 Note. SUI, stress urinary incontinence; BMI, body mass index; SD, standard deviation. Table 2. Multivariate analysis of clinical data in the training dataset
Variables β OR (95% CI) P Waist circumference (cm) 80–89.9 vs. ≤ 79.9 0.707 2.027 (1.338–3.071) 0.001 ≥ 90 vs. ≤ 79.9 1.978 7.232 (4.418–11.837) < 0.001 Vaginal parity 0.718 2.050 (1.717–2.447) < 0.001 First birth weight (kg), > 4 vs. ≤ 4 1.617 5.037 (2.732–9.285) < 0.001 Constipation, yes vs. no 1.445 4.242 (2.982–6.034) < 0.001 Anterior vaginal prolapse, yes vs. no 1.416 4.120 (2.687–6.317) < 0.001 Family history of urine leakage, yes vs. no 1.702 5.487 (3.467–8.684) < 0.001 Constant −3.519 0.030 < 0.001 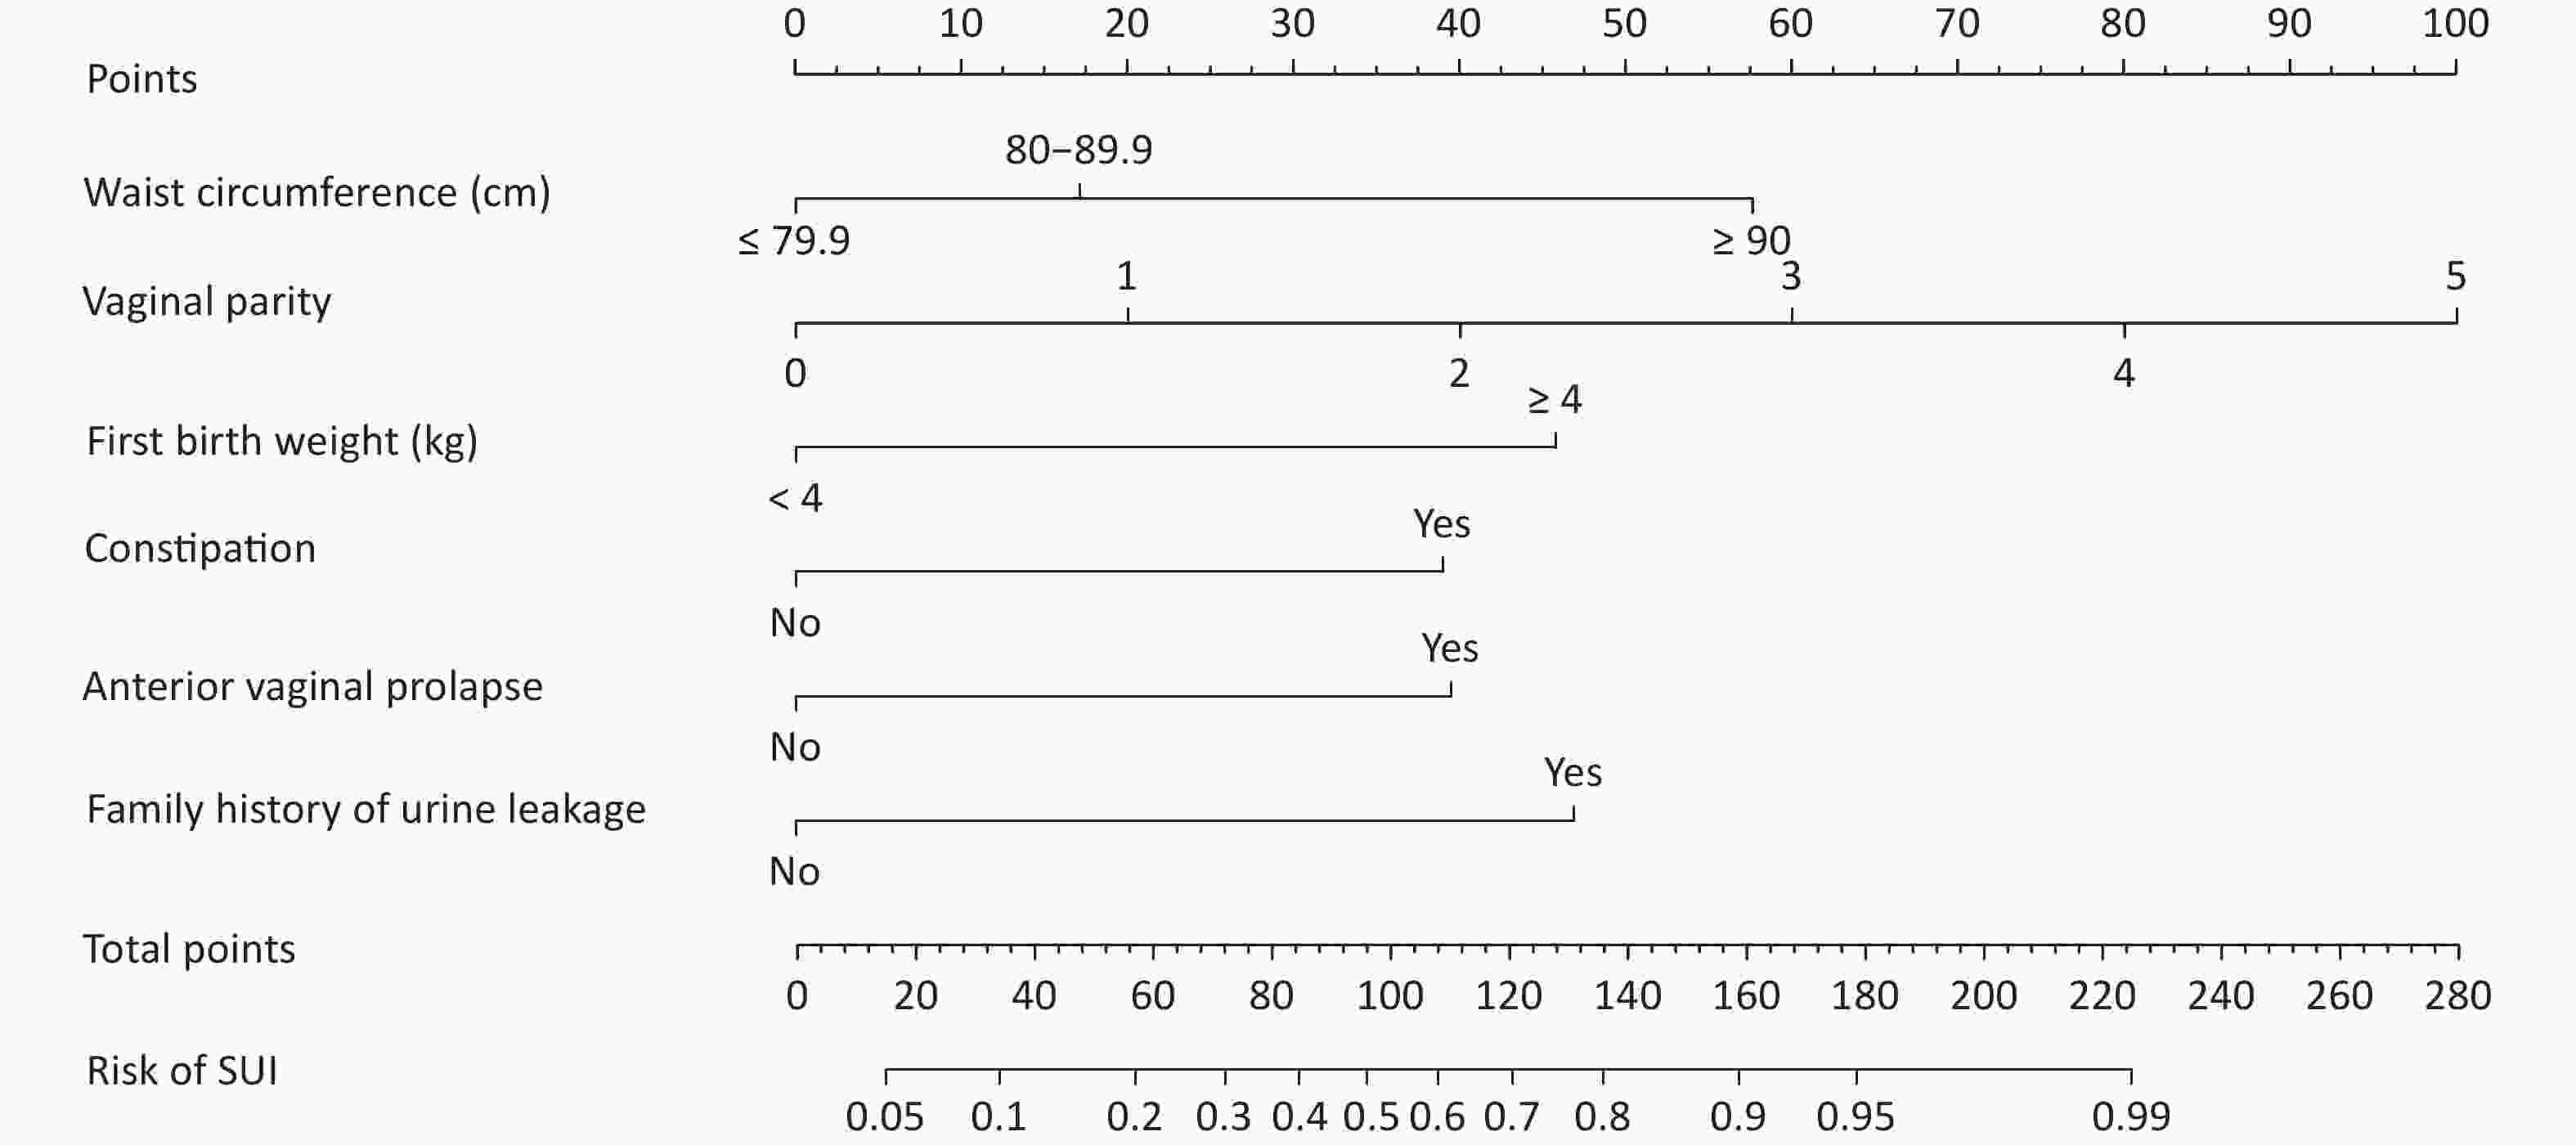
Figure 1. Risk nomogram for predicting SUI in women. SUI, stress urinary incontinence.
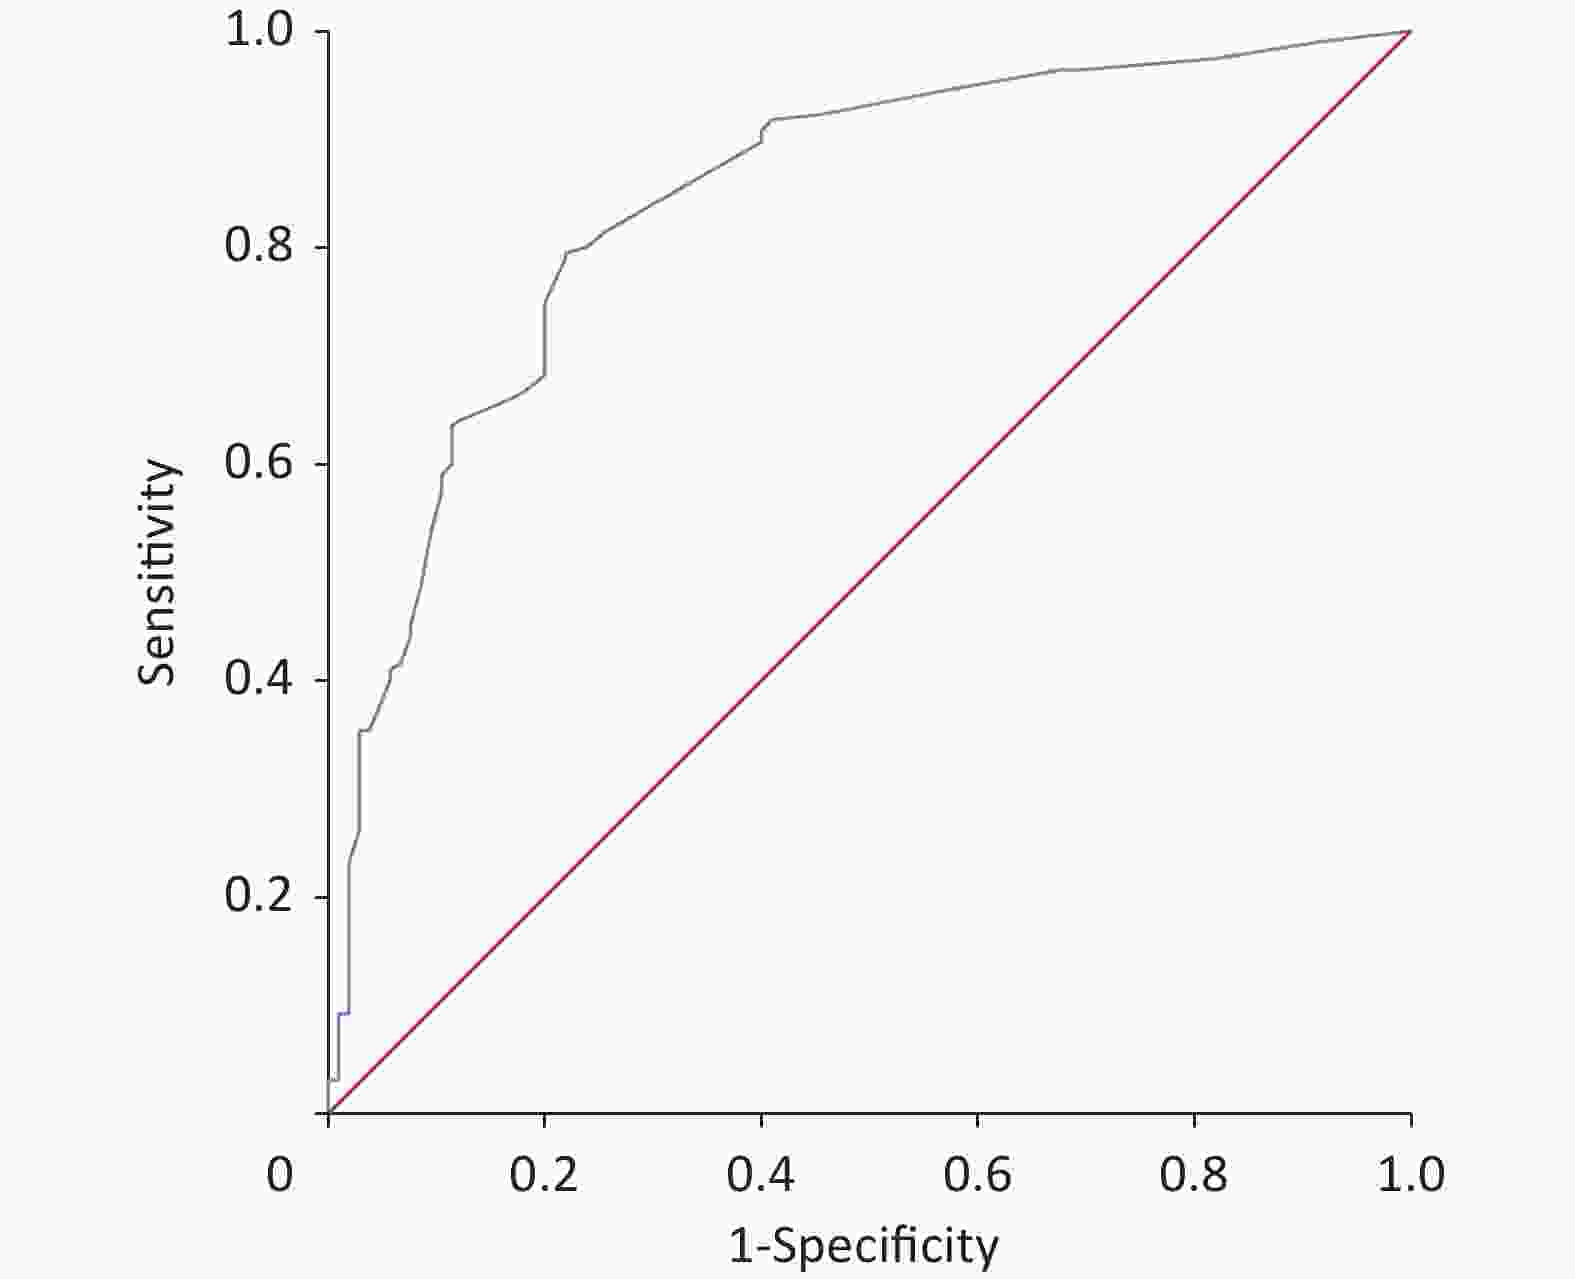
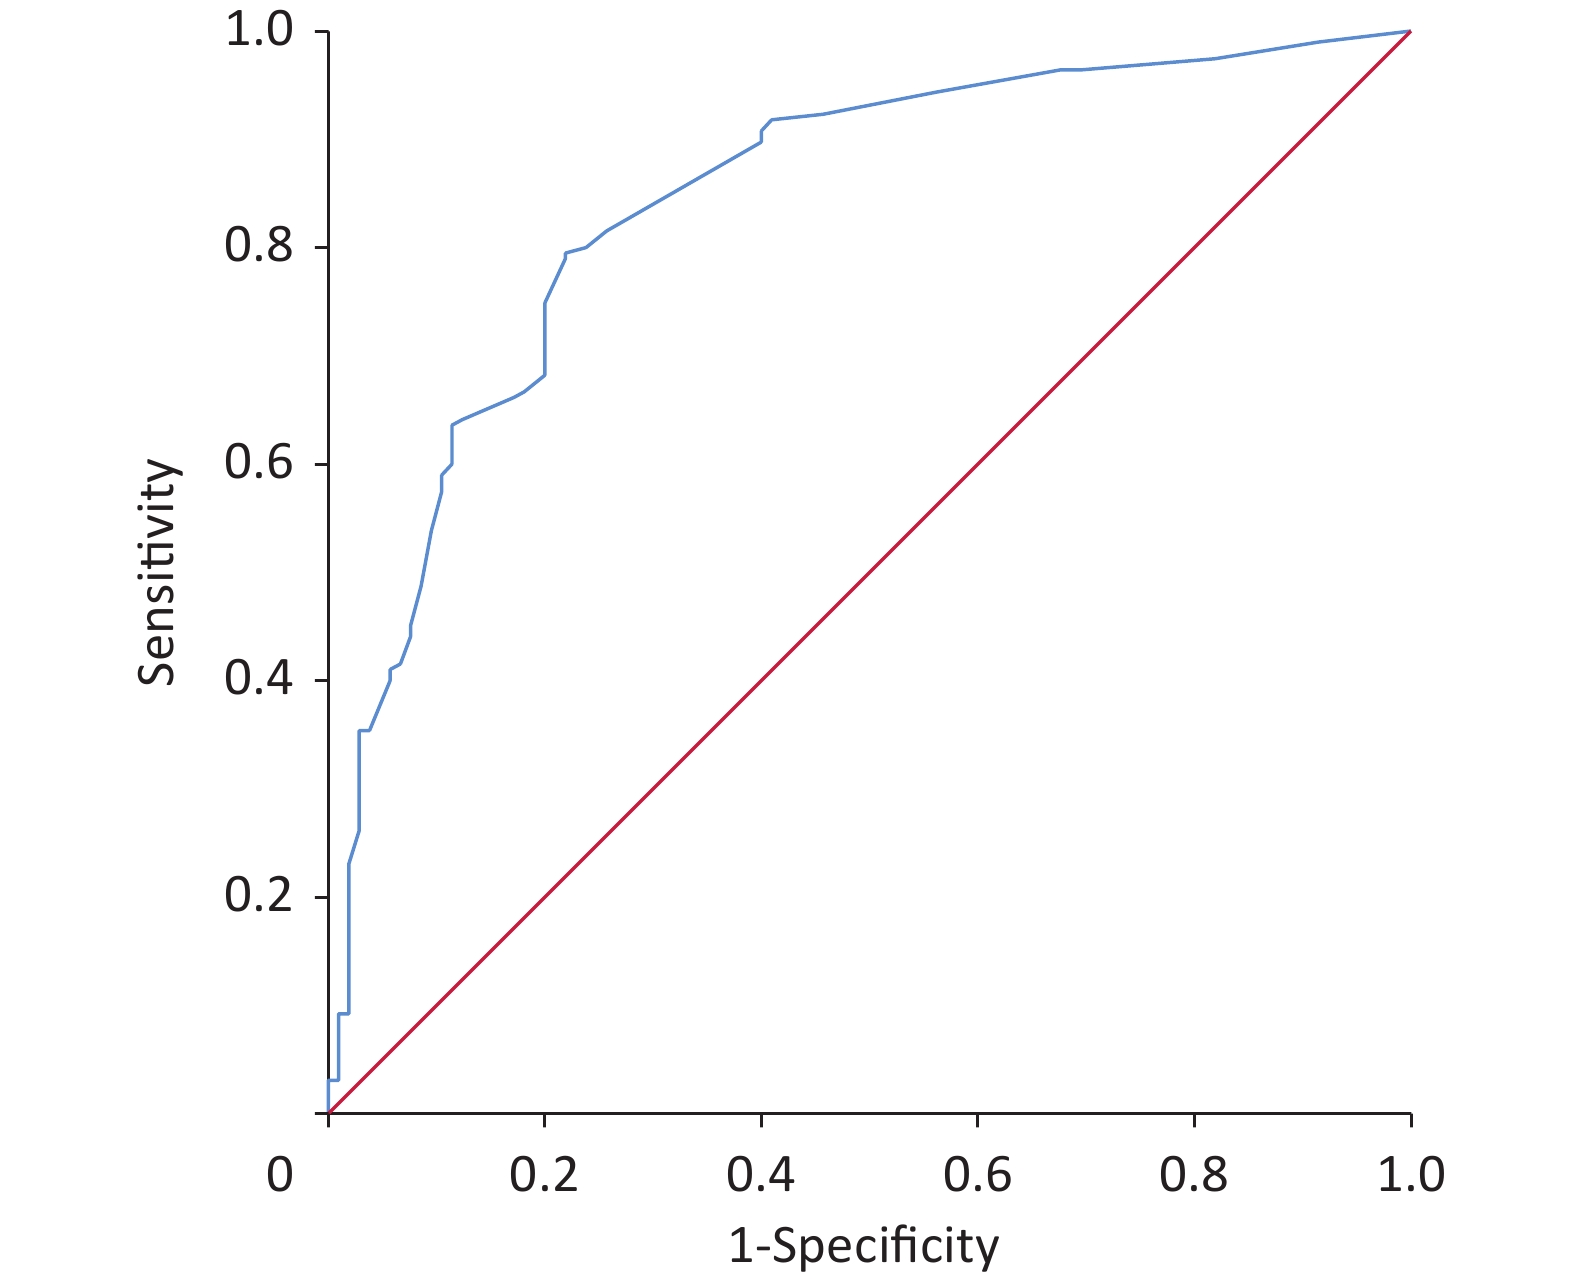
Figure S1. The ROC curve of the prediction model in the training dataset was plotted, and AUC was 0.87 (95 % CI, 0.85–0.90). ROC, receiver operating characteristic.
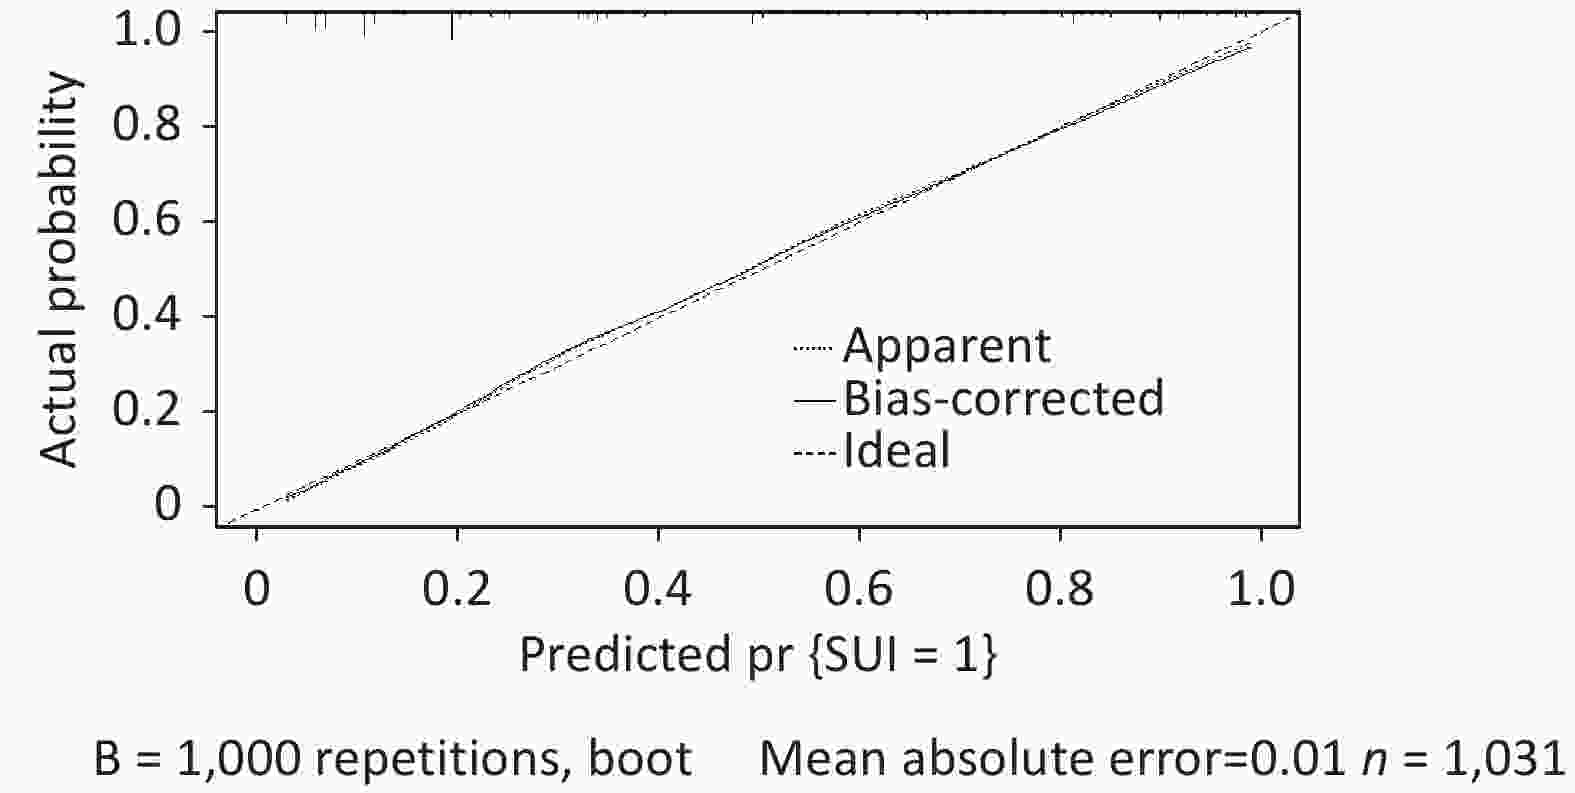
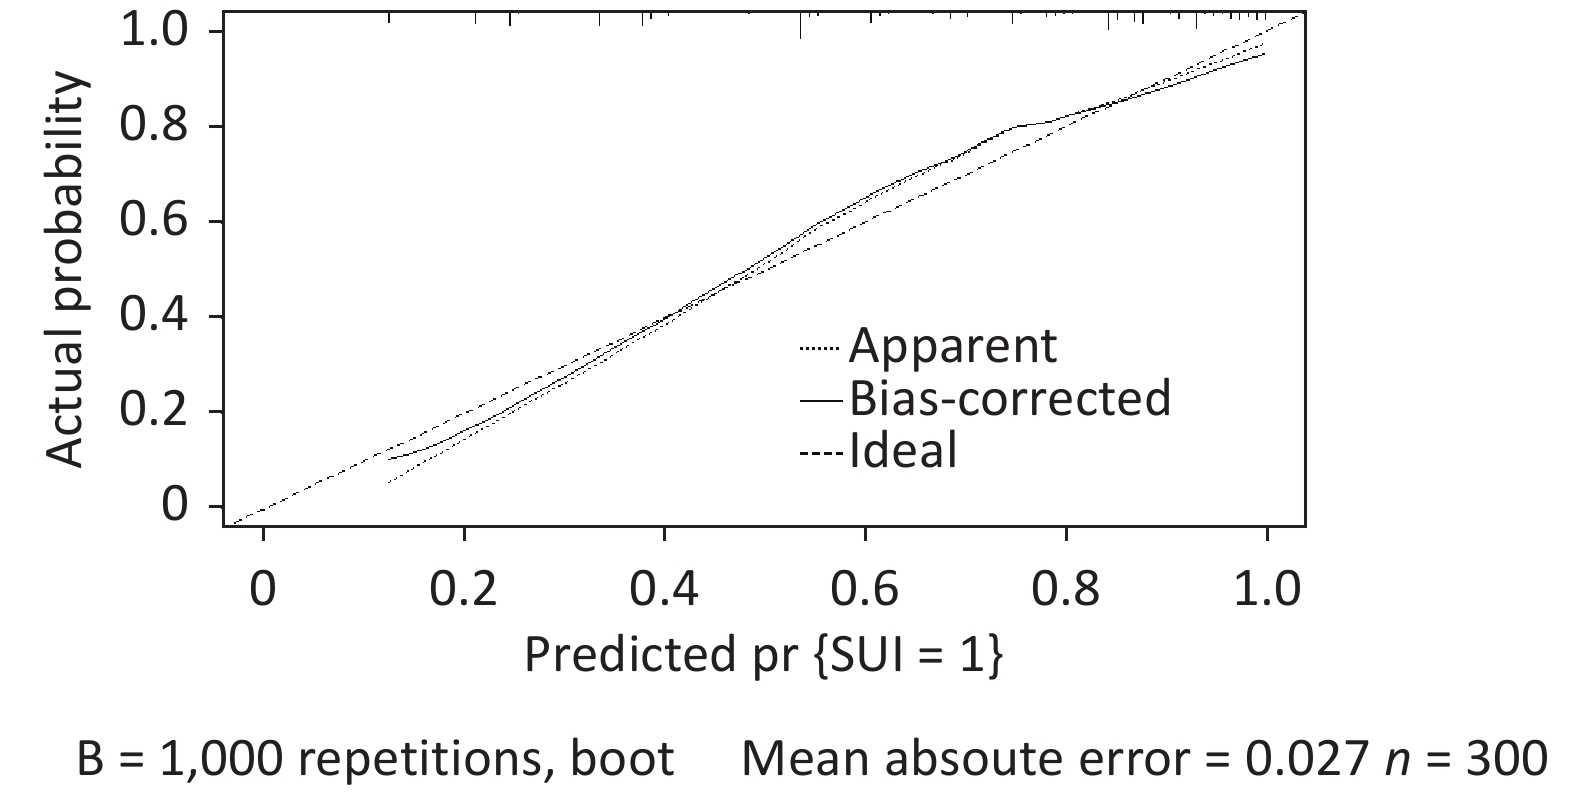
Figure S2. The calibration curve in the validation dataset showed good agreement between predicted and actual values.
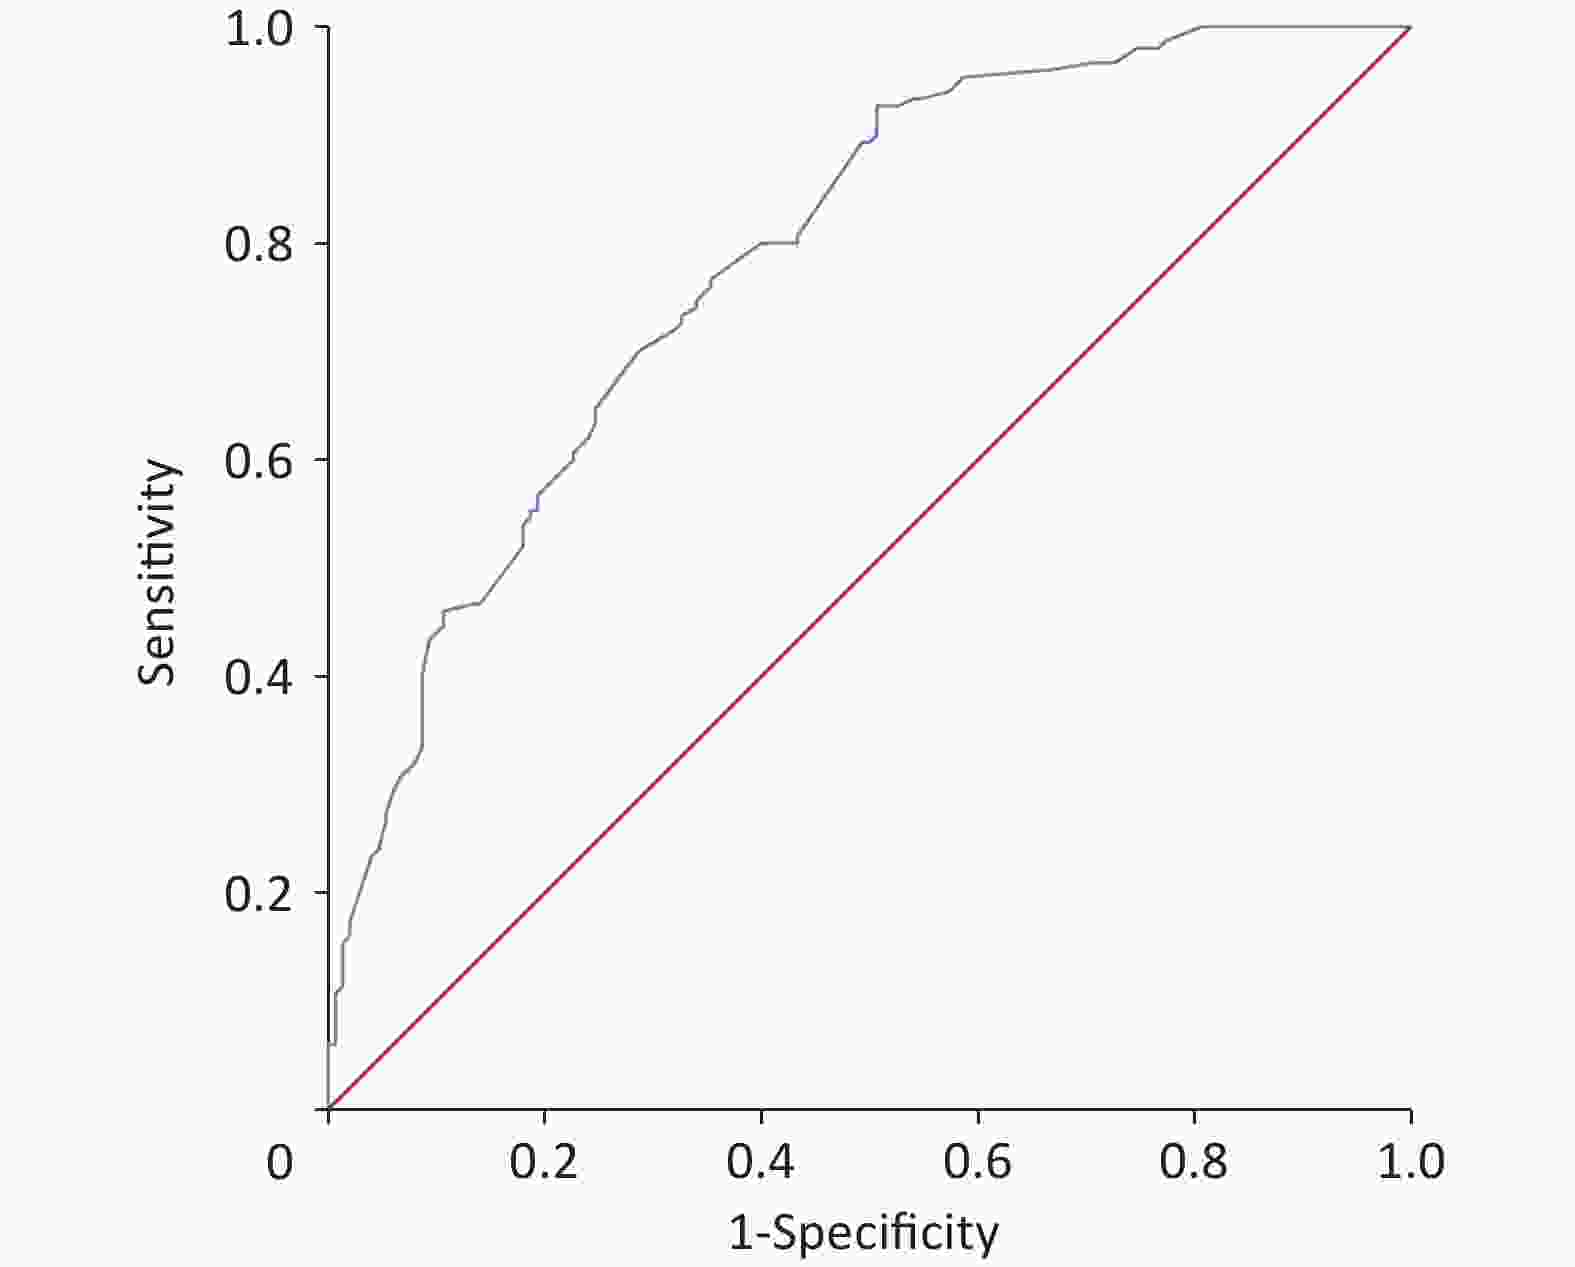
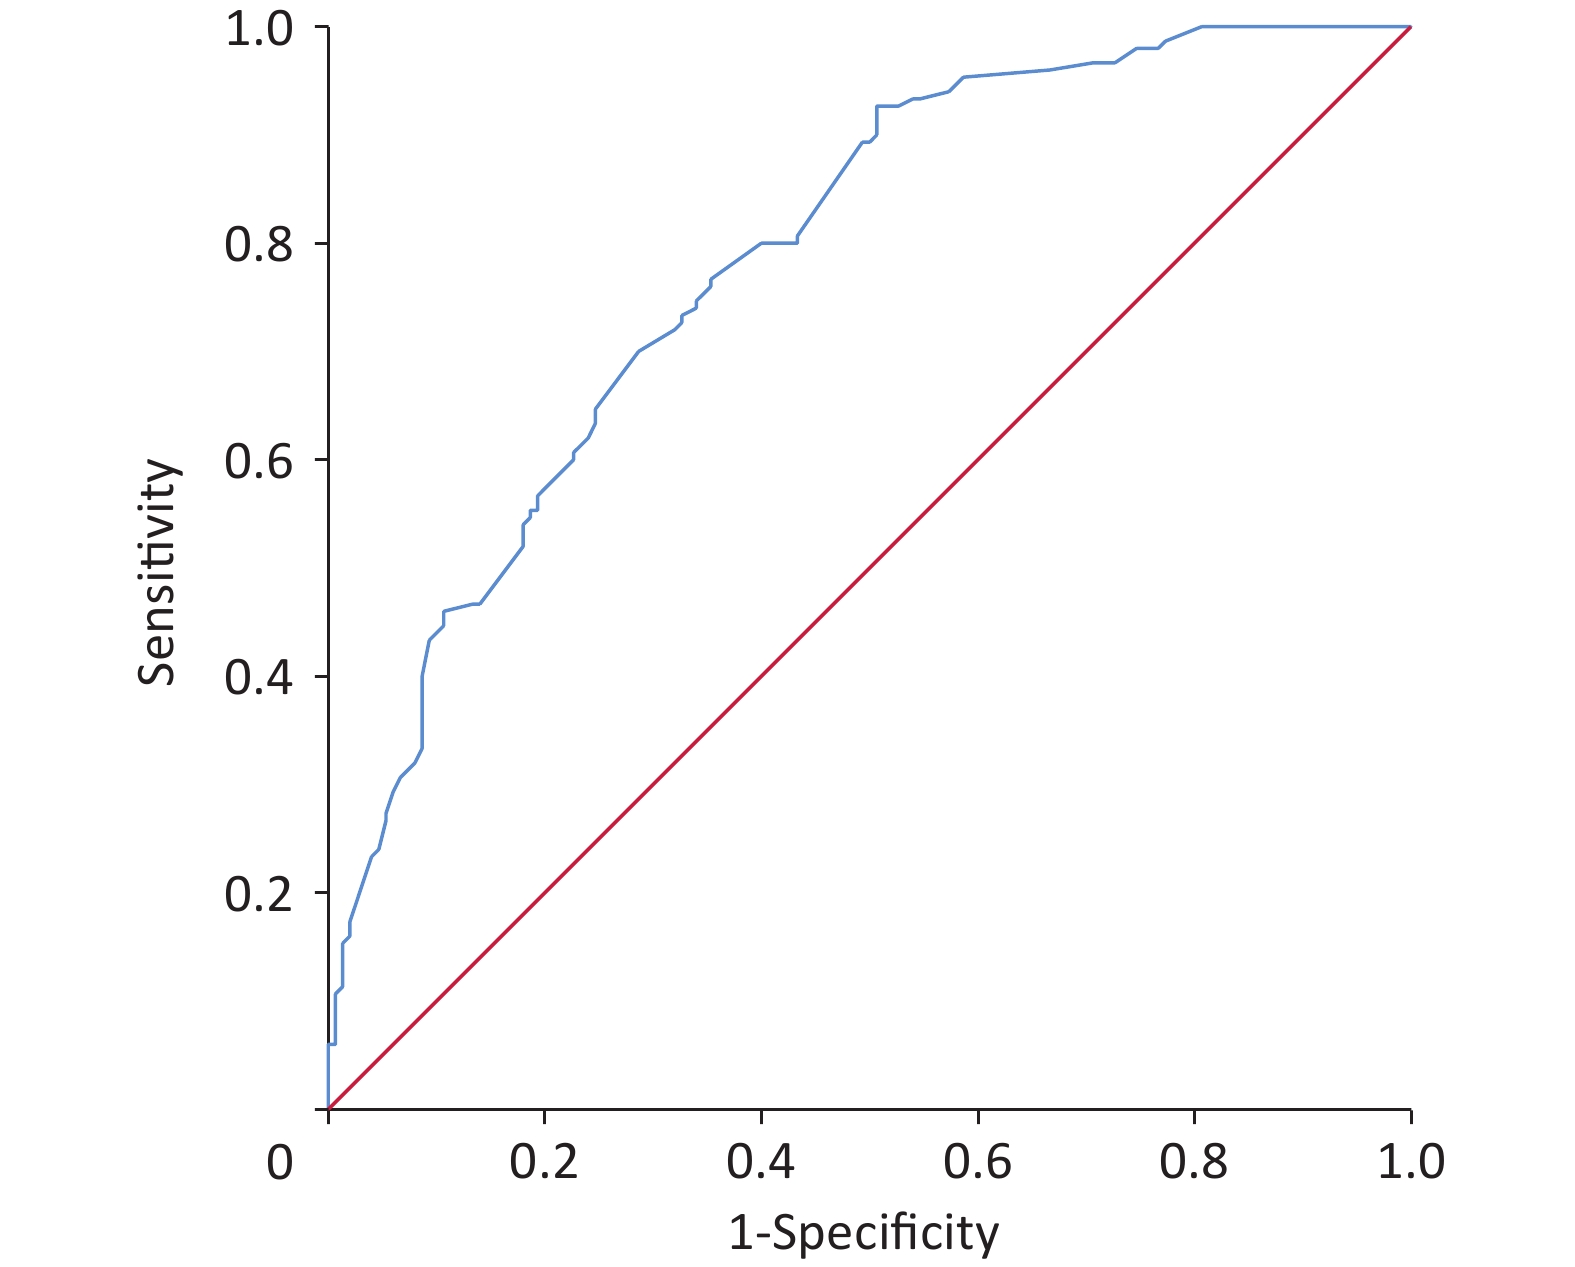
Figure S3. The ROC curve of the validation dataset was drawn, and AUC was 0.84 (95% CI, 0.80–0.88). ROC, receiver operating characteristic.
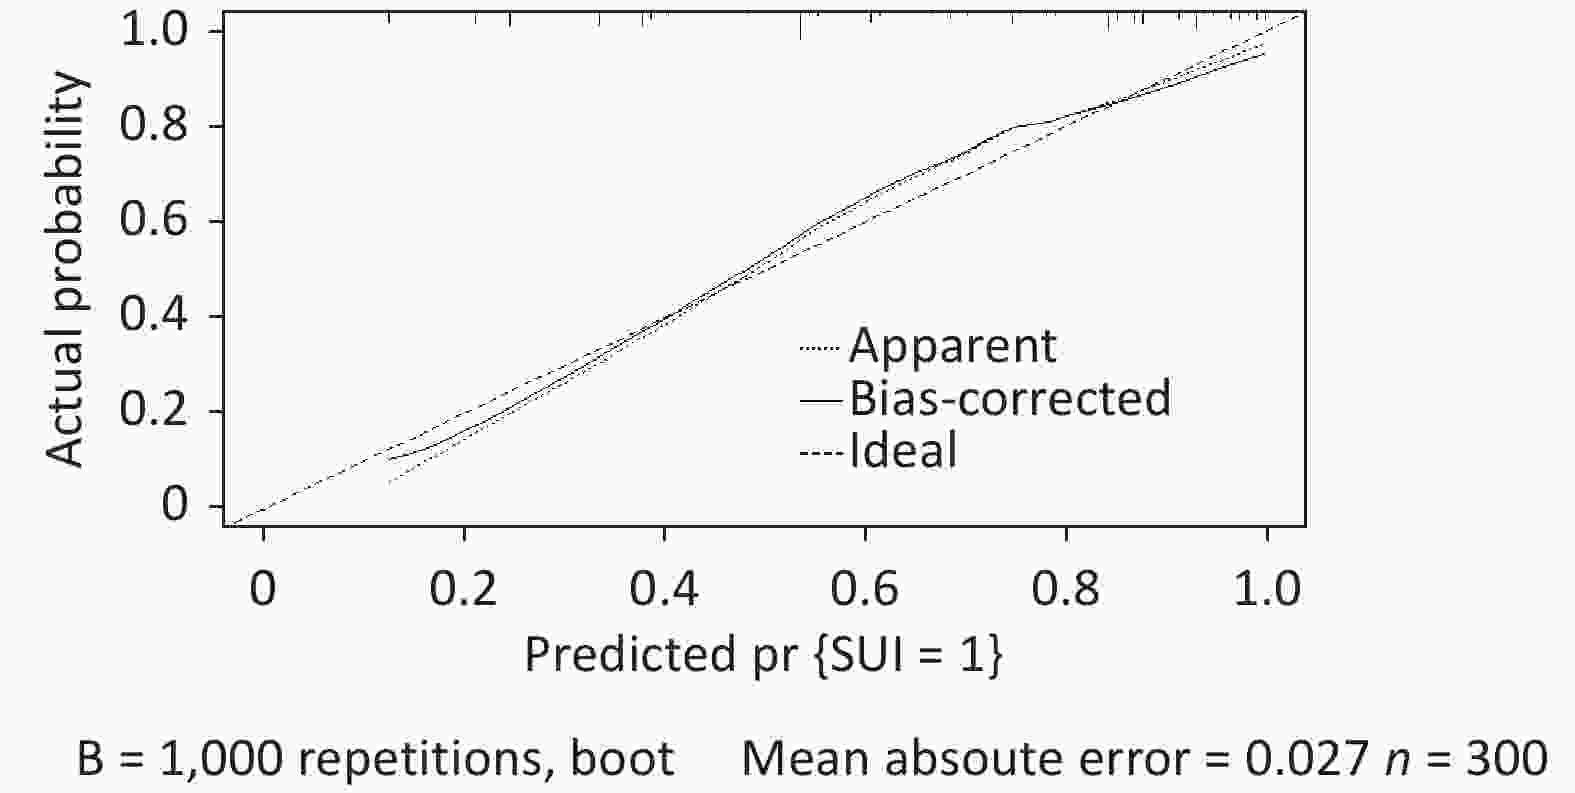
Figure S4. The calibration curve in the validation dataset showed good agreement between predicted and actual values.
Existing literature has reported prediction models for early postpartum SUI and older SUI, mainly emphasizing age, vaginal delivery, and BMI, which are undoubtedly common factors in the occurrence of SUI in women[5,6]. However, as our study statistics demonstrate, certain characteristics, including young age, low BMI, lack of a history of vaginal delivery, and lack of a history of macrosomia, were also observed in adult patients with SUI. Other significant risk factors may exist, including susceptibility genes and family heredity, as evidenced by molecular studies on pelvic floor dysfunction[7]. In addition, the current models for predicting SUI in adult women are constrained by the limited sample size and the imprecision of the models based on a meta-analysis of previous studies, which employed a training database of 1,031 adult cases and a validation database of 300 cases with complete clinical data. The analysis included 22 variables, including family history, constipation, and pelvic organ prolapse, in addition to age, BMI, number of vaginal births, fetal weight, and other relevant factors. The current prediction model exhibited high consistency in the validation dataset and bootstrap validation, thereby providing significant benefits to both the physician and the patient.
The advantage of this study is that the established prediction model was verified both internally and externally; thus, the results were more objective. This study had some limitations. First, since the sample survey came from single-center data, some bias may exist without verifying the data of other centers; for instance, in this study, the mean age was lower than the average age of onset and was excluded from the modeling. If a multi-center approach is employed, whereby data from different regional sources are used, this potential issue may be circumvented. Second, our analysis indicates that exercise intensity and heavy manual labor may be significant factors in the development of SUI. However, owing to the absence of quantitative criteria, the credibility of the model was diminished, and these variables were excluded from the model. The model could be enhanced by further expanding the sample size and formulating corresponding standards. The Youden index was employed to assess the veracity of the model, and the results were deemed satisfactory. Nevertheless, the index does not provide information on the direction or magnitude of any miscalibration; therefore, further research should employ more indicators to ascertain the authenticity and accuracy of the model, based on multi-center and large model research. Consequently, conducting multi-center studies with large sample sizes to establish a credible and accurate adult SUI model in women is imperative.
-
Table S1. Bootstrap validation of clinical data in the training dataset
Variables β OR (95% CI) P Waist circumference (cm) 80-89.9 vs. ≤ 79.9 0.588 1.800 (1.661–1.950) < 0.001 ≥ 90 vs. ≤ 79.9 2.154 8.619 (7.851–9.461) < 0.001 Vaginal parity 0.711 3.548 (3.227–3.902) < 0.001 First birth weight (kg), > 4 vs. ≤ 4 1.461 4.306 (3.832–4.839) < 0.001 Constipation, yes vs. no 1.445 4.531 (2.982-6.034) < 0.001 Anterior vaginal prolapse, yes vs. no 1.501 4.488 (4.124–4.884) < 0.001 Family history of urine leakage, yes vs. no 1.714 5.552 (5.075–6.075) < 0.001 Constant −2.872 0.025 < 0.001 Table S2. Accuracy evaluation of prediction model
Indicators Training dataset Validation dataset AUC (95% CI) 0.87 (0.85–0.89) 0.84 (0.80–0.88) Youden index 0.61 0.58 Specificity (%) (95% CI) 80.62 (76.3–84.4) 78.11 (74.7–81.2) Sensitivity (%) (95% CI) 82.69 (78.5–86.3) 79.49 (73.1–84.9) Positive likelihood ratio (95% CI) 3.78 (3.24–4.40) 3.63 (2.51–5.42) Negative likelihood ratio (95% CI) 0.22 (0.18–0.28) 0.26 (0.20–0.35) Table S3. Two clinical exams for validating the model
Patients SUI Waist circum
ference( cm)Vaginal
parityFirst birth
weight (kg)Constipation Anterior vaginal
prolapseFamily history
of urine leakageLogist (p) Case1 Yes 96 3 3.6 No Yes Yes 3.731 Case2 No 81 1 2.9 Yes Yes No 0.767 Note. SUI, stress urinary incontinence.
doi: 10.3967/bes2024.114
Multivariate Analysis of Female Stress Urinary Incontinence and Establishment of a Prediction Model
-
The authors declare no conflict of interest.
&These authors contributed equally to this work.
注释:1) Conflicts of Interest: -
Figure 1. Risk nomogram for predicting SUI in women. SUI, stress urinary incontinence.
S1. The ROC curve of the prediction model in the training dataset was plotted, and AUC was 0.87 (95 % CI, 0.85–0.90). ROC, receiver operating characteristic.
S2. The calibration curve in the validation dataset showed good agreement between predicted and actual values.
S3. The ROC curve of the validation dataset was drawn, and AUC was 0.84 (95% CI, 0.80–0.88). ROC, receiver operating characteristic.
S4. The calibration curve in the validation dataset showed good agreement between predicted and actual values.
Table 1. Comparison between training and validation datasets and univariate analysis in training dataset
Variables Comparison between training and validation datasets Univariate analysis intraining dataset (n = 1,031) Training dataset
(n = 1,031)Validation dataset
(n = 300)P Non-SUI = 0
(n = 644)SUI = 1
(n = 387)OR (95% CI) P Age (y), mean (SD) 40.58 (8.65) 40.41 (8.09) 0.76 38.55 (8.550) 43.97 (8.078) 0.925 (0.910–0.940) < 0.001 Ethnicity, n (%) 0.90 Han 1,014 (98.35) 296 (98.67) 630 (97.83) 384 (99.22) Reference Minority 17 (1.65) 4 (1.33) 14 (2.17) 3 (0.78) 0.352 (0.100–1.231) 0.102 Education, n (%) 0.39 Primary school and below 141 (13.68) 49 (16.33) 41 (6.36) 100 (25.84) Reference Junior middle school 249 (24.15) 79 (26.33) 130 (20.19) 119 (30.75) 0.375 (0.242–0.583) < 0.001 Senior school 311 (30.16) 78 (26.00) 217 (33.70) 94 (24.29) 0.178 (0.115–0.275) < 0.001 College or above 330 (32.01) 94 (31.33) 256 (39.75) 74 (19.12) 0.119 (0.076–0.185) < 0.001 BMI (kg/m2), n (%) 0.85 ≤ 24.9 725 (70.32) 216 (72.00) 501 (77.80) 224 (57.88) Reference 25.0–27.9 211 (20.46) 58 (19.33) 101 (15.68) 110 (28.42) 2.236 (1.690–2.958) < 0.001 ≥ 28.0 95 (9.21) 26 (8.67) 42 (6.52%) 53 (13.70) 3.045 (1.967–4.713) < 0.001 Waist circumference (cm), n (%) 0.08 ≤ 79.9 298 (28.90) 87 (29.00) 232 (36.02) 66 (17.05) Reference 80.0–89.9 499 (48.40) 162 (54.00) 340 (52.80) 159 (41.09) 1.644 (1.179–2.291) 0.003 ≥ 90.0 234 (22.70) 51 (17.00) 72 (11.18) 162 (41.86) 7.909 (5.357–11.678) < 0.001 Region, n (%) 0.20 Town 780 (75.65) 216 (72.00) 531 (82.45) 249 (64.34) Reference Rural area 251 (24.35) 84 (28.00) 113 (17.55) 138 (35.66) 0.417 (0.310–0.559) < 0.001 Heavy physical labor, n (%) 0.40 No 873 (84.68) 248 (82.67) 559 (86.80) 314 (81.14) Reference Yes 158 (15.32) 52 (17.33) 85 (13.20) 73 (18.86) 1.529 (1.086–2.152) 0.015 Gravidity (y), mean (SD) 3.00 (1.62) 3.03 (1.51) 0.81 2.66 (1.436) 3.58(1.698) 1.438 (1.321–1.565) <0.001 Mode of first birth, n (%) 0.22 Cesarean section 220 (21.34) 74 (24.67) 465 (72.20) 346 (89.41) Reference Vaginal delivery 811 (78.66) 226 (75.33) 179 (27.80) 41 (10.59) 0.308 (0.213–0.444) < 0.001 Vaginal parity, mean (SD) 1.37 (0.95) 1.35 (0.95) 0.87 1.11 (0.891) 1.89 (1.062) 0.463 (0.403–0.533) < 0.001 Age at first birth, mean (SD) 24.69 (2.82) 24.71 (3.30) 0.09 25.00 (2.739) 24.16 (2.885) 1.099 (1.054–1.147) < 0.001 First birth weight (kg), n (%) 0.14 < 4 955 (92.63) 270 (90.00) 618 (95.96) 337 (87.08) Reference ≥ 4 76 (7.33) 30 (10.00) 26 (4.04) 50 (12.92) 3.527 (2.156–5.769) < 0.001 Hypertension, n (%) 0.36 No 953 (92.43) 282 (94.00) 617 (95.81) 336 (86.82) Reference Yes 78 (7.57) 18 (6.00) 27 (4.19) 51 (13.18) 3.469 (2.136–5.634) < 0.001 Diabetes, n (%) 0.67 No 1,015 (98.45) 297 (99.00) 641 (99.53) 374 (96.64) Reference Yes 16 (1.55) 3 (1.00) 3 (0.47) 13 (3.36) 7.427 (2.103–26.231) 0.002 Dyslipidemia, n (%) 0.51 No 1,007 (97.67) 291 (97.00) 638 (99.07) 369 (95.35) Reference Yes 24 (2.33) 9 (3.00) 6 (0.93) 18 (4.65) 5.187 (2.041–13.183) < 0.001 Heart disease, n (% ) 0.51 No 1,013 (98.25) 293 (97.67) 637 (98.91) 376 (97.16) Reference Yes 18 (1.75) 7 (2.33) 7 (1.09) 11 (2.84) 2.662 (1.023–6.926) 0.045 Constipation, n (%) 1.00 No 739 (71.68) 215 (71.67) 541 (84.01) 198 (51.16) Reference Yes 292 (28.32) 85 (28.33) 103 (15.99) 189 (48.84) 0.199 (0.149–0.267) < 0.001 Pelvic surgery history, n (%) 0.25 No 940 (91.17) 267 (92.00) 592 (91.93) 348 (89.92) Reference Yes 91 (8.83) 33 (8.00) 52 (8.07) 39 (10.08) 1.276 (0.825–1.973) 0.273 Anterior vaginal prolapse, n (%) 0.38 No 841 (81.57) 238 (79.33) 597 (92.70) 244 (63.05) Reference Yes 190 (18.43) 62 (20.67) 47 (7.30) 143 (36.95) 7.444 (5.185–10.687) < 0.001 Uterine prolapse, n (%) 0.34 No 943 (91.46) 269 (89.67) 606 (94.10) 337 (87.08) Reference Yes 88 (8.54) 31 (10.33) 38 (5.90) 50 (12.92) 2.366 (1.520–3.682) < 0.001 Posterior vaginal prolapse, n (%) 0.10 No 986 (95.64) 280 (93.33) 631 (97.98) 355 (91.73) Reference Yes 45 (4.36) 20 (6.67) 13 (2.02) 32 (8.27) 4.375 (2.267–8.445) < 0.001 Perineal laceration, n (%) 0.84 No 969 (93.99) 281 (93.67) 634 (98.45) 335 (86.56) Reference Yes 62 (6.01) 19 (6.33) 10 (1.55) 52 (13.44) 9.841 (4.938–19.613) < 0.001 Family history of urine leakage, n (%) 0.38 No 877 (85.06) 249 (83.00) 595 (92.39) 282 (72.87) Reference Yes 154 (14.94) 51 (17.00) 49 (7.61) 105 (27.13) 4.521 (3.131–6.529) < 0.001 Note. SUI, stress urinary incontinence; BMI, body mass index; SD, standard deviation.  下载: 导出CSV
Table 2. Multivariate analysis of clinical data in the training dataset
Variables β OR (95% CI) P Waist circumference (cm) 80–89.9 vs. ≤ 79.9 0.707 2.027 (1.338–3.071) 0.001 ≥ 90 vs. ≤ 79.9 1.978 7.232 (4.418–11.837) < 0.001 Vaginal parity 0.718 2.050 (1.717–2.447) < 0.001 First birth weight (kg), > 4 vs. ≤ 4 1.617 5.037 (2.732–9.285) < 0.001 Constipation, yes vs. no 1.445 4.242 (2.982–6.034) < 0.001 Anterior vaginal prolapse, yes vs. no 1.416 4.120 (2.687–6.317) < 0.001 Family history of urine leakage, yes vs. no 1.702 5.487 (3.467–8.684) < 0.001 Constant −3.519 0.030 < 0.001
下载: 导出CSV
S1. Bootstrap validation of clinical data in the training dataset
Variables β OR (95% CI) P Waist circumference (cm) 80-89.9 vs. ≤ 79.9 0.588 1.800 (1.661–1.950) < 0.001 ≥ 90 vs. ≤ 79.9 2.154 8.619 (7.851–9.461) < 0.001 Vaginal parity 0.711 3.548 (3.227–3.902) < 0.001 First birth weight (kg), > 4 vs. ≤ 4 1.461 4.306 (3.832–4.839) < 0.001 Constipation, yes vs. no 1.445 4.531 (2.982-6.034) < 0.001 Anterior vaginal prolapse, yes vs. no 1.501 4.488 (4.124–4.884) < 0.001 Family history of urine leakage, yes vs. no 1.714 5.552 (5.075–6.075) < 0.001 Constant −2.872 0.025 < 0.001
下载: 导出CSV
S2. Accuracy evaluation of prediction model
Indicators Training dataset Validation dataset AUC (95% CI) 0.87 (0.85–0.89) 0.84 (0.80–0.88) Youden index 0.61 0.58 Specificity (%) (95% CI) 80.62 (76.3–84.4) 78.11 (74.7–81.2) Sensitivity (%) (95% CI) 82.69 (78.5–86.3) 79.49 (73.1–84.9) Positive likelihood ratio (95% CI) 3.78 (3.24–4.40) 3.63 (2.51–5.42) Negative likelihood ratio (95% CI) 0.22 (0.18–0.28) 0.26 (0.20–0.35)
下载: 导出CSV
S3. Two clinical exams for validating the model
Patients SUI Waist circum
ference( cm)Vaginal
parityFirst birth
weight (kg)Constipation Anterior vaginal
prolapseFamily history
of urine leakageLogist (p) Case1 Yes 96 3 3.6 No Yes Yes 3.731 Case2 No 81 1 2.9 Yes Yes No 0.767 Note. SUI, stress urinary incontinence.
下载: 导出CSV
-
[1] Lamerton TJ, Torquati L, Brown WJ. Overweight and obesity as major, modifiable risk factors for urinary incontinence in young to mid-aged women: a systematic review and meta-analysis. Obes Rev, 2018; 19, 1735−45. doi: 10.1111/obr.12756 [2] Gonzales AL, Barnes KL, Qualls CR, et al. Prevalence and treatment of postpartum stress urinary incontinence: a systematic review. Female Pelvic Med Reconstr Surg, 2021; 27, e139−45. doi: 10.1097/SPV.0000000000000866 [3] Wei DM, Meng J, Zhang YT, et al. Identification of potential associated factors for stress urinary incontinence in women: a retrospective study. Ann Transl Med, 2022; 10, 965. doi: 10.21037/atm-22-3539 [4] Cartwright R, Kirby AC, Tikkinen KAO, et al. Systematic review and metaanalysis of genetic association studies of urinary symptoms and prolapse in women. Am J Obstet Gynecol, 2015; 212, 199.e1−24. doi: 10.1016/j.ajog.2014.08.005 [5] Xu CC, Guo Y, Chi XL, et al. Establishment and validation of a simple nomogram for predicting early postpartum stress urinary incontinence among women with vaginal delivery: a retrospective study. BMC Womens Health, 2023; 23, 8. doi: 10.1186/s12905-023-02160-2 [6] Zhang D, Gao L, Jia YY, et al. Construction of progress prediction model of urinary incontinence in elderly women: protocol for a multi-center, prospective cohort study. Int J Environ Res Public Health, 2022; 19, 734. doi: 10.3390/ijerph19020734 [7] Li YQ, Zhang QY, Sun BF, et al. Single-cell transcriptome profiling of the vaginal wall in women with severe anterior vaginal prolapse. Nat Commun, 2021; 12, 87. doi: 10.1038/s41467-020-20358-y -
 24066+Supplementary Materials.pdf

-

 点击查看大图
计量
- 文章访问数: 1151
- HTML全文浏览量: 449
- PDF下载量: 58
- 被引次数: 0

 Quick Links