

 下载:
下载:


-
The World Health Organization defines anemia as a condition of excessively low hemoglobin concentrations, with thresholds of < 130 g/L for men, < 120 g/L for non-pregnant women, and < 110 g/L for pregnant women. Hemoglobin levels can physiologically decrease by approximately 5 g/L during the second trimester of pregnancy[1]. Additionally, normal hemoglobin levels are influenced by factors such as age, race, and altitude[2]. Anemia is a common manifestation of hematological disorders and a complication of various chronic conditions such as chronic kidney disease, congestive heart failure, and malignant tumors[3]. The results of the Global Burden of Disease Study in 2021 indicated a global prevalence as high as 24% for anemia, affecting approximately 1.29 billion people worldwide[4]. Thus, anemia is a global health concern and a leading cause of morbidity in women.
Approximately 29% of non-pregnant women[5] and 36.8% of pregnant women[6] suffer from anemia globally, with both the prevalence and average severity of anemia being higher in women[7].Early active intervention can prevent the development of anemia and is the preferred method for controlling the prevalence of anemia[8]. Iron deficiency is the most common cause of anemia in women[9]. Iron deficiency anemia (IDA) is associated with a decline in cognitive ability[10], with symptoms including weakness, fatigue, anxiety, low mood or depression, decreased exercise tolerance, difficulty concentrating, and reduced work efficiency. These symptoms may be related to reduced oxygen transport due to anemia and decreased cellular oxidative capacity due to iron deficiency[11]. Severe IDA is associated with an increased risk of preterm birth, low birth weight infants[12], and increased maternal mortality[13,14] and may also lead to infections[15] and heart failure[16]. Although these studies primarily focused on iron-deficiency anemia, the harm exceeded that of non-anemia, supporting the primary role of anemia as a risk factor for adverse outcomes. Increasing evidence suggests that preoperative anemia is associated with a higher risk of complications, longer hospital stays, blood transfusion requirements, and mortality[17–20]. Women have a higher probability of perioperative blood transfusion[21]. Therefore, early identification and timely intervention for patients with mild anemia to prevent progression to moderate or severe anemia are important for improving the quality of life and public health of women.
Complete blood cell examination is the gold standard for diagnosing anemia. Accurate acquisition of hemoglobin level information is crucial in determining anemia in women and reducing the prevalence of severe anemia[22]. Obtaining blood samples requires invasive puncture procedures that require professional medical personnel and specialized detection equipment[23]. Research indicates that non-invasive hemoglobin measurement through the skin[24], fingertips[25], nail beds[26], or mucous membranes[27,28] can achieve a prediction accuracy rate as high as 96%. This not only reflects the clinical value of non-invasive anemia screening prediction models but also plays a positive role in reducing the discomfort associated with invasive blood collection and eliminating the risk of infection. Studies have shown that anemia is associated with pallor in certain parts of the body, such as the face, lips, and conjunctiva[29]. As a part of the skin, the largest organ of the human body, the face can reflect physiological and pathological information through changes in its color and texture[24,30]. The surface of the tongue is covered by mucosa, and the color characteristics of this anatomical site mainly originate from blood, with minimal interference from confounding chromophores such as melanin. These two collection sites complemented each other. The easily accessible sampling site and simple sampling method met the need for rapid and large-scale anemia screening in high-risk populations (such as children and pregnant women) and the general public on the one hand. However, the advantages of non-invasiveness, low cost, and high accuracy have a positive impact on reducing the prevalence of anemia in remote areas where resources are relatively scarce. Therefore, changes in facial and tongue features may be potential clinical markers for early screening of anemia risk.
As non-invasive and convenient health assessment methods, the importance of inspection and tongue diagnosis is increasingly prominent. They mainly provide valuable diagnostic clues to doctors by observing color and texture changes in the facial skin, tongue body, and tongue coating. With the rapid development of computer image processing technology, we are no longer limited to visual observation but can quantitatively describe and analyze facial and tongue features. Previous studies have shown that changes in mucosal color are closely related to the metabolism of hematological parameters[31,32], which provides a scientific basis for tongue inspection and diagnosis. In the wave of big data and artificial intelligence, machine learning technology has become the key to developing disease risk warning models based on tongue data. As an important branch of machine learning, deep learning can automatically extract low-level features from images and convert them into high-level features by constructing a multilayer perceptron structure, thereby achieving precise capture of facial and tongue image features[33,34]. In this study, we fully leveraged the strengths of machine and deep learning to construct an early anemia risk-screening model for women, focusing on facial and tongue images. This model not only inherits the traditional advantages of inspection and tongue diagnosis but also incorporates the power of modern technology, making health assessments more precise and efficient. This study provides a new perspective and methodology for managing women's health.
This study aimed to identify the crucial features of facial and tongue images associated with anemia in a female population and to establish a screening model for anemia risk. The analysis was conducted from three perspectives: (1) Utilizing the TDAS v2.0 and FDAS tools, we extracted color and texture characteristics from facial and tongue images to analyze the differences in these features among female individuals with anemia, as well as the patterns of age-related changes. (2) By employing Least Absolute Shrinkage and Selection Operator (LASSO) regression for feature selection, we aimed to filter out facial and tongue parameters that were significantly associated with anemia. (3) Subsequently, anemia risk-screening models were established for female participants using both classic machine learning classification algorithms and deep learning algorithms for feature fusion modeling. The performance of the models derived from both methods was then evaluated.
-
Data were collected from January 10, 2019, to December 18, 2019, at the Physical Examination Center of Shu Guang Hospital affiliated to Shanghai University of Traditional Chinese Medicine. All participants provided written informed consent. The inclusion criteria were as follows: (1) female sex and (2) age between 20 and 49 years. The exclusion criteria were as follows: (1) facial makeup; (2) presence of liver failure, renal failure, severe infection, severe hematological disorders, or other conditions that could cause blood profile changes; (3) skin diseases affecting facial color, such as vitiligo, urticaria, and acne; (4) acute onset of acute or chronic diseases within 1 month prior to image acquisition; (5) history of blood donation or blood transfusion prior to image and blood acquisition; and (6) pregnancy or lactation. According to the data collection process, after the participants provided blood samples, a specially trained researcher captured images of their faces and tongues using the TFDA-1 tongue and face diagnosis instrument[35] developed by the Smart Diagnosis Technology Research Team at Shanghai University of Traditional Chinese Medicine. Two sets of facial and tongue images were captured for each participant, and quality control measures were implemented to ensure image quality. Demographic information of the participants included their sex, age, BMI, and blood pressure (Table 1).
Table 1. Basic Information of Subjects
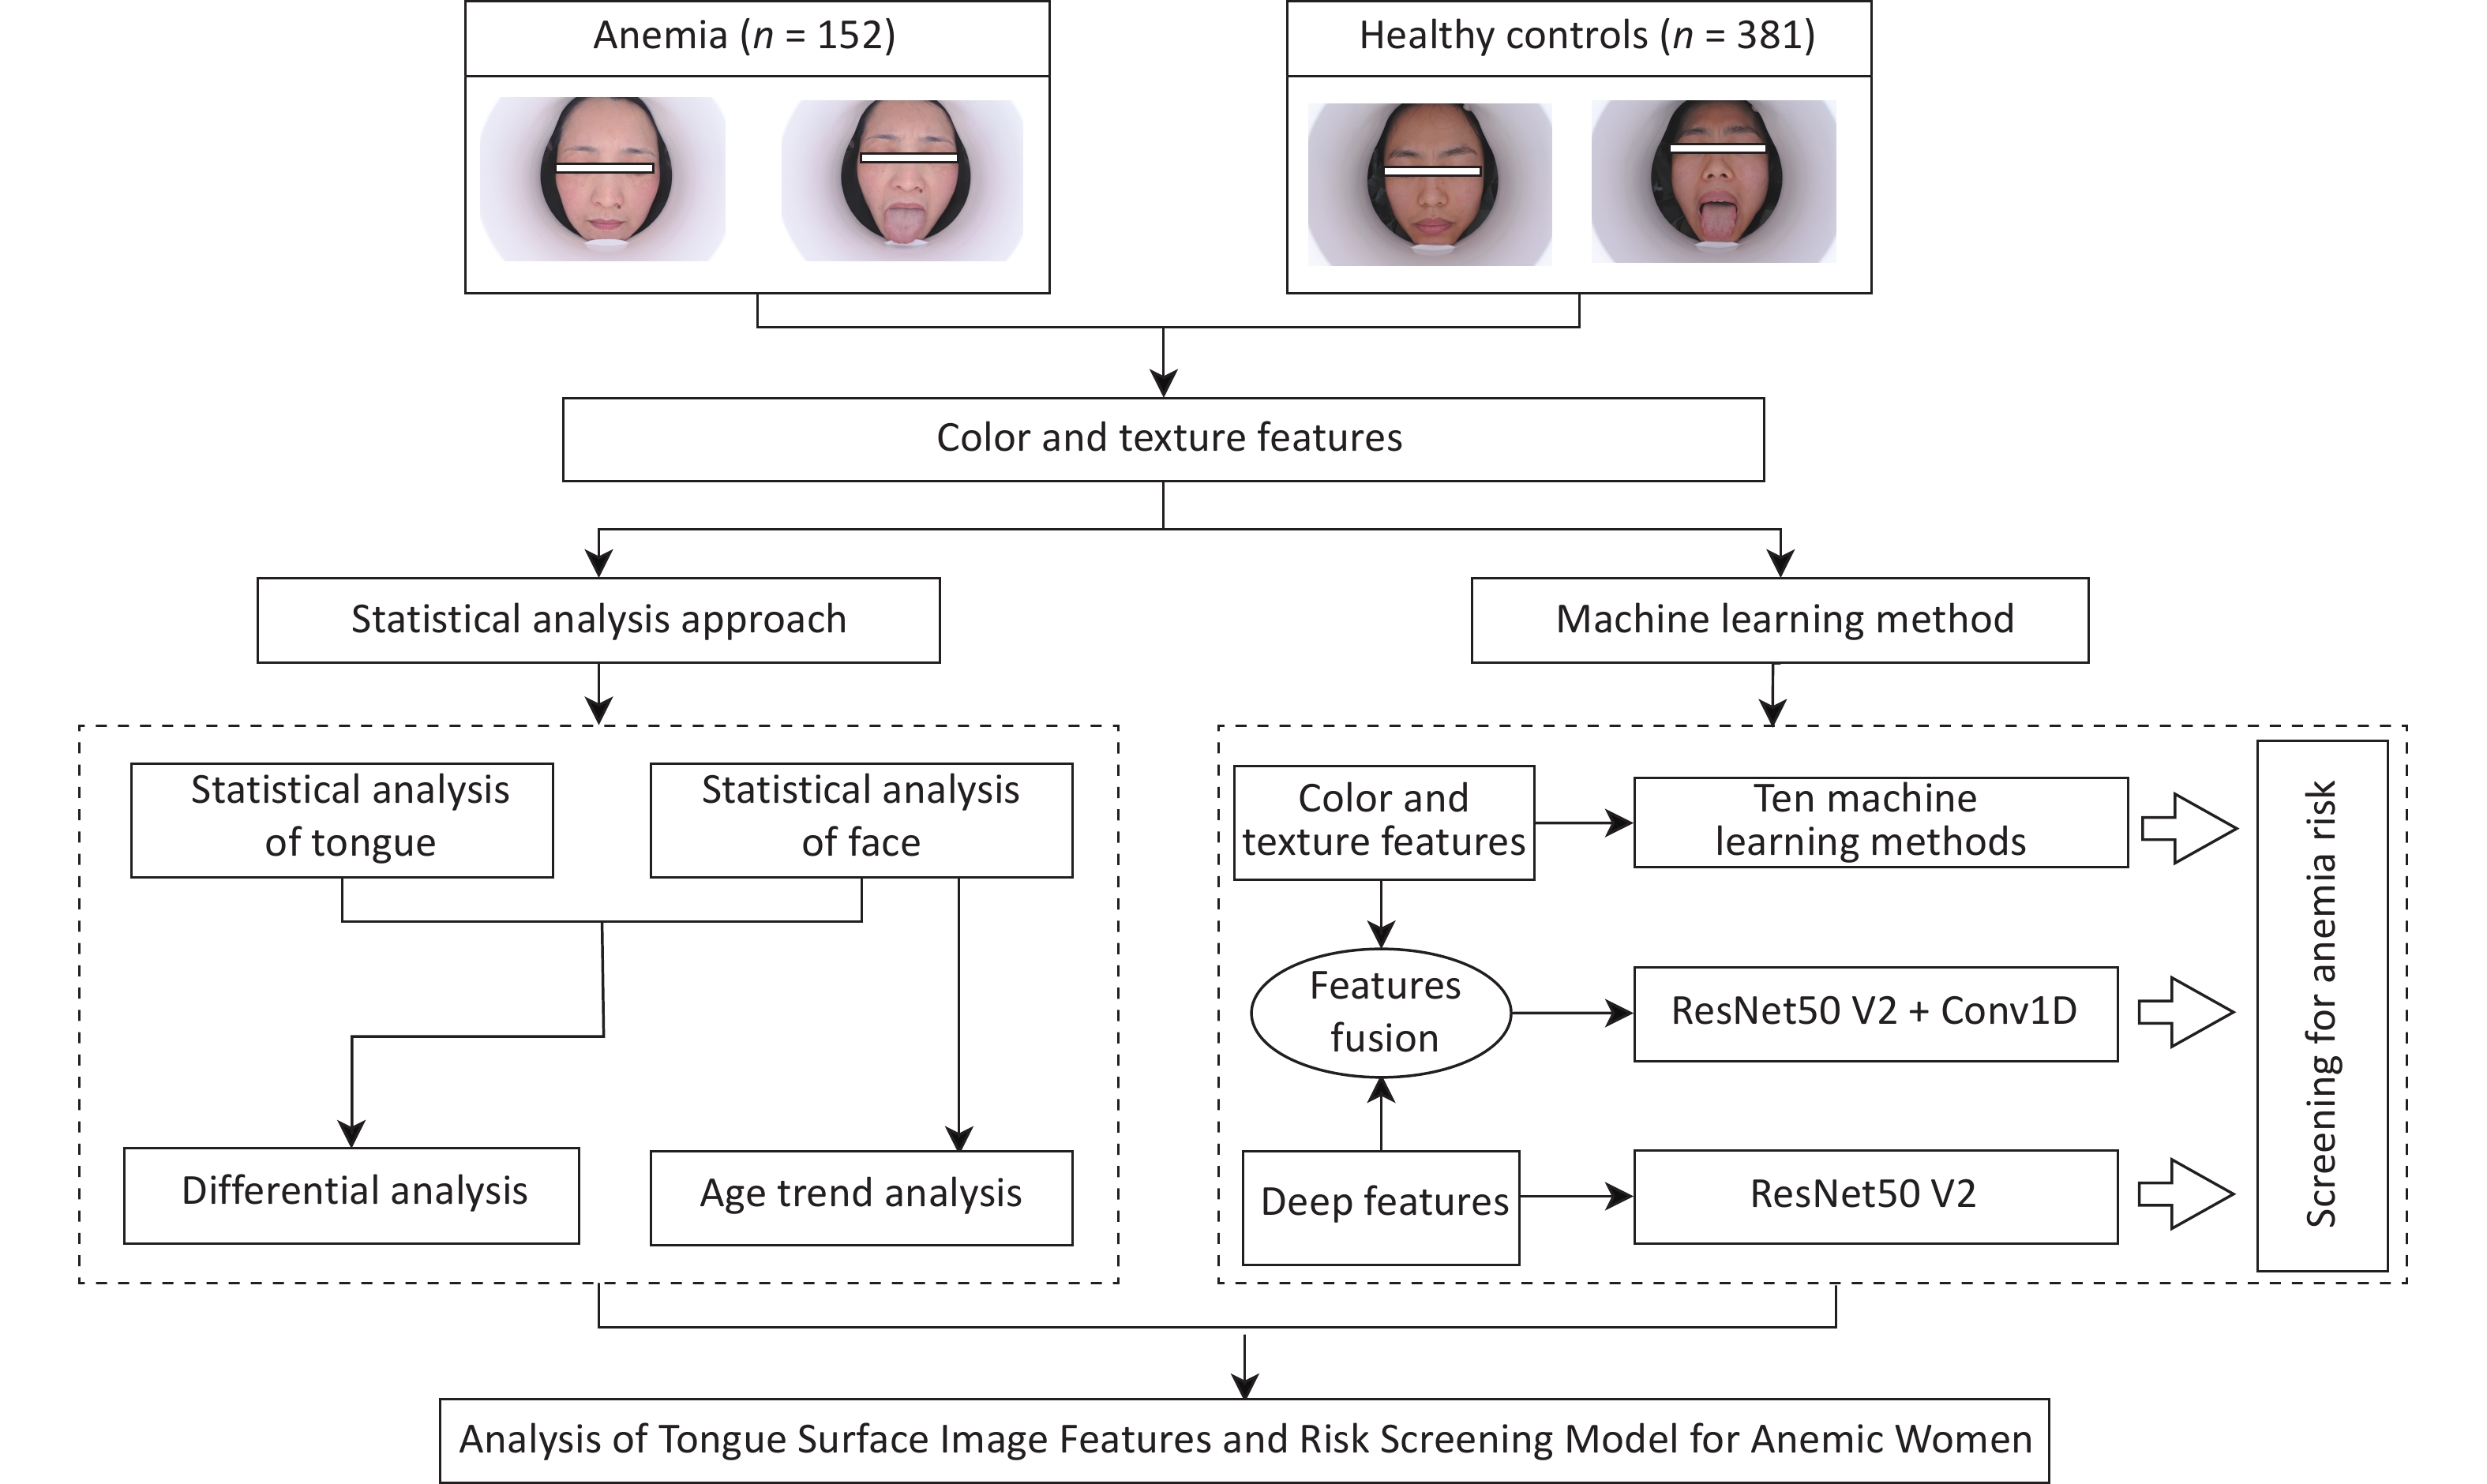
Anemia (n = 152) Healthy Controls (n = 381) Total χ2/t P age[n(%),year] 0.987 0.610 20−29 31 (20.4) 90 (23.6) 121 (22.7) 30−39 64 (42.1) 163 (42.8) 227 (42.6) 40−49 57 (37.5) 128 (33.6) 185 (34.7) BMI[x±s, Kg/m2] 22.289±3.061 22.105±3.117 0.651 0.515 SBP[x±s, mmHg] 114.868±12.151 112.976±12.603 1.581 0.115 DBP[x±s, mmHg] 71.263±9.244 71.457±8.358 −0.234 0.815 This study was reviewed and approved by the Ethics Committee of Shuguang Hospital affiliated to Shanghai University of Traditional Chinese Medicine (approval number: 2018-626-55-01). The workflow diagram is illustrated in Figure 1.

Figure 1. Workflow diagram.
-
Data were annotated based on the participants’ laboratory results, which were judged according to hemoglobin concentration. Anemia was diagnosed based on the “Multidisciplinary Expert Consensus on the Diagnosis, Treatment, and Prevention of Iron Deficiency and Iron Deficiency Anemia in 2022.” The threshold for anemia in Chinese women is hemoglobin level < 110 g/L[36]. In this study, researchers collected facial images, tongue images, and blood samples from the participants on the same day. If the participants’ hemoglobin level was < 110 g/L, they were considered to belong to the anemia group (label = 1). If the participants’ hemoglobin level was greater than or equal to 110 g/L, they are considered to be in the healthy control group (label = 0).
-
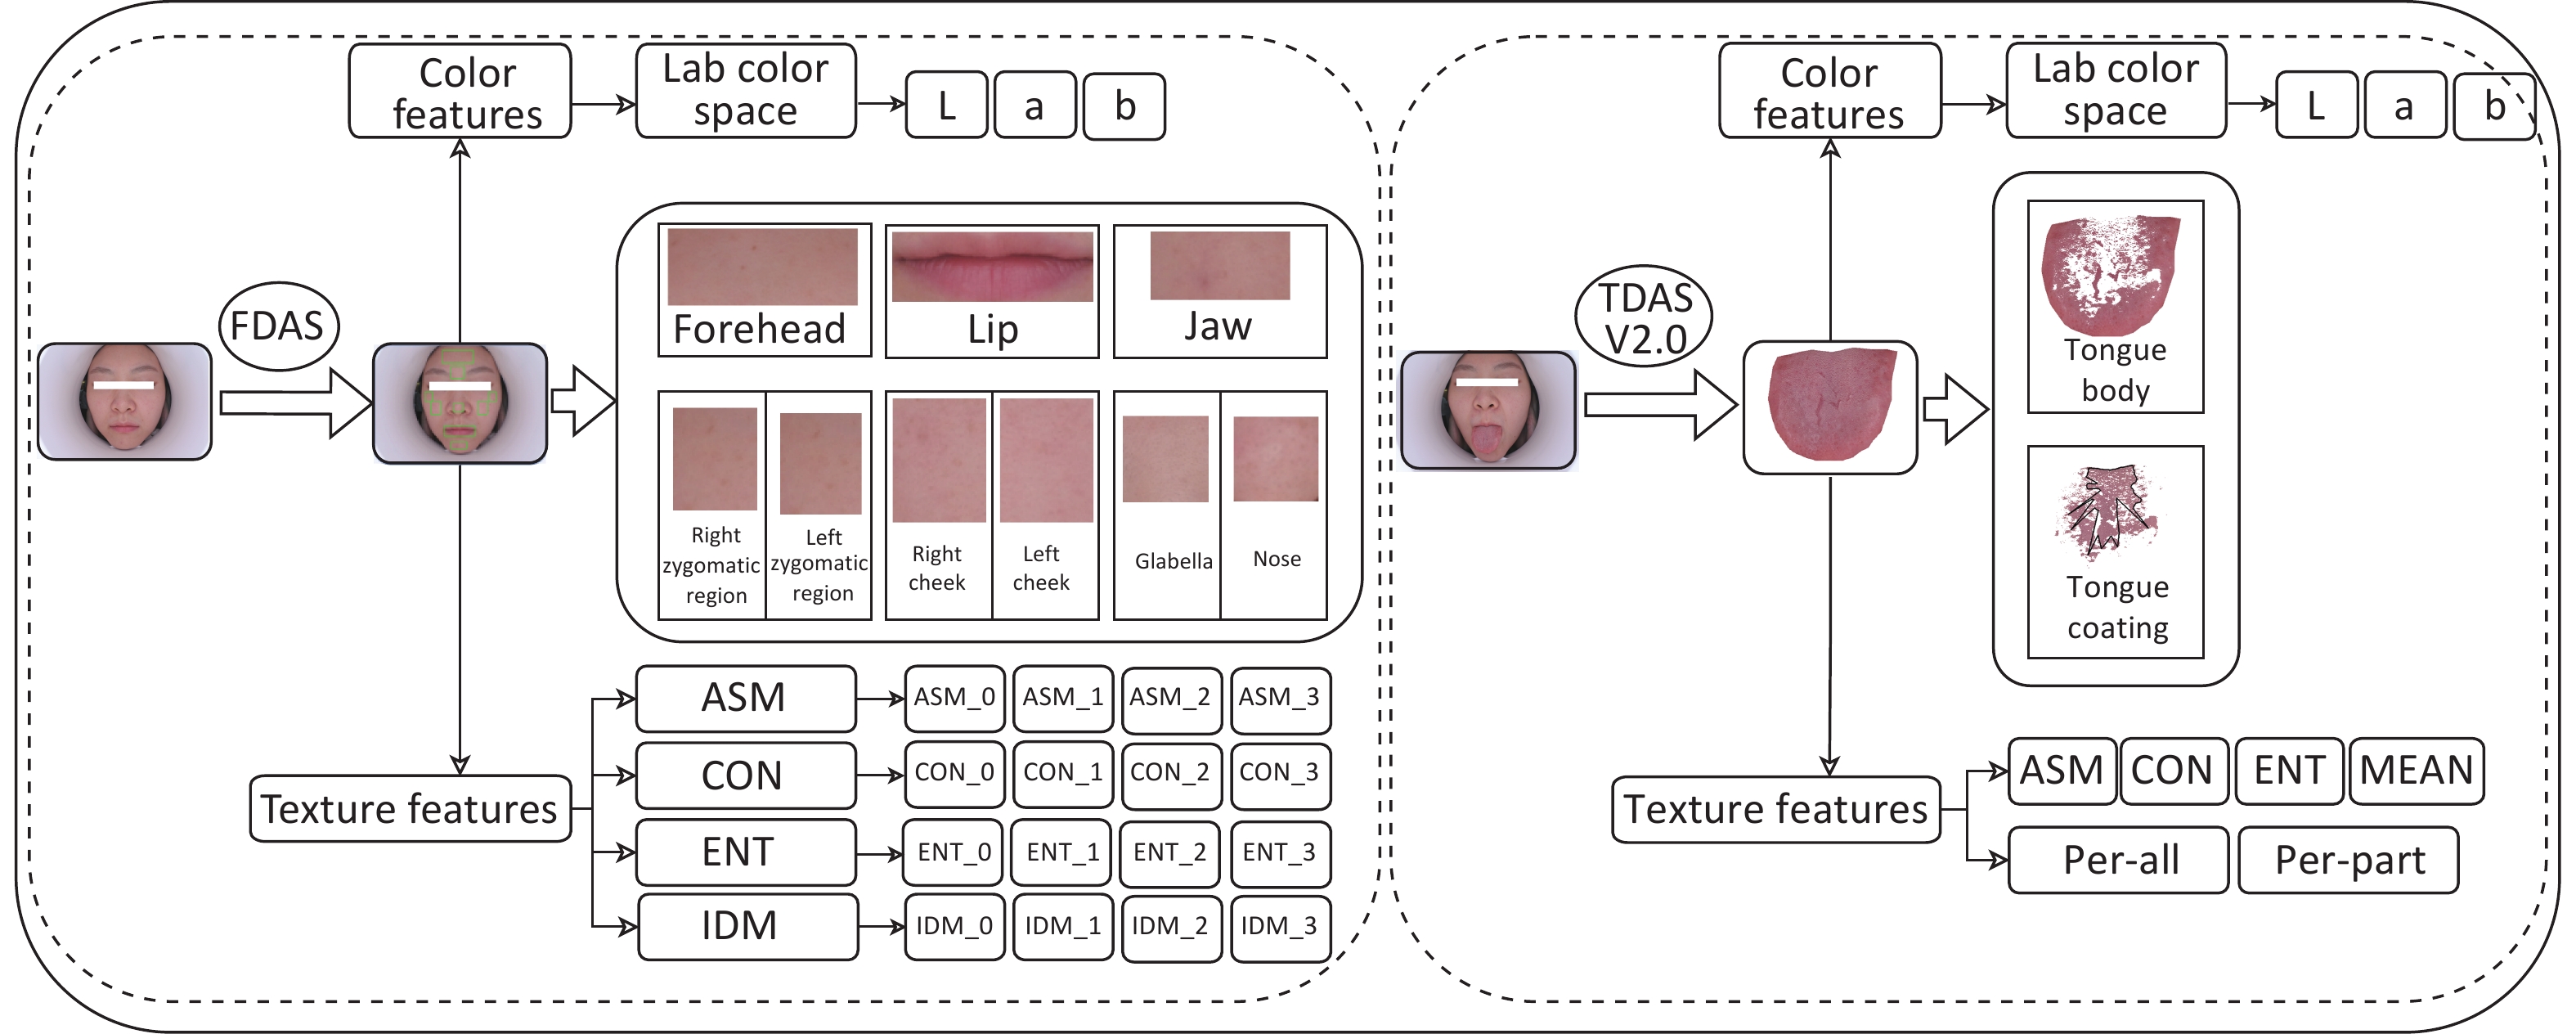
In this study, the color and texture features of the tongue body (TB) and tongue coating (TC) were extracted using Tongue Diagnosis Analysis System version 2.0 (TDAS v2.0), a tongue diagnosis analysis system developed by the Intelligent Diagnosis Technology Research Team at Shanghai University of Traditional Chinese Medicine (Figure 2). The color features were expressed using the Lab color space, where the L-value represents lightness, with a higher L-value indicating a brighter color. The a-value corresponds to the red-green axis, where a positive value indicates redness (higher values mean deeper red) and a negative value indicates greenness (lower values mean deeper green). The b-value pertains to the yellow-blue axis, where a positive value signifies yellowness (higher values indicate deeper yellow) and a negative value denotes blueness (lower values mean deeper blue). The color features included TB-L, TB-a, TB-b, TC-L, TC-a, and TC-b. Texture features included contrast (CON), angular second moment (ASM), entropy (ENT), and mean value (MEAN). Among them, the larger the values of texture features CON, ENT, and MEAN, and the smaller the ASM value, the rougher the tongue texture[37]. In addition, the tongue coating indices for all parts and for each part were calculated based on the pixel values. Facial color and texture features were extracted using Face Diagnosis Analysis System (FDAS) (Figure 2). The extraction range for the facial image indicators encompassed the entire face and nine specific facial areas. Based on the gray-level co-occurrence matrix (GLCM), certain feature quantities were extracted to describe the texture feature information of the facial image[38,39]. The feature quantities included ASM, CON, ENT, and inverse different moment (IDM). The facial color and tongue variables used in the analysis are shown in Supplementary Tables S1-S2. Statistical analysis was performed on the facial and tongue image features of the two groups.

Figure 2. Process of extracting the color and texture of face and tongue images using FDAS and TDAS V2.0.
-
Normally distributed quantitative data were presented as x±s to represent central and dispersion tendencies. Skew-distributed quantitative data were expressed as M(P25, P75) to represent the central and dispersion tendencies. If the comparison variables between the groups satisfied normality and homogeneity of variance, an independent sample t-test and one-way ANOVA were used. If the variables did not meet the criteria, the Mann–Whitney U test was used for comparisons between two groups, whereas the Kruskal–Wallis H test was used for comparisons among three groups, followed by pairwise comparisons. Categorical variables were presented as n (%), and comparisons among multiple categorical data classes were conducted using the χ² test. All statistical analyses were performed using SPSS version 27.0 (IBM Corp., Armonk, NY, USA), with statistical significance set at P < 0.05.
-
Not all of the aforementioned 62 facial and tongue imaging features are useful for predicting anemia because they contain redundant features. The selection of too many features increases the risk of overfitting. Therefore, it is crucial to reduce the dimensionality of facial and tongue image features and select indicators that are highly correlated with anemia. To achieve this, the LASSO regression method was employed for variable selection. This method introduces an L1 norm as a penalty constraint in the calculation to minimize the Residual Sum of Squares (RSS). When the penalty coefficient λ is sufficiently large, it can compress the coefficients to zero, effectively selecting the most relevant variables to the outcome and reducing the dimensionality of independent variables. This helped avoid the risks of collinearity and overfitting[40].
-
We employed ten machine learning methods: Logistic Regression (LG), Decision Tree (DT), Support Vector Machine (SVM), Random Forest (RF), K-nearest neighbors (KNN), Artificial Neural Network (ANN), naïve Bayes (NB), extreme Gradient Boosting (XGBoost), Light Gradient Boosting Machine (LightGBM), and Adaptive Boosting (AdBoost). The ratio of the training set to the test set was 7:3. Early anemia risk-screening models were established based on facial and tongue parameters filtered by LASSO. All machine learning models were constructed using Python software version 3.8.
-
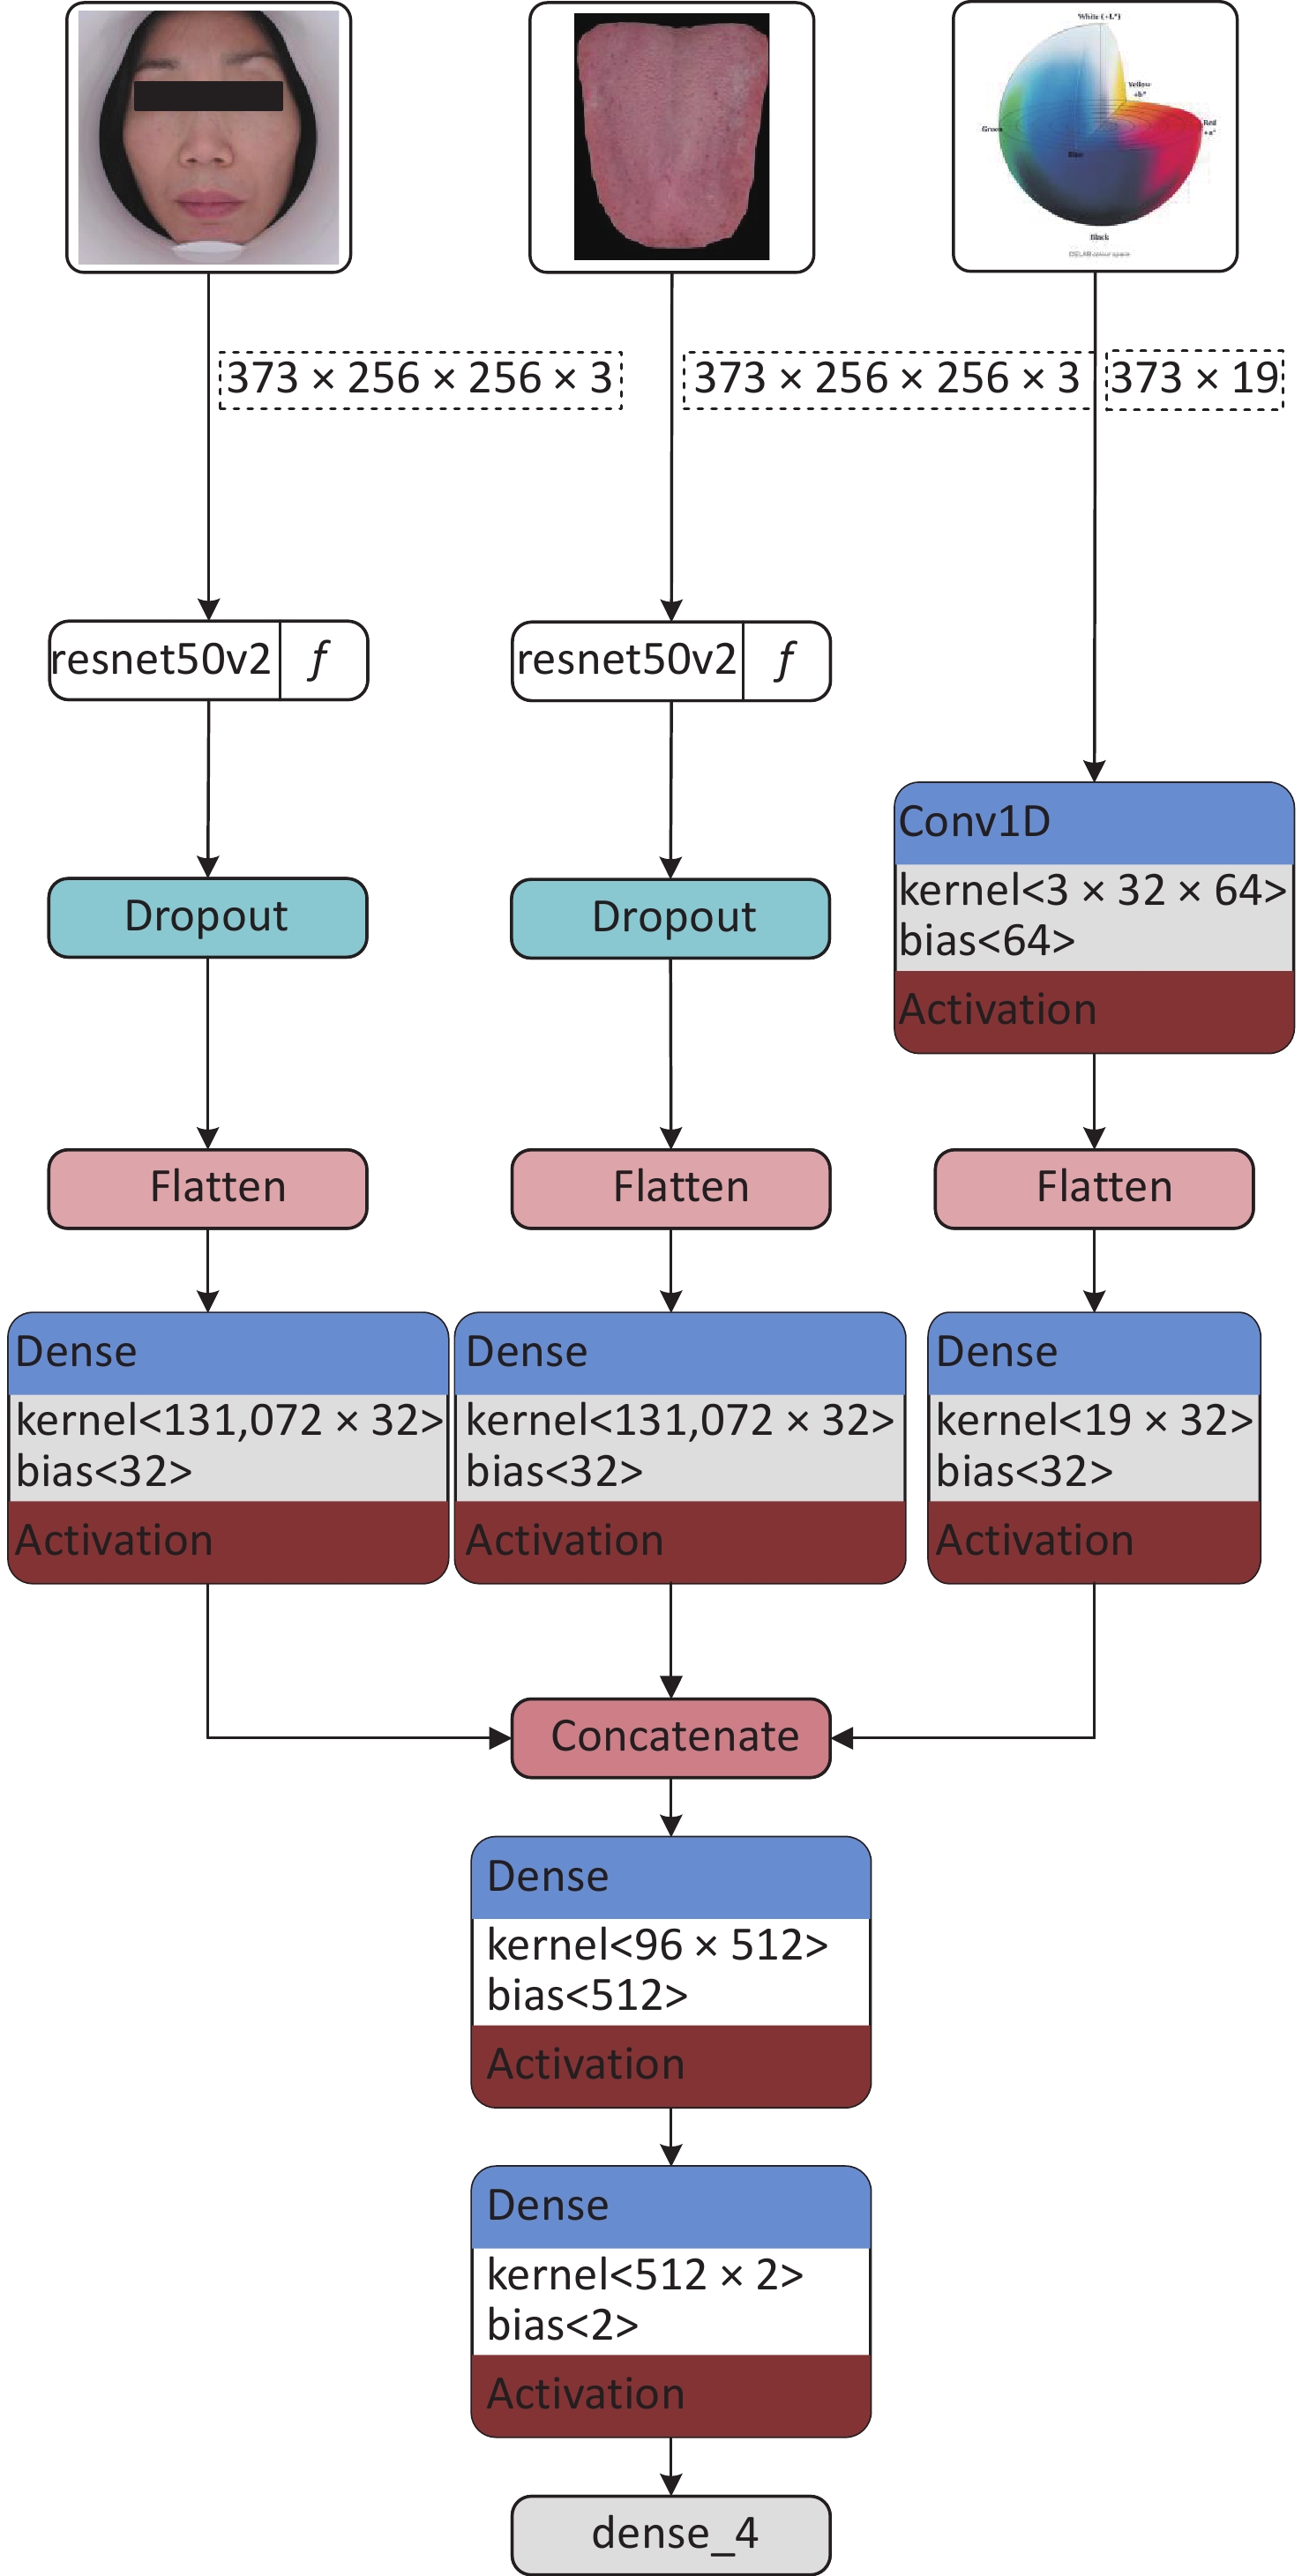
The anemia and healthy control groups were classified with ResNet as the primary deep learning structure. The ResNet50V2 model was used to extract features from facial and tongue images segmented using the TDAS software. The purpose of this step was to extract representative features from the images to support subsequent classification tasks. To fully utilize the color space information, researchers organized the color and texture features of faces and tongues after LASSO analysis into a one-dimensional array. These features, excluding the interference of multicollinearity, reflected the inherent differences between women with and without anemia in terms of facial and tongue color and texture. Conv1D was employed to extract core features from these color and texture characteristics, further identifying the most useful information for classification. Next, the image feature information extracted by the ResNet50V2 model was fused with the color-space features extracted by the Conv1D model. This step was achieved through a concat operation by fusing features from three dimensions at the feature level. This feature fusion method can fully utilize image, color, and texture information, thereby improving classification accuracy. Finally, a fully connected layer is used to complete the classification. The fully connected layer can map the previous feature fusion results to different classification labels, enabling decision making for classifying the anemia and healthy control groups. During the classification process, the softmax function was adopted as the activation function, which can output a probability value for each category indicating the likelihood of a sample belonging to that category. The implementation path of this model is illustrated in Figure 3.
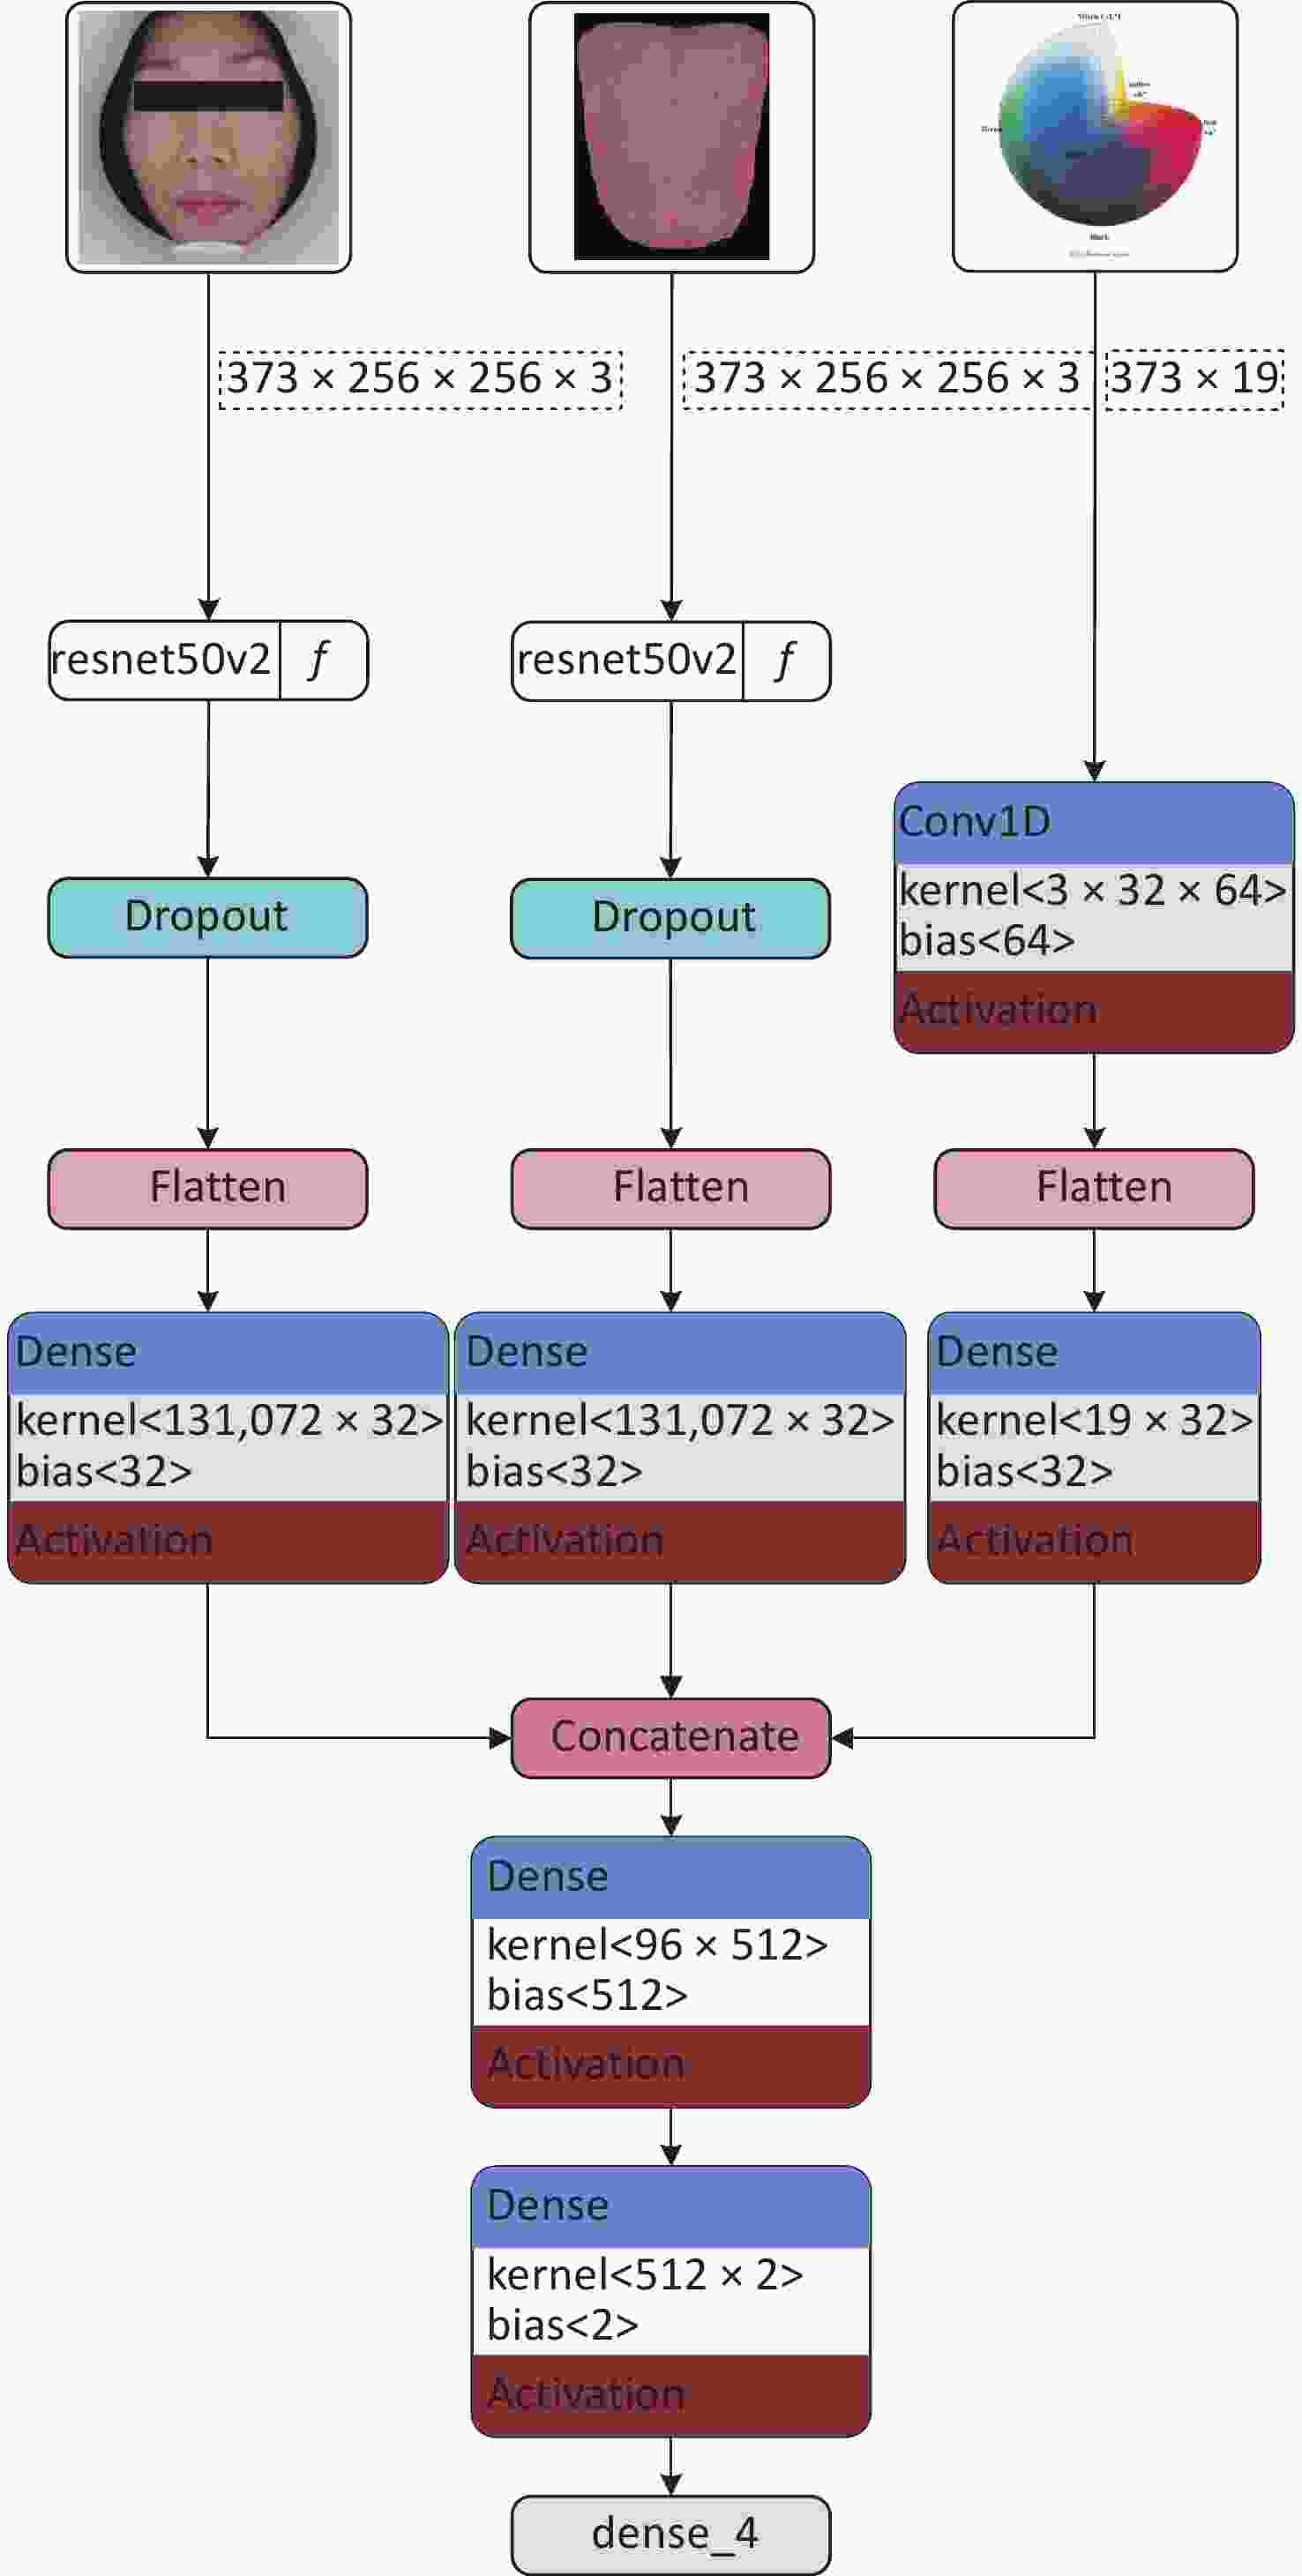
Figure 3. Structure diagram of fusion feature deep learning model.
-
The above parametric models were trained and tested, and the importance of the test set indicators in the different models was analyzed to select the optimal model. The anemia screening model was evaluated using the ROC curve, area under the ROC curve (AUROC), precision-recall (PR) curve, and Decision Curve Analysis (DCA). The ROC curve and AUROC can be used to directly assess the ability of the model to distinguish patients with anemia. A larger AUROC indicates better discriminatory power for the prediction model. The PR curve and the area under the PR curve (AP) can be used to comprehensively evaluate precision and recall and are sensitive to the prediction of positive events. They are often used to evaluate models when there are fewer positive events than when there are more negative events. DCA assesses the effectiveness of the prediction model in decision-making by quantifying the net benefit at different threshold probabilities[41].
-
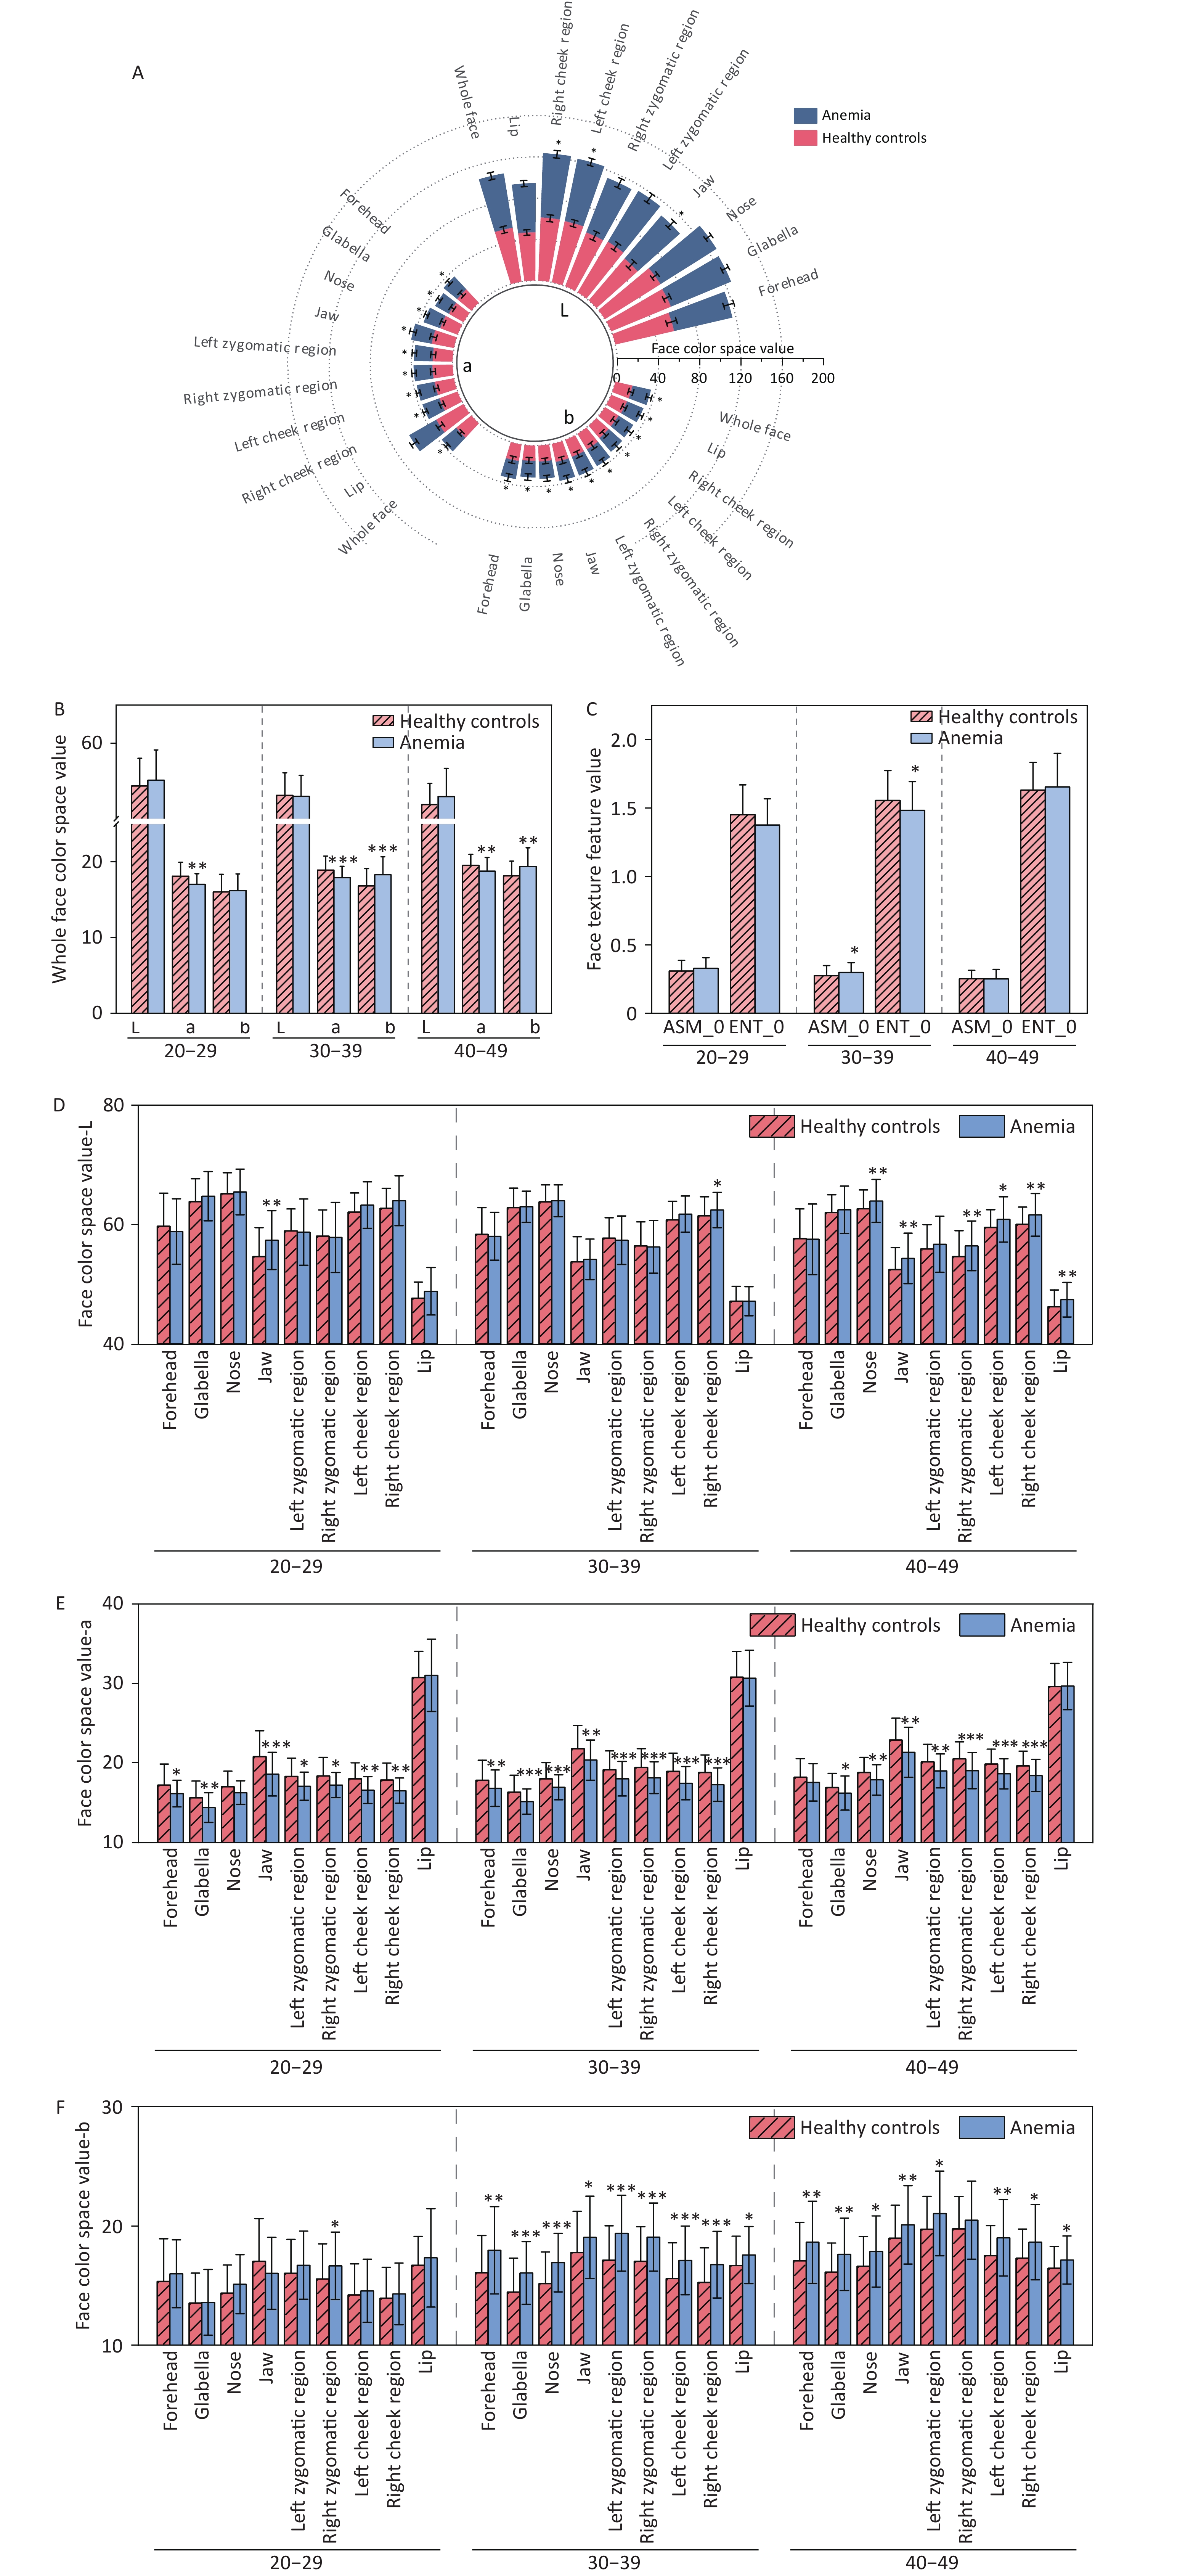
Comparison of facial complexion between the anemia and healthy control groups indicated differences in facial color and texture (P < 0.05). Specifically, with respect to color, the most significant differences in facial color between the two groups of participants were observed in terms of a-values and b-values. The a-values of the facial anemia group were lower than those of the healthy control group for different facial areas in individuals of the same age range. The b-values in the anemia group were higher than those in the healthy control group. No difference was observed in the L-values for the whole face; however, specifically in certain facial areas such as the right zygomatic region, cheek, nose, lips, and mandible, the L-values of the anemia group were higher than those of the healthy control group. Significant differences in facial texture were observed in the 30–39 age group. Specifically, ASM, which reflects the uniformity of image distribution and texture coarseness, was higher in the anemia group, whereas ENT, which reflects the complexity of image distribution, was lower in the anemia group. There was no difference in the a-value, which reflects the degree of redness, in the comparison of lips across different age groups. The statistical analysis results of facial data from the two groups are presented in Figure 4 and Supplementary Tables S3 and S4.
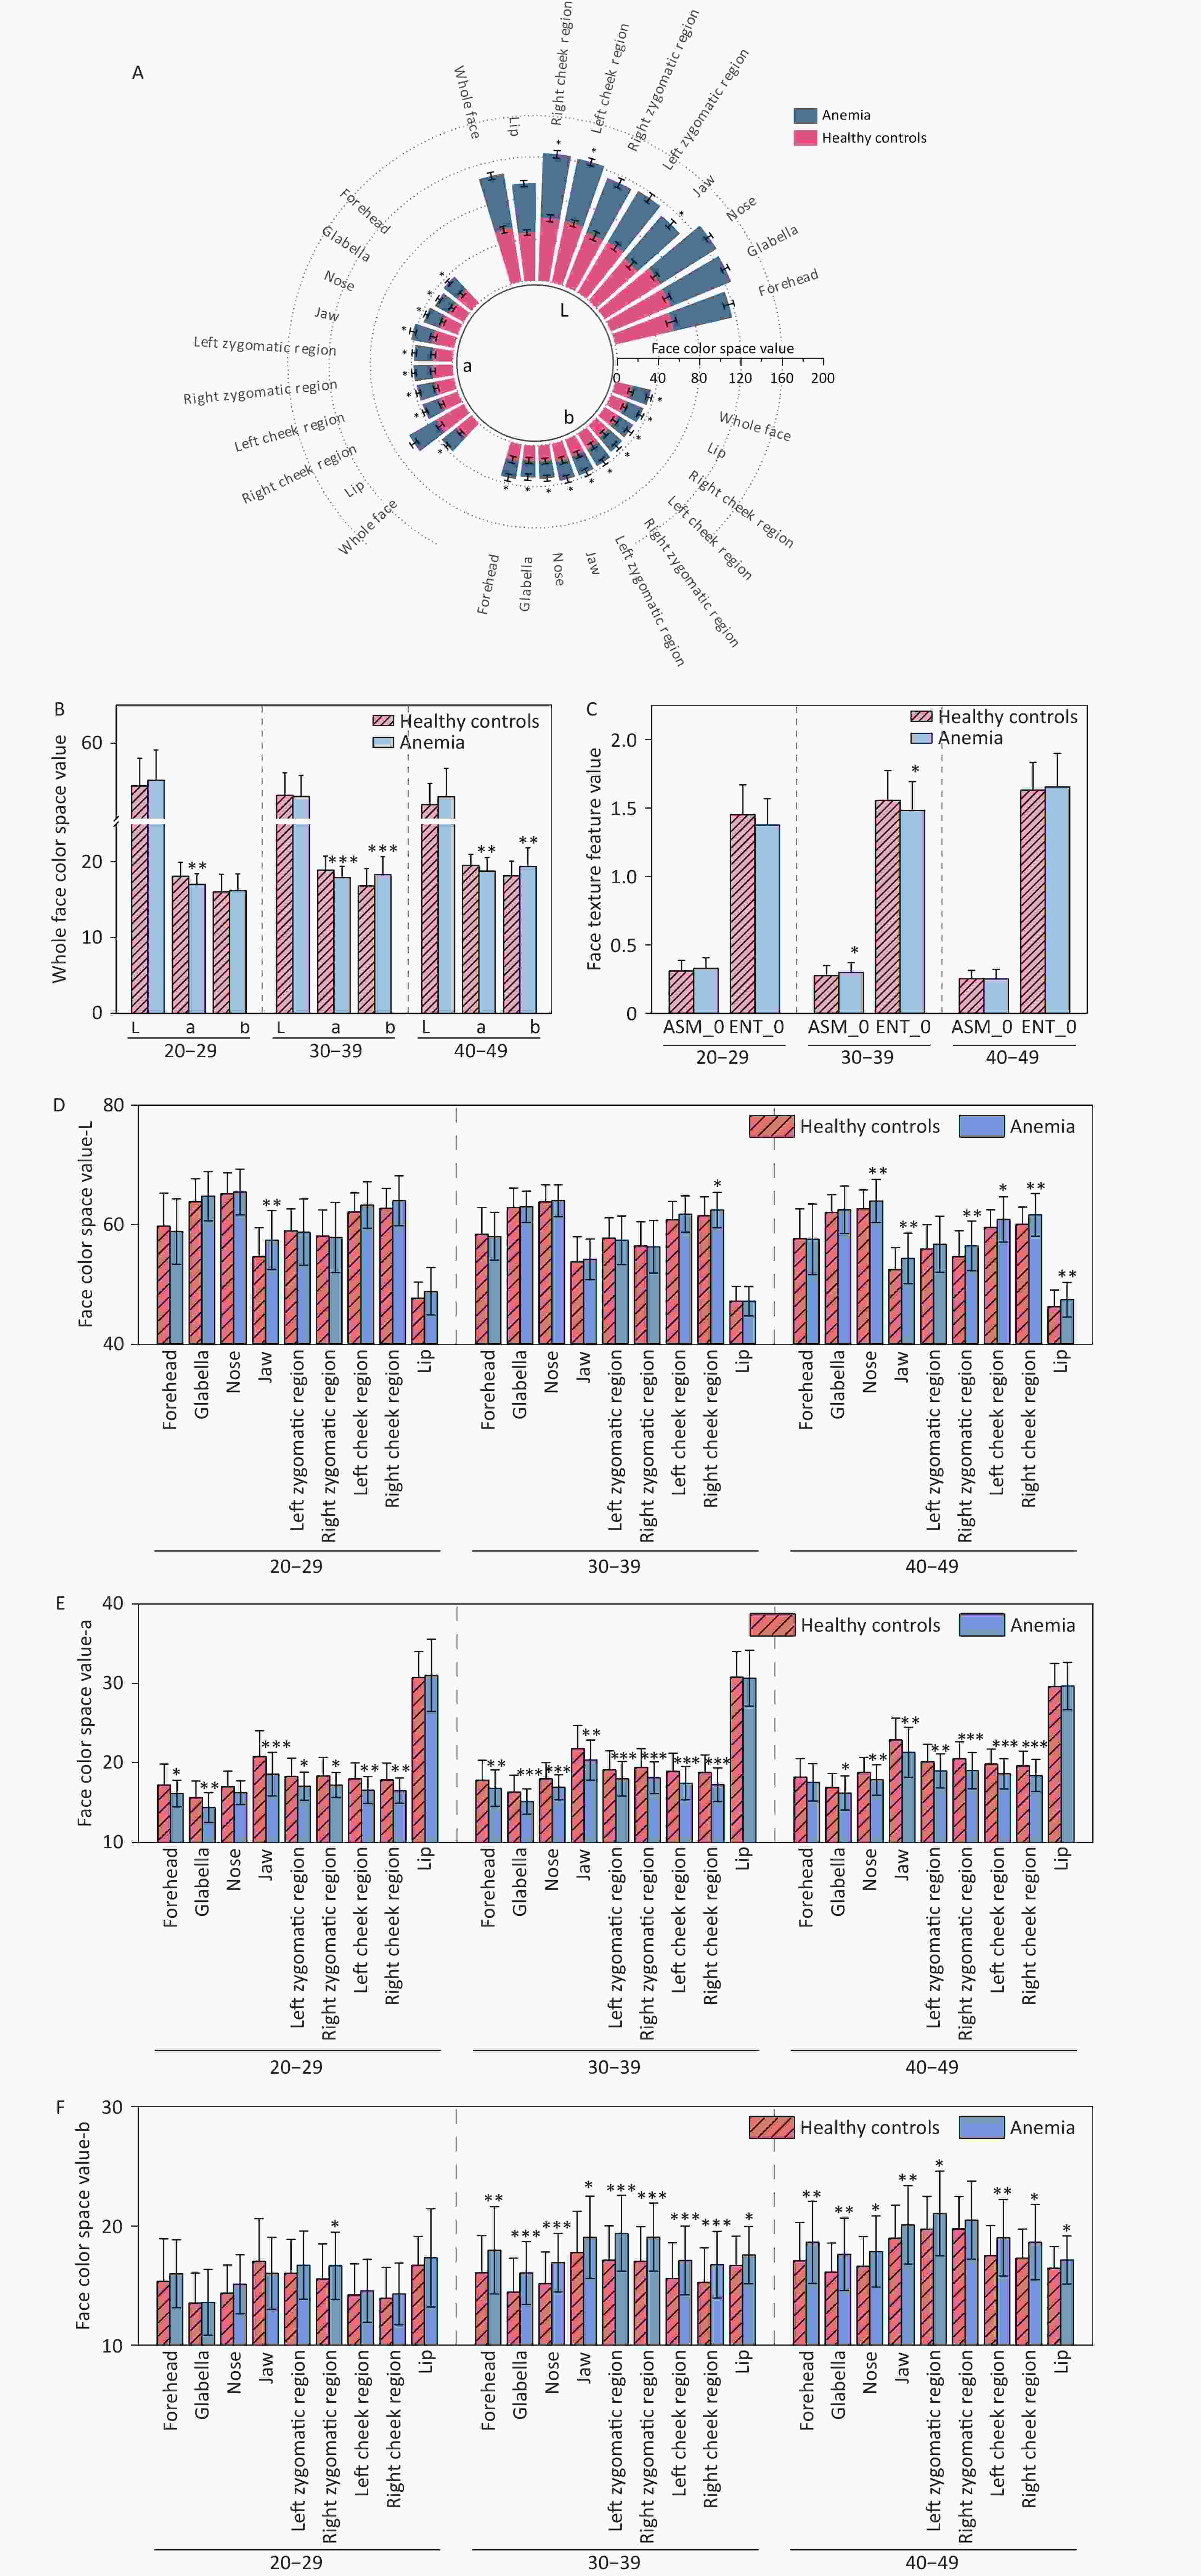
Figure 4. Comparison of facial image color and texture indices between two groups of participants. (A) Comparison of color indices between the healthy control group and the anemia group for the whole face and nine facial areas (without distinguishing age groups). (B) Comparison of color indices for the whole face (with age groups distinguished). (C) Comparison of texture indices for the whole face (taking ASM_0 and ENT_0 as examples). (D) Comparison of L-values across nine facial areas. (E) Comparison of a-values across nine facial areas. (F) Comparison of b-values across nine facial areas. The horizontal axis represents different indices, while "20–29," "30–39," and "40–49" indicate age ranges. The vertical axis represents color values and texture values. Compared with the healthy control, *P < 0.05; **P < 0.01; ***P < 0.001. ASM, angular second moment. ENT, entropy.
-
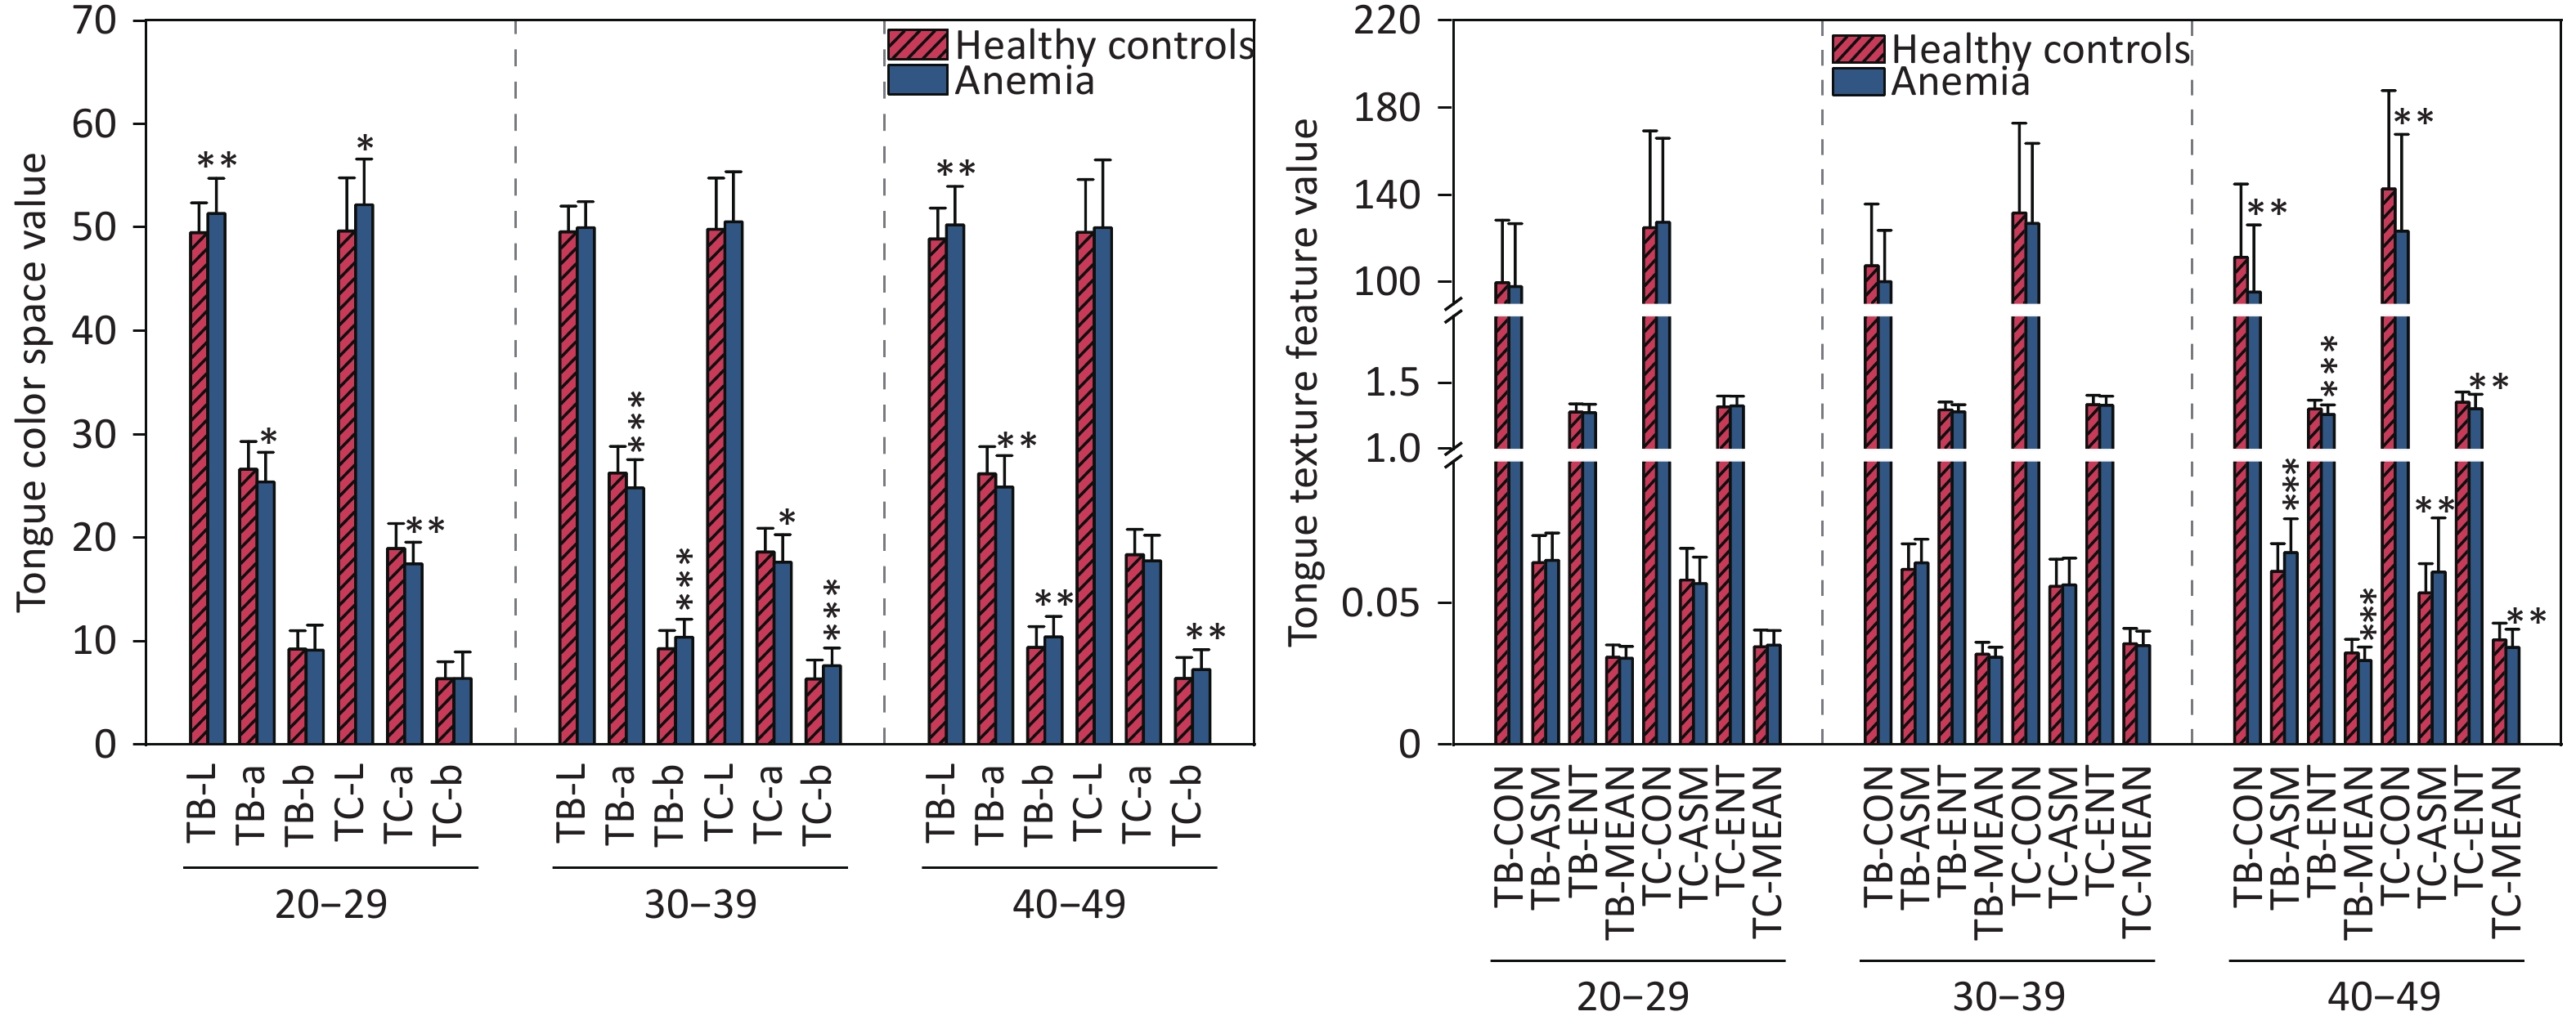
Comparison of tongue features between the anemia and healthy control groups indicated significant differences in the color and texture of the tongue body and tongue coating (P < 0.05). With regard to color, the L-values of tongue quality and tongue coating in the anemia group across all age groups were greater than those in the healthy control group. The a-values of the anemia group were lower than those of the healthy control group, and the b-values of the anemia group were greater than those of the healthy control group. There were also differences in the texture characteristics of tongue quality and tongue coating in the 40–49-year age group, specifically manifested in the texture characteristics of TB-CON, TC-CON, TB-ENT, TC-ENT, TB-MEAN, and TC-MEAN, which were lower in the anemia group than in the healthy control group. TB-ASM and TC-ASM texture indicators were greater in the anemia group than in the healthy control group. No difference in par-All and per-Part was noted between the anemia group and the healthy control group. The statistical analysis results of tongue data from the two groups are presented in Figure 5 and Supplementary Table S5.
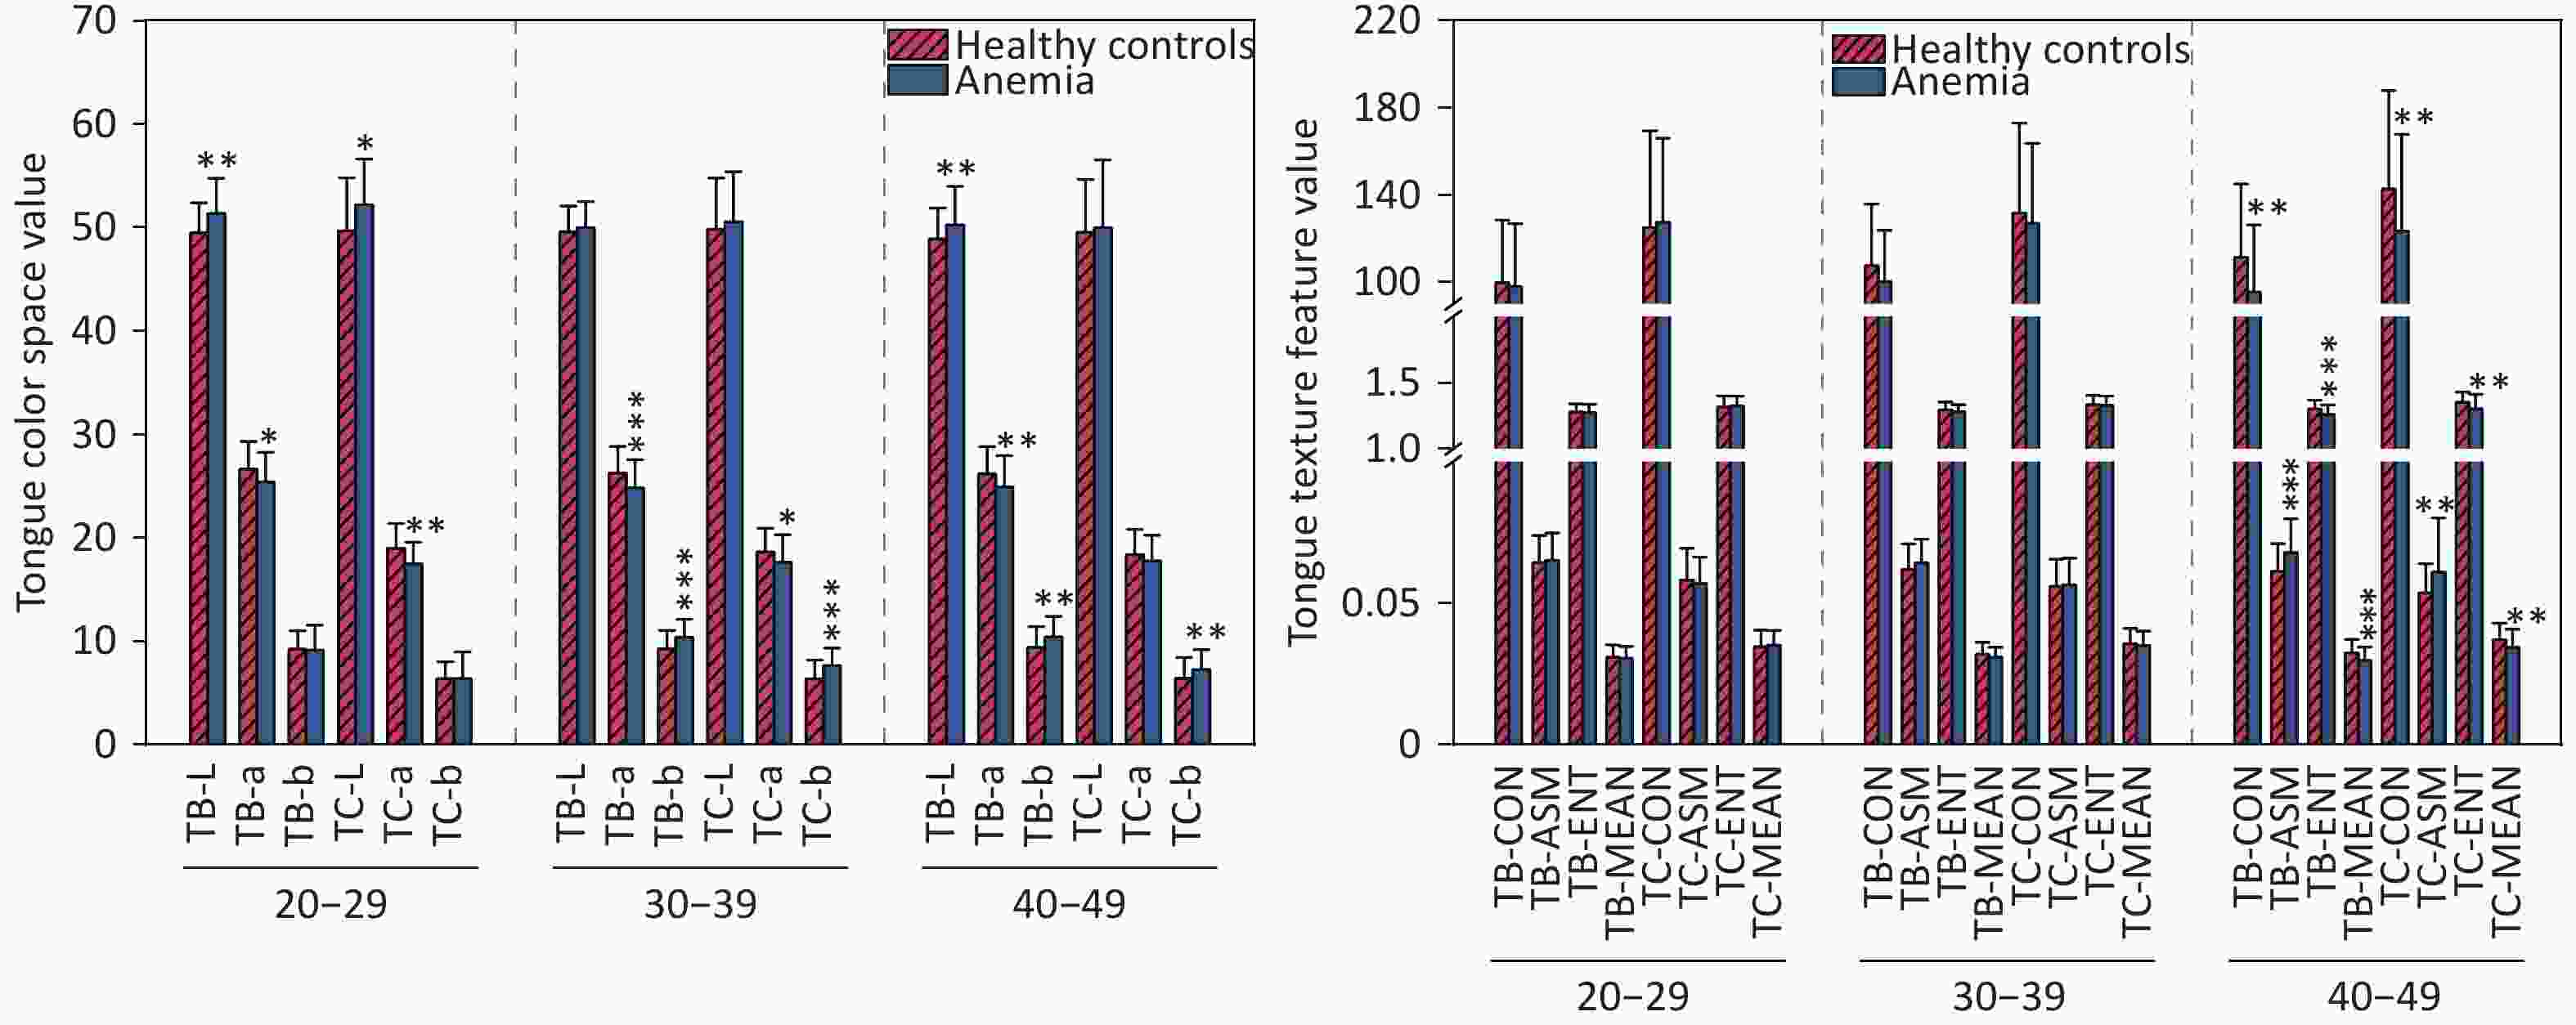
Figure 5. Compares the tongue image color and texture indicators between two groups of participants. (A) Lab color space indicators. (B) Texture indicators. The horizontal axis represents different indicators, with 20–29, 30–39, and 40–49 denoting age ranges. The vertical axis represents color values and texture values. Compared with the healthy controls, *P < 0.05; **P < 0.01; ***P < 0.001. TC, tongue coating. TB, tongue body. CON, contrast. ASM, angular second moment; ENT, entropy; MEAN, mean value.
-
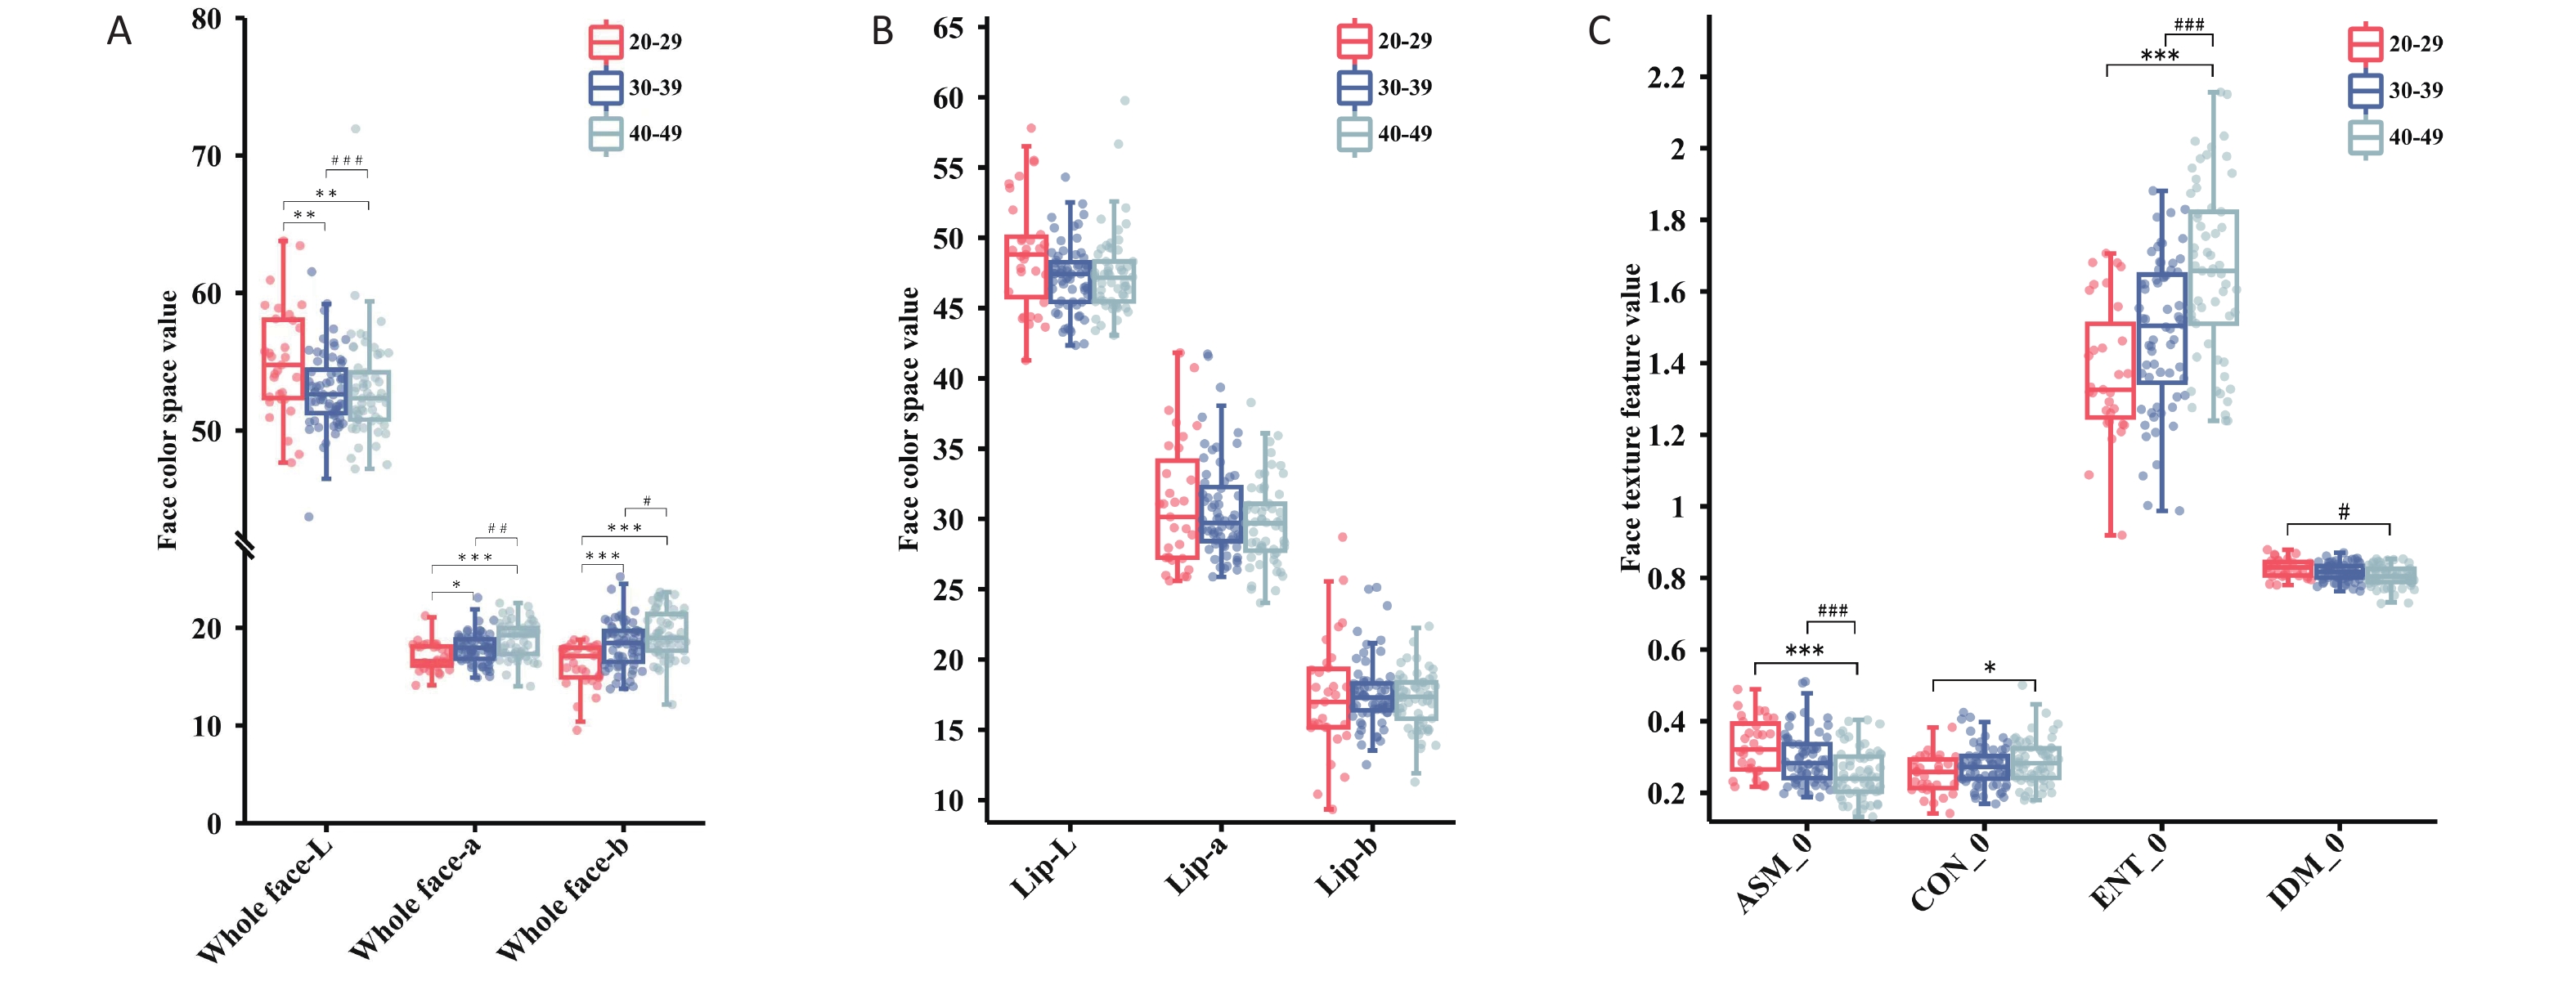
The trends in various indicators related to the face and lips of women with anemia changed differently with age. Specifically, for the overall facial area, as age increased, the L-value showed a downward trend, whereas the a- and b-values showed an upward trend (P < 0.05). However, the a-value of lip color decreased with age (P > 0.05). The a-value of lip color was greater than the overall facial a-value across the different age groups, whereas the L-value was always lower than the overall facial L-value. For women with anemia, the facial texture indicators ASM and IDM showed a downward trend with increasing age, while the CON and ENT indicators showed an upward trend (P < 0.05). Statistical analysis results of age trends in color and texture indicators for the two sets of data are shown in Figure 6 and Supplementary Tables S6-S7.
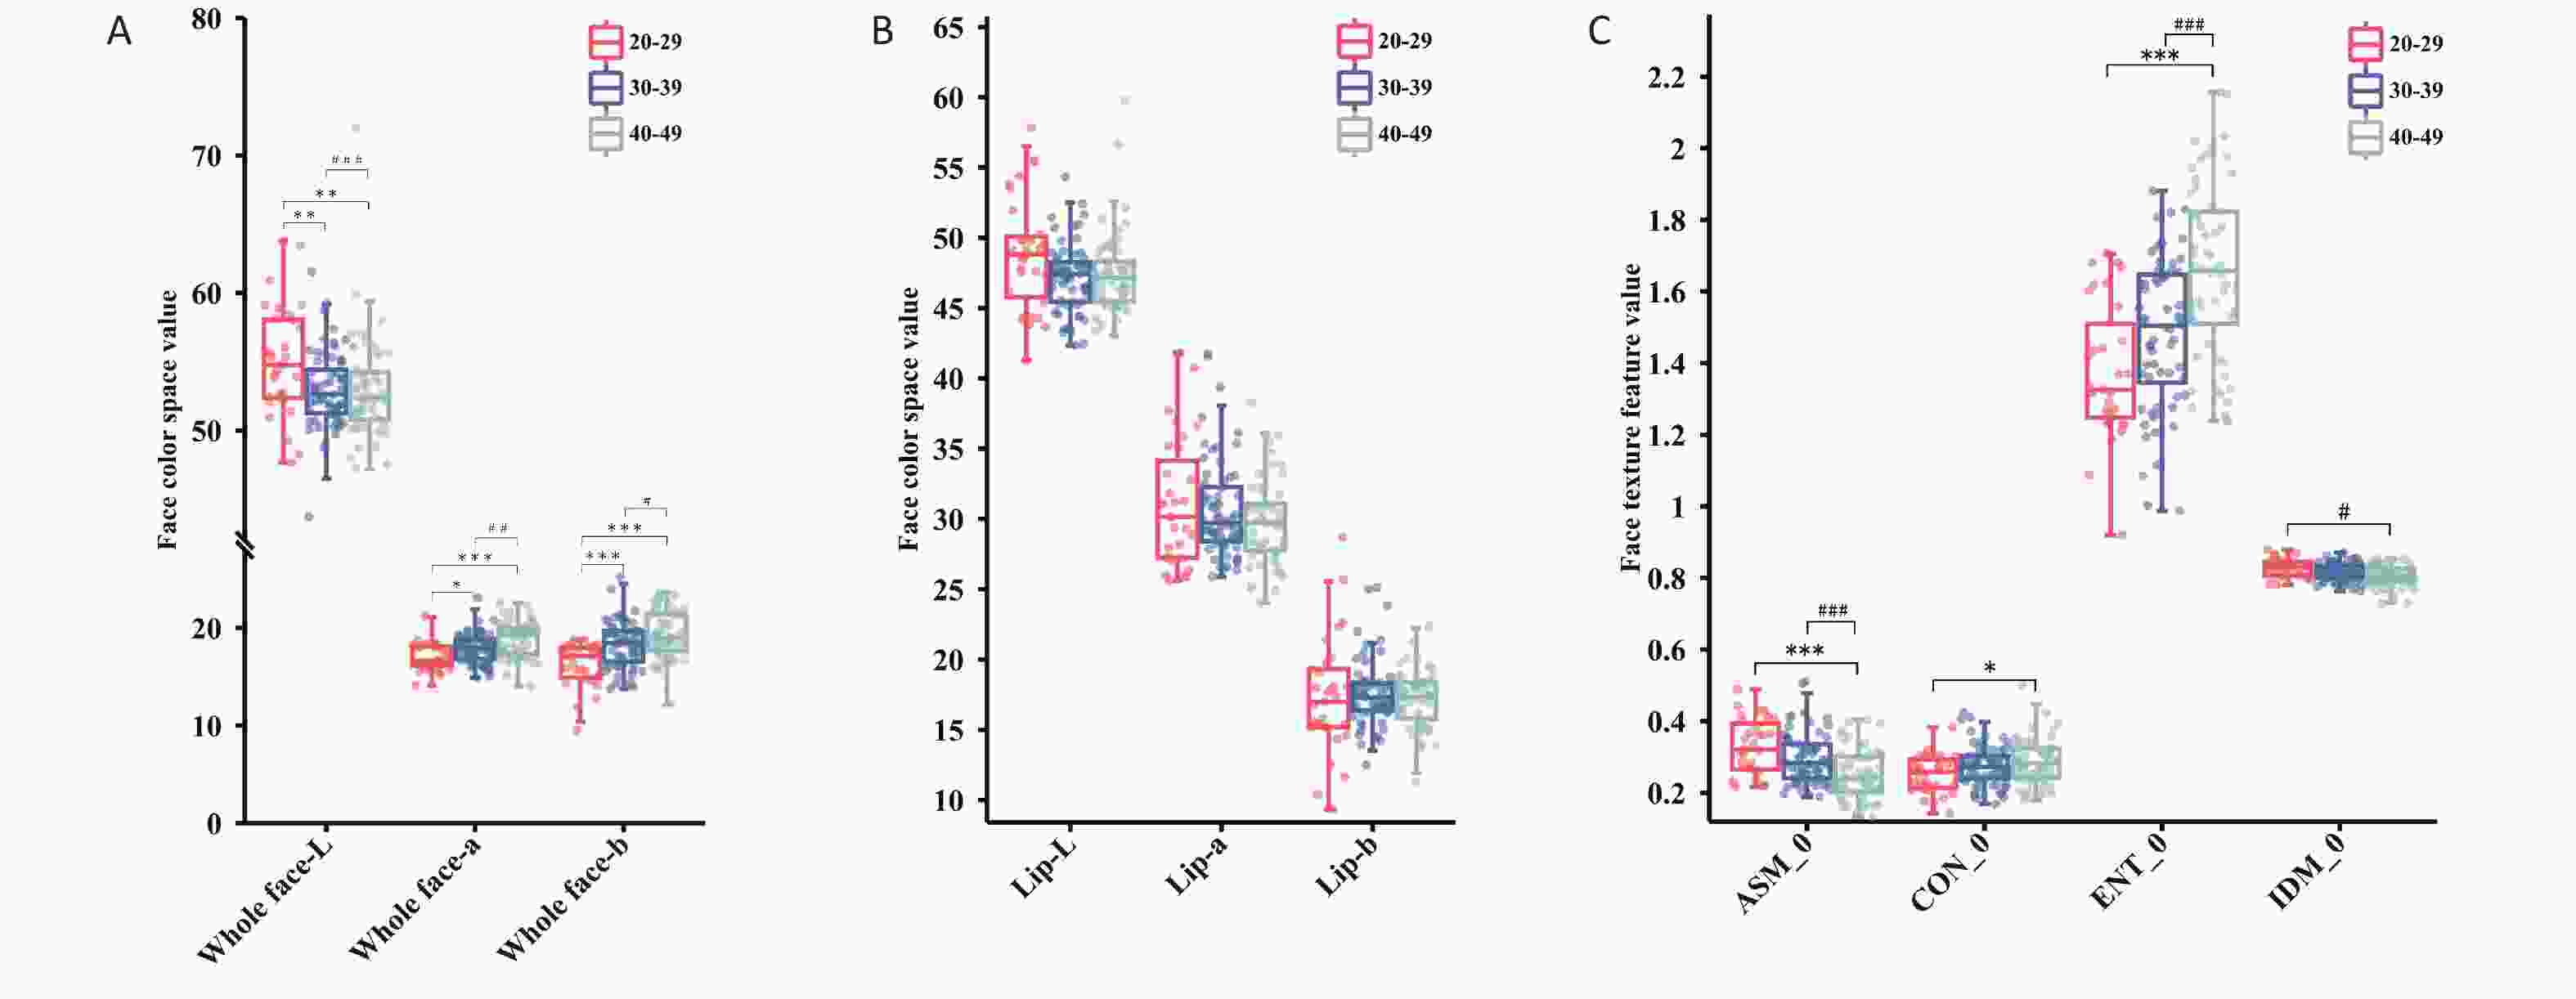
Figure 6. The trend changes in facial image color and texture indicators across different age groups for female anemia patients. (A) Full-face color indicators. (B) Lip color indicators. (C) Facial texture indicators. Compared with the 20–29 age group, *P < 0.05; **P < 0.01; ***P < 0.001; Compared with the 30–39 age group, #P < 0.05; ##P < 0.01; ###P < 0.001. ASM, angular second moment; CON, contrast; ENT, entropy; IDM, inverse different moment.
-
LASSO regression was applied for feature selection on a high-dimensional dataset comprising 62 indicators encompassing the facial and tongue image metrics of the participants. The LASSO algorithm adjusts the model's complexity through the λ value, where a higher λ value results in greater variable compression, leading to a more streamlined model. As evident from Figure 7(a), as the Log(λ) parameter increases, the penalty imposed by LASSO gradually intensifies, causing a decrease in the number of selected variables. Furthermore, the coefficient values of the variables gradually converge as the Log(λ) parameter increases. This process is illustrated in Figure 7(b). The results show that after LASSO regression screening (λ = 0.015) of the 62 indicators, a total of 19 variables were identified as highly correlated with anemia. These variables were: total-a, total-b, lip-L, lip-b, foreh-b, glab-a, glab-b, jaw-a, lzyg-b, rzyg-a, lcheek-a, rcheek-a, nose-b, TC-a, TC-b, TB-L, TB-a, TB-ASM, and TB-MEAN.
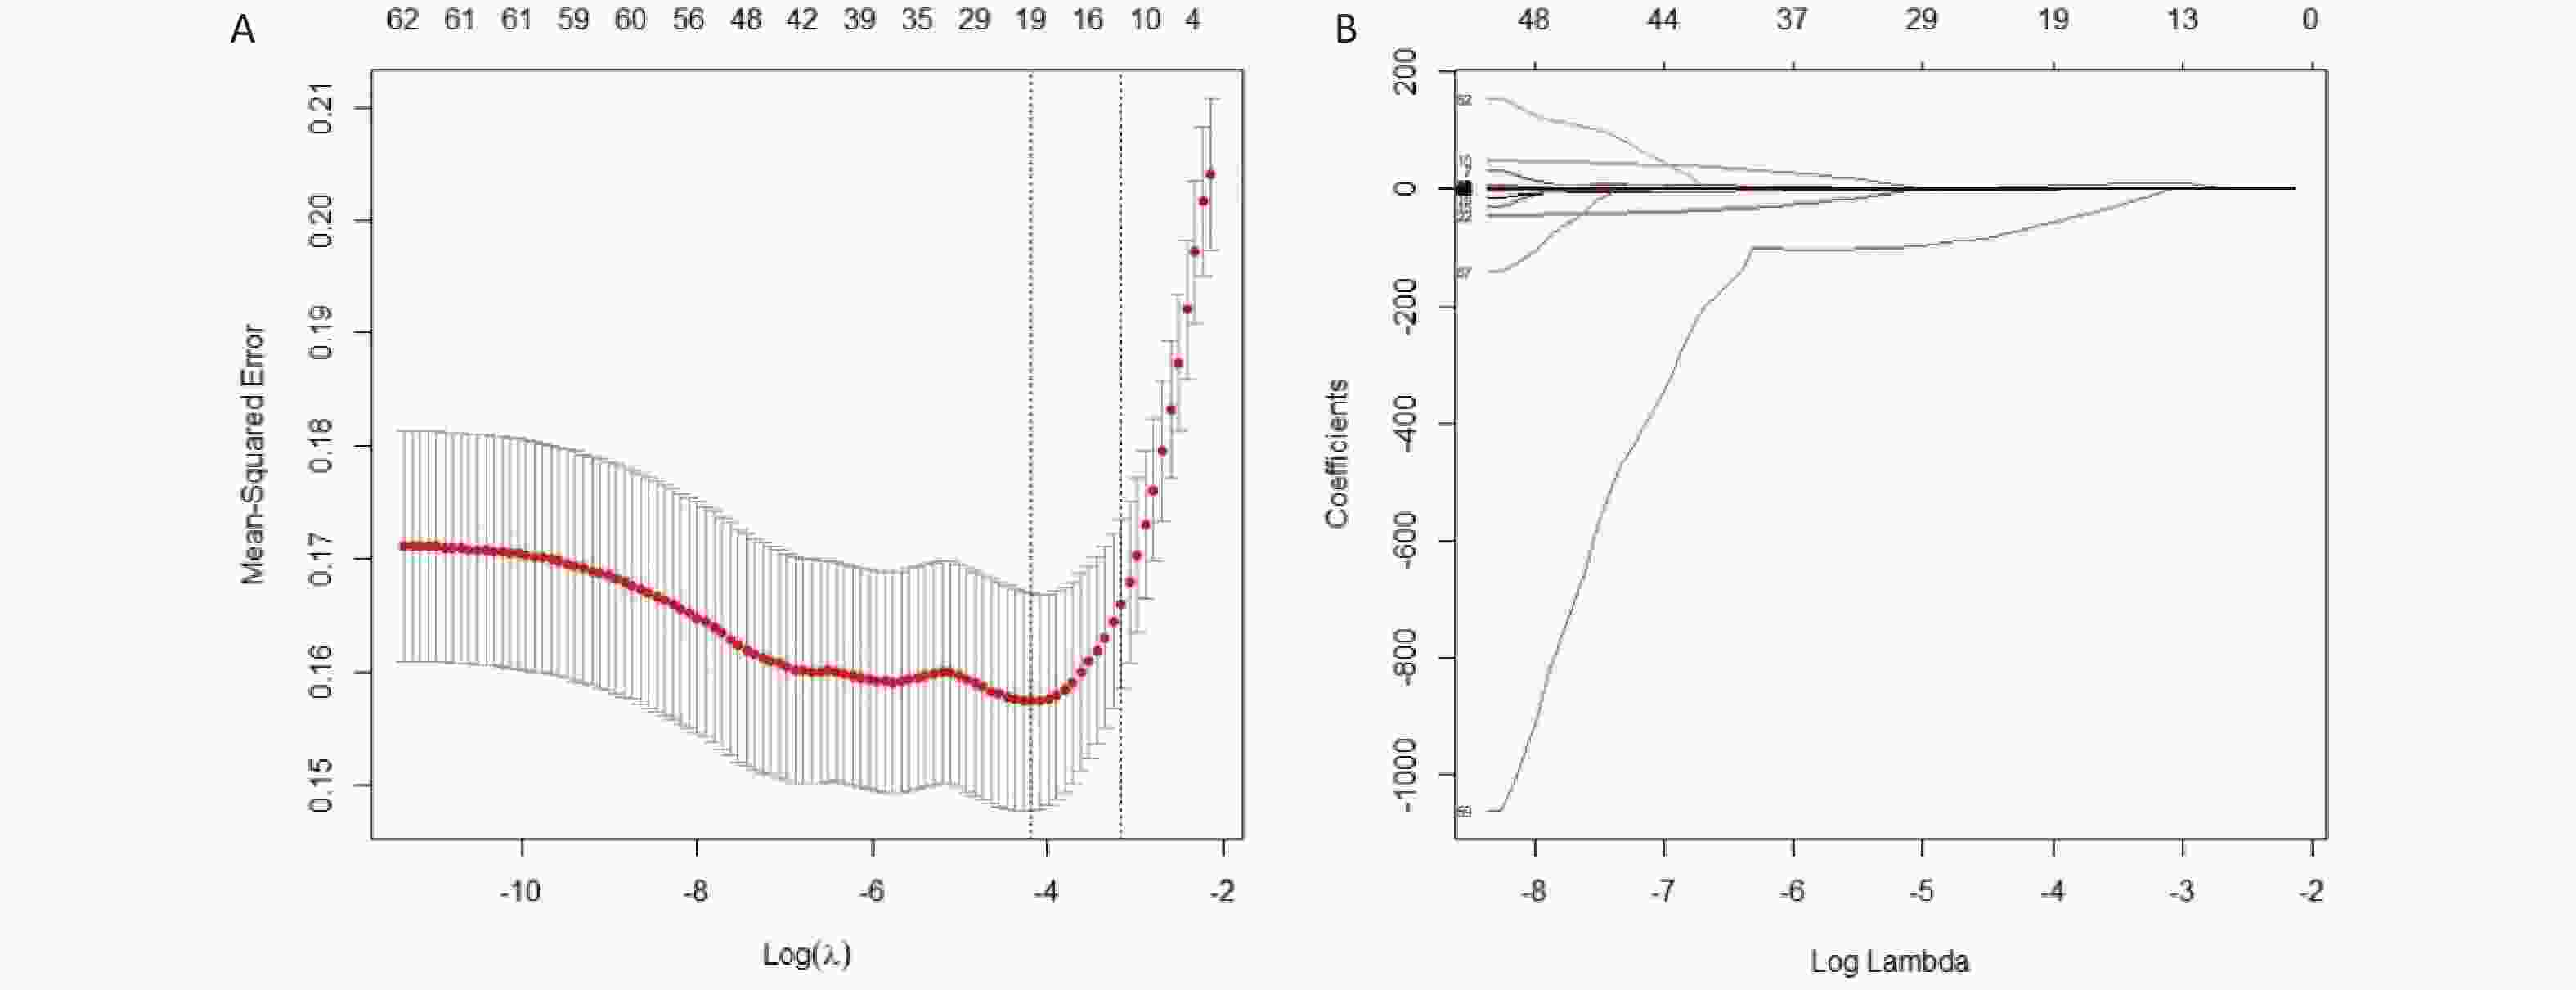
Figure 7. The results of variable selection using LASSO regression. (A) A plot of Log(λ) versus the number of selected variables. The vertical axis represents the minimum mean squared error, the upper horizontal axis indicates the number of predictor variables, and the lower horizontal axis corresponds to the Log(λ) value associated with the λ parameter. Vertical dashed lines are drawn at the points of minimum mean squared error (λ = 0.015) and the standard error of the minimum distance (λ = 0.043). (B) A plot of Log(λ) versus the coefficient values of the variables. The vertical axis shows the coefficient values of the predictor variables, the top horizontal axis indicates the number of predictor variables, and the bottom horizontal axis corresponds to the Log(λ) associated with the λ parameter.
-
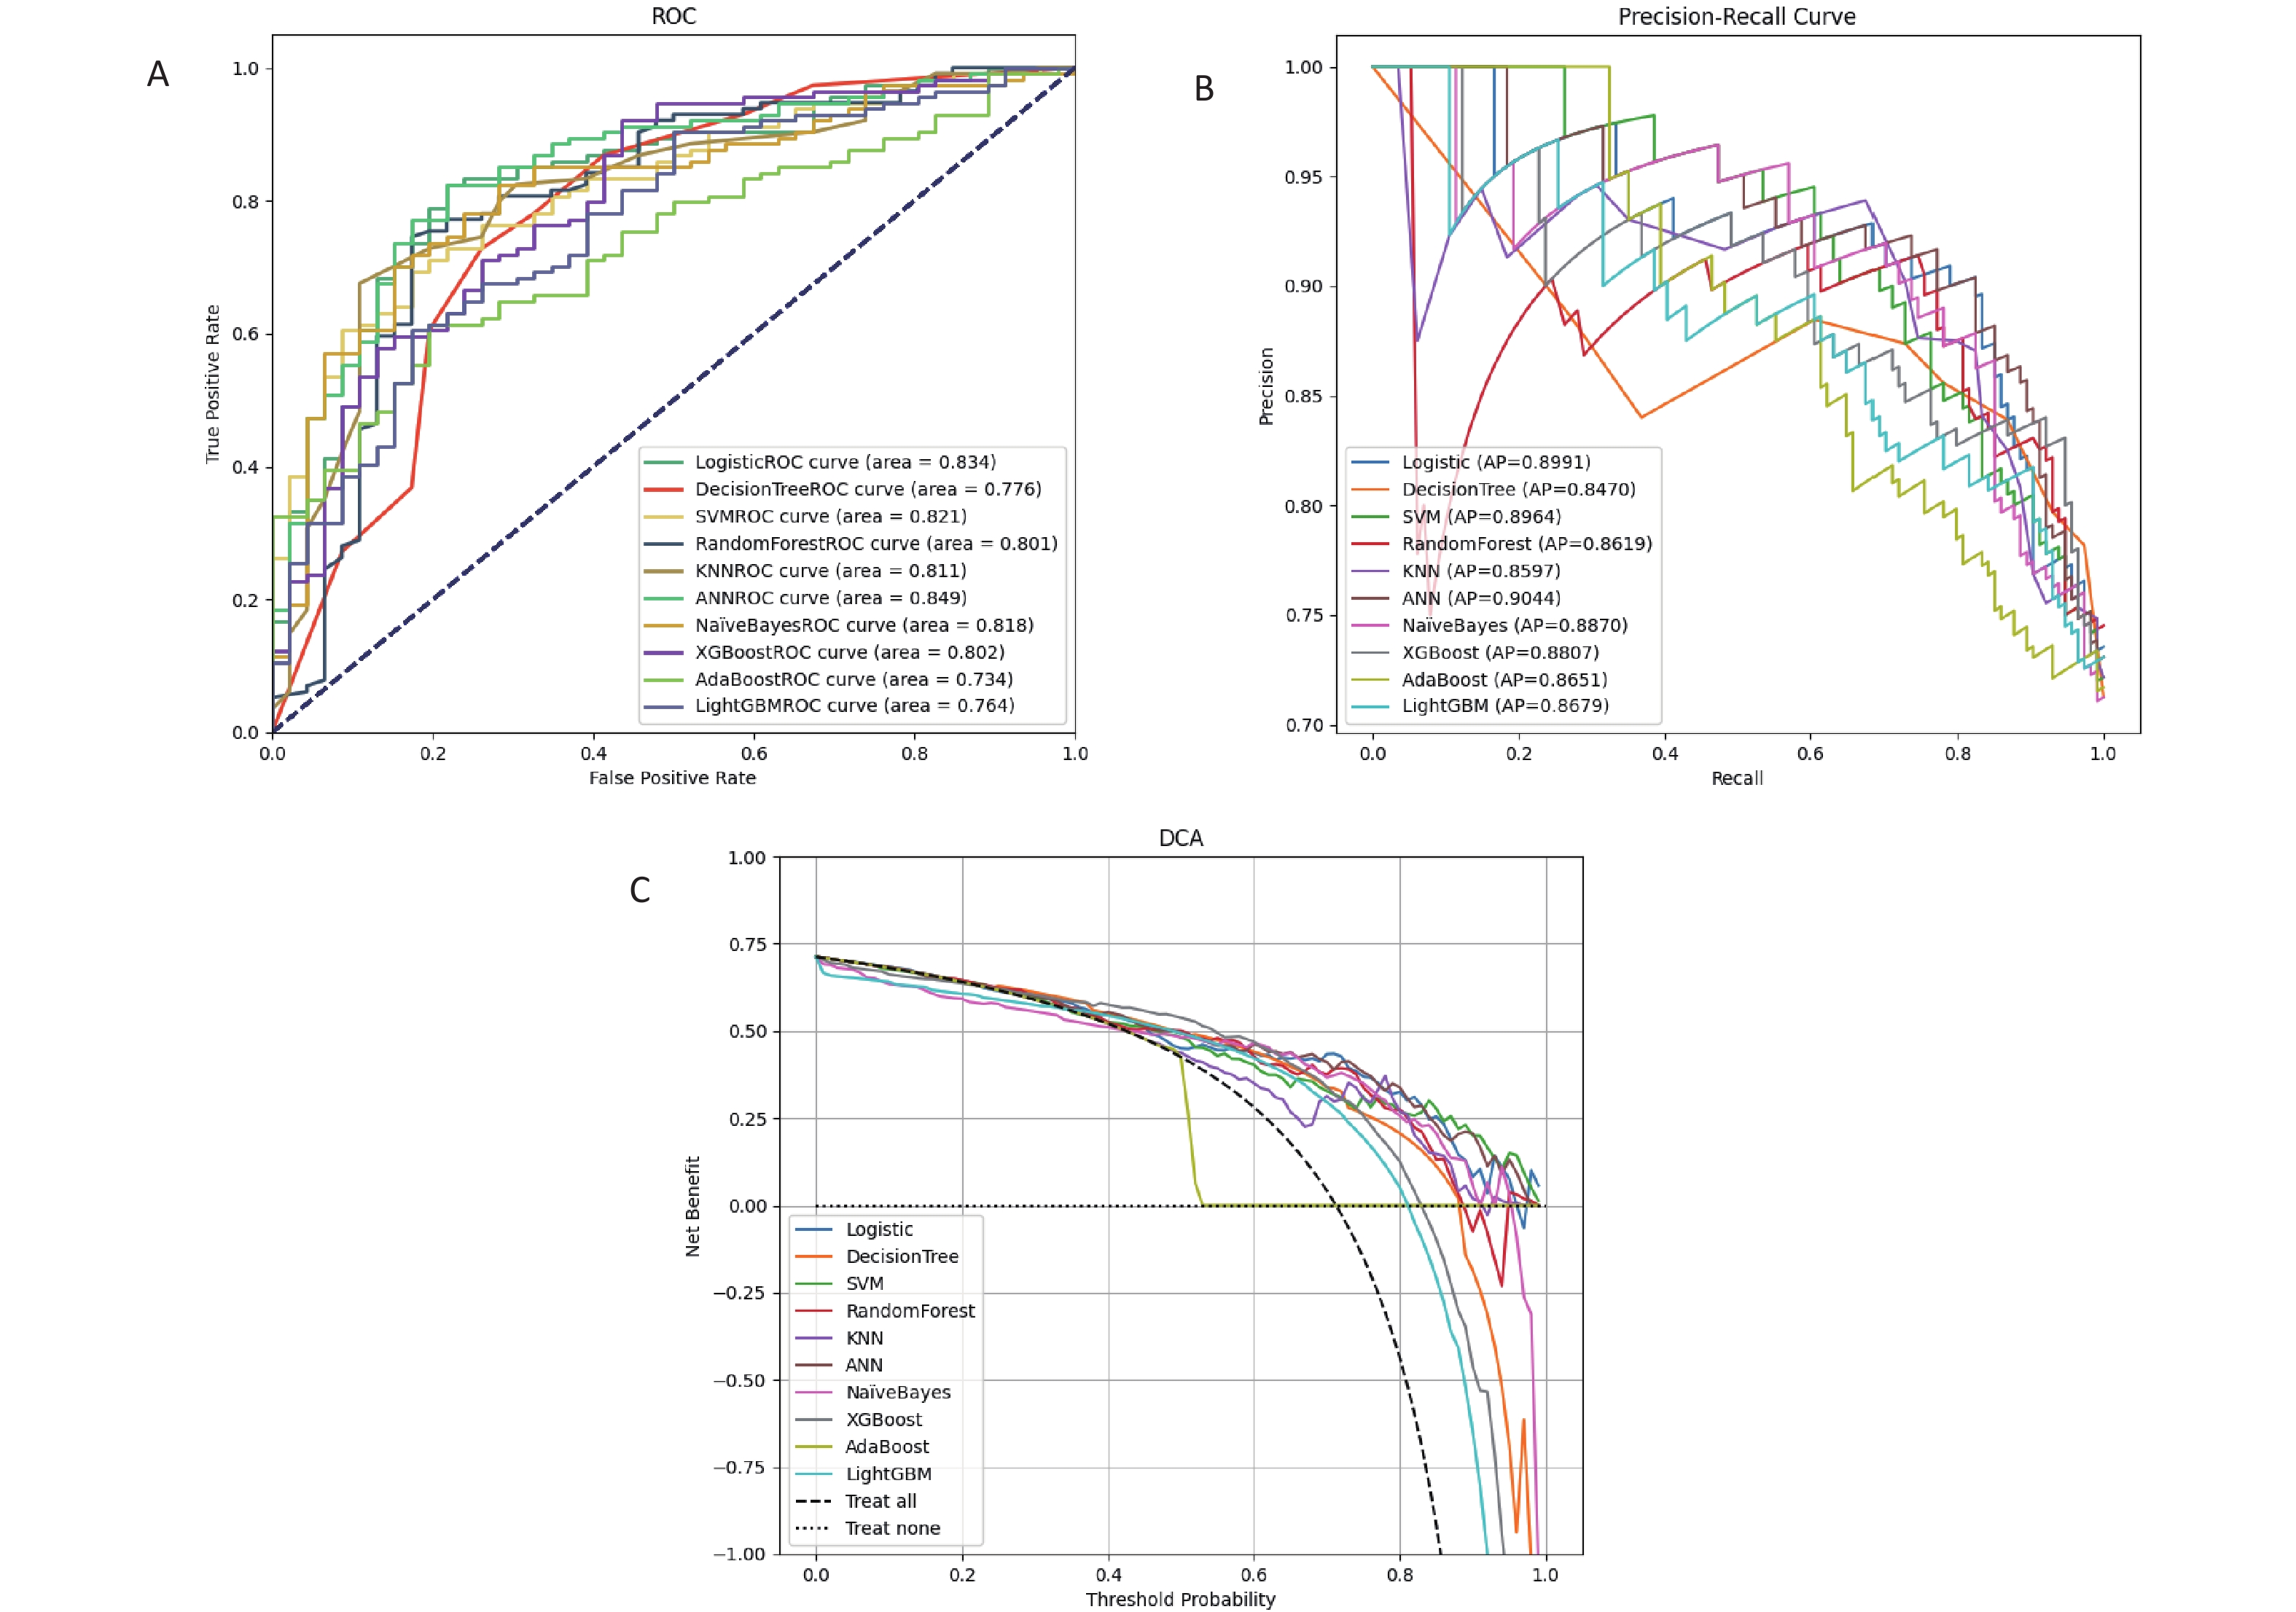
Based on facial and tongue data, we evaluated multiple machine learning models to construct a female anemia screening model and conducted a detailed comparison of their performances on the test set. From the overall performance of the models, the ANN and XGBoost demonstrated superior performance across multiple evaluation metrics. The ANN achieved an AUC of 0.849, an accuracy of 0.781, and an F1 score of 0.533, which stood out among the models. XGBoost, with an AUC of 0.802, an accuracy of 0.825, and an F1 score of 0.632, exhibited high accuracy and precision and also performed well in terms of specificity (Figure 8a, Supplementary Table S8). These two models provide relatively comprehensive performance in detecting anemia cases. According to the PR curve, the ANN model demonstrated the best performance on the test set, with the highest AP value (Figure 8b). We used the DCA to assess the net benefit to patients based on clinical decisions guided by the predictive model. The DCA evaluation indicated that the ANN offers superior clinical applicability (Figure 8c). A comprehensive analysis suggested that the ANN model was optimal.

Figure 8. Comprehensive analysis of test set results for different machine learning algorithms. (A) ROC curve and AUC for the test set. All participants were divided into training and test sets at a 7:3 ratio. (B) the PR curve and AP value for the test set, with Precision on the y-axis and Recall on the x-axis. A PR curve closer to the top right corner indicates better model performance. In cases where the PR curves of different prediction models cross, the AP value under the PR curve is used for further quantification and comparison of different models. (C) DCA for the test set, where the x-axis represents threshold probability, and the y-axis represents net benefit. The two dashed lines above the x-axis represent two extreme cases: the light dashed line indicates that all indicators are negative, resulting in a net benefit of 0 for treatment. The dark dashed line represents all prediction indicators being positive, with a net benefit represented by a negative slope diagonal line. The remaining solid lines represent different models. The further the solid line is from the two extreme lines and the larger the area it forms, the better the clinical model's effectiveness.
-
By integrating images with color space characteristics and utilizing deep learning models for feature extraction and classification, accurate classification of female anemia was achieved. The results indicate that the fusion model, which had an AUC and specificity comparable to those of the ANN model, outperformed the ANN model in terms of accuracy, precision, sensitivity, and F1-score (Figure 9a, Supplementary Table S9). Thus, the predictive performance of the fusion model was accurate. The PR curve of the fusion model is located in the top-right corner, with an AP value of 0.9, indicating superior model performance (Figure 9b). The clinical decision curve (DCA) of the predictive model revealed that when the probability threshold ranged from 35% to 95%, the clinical net benefit of predicting female anemia events using the predictive model in the training set was greater than that of both the "full intervention" and "no intervention" strategies. Within this range, the model demonstrates good clinical applicability (results shown in Figure 9c). These results suggest that the ResNet50V2 and Conv1D fusion models can be used to classify female anemia populations. It can be observed that by combining the advantages of image and data features, the model can better balance the predictive capabilities of different categories, optimize the recognition of minority classes, reduce false positives and false negatives, and demonstrate better evaluation performance than a single model.
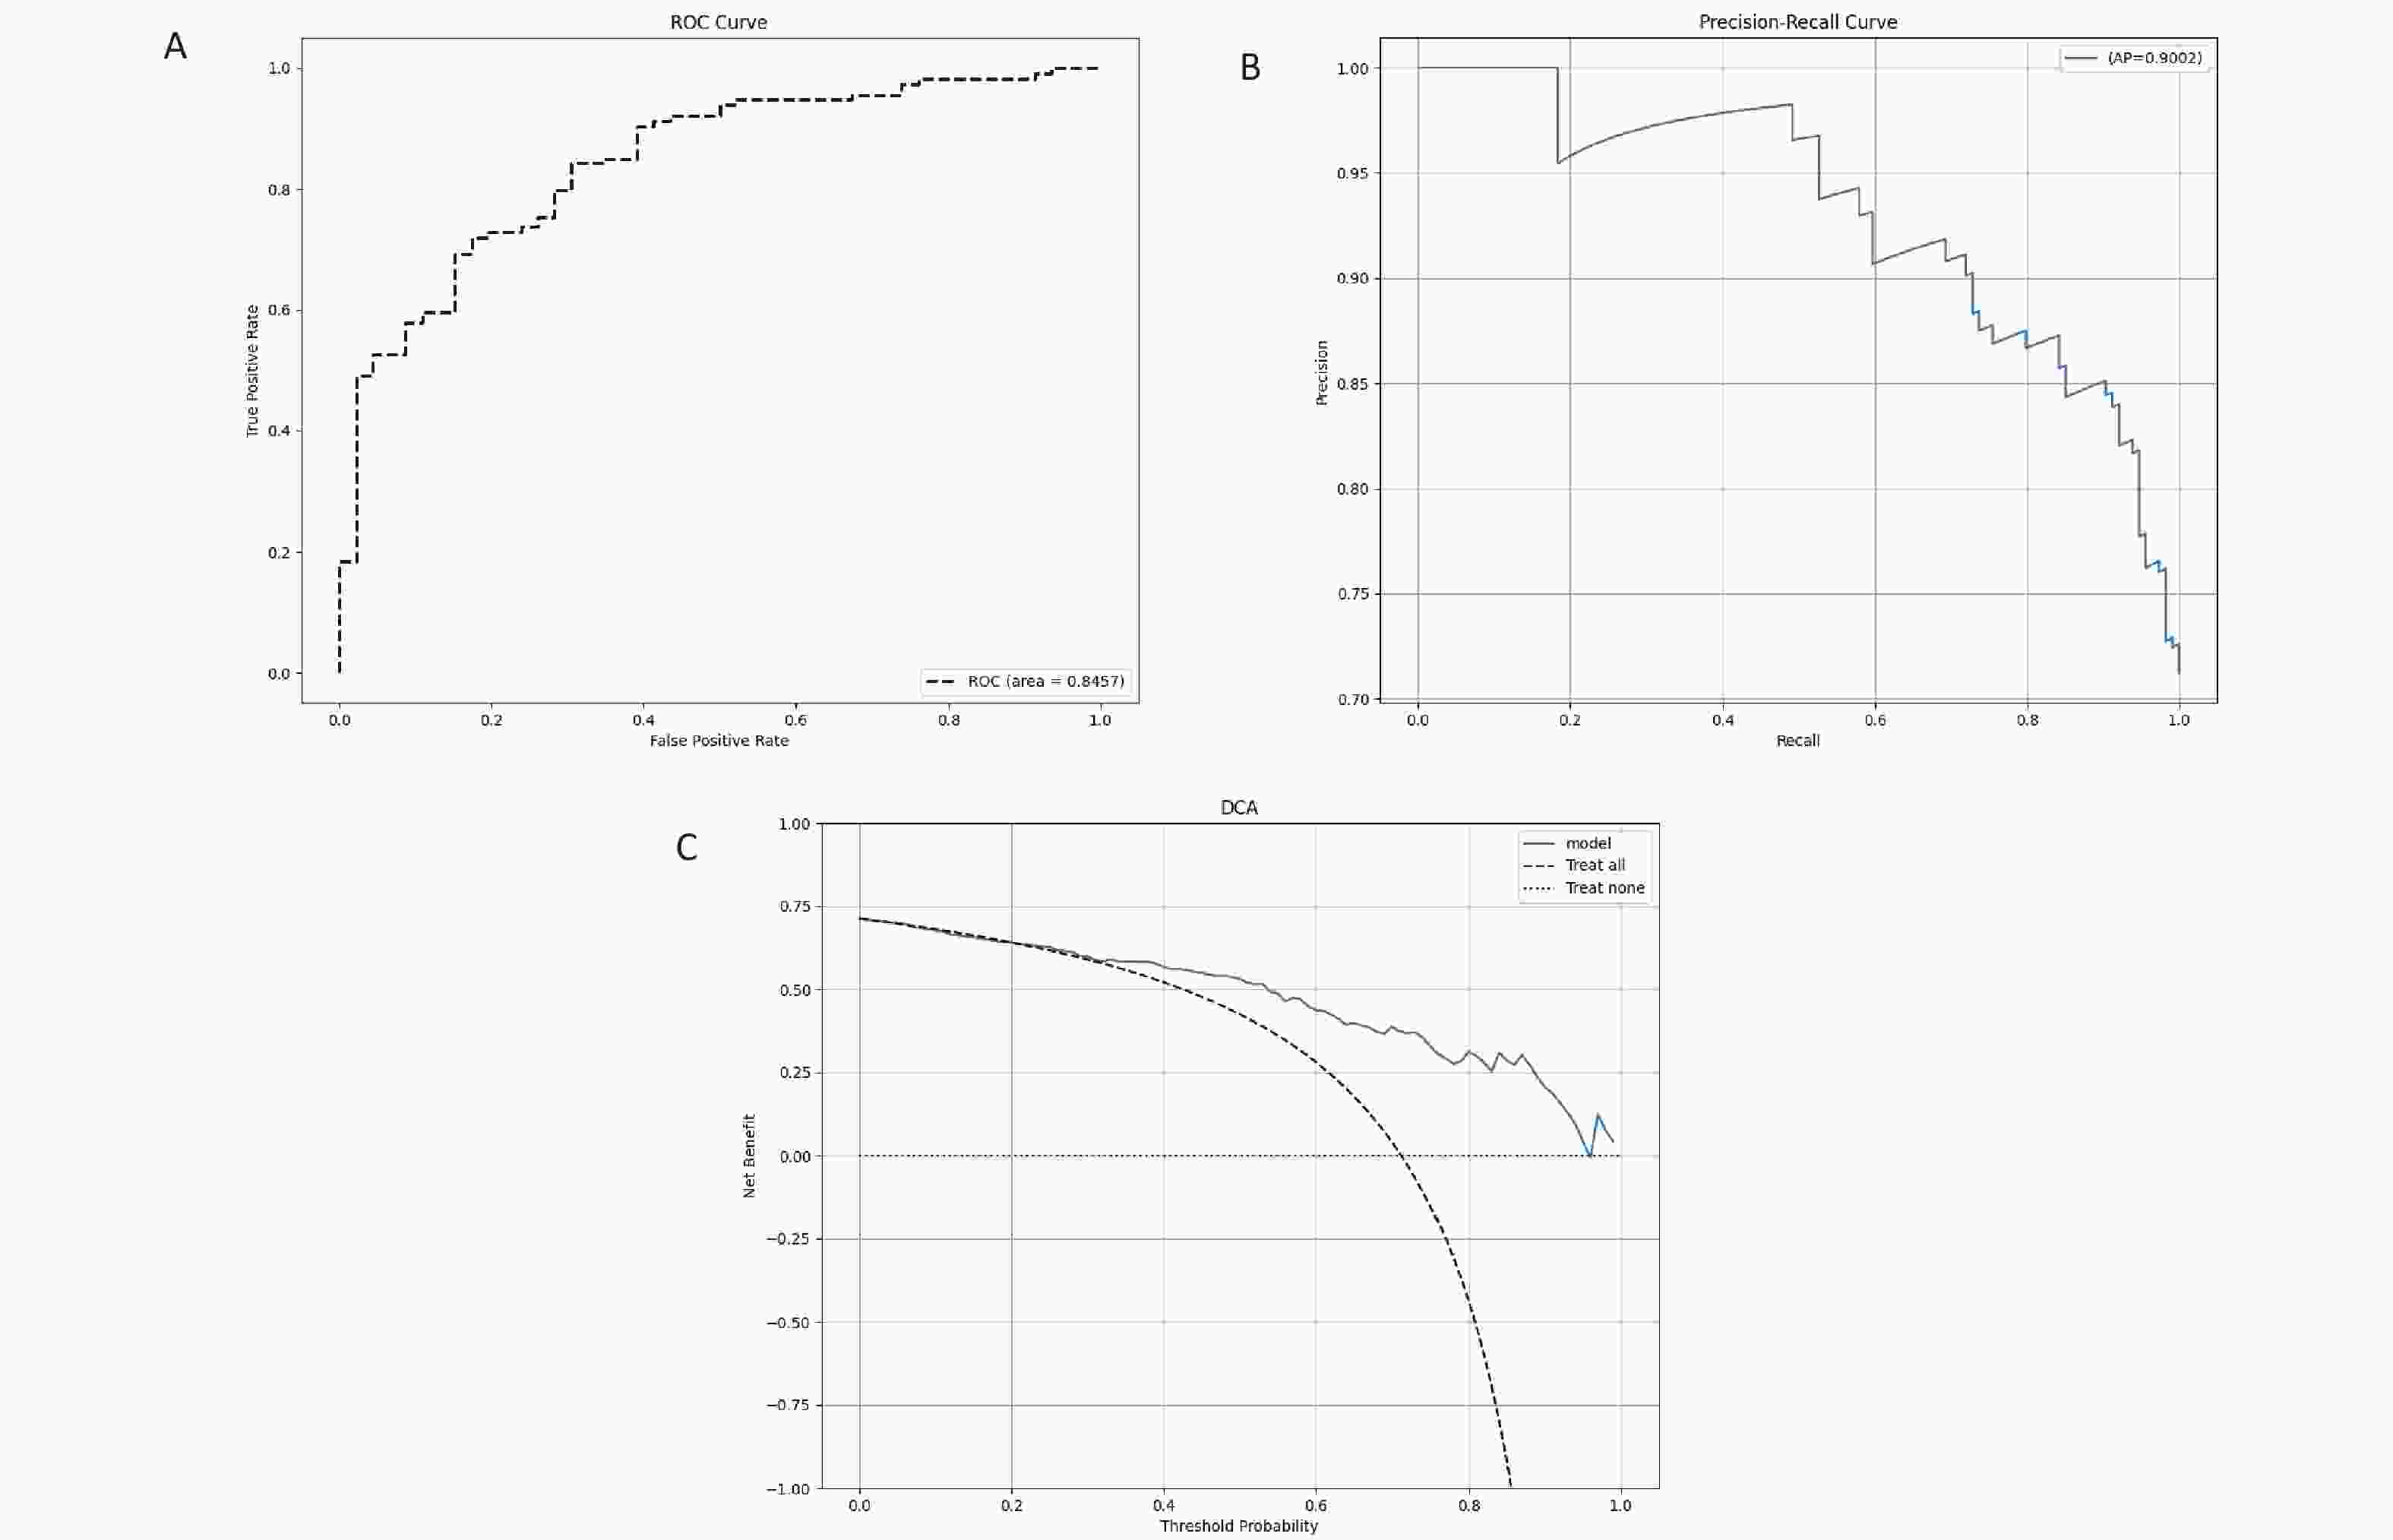
Figure 9. the analysis results of the test set for the ResNet50V2 and Conv1D fusion model. (A) ROC curve and AUC of the test set. All participants were divided into training and test sets at a 7:3 ratio. (B) PR curve and AP value for the test set, with Precision on the y-axis and Recall on the x-axis. PR curve closer to the top right corner indicates better model performance. (C) DCA for the test set, where the x-axis represents the threshold probability, and the y-axis represents the net benefit.
-
After statistically analyzing the relationship between face and tongue color, texture indicators, and anemia in women, our study yielded several interesting results. In this study, face and tongue color and texture indicators served as predictive variables for anemia in women. CIELab was used to express the color characteristics of the face and tongue because it is a physiologically based color system that can objectively measure the visual perception of color, thus quantitatively describing the magnitude of perceived color differences or changes[42].
The research results indicated that in comparisons of facial color within the same age group, female patients with anemia exhibited lower a-values and higher L-values and b-values on both their faces and tongues. In terms of color, women with anemia in different age groups tended to have lower a-values and higher b-values in their facial complexion, tongue quality, and tongue coating, with higher L-values in certain facial areas. Specifically, the a-value represents the redness of the color, and a lower value indicates a lesser degree of redness in the facial skin and tongue of women with anemia. The b-value signifies the yellowness of the color, with a higher value indicating a more yellowish hue in the facial skin and tongue of this population. The L-value reflects the brightness of the color, with a higher value indicating brighter and fairer facial skin among women with anemia. Changes in peripheral blood components affect the optical properties of the skin, resulting in alterations in its diffuse reflectance spectrum[43]. Jing et al[44]. conducted a unified comparison and analysis of diffuse reflectance spectra and colors under different total hemoglobin concentrations and oxygen saturation levels using Monte Carlo simulation. They found that an increase in hemoglobin concentration led to a decrease in diffuse reflectance across the entire visible spectrum, causing the skin to appear yellowish. A decrease in the oxygen saturation resulted in a gradual reduction in the red component. Previous studies on anemia have also found a correlation between anemia and pallor in the face, lips, and conjunctiva[29,45–47]. There was no difference in L-values when whole faces of the two groups were compared. A possible reason is that most of the participants in this study had mild anemia, and the main manifestations of anemia in the facial complexion were changes in a- and b-values. Lower values of the texture indicators CON, ENT, and MEAN and higher ASM values reflect finer facial, tongue, and tongue coating textures. In this study, the facial texture indicator ENT was lower in women aged 30–39 compared than in healthy controls, while ASM was higher. For women aged 40–49, the tongue and tongue coating texture indicators CON, ENT, and MEAN were lower than those of the healthy control group, whereas ASM was higher. Anemia-affected female population tend to have delicate facial textures, refined tongue quality, and smoother tongue coatings.
As age increases, the facial color and texture indicators of female participants with anemia exhibit a similar trend of change compared with healthy females. Specifically, women with anemia experience a decrease in the L-value, an increase in the a- and b-values, and an increase in the ASM value of their facial skin. This signifies that as age progresses, the brightness of the facial skin diminishes, the red and yellow components increase, and the skin texture becomes rougher.
Skin color is formed by the interaction between absorption and reflection. When light hits the skin surface, it may be absorbed by pigments such as melanin, hemoglobin, and carotenoids or reflected by transparent keratin particles in the epidermis or collagen fibers in the dermis. Previous research has shown a strong exponential negative correlation between melanin content in the epidermis and the L-value. Even a small change in the melanin content can cause a significant change in the L-value[48]. With increasing age, melanin synthesis continuously increases to basal levels under the influence of environmental factors. In addition, color L-value measurements revealed a positive correlation between dermal collagen density and skin brightness. Collagen density negatively correlates with age and light absorption in the dermis[49]. In addition to being influenced by human skin blood flow[50], the a-value is also affected by the total melanin content in the epidermis[48], which means that as the total melanin content in the epidermis increases, the a-value also increases. However, this correlation was much weaker than the impact of the L-value on melanin content. Studies have indicated that the extracellular matrix plays a crucial role in maintaining the elastic appearance of the dermis and provides a suitable environment for skin cells. Significant changes occur in the morphology and function of the extracellular matrix with increasing age[51], along with various exogenous factors such as the secretion of matrix metalloproteinase (MMP) induced by ultraviolet radiation[52], a decrease in collagen content, and an increase in the oxidation of skin collagen fibers. The oxidized collagen fibers appeared yellow, leading to an increase in the b-value. A decrease in collagen tissue, a disordered arrangement of collagen fibers, interruption of the elastic fiber network, and an increase in skin texture were observed. Although the difference was not statistically significant, the a-value of lip color decreased significantly with age. A possible reason is that the stratum corneum of the lips is relatively thin and the influence of melanin is less; therefore, blood content is the main factor affecting the a-value. The total vascular area of the dermis and the number of blood vessels in the upper lip dermis decrease with age[53,54]. Hemoglobin is the main source of the red color in the skin, and the presence of anemia may be the reason for the decrease in the a-value.
Our study utilized facial and tongue images of the participants combined with machine learning techniques to establish a risk-screening model for female anemia. The ability of machine learning classification methods and deep learning approaches to detect anemia in the participants was compared. When using the ANN and XGBoost models to detect patients with anemia, both AUROC and accuracy were high, indicating relatively low false-negative and false-positive rates. This suggests that the model can detect the vast majority of anemia in most patients. Additionally, in the context of this study, the data were imbalanced, with the number of patients with anemia being far fewer than that of healthy individuals. In such scenarios, models with higher AUC are more suitable for detecting rare events or minority class samples because they can better differentiate between different classes of samples. Even if the accuracy is low, identifying important minority class samples[55]. Therefore, the ANN model has higher practical clinical value. The model predicts the risk of female anemia based solely on 19 facial and tongue images, offering advantages such as non-invasiveness, safety, efficiency, and accuracy. It is highly suitable for large-scale risk screening of anemia in women. Although other machine learning classification models such as LG and SVM exhibited high AUC values (0.834 and 0.821, respectively), they performed poorly in terms of sensitivity and f1-score. In particular, LG had a sensitivity of only 0.326, making it ineffective in identifying anemia cases and resulting in a low f1-score. The KNN, while achieving perfect accuracy (1.0), had a sensitivity of only 0.043, failing to effectively identify anemia cases and leading to an extremely low f1-score, indicating that it had not learned effective information to differentiate between healthy individuals and patients with anemia. AdaBoost performed relatively poorly in terms of AUC and accuracy, with an unsatisfactory f1-score and precision, showing poor model performance. Additionally, the DT and RF models performed well in terms of the overall accuracy, with accuracies of 0.781 and 0.788, respectively, and high precisions of 0.704 and 0.75, respectively. However, their sensitivities are low, limiting their ability to detect anemia. Although NB has a relatively high sensitivity (sensitivity = 0.565), it has a low precision and F1 score, tending to misidentify healthy individuals as having anemia. Therefore, further optimization is required to enhance their performance for practical applications.
Compared with using images alone for deep learning modeling, the fused feature model can further improve the detection ability of female anemia. Both the AUROC and accuracy increased by over 80%. The image and color space features complement and mutually reinforce each other after fusion. This model has improved accuracy in detecting patients with anemia and has the ability to identify patients with mild anemia. However, the sensitivity was slightly low because of the misidentification of patients with anemia as healthy individuals in the model. Additionally, compared with the facial and tongue color and texture indicators, the fused features did not significantly improve the model's screening ability for female anemia. This suggests that if we want to improve accuracy, we need to introduce new indicators.
One of the strengths of our study was that all participants were from a physical examination center, with the majority being young and middle-aged women who had a single diagnosis of anemia or were only diagnosed with anemia. Therefore, the facial and tongue images were representative. Nevertheless, the participants were from a wide range of occupations and geographical regions, resulting in a more diverse collection of images. Our study compared the color and texture indicators of facial and tongue images between anemic and healthy populations, screened the facial and tongue features most relevant to anemia status, and constructed a high-accuracy anemia risk-screening model.
In addition to diagnosis, our study meets the design requirements for multiple scenarios. Traditional facial and tongue diagnostic methods rely on the surrounding environment and the subjective experience of doctors, which can easily lead to deviations. However, obtaining rapid blood test results is not feasible in many local clinics or resource-limited areas. In this study, we used a TFDA-1 tongue and face diagnosis instrument to collect and analyze facial and tongue photographs. By employing machine learning methods to explore the inherent patterns in the data, we achieved non-invasive, rapid, and accurate detection of anemia in women. In the future, our research will facilitate the rapid determination of whether a patient has anemia and provide reasonable diagnostic and treatment recommendations. Mild and moderate-to-severe anemia exhibit different symptoms or signs, such as shortness of breath, difficulty in breathing, and rapid heart rate in patients with severe anemia at rest. These characteristics can be utilized to establish a connection between facial and tongue images and the severity of anemia, which is a complex but meaningful challenge.
-
Our non-invasive risk-screening model for female anemia is a successful exploration of machine learning technology in the medical field. This study employs both classical machine learning and deep learning algorithms to maximize their respective strengths by combining prior knowledge with latent features. We used facial and tongue image datasets to optimally classify female patients with and without anemia. Our research successfully demonstrated that facial and tongue information can serve as new biomarkers for screening the risk of anemia in women using machine learning. The model exhibited a good detection capability for female patients with anemia. Furthermore, the detection process was non-invasive. This study provides a feasible method for establishing a correlation between anemia and facial and tongue imaging findings.
However, this study has some limitations. First, it was a single-center investigation with a uniform sex and age structure in the patient population and relatively similar dietary compositions. Therefore, our findings may not be generalizable to other ethnic groups. Second, the sample size of this study was insufficient, especially given the significant disparity between the number of patients with and without anemia. Third, this study did not include middle-aged or older women aged over 50 years with anemia. Anemia is relatively prevalent among middle-aged and elderly populations in China[56]. Especially in the elderly, anemia is an independent risk factor for a poor prognosis[57]. In the future, we need to expand the age range, conduct further external validation, and explore the association between facial and tongue features and anemia. Finally, the sensitivity of the model for detecting anemia in young and middle-aged women was 0.565, with a slightly high false-negative rate, indicating that the model still requires improvement.
-
This study successfully analyzed differences in facial and tongue data as well as age distribution trends between anemic and healthy women based on color and texture features extracted from facial and tongue images. Additionally, classic machine learning and deep learning algorithms were employed to extract deep features, ultimately establishing a screening model for female anemia risk. This model enables the non-invasive detection of anemia in women, demonstrating that facial and tongue information serves as a potential TCM phenotype and that facial and tongue image features correlate with hemoglobin levels. In the future, we plan to collect more data, extract additional features, and enhance model performance, providing a non-invasive assessment method based on different hemoglobin levels.
doi: 10.3967/bes2025.047
Analysis of Tongue and Face Image Features of Anemic Women and Construction of Risk-Screening Model
-
Abstract:
Objective To identify the key features of facial and tongue images associated with anemia in female populations, establish anemia risk-screening models, and evaluate their performance. Methods A total of 533 female participants (anemic and healthy) were recruited from Shuguang Hospital. Facial and tongue images were collected using the TFDA-1 tongue and face diagnosis instrument. Color and texture features from various parts of facial and tongue images were extracted using Face Diagnosis Analysis System (FDAS) and Tongue Diagnosis Analysis System version 2.0 (TDAS v2.0). Least Absolute Shrinkage and Selection Operator (LASSO) regression was used for feature selection. Ten machine learning models and one deep learning model (ResNet50V2 + Conv1D) were developed and evaluated. Results Anemic women showed lower a-values, higher L- and b-values across all age groups. Texture features analysis showed that women aged 30–39 with anemia had higher angular second moment (ASM)and lower entropy (ENT) values in facial images, while those aged 40–49 had lower contrast (CON), ENT, and MEAN values in tongue images but higher ASM. Anemic women exhibited age-related trends similar to healthy women, with decreasing L-values and increasing a-, b-, and ASM-values. LASSO identified 19 key features from 62. Among classifiers, the Artificial Neural Network (ANN) model achieved the best performance [area under the curve (AUC): 0.849, accuracy: 0.781]. The ResNet50V2 model achieved comparable results [AUC: 0.846, accuracy: 0.818]. Conclusion Differences in facial and tongue images suggest that color and texture features can serve as potential TCM phenotype and auxiliary diagnostic indicators for female anemia. -
Key words:
- Female anemia /
- Facial image /
- Tongue image /
- Machine learning /
- Deep learning
&These authors contributed equally to this work.
注释:1) Competing Interests: -
Figure 2. Process of extracting the color and texture of face and tongue images using FDAS and TDAS V2.0.
Figure 4. Comparison of facial image color and texture indices between two groups of participants. (A) Comparison of color indices between the healthy control group and the anemia group for the whole face and nine facial areas (without distinguishing age groups). (B) Comparison of color indices for the whole face (with age groups distinguished). (C) Comparison of texture indices for the whole face (taking ASM_0 and ENT_0 as examples). (D) Comparison of L-values across nine facial areas. (E) Comparison of a-values across nine facial areas. (F) Comparison of b-values across nine facial areas. The horizontal axis represents different indices, while "20–29," "30–39," and "40–49" indicate age ranges. The vertical axis represents color values and texture values. Compared with the healthy control, *P < 0.05; **P < 0.01; ***P < 0.001. ASM, angular second moment. ENT, entropy.
Figure 5. Compares the tongue image color and texture indicators between two groups of participants. (A) Lab color space indicators. (B) Texture indicators. The horizontal axis represents different indicators, with 20–29, 30–39, and 40–49 denoting age ranges. The vertical axis represents color values and texture values. Compared with the healthy controls, *P < 0.05; **P < 0.01; ***P < 0.001. TC, tongue coating. TB, tongue body. CON, contrast. ASM, angular second moment; ENT, entropy; MEAN, mean value.
Figure 6. The trend changes in facial image color and texture indicators across different age groups for female anemia patients. (A) Full-face color indicators. (B) Lip color indicators. (C) Facial texture indicators. Compared with the 20–29 age group, *P < 0.05; **P < 0.01; ***P < 0.001; Compared with the 30–39 age group, #P < 0.05; ##P < 0.01; ###P < 0.001. ASM, angular second moment; CON, contrast; ENT, entropy; IDM, inverse different moment.
Figure 7. The results of variable selection using LASSO regression. (A) A plot of Log(λ) versus the number of selected variables. The vertical axis represents the minimum mean squared error, the upper horizontal axis indicates the number of predictor variables, and the lower horizontal axis corresponds to the Log(λ) value associated with the λ parameter. Vertical dashed lines are drawn at the points of minimum mean squared error (λ = 0.015) and the standard error of the minimum distance (λ = 0.043). (B) A plot of Log(λ) versus the coefficient values of the variables. The vertical axis shows the coefficient values of the predictor variables, the top horizontal axis indicates the number of predictor variables, and the bottom horizontal axis corresponds to the Log(λ) associated with the λ parameter.
Figure 8. Comprehensive analysis of test set results for different machine learning algorithms. (A) ROC curve and AUC for the test set. All participants were divided into training and test sets at a 7:3 ratio. (B) the PR curve and AP value for the test set, with Precision on the y-axis and Recall on the x-axis. A PR curve closer to the top right corner indicates better model performance. In cases where the PR curves of different prediction models cross, the AP value under the PR curve is used for further quantification and comparison of different models. (C) DCA for the test set, where the x-axis represents threshold probability, and the y-axis represents net benefit. The two dashed lines above the x-axis represent two extreme cases: the light dashed line indicates that all indicators are negative, resulting in a net benefit of 0 for treatment. The dark dashed line represents all prediction indicators being positive, with a net benefit represented by a negative slope diagonal line. The remaining solid lines represent different models. The further the solid line is from the two extreme lines and the larger the area it forms, the better the clinical model's effectiveness.
Figure 9. the analysis results of the test set for the ResNet50V2 and Conv1D fusion model. (A) ROC curve and AUC of the test set. All participants were divided into training and test sets at a 7:3 ratio. (B) PR curve and AP value for the test set, with Precision on the y-axis and Recall on the x-axis. PR curve closer to the top right corner indicates better model performance. (C) DCA for the test set, where the x-axis represents the threshold probability, and the y-axis represents the net benefit.
Table 1. Basic Information of Subjects
Anemia (n = 152) Healthy Controls (n = 381) Total χ2/t P age[n(%),year] 0.987 0.610 20−29 31 (20.4) 90 (23.6) 121 (22.7) 30−39 64 (42.1) 163 (42.8) 227 (42.6) 40−49 57 (37.5) 128 (33.6) 185 (34.7) BMI[x±s, Kg/m2] 22.289±3.061 22.105±3.117 0.651 0.515 SBP[x±s, mmHg] 114.868±12.151 112.976±12.603 1.581 0.115 DBP[x±s, mmHg] 71.263±9.244 71.457±8.358 −0.234 0.815  下载: 导出CSV
-
[1] Pasricha SR, Colman K, Centeno-Tablante E, et al. Revisiting WHO haemoglobin thresholds to define anaemia in clinical medicine and public health. Lancet Haematol, 2018; 5, e60−2. doi: 10.1016/S2352-3026(18)30004-8 [2] Beutler E, Waalen J. The definition of anemia: what is the lower limit of normal of the blood hemoglobin concentration? Blood, 2006; 107, 1747-50. [3] The Writing Committee of the Report on Cardiovascular Health and Diseases in China. Report on cardiovascular health and diseases in China 2021: an updated summary. Biomed Environ Sci, 2022; 35, 573−603. [4] GBD 2021 Anaemia Collaborators. Prevalence, years lived with disability, and trends in anaemia burden by severity and cause, 1990-2021: findings from the Global Burden of Disease Study 2021. Lancet Haematol, 2023; 10, e713−34. doi: 10.1016/S2352-3026(23)00160-6 [5] Kassebaum NJ, Jasrasaria R, Naghavi M, et al. A systematic analysis of global anemia burden from 1990 to 2010. Blood, 2014; 123, 615−24. doi: 10.1182/blood-2013-06-508325 [6] Karami M, Chaleshgar M, Salari N, et al. Global prevalence of anemia in pregnant women: a comprehensive systematic review and meta-analysis. Matern Child Health J, 2022; 26, 1473−87. doi: 10.1007/s10995-022-03450-1 [7] Bachman E, Travison TG, Basaria S, et al. Testosterone induces erythrocytosis via increased erythropoietin and suppressed hepcidin: evidence for a new erythropoietin/hemoglobin set point. J Gerontol A Biol Sci Med Sci, 2014; 69, 725−35. doi: 10.1093/gerona/glt154 [8] Shi HF, Chen L, Wang YY, et al. Severity of anemia during pregnancy and adverse maternal and fetal outcomes. JAMA Netw Open, 2022; 5, e2147046. doi: 10.1001/jamanetworkopen.2021.47046 [9] Pasricha SR, Tye-Din J, Muckenthaler MU, et al. Iron deficiency. Lancet, 2021; 397(10270), 233-48. [10] Andro M, Le Squere P, Estivin S, et al. Anaemia and cognitive performances in the elderly: a systematic review. Eur J Neurol, 2013; 20, 1234−40. doi: 10.1111/ene.12175 [11] Haas JD, Brownlie IV T. Iron deficiency and reduced work capacity: a critical review of the research to determine a causal relationship. J Nutr, 2001; 131, 676S−90S. doi: 10.1093/jn/131.2.676S [12] Rasmussen K. Is there a causal relationship between iron deficiency or iron-deficiency anemia and weight at birth, length of gestation and perinatal mortality. J Nutr, 2001; 131, 590S−603S. doi: 10.1093/jn/131.2.590S [13] Young MF. Maternal anaemia and risk of mortality: a call for action. Lancet Glob Health, 2018; 6, e479−80. doi: 10.1016/S2214-109X(18)30185-2 [14] Mizanur RM, Krull AS, Shafiur RM, et al. Maternal anemia and risk of adverse birth and health outcomes in low- and middle-income countries: systematic review and meta-analysis. Am J Clin Nutr, 2016; 103, 495−504. doi: 10.3945/ajcn.115.107896 [15] Dunne JR, Malone D, Tracy JK, et al. Perioperative anemia: an independent risk factor for infection, mortality, and resource utilization in surgery. J Surg Res, 2002; 102, 237−44. doi: 10.1006/jsre.2001.6330 [16] Anand IS. Anemia and chronic heart failure: implications and treatment options. J Am Coll Cardiol, 2008; 52, 501−11. doi: 10.1016/j.jacc.2008.04.044 [17] Hung M, Besser M, Sharples LD, et al. The prevalence and association with transfusion, intensive care unit stay and mortality of pre-operative anaemia in a cohort of cardiac surgery patients. Anaesthesia, 2011; 66, 812−8. doi: 10.1111/j.1365-2044.2011.06819.x [18] Musallam KM, Tamim HM, Richards T, et al. Preoperative anaemia and postoperative outcomes in non-cardiac surgery: a retrospective cohort study. Lancet, 2011; 378, 1396−407. doi: 10.1016/S0140-6736(11)61381-0 [19] Baron DM, Hochrieser H, Posch M, et al. Preoperative anaemia is associated with poor clinical outcome in non-cardiac surgery patients. Br J Anaesth, 2014; 113, 416−23. doi: 10.1093/bja/aeu098 [20] Kulier A, Levin J, Moser R, et al. Impact of preoperative anemia on outcome in patients undergoing coronary artery bypass graft surgery. Circulation, 2007; 116, 471−9. doi: 10.1161/CIRCULATIONAHA.106.653501 [21] Gombotz H, Schreier G, Neubauer S, et al. Gender disparities in red blood cell transfusion in elective surgery: a post hoc multicentre cohort study. BMJ Open, 2016; 6, e012210. doi: 10.1136/bmjopen-2016-012210 [22] Ma QY, Zhang SK, Liu J, et al. Study on the prevalence of severe anemia among non-pregnant women of reproductive age in rural China: a large population-based cross-sectional study. Nutrients, 2017; 9, 1298. doi: 10.3390/nu9121298 [23] Karnad A, Poskitt TR. The automated complete blood cell count. Use of the red blood cell volume distribution width and mean platelet volume in evaluating anemia and thrombocytopenia. Arch Intern Med, 1985; 145, 1270−2. doi: 10.1001/archinte.1985.00360070150025 [24] Zhang AX, Lou JJ, Pan ZJ, et al. Prediction of anemia using facial images and deep learning technology in the emergency department. Front Public Health, 2022; 10, 964385. doi: 10.3389/fpubh.2022.964385 [25] Hasan K, Haque M, Adib R, et al. SmartHeLP: smartphone-based Hemoglobin Level Prediction Using an Artificial Neural Network. AMIA Annu Symp Proc, 2018; 2018, 535−44. [26] Mannino RG, Myers DR, Tyburski EA, et al. Smartphone app for non-invasive detection of anemia using only patient-sourced photos. Nat Commun, 2018; 9, 4924. doi: 10.1038/s41467-018-07262-2 [27] Suner S, Rayner J, Ozturan IU, et al. Prediction of anemia and estimation of hemoglobin concentration using a smartphone camera. PLoS One, 2021; 16, e0253495. doi: 10.1371/journal.pone.0253495 [28] Donmez TB, Mansour M, Kutlu M, et al. Anemia detection through non-invasive analysis of lip mucosa images. Front Big Data, 2023; 6, 1241899. doi: 10.3389/fdata.2023.1241899 [29] Chalco JP, Huicho L, Alamo C, et al. Accuracy of clinical pallor in the diagnosis of anaemia in children: a meta-analysis. BMC Pediatr, 2005; 5, 46. doi: 10.1186/1471-2431-5-46 [30] Ang L, Lee BJ, Kim H, et al. Prediction of hypertension based on facial complexion. Diagnostics (Basel), 2021; 11, 540. doi: 10.3390/diagnostics11030540 [31] Zhao J, Lin L, Lu XZ, et al. non-invasive detection of hematocrit and the mean corpuscular hemoglobin concentration levels by Vis-NIR spectroscopy. Spectroscopy Spectral Anal, 2014; 34, 652−5. (In Chinese) [32] Collings S, Thompson O, Hirst E, et al. non-invasive detection of anaemia using digital photographs of the conjunctiva. PLoS One, 2016; 11, e0153286. doi: 10.1371/journal.pone.0153286 [33] Lecun Y, Bengio Y, Hinton G. Deep learning. Nature, 2015; 521(7553), 436-44. [34] Maier A, Syben C, Lasser T, et al. A gentle introduction to deep learning in medical image processing. Z Med Phys, 2019; 29, 86−101. doi: 10.1016/j.zemedi.2018.12.003 [35] Li J, Yuan P, Hu X, et al. A tongue features fusion approach to predicting prediabetes and diabetes with machine learning. J Biomed Inform, 2021; 115, 1−13. [36] Red cell diseases (anemia) Group, Society of Hematology, Chinese Medical Association. Multidisciplinary expert Consensus on the Diagnosis and Prevention of iron deficiency and iron deficiency anemia (2022 edition). Chin Med J, 2022; 102, 3246−56. (In Chinese) [37] Xu JT, Sun Y, Zhang ZF, et al. Analysis and recognition of tongue texture features based on difference statistical method. Academ J Shanghai Univ Traditional Chin Med, 2003; 17, 55−8. (In Chinese) [38] Valckx FM, Thijssen JM. Characterization of echographic image texture by cooccurrence matrix parameters. Ultrasound Med Biol, 1997; 23, 559−71. doi: 10.1016/S0301-5629(97)00041-0 [39] Liao YY, Wu JC, Li CH, et al. Texture feature analysis for breast ultrasound image enhancement. Ultrason Imaging, 2011; 33, 264−78. doi: 10.1177/016173461103300405 [40] Tibshirani R. Regression shrinkage and selection via the lasso. J R Statist Soc B, 1996; 58, 267−88. doi: 10.1111/j.2517-6161.1996.tb02080.x [41] Vickers AJ, Elkin EB. Decision curve analysis: a novel method for evaluating prediction models. Med Decis Making, 2006; 26, 565−74. doi: 10.1177/0272989X06295361 [42] Weatherall IL, Coombs BD. Skin Color Measurements in Terms of CIELAB Color Space Values. Journal of Investigative Dermatology, 1992; 99, 468−73. doi: 10.1111/1523-1747.ep12616156 [43] Karamavuş Y, Özkan M. Newborn jaundice determination by reflectance spectroscopy using multiple polynomial regression, neural network, and support vector regression. Biomed Signal Proces, 2019; 51, 253−63. doi: 10.1016/j.bspc.2019.01.019 [44] Yuan J, Zhao YJ, Kong LQ, et al. Simulation analysis of skin diffuse reflectance spectroscopy and skin color with blood component change. Acta Optica Sinica, 2022; 42, 216−26. (In Chinese) [45] Strobach RS, Anderson SK, Doll DC, et al. The value of the physical examination in the diagnosis of anemia. Correlation of the physical findings and the hemoglobin concentration. Arch Intern Med, 1988; 148, 831−2. doi: 10.1001/archinte.1988.00380040071013 [46] Sheth TN, Choudhry NK, Bowes M, et al. The relation of conjunctival pallor to the presence of anemia. J Gen Intern Med, 1997; 12, 102−6. doi: 10.1007/s11606-006-5004-x [47] Weber MW, Kellingray SD, Palmer A, et al. Pallor as a clinical sign of severe anaemia in children: an investigation in the Gambia. Bull World Health Organ, 1997; 75(Suppl 1), 113-8. [48] Alaluf S, Atkins D, Barrett K, et al. The impact of epidermal melanin on objective measurements of human skin colour. Pigment Cell Res, 2002; 15, 119−26. doi: 10.1034/j.1600-0749.2002.1o072.x [49] Masuda Y, Ogura Y, Inagaki Y, et al. Analysis of the influence of collagen fibres in the dermis on skin optical reflectance by Monte Carlo simulation in a nine-layered skin model. Skin Res Technol, 2018; 24, 248−55. doi: 10.1111/srt.12421 [50] Shriver MD, Parra EJ. Comparison of narrow-band reflectance spectroscopy and tristimulus colorimetry for measurements of skin and hair color in persons of different biological ancestry. Am J Phys Anthropol, 2000; 112, 17−27. doi: 10.1002/(SICI)1096-8644(200005)112:1<17::AID-AJPA3>3.0.CO;2-D [51] Pu SY, Huang YL, Pu CM, et al. Effects of Oral Collagen for Skin Anti-Aging: A Systematic Review and Meta-Analysis. Nutrients, 2023; 15, 2080. doi: 10.3390/nu15092080 [52] Mullenders LHF. Solar UV damage to cellular DNA: from mechanisms to biological effects. Photochem Photobio Sci, 2018; 17, 1842−52. doi: 10.1039/c8pp00182k [53] Seo JY, Leem S, Kim HJ, et al. Image-based investigation of lip aging features in a large number of Korean women. Skin Res Technol, 2024; 30, 1−8. [54] Gomi T, Imamura T. Age-related changes in the vasculature of the dermis of the upper lip vermilion. Aging, 2019; 11, 3551−60. doi: 10.18632/aging.101996 [55] Zhu X, Hao J, Guo Y, et al. AUC Maximization in Imbalanced Lifelong Learning. The 39th conference on uncertainty in artificial intelligence, 2023; 2574-85. [56] Ruan Y, Guo Y, Kowal P, et al. Association between anemia and frailty in 13, 175 community-dwelling adults aged 50 years and older in China. BMC Geriatr, 2019; 19, 327. doi: 10.1186/s12877-019-1342-5 [57] Balducci L. Epidemiology of anemia in the elderly: information on diagnostic evaluation. J Am Geriatr Soc, 2003; 51, 2−9. doi: 10.1046/j.1532-5415.51.3s.4.x -

 点击查看大图
计量
- 文章访问数: 40
- HTML全文浏览量: 16
- PDF下载量: 0
- 被引次数: 0

 Quick Links