

 下载:
下载:


-
Cardiovascular disease (CVD), the primary cause of mortality worldwide, is a significant public health concern affecting the well-being and life expectancy of global population[1]. CVD bears the greatest burden and remains the leading cause of death in China, with continually increasing prevalence rates. Given that CVD is a major threat to the health of global population, urgent interventions are required to reduce its burden.
Climate conditions are relevant to an individual’s daily life and play an important role in public health. The Intergovernmental Panel on Climate Change (IPCC) asserts that climate change has led to an escalation in extreme weather phenomena, such as heightened temperatures, excessive rainfall, and flooding[2]. Projections postulate a shift to a warmer and more humid climatic change on the Earth in the coming century. This transformation poses a grave challenge because of its augmentation of disease risk, directly or indirectly affecting human well-being[3-5].
Previous studies have demonstrated the sensitivity of CVD to environmental factors throughout the world[4]. The impact of exposure to high temperatures and heat waves on health has received widespread attention[5-7]. Relative humidity (RH) quantifies the atmospheric water vapor content[8], commonly referred as humidity. Humidity, as a climatic condition, is also influenced by seasonal variations such as temperature[9]. It can affect human health through various mechanisms and has been linked to disease development[10,11]. Therefore, in the context of climate change, it is important to consider the impact of humidity on CVD.
Nonetheless, existing findings related to humidity are inconclusive. One study reported the increased the risk of ischemic heart disease and hospitalization in cold and dry weather conditions due to air pollution[12]. The burden of CVD may be exacerbated by the combined effect of high temperatures, low humidity or low temperatures, and high humidity[9,13,14]. In contrast, some studies have found no association between humidity and CVD[15-17]. Furthermore, although some studies have identified the role of humidity[18], its independent effect on CVD is not well known. More frequently, it is considered a confounding variable, probably associated with predictor and response variables, such as temperature or environmental pollutants[4,10,19-21]. Moreover, few studies have explored the shape of the exposure-response relationship between humidity and the incidence of CVD. China is a large nation with diverse climates. Consequently, evidence from a large-scale national study with different geographical area and climatic conditions is indispensable for understanding the adverse health effects of humidity.
Therefore, the present study evaluated the CVD risk associated with long-term RH exposure using precise data of ambient humidity and a large prospective population-based cohort. We also explored the shape of the exposure-response association using restricted cubic spline (RCS) models. By focusing on the independent effects of humidity on CVD, this study provided a strong scientific foundation for investigating CVD risk factors, identifying high-risk groups, and establishing an alert system for environmental health risks. This study is of great significance for effectively reducing the burden of CVD and its socioeconomic implications in China.
-
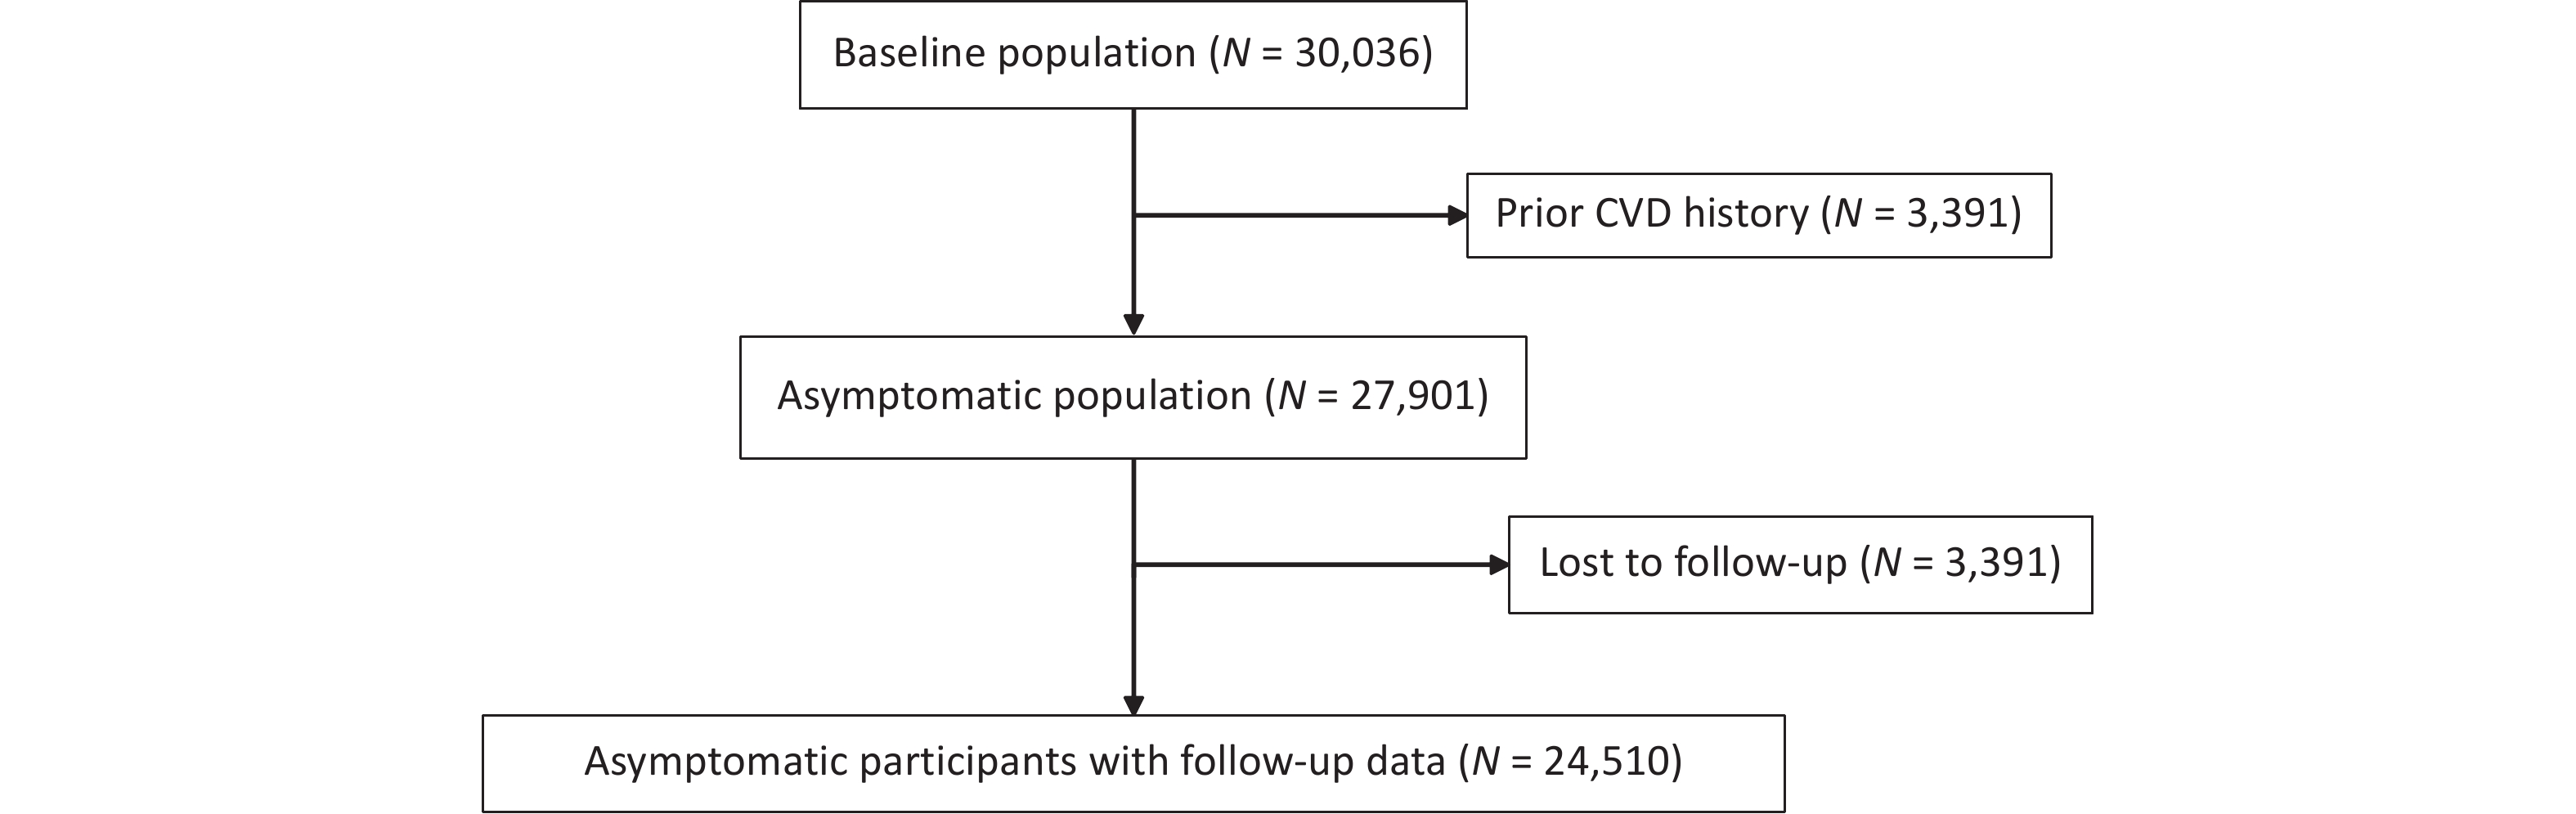
Study participants were recruited from the China Hypertension Survey (CHS), a nationally representative study[22,23]. Stratified multistage random sampling was used to include nearly 500,000 participants aged 15 years and older from 31 provinces across China between October 2012 and December 2015 to conduct the CHS study. This study further randomly selected 35,000 subjects aged ≥ 35 years from 14 provinces based on their residential districts’ geographical locations and economic development conditions. During the follow-up between 2018 and 2019, 30,036 participants who completed physical examinations at baseline were resurveyed for all-cause mortality and cardiovascular events. This analysis excluded 2,135 subjects from the initial participants at baseline because of a history of CVD (fatal or nonfatal coronary heart disease [CHD] and stroke). Moreover, 3,391 participants were excluded because they were lost to follow-up. Ultimately, 24,510 participants remained eligible. The numbers of participants included and excluded at each stage of the study are shown in the flowchart (Figure 1). All participants provided written informed consent before enrolment. The Ethics Committee of Fuwai Hospital approved this study (Beijing, China).

Figure 1. Flow diagram of participants recruitment.
-
In this study, CVD was defined as fatal or nonfatal CHD and stroke. CHD includes acute myocardial infarction (MI), percutaneous transluminal coronary angioplasty (PTCA), stent implantation, and coronary artery bypass grafting (CABG). CHD deaths encompassed all fatal events resulting from MI or other coronary deaths. Stroke included clinical signs and symptoms of subarachnoid or intracerebral hemorrhage or cerebral infarction, with rapidly developing signs of focal (or global) disturbances in cerebral function lasting > 24 h without an apparent non-vascular cause.
-
The National Meteorological Information Center (NMIC) of the China Meteorological Administration (CMA) provided quality-controlled RH and temperature datasets from 2,400 surface meteorological observation stations across China with full approval from the relevant authorities. We obtained baseline address-level environmental exposure for each participant using bilinear interpolation, a method for estimating value of a function at a specific point based on its known values at the surrounding points. This method has demonstrated strong performance in interpolating continuous environmental variables. Other adopted approaches were bicubic and inverse distance-weighted interpolation. The interpolation results were robust as all Pearson correlation coefficients between the results derived from the bicubic and inverse distance-weighted methods and bilinear interpolation were close to 1 and statistically significant at the 99% confidence level. The National Environmental Monitoring Center of China (NEMC) provided air pollution datasets from over 1,000 surface air quality monitoring stations[24]. We obtained baseline address-level air pollution exposure in a manner similar to that for RH and temperature. The main pollutant in this study was PM2.5 because of its greater impact on environmental pollution and CVD, as evidenced in the literature of such studies[25,26]. In this study, we primarily used annual, summer, and winter mean exposures to assess the baseline environmental exposure of each participant at the address level. We selected summer and winter as they represent the most extreme temperature and humidity conditions, whereas spring and autumn are the transitional seasons. Consequently, ambient humidity in summer and winter is hypothesized to significantly impact CVD more than that in other seasons.
-
Various characteristics were considered, including age, ethnicity, education, place of residence, CVD medication, smoking and drinking status, body mass index (BMI), diabetes mellitus, dyslipidemia, hypertension, and family history of CVD. Well-trained interviewers obtained health information using standardized questionnaires during the baseline survey. Ethnicity was divided into Han and ethnic minorities such as Hui, Uyghur, and Zhuang. Education level was categorized as < middle school and ≥ middle school. Current smoking or alcohol consumption was defined as participants who had a history of smoking or drinking for at least one week in the past month. Height was measured using a standard rectangular meter (to the nearest 0.5 cm). Body weight was measured using an OMRON body fat and weight measurement device (V-body HBF-371; OMRON, Kyoto, Japan) for BMI calculation. BMI was also classified as normal (BMI = 18.5–23.9 kg/m²), overweight (BMI = 24–27.9 kg/m²), and obesity (BMI ≥ 28 kg/m²). Diabetes mellitus was defined as fasting blood glucose ≥ 7 mmol/L and/or previously diagnosed diabetes, and/or use of hypoglycemic medication in the past two weeks. Blood samples from each participant were acquired after fasting for at least 8 h, and an automated analyzer in the same core laboratory (Beijing Adicon Clinical Laboratories, Inc, Beijing, China) was used for lipid analysis using enzymatic methods. Dyslipidemia was defined as total triglycerides ≥ 2.26 mmol/L, and/or total cholesterol ≥ 6.22 mmol/L, and/or high-density lipoprotein cholesterol < 1.04 mmol/L, and/or low-density lipoprotein cholesterol ≥ 4.14 mmol/L, and/or using hypolipidemic medicine, and/or prior diagnosis of dyslipidemia[27]. Hypertension was defined as systolic blood pressure ≥ 140 mmHg and/or diastolic blood pressure ≥ 90 mmHg and/or use of antihypertensive medication within two weeks. A family history of CVD was defined based on the occurrence of CHD or stroke in the participants’ parents or siblings. Medication therapies included antihypertensive drugs, hypoglycemic drugs, and statins.
-
In this study, the baseline characteristics of the participants were categorized according to sex. Continuous variables are expressed as mean ± standard deviation (SD). Student’s t-test was applied for normally distributed variables, and the Wilcoxon rank-sum test was used for non-normally distributed variables. Categorical variables and event incidences were represented as the number of cases (%), and comparisons were made using the chi-square test, which had the same results as Fisher’s test.
Cox proportional hazard models[28] estimated the association between RH and CVD risk. First, the RH was analyzed as a continuous variable (per 10% increase). Considering the probable influence of low and high humidity on health during daily life, the association between RH and CVD risk of CVD was further explored by quintile grouping of RH and using the middle group as the reference. Hazard ratios (HRs) and the corresponding 95% confidence intervals (CIs) were calculated. A series of models were considered to explore these relationships, with an increasing adjustment of Models 1 to 3. Model 1 is adjusted for age and sex. Model 2 added adjustments for ethnicity (Han, minority), education (≤ 6 years and ≥ 7 years), urbanity (urban and rural), alcohol use, current smoker, obesity (normal, overweight, obesity), diabetes mellitus, dyslipidemia, hypertension, family history of CVD, cardiovascular medication, and annual temperature average. Model 3 included PM2.5.
Exposure-response curves between RH and CVD risk were modelled using restricted cubic spline (RCS)[29] by setting three nodes at the 10th, 50th, and 90th percentiles, after adjusting for the potential confounders mentioned above. The solid lines represent the effect estimates, and the dashed lines indicate the 95% CI.
Lastly, subgroup analyses were performed by sex (male vs. female), age (< 65 years vs. ≥ 65 years), and geographical region (north vs. south) to identify susceptible groups.
Statistical tests were performed, and a 2-tailed P < 0.05 was considered statistically significant. SAS version 9.4 (SAS Institute, Cary, NC, USA) was used for all analyses. RCS models and graphs were constructed using R (version 4.2.2).
-
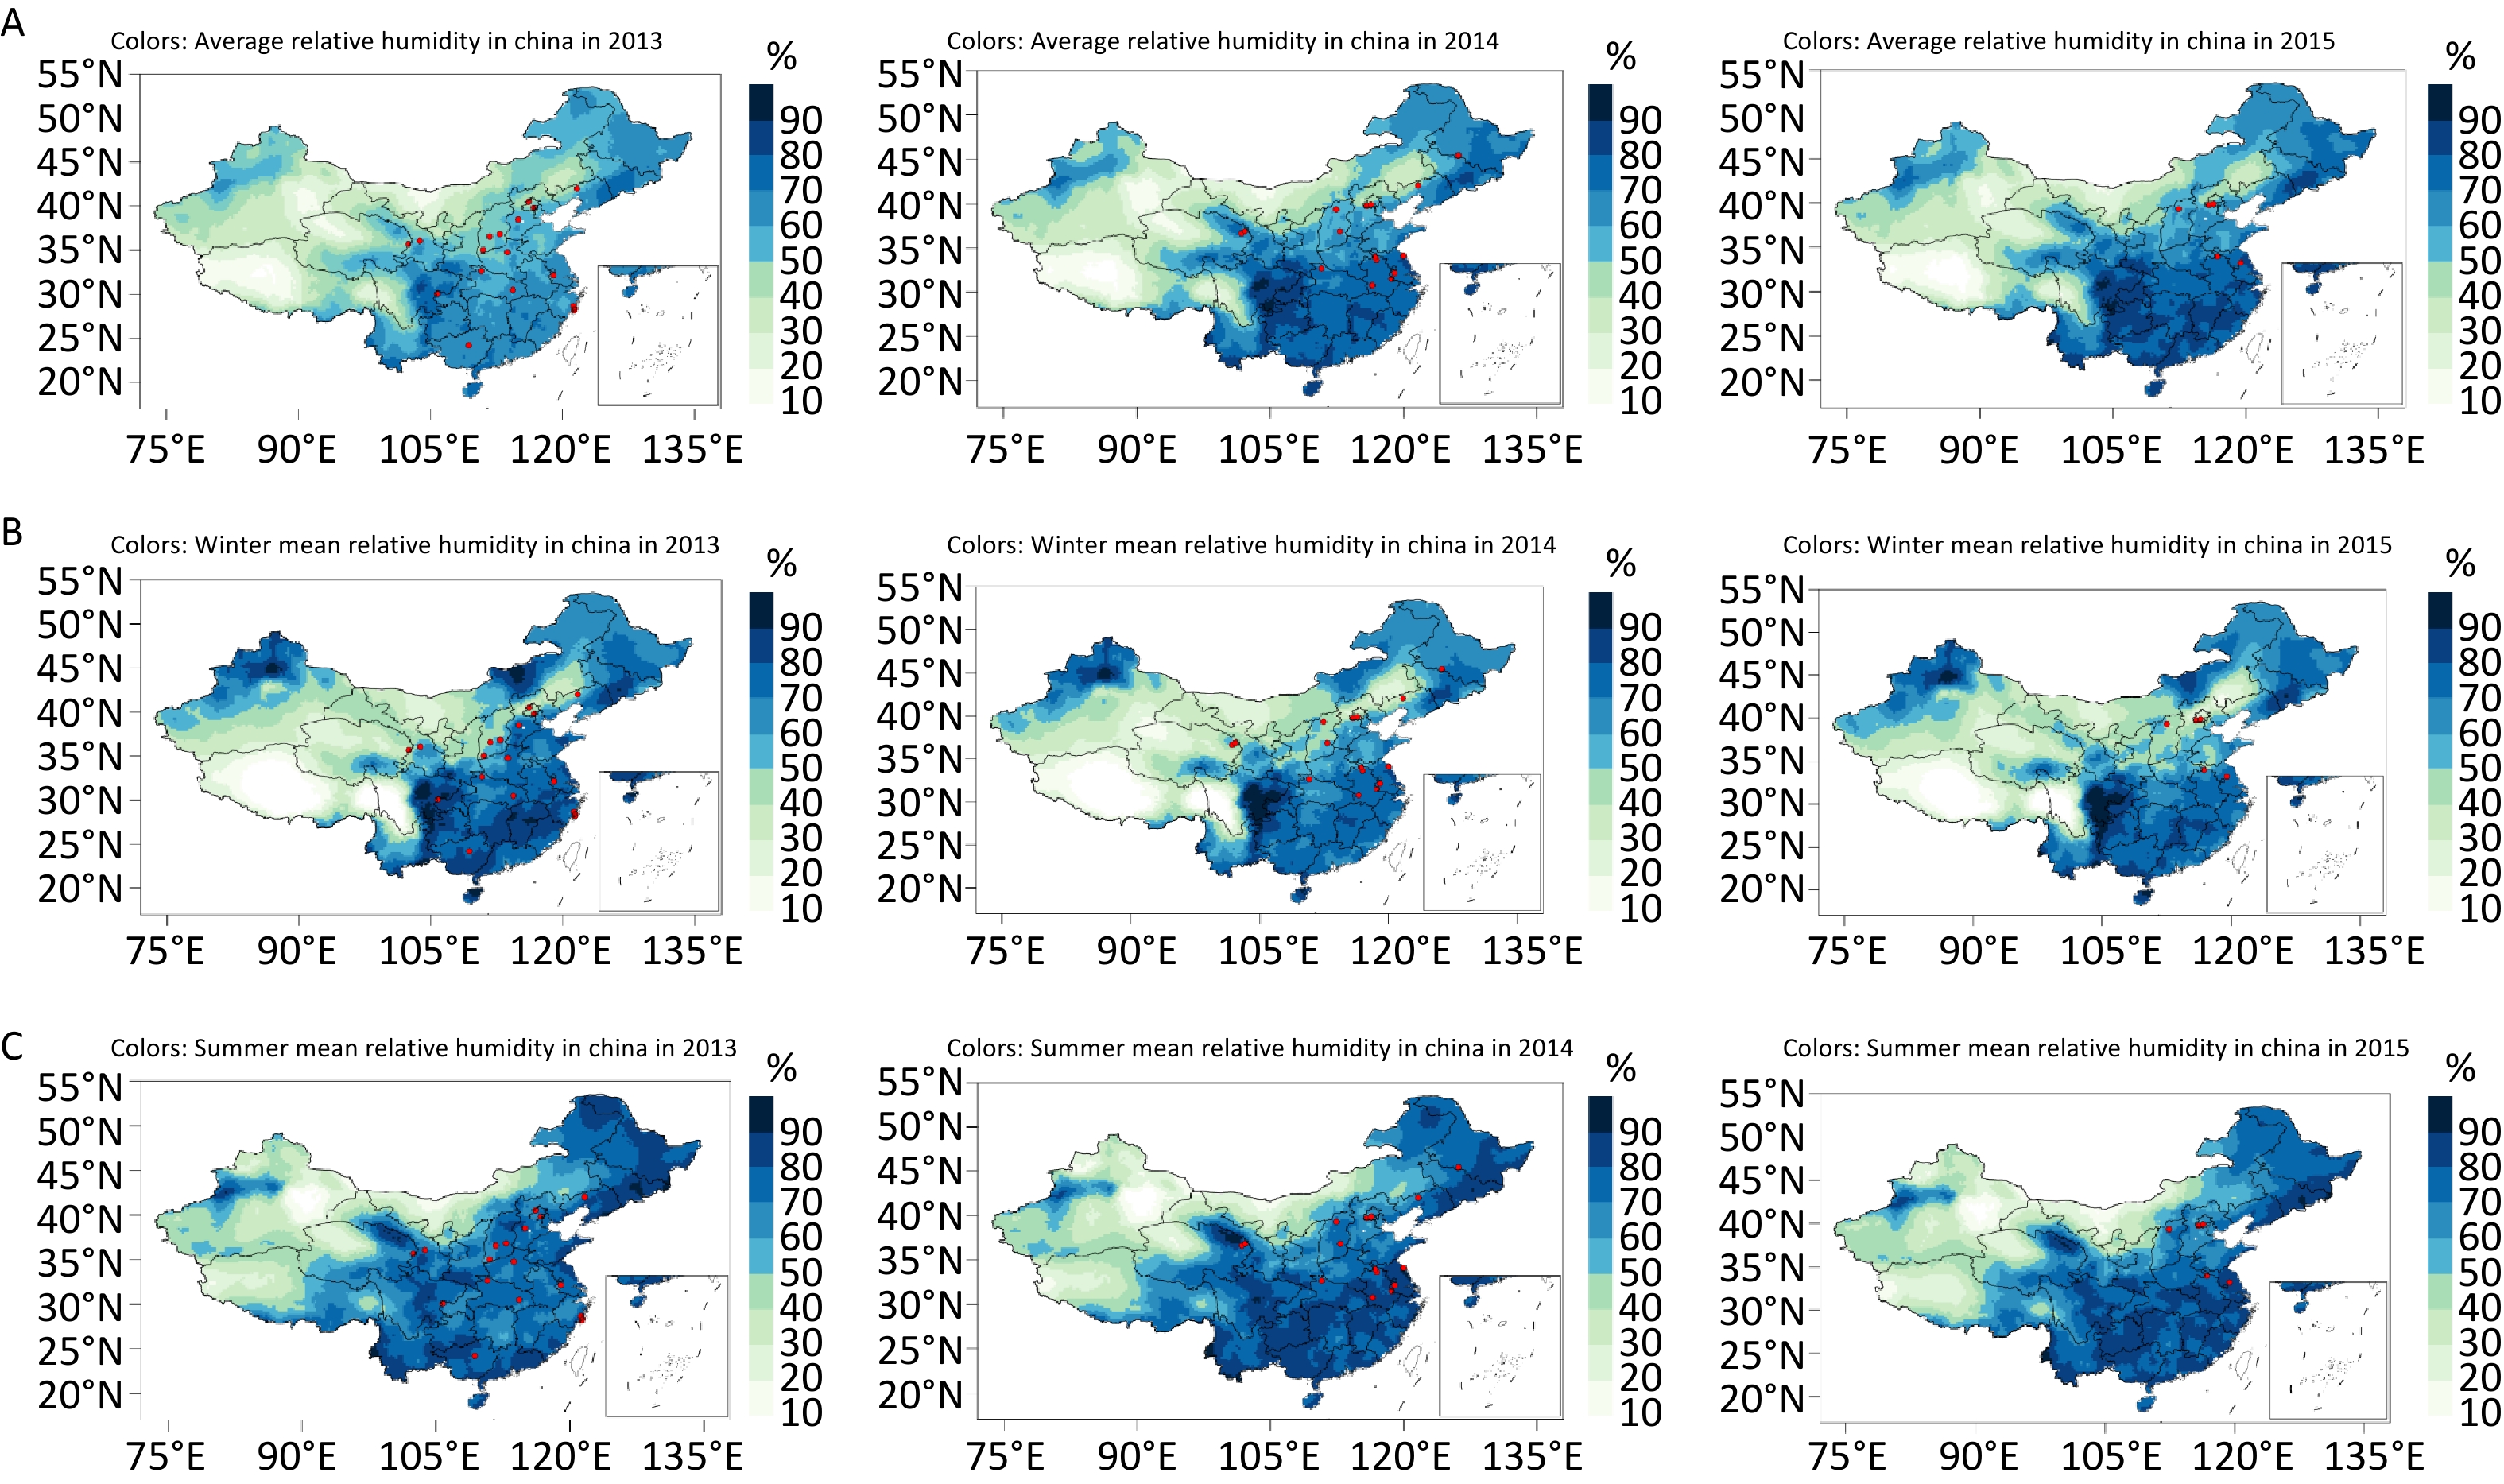
The total study population comprised 24,510 participants, and the median follow-up was 4.92 years. A total of 973 CVD events occurred. The incidence of CVD events was 4.96% (n = 562) in males and 3.12% (n = 411) in females (P < 0.001). Details of the baseline characteristics of the study participants are shown in Table 1. The mean age of participants was 56.31 years. Males (57.05 years) were slightly older than females (55.67 years). Diabetes, dyslipidemia, and hypertension were more prevalent in males than in females, whereas females had a higher proportion of nonsmokers, a higher prevalence of CVD family history and medication history, and a higher BMI. The annual, summer, and winter average temperatures during the baseline survey were 12.71 °C, 23.86 °C, and –0.32 °C, respectively. The PM2.5 concentration at baseline survey was 62.10 μg/m3. Given China’s typical continental climate, the RH increased from the northern to southern regions. The annual, winter, and summer average RH in this study were 65.96%, 61.28%, and 74.97%, respectively. Supplementary Figure S1 (available in www.besjournal.com) presents a map of China with the average annual, winter, and summer RH during the baseline survey period, which shows the humidity to be generally higher in the southern regions than in the northern regions.
Table 1. Baseline characteristics of the study participants
Characteristics Total (n = 24,510) Male (n = 11,322) Female (n = 13,188) P value Demographics Age (years) 56.31 ± 13.11 57.05 ± 13.25 55.67 ± 12.96 < 0.001 Han ethnicity (%) 22,076 (90.80) 10,292 (90.91) 11,784 (89.36) < 0.001 Education (≥ Middle school) 11,978 (48.87) 6,427 (56.77) 5,551 (42.09) < 0.001 Urban (%) 13,404 (54.69) 6,099 (53.87) 7,305 (55.40) 0.017 Characteristics Smoking (%) 16,996 (69.35) 6,952 (61.40) 562 (4.26) < 0.001 Alcohol drinking (%) 6,842 (27.92) 5,909 (52.20) 933 (7.08) < 0.001 BMI (kg/m2) 24.54 ± 3.49 24.37 ± 3.37 24.68 ± 3.58 < 0.001 Obesity (%) 4,257 (17.56) 1,773 (15.85) 2,484 (19.03) < 0.001 Fasting blood glucose 5.57 ± 1.54 5.62 ± 1.56 5.53 ± 1.52 < 0.001 Diabetes mellitus (%) 2,535 (10.36) 1,249 (11.05) 1,286 (9.76) 0.001 TC 4.79 ± 0.99 4.71 ± 0.95 4.85 ± 1.01 < 0.001 HDL-C 1.36 ± 0.34 1.32 ± 0.35 1.40 ± 0.33 < 0.001 LDL-C 2.80 ± 0.82 2.75 ± 0.80 2.85 ± 0.83 < 0.001 TG 1.45 ± 1.02 1.50 ± 1.14 1.41 ± 0.91 0.5162 Dyslipidemia (%) 8,377 (34.22) 4,215 (37.27) 4,162 (31.60) < 0.001 SBP 132.02 ± 20.19 132.86 ± 19.12 131.30 ± 21.04 < 0.001 DBP 77.22 ± 11.05 79.22 ± 11.06 75.50 ± 10.75 < 0.001 Hypertension (%) 9,732 (39.71) 4,708 (41.59) 5,024 (38.10) < 0.001 CVD family History (%) 2,824 (11.52) 1,220 (10.78) 1,604 (12.16) < 0.001 Medication therapy (%) 5,393 (22.00) 2,414 (21.32) 2,979 (22.59) 0.017 Environmental characteristics Annual temperature (°C) 12.71 ± 4.88 12.68 ± 4.87 12.74 ± 4.88 0.868 Summer average temperature (°C) 23.86 ± 4.27 23.87 ± 4.27 23.85 ± 4.88 0.434 Winter average temperature (°C) –0.32 ± 6.70 –0.39 ± 6.72 –0.26 ± 6.67 0.578 PM2.5 (μg/m3) 74.97 ± 7.05 75.14 ± 6.97 74.83 ± 7.11 0.006 Annual average relative humidity (%) 61.28 ± 13.46 61.62 ± 13.36 60.99 ± 13.53 0.002 Summer average relative humidity (%) 62.10 ± 22.71 61.68 ± 22.44 62.46 ± 22.94 0.007 Winter average relative humidity (%) 65.96 ± 9.82 66.17 ± 9.75 65.78 ± 9.86 0.005 Note. Data are expressed as mean ± standard deviation (SD) or n (%). CVD, cardiovascular disease; BMI, body mass index; TC, total cholesterol; HDL-C, high-density lipoprotein cholesterol; LDL-C, low-density lipoprotein cholesterol; TG, triglycerides; SBP, systolic blood pressure; DBP, diastolic blood pressure; PM2.5, particulate matter of diameter ≤ 2.5 mm. -
In Model 3, after adjusting for confounders of age, sex, ethnic minorities, education, urban, drinking, smoking, BMI, diabetes mellitus, dyslipidemia, hypertension, CVD family history, medication therapy, temperature, PM2.5, the HR (95% CI) of CVD risk was 1.06 (95% CI: 0.97–1.15), 1.17 (95% CI: 1.04–1.31), and 1.02 (95% CI: 0.95–1.09) per 10% increase in annual, summer, and winter mean RH, respectively. RH was divided into quintiles in ascending order, with the 3rd quintile used as the reference. The participants in the 1st and 5th quintiles of RH had a higher risk of developing CVD. The HRs (95% CIs) for annual average RH in the 1st and 5th quintiles were 1.09 (0.89–1.35) and 1.30 (0.94–1.80), respectively. For summer mean RH, the HRs (95% CIs) for the 1st and 5th quintiles were 1.34 (95% CI: 1.04–1.71) and 1.44 (95% CI: 1.14, 1.83), respectively. In the case of winter mean RH, the HRs (95% CIs) for the 1st and 5th quintiles were 1.16 (95% CI: 0.92–1.47) and 1.39 (95% CI: 1.10–1.75), respectively. This indicates that both dry and wet environments increased the risk of CVD (Table 2).
Table 2. HR (95% CI) of the relationship between relative humidity and CVD
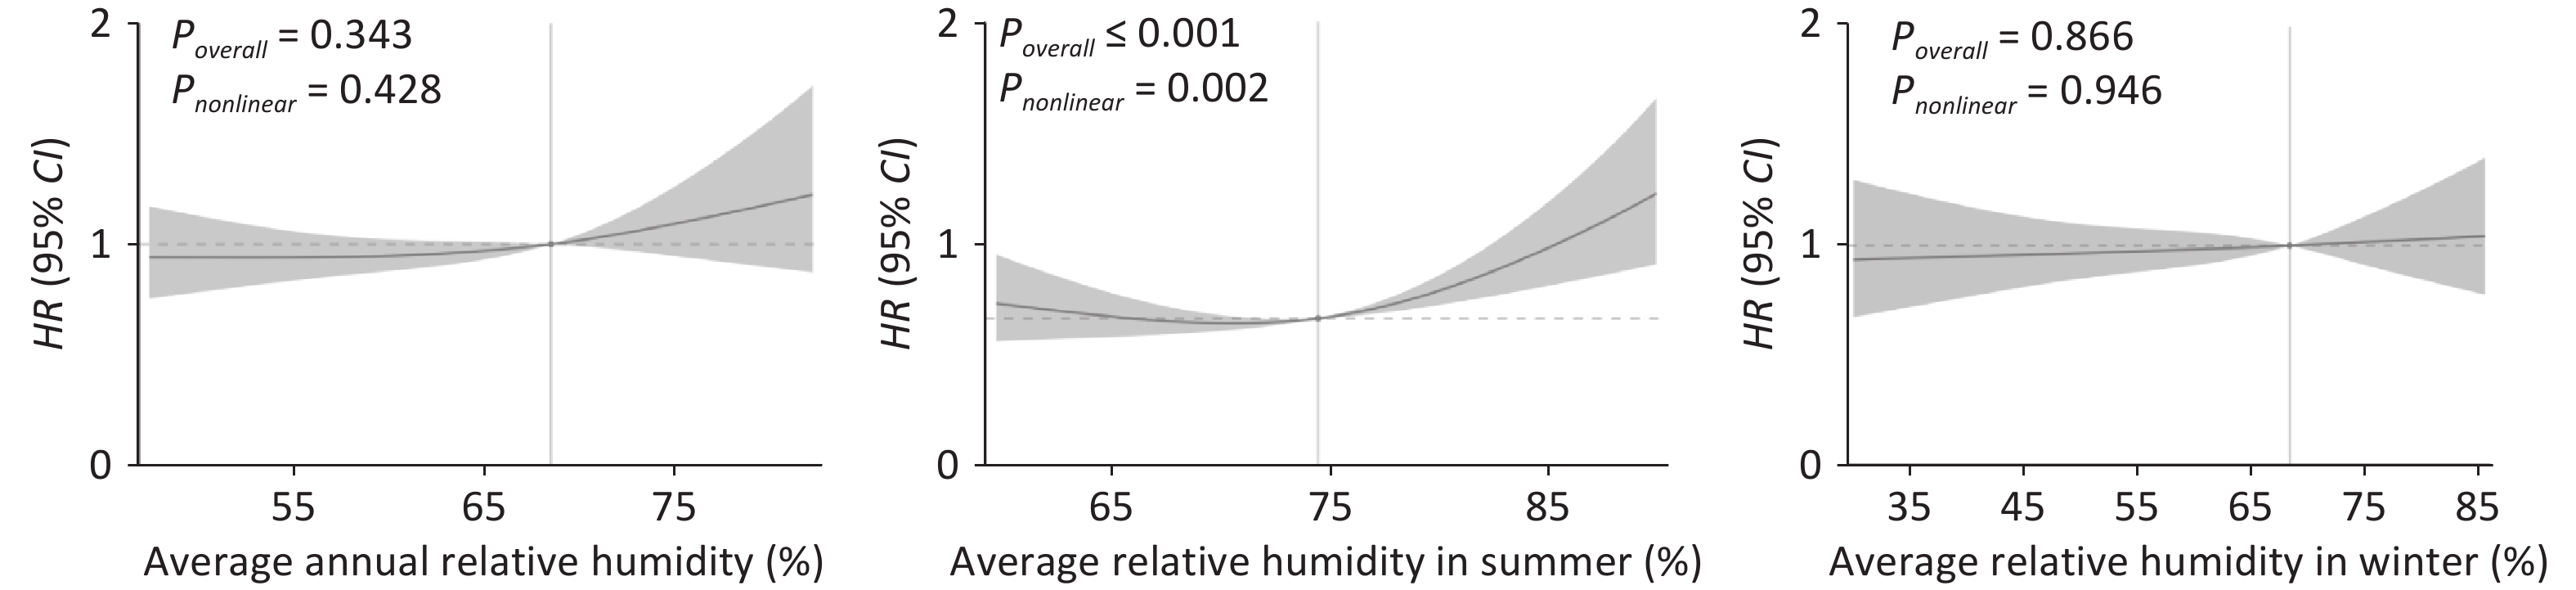
RH HR (95% CI) Crude model Model 1 Model 2 Model 3 Annual RH Per 10% Increment 0.99 (0.93–1.05) 0.95 (0.89–1.01) 1.06 (0.97–1.15) 1.06 (0.97–1.15) RH quintile 1st quintile 1.11 (0.91–1.35) 1.01 (0.83–1.22) 1.09 (0.88–1.34) 1.09 (0.89–1.35) 2nd quintile 0.62 (0.49–0.78) 0.64 (0.51–0.80) 0.58 (0.46–0.74) 0.58 (0.46–0.74) 3rd quintile (reference) 1.00 1.00 1.00 1.00 4th quintile 1.08 (0.88–1.32) 1.01 (0.83–1.23) 1.46 (1.12–1.89) 1.49 (1.14–1.95) 5th quintile 0.91 (0.76–1.09) 0.76 (0.63–0.91) 1.35 (0.99–1.86) 1.30 (0.94–1.80) Summer RH Per 10% Increment 1.04 (0.95–1.15) 1.03 (0.94–1.12) 1.16 (1.04–1.30) 1.17 (1.04–1.31) RH quintile 1st quintile 1.69 (1.36–2.10) 1.59 (1.28–1.98) 1.38 (1.07–1.76) 1.34 (1.04–1.71) 2nd quintile 1.25 (1.01–1.54) 1.30 (1.05–1.61) 1.07 (0.85–1.35) 1.05 (0.83–1.33) 3rd quintile (reference) 1.00 1.00 1.00 1.00 4th quintile 1.17 (0.93–1.46) 1.13 (0.90–1.42) 0.91 (0.70–1.18) 0.83 (0.63–1.10) 5th quintile 1.42 (1.16–1.75) 1.31 (1.06–1.61) 1.35 (1.08–1.68) 1.44 (1.14–1.83) Winter RH Per 10% Increment 0.96 (0.92–1.01) 0.94 (0.90–0.99) 1.02 (0.95–1.09) 1.02 (0.95–1.09) RH quintile 1st quintile 1.48 (1.19–1.85) 1.42 (1.14–1.77) 1.17 (0.93–1.49) 1.16 (0.92–1.47) 2nd quintile 1.20 (0.96–1.49) 1.23 (0.98–1.53) 1.01 (0.80–1.28) 1.01 (0.80–1.28) 3rd quintile (reference) 1.00 1.00 1.00 1.00 4th quintile 1.34 (1.09–1.64) 1.27 (1.03–1.56) 1.44 (1.15–1.80) 1.45 (1.15–1.81) 5th quintile 1.26 (1.02–1.56) 1.18 (0.96–1.46) 1.38 (1.10–1.75) 1.39 (1.10–1.75) Note. RH, relative humidity; HR, hazard ratio; CI, confidence interval; CVD, cardiovascular disease; Model 1 adjusted for age and sex; Model 2: Model 1+ ethnic minorities, education, urban area, drinking, smoking, BMI, diabetes mellitus, dyslipidemia, hypertension, CVD family history, CVD medication, and temperature; Model 3: Model 2+ PM2.5. The exposure-response relationship curves further demonstrated the relationship between RH and CVD risk (Figure 2). A U-shaped nonlinear relationship was observed between summer mean RH and CVD occurrence (Pnonlinear < 0.05). A serious risk of CVD occurrence with an extremely low humidity, and CVD risk decreased with an increase in humidity. However, after reaching the minimum risk of occurrence, the risk began to increase. These results were partially verified by the results of Cox regression analysis.

Figure 2. Exposure-response curves of the relationships between RH and incidence of CVD among Chinese adults, using a natural spline function. RH, relative humidity; CVD, cardiovascular disease; HR, hazard ratio; CI, confidence interval. HR was estimated by comparison with the median RH. The red curve represents the effect estimates of HR, and the light-red shaded area represents the 95% CI.
-
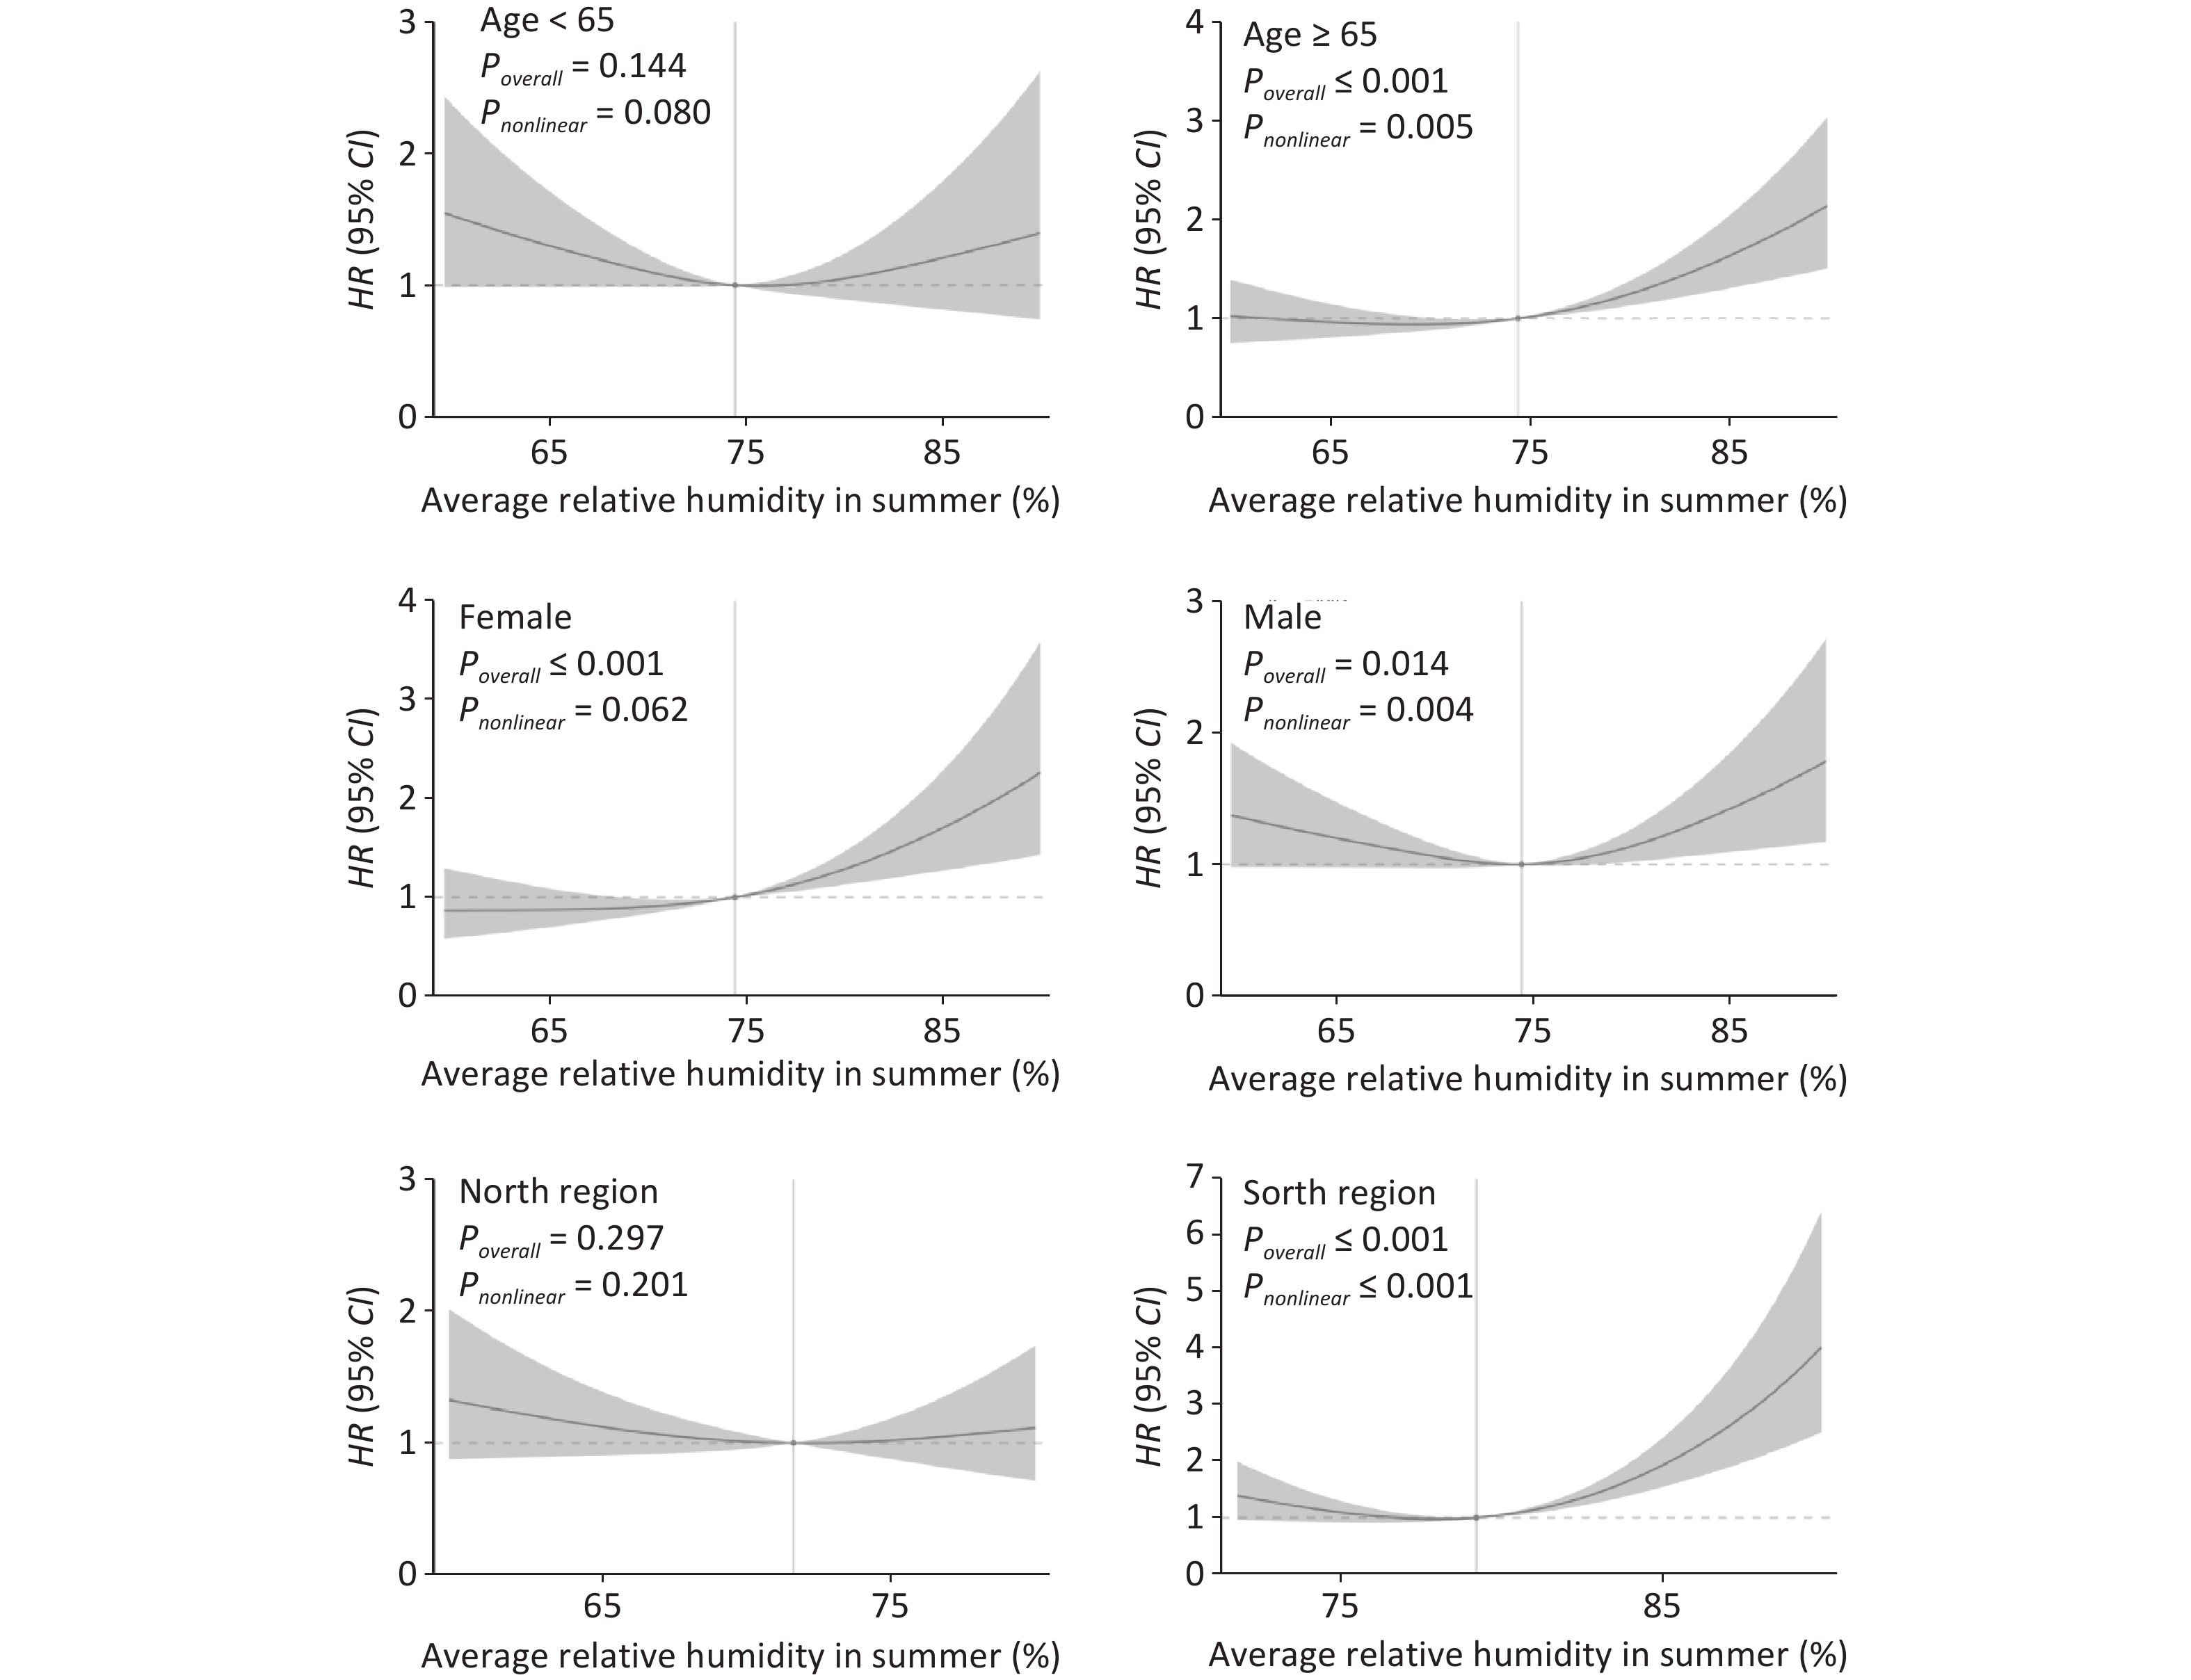
Age, sex, and geographical region were stratified and the analysis confirmed positive associations. The stratified exposure-response curves revealed significant variations in the relationship between summer RH and CVD risk across different groups (Figure 3). The findings indicated that the association between summer RH and CVD was particularly pronounced among females, individuals aged 65 and above, and those residing in the southern regions (Poverall ≤ 0.001).
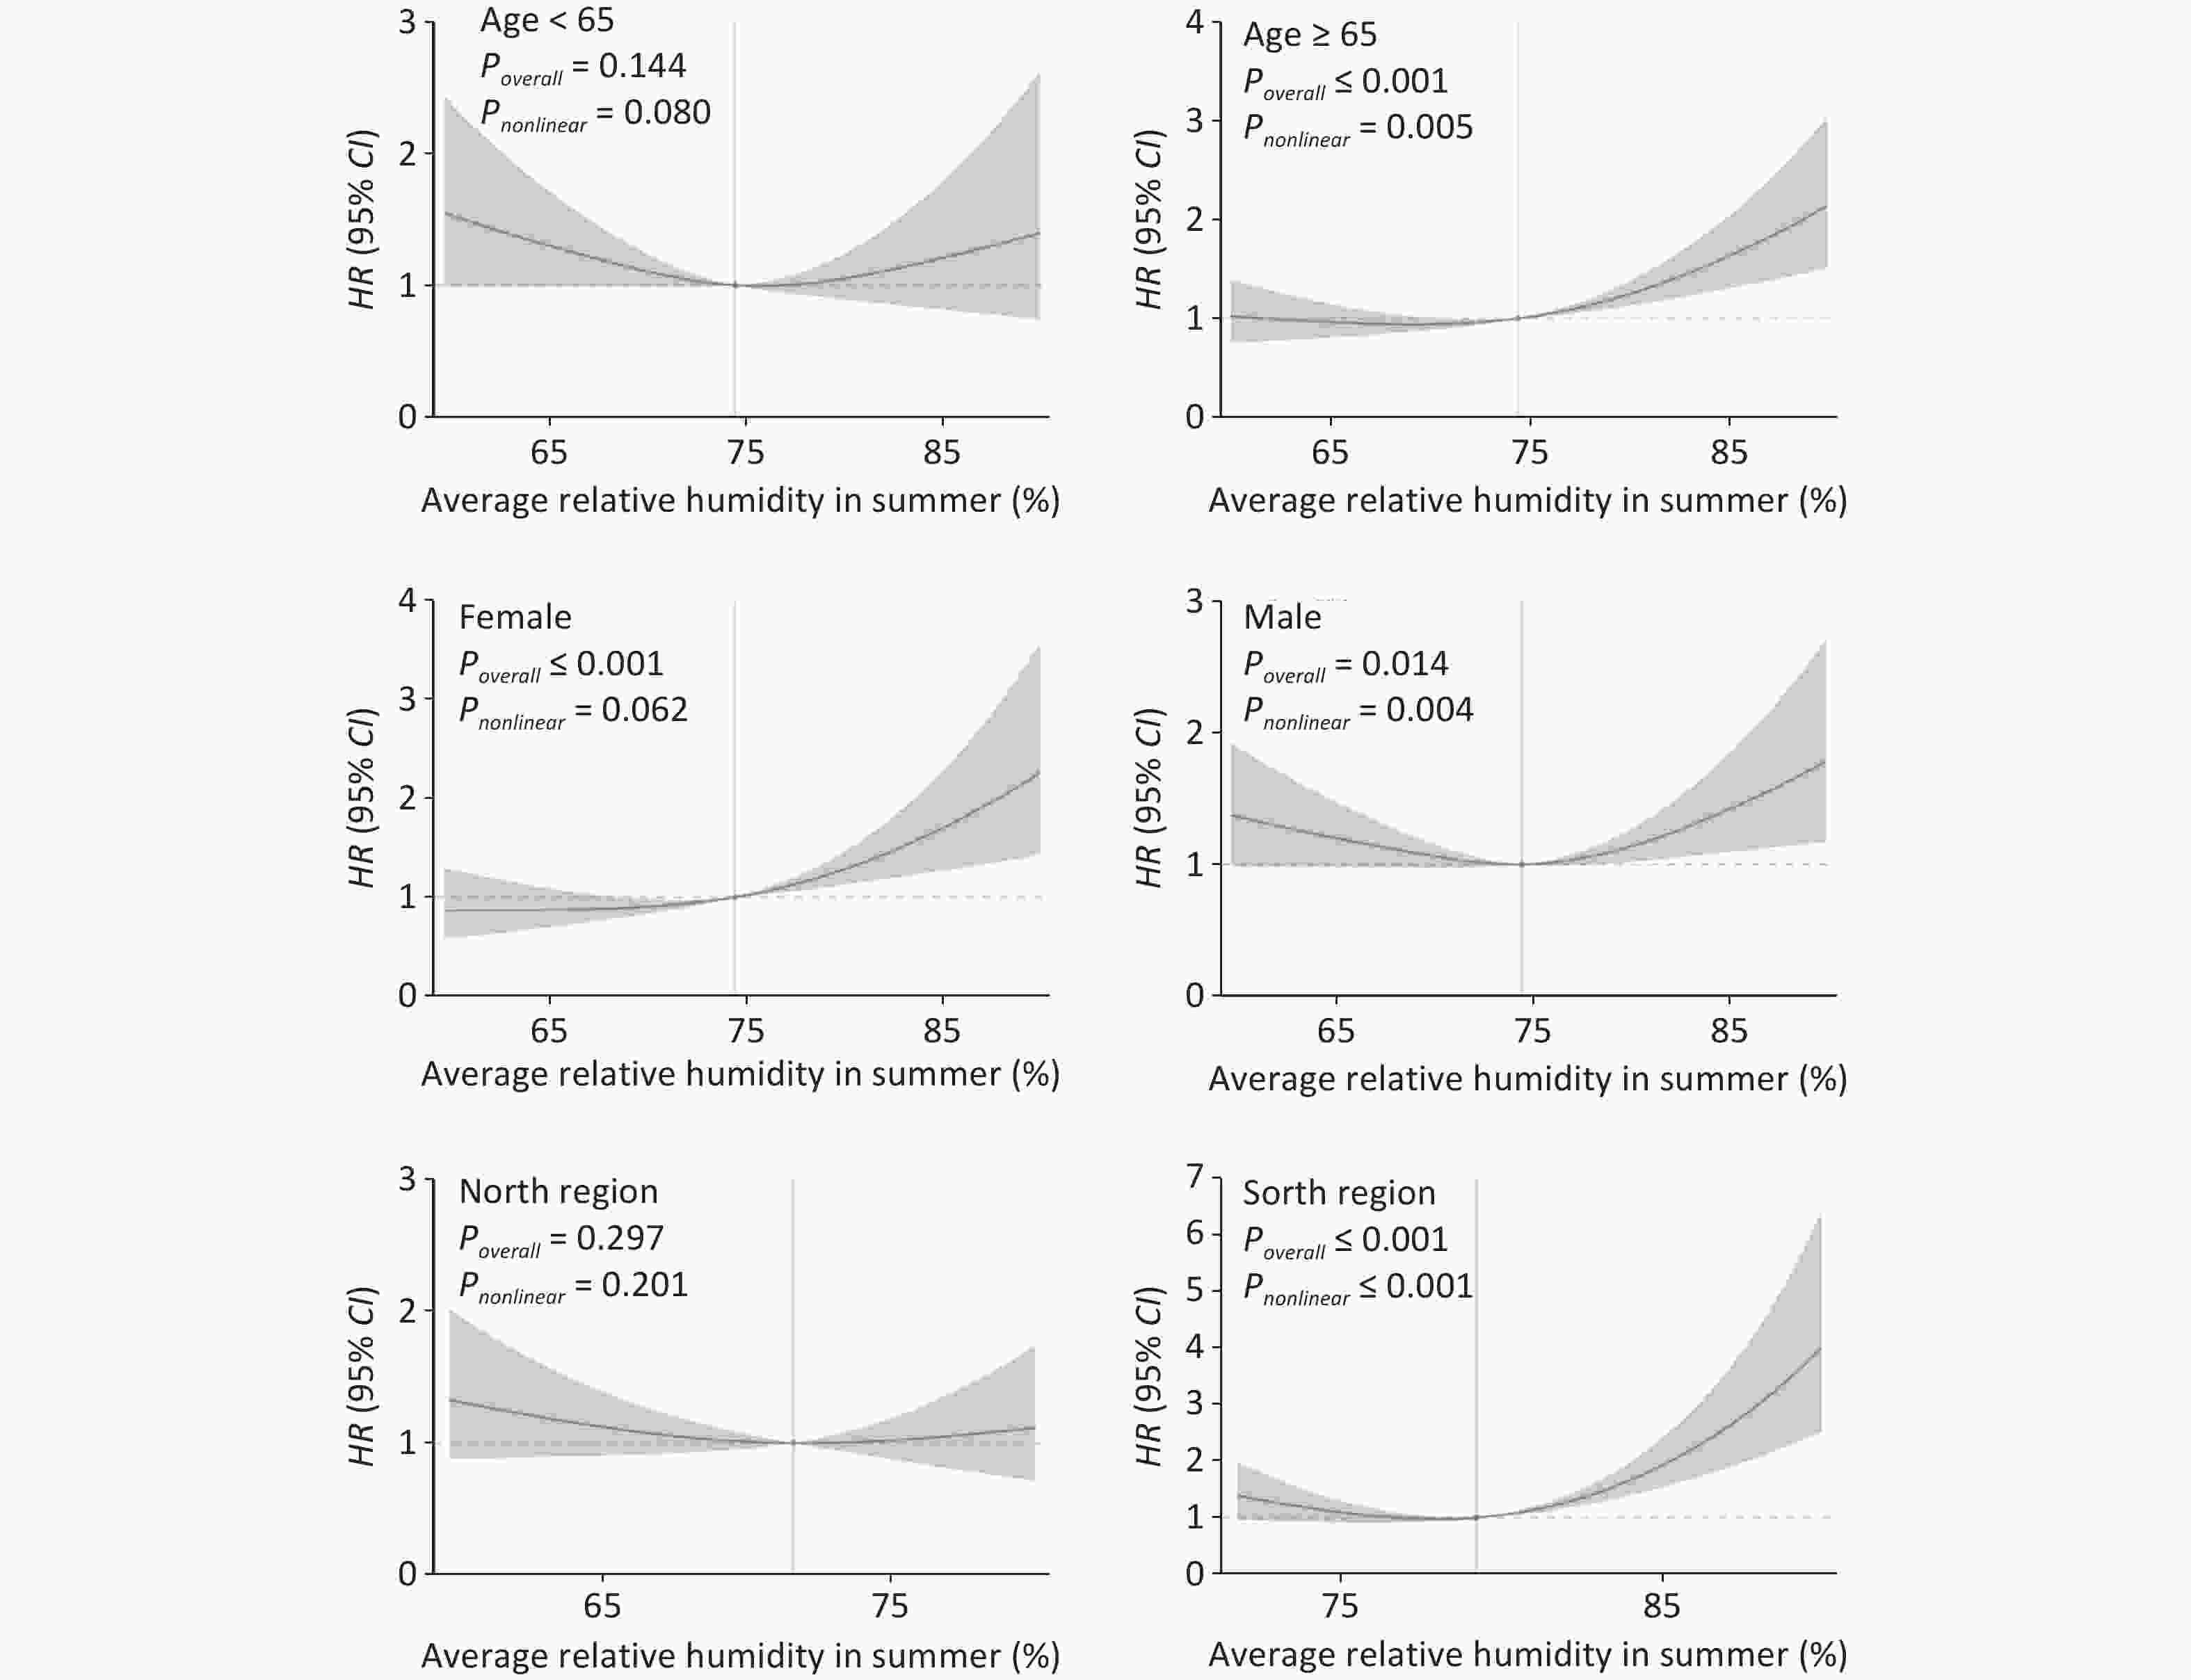
Figure 3. Exposure-response curves of the relationships between summer mean RH and incidence of CVD in various subgroups, using a natural spline function. RH, relative humidity; CVD, cardiovascular disease; HR, hazard ratio; CI, confidence interval. HR was estimated by comparison with the median RH. The red curve represents the effect estimates of HR, and the light-red shaded area represents the 95% CI.
-
In conclusion, our study revealed a significant U-shaped nonlinear relationship between RH and CVD during summer, with dry or humid conditions increasing the risk of CVD. Exposure to high RH was particularly hazardous for the occurrence of CVD. The relationship between RH and CVD was stronger in women, older adults, and those living in the south.
These results are consistent with those of previous studies on the relationship between humidity and CVD. Yang et al. reported an association between RH and the admission rate of patients with cerebral infarction and hypertensive nephropathy[30]. Similarly, a time-series study by Panagiotakos et al. found that the risk of acute coronary syndrome increased with an increase in RH by 1%[31]. Other studies have also highlighted the influence of RH on mortality during the summer season, with the highest mortality occurring on days of extreme heat and humidity[32,33]. Additionally, the incidence of stroke increases under conditions of extremely low or high RH[34], and both increasing and decreasing RH were associated with a slight increase in CVD admissions[35]. In Central Europe, dry or humid atmospheres have been associated with a significant increase in CVD mortality[36]. A study from Sydney also reported that summer mortality levels were associated with dry or wet atmospheres[37].
Several hypotheses have been proposed to explain the increased risk of mortality associated with exposure to high or low humidity. Humidity is a crucial environmental factor that affects heat stress and hydration status. Efficient heat dissipation occurs with a significant temperature and humidity difference between the skin surface and surrounding air[10]. Highly humid air slows down moisture evaporation from the skin surface, thereby affecting the body’s ability to sweat and cool itself[8]. Therefore, high humidity exacerbates the effects of heat stress and contributes to adverse health outcomes. As its severity increases, it may strain the cardiovascular system and augment existing heart-related diseases. In contrast, dry air in low-humidity environments leads to dehydration and narrowing of blood vessels[11]. Constriction of blood vessels impedes blood flow to the heart, potentially causing CVD and posing significant health risks.
Stratifying the study population by sex revealed that the impact of unsuitable humidity on CVD during summer was higher in women than in men. One possible reason for this is the effect of humidity on human sensation of temperature. Similar temperature conditions can be perceived differently under different humidity conditions[38]. Women with a higher body weight than men, can resist chills better and are more susceptible to thermal effects[39,40], which may aggravate the effect of humidity on CVD risk in the female population.
The stratification of the study population according to age revealed that the effects of unsuitable humidity on CVD during the summer months were riskier in those ≥ 65 years of age than in those < 65 years of age. This may be due to gradual physiological aging in older individuals and the possible weakening of sensory functions. The critical physiopathological factor is that with aging, sweating decreases, thermoregulation becomes difficult, and skin circulation weakens, making it more likely to induce disease[41,42] and intensify the effect of humidity on CVD in older age groups. Some studies have found a subsequent increase in mortality risk with age in wet and cold environments[43]. Both high- and low-humidity environments increase the mortality risk from influenza and pneumonia in older adults[44].
Stratification of the study population according to geographic region revealed that the effect of unsuitable humidity on CVD during the summer months was more significant in the southern region than in the northern region. This may be because of greater humidity variability observed in the southern region of China, leading to an amplified effect of relative humidity on CVD. Studies in southern China demonstrated the effects of humidity on CVD[9]. Further studies are required to refine the differences in the role of humidity on CVD risk in different regions.
-
This study had several strengths. First, it was conducted based on a nationally representative survey employing standardized procedures and strict quality control measures, resulting in reliable analytical data. Second, categorical analysis and RCS models were used to refine the relationship between dry or humid environments and CVD. Third, follow-up data confirmed the accuracy of the, considering the individual characteristics of the sample and controlling for confounding factors. Finally, a humidity data assessment was obtained from the NMIC of the CMA, which has a high spatial resolution, considerably enhancing the study accuracy. However, some limitations require consideration. First, a bias may have been introduced in the study, as information on participant characteristics was available only at baseline. Second, despite accounting for several confounding factors in our analyses, residual unmeasured covariates may have affected CVD occurrence. Third, indoor and outdoor humidity differed, and individual exposure varied with indoor ventilation and activity. However, such ecological fallacies cannot be avoided and may have influenced the results to some extent. Finally, changes in residential address during the follow-up period were not considered in this study, which may have caused a bias in the results.
-
This study reveals that humidity is a key factor affecting CVD in the context of climate change. Humidity was also found to have a greater impact on health in the summer, with both dry and wet conditions increasing the risk of CVD. Therefore, more attention should be paid to the effects of environmental humidity on health. It is recommended that humidity be controlled and maintained at a moderate level through measures, such as improving air circulation and using air conditioners and humidifiers.
-
Zengwu Wang had full access to all data in the study and takes responsibility for the integrity of the data and accuracy of the data analysis. Concept and design: Minmei He, Gang Huang, and Zengwu Wang. Drafting of the manuscript: Congyi Zheng, Jiamin Wu, and Haosu Tang. Statistical analysis: Congyi Zheng, and Jiamin Wu. Obtained funding and supervision: Zengwu Wang. Acquisition, analysis, and interpretation of data: All authors.
-
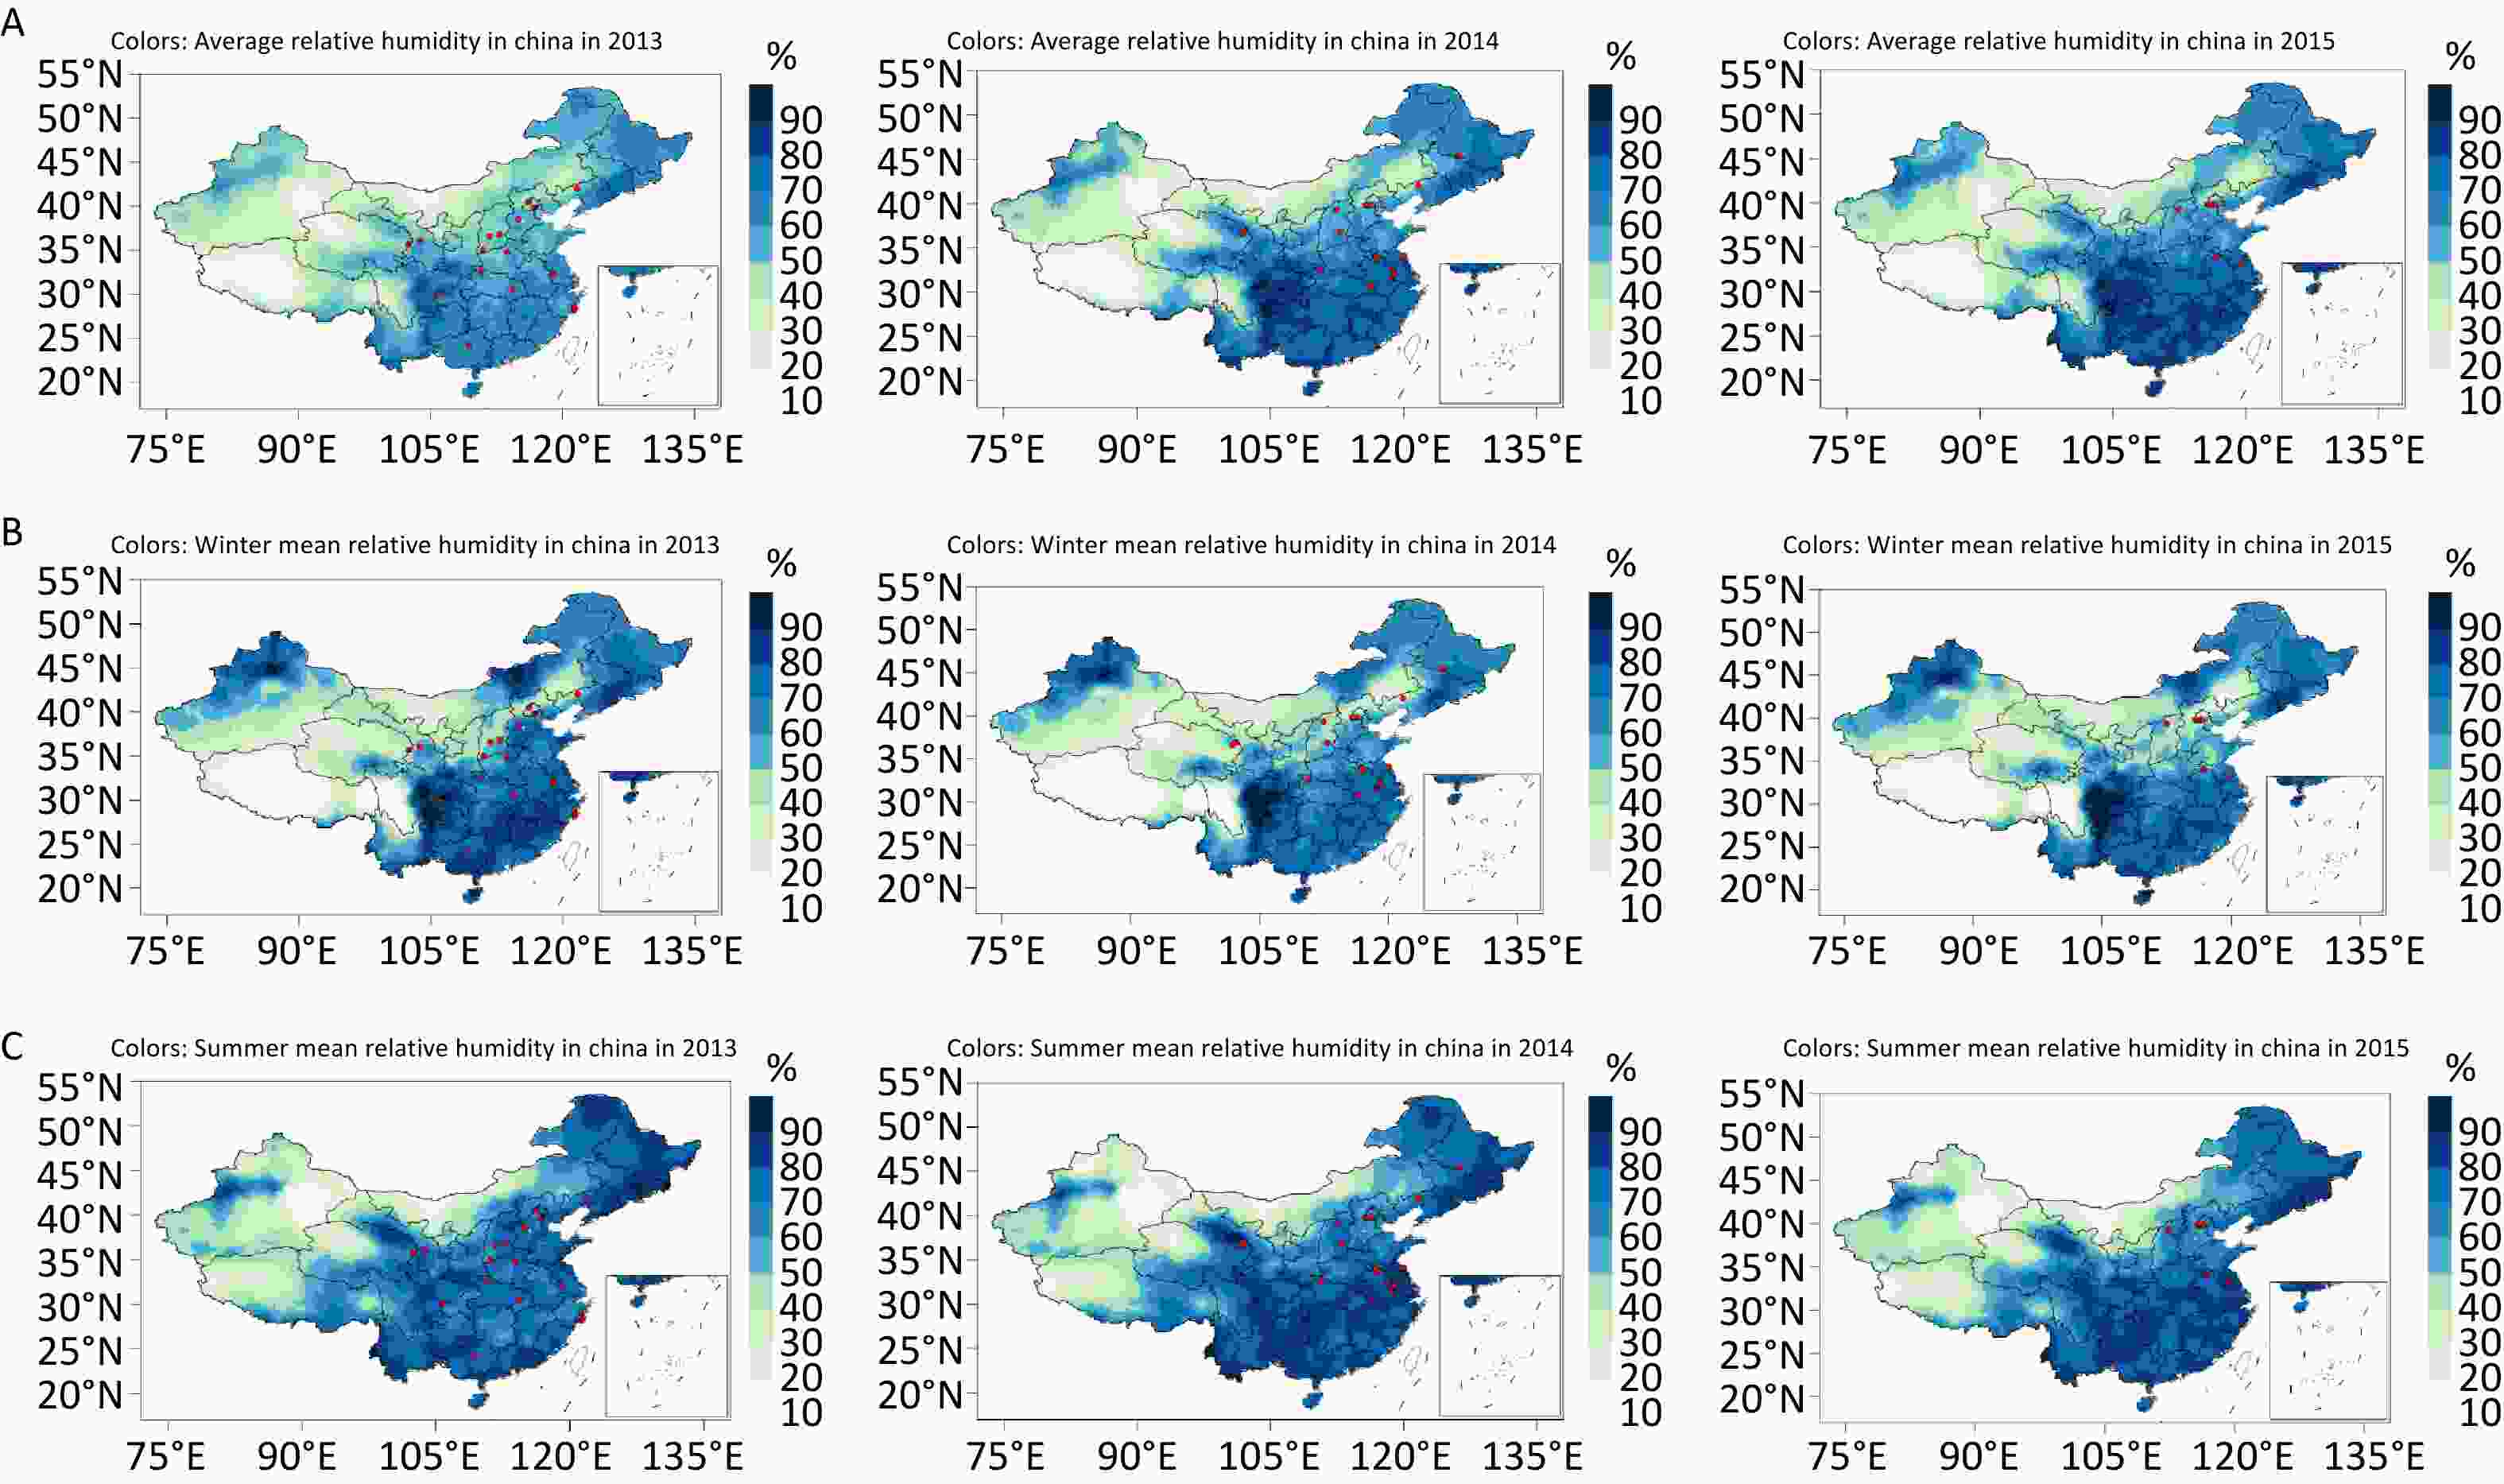
Figure S1. Average annual relative humidity (A), winter mean relative humidity (B), and summer mean relative humidity (C) in China, 2013–2015. Red dots denote survey sites in the baseline year.
全文HTML
Study Design and Participants
CVD Ascertainment
Environmental Exposure Assessment
Baseline Covariate Measurements
Statistical Analysis
Summary Statistics and the Population Characteristics
Relationship of Long-term Exposure to Relative Humidity with the Incidence of CVD
Effect Modification and Stratified Analyses
Strengths and Limitations
 24138+.pdf
|

|

 Quick Links