

 下载:
下载:

-
Vitamin D deficiency (VDD) has emerged as a major nutritional problem among children and adolescents. Numerous studies have documented the adverse health effects of VDD, including conditions such as chronic kidney diseases, hypoparathyroidism, and autoimmune diseases. Nevertheless, these studies were conducted only in adults and among individuals with underlying medical conditions. Adolescence is at a unique stage of growth, where nutritional deficiencies may have profound implications on their future health. Thus, there is an urgent need to conduct research on the impact of vitamin D deficiency on adolescent health.
Systemic inflammation (SI) relates to an rising risk of various physical and mental health problems, including cardiovascular diseases (CVDs), cancer, depression, autoimmune diseases, and neurodegenerative diseases. Understanding the modifiable triggers of SI could offer clues for promoting health, especially in a critical period of life, such as adolescence. Increasing evidence has shown that VDD is a notable risk factor leading to SI. Biologically, vitamin D metabolizing enzymes and vitamin D receptors are expressed in innate and adaptive immune tissues. Vitamin D plays its anti-inflammatory functions via a variety of mechanisms, such as upregulating MAP kinase, inhibiting the NF-κB signaling pathway, and regulating several cytokine levels[1]. A meta-analysis that reviewed eight studies conducted on children and adolescents reported a link of vitamin D levels with biomarkers of oxidative stress and inflammation in children and adolescents[2]. However, most of these studies were retrospective or cross-sectional, and only a few longitudinal cohorts have explored the relationship between vitamin D levels and inflammatory in adolescents.
Peripheral blood cell counts associated with infection and inflammation, including white blood cell (WBC) counts, lymphocyte count (LC), and neutrophil count (NC), have been reported to correlate with vitamin D levels[3]. Neutrophil-lymphocyte ratio (NLR) and platelet count (PLT) to platelet/lymphocyte ratio (PLR), derived from LC, NC, and PLT, are inexpensive biomarkers of systemic inflammation and are also known to be linked with vitamin D levels. In addition, an correlation between vitamin D levels and rising red blood cell distribution width (RDW) was reported. Associations between mean platelet volume (MPV), PLT and systemic immune inflammation index (SII) and vitamin D have also been presented in previous studies[4]. However, there is a lack of empirical research establishing an association between VDD and inflammation indexes in adolescents.
A review of previous studies found major sex differences in vitamin D deficiency, with most studies showing a higher prevalence in women than men. Previous studies have observed sexual dimorphism in inflammatory activity. Therefore, sex differences in the relationship between vitamin D and SI need to be explored. This study aimed to explore the longitudinal association and the sex differences between vitamin D levels and SI markers in early adolescence.
The study abides by the STROBE (Strengthening the Reporting of Observational Studies in Epidemiology) guidelines (Supplementary Table S1, available in www.besjournal.com).
Table S1. STROBE Statement—Checklist of items that should be included in reports of cohort studies
Items Item No Recommendation Title and abstract 1 (a) Indicate the study’s design with a commonly used term in the title or the abstract (b) Provide in the abstract an informative and balanced summary of what was done and what was found Introduction Background/
rationale2 Explain the scientific background and rationale for the investigation being reported Objectives 3 State specific objectives, including any prespecified hypotheses Methods Study design 4 Present key elements of study design early in the paper Setting 5 Describe the setting, locations, and relevant dates, including periods of recruitment, exposure, follow-up, and data collection Participants 6 (a) Give the eligibility criteria, and the sources and methods of selection of participants. Describe methods of follow-up (b) For matched studies, give matching criteria and number of exposed and unexposed Variables 7 Clearly define all outcomes, exposures, predictors, potential confounders, and effect modifiers. Give diagnostic criteria, if applicable Data sources/ measurement 8* For each variable of interest, give sources of data and details of methods of assessment (measurement). Describe comparability of assessment methods if there is more than one group Bias 9 Describe any efforts to address potential sources of bias Study size 10 Explain how the study size was arrived at Quantitative variables 11 Explain how quantitative variables were handled in the analyses. If applicable, describe which groupings were chosen and why
Statistical methods12 (a) Describe all statistical methods, including those used to control for confounding (b) Describe any methods used to examine subgroups and interactions (c) Explain how missing data were addressed (d) If applicable, explain how loss to follow-up was addressed (e) Describe any sensitivity analyses Results Participants 13* (a) Report numbers of individuals at each stage of study—eg numbers potentially eligible, examined for eligibility, confirmed eligible, included in the study, completing follow-up, and analysed (b) Give reasons for non-participation at each stage (c) Consider use of a flow diagram Descriptive data 14* (a) Give characteristics of study participants (eg demographic, clinical, social) and information on exposures and potential confounders (b) Indicate number of participants with missing data for each variable of interest (c) Summarise follow-up time (eg, average and total amount) Outcome data 15* Report numbers of outcome events or summary measures over time Main results 16 (a) Give unadjusted estimates and, if applicable, confounder-adjusted estimates and their precision (eg, 95% confidence interval). Make clear which confounders were adjusted for and why they were included (b) Report category boundaries when continuous variables were categorized (c) If relevant, consider translating estimates of relative risk into absolute risk for a meaningful time period Other analyses 17 Report other analyses done—eg analyses of subgroups and interactions, and sensitivity analyses Discussion Key results 18 Summarise key results with reference to study objectives Limitations 19 Discuss limitations of the study, taking into account sources of potential bias or imprecision. Discuss both direction and magnitude of any potential bias Interpretation 20 Give a cautious overall interpretation of results considering objectives, limitations, multiplicity of analyses, results from similar studies, and other relevant evidence Generalisability 21 Discuss the generalisability (external validity) of the study results Other information Funding 22 Give the source of funding and the role of the funders for the present study and, if applicable, for the original study on which the present article is based Note. *Give information separately for exposed and unexposed groups. An Explanation and Elaboration article discusses each checklist item and gives methodological background and published examples of transparent reporting. The STROBE checklist is best used in conjunction with this article (freely available on the Web sites of PLoS Medicine at http://www.plosmedicine.org/, Annals of Internal Medicine at http://www.annals.org/, and Epidemiology at http://www.epidem.com/). Information on the STROBE Initiative is available at http://www.strobe-statement.org. Data were collected from the Chinese Early Adolescent Cohort (CEAC), which consisted of 1,860 early adolescents from a middle school in Huaibei City, Anhui Province, using random cluster sampling from September 2019 to September 2021. The baseline survey (wave 1) included all seventh grade students of the selected school. Demographic and health-related information of the participants was collected through questionnaires, and participants with any diagnosed organic or chronic disease (including chronic kidney and/or liver diseases and inflammatory diseases) that may impact vitamin D metabolism and inflammatory levels were excluded from the study. As blood parameters may vary according to different health conditions, adolescents with > 4 standard deviations (SDs) in the number of each cell type (WBC and RBC) and participants for whom serum 25(OH)D and blood inflammation indicator levels at wave 1 and wave 3 could not be obtained were excluded. Finally, a total of 1,423 participants were included in the final analysis (Supplementary Table S2, available in www.besjournal.com).
Table S2. Description of the main sample characteristics
Variables Overall Males Females P value Mean or n SD or % Mean or n SD or % Mean or n SD or % Wave1 (n = 1,423) WBC (×109/L) 7.22 2.11 7.18 2.14 7.30 2.06 0.321 LC (×109/L) 2.61 0.69 2.63 0.68 2.57 0.70 0.071 NC (×109/L) 3.85 1.96 3.79 1.99 3.95 1.90 0.15 RDW (%) 13.37 0.76 13.50 0.74 13.17 0.76 < 0.001 PLT (×109/L) 283.88 61.09 284.52 61.57 282.86 60.35 0.626 MPV (fL) 10.59 1.09 10.57 1.13 10.62 1.04 0.491 PLR 114.68 33.56 113.44 32.81 116.65 34.66 0.087 NLR 1.58 0.90 1.54 0.90 1.65 0.90 0.029 SII (×109/L) 438.60 255.61 426.81 253.87 457.32 257.49 0.033 VD (ng/mL) 23.23 5.68 23.93 5.75 22.13 5.38 < 0.001 VDD Yes 410 28.8 202 23.2 208 37.4 < 0.001 No 1013 71.2 666 76.8 347 62.6 Wave3 (n = 1,348) WBC (×109/L) 7.96 2.07 7.80 2.02 8.21 2.12 < 0.001 LC (×109/L) 2.33 0.66 2.38 0.65 2.26 0.67 < 0.001 NC (×109/L) 4.67 2.11 4.44 2.02 5.04 2.19 0.002 RDW (%) 13.37 0.72 13.31 0.56 13.47 0.91 0.621 PLT (×109/L) 309.91 78.15 302.25 75.22 322.06 81.19 < 0.001 MPV (fL) 9.75 0.99 9.73 1.02 9.77 0.95 < 0.001 PLR 141.59 48.45 135.23 45.92 151.68 50.64 0.469 NLR 2.17 1.17 2.02 1.08 2.42 1.27 < 0.001 SII (×109/L) 684.87 424.34 616.58 376.06 793.27 471.81 < 0.001 VD (ng/mL) 19.25 5.80 20.12 5.89 17.88 5.38 0.912 VDD Yes 780 57.9 411 49.7 369 70.8 < 0.001 No 568 42.1 416 50.3 152 29.2 Note. Data for numerical variables are expressed in terms of mean ± standard deviation and data for categorical variables in terms of frequency and percentage. A Kolmogorov–Smirnov normality test was used to determine the normal distribution of the variables. The Mann–Whitney U test was used for independent variables not normally distributed, and the Wilcoxon test was used for dependent variables. WBC, white blood cell; LC, lymphocyte count; NC, neutrophil count; RDW, red blood cell distribution width; PLT, platelet count; MPV, mean platelet volume; NLR, neutrophil to lymphocyte ratio; PLR, platelet to lymphocyte ratio; SII, systemic immune inflammation index. During the baseline and the third wave follow-up, nurses were commissioned to take fasting blood samples of the participants. After centrifuging, the serum samples were obtained and stored in the refrigerator at –80 °C until testing. The serum 25(OH)D concentrations (ng/mL) in the first and third wave were determined by LIAISON 25 OH total vitamin D assay. Using the cut-off point — 20 ng/mL for vitamin D deficiency, participants were grouped into vitamin D deficiency group (25(OH)D < 20 ng/mL) and for vitamin D non-deficiency group (25(OH)D ≥ 20 ng/mL). Vitamin D deficiency trajectories across two waves were defined as no VDD, new VDD, remitted VDD, and persistent VDD (Supplementary Table S3, available in www.besjournal.com).
Table S3. Definition of vitamin D deficiency trajectory
Variables 25(OH)D levels of wave 1 (ng/mL) 25(OH)D levels of wave 3 (ng/mL) No VDD ≥ 20 ≥ 20 New VDD ≥ 20 < 20 Remitted VDD < 20 ≥ 20 Persistent VDD < 20 < 20 Note. (1) defined as no VDD when the 25(OH)D of both wave 1 and wave 3 is greater than or equal to 20 ng/mL (reference group); (2) defined as new VDD when the 25(OH)D of wave 1 is greater than or equal to 20 ng/mL and the 25(OH)D of wave 3 is less than 20 ng/mL; (3) defined as remitted VDD when the 25(OH)D of wave 1 is less than 20 ng/mL and the 25(OH)D of wave 3 is greater than or equal to 20 ng/mL; (4) defined as persistent VDD when the 25(OH)D is less than 20 ng/mL across two waves. At baseline and the third wave follow-up, fasting blood samples were immediately sent to the laboratory for routine blood analysis with Sysmox-XS-800i hematology analyzer. Basic measurements include WBC count, LC, NC, RDW, and PLT. PLR, NLR, and SII indicating systemic inflammation were calculated as follows:
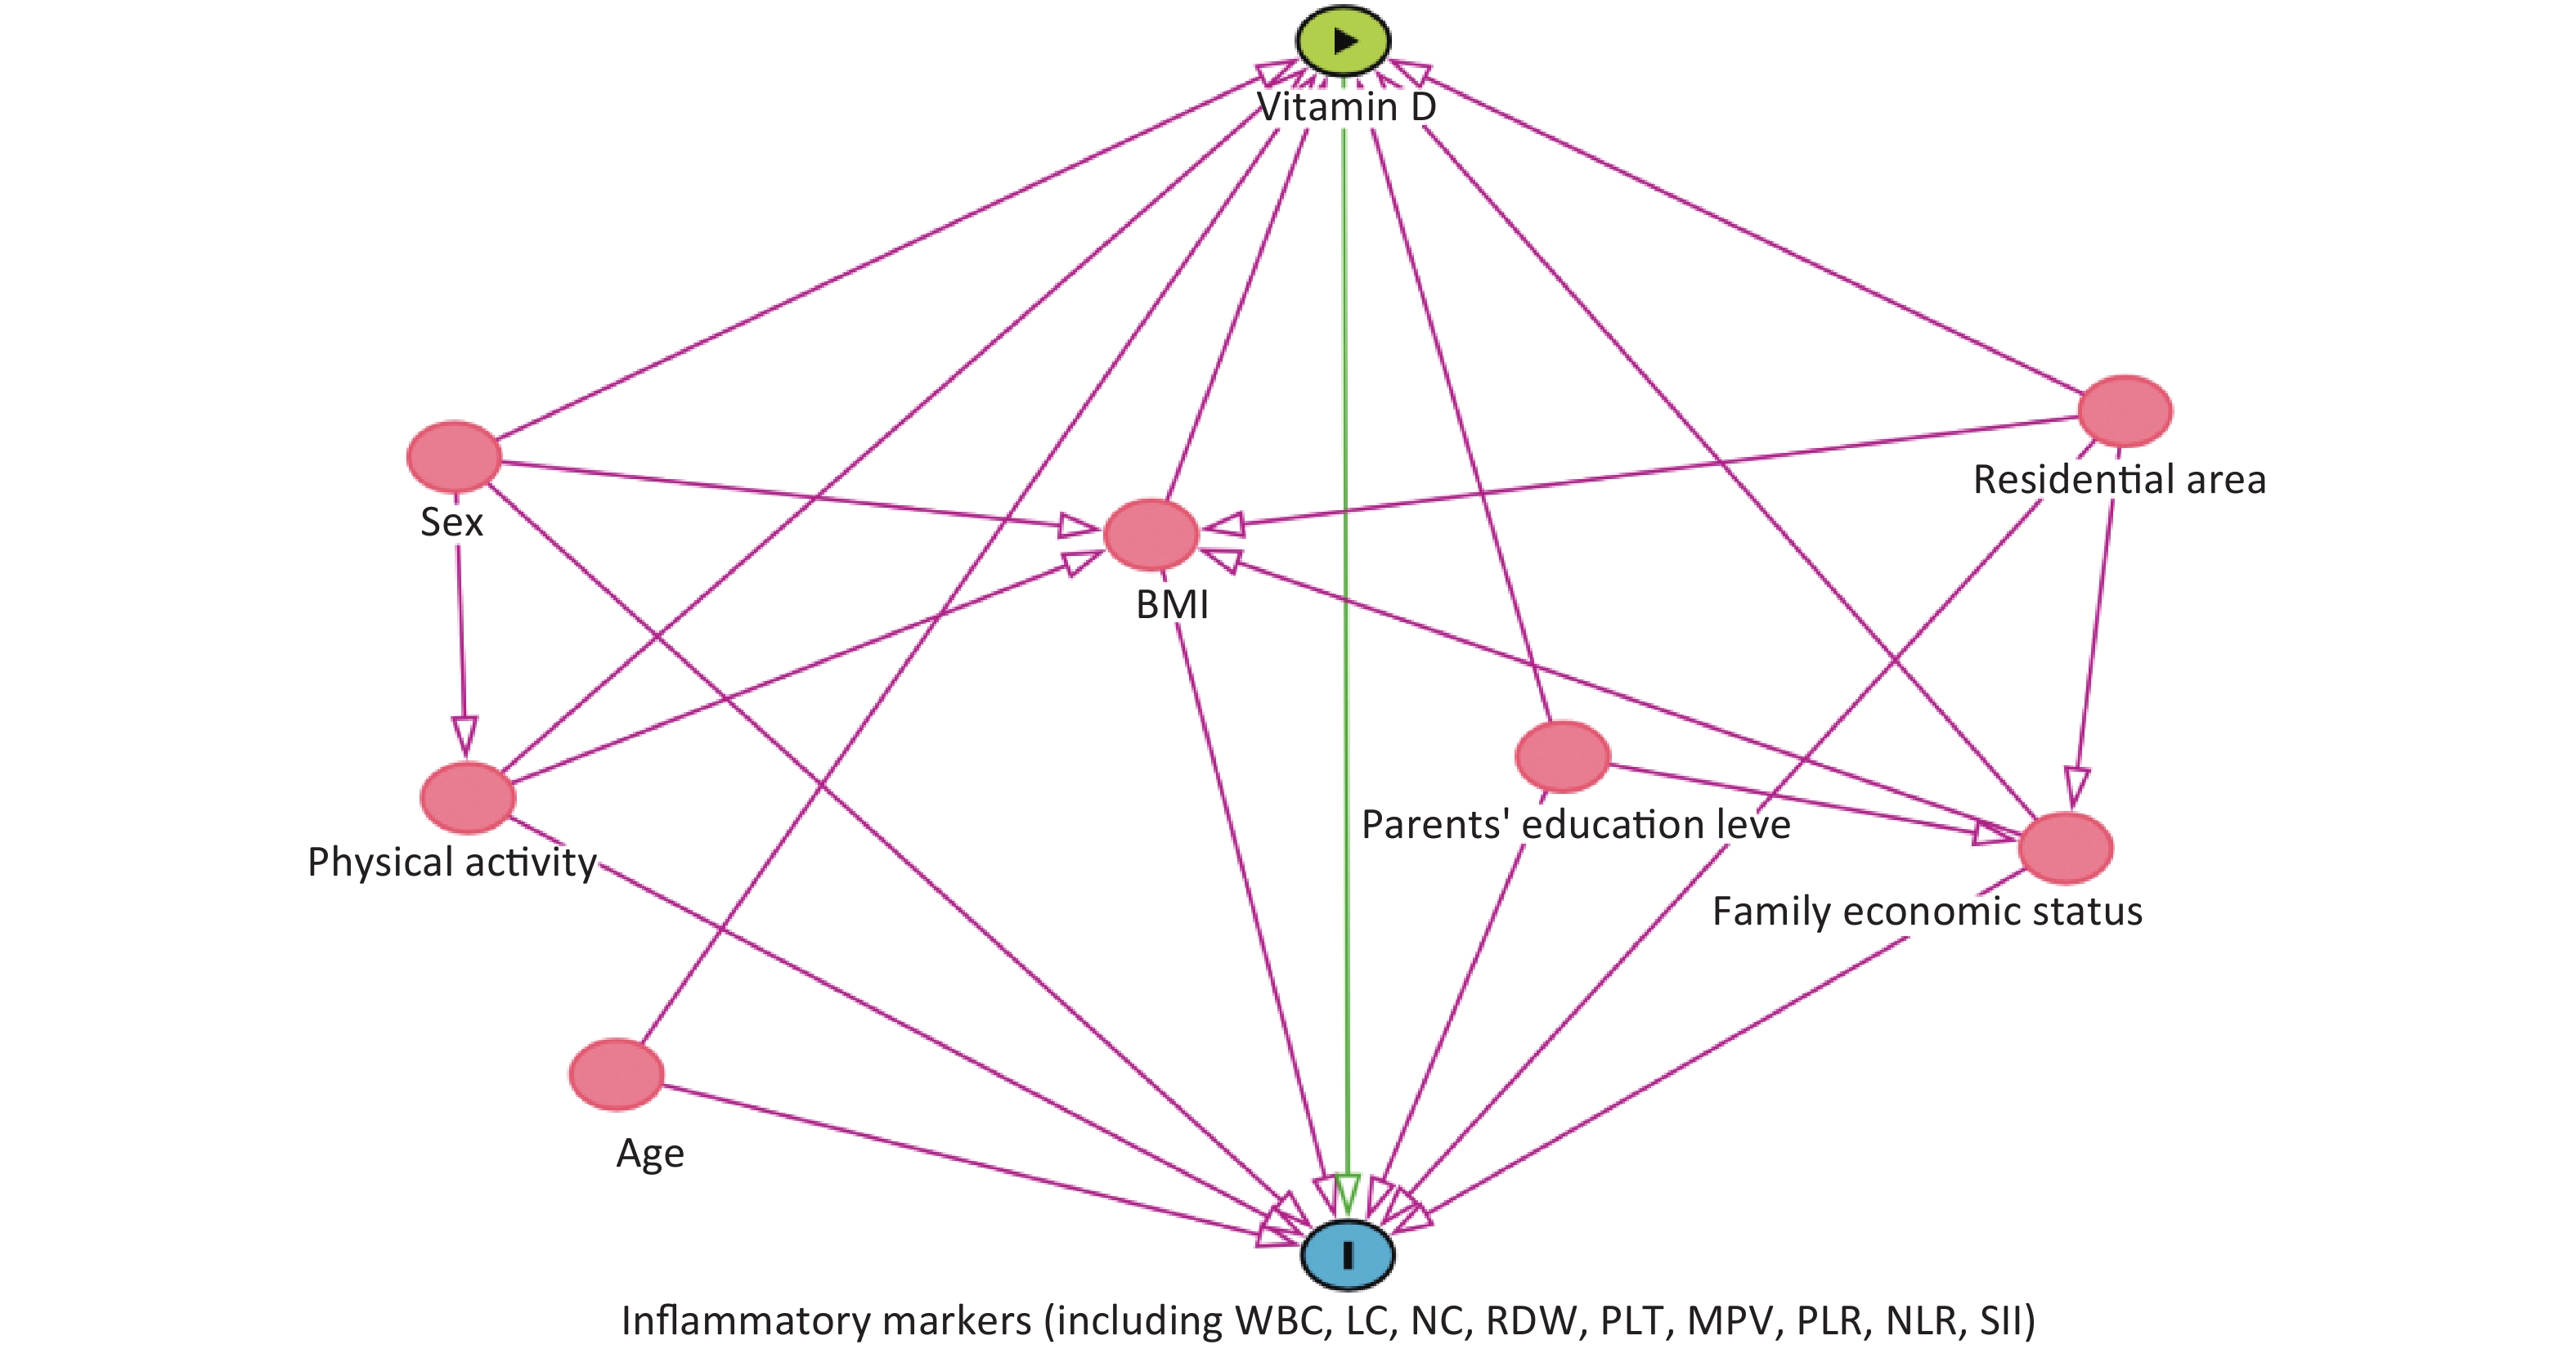
$$ \text{PLR\;=\;PLT/LC} $$ (1) $$ \text{NLR \;=\;NC/LC} $$ (2) $$ \text{SII} =\text{PLT}\times \text{ (NC/LC)} $$ (3) A directed acyclic graph (DAG) is used to identify confounders relating to both vitamin D levels and SI (Supplementary Figure S1, available in www.besjournal.com)[5]. The confounders included were age (used as a continuous variable), sex (male or female), residential area (urban or rural), family economic status (poor/medium or good), parents’ education level (primary and secondary school or high school above), body mass index (used as a continuous variable), moderate physical activity (0, 1–2, or ≥ 3 days/week) and vigorous physical activity (0, 1–2, or ≥ 3 days/week). These factors have been found to be associated with vitamin D levels and SI.
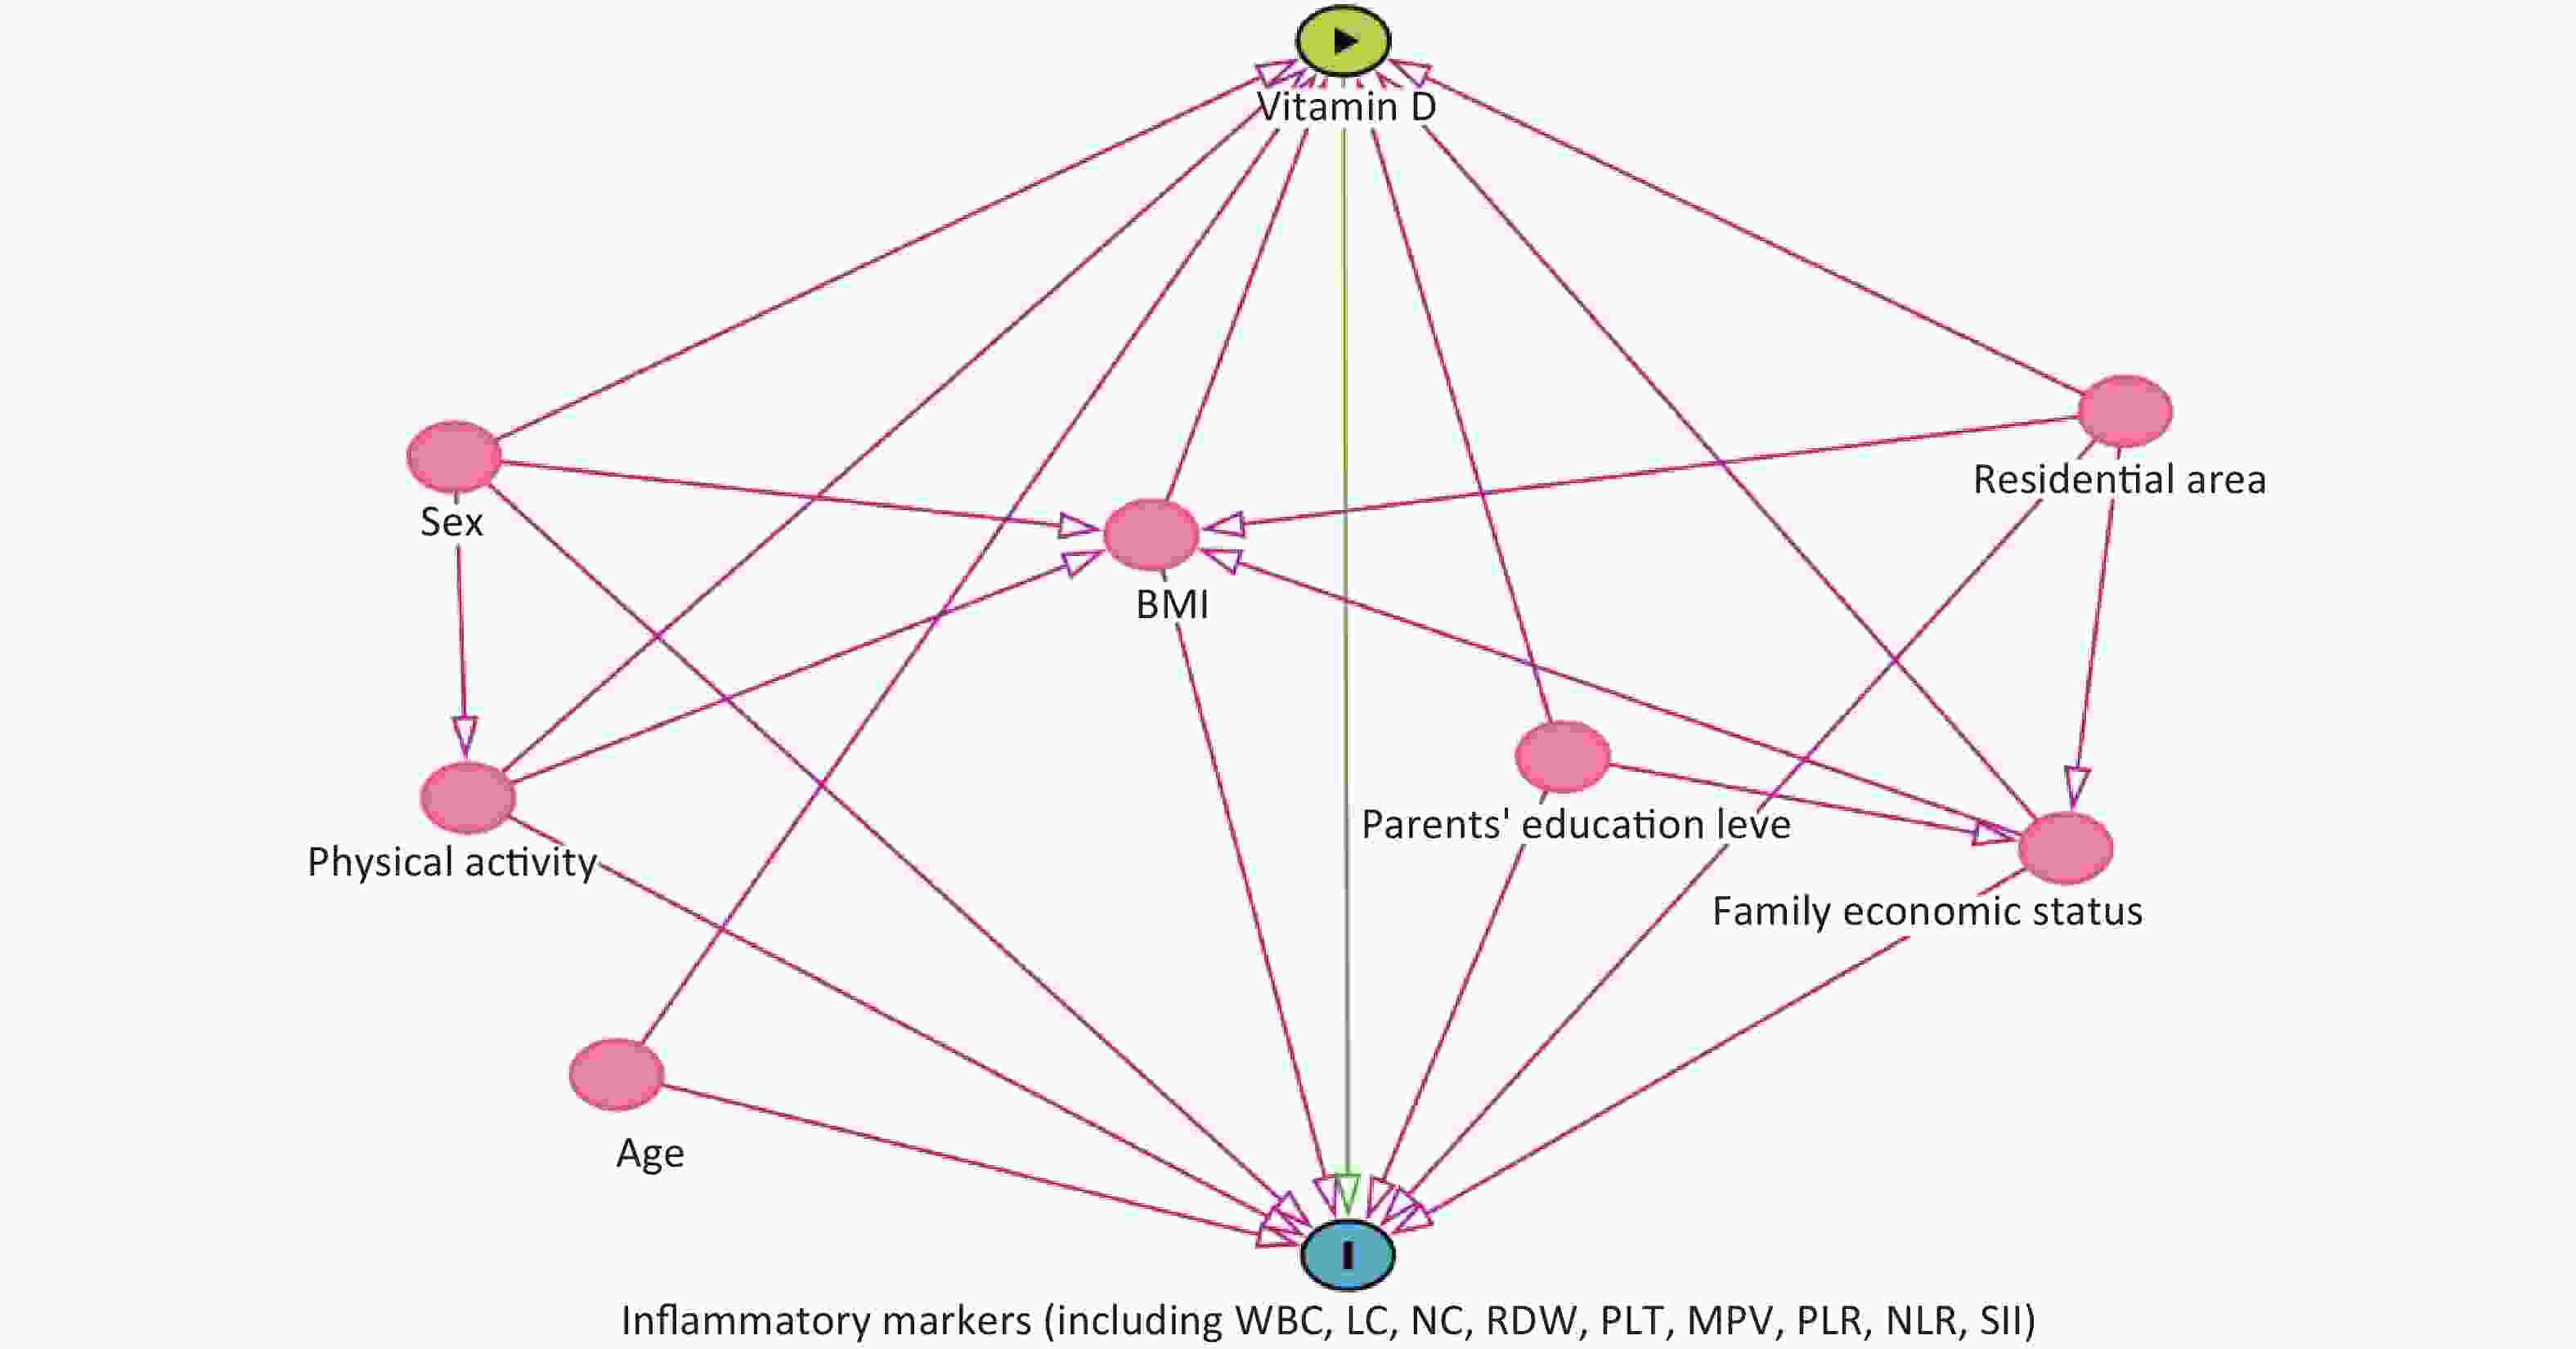
Figure S1. Directed acyclic graph (DAG) illustrating confounders selection. The confounders included in this study were age (used as a continuous variable), sex (male or female), residential area (urban or rural), family economic status (poor/medium or good), parents' education level (primary and secondary school or high school above), body mass index (used as a continuous variable), moderate physical activity and vigorous physical activity. These factors have been found to be associated with vitamin D levels and SI.
Data analysis was conducted using SPSS (version 26.0; IBM Corp). Sample characteristics were presented based on sex. Linear regression models were performed with vitamin D level or status as the independent variable and levels of SI indexes as the dependent variable to explore the relationship between blood vitamin D levels and vitamin D deficiency with levels of inflammatory markers at baseline (n = 1,423) or 2-year follow-up (n = 1,348) after adjusting the covariates in DAG. Furthermore, sex-stratified linear regression was performed. Meta-analysis using random effects model was used to combine the associations of both time points.
Changes of vitamin D levels across two waves were calculated by using the vitamin D levels at 2-year follow-up minus vitamin D levels at baseline. Similarly, the changes of SI indexes across two waves were obtained. A set of linear regression models was performed to assess the longitudinal relationship between vitamin D levels and changes in levels of inflammation indexes across two waves after adjusting for covariates in DAG. First, VDD at baseline was used as predictors. Second, longitudinal changes in vitamin D levels were coded as predictors. Finally, longitudinal trajectories of vitamin D status were set as predictors. Moreover, sex-stratified linear regression was performed to explore whether those relationships were sex-specific. A significance level of P value 0.05 (2-tailed) was used.
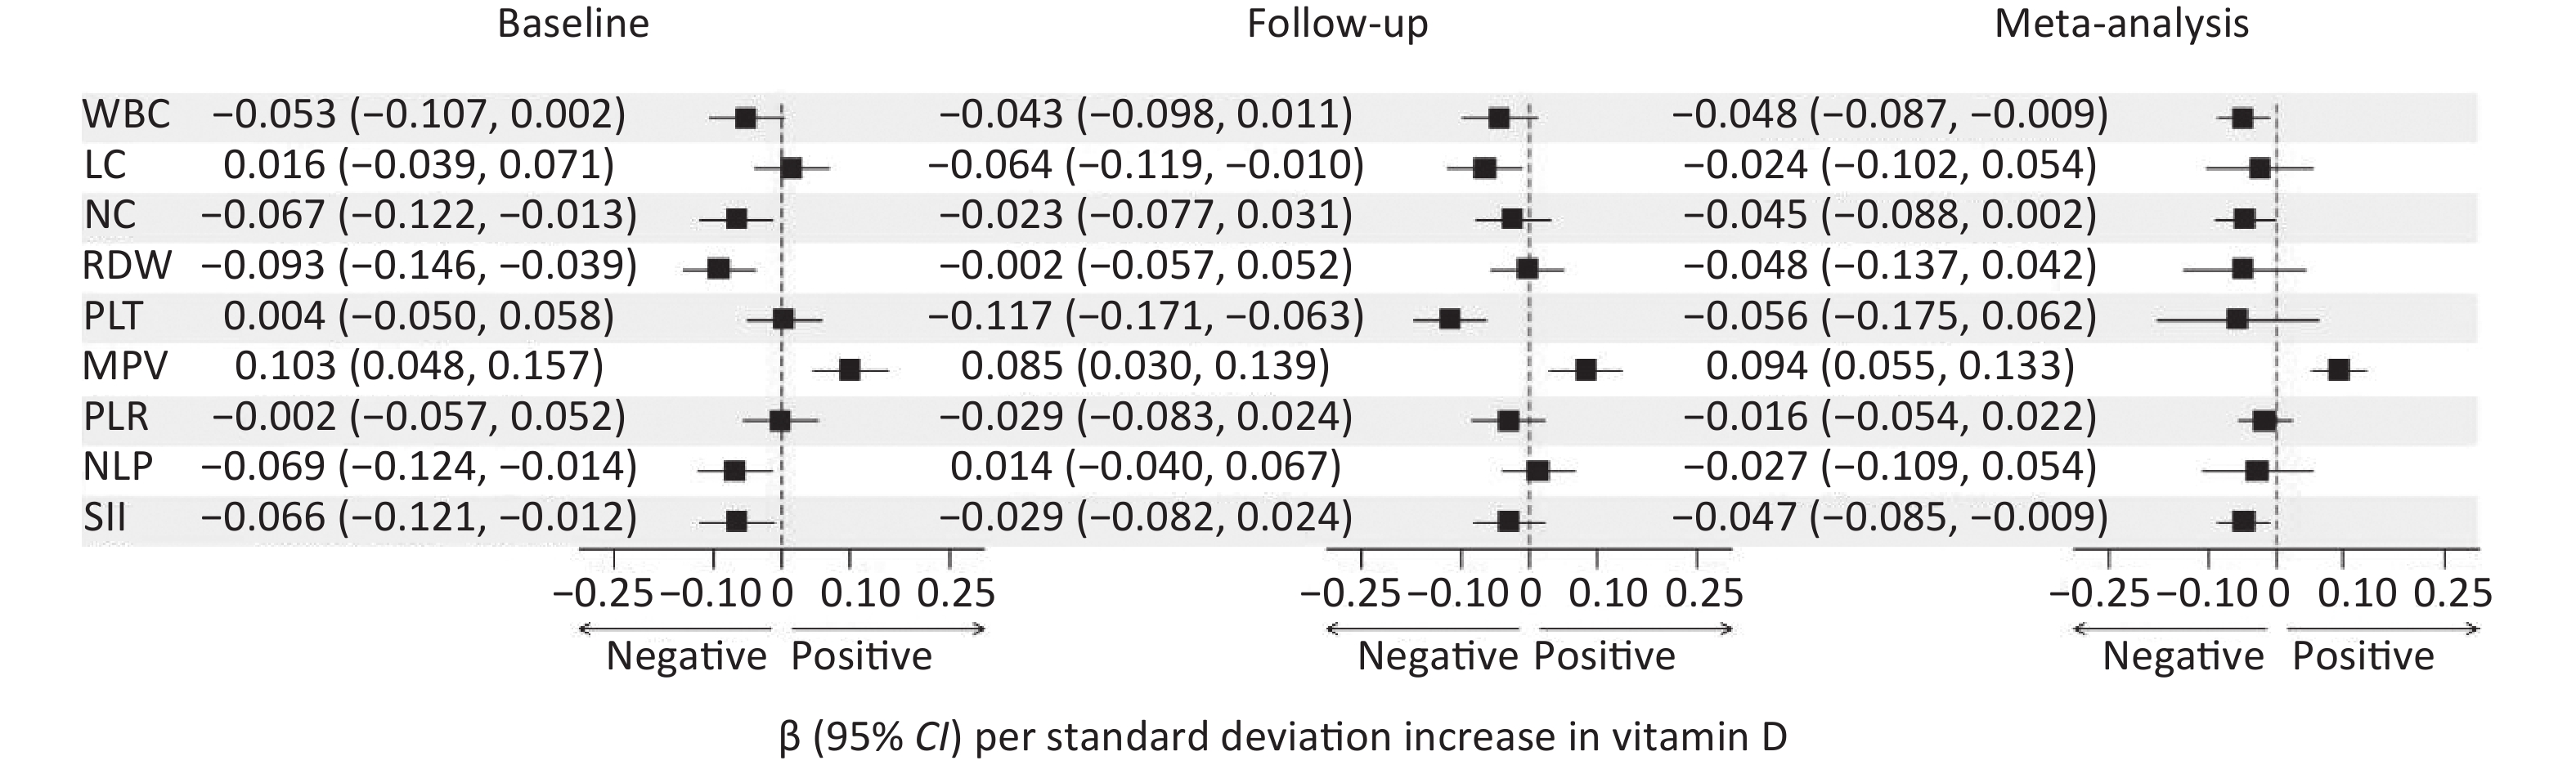
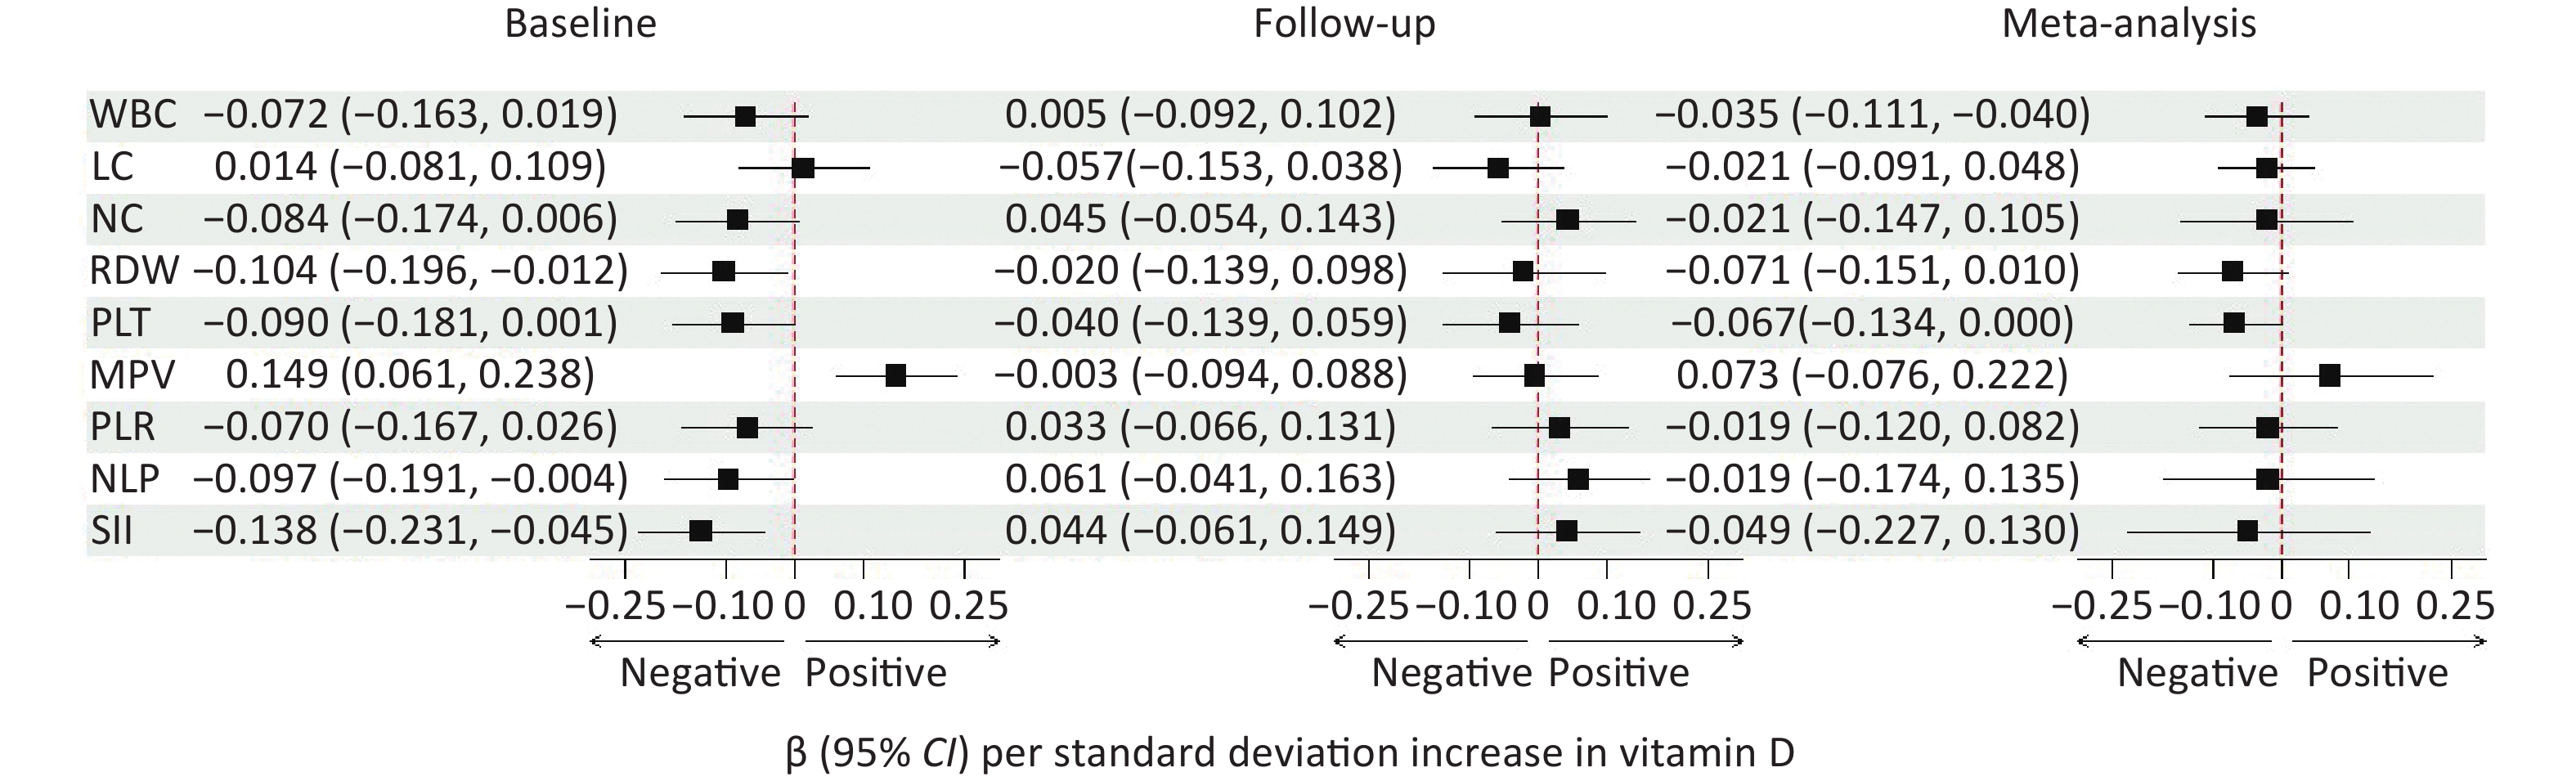
Meta-analysis combining results at both time points revealed that vitamin D levels or status were negatively correlated with WBC, NC and SII, but positively correlated with MPV (as shown in Figure 1). The longitudinal analysis results further showed that: (1) Baseline VDD was significantly positively correlated with the increase of WBC, NC, RDW, PLT, PLR, NLR and SII levels; (2) Increased vitamin D levels were significantly positively correlated with MPV and negatively correlated with LC; (3) New VDD was positively correlated with LC and PLT. Persistent VDD is positively correlated with WBC, NC, PLT, PLR, NLR and SII (Tables 1–2, Supplementary Table S4,
Supplementary Figure S2 , available in www.besjournal.com). All the above results indicate a significant association between serum vitamin D levels or status and levels of multiple SI markers.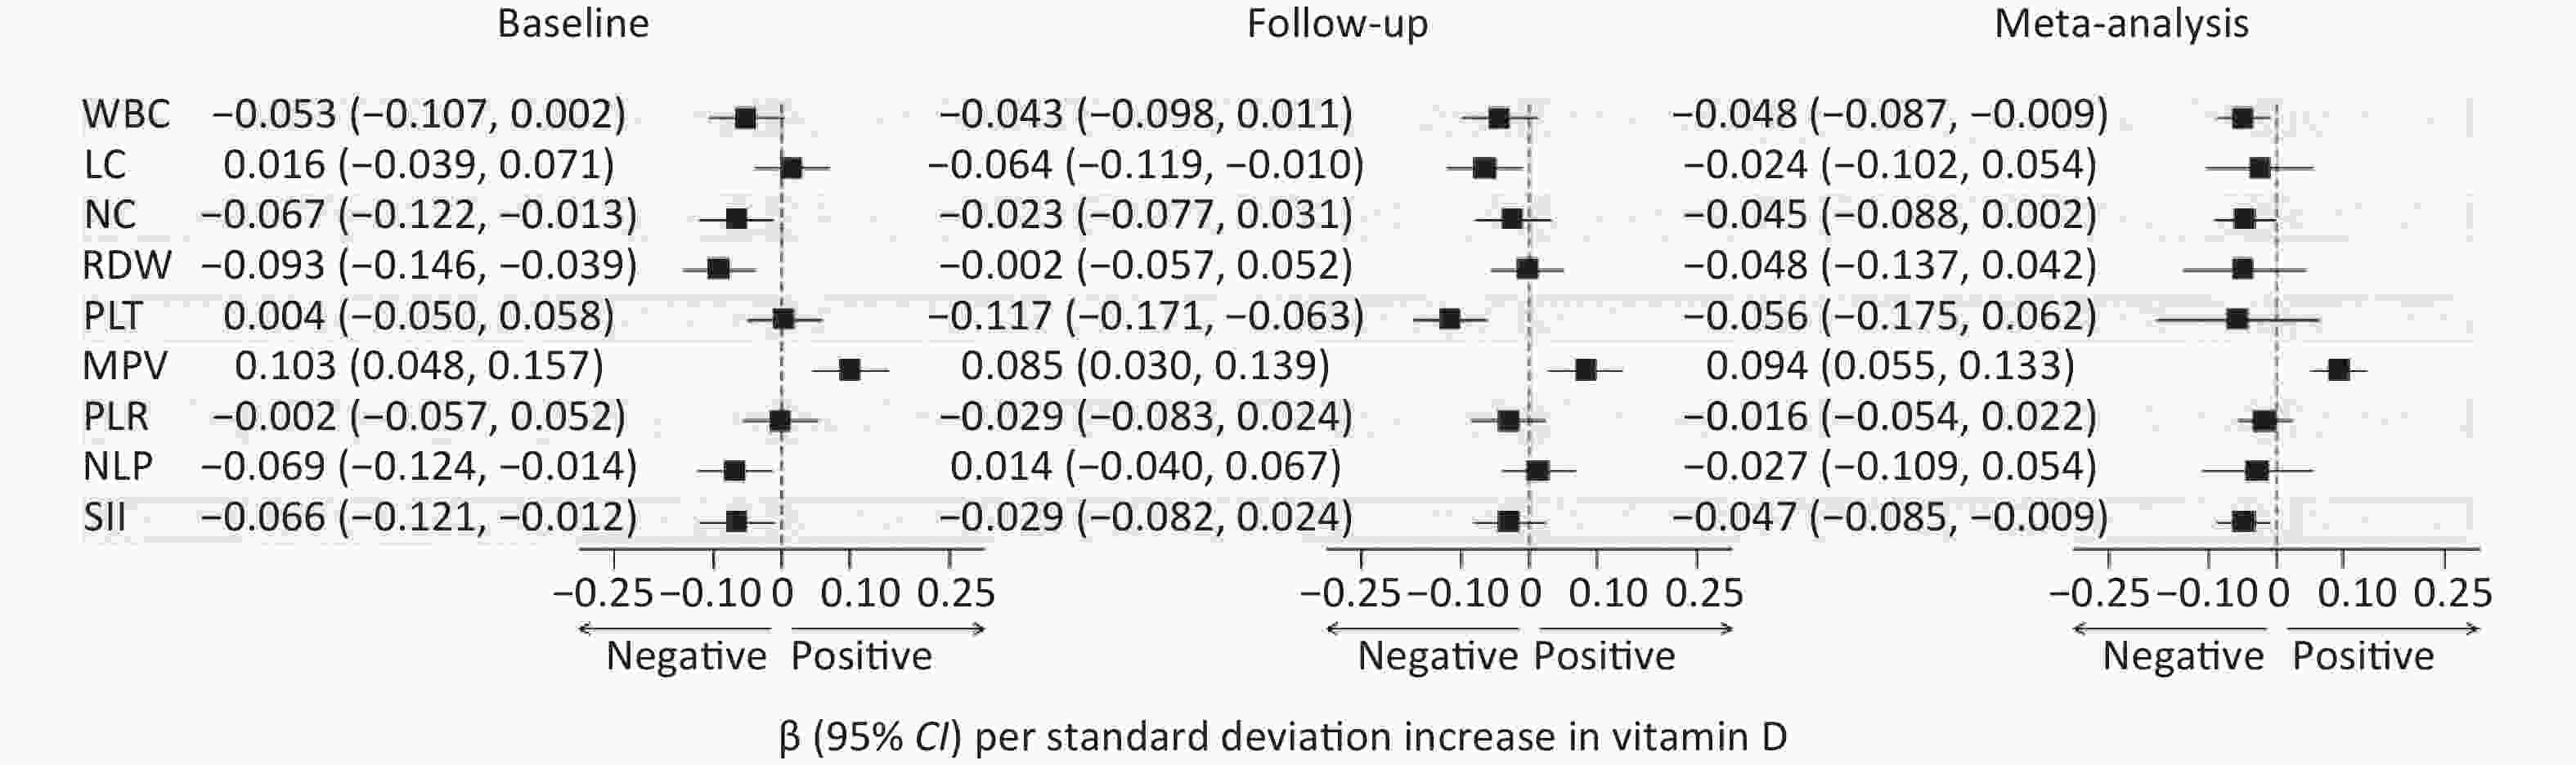
Figure 1. Linear regression analysis was performed for vitamin D levels and 9 blood markers of systemic inflammation indexes at baseline and at 2-year follow-up. Vitamin D levels and 9 blood inflammatory marker levels at both wave 1 and wave 3 was log-transformed and standardized to z-score. Meta-analysis combined results at both time points revealed significant associations between serum vitamin D levels with multiple inflammatory markers, β indicates per SD increment in vitamin D levels, β and 95% CI were obtained by linear regression, adjusting for age, sex, residential area, family economic status, parent’s education level, BMI, moderate physical activity and vigorous physical activity.
Table 1. Correlation of vitamin D deficiency at baseline with longitudinal changes in systemic inflammation indexes
Variables Crude model Adjusted model β 95% CI P-value β 95% CI P-value WBC 0.184 −0.094, 0.462 0.194 0.241 0.010, 0.472 0.041 LC 0.020 −0.077, 0.117 0.690 −0.020 −0.097, 0.057 0.607 NC 0.246 −0.037, 0.529 0.088 0.312 0.073, 0.551 0.011 RDW 0.021 −0.086, 0.127 0.703 0.033 −0.049, 0.115 0.432 PLT 18.748 8.889, 28.607 < 0.001 17.835 8.954, 26.715 < 0.001 MPV 0.036 −0.083, 0.154 0.557 −0.040 −0.141, 0.061 0.439 PLR 9.288 3.402, 15.174 0.002 9.355 3.884, 14.826 0.001 NLR 0.137 −0.016, 0.291 0.079 0.172 0.038, 0.307 0.012 SII 89.355 38.998, 139.712 0.001 87.587 39.883, 135.291 < 0.001 Note. Adjusted model included covariates: age, sex, residential area, family economic status, parent’s education level, BMI, moderate physical activity, vigorous physical activity, and corresponding blood cell indices levels at wave. WBC, white blood cell; LC, lymphocyte count; NC, neutrophil count; RDW, red blood cell distribution width; PLT, platelet count; MPV, mean platelet volume; PLR, platelet to lymphocyte ratio; NLR, neutrophil to lymphocyte ratio; SII, systemic immune inflammation index. Table 2. Correlation of longitudinal changes in vitamin D levels with changes in systemic inflammation indexes
Variables Crude model Adjusted model β 95% CI P value β 95% CI P value WBC −0.016 −0.038, 0.006 0.158 −0.008 −0.029, 0.013 0.454 LC −0.012 −0.019, −0.004 0.003 −0.012 −0.019, −0.005 0.001 NC −0.003 −0.025, 0.019 0.796 0.006 −0.016, 0.027 0.610 RDW −0.006 −0.015, 0.002 0.129 0.002 −0.006, 0.009 0.647 PLT 0.763 −0.015, 1.540 0.054 −0.519 −1.309, 0.272 0.198 MPV 0.013 0.004, 0.023 0.005 0.012 0.003, 0.021 0.009 PLR 1.020 0.559, 1.481 < 0.001 0.487 0.001, 0.974 0.050 NLR 0.011 −0.001, 0.023 0.083 0.014 −0.002, 0.026 0.051 SII 5.693 1.731, 9.654 0.005 3.360 −0.886, 7.605 0.121 Note. Adjusted model included covariates: age, sex, residential area, family economic status, parent’s education level, BMI, moderate physical activity, vigorous physical activity, corresponding blood cell indices levels at wave 1, and vitamin D levels at wave 1. WBC, white blood cell; LC, lymphocyte count; NC, neutrophil count; RDW, red blood cell distribution width; PLT, platelet count; MPV, mean platelet volume; PLR, platelet to lymphocyte ratio; NLR, neutrophil to lymphocyte ratio; SII, systemic immune inflammation index. WBC is a nonspecific biomarker for responding to acute inflammation; NC is generally involved in innate immune response, while LC is mainly involved in adaptive immune responses. PLT has shown the ability to recruit WBCs and release proinflammatory and anti-inflammatory factors. Despite several observational studies suggesting the potential role of vitamin D deficiency with WBC NC, LC and PLT in children and adolescents with various health conditions, there is a lack of reliable evidence derived from prospective studies. Our prospective study extended prior findings and was the first to report the longitudinal effect of vitamin D on those SI indexes in early adolescence. RDW is commonly used to differentiate the diagnosis of anemia, and can also be a inexpensive biomarker of SI. A study in the United States found serum 25(OH)D levels were inversely associated with elevated RDW[6]. In contrast, another retrospective study including 16,321 healthy children demonstrated a positive correlation between serum 25(OH)D levels and RDW[7]. Both findings lacked of longitudinal validation. However, we did not find an significant association between vitamin D levels and serum RDW levels in this study. MPV is associated with various proinflammatory diseases, and is a measure used to assess platelet reactivity, as well as platelet size and prethrombotic status. Our study show a significant positive correlation between increased vitamin D levels and MPV using longitudinal data, and the results of another study on specific dermatitis in children are consistent with ours[8]. PLR and NLR are inexpensive and readily available indicators of systemic inflammation and can be used as potential biomarkers to assess inflammation in a variety of diseases, such as cerebrovascular disease, CVD, and autoimmune diseases, and these ratios have better predictive value in assessing inflammation than lymphocytes, neutrophils, or monocytes alone. SII, as a novel inflammatory marker, is linked with an increased risk of collateral circulation development, contrast nephropathy, and CVD in previous studies. Several cross-sectional studies have shown a negative correlation between vitamin D and NLR and PLR[7,9]. Additionally, consistent with our findings, a recent study found that vitamin D status was inversely linked with SII in patients with acute coronary syndrome (ACS)[10]. Our prospective study extended prior findings and was the first to explore the effect of longitudinal vitamin D trajectory on SI in healthy adolescents.
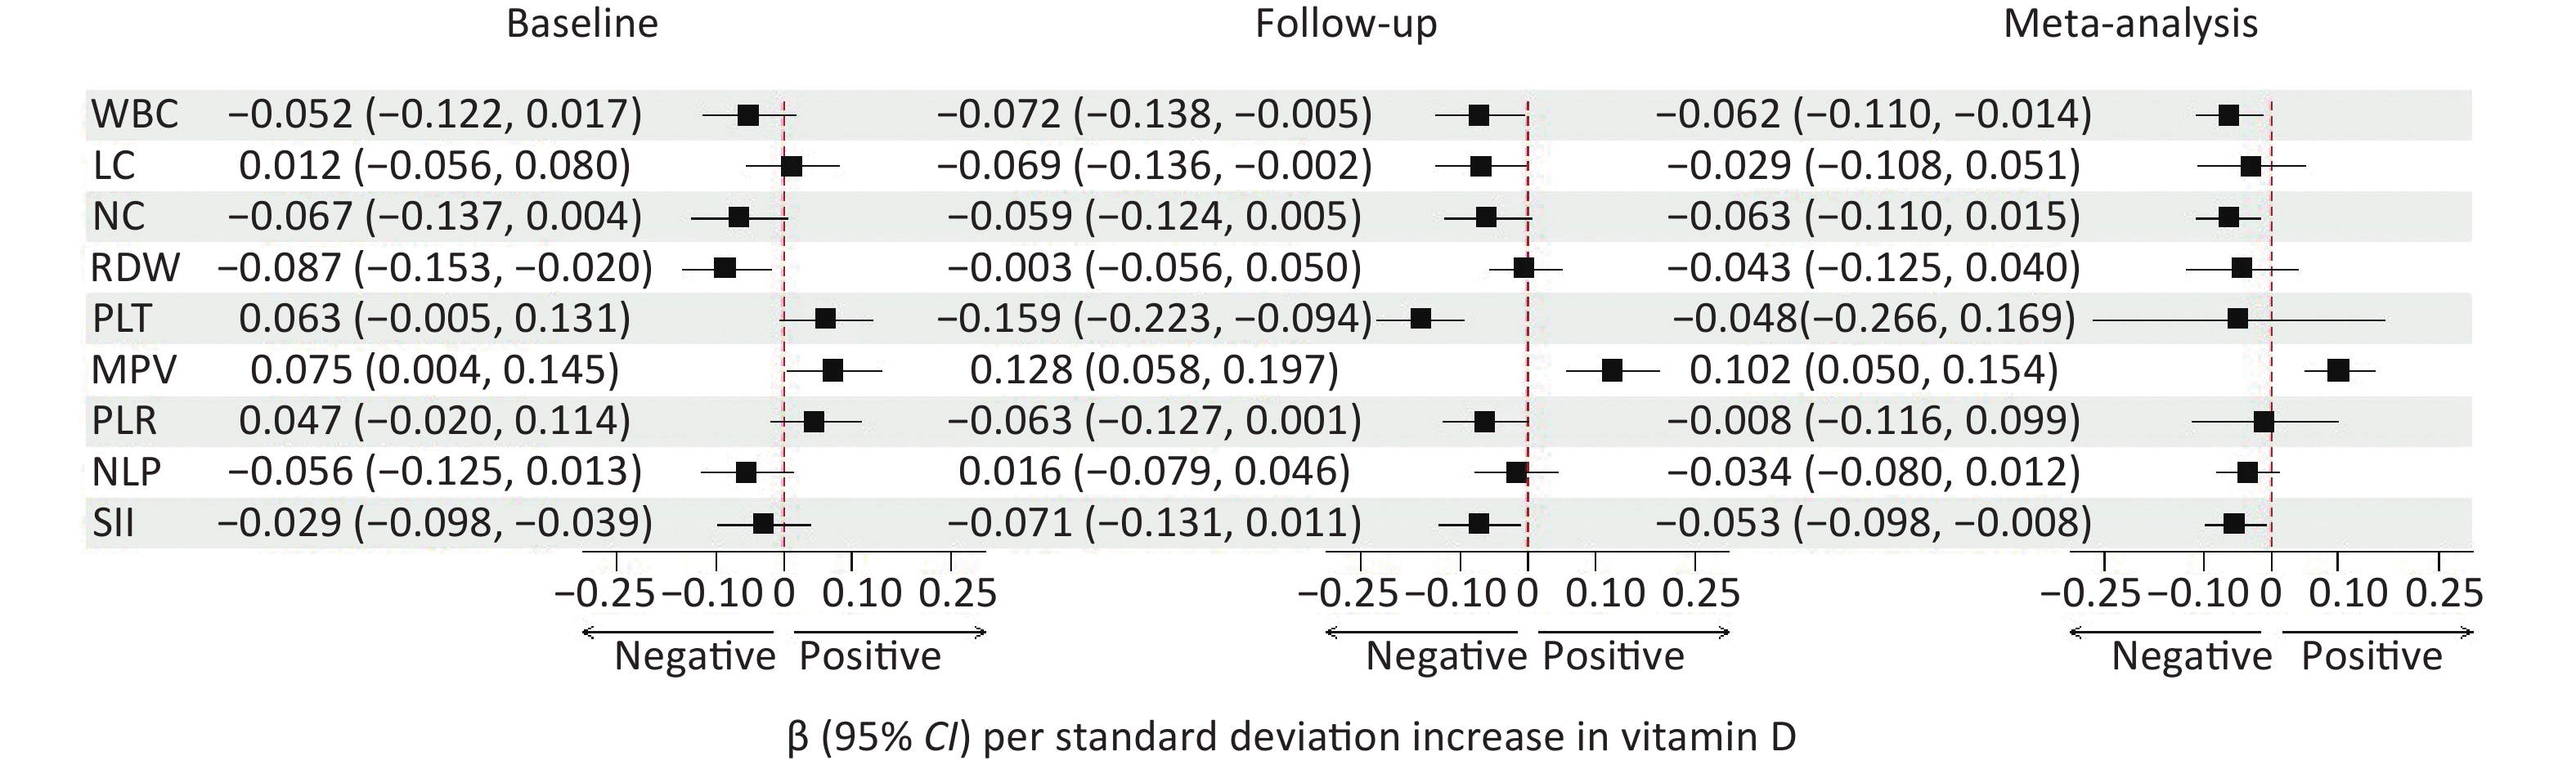
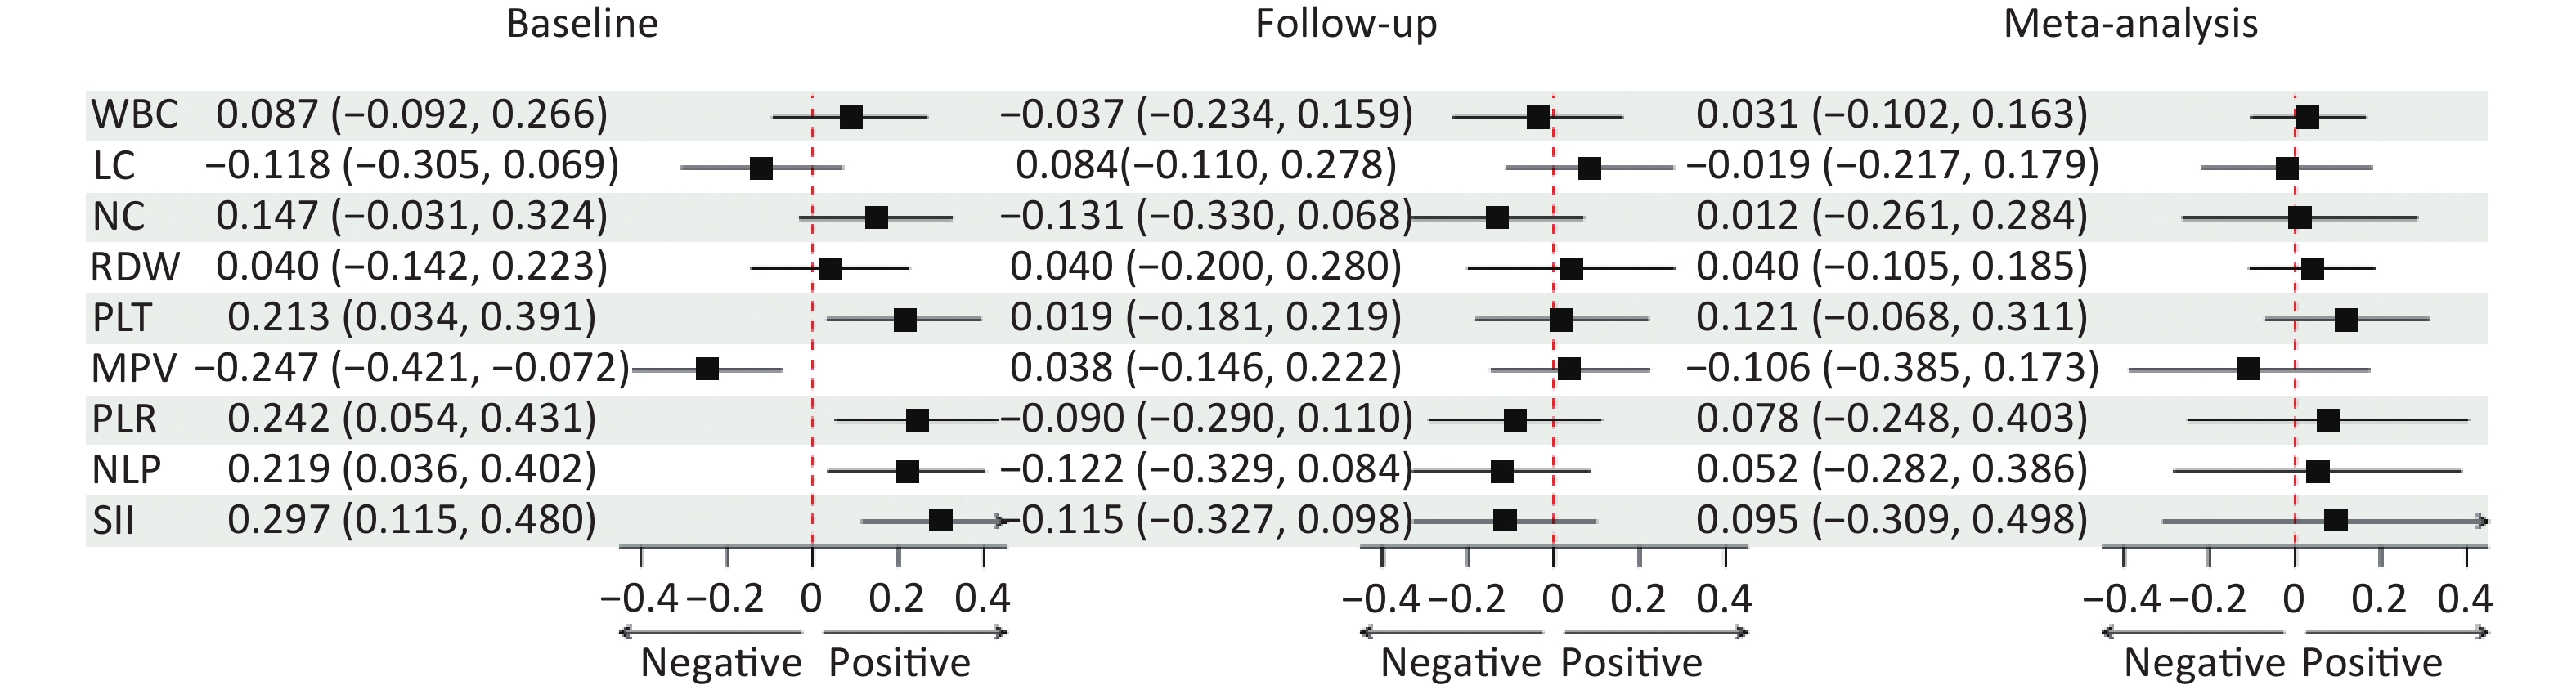
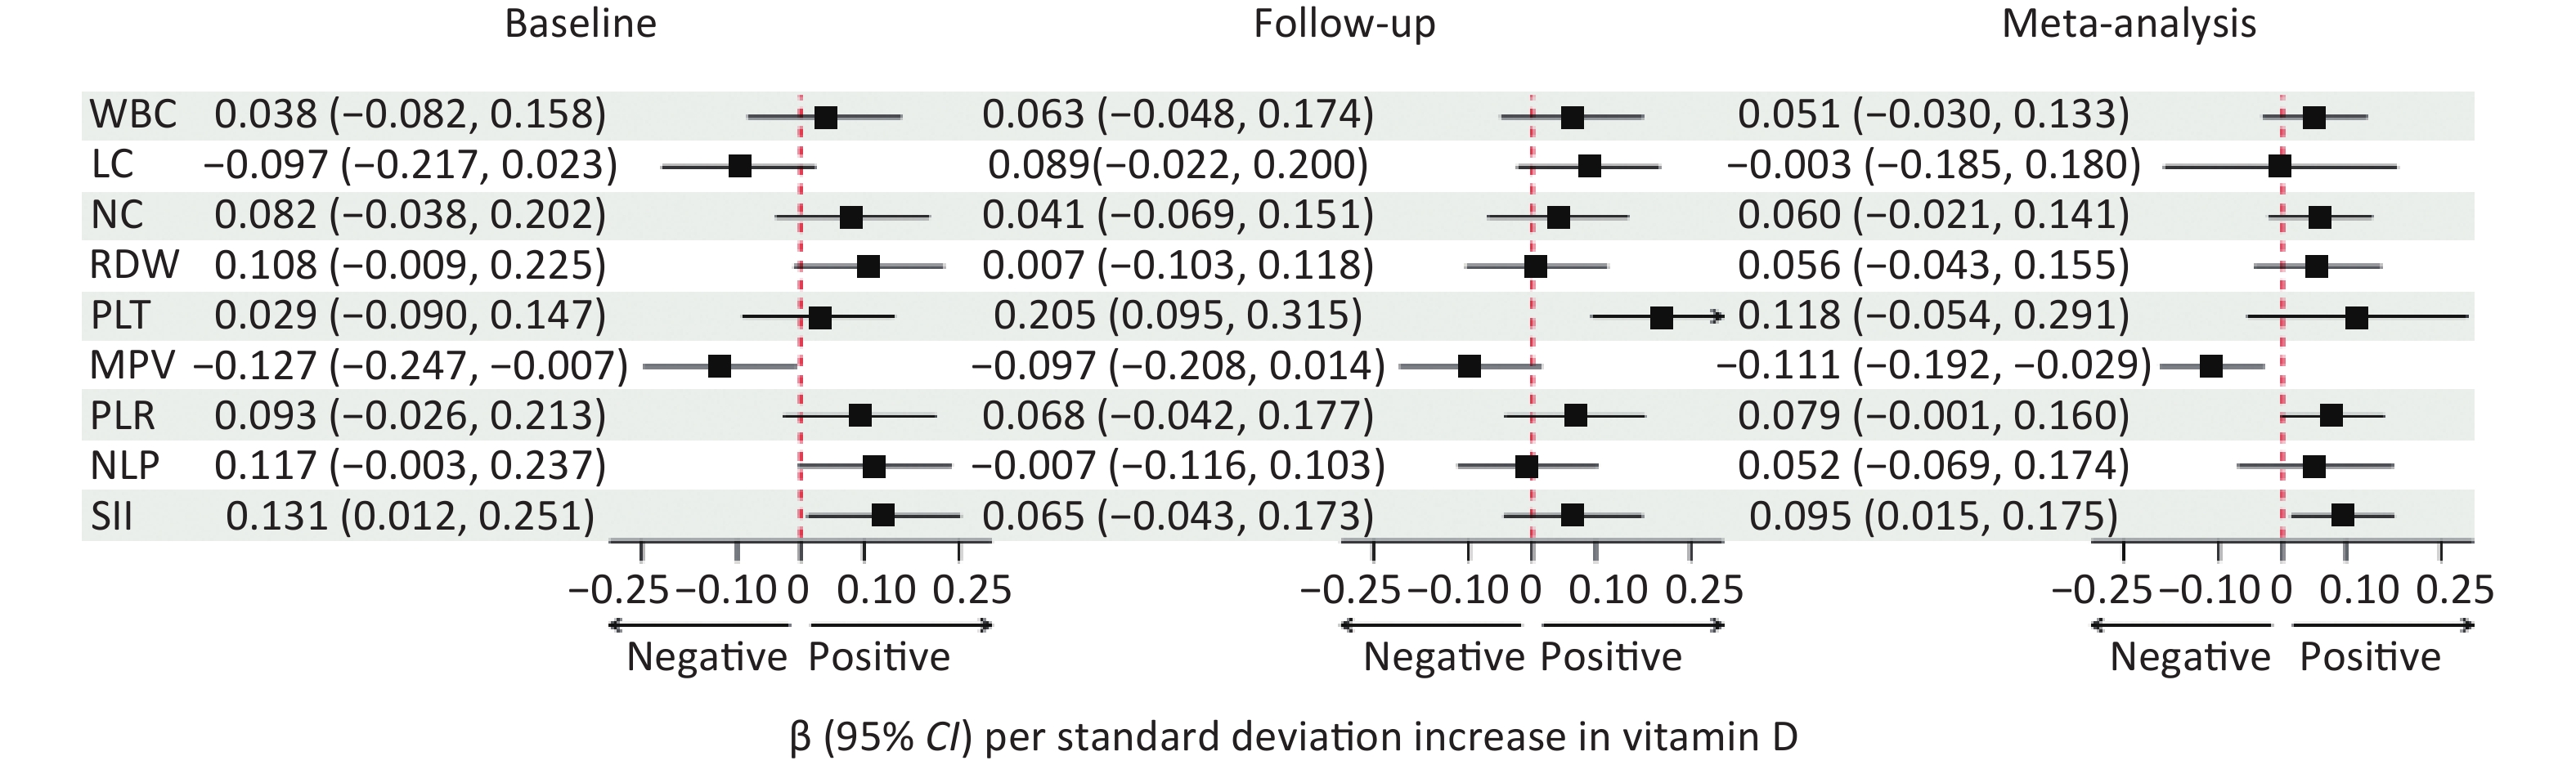
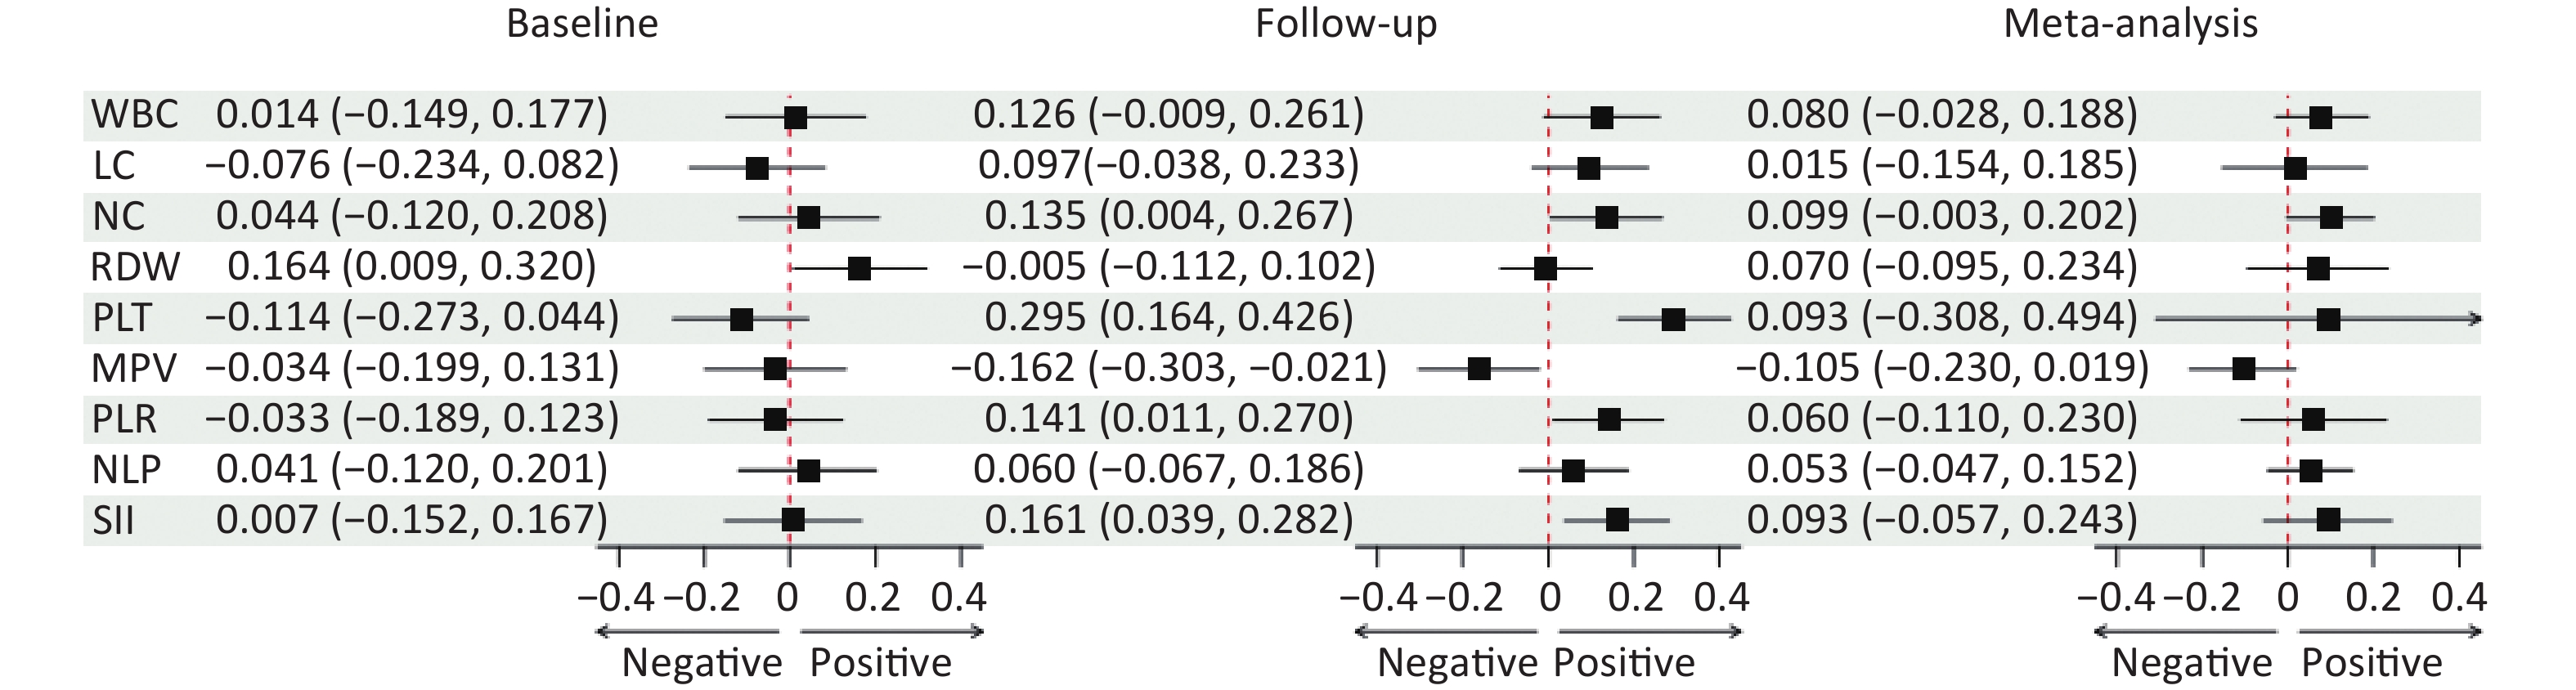
We further conducted a sex stratification analysis based on the above analysis. The results of meta-analysis showed that Vitamin D levels of male participants were negatively associated with WBC, NC and SII, but positively correlated with MPV. No significant associations were found among female participants (Supplementary Figures S3–S6, available in www.besjournal.com). The longitudinal analysis of male subjects showed that: (1) Baseline VDD was significantly positively correlated with NC, PLT, PLR, NLR, and SII, and negatively correlated with MPV. (2) Vitamin D levels were significantly correlated with LC and MPV. (3) New VDD significantly associated with LC and PLT. Persistent VDD is positively correlated with WBC, NC, PLT, MPV and PLR, NLR and SII, and negatively correlated with MPV. Similarly, for female participants, no significant results were found in the longitudinal analysis (Supplementary Tables S5–S7, available in www.besjournal.com). In response to the observed sexual dimorphism in the association between vitamin D and SI markers, we endeavor to delve deeper into the relevant biological mechanisms in search of explanations.
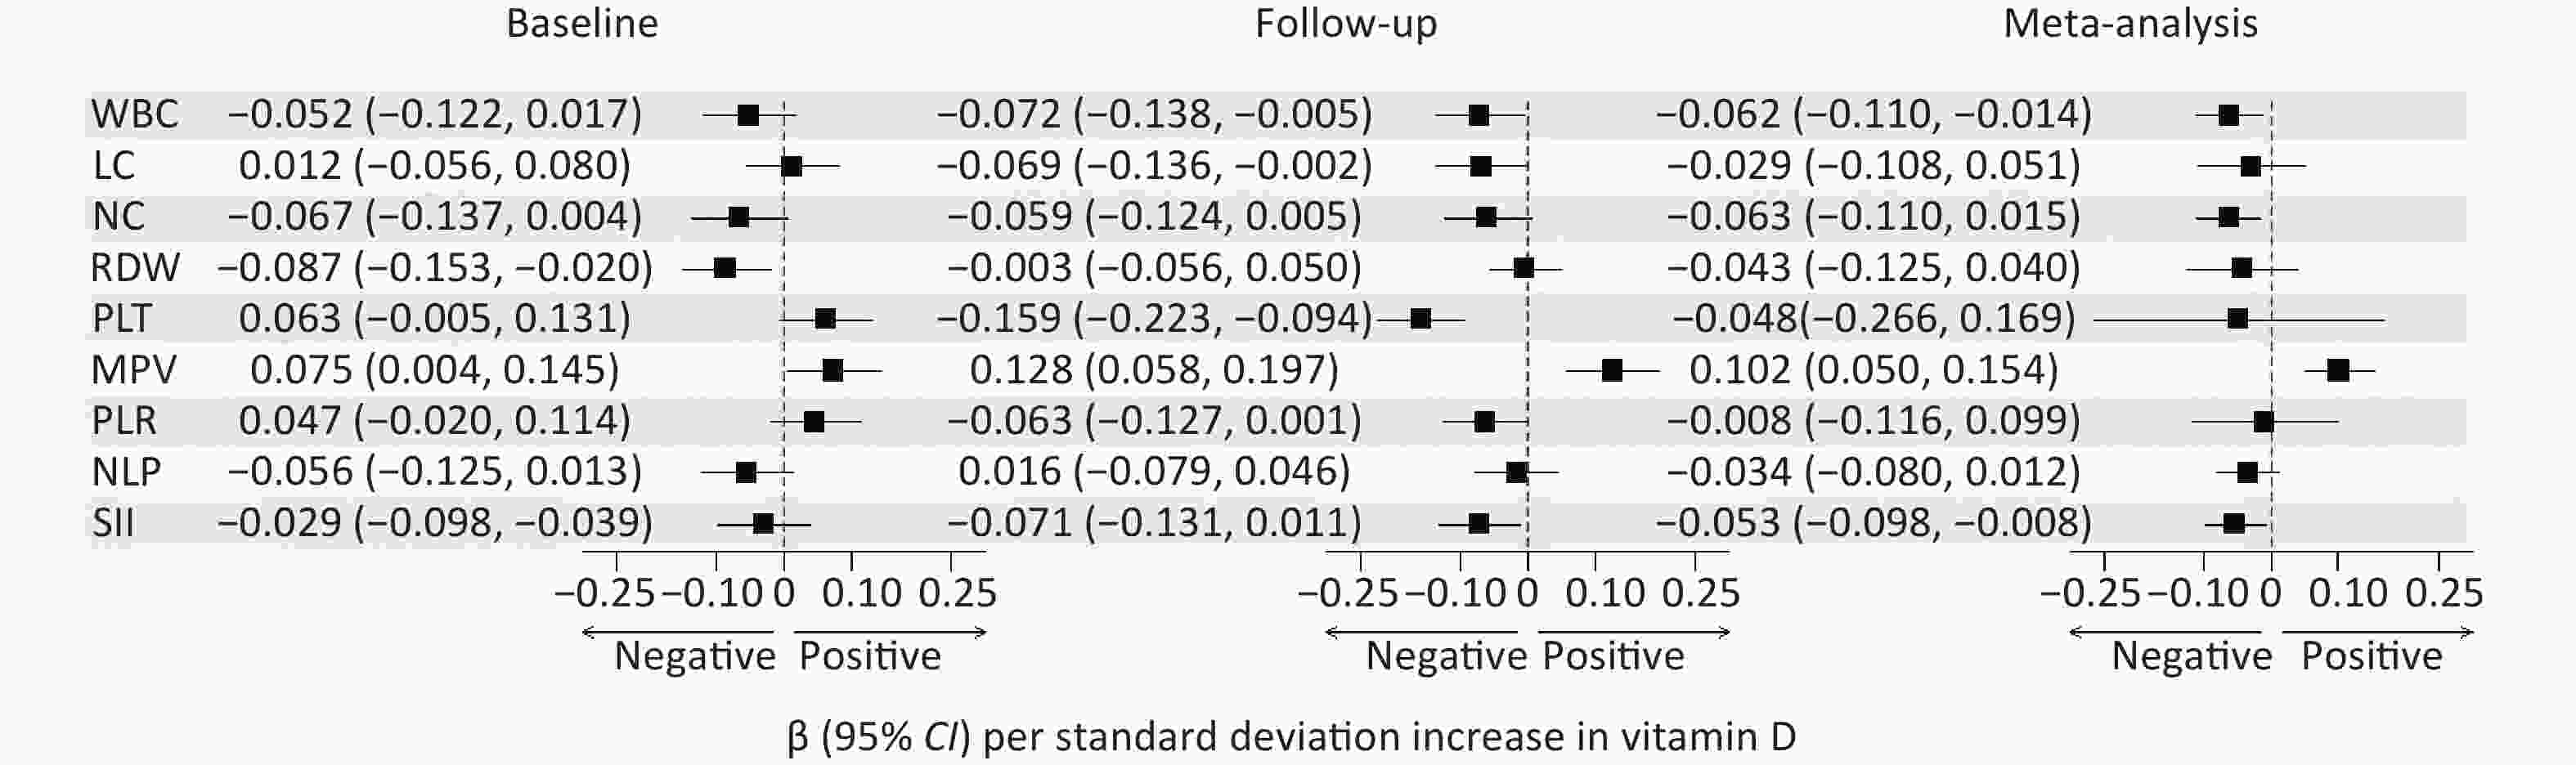
Figure S3. Linear regression analysis was performed for vitamin D levels and 9 blood markers of systemic inflammation at baseline and at 2-year follow-up in male students. Vitamin D levels and 9 blood markers of inflammation levels at both wave 1 and wave 3 was log-transformed and standardized to z-score. Meta-analysis combined results at both time points revealed significant associations between serum vitamin D levels with multiple inflammatory markers. β indicates per SD increment in vitamin D levels, β and 95% CI were obtained by linear regression, adjusting for age, residential area, family economic status, parent’s education level, BMI, moderate physical activity and vigorous physical activity.
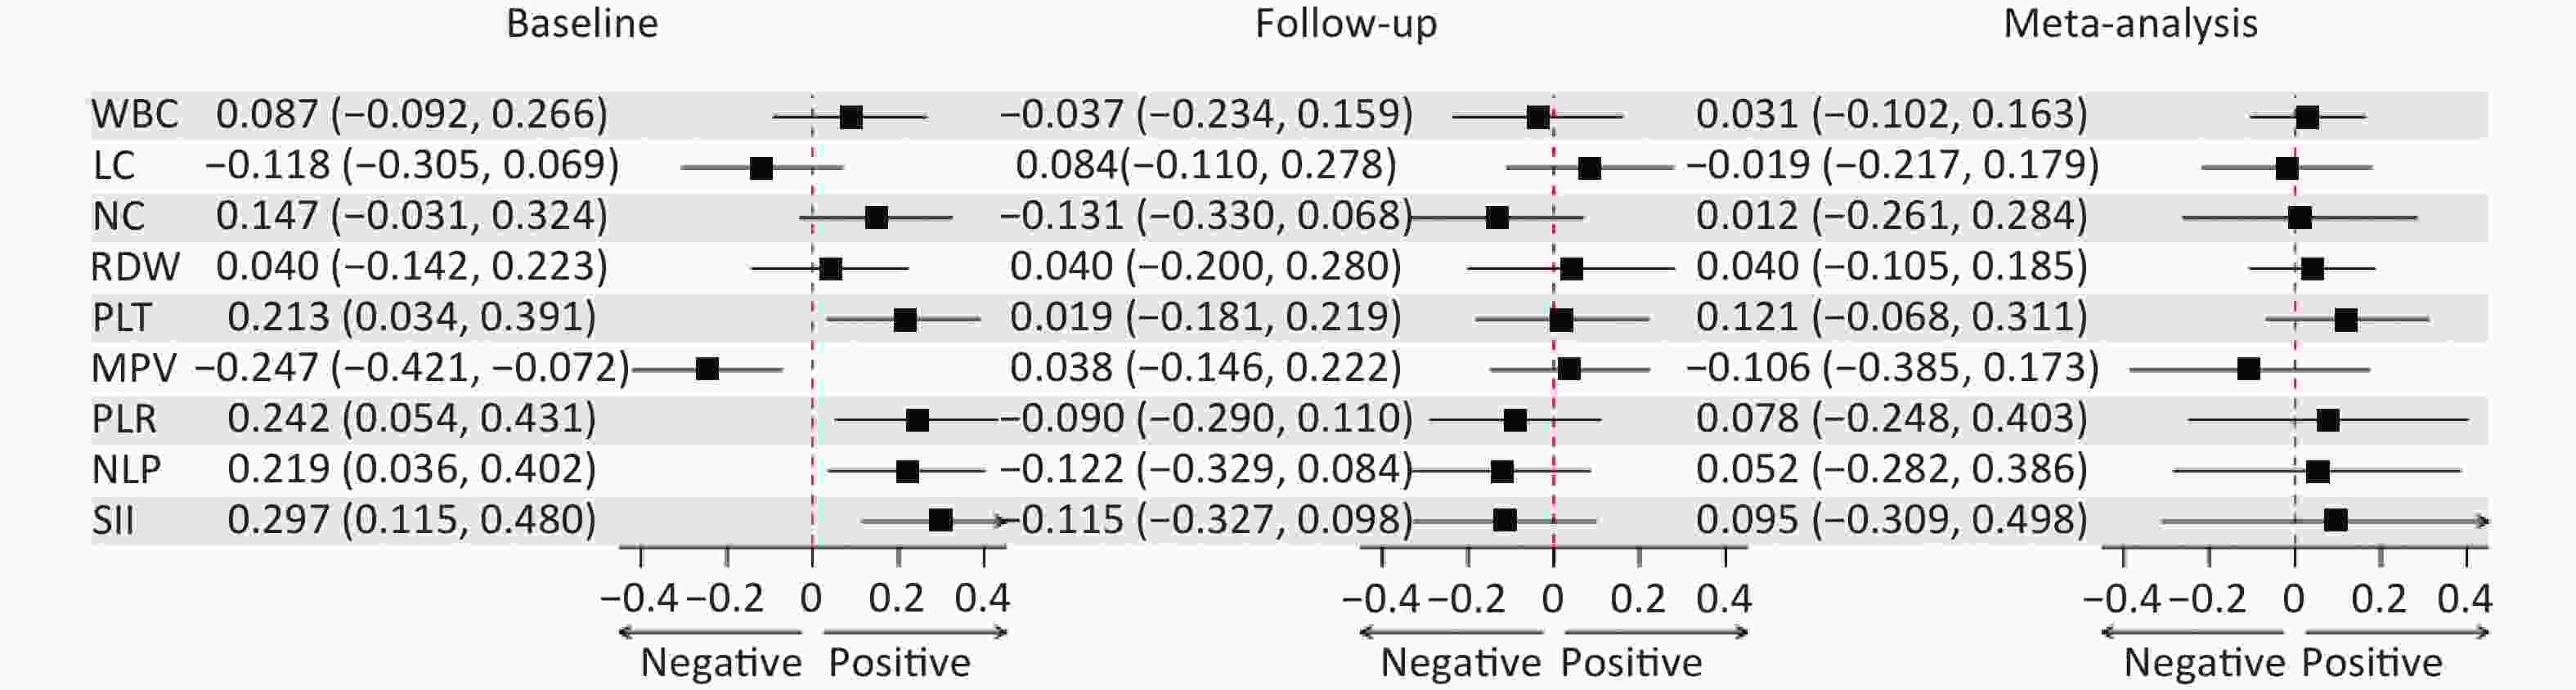
Figure S6. Linear regression analysis was performed for vitamin D deficiency and 9 blood markers of systemic inflammation at baseline and at 2-year follow-up in female students.
Table S5. Sex differences in association between vitamin D deficiency at baseline and longitudinal changes in systemic inflammation indexes
Variables Males Females β 95% CI P-value β 95% CI P-value WBC 0.277 −0.031, 0.586 0.078 0.198 −0.152, 0.547 0.267 LC −0.030 −0.132, 0.072 0.560 −0.003 −0.121, 0.115 0.956 NC 0.339 0.028, 0.650 0.033 0.284 −0.095, 0.663 0.141 RDW 0.005 −0.082, 0.092 0.911 0.082 −0.075, 0.239 0.306 PLT 23.369 12.032, 34.706 < 0.001 12.596 −2.052, 27.243 0.092 MPV −0.139 −0.276, −0.002 0.047 0.095 −0.056, 0.245 0.216 PLR 11.769 4.774, 18.764 0.001 6.315 −2.633, 15.263 0.166 NLR 0.218 0.050, 0.386 0.011 0.122 −0.106, 0.349 0.293 SII 108.554 50.982, 166.127 < 0.001 60.058 −23.908, 144.023 0.161 Table S7. Sex differences in association between vitamin D deficiency at baseline with longitudinal changes in systemic inflammation indices
Variables Males Females Remitted VDD New VDD Persistent VDD Remitted VDD New VDD Persistent VDD β (95% CI) P value β (95% CI) P value β (95% CI) P value β (95% CI) P value β (95% CI) P value β (95% CI) P value WBC 0.053
(−0.593,
0.698)0.873 0.134
(−0.176,
0.445)0.396 0.395
(0.038,
0.751)0.030 −0.198
(−1.069,
0.674)0.656 −0.099
(−0.521,
0.324)0.646 0.182
(−0.265,
0.629)0.424 LC 0.001
(−0.211,
0.214)0.990 0.123
(0.021,
0.225)0.019 0.022
(−0.095,
0.140)0.710 −0.104
(−0.399,
0.190)0.486 0.044
(−0.098,
0.187)0.543 0.041
(−0.110,
0.192)0.592 NC 0.194
(−0.456,
0.844)0.558 0.150
(−0.162,
0.463)0.346 0.446
(0.087,
0.805)0.015 −0.052
(−0.995,
0.892)0.914 −0.351
(−0.809,
0.107)0.132 0.086
(−0.397,
0.570)0.726 RDW −0.015
(−0.197,
0.166)0.868 −0.023
(−0.110,
0.065)0.611 −0.001
(−0.102,
0.099)0.978 0.355
(−0.037,
0.747)0.076 0.076
(−0.114,
0.266)0.432 0.098
(−0.103,
0.299)0.339 PLT 13.906
(−9.632,
37.444)0.247 17.909
(6.585,
29.234)0.002 34.244
(21.244,
47.244)< 0.001 5.776
(−30.607,
42.158)0.755 −6.919
(−24.545,
10.707)0.441 8.666
(−10.106,
27.439)0.365 MPV 0.090
(−0.197,
0.377)0.539 −0.044
(−0.182,
0.094)0.532 −0.214
(−0.372,
−0.055)0.008 0.150
(−0.223,
0.522)0.429 0.006
(−0.175,
0.186)0.952 0.091
(−0.101,
0.283)0.351 PLR 2.843
(−11.792,
17.478)0.703 0.950
(−6.088,
7.988)0.791 14.297
(6.223,
22.370)0.001 13.512
(−8.630,
35.655)0.231 −7.225
(−17.952,
3.501)0.186 0.269
(−11.156,
11.695)0.963 NLR 0.071
(−0.281,
0.424)0.690 −0.054
(−0.224,
0.115)0.529 0.226
(0.031,
0.420)0.023 0.017
(−0.548,
0.582)0.953 −0.202
(−0.475,
0.072)0.148 −0.004
(−0.293,
0.286)0.978 SII 35.710
(−84.714,
156.134)0.561 15.515
(−42.423,
73.454)0.599 132.991
(66.524,
199.458)< 0.001 −10.921
(−218.632,
196.790)0.918 −87.054
(−187.432,
13.324)0.089 9.295
(−97.320,
115.910)0.864 Previous studies have shown that vitamin D3 can boost the production of testosterone by reducing the activity of aromatase, and testosterone is known to have anti-inflammatory effects, which explains the negative association between vitamin D and serum inflammatory markers in males. But multiple previous studies have suggested that the link between vitamin D and inflammation is more pronounced in women, this can be explained by the sex hormone-related mechanisms. Estrogen can reduce the expression of the CYP24A1 gene and increase the expression of the VDR gene, resulting in a stronger anti-inflammatory response in women than in men. In our study, the association between vitamin D levels and inflammatory markers in the female cohort was only found to be meaningful at wave 1 and was not validated in the longitudinal cohort. This may be related to the limited sample size of this study, and we only included healthy adolescents. However, the results obtained in this study require to be verified by future study with a larger sample size.
This study has several limitations. First, compared to other studies, we did not include sufficient dietary information to assess total vitamin D3 intake, and it did not include information on the amount of daylight exposure. Second, all the included samples were only from a middle school, therefore the results are limited in generality and not nationally represented. Third, although we included some confounders, our effect estimates may have been influenced by other unmeasured or unknown confounders, such as the impact of COVID-19 and academic pressure, or other potential inflammatory-related influences. Moreover, the information about confounders was measured at baseline, the changes of the confounders were not considered. Fourth, there was no strict clinical diagnosis and screening when the subjects were included in the study. Finally, only peripheral blood cells and their related indicators were selected as inflammatory markers in this study, and it is necessary to expand research in the future to further explore the association between vitamin D and other systemic inflammatory markers.
In summary, our study revealed a negative correlation between vitamin D levels and WBC, LC, NC, PLT, NLR, PLR, SII levels, while a positive correlation was observed with MPV, with this association primarily evident among male participants. Our findings suggest that it is imperative to strengthen the assessment of adolescents' vitamin D level, and further conduct intervention studies targeting individuals with vitamin D deficiency among adolescents. By enhancing vitamin D levels, including increasing time spent outdoors for physical activity and administering vitamin D supplements, thus promoting the health of adolescents and reducing the risk of various diseases caused by SI.
-
Table S4. Correlation of longitudinal trajectories of vitamin D status with changes in systemic inflammation indexes
Variables Remitted VDD New VDD Persistent VDD Crude model Adjusted model Crude model Adjusted model Crude model Adjusted model β (95% CI) P value β (95% CI) P value β (95% CI) P value β (95% CI) P value β (95% CI) P value β (95% CI) P value WBC −0.138
(−0.770,
0.493)0.667 0.029
(−0.489,
0.548)0.912 0.155
(−0.145,
0.454)0.311 0.040
(−0.209,
0.289)0.754 0.328
(0.001,
0.655)0.049 0.303
(0.028,
0.578)0.031 LC −0.065
(−0.286,
0.156)0.563 −0.029
(−0.200,
0.143)0.742 0.110
(0.005,
0.215)0.039 0.093
(0.011,
0.176)0.026 0.096
(−0.018,
0.211)0.099 0.036
(−0.055,
0.127)0.440 NC 0.083
(−0.560,
0.725)0.801 0.166
(−0.369,
0.702)0.542 0.122
(−0.182,
0.427)0.431 −0.030
(−0.287,
0.227)0.820 0.344
(0.011,
0.677)0.043 0.321
(0.037,
0.605)0.027 RDW 0.007
(−0.234,
0.248)0.955 0.116
(−0.069,
0.300)0.218 0.093
(−0.022,
0.207)0.111 0.006
(−0.082,
0.095)0.889 0.075
(−0.050,
0.200)0.241 0.021
(−0.076,
0.119)0.668 PLT 10.894
(−11.474,
33.262)0.340 11.521
(−8.344,
31.386)0.255 11.859
(1.251,
22.466)0.028 10.035
(0.496,
19.574)0.039 26.760
(15.175,
38.344)< 0.001 24.844
(14.303,
35.385)< 0.001 MPV 0.101
(−0.169,
0.371)0.462 0.101
(−0.125,
0.327)0.381 −0.050
(−0.178,
0.078)0.444 −0.040
(−0.149,
0.068)0.464 −0.004
(−0.144,
0.136)0.954 −0.090
(−0.210,
0.030)0.143 PLR 10.152
(−3.235,
23.539)0.137 6.691
(−5.561,
18.944)0.284 0.105
(−6.243,
6.453)0.974 −1.498
(−7.381,
4.385)0.618 9.189
(2.255,
16.122)0.009 8.978
(2.469,
15.488)0.007 NLR 0.091
(−0.258,
0.440)0.608 0.073
(−0.228,
0.374)0.635 −0.026
(−0.191,
0.140)0.762 −0.102
(−0.247,
0.043)0.167 0.131
(−0.049,
0.312)0.154 0.131
(−0.029,
0.291)0.107 SII 46.964
(−67.522,
161.450)0.421 28.418
(−78.293,
135.130)0.601 11.228
(−43.063,
65.520)0.685 −18.340
(−69.563,
32.884)0.483 103.296
(44.001,
162.591)0.001 87.914
(31.231,
144.597)0.002 Note. No VDD (reference group): 25(OH)D ≥ 20 ng/mL at both wave 1 And wave 3, new VDD: baseline 25(OH)D ≥ 20 ng/mL at wave 1 and 25(OH)D < 20 ng/mL at wave 3, remitted VDD: 25(OH)D < 20 ng/mL at wave 1 and 25(OH)D ≥ 20 ng/mL at wave 3, persistent VDD: 25(OH)D < 20 nmol/L at both wave 1 and wave 3; Adjusted model included covariates: age, sex, residential area, family economic status, parent’s education level, BMI, moderate physical activity, vigorous physical activity, and blood cell indices levels at wave1. Table S6. Sex differences in association between longitudinal changes in vitamin D levels with changes in systemic inflammation indexes
Variables Males Females β 95% CI P value β 95% CI P value WBC −0.013 −0.039, 0.012 0.312 0.002 −0.033, 0.037 0.913 LC −0.013 −0.021, −0.004 0.003 −0.009 −0.021, 0.002 0.118 NC −0.004 −0.030, 0.022 0.740 0.024 −0.014, 0.062 0.209 RDW −0.001 −0.008, 0.006 0.820 0.003 −0.012, 0.019 0.671 PLT −0.907 −1.839, 0.026 0.057 0.272 −1.178, 1.722 0.713 MPV 0.015 0.004, 0.026 0.010 0.006 −0.009, 0.020 0.463 PLR 0.300 −0.281, 0.881 0.311 0.776 −0.106, 1.657 0.084 NLR 0.011 −0.003, 0.025 0.139 0.019 −0.003, 0.042 0.095 SII 1.156 −3.617, 5.928 0.635 6.904 −1.386, 15.193 0.102 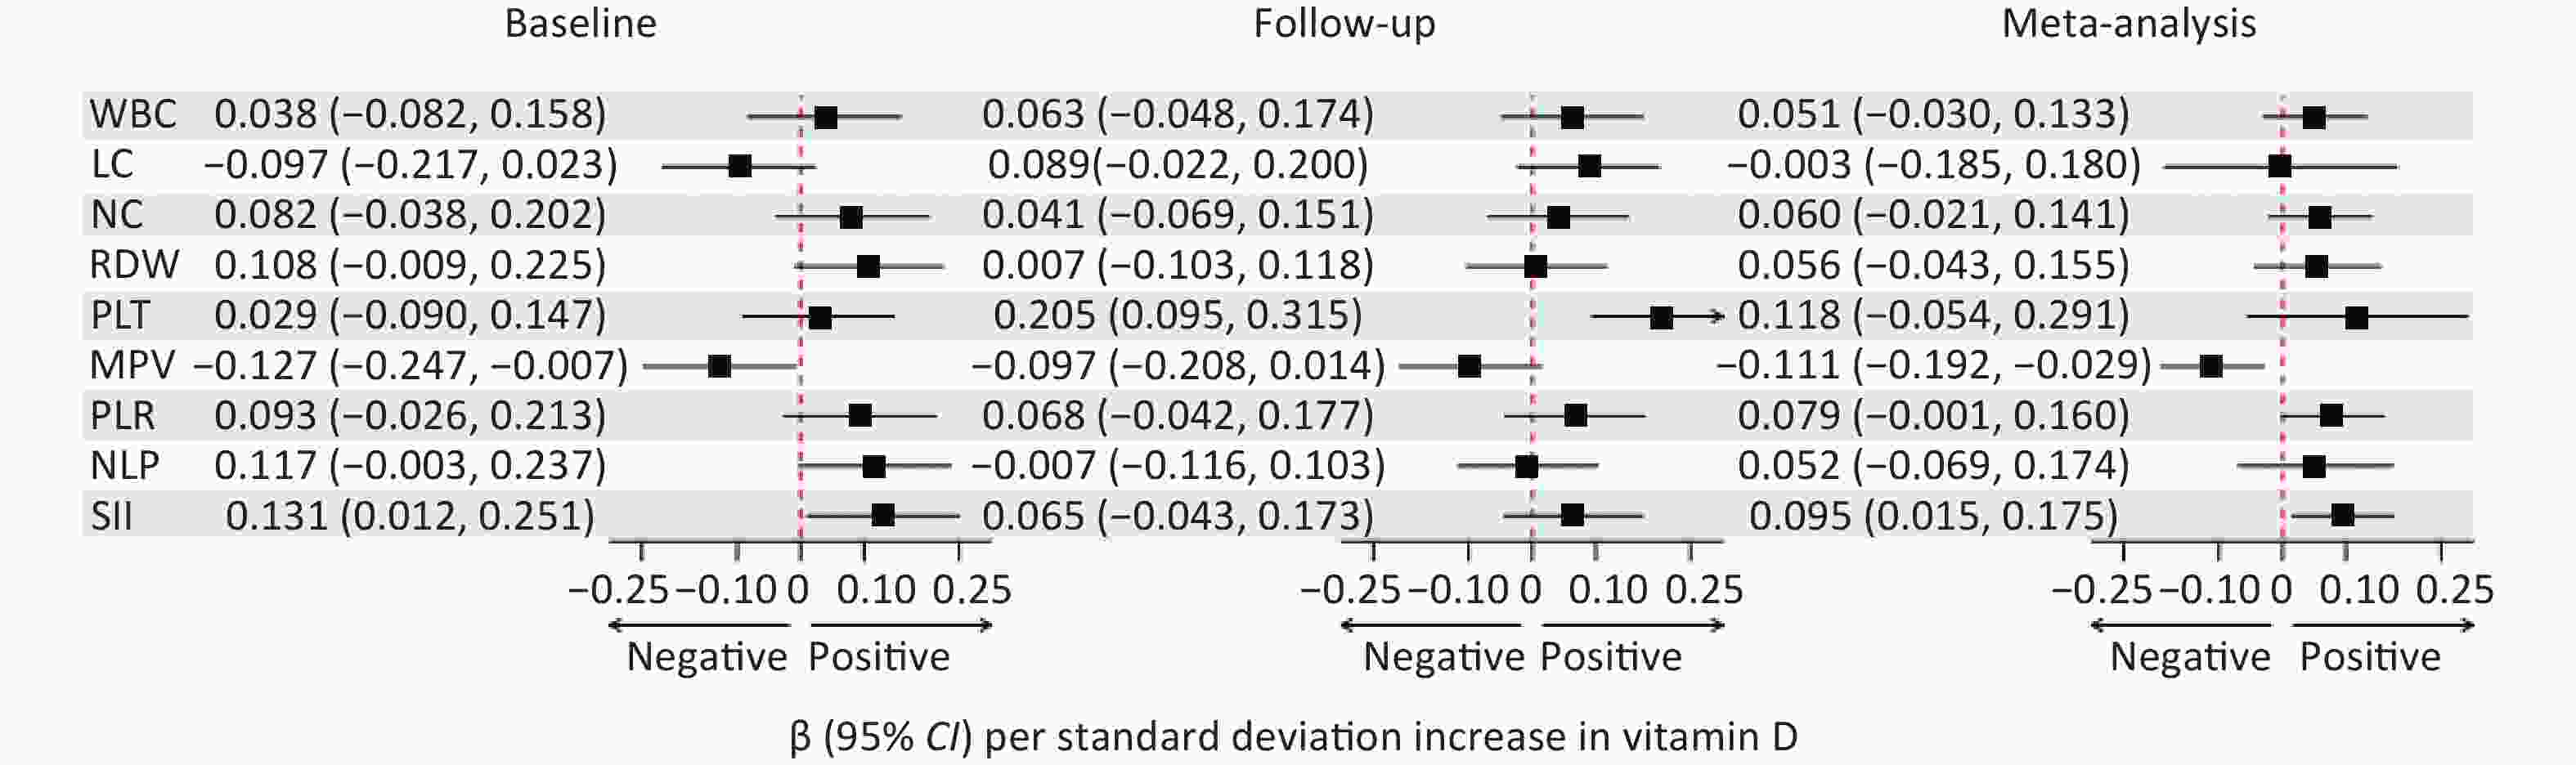
Figure S2. Linear regression analysis was performed for vitamin D deficiency and 9 blood markers of systemic inflammation at baseline and at 2-year follow-up.
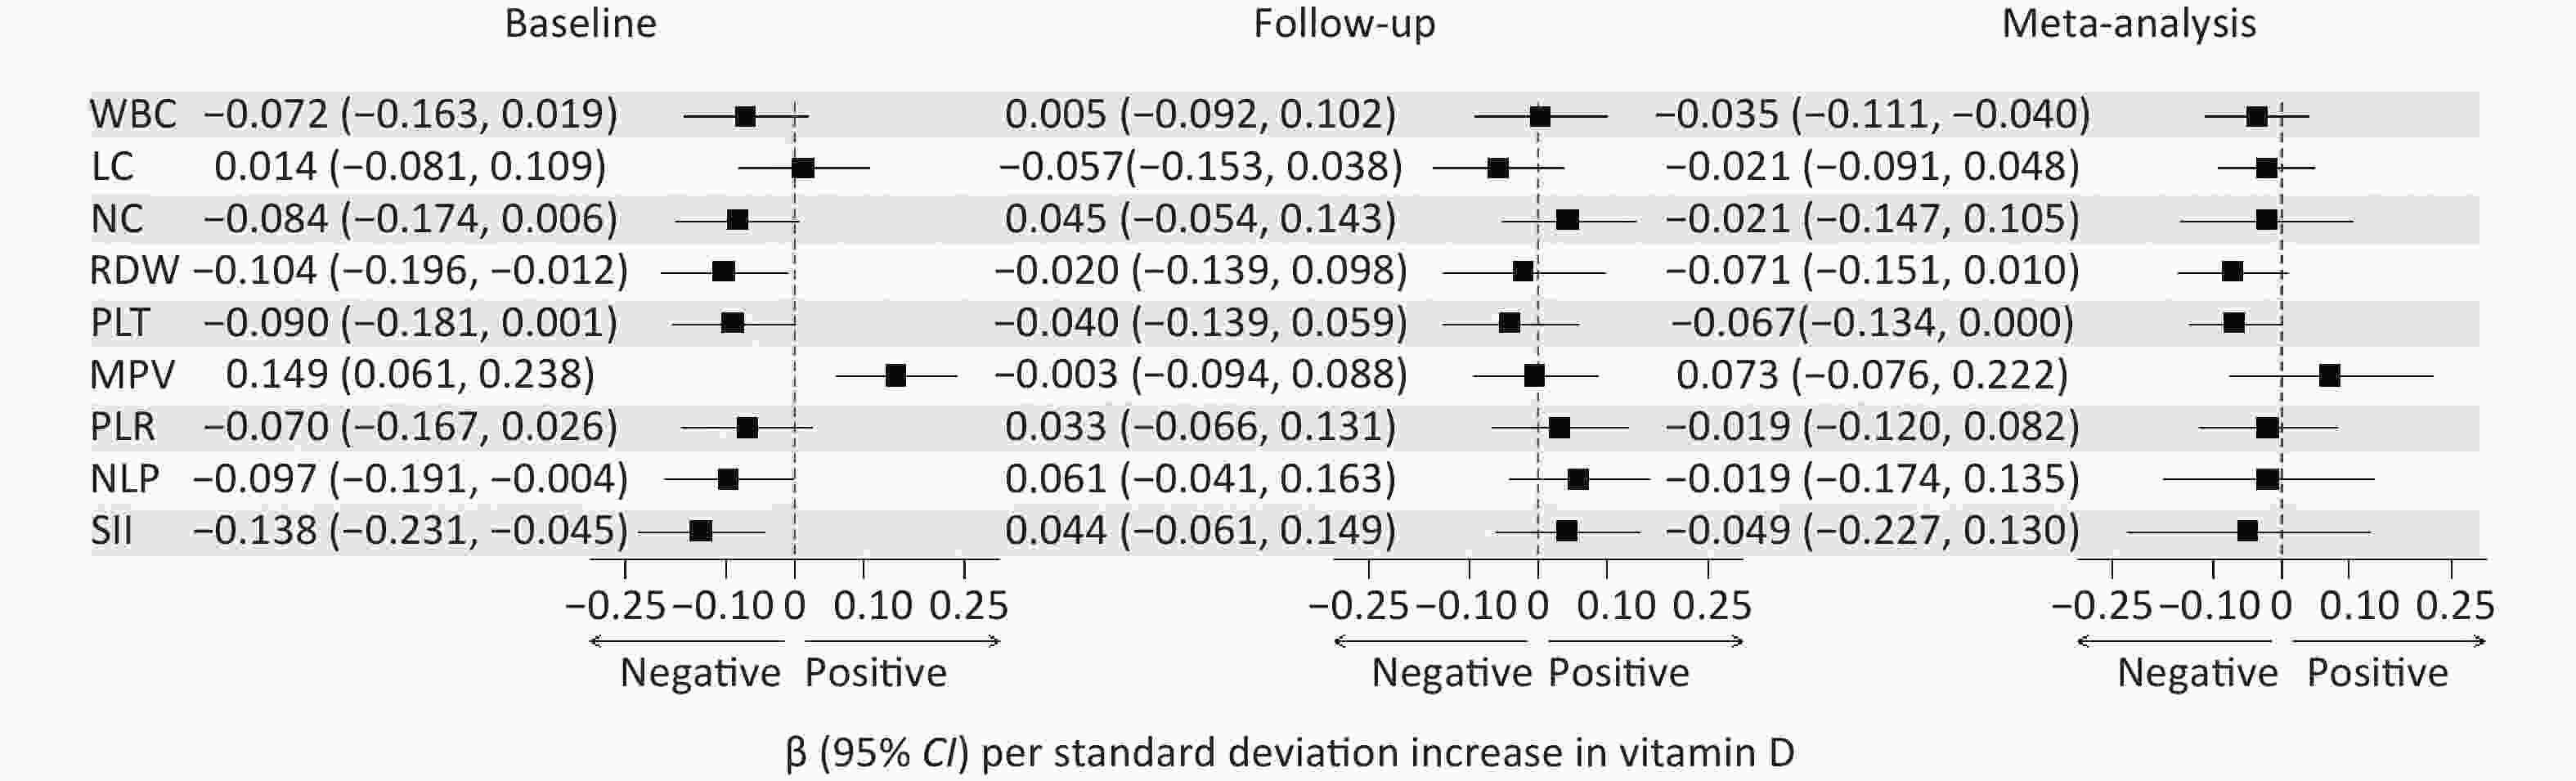
Figure S4. Linear regression analysis was performed for vitamin D levels and 9 blood markers of systemic inflammation at baseline and at 2-year follow-up in female students. Vitamin D levels and 9 blood markers of inflammation levels at both wave 1 and wave 3 was log-transformed and standardized to z-score. Meta-analysis combined results at both time points revealed significant associations between serum vitamin D levels with multiple inflammatory markers. β indicates per SD increment in vitamin D levels, β and 95% CI were obtained by linear regression, adjusting for age, residential area, family economic status, parent’s education level, BMI, moderate physical activity and vigorous physical activity.
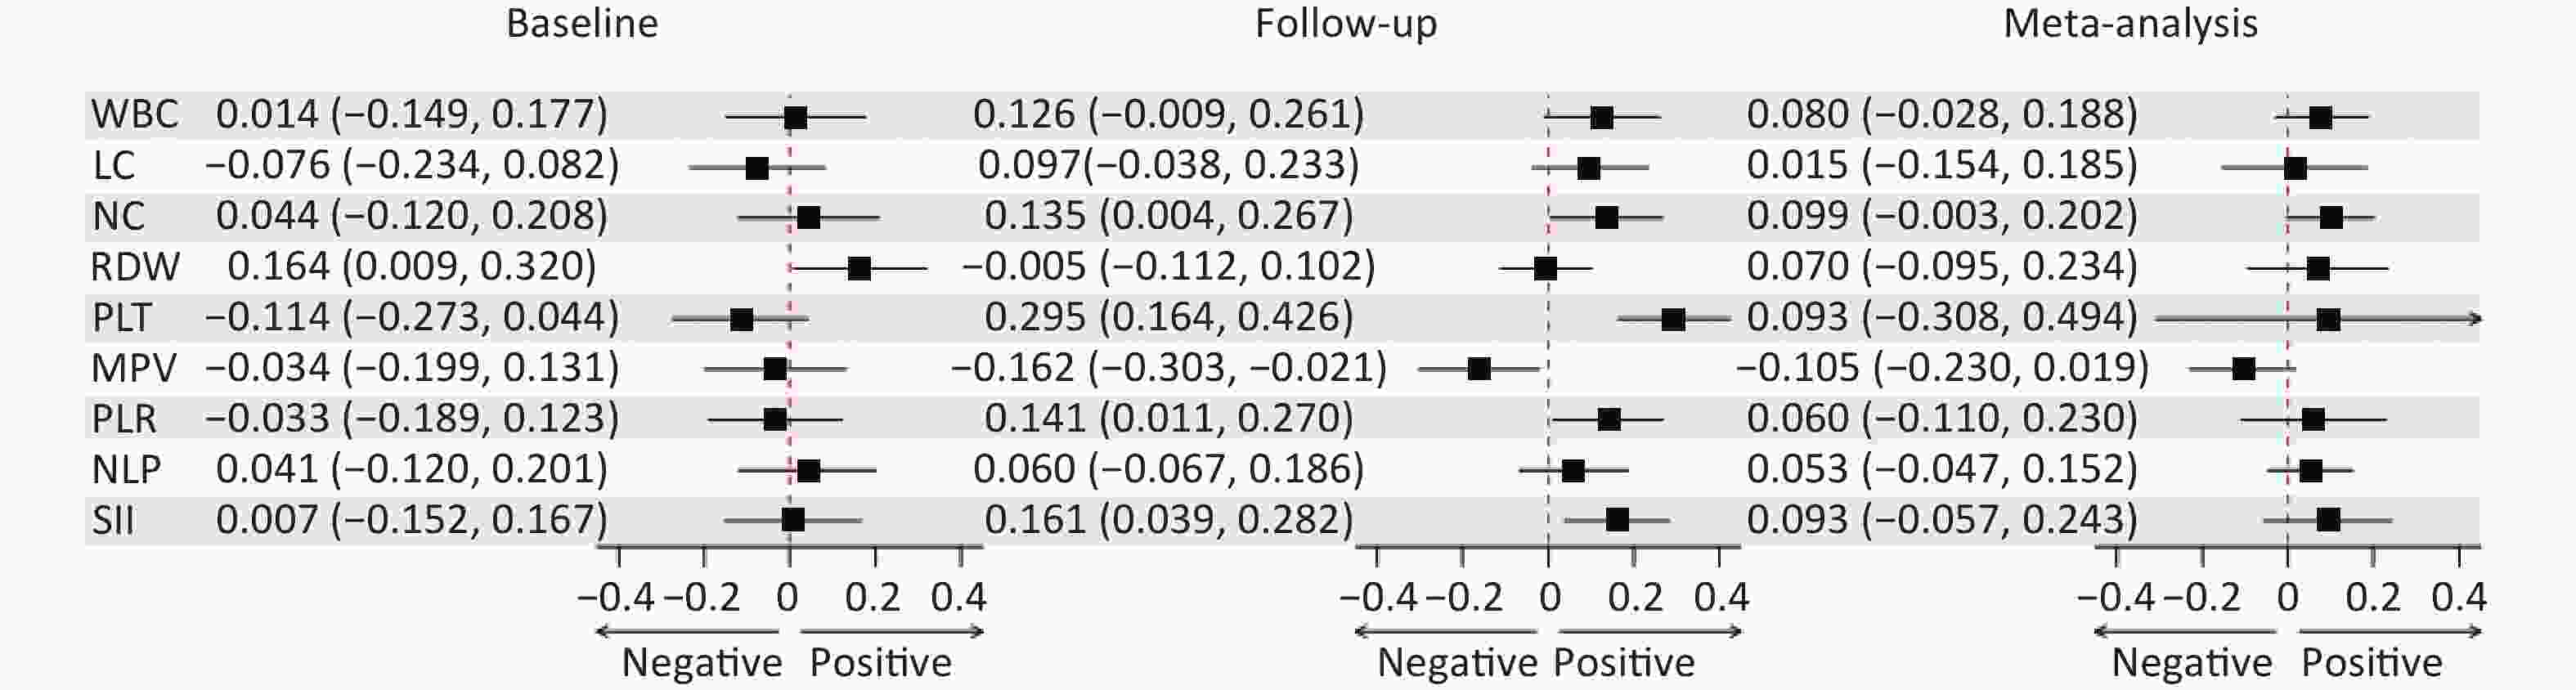
Figure S5. Linear regression analysis was performed for vitamin D deficiency and 9 blood markers of systemic inflammation at baseline and at 2-year follow-up in male students.
doi: 10.3967/bes2024.139
Longitudinal Associations between Vitamin D Status and Systemic Inflammation Markers among Early Adolescents
-
Ting Tang: Conceptualization, methodology, investigation, formal analysis, literature search, and writing-original draft. Xinhui Wang: Methodology, investigation, formal analysis, and writing-review & editing. Xue Wen, Min Li, and Mengyuan Yuan: Methodology, formal analysis, and writing-review & editing. Yonghan Li: Investigation, and writing-review & editing. Xiaoqin Zhong, Fangbiao Tao, and Puyu Su: Writing-review & editing. Xihua Yu: Conceptualization, methodology, and writing-review & editing. Gengfu Wang: Conceptualization, methodology, investigation, formal analysis, literature search, and writing-review & editing.
All authors report no conflict of interest.
&These authors contributed equally to this work.
注释:1) Authors’ Contributions: 2) Competing Interests: -
S1. Directed acyclic graph (DAG) illustrating confounders selection. The confounders included in this study were age (used as a continuous variable), sex (male or female), residential area (urban or rural), family economic status (poor/medium or good), parents' education level (primary and secondary school or high school above), body mass index (used as a continuous variable), moderate physical activity and vigorous physical activity. These factors have been found to be associated with vitamin D levels and SI.
Figure 1. Linear regression analysis was performed for vitamin D levels and 9 blood markers of systemic inflammation indexes at baseline and at 2-year follow-up. Vitamin D levels and 9 blood inflammatory marker levels at both wave 1 and wave 3 was log-transformed and standardized to z-score. Meta-analysis combined results at both time points revealed significant associations between serum vitamin D levels with multiple inflammatory markers, β indicates per SD increment in vitamin D levels, β and 95% CI were obtained by linear regression, adjusting for age, sex, residential area, family economic status, parent’s education level, BMI, moderate physical activity and vigorous physical activity.
S3. Linear regression analysis was performed for vitamin D levels and 9 blood markers of systemic inflammation at baseline and at 2-year follow-up in male students. Vitamin D levels and 9 blood markers of inflammation levels at both wave 1 and wave 3 was log-transformed and standardized to z-score. Meta-analysis combined results at both time points revealed significant associations between serum vitamin D levels with multiple inflammatory markers. β indicates per SD increment in vitamin D levels, β and 95% CI were obtained by linear regression, adjusting for age, residential area, family economic status, parent’s education level, BMI, moderate physical activity and vigorous physical activity.
S6. Linear regression analysis was performed for vitamin D deficiency and 9 blood markers of systemic inflammation at baseline and at 2-year follow-up in female students.
S2. Linear regression analysis was performed for vitamin D deficiency and 9 blood markers of systemic inflammation at baseline and at 2-year follow-up.
S4. Linear regression analysis was performed for vitamin D levels and 9 blood markers of systemic inflammation at baseline and at 2-year follow-up in female students. Vitamin D levels and 9 blood markers of inflammation levels at both wave 1 and wave 3 was log-transformed and standardized to z-score. Meta-analysis combined results at both time points revealed significant associations between serum vitamin D levels with multiple inflammatory markers. β indicates per SD increment in vitamin D levels, β and 95% CI were obtained by linear regression, adjusting for age, residential area, family economic status, parent’s education level, BMI, moderate physical activity and vigorous physical activity.
S5. Linear regression analysis was performed for vitamin D deficiency and 9 blood markers of systemic inflammation at baseline and at 2-year follow-up in male students.
S1. STROBE Statement—Checklist of items that should be included in reports of cohort studies
Items Item No Recommendation Title and abstract 1 (a) Indicate the study’s design with a commonly used term in the title or the abstract (b) Provide in the abstract an informative and balanced summary of what was done and what was found Introduction Background/
rationale2 Explain the scientific background and rationale for the investigation being reported Objectives 3 State specific objectives, including any prespecified hypotheses Methods Study design 4 Present key elements of study design early in the paper Setting 5 Describe the setting, locations, and relevant dates, including periods of recruitment, exposure, follow-up, and data collection Participants 6 (a) Give the eligibility criteria, and the sources and methods of selection of participants. Describe methods of follow-up (b) For matched studies, give matching criteria and number of exposed and unexposed Variables 7 Clearly define all outcomes, exposures, predictors, potential confounders, and effect modifiers. Give diagnostic criteria, if applicable Data sources/ measurement 8* For each variable of interest, give sources of data and details of methods of assessment (measurement). Describe comparability of assessment methods if there is more than one group Bias 9 Describe any efforts to address potential sources of bias Study size 10 Explain how the study size was arrived at Quantitative variables 11 Explain how quantitative variables were handled in the analyses. If applicable, describe which groupings were chosen and why
Statistical methods12 (a) Describe all statistical methods, including those used to control for confounding (b) Describe any methods used to examine subgroups and interactions (c) Explain how missing data were addressed (d) If applicable, explain how loss to follow-up was addressed (e) Describe any sensitivity analyses Results Participants 13* (a) Report numbers of individuals at each stage of study—eg numbers potentially eligible, examined for eligibility, confirmed eligible, included in the study, completing follow-up, and analysed (b) Give reasons for non-participation at each stage (c) Consider use of a flow diagram Descriptive data 14* (a) Give characteristics of study participants (eg demographic, clinical, social) and information on exposures and potential confounders (b) Indicate number of participants with missing data for each variable of interest (c) Summarise follow-up time (eg, average and total amount) Outcome data 15* Report numbers of outcome events or summary measures over time Main results 16 (a) Give unadjusted estimates and, if applicable, confounder-adjusted estimates and their precision (eg, 95% confidence interval). Make clear which confounders were adjusted for and why they were included (b) Report category boundaries when continuous variables were categorized (c) If relevant, consider translating estimates of relative risk into absolute risk for a meaningful time period Other analyses 17 Report other analyses done—eg analyses of subgroups and interactions, and sensitivity analyses Discussion Key results 18 Summarise key results with reference to study objectives Limitations 19 Discuss limitations of the study, taking into account sources of potential bias or imprecision. Discuss both direction and magnitude of any potential bias Interpretation 20 Give a cautious overall interpretation of results considering objectives, limitations, multiplicity of analyses, results from similar studies, and other relevant evidence Generalisability 21 Discuss the generalisability (external validity) of the study results Other information Funding 22 Give the source of funding and the role of the funders for the present study and, if applicable, for the original study on which the present article is based Note. *Give information separately for exposed and unexposed groups. An Explanation and Elaboration article discusses each checklist item and gives methodological background and published examples of transparent reporting. The STROBE checklist is best used in conjunction with this article (freely available on the Web sites of PLoS Medicine at http://www.plosmedicine.org/, Annals of Internal Medicine at http://www.annals.org/, and Epidemiology at http://www.epidem.com/). Information on the STROBE Initiative is available at http://www.strobe-statement.org.  下载: 导出CSV
S2. Description of the main sample characteristics
Variables Overall Males Females P value Mean or n SD or % Mean or n SD or % Mean or n SD or % Wave1 (n = 1,423) WBC (×109/L) 7.22 2.11 7.18 2.14 7.30 2.06 0.321 LC (×109/L) 2.61 0.69 2.63 0.68 2.57 0.70 0.071 NC (×109/L) 3.85 1.96 3.79 1.99 3.95 1.90 0.15 RDW (%) 13.37 0.76 13.50 0.74 13.17 0.76 < 0.001 PLT (×109/L) 283.88 61.09 284.52 61.57 282.86 60.35 0.626 MPV (fL) 10.59 1.09 10.57 1.13 10.62 1.04 0.491 PLR 114.68 33.56 113.44 32.81 116.65 34.66 0.087 NLR 1.58 0.90 1.54 0.90 1.65 0.90 0.029 SII (×109/L) 438.60 255.61 426.81 253.87 457.32 257.49 0.033 VD (ng/mL) 23.23 5.68 23.93 5.75 22.13 5.38 < 0.001 VDD Yes 410 28.8 202 23.2 208 37.4 < 0.001 No 1013 71.2 666 76.8 347 62.6 Wave3 (n = 1,348) WBC (×109/L) 7.96 2.07 7.80 2.02 8.21 2.12 < 0.001 LC (×109/L) 2.33 0.66 2.38 0.65 2.26 0.67 < 0.001 NC (×109/L) 4.67 2.11 4.44 2.02 5.04 2.19 0.002 RDW (%) 13.37 0.72 13.31 0.56 13.47 0.91 0.621 PLT (×109/L) 309.91 78.15 302.25 75.22 322.06 81.19 < 0.001 MPV (fL) 9.75 0.99 9.73 1.02 9.77 0.95 < 0.001 PLR 141.59 48.45 135.23 45.92 151.68 50.64 0.469 NLR 2.17 1.17 2.02 1.08 2.42 1.27 < 0.001 SII (×109/L) 684.87 424.34 616.58 376.06 793.27 471.81 < 0.001 VD (ng/mL) 19.25 5.80 20.12 5.89 17.88 5.38 0.912 VDD Yes 780 57.9 411 49.7 369 70.8 < 0.001 No 568 42.1 416 50.3 152 29.2 Note. Data for numerical variables are expressed in terms of mean ± standard deviation and data for categorical variables in terms of frequency and percentage. A Kolmogorov–Smirnov normality test was used to determine the normal distribution of the variables. The Mann–Whitney U test was used for independent variables not normally distributed, and the Wilcoxon test was used for dependent variables. WBC, white blood cell; LC, lymphocyte count; NC, neutrophil count; RDW, red blood cell distribution width; PLT, platelet count; MPV, mean platelet volume; NLR, neutrophil to lymphocyte ratio; PLR, platelet to lymphocyte ratio; SII, systemic immune inflammation index.
下载: 导出CSV
S3. Definition of vitamin D deficiency trajectory
Variables 25(OH)D levels of wave 1 (ng/mL) 25(OH)D levels of wave 3 (ng/mL) No VDD ≥ 20 ≥ 20 New VDD ≥ 20 < 20 Remitted VDD < 20 ≥ 20 Persistent VDD < 20 < 20 Note. (1) defined as no VDD when the 25(OH)D of both wave 1 and wave 3 is greater than or equal to 20 ng/mL (reference group); (2) defined as new VDD when the 25(OH)D of wave 1 is greater than or equal to 20 ng/mL and the 25(OH)D of wave 3 is less than 20 ng/mL; (3) defined as remitted VDD when the 25(OH)D of wave 1 is less than 20 ng/mL and the 25(OH)D of wave 3 is greater than or equal to 20 ng/mL; (4) defined as persistent VDD when the 25(OH)D is less than 20 ng/mL across two waves.
下载: 导出CSV
Table 1. Correlation of vitamin D deficiency at baseline with longitudinal changes in systemic inflammation indexes
Variables Crude model Adjusted model β 95% CI P-value β 95% CI P-value WBC 0.184 −0.094, 0.462 0.194 0.241 0.010, 0.472 0.041 LC 0.020 −0.077, 0.117 0.690 −0.020 −0.097, 0.057 0.607 NC 0.246 −0.037, 0.529 0.088 0.312 0.073, 0.551 0.011 RDW 0.021 −0.086, 0.127 0.703 0.033 −0.049, 0.115 0.432 PLT 18.748 8.889, 28.607 < 0.001 17.835 8.954, 26.715 < 0.001 MPV 0.036 −0.083, 0.154 0.557 −0.040 −0.141, 0.061 0.439 PLR 9.288 3.402, 15.174 0.002 9.355 3.884, 14.826 0.001 NLR 0.137 −0.016, 0.291 0.079 0.172 0.038, 0.307 0.012 SII 89.355 38.998, 139.712 0.001 87.587 39.883, 135.291 < 0.001 Note. Adjusted model included covariates: age, sex, residential area, family economic status, parent’s education level, BMI, moderate physical activity, vigorous physical activity, and corresponding blood cell indices levels at wave. WBC, white blood cell; LC, lymphocyte count; NC, neutrophil count; RDW, red blood cell distribution width; PLT, platelet count; MPV, mean platelet volume; PLR, platelet to lymphocyte ratio; NLR, neutrophil to lymphocyte ratio; SII, systemic immune inflammation index.
下载: 导出CSV
Table 2. Correlation of longitudinal changes in vitamin D levels with changes in systemic inflammation indexes
Variables Crude model Adjusted model β 95% CI P value β 95% CI P value WBC −0.016 −0.038, 0.006 0.158 −0.008 −0.029, 0.013 0.454 LC −0.012 −0.019, −0.004 0.003 −0.012 −0.019, −0.005 0.001 NC −0.003 −0.025, 0.019 0.796 0.006 −0.016, 0.027 0.610 RDW −0.006 −0.015, 0.002 0.129 0.002 −0.006, 0.009 0.647 PLT 0.763 −0.015, 1.540 0.054 −0.519 −1.309, 0.272 0.198 MPV 0.013 0.004, 0.023 0.005 0.012 0.003, 0.021 0.009 PLR 1.020 0.559, 1.481 < 0.001 0.487 0.001, 0.974 0.050 NLR 0.011 −0.001, 0.023 0.083 0.014 −0.002, 0.026 0.051 SII 5.693 1.731, 9.654 0.005 3.360 −0.886, 7.605 0.121 Note. Adjusted model included covariates: age, sex, residential area, family economic status, parent’s education level, BMI, moderate physical activity, vigorous physical activity, corresponding blood cell indices levels at wave 1, and vitamin D levels at wave 1. WBC, white blood cell; LC, lymphocyte count; NC, neutrophil count; RDW, red blood cell distribution width; PLT, platelet count; MPV, mean platelet volume; PLR, platelet to lymphocyte ratio; NLR, neutrophil to lymphocyte ratio; SII, systemic immune inflammation index.
下载: 导出CSV
S5. Sex differences in association between vitamin D deficiency at baseline and longitudinal changes in systemic inflammation indexes
Variables Males Females β 95% CI P-value β 95% CI P-value WBC 0.277 −0.031, 0.586 0.078 0.198 −0.152, 0.547 0.267 LC −0.030 −0.132, 0.072 0.560 −0.003 −0.121, 0.115 0.956 NC 0.339 0.028, 0.650 0.033 0.284 −0.095, 0.663 0.141 RDW 0.005 −0.082, 0.092 0.911 0.082 −0.075, 0.239 0.306 PLT 23.369 12.032, 34.706 < 0.001 12.596 −2.052, 27.243 0.092 MPV −0.139 −0.276, −0.002 0.047 0.095 −0.056, 0.245 0.216 PLR 11.769 4.774, 18.764 0.001 6.315 −2.633, 15.263 0.166 NLR 0.218 0.050, 0.386 0.011 0.122 −0.106, 0.349 0.293 SII 108.554 50.982, 166.127 < 0.001 60.058 −23.908, 144.023 0.161
下载: 导出CSV
S7. Sex differences in association between vitamin D deficiency at baseline with longitudinal changes in systemic inflammation indices
Variables Males Females Remitted VDD New VDD Persistent VDD Remitted VDD New VDD Persistent VDD β (95% CI) P value β (95% CI) P value β (95% CI) P value β (95% CI) P value β (95% CI) P value β (95% CI) P value WBC 0.053
(−0.593,
0.698)0.873 0.134
(−0.176,
0.445)0.396 0.395
(0.038,
0.751)0.030 −0.198
(−1.069,
0.674)0.656 −0.099
(−0.521,
0.324)0.646 0.182
(−0.265,
0.629)0.424 LC 0.001
(−0.211,
0.214)0.990 0.123
(0.021,
0.225)0.019 0.022
(−0.095,
0.140)0.710 −0.104
(−0.399,
0.190)0.486 0.044
(−0.098,
0.187)0.543 0.041
(−0.110,
0.192)0.592 NC 0.194
(−0.456,
0.844)0.558 0.150
(−0.162,
0.463)0.346 0.446
(0.087,
0.805)0.015 −0.052
(−0.995,
0.892)0.914 −0.351
(−0.809,
0.107)0.132 0.086
(−0.397,
0.570)0.726 RDW −0.015
(−0.197,
0.166)0.868 −0.023
(−0.110,
0.065)0.611 −0.001
(−0.102,
0.099)0.978 0.355
(−0.037,
0.747)0.076 0.076
(−0.114,
0.266)0.432 0.098
(−0.103,
0.299)0.339 PLT 13.906
(−9.632,
37.444)0.247 17.909
(6.585,
29.234)0.002 34.244
(21.244,
47.244)< 0.001 5.776
(−30.607,
42.158)0.755 −6.919
(−24.545,
10.707)0.441 8.666
(−10.106,
27.439)0.365 MPV 0.090
(−0.197,
0.377)0.539 −0.044
(−0.182,
0.094)0.532 −0.214
(−0.372,
−0.055)0.008 0.150
(−0.223,
0.522)0.429 0.006
(−0.175,
0.186)0.952 0.091
(−0.101,
0.283)0.351 PLR 2.843
(−11.792,
17.478)0.703 0.950
(−6.088,
7.988)0.791 14.297
(6.223,
22.370)0.001 13.512
(−8.630,
35.655)0.231 −7.225
(−17.952,
3.501)0.186 0.269
(−11.156,
11.695)0.963 NLR 0.071
(−0.281,
0.424)0.690 −0.054
(−0.224,
0.115)0.529 0.226
(0.031,
0.420)0.023 0.017
(−0.548,
0.582)0.953 −0.202
(−0.475,
0.072)0.148 −0.004
(−0.293,
0.286)0.978 SII 35.710
(−84.714,
156.134)0.561 15.515
(−42.423,
73.454)0.599 132.991
(66.524,
199.458)< 0.001 −10.921
(−218.632,
196.790)0.918 −87.054
(−187.432,
13.324)0.089 9.295
(−97.320,
115.910)0.864
下载: 导出CSV
S4. Correlation of longitudinal trajectories of vitamin D status with changes in systemic inflammation indexes
Variables Remitted VDD New VDD Persistent VDD Crude model Adjusted model Crude model Adjusted model Crude model Adjusted model β (95% CI) P value β (95% CI) P value β (95% CI) P value β (95% CI) P value β (95% CI) P value β (95% CI) P value WBC −0.138
(−0.770,
0.493)0.667 0.029
(−0.489,
0.548)0.912 0.155
(−0.145,
0.454)0.311 0.040
(−0.209,
0.289)0.754 0.328
(0.001,
0.655)0.049 0.303
(0.028,
0.578)0.031 LC −0.065
(−0.286,
0.156)0.563 −0.029
(−0.200,
0.143)0.742 0.110
(0.005,
0.215)0.039 0.093
(0.011,
0.176)0.026 0.096
(−0.018,
0.211)0.099 0.036
(−0.055,
0.127)0.440 NC 0.083
(−0.560,
0.725)0.801 0.166
(−0.369,
0.702)0.542 0.122
(−0.182,
0.427)0.431 −0.030
(−0.287,
0.227)0.820 0.344
(0.011,
0.677)0.043 0.321
(0.037,
0.605)0.027 RDW 0.007
(−0.234,
0.248)0.955 0.116
(−0.069,
0.300)0.218 0.093
(−0.022,
0.207)0.111 0.006
(−0.082,
0.095)0.889 0.075
(−0.050,
0.200)0.241 0.021
(−0.076,
0.119)0.668 PLT 10.894
(−11.474,
33.262)0.340 11.521
(−8.344,
31.386)0.255 11.859
(1.251,
22.466)0.028 10.035
(0.496,
19.574)0.039 26.760
(15.175,
38.344)< 0.001 24.844
(14.303,
35.385)< 0.001 MPV 0.101
(−0.169,
0.371)0.462 0.101
(−0.125,
0.327)0.381 −0.050
(−0.178,
0.078)0.444 −0.040
(−0.149,
0.068)0.464 −0.004
(−0.144,
0.136)0.954 −0.090
(−0.210,
0.030)0.143 PLR 10.152
(−3.235,
23.539)0.137 6.691
(−5.561,
18.944)0.284 0.105
(−6.243,
6.453)0.974 −1.498
(−7.381,
4.385)0.618 9.189
(2.255,
16.122)0.009 8.978
(2.469,
15.488)0.007 NLR 0.091
(−0.258,
0.440)0.608 0.073
(−0.228,
0.374)0.635 −0.026
(−0.191,
0.140)0.762 −0.102
(−0.247,
0.043)0.167 0.131
(−0.049,
0.312)0.154 0.131
(−0.029,
0.291)0.107 SII 46.964
(−67.522,
161.450)0.421 28.418
(−78.293,
135.130)0.601 11.228
(−43.063,
65.520)0.685 −18.340
(−69.563,
32.884)0.483 103.296
(44.001,
162.591)0.001 87.914
(31.231,
144.597)0.002 Note. No VDD (reference group): 25(OH)D ≥ 20 ng/mL at both wave 1 And wave 3, new VDD: baseline 25(OH)D ≥ 20 ng/mL at wave 1 and 25(OH)D < 20 ng/mL at wave 3, remitted VDD: 25(OH)D < 20 ng/mL at wave 1 and 25(OH)D ≥ 20 ng/mL at wave 3, persistent VDD: 25(OH)D < 20 nmol/L at both wave 1 and wave 3; Adjusted model included covariates: age, sex, residential area, family economic status, parent’s education level, BMI, moderate physical activity, vigorous physical activity, and blood cell indices levels at wave1.
下载: 导出CSV
S6. Sex differences in association between longitudinal changes in vitamin D levels with changes in systemic inflammation indexes
Variables Males Females β 95% CI P value β 95% CI P value WBC −0.013 −0.039, 0.012 0.312 0.002 −0.033, 0.037 0.913 LC −0.013 −0.021, −0.004 0.003 −0.009 −0.021, 0.002 0.118 NC −0.004 −0.030, 0.022 0.740 0.024 −0.014, 0.062 0.209 RDW −0.001 −0.008, 0.006 0.820 0.003 −0.012, 0.019 0.671 PLT −0.907 −1.839, 0.026 0.057 0.272 −1.178, 1.722 0.713 MPV 0.015 0.004, 0.026 0.010 0.006 −0.009, 0.020 0.463 PLR 0.300 −0.281, 0.881 0.311 0.776 −0.106, 1.657 0.084 NLR 0.011 −0.003, 0.025 0.139 0.019 −0.003, 0.042 0.095 SII 1.156 −3.617, 5.928 0.635 6.904 −1.386, 15.193 0.102
下载: 导出CSV
-
[1] El-Sharkawy A, Malki A. Vitamin D signaling in inflammation and cancer: molecular mechanisms and therapeutic implications. Molecules, 2020; 25, 3219. [2] Filgueiras MS, Rocha NP, Novaes JF, et al. Vitamin D status, oxidative stress, and inflammation in children and adolescents: a systematic review. Crit Rev Food Sci Nutr, 2020; 60, 660–9. [3] Grégoire-Pelchat P, Alos N, Ribault V, et al. Vitamin D intake and status of children with sickle cell disease in Montreal, Canada. J Pediatr Hematol Oncol, 2018; 40, e531–6. [4] Zhou W, Mao S, Wu LX, et al. Association between Vitamin D status and sepsis. Clin Lab, 2018; 64, 451–60. [5] Wang GF, Yuan MY, Chang JJ, et al. Vitamin D and depressive symptoms in an early adolescent cohort. Psychol Med, 2023; 53, 5852-60. [6] Otero TMN, Monlezun DJ, Christopher KB, et al. Vitamin D status and elevated red cell distribution width in community-dwelling adults: results from the national health and nutrition examination survey 2001–2006. J Nutr Health Aging, 2017; 21, 1176–82. [7] Konuksever D, Yücel Karakaya SP, Bölük O, et al. The association of Vitamin D deficiency with hemogram-derived inflammatory biomarkers in children. Nutr Metab Cardiovasc Dis, 2022; 32, 2418–23. [8] Daniluk U, Filimoniuk A, Kowalczuk-Krystoń M, et al. Association of antioxidants and Vitamin D level with inflammation in children with atopic dermatitis. Int J Dermatol, 2019; 58, 1056–61. [9] Akbas EM, Gungor A, Ozcicek A, et al. Vitamin D and inflammation: evaluation with neutrophil-to-lymphocyte ratio and platelet-to-lymphocyte ratio. Arch Med Sci, 2016; 4, 721–7. [10] Dziedzic EA, Gąsior JS, Tuzimek A, et al. The association between serum Vitamin D concentration and new inflammatory biomarkers—Systemic Inflammatory Index (SII) and Systemic Inflammatory Response (SIRI)—in patients with ischemic heart disease. Nutrients, 2022; 14, 4212. -

 点击查看大图
计量
- 文章访问数: 360
- HTML全文浏览量: 156
- PDF下载量: 41
- 被引次数: 0

 Quick Links