

 下载:
下载:

-
Coronary heart disease (CHD) and type 2 diabetes (T2D) are two major chronic cardiometabolic disorders that frequently coexist as comorbid conditions[1]. Estimates suggest that approximately one-third of patients with CHD also have diabetes[2].
Among patients with T2D, poor glycemic control leads to the development of cardiovascular disease (CVD). However, current epidemiologic evidence on the effects of glycemic control largely focuses on the general population with diabetes[3], while relatively scant data exists regarding patients with T2D complicated by CHD. Moreover, contemporary guidelines for the management of T2D generally advocate for personalized glycemic control, tailored to individual patient characteristics including age, sex, diabetes duration, and the extent of comorbidity burden. However, a significant portion of these guidelines is based on expert consensus rather than robust evidence-based medicine[4], which may limit their direct applicability to patients with T2D and concomitant CHD. On the other hand, in CHD patients with long-standing diabetes, the benefits of glycemic targets are still unclear, particularly for subsequent myocardial infarction (MI) event[5]. Also, while patients with concurrent CHD and T2D frequently present with additional comorbidities[6], it is also unclear whether different comorbidities could amplify the excess risk of MI associated with poor glycemic control and longer diabetes duration among this patient population[7].
Using a large-scale health information database in Shenzhen, China, this study aimed to investigate the independent and joint associations of fasting plasma glucose (FPG), an indicator of glycemic control, and diabetes duration with the risk of subsequent MI among individuals with T2D and CHD. Furthermore, we explored whether these associations varied by age, sex, and comorbidities.
-
Data for this study were sourced from the Health Information Database of Shenzhen[8]. This Database collected medical and health-related information in Shenzhen, China, encompassing a wide range of healthcare facilities including hospitals, community health service centers, and public health institutions at all levels. In the present study, comprehensive medical records comprising inpatient information, disease diagnoses with corresponding International Classification of Diseases 10 (ICD-10) codes, prescription details, records of death registrations, and resident registration and health records were analyzed.
-
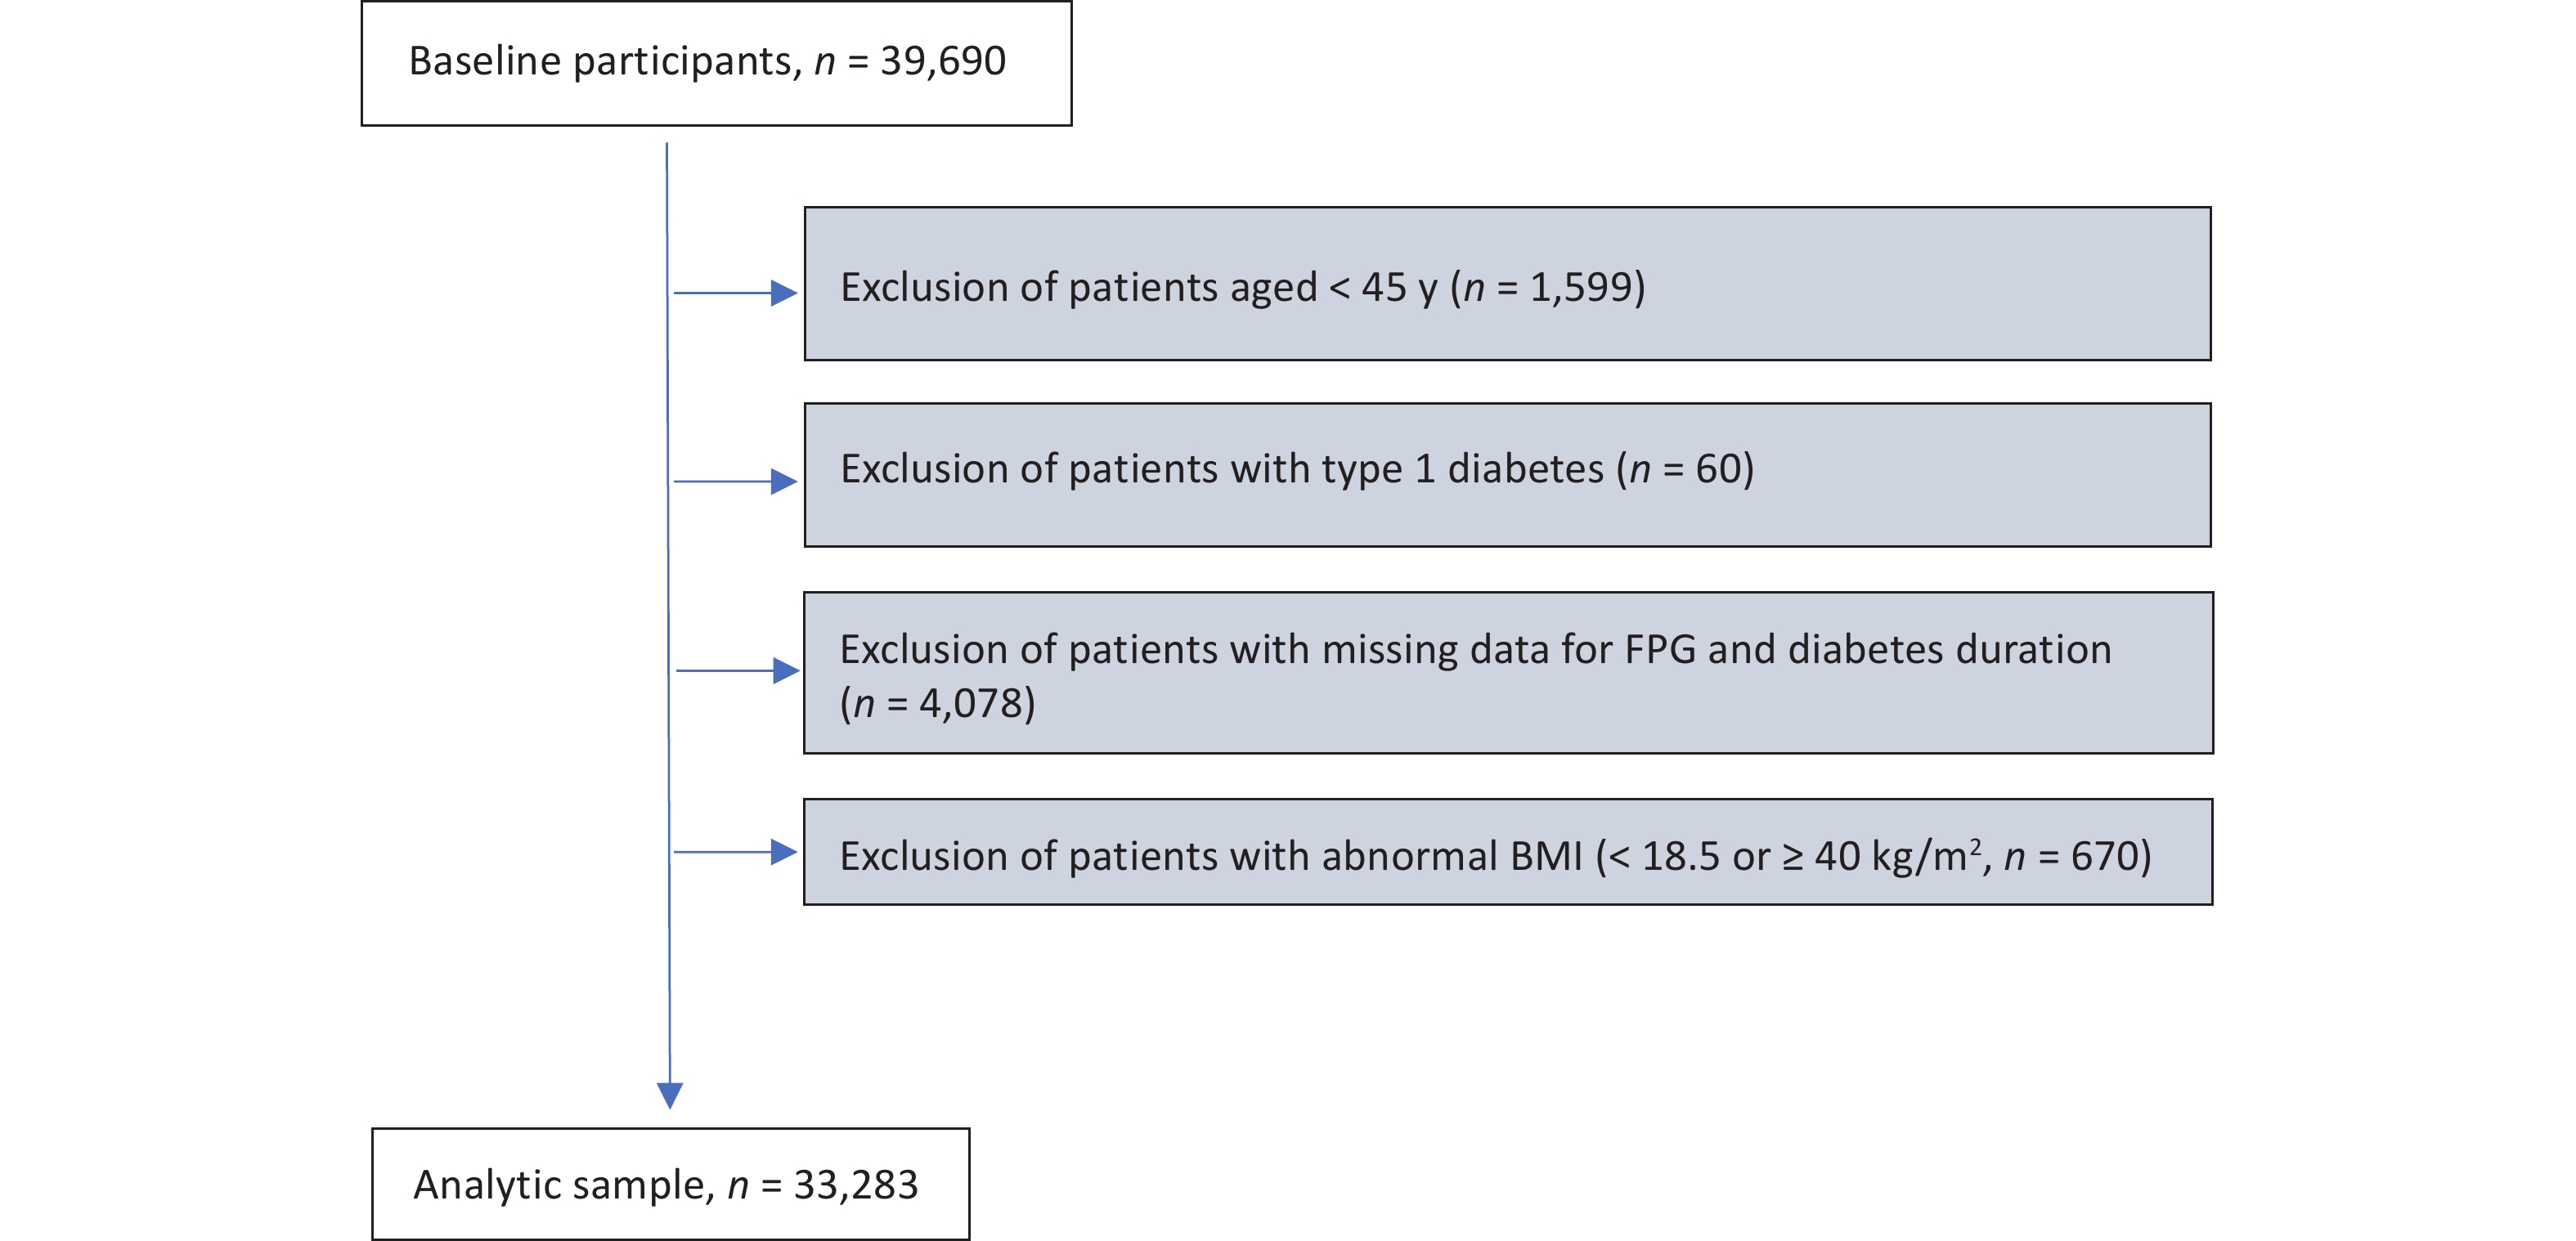
This study identified residents with CHD from hospital admission records and matched them with the latest records in the Diabetes Chronic Disease Management System, resulting in a cohort of 39,690 patients with CHD and concurrent diabetes. Subsequently, the target population was defined based on the following exclusion criteria: (1) excluding those under 45 years old (n = 1,599); (2) excluding patients labeled as "type 1 diabetes" in the Chronic Disease Management System (n = 60); (3) excluding individuals with missing FPG and diabetes duration information (n = 4,078); and (4) excluding individuals with abnormal values in continuous covariates, i.e., body mass index (BMI) < 18.5 or ≥ 40 kg/m2 (n = 670). After applying the exclusion criteria, the study identified an analytic sample of 33,283 individuals, who were patients with both CHD and T2D (Supplementary Figure S1, available in www.besjournal.com). This study adhered to the principles of the Helsinki Declaration and received approval from the ethical review committee of the Southern University of Science and Technology (Approval No. 20210067).
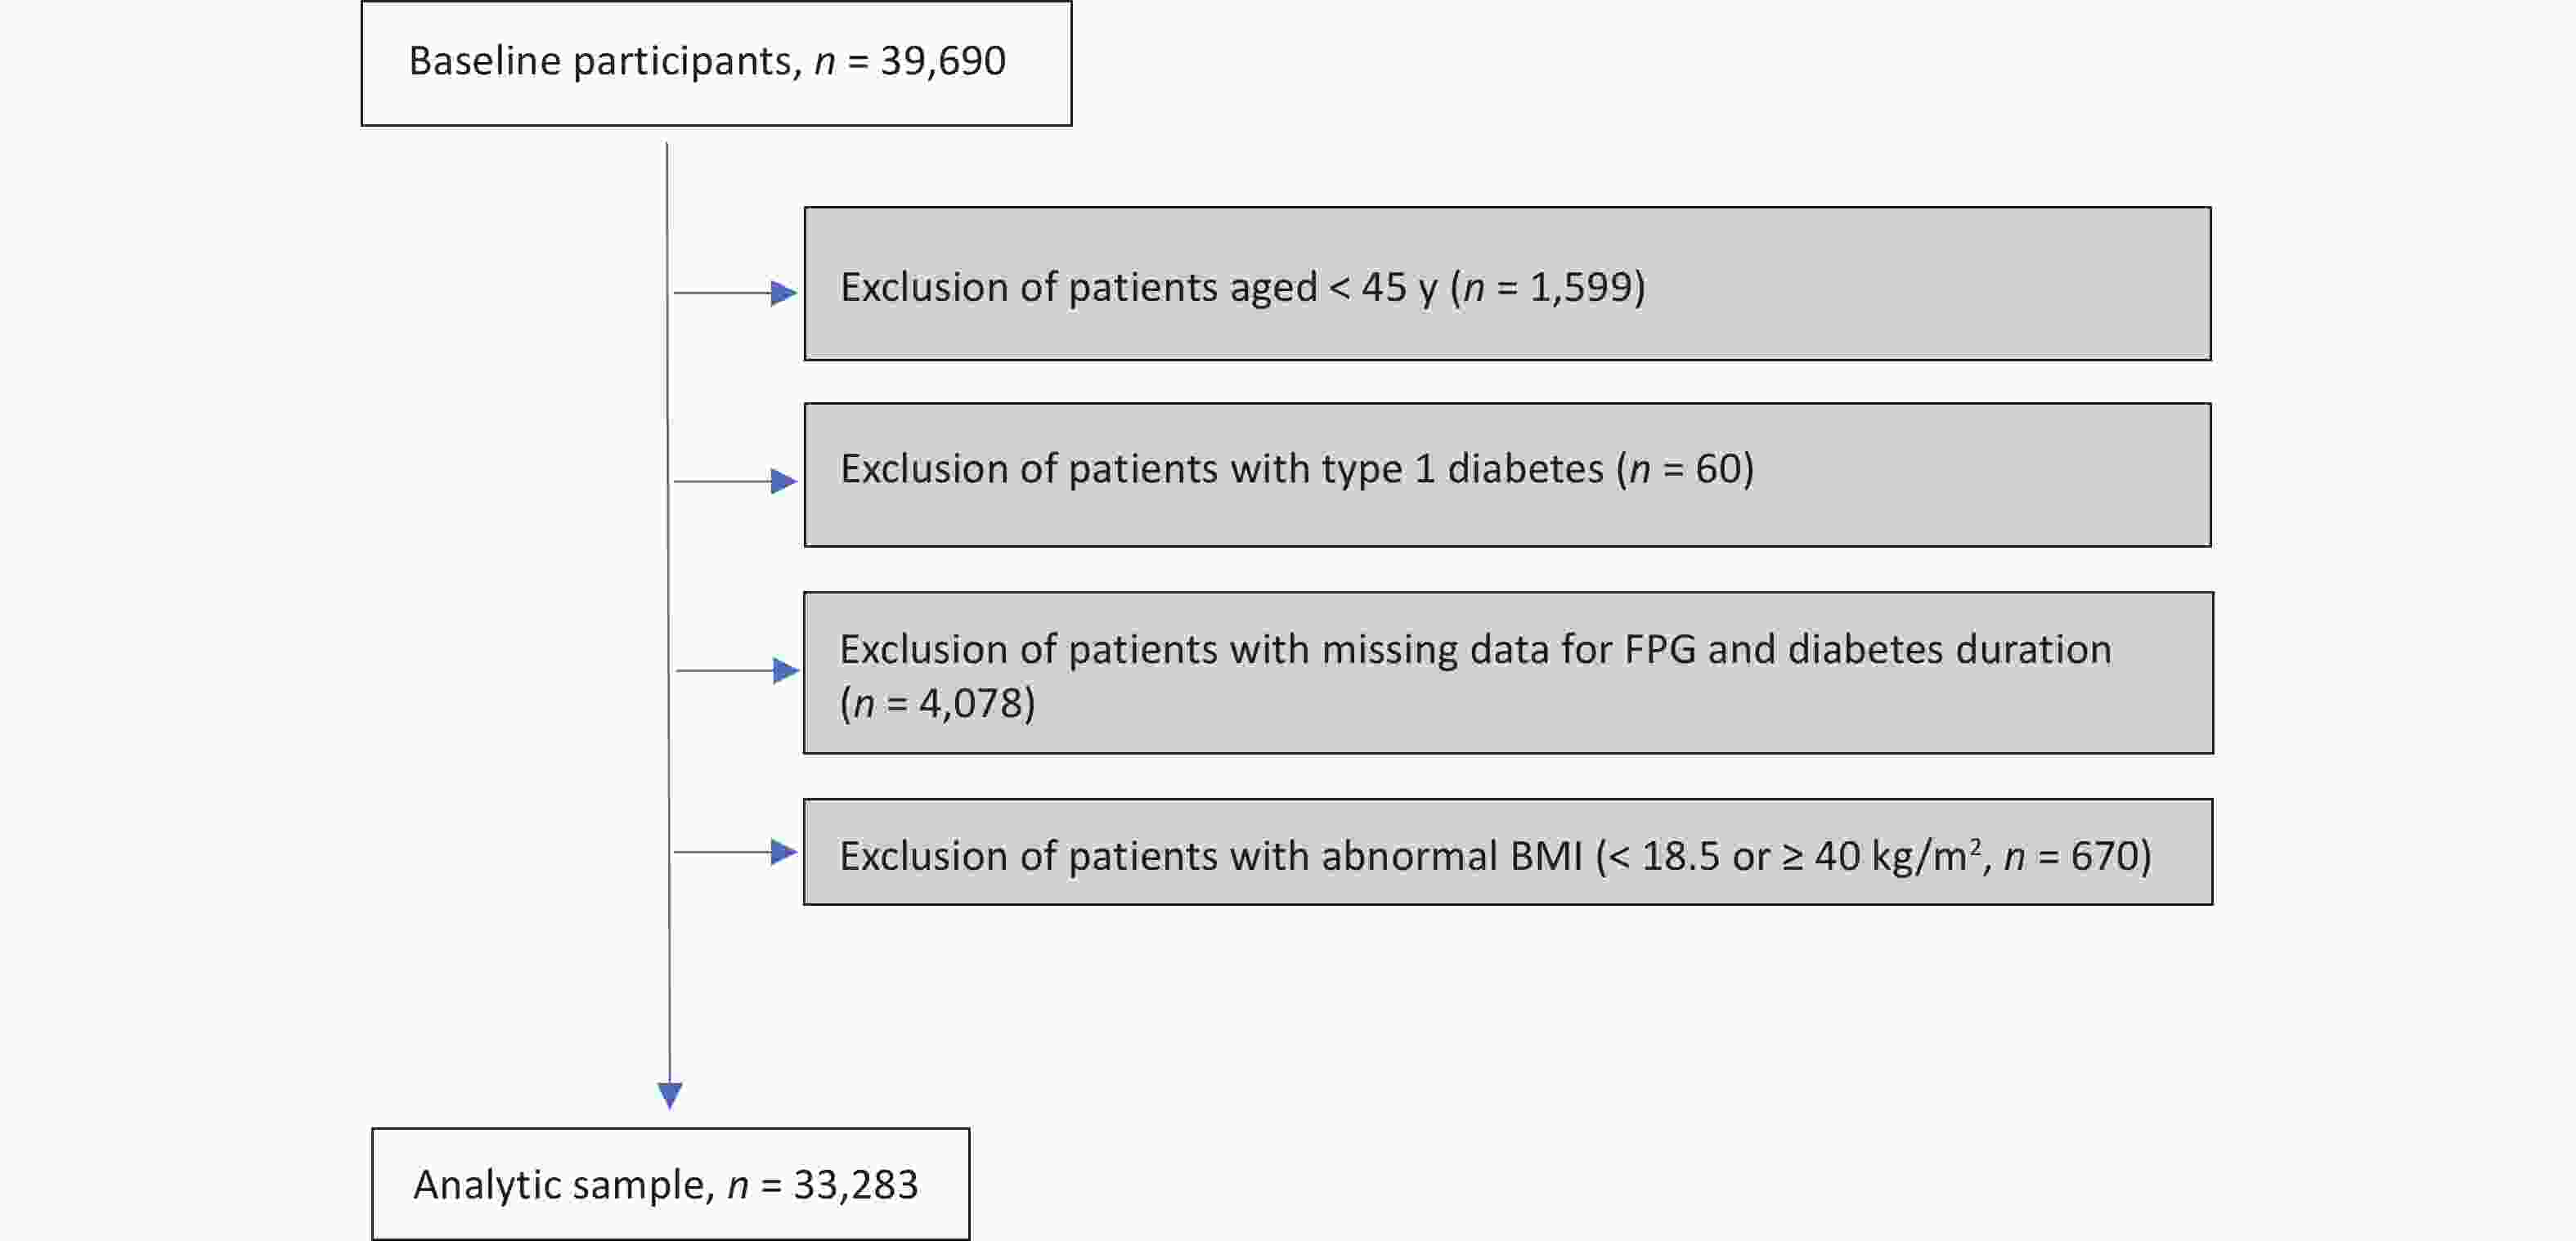
Figure S1. Flowchart of the study population selection.
-
The Diabetes Chronic Disease Management System in Shenzhen comprehensively records diabetes-related traits such as FPG for each patient undergoing diabetes management at community health service centers, along with demographic and lifestyle information. This study utilized the FPG data recorded in the database. Diabetes duration was calculated as the difference between the patient’s baseline age and the self-reported date of diabetes diagnosis.
-
Covariates included demographic information, anthropometric measurements, lifestyle factors, and other clinical characteristics. Specifically, demographic and anthropometric measurements included age, sex, marital status (married, divorced, widowed, and single), education level (junior high school and below, high school or vocational school, and college and above), and BMI. Lifestyles included alcohol consumption (non-drinker, > 0 but ≤ 100 g/day, 101–250 g/day, and > 250 g/day), physical activity in leisure time (no physical activity, 1–2 times/week, 3–4 times/week, and 5–7 times/week), and smoking (non-smoker, 1–10 cigarettes/day, 11–20 cigarettes/day, and > 20 cigarettes/day). Additionally, other clinical characteristics included diabetes medication adherence (complete adherence, irregular adherence, and no use of hypoglycemic drugs) and comorbidities identified using ICD-10 codes during hospitalization (atrial fibrillation, chronic kidney disease, chronic respiratory disease, hypertension, and inflammatory arthropathies). With the exception of comorbidities, which were identified using ICD-10 codes during hospitalization, most of the variables were derived from self-reported data collected during patient visits to community health centers. Community doctors, who were professionally trained, conducted the assessments following standardized protocols to ensure the reliability and validity of the data. Patients were provided with clear instructions and support on how to accurately report their lifestyles. Periodic audits were conducted to check for consistency and accuracy in the recorded data.
-
The outcomes of this study are MI requiring hospitalization and revascularization procedures as well as death due to MI. Specifically, MI hospitalization and death events are identified through subsequent hospitalization and death records based on ICD-10 codes (I21, I22, I23, I24.1, and I25.2) and procedure codes (36.06, 36.07, and 36.1). Person-years were calculated from the date of baseline to the date of first subsequent MI event, death, or the end of follow-up (1 Oct 2023), whichever came first.
-
Glycemic control was defined by the FPG levels. We categorized FPG into three groups mainly based on clinical guidelines and relevance[9,10]: < 6.1 mmol/L (well controlled), 6.1–8.0 mmol/L (under controlled), and > 8.0 mmol/L (poorly controlled). The grouping strategy was to ensure that each group retained a sufficient sample size for robust statistical analysis. Moreover, the study population was stratified into two groups based on the diabetes duration: < 10 y and ≥ 10 y. Additionally, we also classified the study population into 6 groups according to FPG (< 6.1 mmol/L, 6.1–8.0 mmol/L, and > 8.0 mmol/L) and diabetes duration (< 10 y and ≥ 10 y). The baseline characteristics are presented as medians (interquartile ranges) for continuous variables, and categorical variables are described as percentages. Between-group comparisons were performed using Mann-Whitney U test or Kruskal-Wallis test for comparing continuous variables, and the chi-square test for categorical variables, where appropriate. There were no missing data for the continuous variables, while missing values accounted for ≤ 1.5% of all the categorical covariates. For missing values for categorical variables, an additional category for missing values was created for imputation.
We employed Cox proportional hazards regression models, adjusting for multiple covariates, to estimate hazard ratios (HRs) and their corresponding 95% confidence intervals (CIs) for MI risk among individuals stratified by FPG level and/or diabetes duration. We conducted a test for the proportional hazards assumption and found no evidence of violation of this assumption. Three adjusted models were employed. Model 1 was adjusted for socioeconomic and demographic factors, including age, sex, marital status, and education level. Model 2 was further adjusted for BMI and a range of lifestyle factors, including alcohol consumption, physical activity, and smoking. Model 3 was additionally adjusted for relevant clinical factors, including diabetes medication compliance, atrial fibrillation, chronic respiratory disease, chronic kidney disease, hypertension, and inflammatory arthropathy, based on adjustments in model 2. The incidence rates were calculated by dividing the number of events by 100 person-years. To elucidate the dose-response relationship between FPG, diabetes duration, and MI, we employed Cox models with penalized cubic splines (PCS) with 3 degrees of freedom[11].
We also explored the associations of FPG and/or diabetes duration with risk of MI, stratifying by age (< 65 y or ≥ 65 y), sex, and comorbidities. Unlike other comorbidities, hypertension lacks specific organ pathology. Hence, this study does not stratify hypertension to explore interaction effects. Potential interactions were tested by adding a multiplicative term to the Cox models. To test the robustness of the joint association, we also conducted additional analyses by excluding patients who experienced MI during the first year of follow-up or excluding those with missing data on covariates. To further understand potential additional risk factors, we also explored the associations between all covariates and the risk of subsequent MI.
-
Among 33,283 patients with CHD and concurrent T2D, 33.8% had been diagnosed with T2D for more than 10 years, with higher FPG levels, older age, and heavier comorbidity burden (except for inflammatory arthropathies). On the other hand, 14.3% of the study patients had a baseline FPG level of > 8.0 mmol/L, and these individuals were more likely to be women, smokers, less educated, less physically active, poorer diabetes medication adherence, had chronic kidney disease, and longer diabetes durations (Supptementary Table S1, available in www.besjournal.com). Compared with patients with best glycemic control (FPG < 6.1 mmol/L) and shorter diabetes duration (< 10 y), those with worst glycemic control (FPG > 8.0 mmol/L) and longer diabetes duration (≥ 10 y) tended to be older, women, less educated, had chronic kidney disease, but showed better compliance with diabetes medications (Table 1).
Table 1. Baseline characteristics among diabetic individuals with coronary heart disease (CHD) according to joint group of fasting plasma glucose (FPG) and diabetes duration in Shenzhen, China
Characteristics Diabetes duration < 10 y, mmol/L Diabetes duration ≥ 10 y, mmol/L P value < 6.1 6.1−8.0 > 8.0 < 6.1 6.1−8.0 > 8.0 FPG, mmol/L 5.7 (0.6) 6.7 (0.5) 9.2 (2.3) 5.7 (0.6) 6.7 (0.5) 9.5 (2.4) < 0.001 Diabetes duration, y 3.0 (4.7) 3.2 (4.9) 3.5 (5.1) 14.6 (8.4) 14.5 (8.4) 14.9 (8.4) < 0.001 Age, y 63 (15) 65 (14) 65 (15) 69 (13) 69 (13) 69 (13) < 0.001 Women 34.1% 37.6% 38.5% 41.8% 42.1% 48.5% < 0.001 Married 96.8% 96.6% 96.1% 95.8% 95.6% 95.8% < 0.001 Junior high school and below 46.3% 50.3% 60.3% 43.9% 46.2% 59.0% < 0.001 BMI, kg/m2 24.4 (3.9) 24.7 (4.1) 24.8 (4.2) 23.7 (3.5) 24.0 (3.7) 24.3 (4.2) < 0.001 No alcohol drinking 92.2% 91.3% 89.1% 93.3% 91.6% 90.5% < 0.001 No exercise 21.1% 24.1% 31.3% 19.9% 21.8% 28.7% < 0.001 No smoking 86.3% 84.9% 80.7% 91.0% 88.6% 87.2% < 0.001 Good diabetes drug compliance 90.3% 89.8% 84.5% 93.9% 96.0% 92.2% < 0.001 Atrial fibrillation 6.0% 5.7% 6.0% 7.6% 6.8% 6.0% 0.002 Chronic kidney disease 9.1% 8.6% 10.1% 18.3% 17.7% 20.3% < 0.001 Chronic respiratory disease 9.9% 10.3% 10.5% 12.4% 11.5% 10.4% 0.003 Hypertension 78.4% 79.8% 78.6% 80.5% 80.7% 80.7% 0.011 Inflammatory arthropathies 6.0% 5.4% 5.2% 5.2% 5.6% 4.7% 0.275 Note. Continuous variables are described as medians (interquartile ranges), and categorical variables are described as percentages. BMI, body mass index; FPG, fasting plasma glucose. Table S1. Baseline characteristics among diabetic individuals with coronary heart disease (CHD) according to fasting plasma glucose (FPG) and diabetes duration in Shenzhen, China
Characteristics FPG P value Diabetes duration P value < 6.1 mmol/L 6.1−8 mmol/L > 8 mmol/L < 10 y ≥ 10 y FPG, mmol/L 5.7 (0.6) 6.7 (0.5) 9.3 (2.3) < 0.001 6.5 (1) 6.7 (1.3) < 0.001 Diabetes duration, year 5.2 (9) 6 (9.4) 7.6 (10.6) < 0.001 3.2 (4.9) 14.6 (8.4) < 0.001 Age, y 65 (14) 66 (15) 66 (14) < 0.001 64 (15) 69 (13) < 0.001 Women 36.4% 39.1% 42.6% < 0.001 36.8% 43.2% Married 96.5% 96.2% 95.9% 0.434 96.6% 95.7% Education level < 0.001 Junior high school and below 45.6% 48.9% 59.8% 50.6% 47.9% College degree or above 23.7% 20.9% 13.9% 19.6% 22.5% High school/Vocational school 30.7% 30.2% 26.3% 29.8% 29.5% BMI, kg/m2 24.1 (3.8) 24.4 (4.0) 24.6 (4.2) < 0.001 24.6 (4.0) 23.9 (3.8) < 0.001 Drinking status < 0.001 0.030 No alcohol drinking 92.6% 91.4% 89.7% 91.3% 91.8% 0−100 g/day 5.6% 6.7% 8.0% 6.6% 6.6% 101−250 g/day 1.2% 1.4% 1.6% 1.5% 1.1% > 250 g/day 0.2% 0.2% 0.3% 0.2% 0.2% Exercise < 0.001 < 0.001 No exercise 20.7% 23.4% 30.2% 24.3% 22.6% 1−2 times/week 10.1% 9.7% 9.9% 21.3% 21.4% 3−4 times/week 23.4% 21.7% 16.0% 21.3% 21.4% 5−7 times/week 45.5% 44.9% 43.5% 44.1% 46.3% Smoking status, % < 0.001 < 0.001 No smoking 87.7% 86.1% 83.4% 84.7% 88.8% 1−10 cigarettes/day 6.0% 5.8% 6.4% 6.4% 5.1% 11−20 cigarettes/day 4.9% 6.3% 7.8% 7.0% 4.6% > 20 cigarettes/day 1.1% 1.5% 2.0% 1.6% 1.2% Diabetes drug compliance < 0.001 < 0.001 Good 91.4% 91.9% 87.7% 89.2% 94.9% Fair 1.8% 2.6% 6.4% 3.4% 2.1% Poor 5.4% 4.7% 5.2% 6.2% 2.4% Atrial fibrillation 6.4% 6.1% 6.0% 0.487 5.8% 6.8% < 0.001 Chronic kidney disease 11.9% 11.7% 14.3% < 0.001 8.9% 18.3% < 0.001 Chronic respiratory disease 10.7% 10.7% 10.5% 0.884 10.3% 11.5% < 0.001 Hypertension 79.0% 80.1% 79.5% 0.094 79.3% 80.7% 0.003 Inflammatory arthropathies 5.7% 5.5% 5.0% 0.183 5.5% 5.4% 0.594 Note. Continuous variables are described as medians (interquartile ranges), and categorical variables are described as percentages. BMI, body mass index; FPG, fasting plasma glucose. -
During a median follow-up of 2.4 y (interquartile range, 1.2–3.7 y), 2,110 patients experienced MI, and the incidence rates (IRs) of the patients with FPG < 6.1 mmol/L, 6.1–8.0 mmol/L, and > 8.0 mmol/L were 2.29, 2.46, 2.85 per 100 person-years, respectively. Additionally, the IRs of patients with diabetes duration < 10 y and ≥ 10 y were 2.22, and 2.96 per 100 person-years, respectively. After adjusting for all predefined covariates (model 3), we found that each 1 mmol/L increase in FPG levels was associated with a 5% (fully-adjusted HR: 1.05, 95% CI: 1.03, 1.07) higher risk of MI. Compared with the patients with FPG < 6.1 mmol/L, patients with FPG between 6.1 to 8.0 mmol/L, and FPG > 8.0 mmol/L were significant associated with higher risks of subsequent MI, with fully-adjusted HRs (95% CI) of 1.25 (1.12, 1.38), and 1.46 (1.26, 1.69), respectively. Longer duration of diabetes was also associated with MI risk, with a fully-adjusted HR (95% CI) of 1.11 (1.08, 1.15) per 5-year extension of diabetes duration. Compared with patients with diabetes duration < 10 y, those with diabetes duration of ≥ 10 y had a 32% (fully-adjusted HR: 1.32, 95% CI: 1.21, 1.45) higher risk of MI (Table 2).
Table 2. HRs and CIs for the association of FPG and diabetes duration with risk of MI among diabetic individuals with CHD in Shenzhen, China
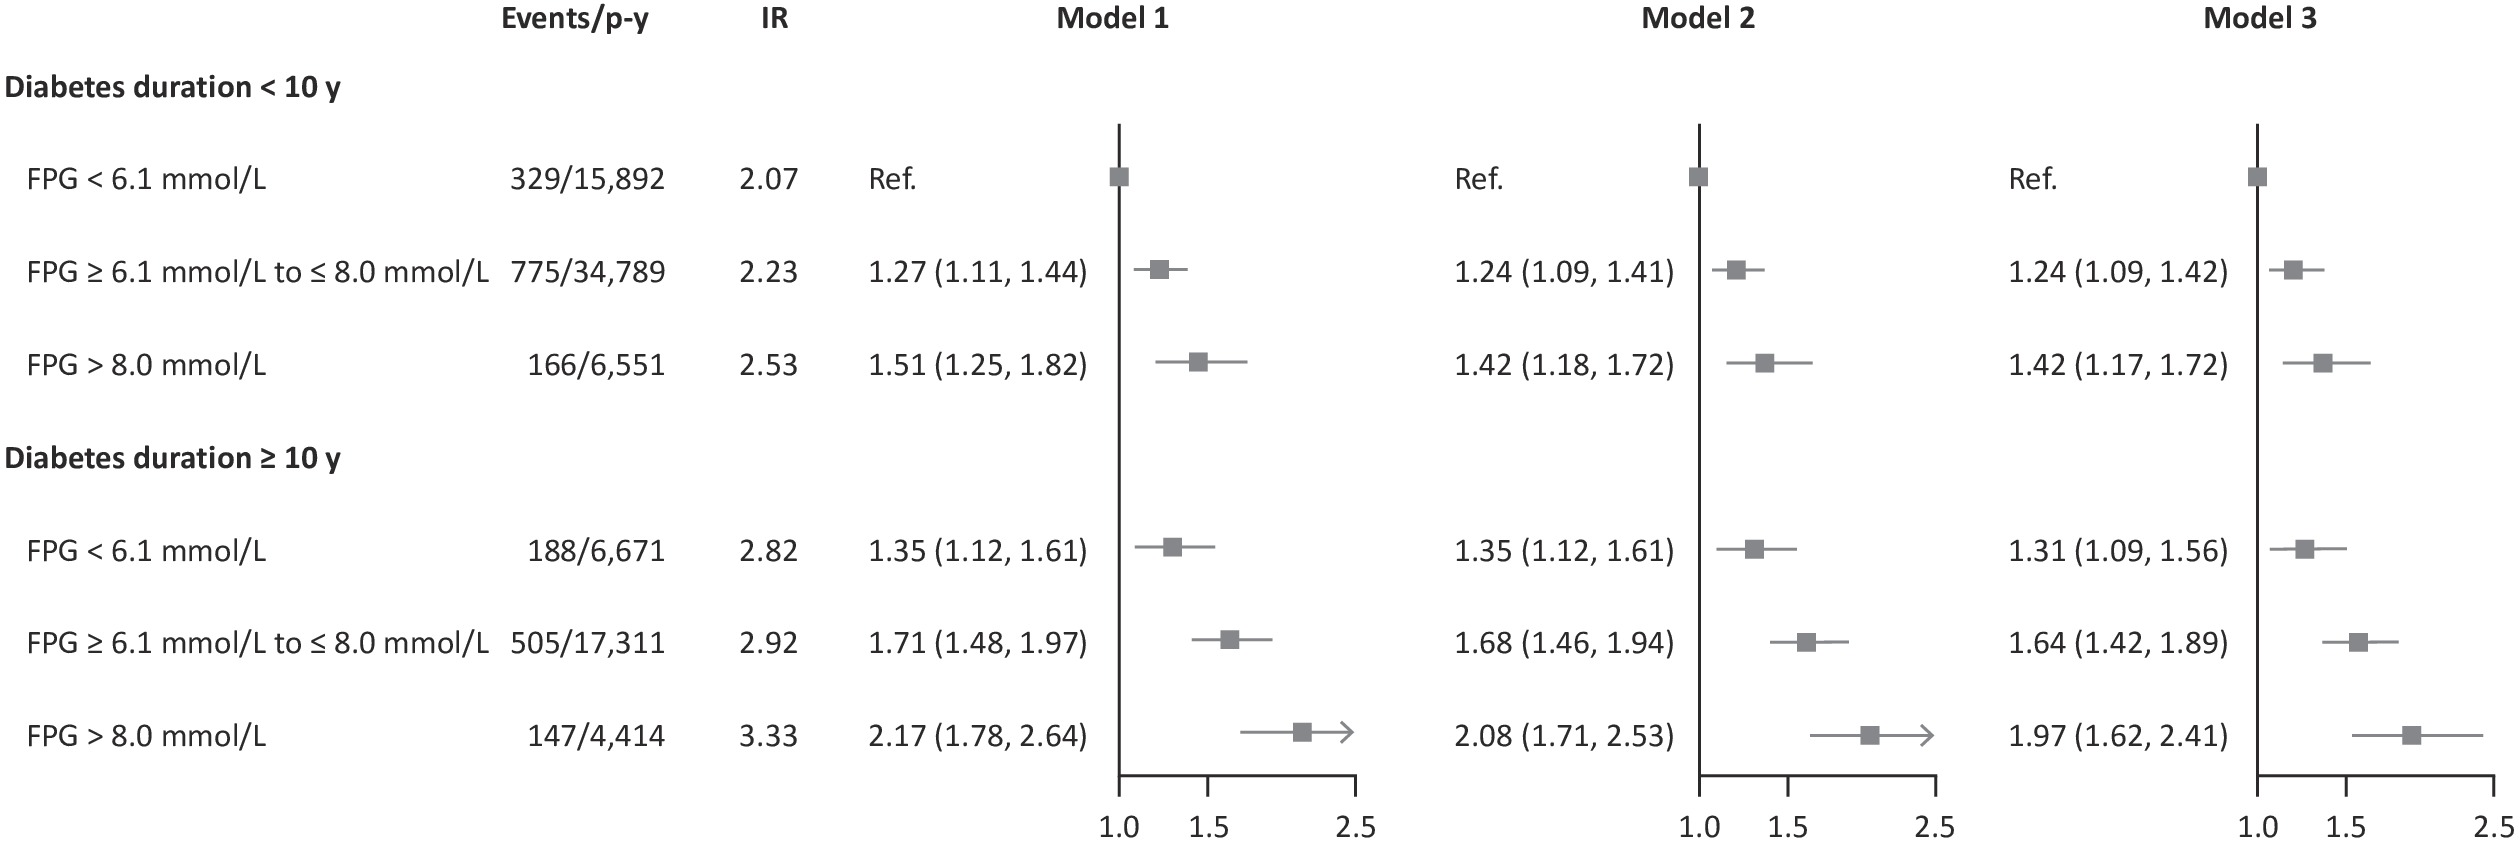
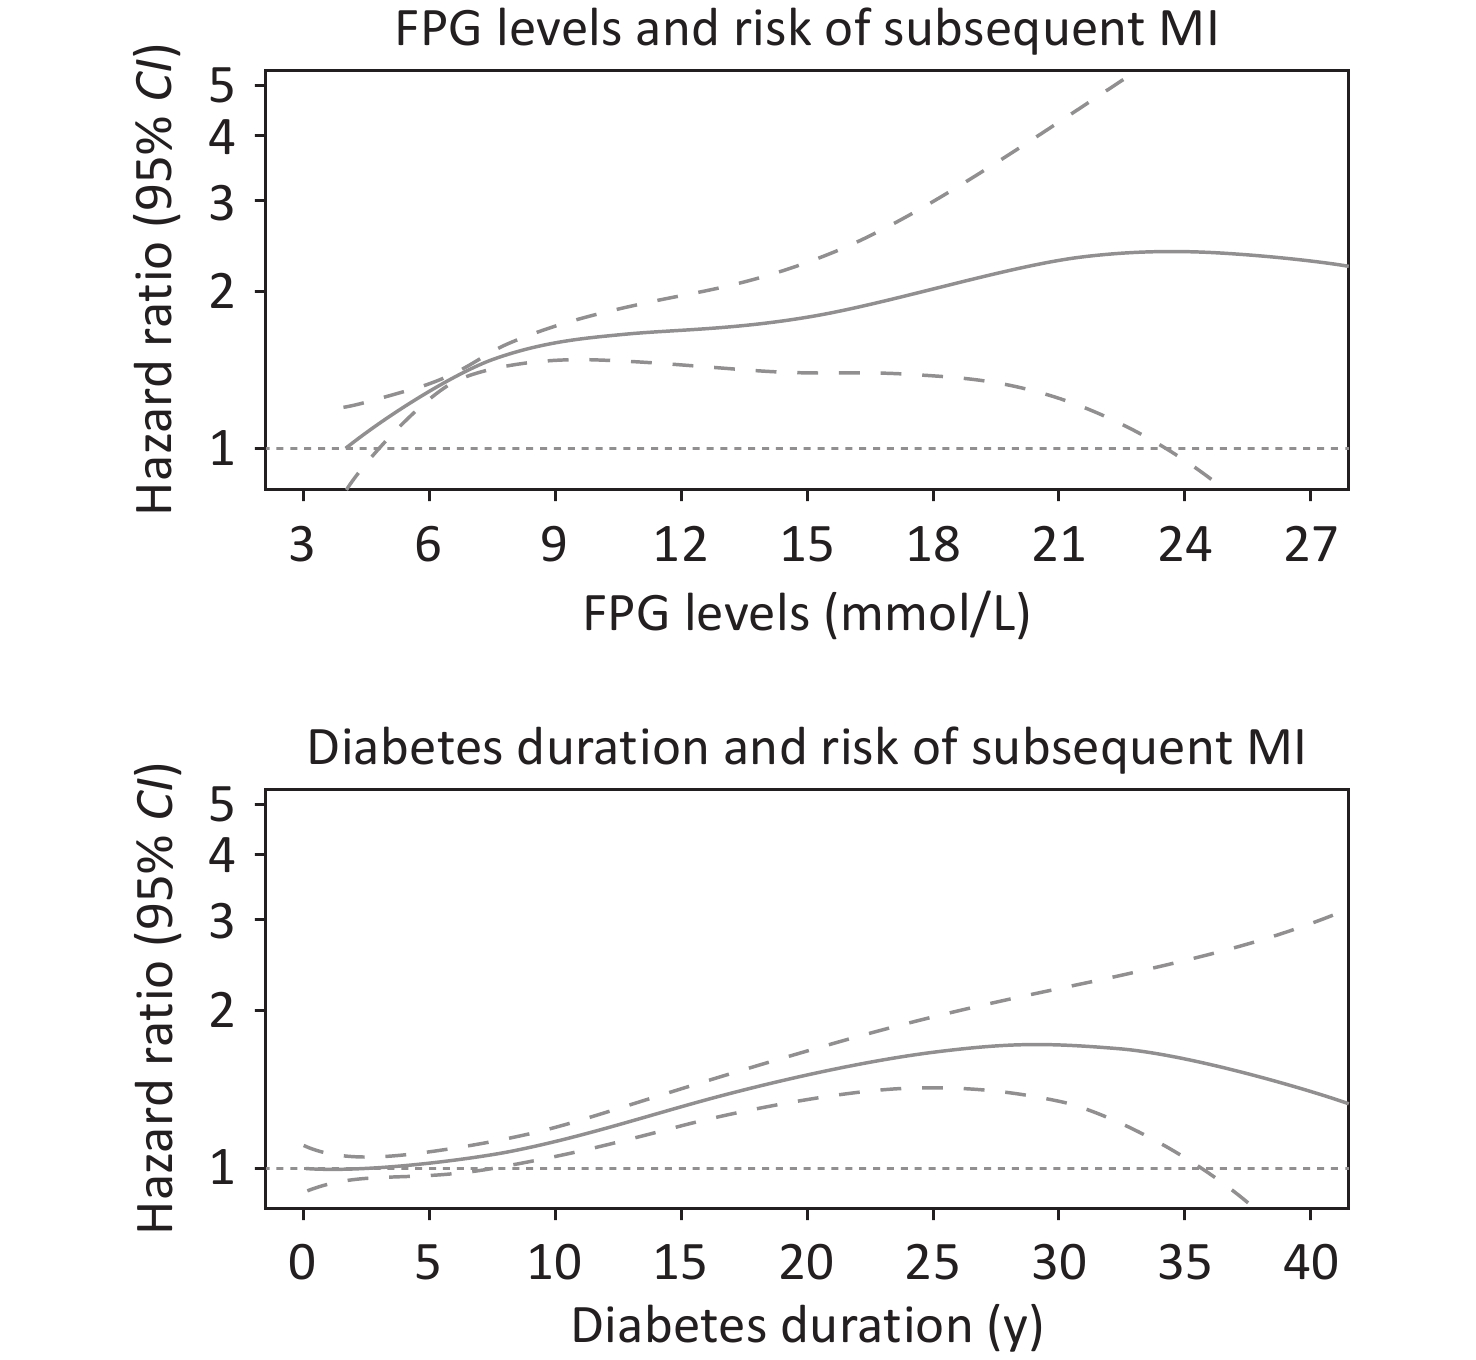
Variables FPG (mmol/L) Diabetes duration < 6.1 6.1−8.0 > 8.0 per 1 < 10 y ≥ 10 y per 5 y Events/person−years 517/22,563 1,280/52,100 313/10,965 − 1,270/57,233 840/28,395 − Incidence rate 2.29 2.46 2.85 − 2.22 2.96 − Model 1 Ref. 1.27 (1.14, 1.41) 1.55 (1.35, 1.79) 1.06 (1.04, 1.08) Ref. 1.36 (1.24, 1.49) 1.12 (1.09, 1.16) Model 2 Ref. 1.24 (1.12, 1.38) 1.47 (1.28, 1.70) 1.05 (1.03, 1.08) Ref. 1.37 (1.25, 1.50) 1.13 (1.09, 1.16) Model 3 Ref. 1.25 (1.12, 1.38) 1.46 (1.26, 1.69) 1.05 (1.03, 1.07) Ref. 1.32 (1.21, 1.45) 1.11 (1.08, 1.15) Note. Model 1 was adjusted for age, sex, marital status, and education level; Model 2 was adjusted for variables in the model 1 plus BMI and lifestyle factors, including, drinking status, physical activity, and smoking status; Model 3 was adjusted for variables in the model 2 plus clinical conditions, including diabetes medication compliance, atrial fibrillation, chronic respiratory disease, chronic kidney disease, hypertension, and inflammatory arthropathy. FPG and diabetes duration was mutually adjusted for each other. The unit for measuring the incidence rate is 100 person−years. FPG, fasting plasma glucose; CHD, coronary heart disease. HRs, hazard ratios; CIs, confidence intervals; MI, myocardial infarction. There were no significant interactions between FPG and diabetes duration (P for interaction = 0.968). When the influence of FPG and diabetes duration on MI was jointly considered, we found that those with worst glycemic control (FGP > 8.0 mmol/L) and longer diabetes duration (≥ 10 y) had the highest risk of experiencing MI event during follow-up (Figure 1). As compared with best glycemic control (FGP < 6.1 mmol/L) and shorter diabetes duration (< 10 y), the fully-adjusted HRs (95% CIs) were 1.31 (1.09, 1.56), 1.64 (1.42, 1.89), and 1.97 (1.62, 2.41), respectively, for combination of diabetes duration of ≥ 10 y and FPG levels of < 6.1 mmol/L (IR: 2.82), 6.1–8.0 mmol/L (IR: 2.92), and > 8.0 mmol/L (IR: 3.33), respectively. The spline graphs showed that the associations of FPG and diabetes duration with subsequent MI were nearly linear (Figure 2) (both P for linear < 0.001).
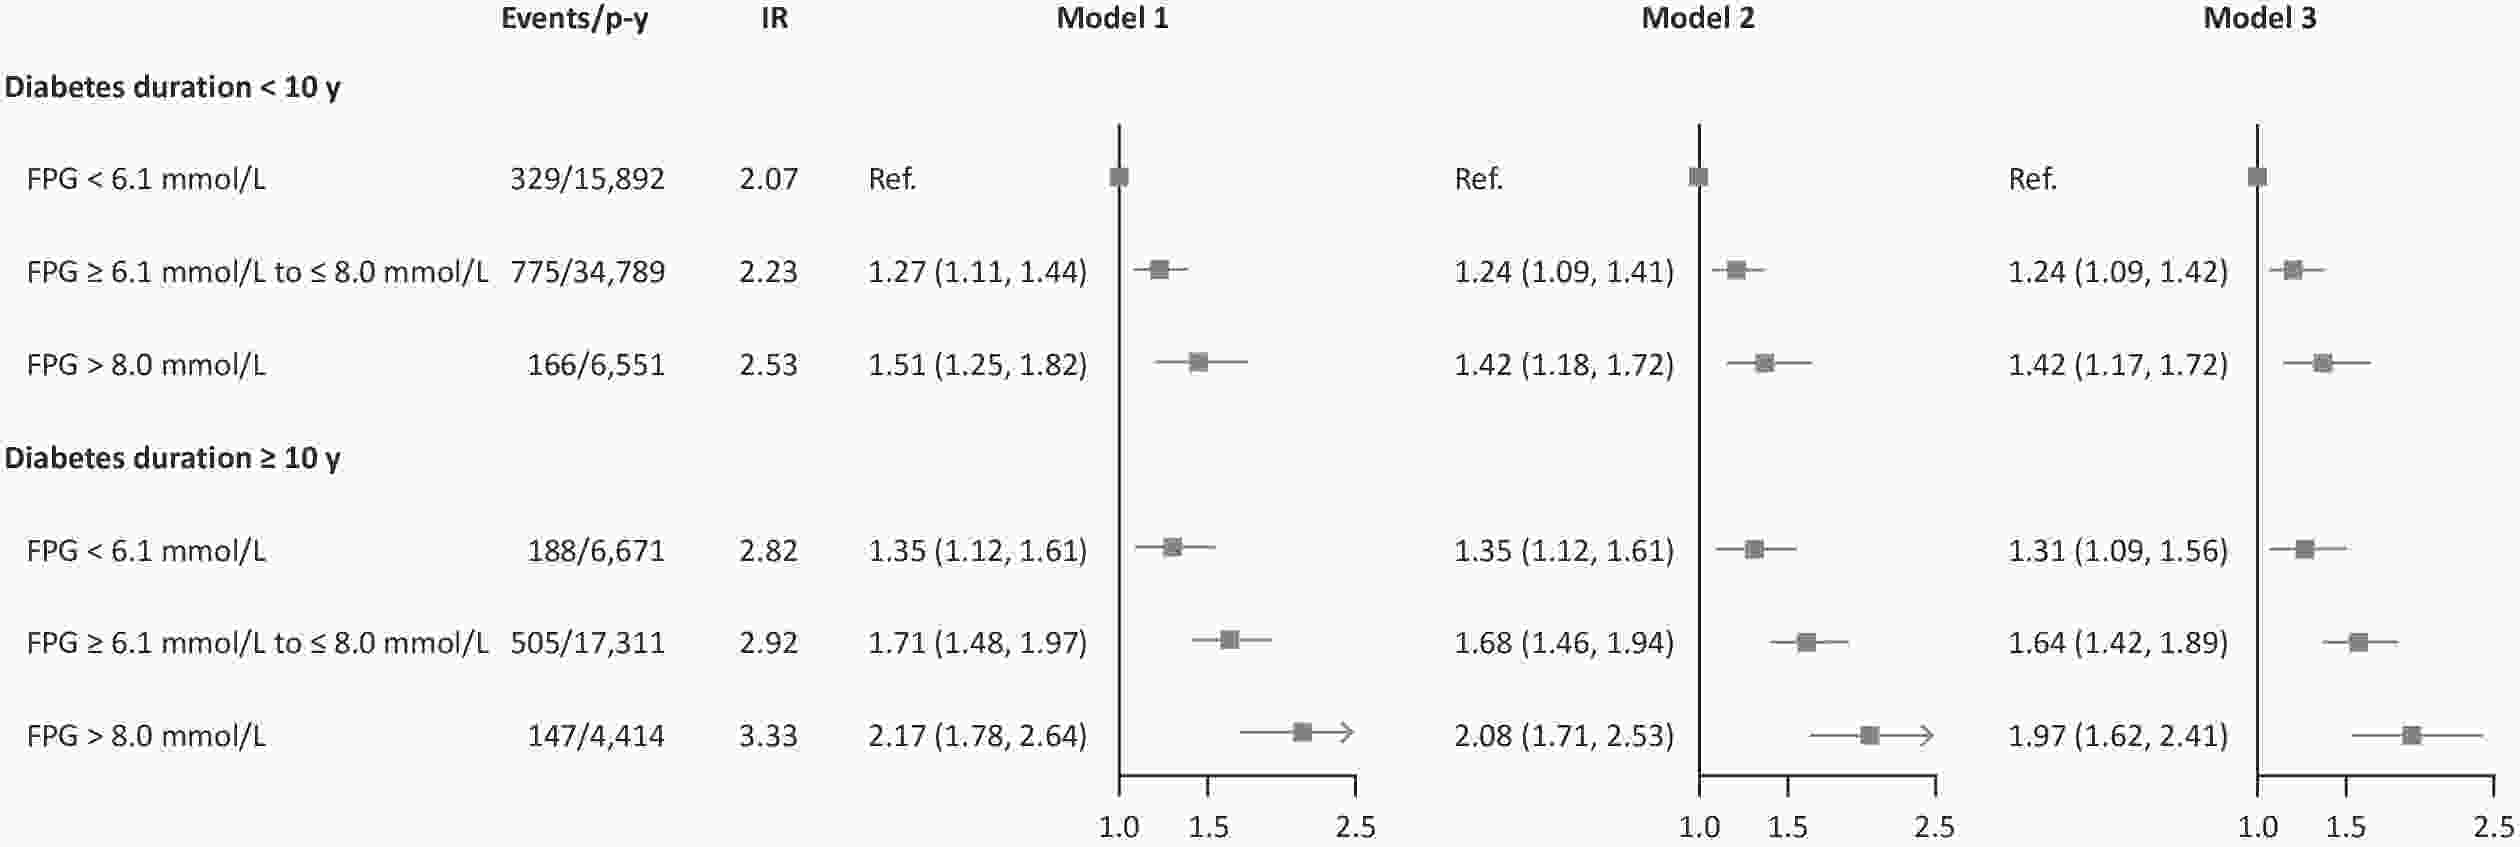
Figure 1. HRs and CIs for the joint association of FPG and diabetes duration with risk of MI among diabetic patients with CHD in Shenzhen, China. Model 1 was adjusted for age, sex, marital status, and education level; Model 2 was adjusted for variables in the model 1 plus BMI and lifestyle factors, including drinking status, physical activity, and smoking status; Model 3 was adjusted for variables in the model 2 plus clinical conditions, including diabetes medication compliance, atrial fibrillation, chronic respiratory disease, chronic kidney disease, hypertension, and inflammatory arthropathy. P for interaction = 0.968. The unit for measuring the incidence rate is 100 person-years. FPG, fasting plasma glucose; CHD, coronary heart disease. HRs, hazard ratios; CIs, confidence intervals; MI, myocardial infarction; IR, incidence rate; P-y, person-year.
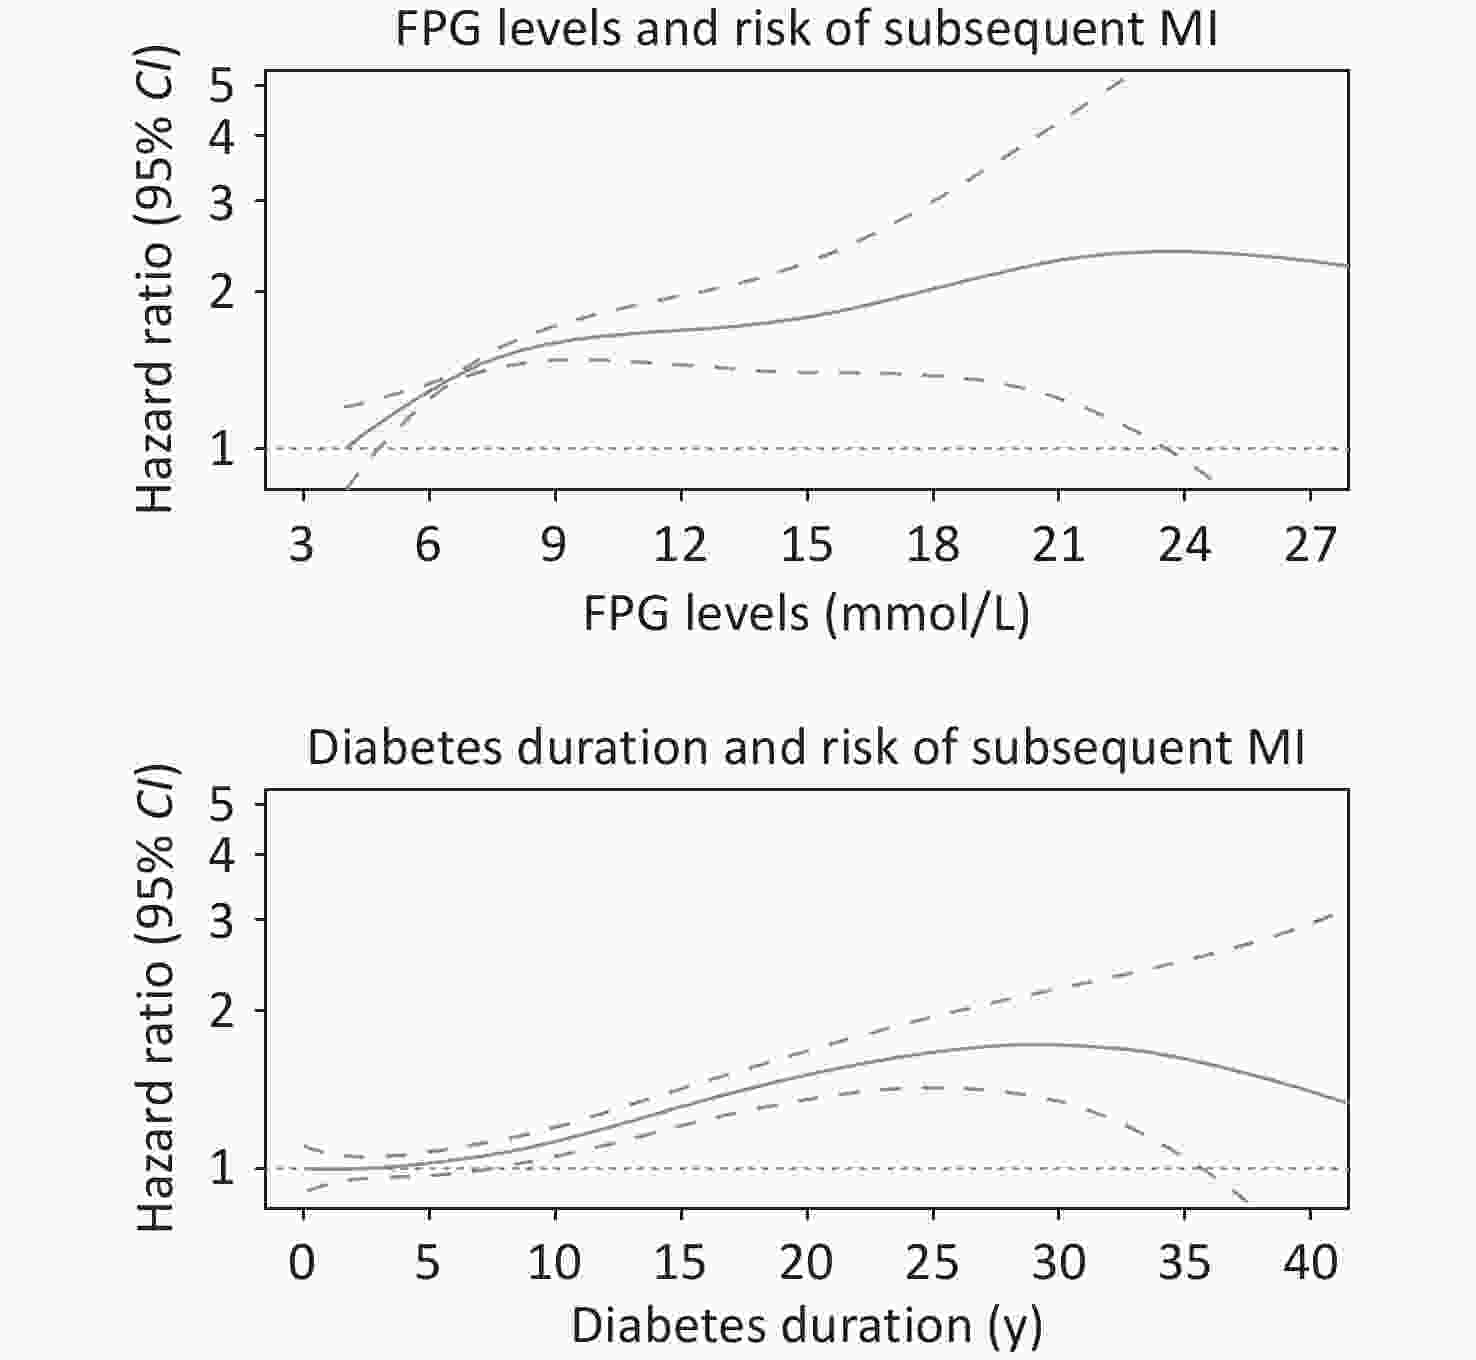
Figure 2. Associations of FPG and diabetes duration with risk of subsequent MI from the Cox regression using penalized cubic splines. FPG levels and Diabetes duration were fitted as a smooth term using a penalized cubic spline with 3 degrees of freedom. The solid lines indicated the HRs, the dashes lines indicated 95% CIs. Multifactorial adjustments were made for age, sex, marital status, education level, BMI, drinking status, physical activity, smoking status, atrial fibrillation, chronic respiratory disease, chronic kidney disease, hypertension, and inflammatory arthropathy. FPG and diabetes duration were mutually adjusted for each other. FPG, fasting plasma glucose; CHD, coronary heart disease; HRs, hazard ratios; CIs, confidence intervals; MI, myocardial infarction; BMI, body mass index.
-
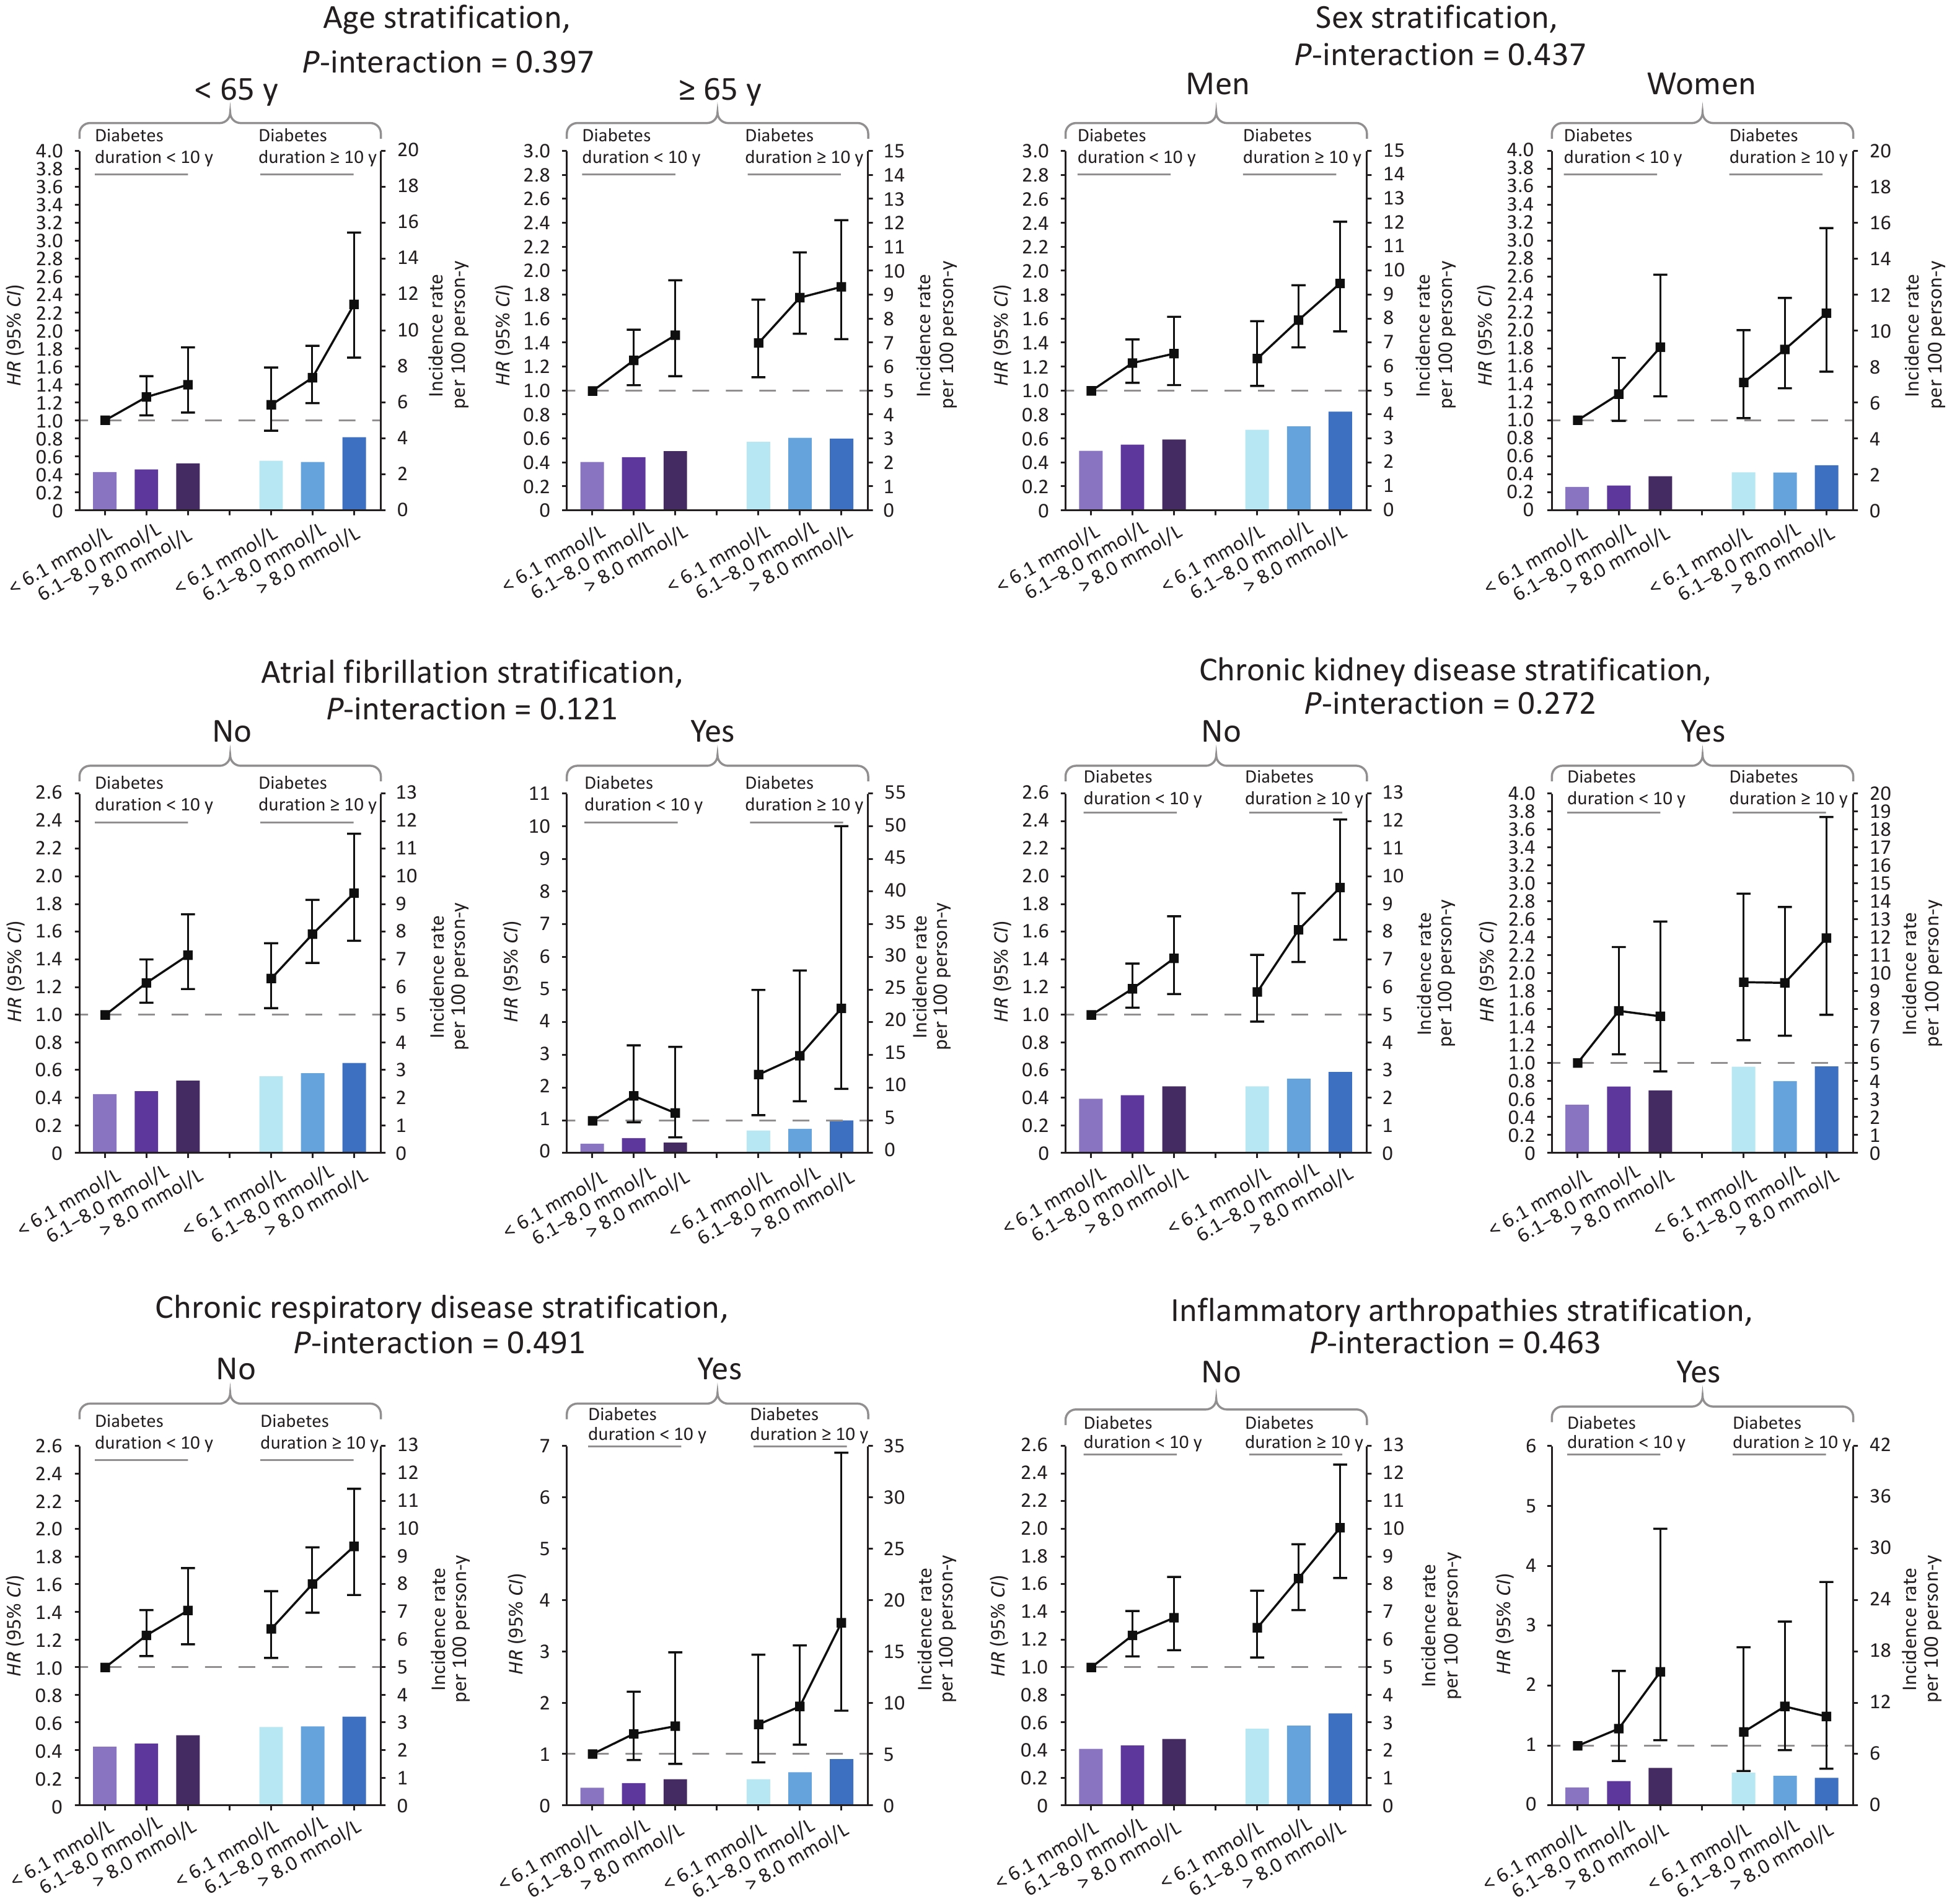
Subgroup analyses stratified by age, sex and comorbidities were performed to explore potential interactions. Overall, age and sex did not modify the associations of FPG or diabetes duration with MI risk. As for the comorbidities, we found that the existence of atrial fibrillation exacerbated the adverse effects of diabetes duration (P for interaction = 0.008) on subsequent MI (Supplementary Tables S2–S5, available in www.besjournal.com). We also analyzed the interactions of age, sex, and comorbidities on the joint associations between FPG and diabetes duration and MI risk, and no interactions were found (all P for interactions > 0.120, Figure 3 and Supplemental Tables S6–S7, available in www.besjournal.com).
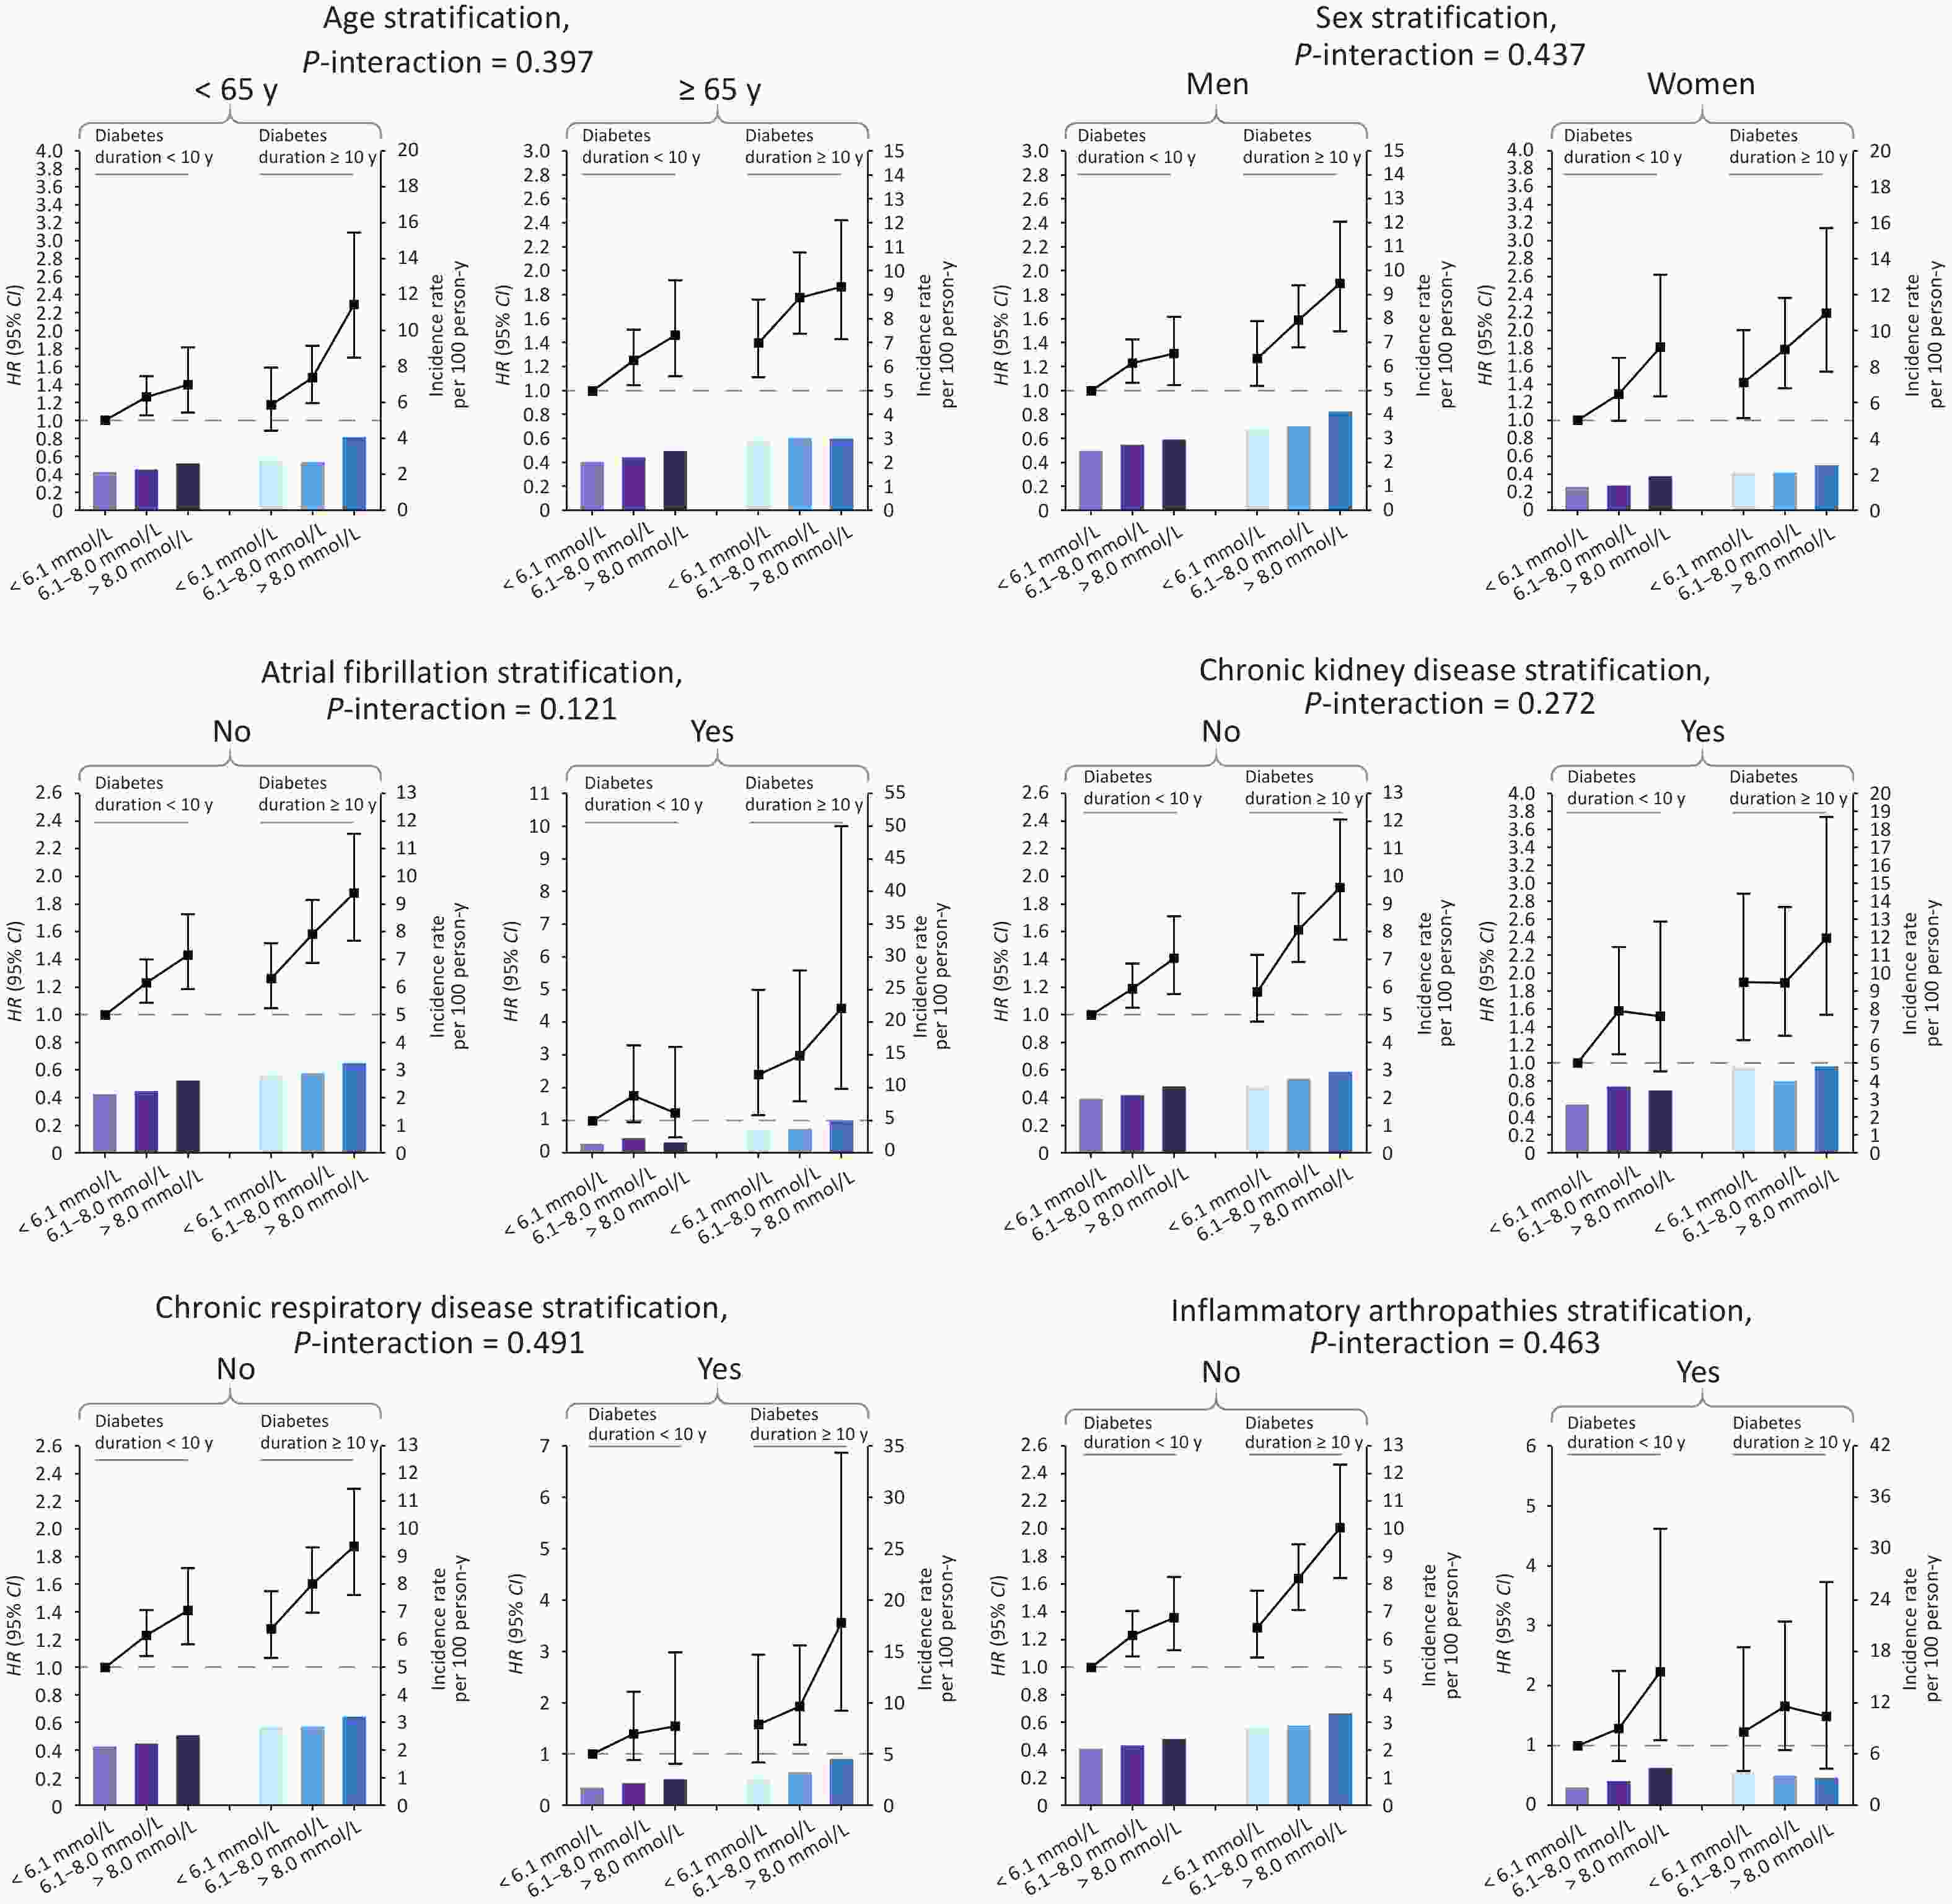
Figure 3. HRs, CIs and IR for the joint association of FPG and diabetes duration with risk of MI among diabetic patients with CHD, by age, sex and comorbidities, in Shenzhen, China. Models were adjusted for age, sex, marital status, education level, BMI, drinking status, physical activity, smoking status and diabetes medication compliance. For sex stratification, sex itself was not adjusted for; for comorbidity stratification, comorbidity itself was not adjusted for. FPG, fasting plasma glucose; CHD, coronary heart disease; HRs, hazard ratios; CIs, confidence intervals; MI, myocardial infarction; BMI, body mass index; IR, incidence rate.
Table S2. Subgroup analysis for the associations of glycemic control with risk of myocardial infarction (MI) among diabetic individuals with coronary heart disease (CHD) in Shenzhen, China, stratified by age and sex
FPG level Age stratification (P for interaction = 0. 822) Age < 65 y Age ≥ 65 y Events/person−years Incidence rate HR (95% CI) Events/person−years Incidence rate HR (95% CI) FPG < 6.1 mmol/L 237/10,427 2.27 Ref. 280/12,136 2.31 Ref. FPG ≥ 6.1 mmol/L to ≤ 8.0 mmol/L 552/23,207 2.38 1.26
(1.08, 1.47)728/28,893 2.52 1.26
(1.10, 1.45)FPG > 8.0 mmol/L 142/4,647 3.06 1.57
(1.27, 1.94)171/6,318 2.71 1.39
(1.15,1.69 )Per 1 mmol/L − − 1.05
(1.02, 1.09)− − 1.05
(1.01, 1.08)FPG level Sex stratification (P for interaction = 0.293) Men Women Events/person−years Incidence rate HR (95% CI) Events/person−years Incidence rate HR (95% CI) FPG < 6.1 mmol/L 384/14,058 2.73 Ref. 133/8,505 1.56 Ref. FPG ≥ 6.1 mmol/L to ≤ 8.0 mmol/L 938/31,414 2.99 1.24
(1.10, 1.40)342/20,686 1.65 1.30
(1.06, 1.60)FPG > 8.0 mmol/L 210/6,222 3.38 1.36
(1.10, 1.40)103/4,743 2.17 1.67
(1.28, 2.18)Per 1 mmol/L − − 1.04
(1.01, 1.07)− − 1.06
(1.02, 1.10)Note. Generally, the models were adjusted for age, sex, marital status, education level, BMI, drinking status, physical activity, smoking status, diabetes medication compliance, atrial fibrillation, chronic respiratory disease, chronic kidney disease, hypertension, inflammatory arthropathy, and diabetes duration. For sex stratification, sex itself was not adjusted for. For comorbidity stratification, comorbidity itself was not adjusted for. CI, confidence interval; FPG, fasting plasma glucose; HR, hazard ratio. -
To test the robustness of the joint association, sensitivity analyses were conducted by excluding patients who experienced MI during the first year of follow-up or excluding those with missing data on covariates (Supplementary Table S8, available in www.besjournal.com). Overall, the joint association remained largely unchanged. We also explored the associations between various covariates and the risk of MI (Supplementary Table S9, available in www.besjournal.com). The results indicate that older age, men, lower levels of physical activity, heavier smoking, chronic kidney disease, and inflammatory arthropathies were significantly associated with elevated risks of MI.
Table S8. Sensitivity analysis for the joint association of fasting plasma glucose (FPG) and diabetes duration with risk of MI among diabetic patients with coronary heart disease (CHD) in Shenzhen, China
Grouping Events/person−years Incidence rate HR (95% CI) Exclusion of patients who experienced recurrent MI during the first year of follow−up Diabetes duration < 10 y FPG < 6.1 mmol/L 289/15,849 1.82 Ref. FPG ≥ 6.1 mmol/L to ≤ 8.0 mmol/L 666/34,670 1.92 1.28 (1.11, 1.47) FPG > 8.0 mmol/L 144/6,526 2.21 1.50 (1.22, 1.83) Diabetes duration ≥ 10 y FPG < 6.1 mmol/L 163/6,640 2.45 1.34 (1.11, 1.63) FPG ≥ 6.1 mmol/L to ≤ 8.0 mmol/L 416/17,199 2.42 1.67 (1.43, 1.95) FPG > 8.0 mmol/L 120/4,389 2.73 1.99 (1.60, 2.48) Exclusion of patients with missing data Diabetes duration < 10 y FPG < 6.1 mmol/L 317/15,602 2.03 Ref. FPG ≥ 6.1 mmol/L to ≤ 8.0 mmol/L 759/34,181 2.22 1.29 (1.13, 1.47) FPG > 8.0 mmol/L 164/6,414 2.56 1.49 (1.23, 1.81) Diabetes duration ≥ 10 y FPG < 6.1 mmol/L 186/6,581 2.83 1.35 (1.13, 1.63) FPG ≥ 6.1 mmol/L to ≤ 8.0 mmol/L 499/17,133 2.91 1.69 (1.47, 1.95) FPG > 8.0 mmol/L 147/4,352 3.38 2.01 (1.65, 2.46) Note. Models were adjusted for age, sex, marital status, education level, BMI, drinking status, physical activity, smoking status, diabetes medication compliance, atrial fibrillation, chronic respiratory disease, chronic kidney disease, hypertension, and inflammatory arthropathy. CI, confidence interval; FPG, fasting plasma glucose; HR, hazard ratio; MI, myocardial infarction. Table S9. Hazard ratios (HRs) and confidence intervals (CIs) for the association of potential risk factors with risk of myocardial infarction (MI) among diabetic individuals with coronary heart disease (CHD) in Shenzhen, China
Potential risk factors Model 3 Potential risk factors Model 3 Age, y 1.01 (1.01, 1.02) Smoking Sex No smoke Ref. Men Ref. 1−10 cigarettes/day 1.19 (0.97, 1.45) Women 0.53 (0.48, 0.59) 11−20 cigarettes/day 1.65 (1.38, 1.97) Marital status > 20 cigarettes/day 1.63 (1.18, 2.26) Married Ref. Drinking divorced 0.72 (0.34, 1.52) No alcohol drinking Ref. widowed 1.09 (0.85, 1.39) 0−100 g/day 0.86 (0.70, 1.04) single 1.19 (0.53, 2.66) 101−250 g/day 1.08 (0.75, 1.57) Education level > 250 g/day 0.66 (0.25, 1.77) College and above Ref. Comorbidities Junior high school and below 1.12 (0.99, 1.25) Chronic respiratory disease 0.99 (0.85, 1.15) High school or vocational school 1.02 (0.91, 1.15) Chronic kidney disease 1.57 (1.41, 1.76) BMI group Inflammatory arthropathies 1.23 (1.03, 1.47) 18.5−24.9 kg/m2 Ref. Hypertension 1.10 (0.98, 1.23) 25−29 kg/m2 0.96 (0.87, 1.05) Atrial fibrillation 1.01 (0.84, 1.21) ≥ 30 kg/m2 0.97 (0.84, 1.12) Medication adherence Exercise No use of hypoglycemic drugs Ref. No exercise Ref. Irregular adherence 0.93 (0.68, 1.26) 5−7 times/week 0.79 (0.70, 0.89) Complete adherence 0.91 (0.74, 1.11) 1−2 times/week 0.69 (0.59, 0.81) − − 3−4 times/week 0.61 (0.54, 0.70) − − Note. Multifactorial adjustments were made for FPG, diabetes duration, age, sex, marital status, education level, BMI, drinking status, physical activity, smoking status, diabetes medication compliance, atrial fibrillation, chronic respiratory disease, chronic kidney disease, hypertension, and inflammatory arthropathy. BMI, body mass index. -
In our study of over 33,000 patients with both CHD and T2D in Shenzhen, China, we found that higher FPG levels and longer diabetes duration were independently associated with an increased risk of subsequent MI. Patients with extreme values for both FPG levels and diabetes duration had the highest MI risk. Although the excess risk of subsequent MI associated with longer diabetes duration appeared to be stronger among those with atrial fibrillation, the combined influence of FPG and diabetes duration on MI was largely similar across different age, sex and comorbidity groups.
Managing blood glucose levels in patients with CHD and T2D is crucial. However, evidence on the link between glycemic control and prognosis among these patients is limited and inconsistent[7]. In a study of 2,884 patients following coronary artery stenting, Kassaian et al. found poor glycemic control (glycated hemoglobin [HbA1c] > 7.0%) to be associated with approximately 2-fold risk of subsequent CVD, compared with non-diabetics[12]. In contrast, the study conducted by You et al. suggested that stringent glucose control (FPG < 7.8 mmol/L) seemed to be linked to an increased risk of CVD, as observed in a cohort of 3,918 diabetic patients who underwent coronary artery bypass grafting (CABG) with the use of cardiopulmonary bypass (On-Pump)[13]. Additionally, the Action to Control Cardiovascular Risk in Diabetes (ACCORD) study, a landmark randomized controlled trial (RCT) in diabetes glycemic intervention, revealed that the adverse event rate even increased in the intensive-treatment group (HbA1c < 6.0%) than in the standard-treatment group, leading to the termination of intensive treatment for safety reasons[14]. Our study, based on real-world scenarios, found that poorer glycemic control was associated with a higher risk of subsequent MI, adding to the existing evidence. The present evidence, along with ours underscores the importance of achieving a balance in glycemic control for patients with CHD and T2D, suggesting that both excessively high and overly strict glucose control may pose risks. The complex relationship between glycemic control and cardiovascular outcomes warrants further investigation to inform optimal therapeutic strategies or targets in this patient population.
The inconsistency in findings regarding the advantages of glycemic control across various studies complicates the task of managing patients with CHD and T2D in clinical practice, highlighting the need for a comprehensive management of risk factors for diabetes patients[15]. In fact, researchers have pointed out that when determining the most suitable approach to glycemic management, it is crucial to take into account factors including the duration of diabetes as well as the presence of pre-existing comorbidities[16]. Indeed, previous research has demonstrated that longer duration of diabetes may amplify the poor CVD prognosis associated with worse glycemic control[17,18]. In the present study, we found that the joint exposure to higher FPG levels and longer diabetes duration had the highest risk of subsequent MI, compared with those with lowest FPG levels and shorter diabetes duration. Collectively, these results may suggest that in patients with a longer duration of diabetes, glycemic control should be more stringent to prevent subsequent CVD events.
The increasing prevalence of obesity among young adults has led to a decline in the age at which T2D is diagnosed[19,20]; and as interventions for the traditional complications associated with diabetes have become more effective, individuals with the condition are experiencing increased longevity. Consequently, they are more likely to have a greater burden of comorbidities over their lifetime. As such, tailored management should also depend on the patient's comorbidity burden[21]. In our current study, we observed that atrial fibrillation could potentially exacerbate the risk of subsequent MI associated with long-term diabetes, albeit without reaching statistical significance in the interaction for the combined effect of FPG levels and diabetes duration. These findings suggest heightened vigilance among clinicians regarding the elevated risk of MI in diabetic patients with CHD who also present with co-occurring atrial fibrillation and long-standing diabetes. Overall, tightening the treatments for patients with long-standing diabetes and elevated FPG, especially those who simultaneously had atrial fibrillation, may be most beneficial for the prevention of adverse outcomes, including MI among individuals with CHD and T2D.
The intricate interplay between atrial fibrillation, diabetes duration, and subsequent MI risk in patients with CHD and T2D may involve several potential mechanisms. Firstly, atrial fibrillation, characterized by atrial remodeling and impaired atrial function, may contribute to hemodynamic disturbances and thromboembolic events, exacerbating MI risk[22]. Secondly, both atrial fibrillation and T2D share common risk factors such as hypertension, obesity, and insulin resistance, which collectively accelerate atherosclerosis progression and plaque instability[23]. Lastly, the presence of atrial fibrillation in patients with longstanding diabetes may reflect an advanced stage of cardiovascular disease characterized by heightened systemic inflammation and endothelial dysfunction, further augmenting MI susceptibility[24]. Overall, understanding these complex interactions informs tailored therapeutic approaches aimed at mitigating MI risk in this high-risk patient population, emphasizing the importance of comprehensive cardiovascular risk management strategies.
Our study also found that older age, men, lower levels of physical activity, heavier smoking, chronic kidney disease, and inflammatory arthropathies were significantly associated with elevated risks of MI. These findings underscore the multifactorial nature of MI risk in diabetic individuals with CHD and highlight the importance of addressing these risk factors comprehensively. The improvement of medical services requires not only the expansion of health insurance coverage but also the improvement of the quality of comprehensive medical services. Indeed, for CHD patients who also have T2D, improving glycemic control requires a comprehensive approach. This includes providing multidisciplinary outpatient clinical and follow-up services, especially for elderly male patients. It is also important to expand the capacity for community-based screening and early detection programs. Promoting physical activity (5-7 times per week) and smoking cessation, as well as encouraging regular blood glucose monitoring, may be beneficial in managing this high-risk population effectively.
-
Our study has several strengths. Firstly, it included a relatively large sample size, encompassing over 33,000 individuals with both CHD and T2D, which enhances the statistical power of our findings. Secondly, the longitudinal nature of our design, with a median follow-up duration of 2.40 years, allows for insights into long-term outcomes. Thirdly, the richness of our dataset, which includes detailed information on demographic characteristics, lifestyle factors, and comorbidity profiles, enables us to perform thorough adjustments for potential confounders, enhancing the robustness of our results. However, our study also has several limitations that should be considered. Firstly, the diagnosis of T2D in our study was based on self-reported and medical record data, which may introduce potential bias between the reported diagnosis time and the actual onset of the disease. To address this, we categorized the duration of T2D into two broad groups: < 10 y and ≥ 10 y, and this wide span grouping helps to reduce the potential bias of self-reported diagnosis time. Secondly, the lack of data on HbA1c, lipid profiles and therapeutic drugs limits our ability to comprehensively assess long-term glycemic control, lipid metabolism or drug interactions, which are critical factors in the context of our study. Thirdly, our study population was confined to diabetic individuals with CHD in Shenzhen, China, which may restrict the generalizability of our findings to other populations.
-
In conclusion, our study highlights the critical role of glycemic control and diabetes duration in influencing subsequent MI in patients with both CHD and T2D. Tailored management strategies focusing on stringent glycemic control may be beneficial, especially for those with longer diabetes duration and atrial fibrillation. Future research should aim to elucidate the underlying mechanisms and develop targeted interventions to improve outcomes in this high-risk population.
-
Table S3. Subgroup analysis for the associations of glycemic control with risk of myocardial infarction (MI) among diabetic individuals with coronary heart disease (CHD) in Shenzhen, China, stratified by comorbidities, including atrial fibrillation, chronic kidney disease, chronic respiratory disease, hypertension, and inflammatory arthropathy
FPG level No Yes Events/person−years Incidence rate HR (95% CI) Events/person−years Incidence rate HR (95% CI) Atrial fibrillation stratification (P for interaction = 0.749) FPG < 6.1 mmol/L 1,197/49,104 2.44 Ref. 83/2,996 2.77 Ref. FPG ≥ 6.1 mmol/L to ≤ 8.0 mmol/L 295/10,338 2.85 1.24 (1.12, 1.38) 18/626 2.87 1.42 (0.92, 2.19) FPG > 8.0 mmol/L / 1.45 (1.25, 1.69) / 1.55 (0.84, 2.85) Per 1 mmol/L − − 1.05 (1.03, 1.08) − − 1.01 (0.90, 1.14) Chronic kidney disease stratification (P for interaction = 0. 905) FPG < 6.1 mmol/L 424/19,992 2.12 Ref. 93/2,571 3.62 Ref. FPG ≥ 6.1 mmol/L to ≤ 8.0 mmol/L 1,058/46,339 2.28 1.26 (1.12, 1.41) 222/5,762 3.85 1.23 (0.96, 1.58) FPG > 8.0 mmol/L 248/9,434 2.63 1.49 (1.27, 1.75) 65/1,531 4.25 1.38 (0.99, 1.92) Per 1 mmol/L − − 1.06 (1.03, 1.09) − − 1.02 (0.97, 1.07) Chronic respiratory disease stratification (P for interaction = 0.493) FPG < 6.1 mmol/L 475/20,449 2.32 Ref. 42/2,114 1.99 Ref. FPG ≥ 6.1 mmol/L to ≤ 8.0 mmol/L 1154/47,208 2.44 1.25 (1.12, 1.39) 126/4,892 2.58 1.31 (0.92, 1.88) FPG > 8.0 mmol/L 282/10,023 2.81 1.43 (1.23, 1.66) 31/942 3.29 1.84 (1.14, 2.98) Per 1 mmol/L − − 1.05 (1.02, 1.07) − − 1.08 (1.01, 1.15) Hypertension stratification (P for interaction = 0.422) FPG < 6.1 mmol/L 90/4,630 1.94 Ref. 427/17,932 2.38 Ref. FPG ≥ 6.1 mmol/L to ≤ 8.0 mmol/L 231/10,116 2.28 1.35 (1.06, 1.73) 1,049/41,984 2.50 1.23 (1.10, 1.38) FPG > 8.0 mmol/L 45/2,064 2.18 1.33 (0.92, 1.93) 268/8,901 3.01 1.47 (1.26, 1.72) Per 1 mmol/L − − 1.06 (1.00, 1.12) − − 1.05 (1.02, 1.07) Inflammatory arthropathy stratification (P for interaction = 0.716) FPG < 6.1 mmol/L 487/21,418 2.27 Ref. 30/1,145 2.62 Ref. FPG ≥ 6.1 mmol/L to ≤ 8.0 mmol/L 1,199/49,489 2.42 1.24 (1.12, 1.38) 81/2,611 3.10 1.31 (0.85, 2.02) FPG > 8.0 mmol/L 292/10,433 2.80 1.44 (1.24, 1.67) 21/532 3.94 1.78 (0.99, 3.20) Per 1 mmol/L − − 1.05 (1.03, 1.07) − − 1.05 (0.96, 1.15) Note. Generally, the models were adjusted for age, sex, marital status, education level, BMI, drinking status, physical activity, smoking status, diabetes medication compliance, atrial fibrillation, chronic respiratory disease, chronic kidney disease, hypertension, inflammatory arthropathy, and diabetes duration. Note that the stratification factor itself was not adjusted for. CI, confidence interval; FPG, fasting plasma glucose; HR, hazard ratio. Table S4. Subgroup analysis for the associations of diabetes duration with risk of myocardial infarction (MI) among diabetic individuals with coronary heart disease (CHD) in Shenzhen, China, stratified by age and sex
Diabetes duration Age stratification (P for interaction = 0.256) Age < 65 y Age ≥ 65 y Events/person−years Incidence rate HR (95% CI) Events/person−years Incidence rate HR (95% CI) Diabetes duration < 10 y 661/29,099 2.27 Ref. 609/28,134 2.16 Ref. Diabetes duration ≥ 10 y 270/9,182 2.94 1.26 (1.08, 1.46) 570/19,214 2.97 1.38 (1.22, 1.55) Per 5 y − − 1.10 (1.03, 1.16) − − 1.12 (1.08, 1.16) Diabetes duration Sex stratification (P for interaction = 0.316) Men Women Events/person−years Incidence rate HR (95% CI) Events/person−years Incidence rate HR (95% CI) Diabetes duration < 10 y 963/35,737 2.69 Ref. 307/21,496 1.43 Ref. Diabetes duration ≥ 10 y 569/15,957 3.57 1.31 (1.18, 1.46) 271/12,439 2.18 1.34 (1.14, 1.59) Per 5 y / − 1.13 (1.08, 1.17) − 1.08 (1.02, 1.14) Note. Generally, the models were adjusted for age, sex, marital status, education level, BMI, drinking status, physical activity, smoking status, diabetes medication compliance, atrial fibrillation, chronic respiratory disease, chronic kidney disease, hypertension, inflammatory arthropathy, and fasting plasma glucose. For sex stratification, sex itself was not adjusted for. For comorbidity stratification, comorbidity itself was not adjusted for. CI, confidence interval; HR, hazard ratio. Table S5. Subgroup analysis for the associations of diabetes duration with risk of myocardial infarction (MI) among diabetic individuals with coronary heart disease (CHD) in Shenzhen, China, stratified by comorbidities, including atrial fibrillation, chronic kidney disease, chronic respiratory disease, hypertension, and inflammatory arthropathy
Diabetes duration No Yes Events/person−years Incidence rate HR (95% CI) Events/person−years Incidence rate HR (95% CI) Atrial fibrillation stratification (P for interaction = 0.008) Diabetes duration < 10 y 1,209/54,072 2.24 Ref. 61/3,161 1.93 Ref. Diabetes duration ≥ 10 y 771/26,567 2.90 1.29 (1.17, 1.42) 69/1,828 3.77 2.04 (1.42, 2.92) Per 5 y − 1.10 (1.07, 1.14) − 1.22 (1.10, 1.35) Chronic kidney disease stratification (P for interaction = 0.448) Diabetes duration < 10 y 1100/52,218 2.11 Ref. 170/5,015 3.39 Ref. Diabetes duration ≥ 10 y 630/23,547 2.68 1.30 (1.18, 1.44) 210/4,848 4.33 1.42 (1.15, 1.75) Per 5 y − 1.10 (1.06, 1.14) − 1.16 (1.08, 1.24) Chronic respiratory disease stratification (P for interaction = 0.179) Diabetes duration < 10 y 1163/52,128 2.23 Ref. 107/5,104 2.10 Ref. Diabetes duration ≥ 10 y 748/25,553 2.93 1.30 (1.18, 1.44) 92/2,843 3.24 1.53 (1.14, 2.05) Per 5 y − 1.10 (1.07, 1.14) − 1.18 (1.08, 1.29) Inflammatory arthropathy stratification (P for interaction = 0.703) Diabetes duration < 10 y 1,190/54,401 2.19 Ref. 80/2,832 2.83 Ref. Diabetes duration ≥ 10 y 788/26,939 2.93 1.35 (1.22, 1.48) 52/1,457 3.57 1.16 (0.79, 1.68) Per 5 y − 1.05 (1.03, 1.07) − 1.05 (0.96, 1.15) Note. Generally, the models were adjusted for age, sex, marital status, education level, BMI, drinking status, physical activity, smoking status, diabetes medication compliance, atrial fibrillation, chronic respiratory disease, chronic kidney disease, hypertension, inflammatory arthropathy, and fasting plasma glucose. Note that the stratification factor itself was not adjusted for. CI, confidence interval; HR, hazard ratio. Table S6. Subgroup analysis for the joint associations of glycemic control and diabetes duration with risk of myocardial infarction (MI) among diabetic individuals with coronary heart disease (CHD) in Shenzhen, China, stratified by age and sex
Grouping Age stratification (P for interaction = 0.379) Age < 65 y Age ≥ 65 y Events/person−years Incidence rate HR (95% CI) Events/person−years Incidence rate HR (95% CI) Grouping < 10 y FPG < 6.1 mmol/L 178/8,308 2.14 Ref. 151/7,584 1.99 Ref. FPG ≥ 6.1 mmol/L to ≤ 8.0 mmol/L 398/17,541 2.27 1.26 (1.05, 1.51) 377/17,248 2.19 1.28 (1.05, 1.54) FPG > 8.0 mmol/L 85/3,250 2.62 1.40 (1.07, 1.82) 81/3,301 2.45 1.49 (1.13, 1.95) Diabetes duration ≥ 10 y FPG < 6.1 mmol/L 59/2,118 2.79 1.20 (0.89, 1.61) 129/4,552 2.83 1.41 (1.11, 1.79) FPG ≥ 6.1 mmol/L to ≤ 8.0 mmol/L 154/5,666 2.72 1.48 (1.18, 1.84) 351/11,645 3.01 1.79 (1.47, 2.17) FPG > 8.0 mmol/L 57/1,397 4.08 2.26 (1.66, 3.06) 90/3,017 2.98 1.82 (1.39, 2.37) Grouping Sex stratification (P for interaction = 0.561) Men Women Events/person−years Incidence rate HR (95% CI) Events/person−years Incidence rate HR (95% CI) Diabetes duration < 10 y FPG < 6.1 mmol/L 256/10,260 2.50 Ref. 73/5632 1.30 Ref. FPG ≥ 6.1 mmol/L to ≤ 8.0 mmol/L 590/21,513 2.74 1.24 (1.07, 1.44) 185/13276 1.39 1.33 (1.01, 1.75) FPG > 8.0 mmol/L 117/3,964 2.95 1.31 (1.05, 1.64) 49/2588 1.89 1.82 (1.26, 2.62) Diabetes duration ≥ 10 y FPG < 6.1 mmol/L 128/3,798 3.37 1.29 (1.04, 1.60) 60/2873 2.09 1.42 (1.01, 2.02) FPG ≥ 6.1 mmol/L to ≤ 8.0 mmol/L 348/9,901 3.51 1.60 (1.36, 1.89) 157/7410 2.12 1.79 (1.35, 2.38) FPG > 8.0 mmol/L 93/2,258 4.12 1.85 (1.45, 2.36) 54/2156 2.50 2.16 (1.51, 3.10) Note. Generally, the models were adjusted for age, sex, marital status, education level, BMI, drinking status, physical activity, smoking status, diabetes medication compliance, atrial fibrillation, chronic respiratory disease, chronic kidney disease, hypertension, inflammatory arthropathy, and diabetes duration. For sex stratification, sex itself was not adjusted for. CI, confidence interval; HR, hazard ratio. Table S7. Subgroup analysis for the joint associations of glycemic control and diabetes duration with risk of myocardial infarction (MI) among diabetic individuals with coronary heart disease (CHD) in Shenzhen, China, stratified by comorbidities, including atrial fibrillation, chronic kidney disease, chronic respiratory disease, hypertension, and inflammatory arthropathy
Grouping No Yes Events/person−years Incidence rate HR (95% CI) Events/person−years Incidence rate HR (95% CI) Atrial fibrillation stratification (P for interaction = 0.121) Diabetes duration < 10 y FPG < 6.1 mmol/L 316/14,996 2.11 Reference 13/896 1.45 Reference FPG ≥ 6.1 mmol/L to ≤ 8.0 mmol/L 733/32,909 2.23 1.23 (1.08, 1.40) 42/1,880 2.23 1.75 (0.93, 3.30) FPG > 8.0 mmol/L 160/6,166 2.59 1.43 (118, 1.73) 6/385 1.56 1.22 (0.46, 3.26) Diabetes duration ≥ 10 y FPG < 6.1 mmol/L 172/6,200 2.77 1.26 (1.04, 1.52) 16/471 3.40 2.38 (1.13, 5.02) FPG ≥ 6.1 mmol/L to ≤ 8.0 mmol/L 464/16,195 2.87 1.58 (1.37, 1.83) 41/1,116 3.67 2.96 (1.56, 5.61) FPG > 8.0 mmol/L 135/4,172 3.24 1.88 (1.53, 2.31) 12/242 4.97 4.42 (1.95, 10.01) Chronic kidney disease stratification (P for interaction = 0.272) Diabetes duration < 10 y FPG < 6.1 mmol/L 290/14,444 2.01 Reference 39/1,448 2.69 Reference FPG ≥ 6.1 mmol/L to ≤ 8.0 mmol/L 667/31,881 2.09 1.20 (1.05, 1.38) 108/2,908 3.71 1.58 (1.09, 2.29) FPG > 8.0 mmol/L 143/5,893 2.43 1.41 (1.15, 1.72) 23/659 3.49 1.52 (0.90, 2.58) Diabetes duration ≥ 10 y FPG < 6.1 mmol/L 134/5,548 2.42 1.17 (0.95, 1.44) 54/1,122 4.81 1.90 (1.25, 2.89) FPG ≥ 6.1 mmol/L to ≤ 8.0 mmol/L 391/14,457 2.70 1.62 (1.38, 1.89) 114/2,854 3.99 1.89 (1.30, 2.74) FPG > 8.0 mmol/L 105/3,541 2.97 1.92 (1.54, 2.42) 42/873 4.81 2.39 (1.53, 3.74) Chronic respiratory disease stratification (P for interaction = 0.491) Diabetes duration < 10 y FPG < 6.1 mmol/L 305/14,483 2.11 Reference 24/1,409 1.70 Reference FPG ≥ 6.1 mmol/L to ≤ 8.0 mmol/L 707/31,681 2.23 1.24 (1.08, 1.42) 68/3,109 2.19 1.39 (0.87, 2.23) FPG > 8.0 mmol/L 151/5,964 2.53 1.41 (1.16, 1.72) 15/587 2.56 1.54 (0.80, 2.99) Diabetes duration ≥ 10 y FPG < 6.1 mmol/L 170/5,966 2.85 1.28 (1.06, 1.55) 18/705 2.55 1.57 (0.83, 2.94) FPG ≥ 6.1 mmol/L to ≤ 8.0 mmol/L 447/15,527 2.88 1.61 (1.39, 1.87) 58/1,784 3.25 1.92 (1.17, 3.12) FPG > 8.0 mmol/L 131/4,059 3.23 1.87 (1.52, 2.30) 16/355 4.51 3.56 (1.84, 6.88) Inflammatory arthropathy stratification (P for interaction = 0.463) Diabetes duration < 10 y FPG < 6.1 mmol/L 311/15,057 2.07 Reference 18/835 2.15 Reference FPG ≥ 6.1 mmol/L to ≤ 8.0 mmol/L 727/33,108 2.20 1.23 (1.08, 1.41) 48/1,682 2.85 1.29 (0.73, 2.25) FPG > 8.0 mmol/L 152/6,237 2.44 1.36 (1.12, 1.66) 14/314 4.45 2.23 (1.08, 4.62) Diabetes duration ≥ 10 y FPG < 6.1 mmol/L 176/6,361 2.77 1.29 (1.07, 1.56) 12/309 3.88 1.23 (0.57, 2.65) FPG ≥ 6.1 mmol/L to ≤ 8.0 mmol/L 472/16,381 2.88 1.64 (1.41, 1.89) 33/929 3.55 1.68 (0.91, 3.08) FPG > 8.0 mmol/L 140/4,196 3.34 2.01 (1.64, 2.47) 7/218 3.21 1.49 (0.60, 3.74) Note. Generally, the models were adjusted for age, sex, marital status, education level, BMI, drinking status, physical activity, smoking status, diabetes medication compliance, atrial fibrillation, chronic respiratory disease, chronic kidney disease, hypertension, inflammatory arthropathy, and diabetes duration. Note that the stratification factor itself was not adjusted for. CI, confidence interval; HR, hazard ratio.
doi: 10.3967/bes2024.187
Glycemic Control and Diabetes Duration in Relation to Subsequent Myocardial Infarction among Patients with Coronary Heart Disease and Type 2 Diabetes
-
-
Key words:
- Coronary heart disease /
- Type 2 diabetes /
- Myocardial infarction /
- Diabetes duration /
- Fasting plasma glucose
The authors declare that they have no competing interests.
This study was approved by the ethics committee at Southern University of Science and Technology.
&These authors contributed equally to this work.
注释:1) Authors’ Contributions: 2) Competing Interests: 3) Ethics: -
S1. Flowchart of the study population selection.
BMI, body mass index; FPG, fasting plasma glucose.
Figure 1. HRs and CIs for the joint association of FPG and diabetes duration with risk of MI among diabetic patients with CHD in Shenzhen, China. Model 1 was adjusted for age, sex, marital status, and education level; Model 2 was adjusted for variables in the model 1 plus BMI and lifestyle factors, including drinking status, physical activity, and smoking status; Model 3 was adjusted for variables in the model 2 plus clinical conditions, including diabetes medication compliance, atrial fibrillation, chronic respiratory disease, chronic kidney disease, hypertension, and inflammatory arthropathy. P for interaction = 0.968. The unit for measuring the incidence rate is 100 person-years. FPG, fasting plasma glucose; CHD, coronary heart disease. HRs, hazard ratios; CIs, confidence intervals; MI, myocardial infarction; IR, incidence rate; P-y, person-year.
Figure 2. Associations of FPG and diabetes duration with risk of subsequent MI from the Cox regression using penalized cubic splines. FPG levels and Diabetes duration were fitted as a smooth term using a penalized cubic spline with 3 degrees of freedom. The solid lines indicated the HRs, the dashes lines indicated 95% CIs. Multifactorial adjustments were made for age, sex, marital status, education level, BMI, drinking status, physical activity, smoking status, atrial fibrillation, chronic respiratory disease, chronic kidney disease, hypertension, and inflammatory arthropathy. FPG and diabetes duration were mutually adjusted for each other. FPG, fasting plasma glucose; CHD, coronary heart disease; HRs, hazard ratios; CIs, confidence intervals; MI, myocardial infarction; BMI, body mass index.
Figure 3. HRs, CIs and IR for the joint association of FPG and diabetes duration with risk of MI among diabetic patients with CHD, by age, sex and comorbidities, in Shenzhen, China. Models were adjusted for age, sex, marital status, education level, BMI, drinking status, physical activity, smoking status and diabetes medication compliance. For sex stratification, sex itself was not adjusted for; for comorbidity stratification, comorbidity itself was not adjusted for. FPG, fasting plasma glucose; CHD, coronary heart disease; HRs, hazard ratios; CIs, confidence intervals; MI, myocardial infarction; BMI, body mass index; IR, incidence rate.
Table 1. Baseline characteristics among diabetic individuals with coronary heart disease (CHD) according to joint group of fasting plasma glucose (FPG) and diabetes duration in Shenzhen, China
Characteristics Diabetes duration < 10 y, mmol/L Diabetes duration ≥ 10 y, mmol/L P value < 6.1 6.1−8.0 > 8.0 < 6.1 6.1−8.0 > 8.0 FPG, mmol/L 5.7 (0.6) 6.7 (0.5) 9.2 (2.3) 5.7 (0.6) 6.7 (0.5) 9.5 (2.4) < 0.001 Diabetes duration, y 3.0 (4.7) 3.2 (4.9) 3.5 (5.1) 14.6 (8.4) 14.5 (8.4) 14.9 (8.4) < 0.001 Age, y 63 (15) 65 (14) 65 (15) 69 (13) 69 (13) 69 (13) < 0.001 Women 34.1% 37.6% 38.5% 41.8% 42.1% 48.5% < 0.001 Married 96.8% 96.6% 96.1% 95.8% 95.6% 95.8% < 0.001 Junior high school and below 46.3% 50.3% 60.3% 43.9% 46.2% 59.0% < 0.001 BMI, kg/m2 24.4 (3.9) 24.7 (4.1) 24.8 (4.2) 23.7 (3.5) 24.0 (3.7) 24.3 (4.2) < 0.001 No alcohol drinking 92.2% 91.3% 89.1% 93.3% 91.6% 90.5% < 0.001 No exercise 21.1% 24.1% 31.3% 19.9% 21.8% 28.7% < 0.001 No smoking 86.3% 84.9% 80.7% 91.0% 88.6% 87.2% < 0.001 Good diabetes drug compliance 90.3% 89.8% 84.5% 93.9% 96.0% 92.2% < 0.001 Atrial fibrillation 6.0% 5.7% 6.0% 7.6% 6.8% 6.0% 0.002 Chronic kidney disease 9.1% 8.6% 10.1% 18.3% 17.7% 20.3% < 0.001 Chronic respiratory disease 9.9% 10.3% 10.5% 12.4% 11.5% 10.4% 0.003 Hypertension 78.4% 79.8% 78.6% 80.5% 80.7% 80.7% 0.011 Inflammatory arthropathies 6.0% 5.4% 5.2% 5.2% 5.6% 4.7% 0.275 Note. Continuous variables are described as medians (interquartile ranges), and categorical variables are described as percentages. BMI, body mass index; FPG, fasting plasma glucose.  下载: 导出CSV
S1. Baseline characteristics among diabetic individuals with coronary heart disease (CHD) according to fasting plasma glucose (FPG) and diabetes duration in Shenzhen, China
Characteristics FPG P value Diabetes duration P value < 6.1 mmol/L 6.1−8 mmol/L > 8 mmol/L < 10 y ≥ 10 y FPG, mmol/L 5.7 (0.6) 6.7 (0.5) 9.3 (2.3) < 0.001 6.5 (1) 6.7 (1.3) < 0.001 Diabetes duration, year 5.2 (9) 6 (9.4) 7.6 (10.6) < 0.001 3.2 (4.9) 14.6 (8.4) < 0.001 Age, y 65 (14) 66 (15) 66 (14) < 0.001 64 (15) 69 (13) < 0.001 Women 36.4% 39.1% 42.6% < 0.001 36.8% 43.2% Married 96.5% 96.2% 95.9% 0.434 96.6% 95.7% Education level < 0.001 Junior high school and below 45.6% 48.9% 59.8% 50.6% 47.9% College degree or above 23.7% 20.9% 13.9% 19.6% 22.5% High school/Vocational school 30.7% 30.2% 26.3% 29.8% 29.5% BMI, kg/m2 24.1 (3.8) 24.4 (4.0) 24.6 (4.2) < 0.001 24.6 (4.0) 23.9 (3.8) < 0.001 Drinking status < 0.001 0.030 No alcohol drinking 92.6% 91.4% 89.7% 91.3% 91.8% 0−100 g/day 5.6% 6.7% 8.0% 6.6% 6.6% 101−250 g/day 1.2% 1.4% 1.6% 1.5% 1.1% > 250 g/day 0.2% 0.2% 0.3% 0.2% 0.2% Exercise < 0.001 < 0.001 No exercise 20.7% 23.4% 30.2% 24.3% 22.6% 1−2 times/week 10.1% 9.7% 9.9% 21.3% 21.4% 3−4 times/week 23.4% 21.7% 16.0% 21.3% 21.4% 5−7 times/week 45.5% 44.9% 43.5% 44.1% 46.3% Smoking status, % < 0.001 < 0.001 No smoking 87.7% 86.1% 83.4% 84.7% 88.8% 1−10 cigarettes/day 6.0% 5.8% 6.4% 6.4% 5.1% 11−20 cigarettes/day 4.9% 6.3% 7.8% 7.0% 4.6% > 20 cigarettes/day 1.1% 1.5% 2.0% 1.6% 1.2% Diabetes drug compliance < 0.001 < 0.001 Good 91.4% 91.9% 87.7% 89.2% 94.9% Fair 1.8% 2.6% 6.4% 3.4% 2.1% Poor 5.4% 4.7% 5.2% 6.2% 2.4% Atrial fibrillation 6.4% 6.1% 6.0% 0.487 5.8% 6.8% < 0.001 Chronic kidney disease 11.9% 11.7% 14.3% < 0.001 8.9% 18.3% < 0.001 Chronic respiratory disease 10.7% 10.7% 10.5% 0.884 10.3% 11.5% < 0.001 Hypertension 79.0% 80.1% 79.5% 0.094 79.3% 80.7% 0.003 Inflammatory arthropathies 5.7% 5.5% 5.0% 0.183 5.5% 5.4% 0.594 Note. Continuous variables are described as medians (interquartile ranges), and categorical variables are described as percentages. BMI, body mass index; FPG, fasting plasma glucose.
下载: 导出CSV
Table 2. HRs and CIs for the association of FPG and diabetes duration with risk of MI among diabetic individuals with CHD in Shenzhen, China
Variables FPG (mmol/L) Diabetes duration < 6.1 6.1−8.0 > 8.0 per 1 < 10 y ≥ 10 y per 5 y Events/person−years 517/22,563 1,280/52,100 313/10,965 − 1,270/57,233 840/28,395 − Incidence rate 2.29 2.46 2.85 − 2.22 2.96 − Model 1 Ref. 1.27 (1.14, 1.41) 1.55 (1.35, 1.79) 1.06 (1.04, 1.08) Ref. 1.36 (1.24, 1.49) 1.12 (1.09, 1.16) Model 2 Ref. 1.24 (1.12, 1.38) 1.47 (1.28, 1.70) 1.05 (1.03, 1.08) Ref. 1.37 (1.25, 1.50) 1.13 (1.09, 1.16) Model 3 Ref. 1.25 (1.12, 1.38) 1.46 (1.26, 1.69) 1.05 (1.03, 1.07) Ref. 1.32 (1.21, 1.45) 1.11 (1.08, 1.15) Note. Model 1 was adjusted for age, sex, marital status, and education level; Model 2 was adjusted for variables in the model 1 plus BMI and lifestyle factors, including, drinking status, physical activity, and smoking status; Model 3 was adjusted for variables in the model 2 plus clinical conditions, including diabetes medication compliance, atrial fibrillation, chronic respiratory disease, chronic kidney disease, hypertension, and inflammatory arthropathy. FPG and diabetes duration was mutually adjusted for each other. The unit for measuring the incidence rate is 100 person−years. FPG, fasting plasma glucose; CHD, coronary heart disease. HRs, hazard ratios; CIs, confidence intervals; MI, myocardial infarction.
下载: 导出CSV
S2. Subgroup analysis for the associations of glycemic control with risk of myocardial infarction (MI) among diabetic individuals with coronary heart disease (CHD) in Shenzhen, China, stratified by age and sex
FPG level Age stratification (P for interaction = 0. 822) Age < 65 y Age ≥ 65 y Events/person−years Incidence rate HR (95% CI) Events/person−years Incidence rate HR (95% CI) FPG < 6.1 mmol/L 237/10,427 2.27 Ref. 280/12,136 2.31 Ref. FPG ≥ 6.1 mmol/L to ≤ 8.0 mmol/L 552/23,207 2.38 1.26
(1.08, 1.47)728/28,893 2.52 1.26
(1.10, 1.45)FPG > 8.0 mmol/L 142/4,647 3.06 1.57
(1.27, 1.94)171/6,318 2.71 1.39
(1.15,1.69 )Per 1 mmol/L − − 1.05
(1.02, 1.09)− − 1.05
(1.01, 1.08)FPG level Sex stratification (P for interaction = 0.293) Men Women Events/person−years Incidence rate HR (95% CI) Events/person−years Incidence rate HR (95% CI) FPG < 6.1 mmol/L 384/14,058 2.73 Ref. 133/8,505 1.56 Ref. FPG ≥ 6.1 mmol/L to ≤ 8.0 mmol/L 938/31,414 2.99 1.24
(1.10, 1.40)342/20,686 1.65 1.30
(1.06, 1.60)FPG > 8.0 mmol/L 210/6,222 3.38 1.36
(1.10, 1.40)103/4,743 2.17 1.67
(1.28, 2.18)Per 1 mmol/L − − 1.04
(1.01, 1.07)− − 1.06
(1.02, 1.10)Note. Generally, the models were adjusted for age, sex, marital status, education level, BMI, drinking status, physical activity, smoking status, diabetes medication compliance, atrial fibrillation, chronic respiratory disease, chronic kidney disease, hypertension, inflammatory arthropathy, and diabetes duration. For sex stratification, sex itself was not adjusted for. For comorbidity stratification, comorbidity itself was not adjusted for. CI, confidence interval; FPG, fasting plasma glucose; HR, hazard ratio.
下载: 导出CSV
S8. Sensitivity analysis for the joint association of fasting plasma glucose (FPG) and diabetes duration with risk of MI among diabetic patients with coronary heart disease (CHD) in Shenzhen, China
Grouping Events/person−years Incidence rate HR (95% CI) Exclusion of patients who experienced recurrent MI during the first year of follow−up Diabetes duration < 10 y FPG < 6.1 mmol/L 289/15,849 1.82 Ref. FPG ≥ 6.1 mmol/L to ≤ 8.0 mmol/L 666/34,670 1.92 1.28 (1.11, 1.47) FPG > 8.0 mmol/L 144/6,526 2.21 1.50 (1.22, 1.83) Diabetes duration ≥ 10 y FPG < 6.1 mmol/L 163/6,640 2.45 1.34 (1.11, 1.63) FPG ≥ 6.1 mmol/L to ≤ 8.0 mmol/L 416/17,199 2.42 1.67 (1.43, 1.95) FPG > 8.0 mmol/L 120/4,389 2.73 1.99 (1.60, 2.48) Exclusion of patients with missing data Diabetes duration < 10 y FPG < 6.1 mmol/L 317/15,602 2.03 Ref. FPG ≥ 6.1 mmol/L to ≤ 8.0 mmol/L 759/34,181 2.22 1.29 (1.13, 1.47) FPG > 8.0 mmol/L 164/6,414 2.56 1.49 (1.23, 1.81) Diabetes duration ≥ 10 y FPG < 6.1 mmol/L 186/6,581 2.83 1.35 (1.13, 1.63) FPG ≥ 6.1 mmol/L to ≤ 8.0 mmol/L 499/17,133 2.91 1.69 (1.47, 1.95) FPG > 8.0 mmol/L 147/4,352 3.38 2.01 (1.65, 2.46) Note. Models were adjusted for age, sex, marital status, education level, BMI, drinking status, physical activity, smoking status, diabetes medication compliance, atrial fibrillation, chronic respiratory disease, chronic kidney disease, hypertension, and inflammatory arthropathy. CI, confidence interval; FPG, fasting plasma glucose; HR, hazard ratio; MI, myocardial infarction.
下载: 导出CSV
S9. Hazard ratios (HRs) and confidence intervals (CIs) for the association of potential risk factors with risk of myocardial infarction (MI) among diabetic individuals with coronary heart disease (CHD) in Shenzhen, China
Potential risk factors Model 3 Potential risk factors Model 3 Age, y 1.01 (1.01, 1.02) Smoking Sex No smoke Ref. Men Ref. 1−10 cigarettes/day 1.19 (0.97, 1.45) Women 0.53 (0.48, 0.59) 11−20 cigarettes/day 1.65 (1.38, 1.97) Marital status > 20 cigarettes/day 1.63 (1.18, 2.26) Married Ref. Drinking divorced 0.72 (0.34, 1.52) No alcohol drinking Ref. widowed 1.09 (0.85, 1.39) 0−100 g/day 0.86 (0.70, 1.04) single 1.19 (0.53, 2.66) 101−250 g/day 1.08 (0.75, 1.57) Education level > 250 g/day 0.66 (0.25, 1.77) College and above Ref. Comorbidities Junior high school and below 1.12 (0.99, 1.25) Chronic respiratory disease 0.99 (0.85, 1.15) High school or vocational school 1.02 (0.91, 1.15) Chronic kidney disease 1.57 (1.41, 1.76) BMI group Inflammatory arthropathies 1.23 (1.03, 1.47) 18.5−24.9 kg/m2 Ref. Hypertension 1.10 (0.98, 1.23) 25−29 kg/m2 0.96 (0.87, 1.05) Atrial fibrillation 1.01 (0.84, 1.21) ≥ 30 kg/m2 0.97 (0.84, 1.12) Medication adherence Exercise No use of hypoglycemic drugs Ref. No exercise Ref. Irregular adherence 0.93 (0.68, 1.26) 5−7 times/week 0.79 (0.70, 0.89) Complete adherence 0.91 (0.74, 1.11) 1−2 times/week 0.69 (0.59, 0.81) − − 3−4 times/week 0.61 (0.54, 0.70) − − Note. Multifactorial adjustments were made for FPG, diabetes duration, age, sex, marital status, education level, BMI, drinking status, physical activity, smoking status, diabetes medication compliance, atrial fibrillation, chronic respiratory disease, chronic kidney disease, hypertension, and inflammatory arthropathy. BMI, body mass index.
下载: 导出CSV
S3. Subgroup analysis for the associations of glycemic control with risk of myocardial infarction (MI) among diabetic individuals with coronary heart disease (CHD) in Shenzhen, China, stratified by comorbidities, including atrial fibrillation, chronic kidney disease, chronic respiratory disease, hypertension, and inflammatory arthropathy
FPG level No Yes Events/person−years Incidence rate HR (95% CI) Events/person−years Incidence rate HR (95% CI) Atrial fibrillation stratification (P for interaction = 0.749) FPG < 6.1 mmol/L 1,197/49,104 2.44 Ref. 83/2,996 2.77 Ref. FPG ≥ 6.1 mmol/L to ≤ 8.0 mmol/L 295/10,338 2.85 1.24 (1.12, 1.38) 18/626 2.87 1.42 (0.92, 2.19) FPG > 8.0 mmol/L / 1.45 (1.25, 1.69) / 1.55 (0.84, 2.85) Per 1 mmol/L − − 1.05 (1.03, 1.08) − − 1.01 (0.90, 1.14) Chronic kidney disease stratification (P for interaction = 0. 905) FPG < 6.1 mmol/L 424/19,992 2.12 Ref. 93/2,571 3.62 Ref. FPG ≥ 6.1 mmol/L to ≤ 8.0 mmol/L 1,058/46,339 2.28 1.26 (1.12, 1.41) 222/5,762 3.85 1.23 (0.96, 1.58) FPG > 8.0 mmol/L 248/9,434 2.63 1.49 (1.27, 1.75) 65/1,531 4.25 1.38 (0.99, 1.92) Per 1 mmol/L − − 1.06 (1.03, 1.09) − − 1.02 (0.97, 1.07) Chronic respiratory disease stratification (P for interaction = 0.493) FPG < 6.1 mmol/L 475/20,449 2.32 Ref. 42/2,114 1.99 Ref. FPG ≥ 6.1 mmol/L to ≤ 8.0 mmol/L 1154/47,208 2.44 1.25 (1.12, 1.39) 126/4,892 2.58 1.31 (0.92, 1.88) FPG > 8.0 mmol/L 282/10,023 2.81 1.43 (1.23, 1.66) 31/942 3.29 1.84 (1.14, 2.98) Per 1 mmol/L − − 1.05 (1.02, 1.07) − − 1.08 (1.01, 1.15) Hypertension stratification (P for interaction = 0.422) FPG < 6.1 mmol/L 90/4,630 1.94 Ref. 427/17,932 2.38 Ref. FPG ≥ 6.1 mmol/L to ≤ 8.0 mmol/L 231/10,116 2.28 1.35 (1.06, 1.73) 1,049/41,984 2.50 1.23 (1.10, 1.38) FPG > 8.0 mmol/L 45/2,064 2.18 1.33 (0.92, 1.93) 268/8,901 3.01 1.47 (1.26, 1.72) Per 1 mmol/L − − 1.06 (1.00, 1.12) − − 1.05 (1.02, 1.07) Inflammatory arthropathy stratification (P for interaction = 0.716) FPG < 6.1 mmol/L 487/21,418 2.27 Ref. 30/1,145 2.62 Ref. FPG ≥ 6.1 mmol/L to ≤ 8.0 mmol/L 1,199/49,489 2.42 1.24 (1.12, 1.38) 81/2,611 3.10 1.31 (0.85, 2.02) FPG > 8.0 mmol/L 292/10,433 2.80 1.44 (1.24, 1.67) 21/532 3.94 1.78 (0.99, 3.20) Per 1 mmol/L − − 1.05 (1.03, 1.07) − − 1.05 (0.96, 1.15) Note. Generally, the models were adjusted for age, sex, marital status, education level, BMI, drinking status, physical activity, smoking status, diabetes medication compliance, atrial fibrillation, chronic respiratory disease, chronic kidney disease, hypertension, inflammatory arthropathy, and diabetes duration. Note that the stratification factor itself was not adjusted for. CI, confidence interval; FPG, fasting plasma glucose; HR, hazard ratio.
下载: 导出CSV
S4. Subgroup analysis for the associations of diabetes duration with risk of myocardial infarction (MI) among diabetic individuals with coronary heart disease (CHD) in Shenzhen, China, stratified by age and sex
Diabetes duration Age stratification (P for interaction = 0.256) Age < 65 y Age ≥ 65 y Events/person−years Incidence rate HR (95% CI) Events/person−years Incidence rate HR (95% CI) Diabetes duration < 10 y 661/29,099 2.27 Ref. 609/28,134 2.16 Ref. Diabetes duration ≥ 10 y 270/9,182 2.94 1.26 (1.08, 1.46) 570/19,214 2.97 1.38 (1.22, 1.55) Per 5 y − − 1.10 (1.03, 1.16) − − 1.12 (1.08, 1.16) Diabetes duration Sex stratification (P for interaction = 0.316) Men Women Events/person−years Incidence rate HR (95% CI) Events/person−years Incidence rate HR (95% CI) Diabetes duration < 10 y 963/35,737 2.69 Ref. 307/21,496 1.43 Ref. Diabetes duration ≥ 10 y 569/15,957 3.57 1.31 (1.18, 1.46) 271/12,439 2.18 1.34 (1.14, 1.59) Per 5 y / − 1.13 (1.08, 1.17) − 1.08 (1.02, 1.14) Note. Generally, the models were adjusted for age, sex, marital status, education level, BMI, drinking status, physical activity, smoking status, diabetes medication compliance, atrial fibrillation, chronic respiratory disease, chronic kidney disease, hypertension, inflammatory arthropathy, and fasting plasma glucose. For sex stratification, sex itself was not adjusted for. For comorbidity stratification, comorbidity itself was not adjusted for. CI, confidence interval; HR, hazard ratio.
下载: 导出CSV
S5. Subgroup analysis for the associations of diabetes duration with risk of myocardial infarction (MI) among diabetic individuals with coronary heart disease (CHD) in Shenzhen, China, stratified by comorbidities, including atrial fibrillation, chronic kidney disease, chronic respiratory disease, hypertension, and inflammatory arthropathy
Diabetes duration No Yes Events/person−years Incidence rate HR (95% CI) Events/person−years Incidence rate HR (95% CI) Atrial fibrillation stratification (P for interaction = 0.008) Diabetes duration < 10 y 1,209/54,072 2.24 Ref. 61/3,161 1.93 Ref. Diabetes duration ≥ 10 y 771/26,567 2.90 1.29 (1.17, 1.42) 69/1,828 3.77 2.04 (1.42, 2.92) Per 5 y − 1.10 (1.07, 1.14) − 1.22 (1.10, 1.35) Chronic kidney disease stratification (P for interaction = 0.448) Diabetes duration < 10 y 1100/52,218 2.11 Ref. 170/5,015 3.39 Ref. Diabetes duration ≥ 10 y 630/23,547 2.68 1.30 (1.18, 1.44) 210/4,848 4.33 1.42 (1.15, 1.75) Per 5 y − 1.10 (1.06, 1.14) − 1.16 (1.08, 1.24) Chronic respiratory disease stratification (P for interaction = 0.179) Diabetes duration < 10 y 1163/52,128 2.23 Ref. 107/5,104 2.10 Ref. Diabetes duration ≥ 10 y 748/25,553 2.93 1.30 (1.18, 1.44) 92/2,843 3.24 1.53 (1.14, 2.05) Per 5 y − 1.10 (1.07, 1.14) − 1.18 (1.08, 1.29) Inflammatory arthropathy stratification (P for interaction = 0.703) Diabetes duration < 10 y 1,190/54,401 2.19 Ref. 80/2,832 2.83 Ref. Diabetes duration ≥ 10 y 788/26,939 2.93 1.35 (1.22, 1.48) 52/1,457 3.57 1.16 (0.79, 1.68) Per 5 y − 1.05 (1.03, 1.07) − 1.05 (0.96, 1.15) Note. Generally, the models were adjusted for age, sex, marital status, education level, BMI, drinking status, physical activity, smoking status, diabetes medication compliance, atrial fibrillation, chronic respiratory disease, chronic kidney disease, hypertension, inflammatory arthropathy, and fasting plasma glucose. Note that the stratification factor itself was not adjusted for. CI, confidence interval; HR, hazard ratio.
下载: 导出CSV
S6. Subgroup analysis for the joint associations of glycemic control and diabetes duration with risk of myocardial infarction (MI) among diabetic individuals with coronary heart disease (CHD) in Shenzhen, China, stratified by age and sex
Grouping Age stratification (P for interaction = 0.379) Age < 65 y Age ≥ 65 y Events/person−years Incidence rate HR (95% CI) Events/person−years Incidence rate HR (95% CI) Grouping < 10 y FPG < 6.1 mmol/L 178/8,308 2.14 Ref. 151/7,584 1.99 Ref. FPG ≥ 6.1 mmol/L to ≤ 8.0 mmol/L 398/17,541 2.27 1.26 (1.05, 1.51) 377/17,248 2.19 1.28 (1.05, 1.54) FPG > 8.0 mmol/L 85/3,250 2.62 1.40 (1.07, 1.82) 81/3,301 2.45 1.49 (1.13, 1.95) Diabetes duration ≥ 10 y FPG < 6.1 mmol/L 59/2,118 2.79 1.20 (0.89, 1.61) 129/4,552 2.83 1.41 (1.11, 1.79) FPG ≥ 6.1 mmol/L to ≤ 8.0 mmol/L 154/5,666 2.72 1.48 (1.18, 1.84) 351/11,645 3.01 1.79 (1.47, 2.17) FPG > 8.0 mmol/L 57/1,397 4.08 2.26 (1.66, 3.06) 90/3,017 2.98 1.82 (1.39, 2.37) Grouping Sex stratification (P for interaction = 0.561) Men Women Events/person−years Incidence rate HR (95% CI) Events/person−years Incidence rate HR (95% CI) Diabetes duration < 10 y FPG < 6.1 mmol/L 256/10,260 2.50 Ref. 73/5632 1.30 Ref. FPG ≥ 6.1 mmol/L to ≤ 8.0 mmol/L 590/21,513 2.74 1.24 (1.07, 1.44) 185/13276 1.39 1.33 (1.01, 1.75) FPG > 8.0 mmol/L 117/3,964 2.95 1.31 (1.05, 1.64) 49/2588 1.89 1.82 (1.26, 2.62) Diabetes duration ≥ 10 y FPG < 6.1 mmol/L 128/3,798 3.37 1.29 (1.04, 1.60) 60/2873 2.09 1.42 (1.01, 2.02) FPG ≥ 6.1 mmol/L to ≤ 8.0 mmol/L 348/9,901 3.51 1.60 (1.36, 1.89) 157/7410 2.12 1.79 (1.35, 2.38) FPG > 8.0 mmol/L 93/2,258 4.12 1.85 (1.45, 2.36) 54/2156 2.50 2.16 (1.51, 3.10) Note. Generally, the models were adjusted for age, sex, marital status, education level, BMI, drinking status, physical activity, smoking status, diabetes medication compliance, atrial fibrillation, chronic respiratory disease, chronic kidney disease, hypertension, inflammatory arthropathy, and diabetes duration. For sex stratification, sex itself was not adjusted for. CI, confidence interval; HR, hazard ratio.
下载: 导出CSV
S7. Subgroup analysis for the joint associations of glycemic control and diabetes duration with risk of myocardial infarction (MI) among diabetic individuals with coronary heart disease (CHD) in Shenzhen, China, stratified by comorbidities, including atrial fibrillation, chronic kidney disease, chronic respiratory disease, hypertension, and inflammatory arthropathy
Grouping No Yes Events/person−years Incidence rate HR (95% CI) Events/person−years Incidence rate HR (95% CI) Atrial fibrillation stratification (P for interaction = 0.121) Diabetes duration < 10 y FPG < 6.1 mmol/L 316/14,996 2.11 Reference 13/896 1.45 Reference FPG ≥ 6.1 mmol/L to ≤ 8.0 mmol/L 733/32,909 2.23 1.23 (1.08, 1.40) 42/1,880 2.23 1.75 (0.93, 3.30) FPG > 8.0 mmol/L 160/6,166 2.59 1.43 (118, 1.73) 6/385 1.56 1.22 (0.46, 3.26) Diabetes duration ≥ 10 y FPG < 6.1 mmol/L 172/6,200 2.77 1.26 (1.04, 1.52) 16/471 3.40 2.38 (1.13, 5.02) FPG ≥ 6.1 mmol/L to ≤ 8.0 mmol/L 464/16,195 2.87 1.58 (1.37, 1.83) 41/1,116 3.67 2.96 (1.56, 5.61) FPG > 8.0 mmol/L 135/4,172 3.24 1.88 (1.53, 2.31) 12/242 4.97 4.42 (1.95, 10.01) Chronic kidney disease stratification (P for interaction = 0.272) Diabetes duration < 10 y FPG < 6.1 mmol/L 290/14,444 2.01 Reference 39/1,448 2.69 Reference FPG ≥ 6.1 mmol/L to ≤ 8.0 mmol/L 667/31,881 2.09 1.20 (1.05, 1.38) 108/2,908 3.71 1.58 (1.09, 2.29) FPG > 8.0 mmol/L 143/5,893 2.43 1.41 (1.15, 1.72) 23/659 3.49 1.52 (0.90, 2.58) Diabetes duration ≥ 10 y FPG < 6.1 mmol/L 134/5,548 2.42 1.17 (0.95, 1.44) 54/1,122 4.81 1.90 (1.25, 2.89) FPG ≥ 6.1 mmol/L to ≤ 8.0 mmol/L 391/14,457 2.70 1.62 (1.38, 1.89) 114/2,854 3.99 1.89 (1.30, 2.74) FPG > 8.0 mmol/L 105/3,541 2.97 1.92 (1.54, 2.42) 42/873 4.81 2.39 (1.53, 3.74) Chronic respiratory disease stratification (P for interaction = 0.491) Diabetes duration < 10 y FPG < 6.1 mmol/L 305/14,483 2.11 Reference 24/1,409 1.70 Reference FPG ≥ 6.1 mmol/L to ≤ 8.0 mmol/L 707/31,681 2.23 1.24 (1.08, 1.42) 68/3,109 2.19 1.39 (0.87, 2.23) FPG > 8.0 mmol/L 151/5,964 2.53 1.41 (1.16, 1.72) 15/587 2.56 1.54 (0.80, 2.99) Diabetes duration ≥ 10 y FPG < 6.1 mmol/L 170/5,966 2.85 1.28 (1.06, 1.55) 18/705 2.55 1.57 (0.83, 2.94) FPG ≥ 6.1 mmol/L to ≤ 8.0 mmol/L 447/15,527 2.88 1.61 (1.39, 1.87) 58/1,784 3.25 1.92 (1.17, 3.12) FPG > 8.0 mmol/L 131/4,059 3.23 1.87 (1.52, 2.30) 16/355 4.51 3.56 (1.84, 6.88) Inflammatory arthropathy stratification (P for interaction = 0.463) Diabetes duration < 10 y FPG < 6.1 mmol/L 311/15,057 2.07 Reference 18/835 2.15 Reference FPG ≥ 6.1 mmol/L to ≤ 8.0 mmol/L 727/33,108 2.20 1.23 (1.08, 1.41) 48/1,682 2.85 1.29 (0.73, 2.25) FPG > 8.0 mmol/L 152/6,237 2.44 1.36 (1.12, 1.66) 14/314 4.45 2.23 (1.08, 4.62) Diabetes duration ≥ 10 y FPG < 6.1 mmol/L 176/6,361 2.77 1.29 (1.07, 1.56) 12/309 3.88 1.23 (0.57, 2.65) FPG ≥ 6.1 mmol/L to ≤ 8.0 mmol/L 472/16,381 2.88 1.64 (1.41, 1.89) 33/929 3.55 1.68 (0.91, 3.08) FPG > 8.0 mmol/L 140/4,196 3.34 2.01 (1.64, 2.47) 7/218 3.21 1.49 (0.60, 3.74) Note. Generally, the models were adjusted for age, sex, marital status, education level, BMI, drinking status, physical activity, smoking status, diabetes medication compliance, atrial fibrillation, chronic respiratory disease, chronic kidney disease, hypertension, inflammatory arthropathy, and diabetes duration. Note that the stratification factor itself was not adjusted for. CI, confidence interval; HR, hazard ratio.
下载: 导出CSV
-
[1] Arnold SV, Bhatt DL, Barsness GW, et al. Clinical management of stable coronary artery disease in patients with type 2 diabetes mellitus: a scientific statement from the american heart association. Circulation, 2020; 141, e779−806. [2] Goldfine AB, Phua EJ, Abrahamson MJ. Glycemic management in patients with coronary artery disease and prediabetes or type 2 diabetes mellitus. Circulation, 2014; 129, 2567−73. doi: 10.1161/CIRCULATIONAHA.113.006634 [3] Rodríguez-Gutiérrez R, Millan-Alanis JM, Barrera FJ, et al. Value of patient-centered glycemic control in patients with type 2 diabetes. Curr Diabetes Rep, 2021; 21, 63. doi: 10.1007/s11892-021-01433-0 [4] ElSayed NA, Aleppo G, Aroda VR, et al. 6. Glycemic targets: standards of care in diabetes-2023. Diabetes Care, 2023; 46, S97−110. doi: 10.2337/dc23-S006 [5] Cardoso CRL, Leite NC, Salles GF. Differential effects of treatment targets on risks of adverse outcomes according to diabetes duration, age and complications: can these characteristics be used to individualize diabetes treatment? The Rio de Janeiro type 2 diabetes cohort. J Diabetes Complications, 2022; 36, 108124. doi: 10.1016/j.jdiacomp.2021.108124 [6] Arnold SV, Kosiborod M, Wang JY, et al. Burden of cardio-renal-metabolic conditions in adults with type 2 diabetes within the Diabetes Collaborative Registry. Diabetes Obes Metab, 2018; 20, 2000−3. doi: 10.1111/dom.13303 [7] Chen JY, Yin D, Dou KF. Intensified glycemic control by HbA1c for patients with coronary heart disease and Type 2 diabetes: a review of findings and conclusions. Cardiovasc Diabetol, 2023; 22, 146. doi: 10.1186/s12933-023-01875-8 [8] Li FR, Wang S, Li X, et al. Multimorbidity and mortality among older patients with coronary heart disease in Shenzhen, China. J Geriatr Cardiol, 2024; 21, 81−9. doi: 10.26599/1671-5411.2024.01.005 [9] Halberg IB, Lyby K, Wassermann K, et al. Efficacy and safety of oral basal insulin versus subcutaneous insulin glargine in type 2 diabetes: a randomised, double-blind, phase 2 trial. Lancet Diabetes Endocrinol, 2019; 7, 179−88. doi: 10.1016/S2213-8587(18)30372-3 [10] American Diabetes Association. 6. Glycemic targets: standards of medical care in diabetes-2020. Diabetes Care, 2020; 43, S66−76. doi: 10.2337/dc20-S006 [11] Li FR, Chen PL, Lv YB, et al. Association between plasma 25-hydroxyvitamin D concentrations and incident activities of daily living disability: a longitudinal community-based cohort study. J Am Med Dir Assoc, 2021; 22, 1946-52. e3. [12] Kassaian SE, Goodarzynejad H, Boroumand MA, et al. Glycosylated hemoglobin (HbA1c) levels and clinical outcomes in diabetic patients following coronary artery stenting. Cardiovasc Diabetol, 2012; 11, 82. doi: 10.1186/1475-2840-11-82 [13] You HZ, Hou XP, Zhang H, et al. Effect of glycemic control and glucose fluctuation on in-hospital adverse outcomes after on-pump coronary artery bypass grafting in patients with diabetes: a retrospective study. Diabetol Metab Syndr, 2023; 15, 20. doi: 10.1186/s13098-023-00984-4 [14] Hoogwerf BJ. Does intensive therapy of type 2 diabetes help or harm? Seeking accord on ACCORD. Cleve Clin J Med, 2008; 75, 729−37. doi: 10.3949/ccjm.75.10.729 [15] Peter PR, Lupsa BC. Personalized management of type 2 diabetes. Curr Diabetes Rep, 2019; 19, 115. doi: 10.1007/s11892-019-1244-0 [16] Terry T, Raravikar K, Chokrungvaranon N, et al. Does aggressive glycemic control benefit macrovascular and microvascular disease in type 2 diabetes?: Insights from ACCORD, ADVANCE, and VADT. Curr Cardiol Rep, 2012; 14, 79−88. doi: 10.1007/s11886-011-0238-6 [17] Li FR, Yang HL, Zhou R, et al. Diabetes duration and glycaemic control as predictors of cardiovascular disease and mortality. Diabetes Obes Metab, 2021; 23, 1361−70. doi: 10.1111/dom.14348 [18] Yang HH, Li FR, Chen ZK, et al. Duration of diabetes, glycemic control, and risk of heart failure among adults with diabetes: a cohort study. J Clin Endocrinol Metab, 2023; 108, 1166−72. doi: 10.1210/clinem/dgac642 [19] Misra S, Ke C, Srinivasan S, et al. Current insights and emerging trends in early-onset type 2 diabetes. Lancet Diabetes Endocrinol, 2023; 11, 768−82. doi: 10.1016/S2213-8587(23)00225-5 [20] Zhao MX, Song LL, Sun L, et al. Associations of type 2 diabetes onset age with cardiovascular disease and mortality: the Kailuan study. Diabetes Care, 2021; 44, 1426−32. doi: 10.2337/dc20-2375 [21] Pratley RE, Gilbert M. Clinical management of elderly patients with type 2 diabetes mellitus. Postgrad Med, 2012; 124, 133−43. doi: 10.3810/pgm.2012.01.2526 [22] Geng TT, Wang Y, Lu Q, et al. Associations of new-onset atrial fibrillation with risks of cardiovascular disease, chronic kidney disease, and mortality among patients with type 2 diabetes. Diabetes Care, 2022; 45, 2422−9. doi: 10.2337/dc22-0717 [23] El-Shetry M, Mahfouz R, Frere AF, et al. The interplay between atrial fibrillation and acute myocardial infarction. Br J Hosp Med, 2021; 82, 1−9. [24] Kwon S, Lee SR, Choi EK, et al. Association between atrial fibrillation and diabetes-related complications: a nationwide cohort study. Diabetes Care, 2023; 46, 2240−8. doi: 10.2337/dc23-0931 -

 点击查看大图
计量
- 文章访问数: 8316
- HTML全文浏览量: 4088
- PDF下载量: 66
- 被引次数: 0

 Quick Links