

 下载:
下载:


-
Depressive disorders consistently rank among the most severe mental illnesses and were among the top-25 leading causes of the global disease burden in 2019, according to the Global Burden of Disease (GBD) study[1]. Despite international efforts to prevent and treat mental illnesses, many countries, especially low- and middle-income countries, fell short of their mental health goals in 2020 due to insufficient investment in the mental health sector[2]. Therefore, special attention must be paid to the global burden of depressive disorders to achieve the United Nations Sustainable Development Goals[3], which focus on reducing premature mortality from noncommunicable diseases (NCDs) as well as promoting mental health and well-being by 2030.
BRICS, which initially included Brazil, Russia, India, China, and South Africa due to their fast-growing economies, was later, in 2024, joined by Saudi Arabia, Iran, Egypt, the United Arab Emirates (UAE), and Ethiopia, expanding to 10 countries and finally forming BRICS Plus. At present, BRICS Plus economies account for nearly half of the world's population and bear approximately 40% of the global disease burden[4]. These countries have witnessed a consistent increase in the number of cases of depressive disorders from 1990 to 2019, which may be attributed to their rapid economic development and the heightened vulnerability of individuals facing adverse circumstances such as poverty, violence, and inequality[5,6]. The proportion of disability-adjusted life years (DALYs) attributable to depressive disorders relative to NCDs increased in BRICS Plus countries between 1990 and 2019, despite well-controlled infectious and cardiovascular diseases. At present, the systematic research across the BRICS Plus countries remains scarce, even in the context of research on the depressive disorder burden in numerous studies at the global, regional, and national levels[1,7-11]. For example, most existing studies have focused on the depressive disorder burden in single countries (e.g., China), with a glaring absence of cross-country comparative analyses[10,11]. Furthermore, these countries paid disproportionately little attention to mental health, despite their positive momentum in health cooperation[6]. The term "mental health" was introduced at the 2013 BRICS health ministers' meeting and was elevated to the leadership level in 2015[12]. However, BRICS Plus countries have largely neglected and unsatisfactory mental health management[10,12], accompanied by the substantial global psychological burden of COVID-19[13]. Unfortunately, the mental health impact of the COVID-19 pandemic was still less appreciated in BRICS Plus[14,15].
In this context, in order to assess the impact of current interventions and guide future policy, it is critical to understand recent temporal trends in depressive disorders across various BRICS Plus countries. The age-period-cohort (APC) model is commonly used to study trends in mental disorder burdens, providing a comprehensive description of the incidence and burden of mental illness[16]. In epidemiology, age effects refer to differences in disease burdens across different age groups, cohort effects indicate varying risks among individuals born in different cohorts, and period effects impact risk for all age groups and cohorts[17]. Therefore, distinguishing between period and cohort effects may benefit the assessment of the success of early interventions and identify future targets[18].
Accordingly, this study aimed to describe the trends in the age-standardized rates of prevalence, incidence, and DALYs (age-standardized prevalence rate [ASPR], age-standardized incidence rate [ASIR], and age-standardized death rate [ASDR]) of depressive disorders in 10 BRICS Plus countries from 1990 to 2021 using GBD 2021 data. The APC model was then used to explore the trend as well as the age, period, and cohort effects of the depressive disorder burden. In addition, we projected the depressive disorder burden in BRICS Plus countries for 2022–2050. Finally, we explored the relationships among ASPRs, ASIRs, and ASDRs attributable to depressive disorders using the sociodemographic index (SDI).
-
The GBD 2021 provides information on 371 diseases and injuries, including incidence, prevalence, mortality, years of life lost, years lived with disability, and DALYs for 204 countries and territories, between 1990 and 2021, which has previously been documented in detail[19]. This work represents the de-identified data from the second source compiled by the Institute for Health Metrics and Evaluation at the University of Washington. The Institutional Review Board of the University of Washington reviewed and approved the waiver of the requirement for informed consent.
We conducted a secondary analysis of data sourced from GBD 2021 (https://vizhub. healthdat. sgbd-results/), accessed in June 2024, focusing on changing trends in the prevalence, incidence, and DALYs of depressive disorders in BRICS Plus countries. Additionally, high-income North America was selected as the comparative benchmark for analyzing the depressive disorder burden, given its lower burden of NCDs, coupled with its economic development and relatively high health coverage[19].
-
Depressive disorders were defined according to the Diagnostic and Statistical Manual of Mental Disorders (DSM-IV-TR) or the International Classification of Diseases, 10th Revision (ICD-10), which comprises major depressive disorders and dysthymias[19]. A systematic literature review was conducted with eligible data acquired using PsycINFO, Embase, and PubMed, supplemented by gray literature searches and expert consultations. In the two-step data analysis, after bias testing and adjustment in epidemiological estimates reported across studies, DisMod-MR 2.1 was used to model "gold standard" estimates (i.e., estimates using the required data collection methods with no bias adjustment required) and adjusted estimates in the meta-regression analysis[20]. Ultimately, the prevalence, DALYs, and incidence of depressive disorders were obtained for 204 countries and territories worldwide from 1990 to 2021.
The SDI is a geometric mean developed by the GBD project researchers to estimate health outcomes and serves as a comprehensive measure of developmental status. This includes the total fertility rate under the age of 25 years (TFU25), average education for individuals aged 15 years and older (EDU15+), and lag-distributed income (LDI) per capita. With a range of 0–1, an SDI value of 0 represents the theoretical minimum level of development relevant to health for a given location, and a value of 1 signifies the theoretical maximum level[21].
-
This study computed the combined age-specific numbers, rates, and age-standardized rates for BRICS Plus countries based on previously published methods and the GBD framework[18,22]. Specifically, the age-specific incidence and DALYs across all included countries were summed to obtain the overall counts for BRICS Plus countries. Age-specific population data from each country were aggregated to calculate the yearly population by age group using the BRICS Plus country data. On this basis, age-specific incidence and DALYs were estimated. Finally, the GBD 2021 standard population was used to compute the age-standardized rates for each year.
The depressive disorder burden was analyzed by sex (male and female) and age group using the BRICS Plus countries between 1990 and 2021. We reported the age-standardized rates and numbers with 95% uncertainty intervals (UIs) for prevalence, DALYs, and incidences. First, we described the changes in population size and the proportion of the world’s population represented by the BRICS Plus countries from 1990 to 2021. Second, we depicted the depressive disorder burden concerning its significance for mental disorders and NCDs in 2021. This study also outlines trends in the number and age-standardized rates of depressive disorders over time. Finally, we examined the associations between the ASPR, ASIR, and ASDR and individuals with depression using the SDIs.
An APC model was employed to estimate the independent effects of age, period, and birth cohort on the depressive disorder burden in BRICS Plus countries and high-income North American countries. In accordance with previous studies[23,24], and to ensure congruence between age and period intervals, which characteristically encompass 5-year age groups in conjunction with 5-year periods, this study incorporated data extending over the 30-year span from 1992 to 2021. Noticeably, the age group of 10–74 years was emphasized, given the relatively lower number of patients with depressive disorders in the remaining age groups, which might compromise the stability of the model. The most significant parameter in this model was net drift, which represents the annual percentage change in depressive disorder burden and the logarithmic trend of the period and cohort in the entire population[25]. Local drift is the result of birth cohort effects. If the local drift was significant, a single summary of age-standardized rate curves and estimated annual percentage change values could not fully describe the temporal trends in each age group[25]. A significant change in depressive disorder burden was defined as a drift of ± 0.5% or more per year. The longitudinal age curve consisted of continuous 5-year intervals. Relative risks were calculated as the ratio of age-specific rates in each period, with the survey year period of 2012–2016 as the reference period. The cohort relative risk was the ratio of the age-specific rates in 18 consecutive cohorts, with 1985–1989 as the reference.
Furthermore, this study predicted changing trends in depressive disorder burden from 2022 to 2050 in both BRICS Plus countries and high-income North America. Disease burden prediction was based on the Bayesian age-period-cohort (BAPC) model[26], which has been confirmed to have greater accuracy in predicting disease burdens[27].
Finally, joinpoint regression analysis (https://surveillance, cancer. gov/joinpoint/) was conducted to further supplement the changing trends of depressive disorder burdens in each country, as a complementary result to the APC model[28]. For each indicator, we fitted models with 0 to 7 joinpoints and evaluated them using the widely applicable Bayesian Information Criterion (WBIC). The model with the lowest WBIC score was determined as the "best" model. Additionally, population trends in each segment were assessed by calculating the annual percentage changes and confidence intervals. The average annual percent change (AAPC) in the APC was used as a summary measure of the pre-specified fixed-interval trends.
-
In 2021, BRICS Plus countries had a population of 3,606.6 million, accounting for 45.70% of the global population. India (17.92%) and China (18.03%) had the largest populations. Compared with 1990, the proportion of the population in BRICS Plus countries other than Russia has increased (Table 1).
Table 1. Characteristics of the prevalence of depressive disorders in BRICS Plus countries and high-income North America from 1992 to 2021
Variables BRICS-plus High-income North America India 1990 2019 2021 1990 2019 2021 1990 2019 2021 Population Total (million) 2,546.8 3,558.6 3,606.6 281.4 366.9 370.2 853.1 1,388.6 1,414.5 Percentage of global population (%) 47.75 45.95 45.7 5.28 4.74 4.69 15.99 17.93 17.92 Prevalence number (million) 82.2 134.1 152.6 11.5
(10.4, 12.8)17.1
(15.6, 18.9)20.8
(18.8, 23.1)29.1
(25.9, 33.0)52.0
(47.0, 58.2)62.5
(56.0, 70.5)Relative proportion (%)# 3.60 4.08 4.57 4.51 5.03 6.02 3.79 4.04 4.77 Relative proportion (%)* 25.26 28.94 30.06 26.39 28.45 30.87 23.77 27.59 29.92 ASPR (per 100,000) 3,600.9 3,453.3 3,842.2 3,817.1
(3,439.5, 4,244.8)4,393.3
(3,986.6, 4,894.9)5,408.3
(4,846.9, 6,049.7)4,205.6
(3,774.2, 4,703.4)3,804.2
(3,460.9, 4,223.3)4,363.1
(3,925.7, 4,880.1)Variables China Brazil Russia 1990 2019 2021 1990 2019 2021 1990 2019 2021 Population Total (million) 1,176.5 1,414.4 1,422.7 148.5 216.8 220.4 151.0 145.9 144.9 Percentage of global population (%) 22.06 18.26 18.03 2.78 2.80 2.79 2.83 1.88 1.84 Prevalence number (million) 34.5
(31.1, 38.4)50.9
(45.8, 56.5)53.1
(47.4, 59.3)5.1
(9.3, 11.7)8.6
(15.7, 18.9)10.7
(18.9, 24.2)5.7
(10.2, 13.0)5.8
(10.4, 13.2)6.8
(12.0, 15.3)Relative proportion (%)# 3.28 3.89 4.03 3.81 4.26 5.17 4.15 4.29 5 Relative proportion (%)* 25.73 30.83 30.45 23.33 23.1 24.93 32.14 33.07 34.18 ASPR (per 100,000) 3,071.8
(2,779.1, 3,404.5)2,825.0
(2,550.4, 3,136.1)2,875.7
(2,590.0, 3,203.4)3,954.1
(3,564.6, 4,422.6)3,602.0
(3,284.4, 3,970.5)4,364.1
(3,881.4, 4,947.3)3,443.0
(3,063.0, 3,900.9)3,277.7
(2,923.5, 3,710.7)3,932.8
(3,503.8, 4,482.6)Variables Iran Egypt Ethiopia 1990 2019 2021 1990 2019 2021 1990 2019 2021 Population Total (million) 57.1 84.4 85.4 55.3 102.3 105.6 50.6 104.5 108.9 Percentage of global population (%) 1.07 1.09 1.08 1.04 1.32 1.34 0.95 1.35 1.38 Prevalence number (million) 2.2
(1.9, 2.6)4.7
(4.1, 5.5)5.2
(4.5, 6.1)1.8
(1.5, 2.2)3.8
(3.2, 4.5)4.5
(3.5, 5.5)1.8
(1.6, 2.0)3.7
(3.2, 4.2)4.3
(3.7, 5.0)Relative proportion (%)# 4.3 5.95 6.49 3.67 4.12 4.74 3.84 3.9 4.37 Relative proportion (%)* 22.49 29.33 29.52 23.52 26.71 28.22 32.42 32.16 33.38 ASPR (per 100,000) 4,901.2
(4,253.0, 5,695.7)5,134.8
(4,449.4, 5,973.9)5,609.4
(4,810.1, 6,488.0)3,907.1
(3,344.4, 4,612.1)4,065.8
(3,507.6, 4,806.0)4,605.4
(3,658.6, 5,580.1)5,339.5
(4,752.0, 6,090.4)4,897.2
(4,380.7, 5,567.6)5,305.7
(4,649.4, 6,114.9)Variables South Africa Saudi Arabia UAE 1990 2019 2021 1990 2019 2021 1990 2019 2021 Population Total (million) 37.0 56.0 56.9 15.9 36.2 37.7 1.9 9.5 9.6 Percentage of global population (%) 0.69 0.72 0.72 0.3 0.47 0.48 0.04 0.12 0.12 Prevalence number (million) 1.4
(1.2, 1.5)2.5
(2.3, 2.8)3.1
(2.7, t3.5)0.5
(0.5, 0.7)1.7
(1.5, 2.1)2.0
(1.6, 2.5)0.1
(0.1, 0.1)0.4
(0.4, 0.5)0.5
(0.4, 0.7)Relative proportion (%)# 4.26 4.95 5.98 3.75 5.14 5.61 4.31 4.93 5.69 Relative proportion (%)* 33.6 36.48 38.25 27.31 32.59 33.71 30.83 32.79 34.69 ASPR (per 100,000) 4,500.7
(4,081.3, 5,001.5)4,469.9
(4,054.1, 4,979.9)5,310.2
(4,712.5, 6,036.6)4,157.5
(3,573.2, 4,902.3)4,356.9
(3,814.5, 5,083.0)4,672.5
(3,737.3, 5,815.4)4,030.0
(3,503.8, 4,699.6)3,773.3
(3,255.0, 4,415.6)4,332.4
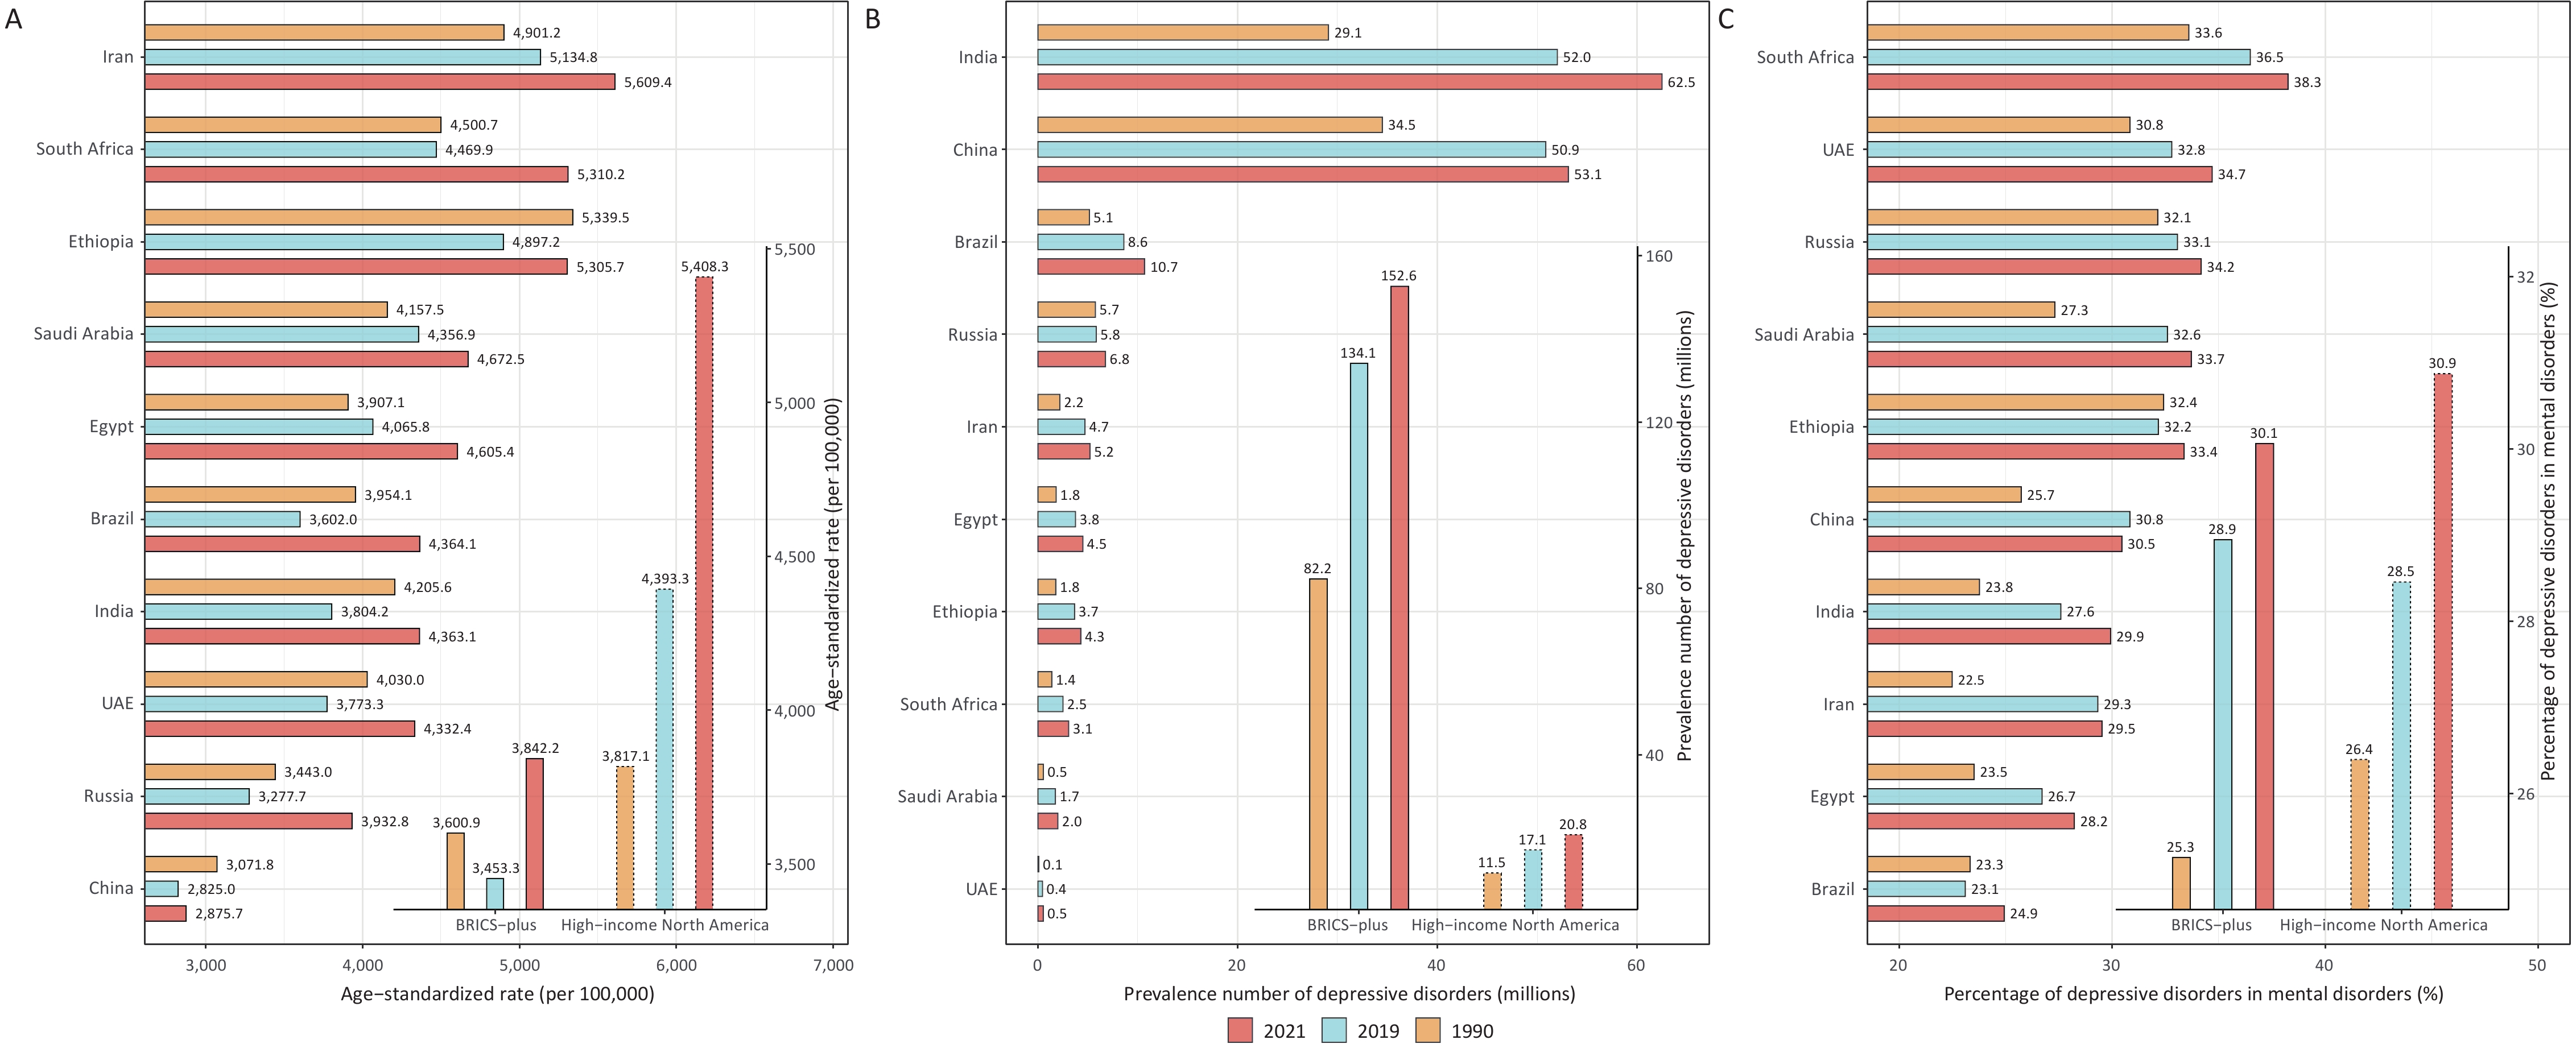
(3,484.9, 5,423.0)Note. BRICS Plus = India, China, Brazil, Russia, Iran, Egypt, Ethiopia, South Africa, Saudi Arabia, and the UAE (United Arab Emirates); ASPR = Age-standardized prevalence rate. #Relative proportion equals (number of individuals with depressive disorders) / (number of individuals with NCDs). *Relative proportion equals (number of individuals with depressive disorders) / (number of individuals with mental disorders). In 2021, the prevalence of depressive disorders was calculated to be 152.6 million people, resulting in 23.7 million DALYs (Table 1 and Supplementary Table S1–S2). The prevalence significantly increased compared to that in 1990 (85.58%) and 2019 (13.80%), and was 7.51 times greater than in high-income North America. India (62.5 million) and China (53.1 million) had the highest number of reports. Depressive disorders have become the most prevalent mental disorder in BRICS Plus countries, accounting for 24.93%–38.25% of the total mental disorders, showing a rising trend since 1990. The ratio of depressive disorder burden to NCDs followed a similar trend (Table 1 and Supplementary Table S1–S2). These findings underscore the urgent need to address the burden of depressive disorders in the BRICS Plus countries.
The ASPR, ASIR, and ASDR exhibited similar trends in the BRICS Plus countries, which were lower than those observed in high-income North America. The ASPR in BRICS Plus countries decreased by 4.10% from 1990 to 2019, dropping from 3,600.9 to 3,453.3 per 100,000 population. However, there was an 11.26% increase in this rate from 2019 to 2021. In contrast, high-income North America experienced a continuous increase of 41.68% from 1990 to 2021. Iran has the highest burden among the BRICS Plus countries, with an ASPR of 5,609.4 (95% UI: 4,810.1–6,488.0) per 100,000 people in 2021. In contrast, China reported the lowest burden, with an ASPR of 2,875.7 (95% UI: 2,590.0–3,203.4) per 100,000 population. From 1990 to 2019, Iran, Egypt, and Saudi Arabia experienced an upward trajectory in ASPR. Between 2019 and 2021, all countries experienced an increase in ASPR, ranging from 1.79% in China to 21.16% in Brazil (Table 1, Figure 1, Supplementary Tables S1–S3, and Supplementary Figures S1–S2).
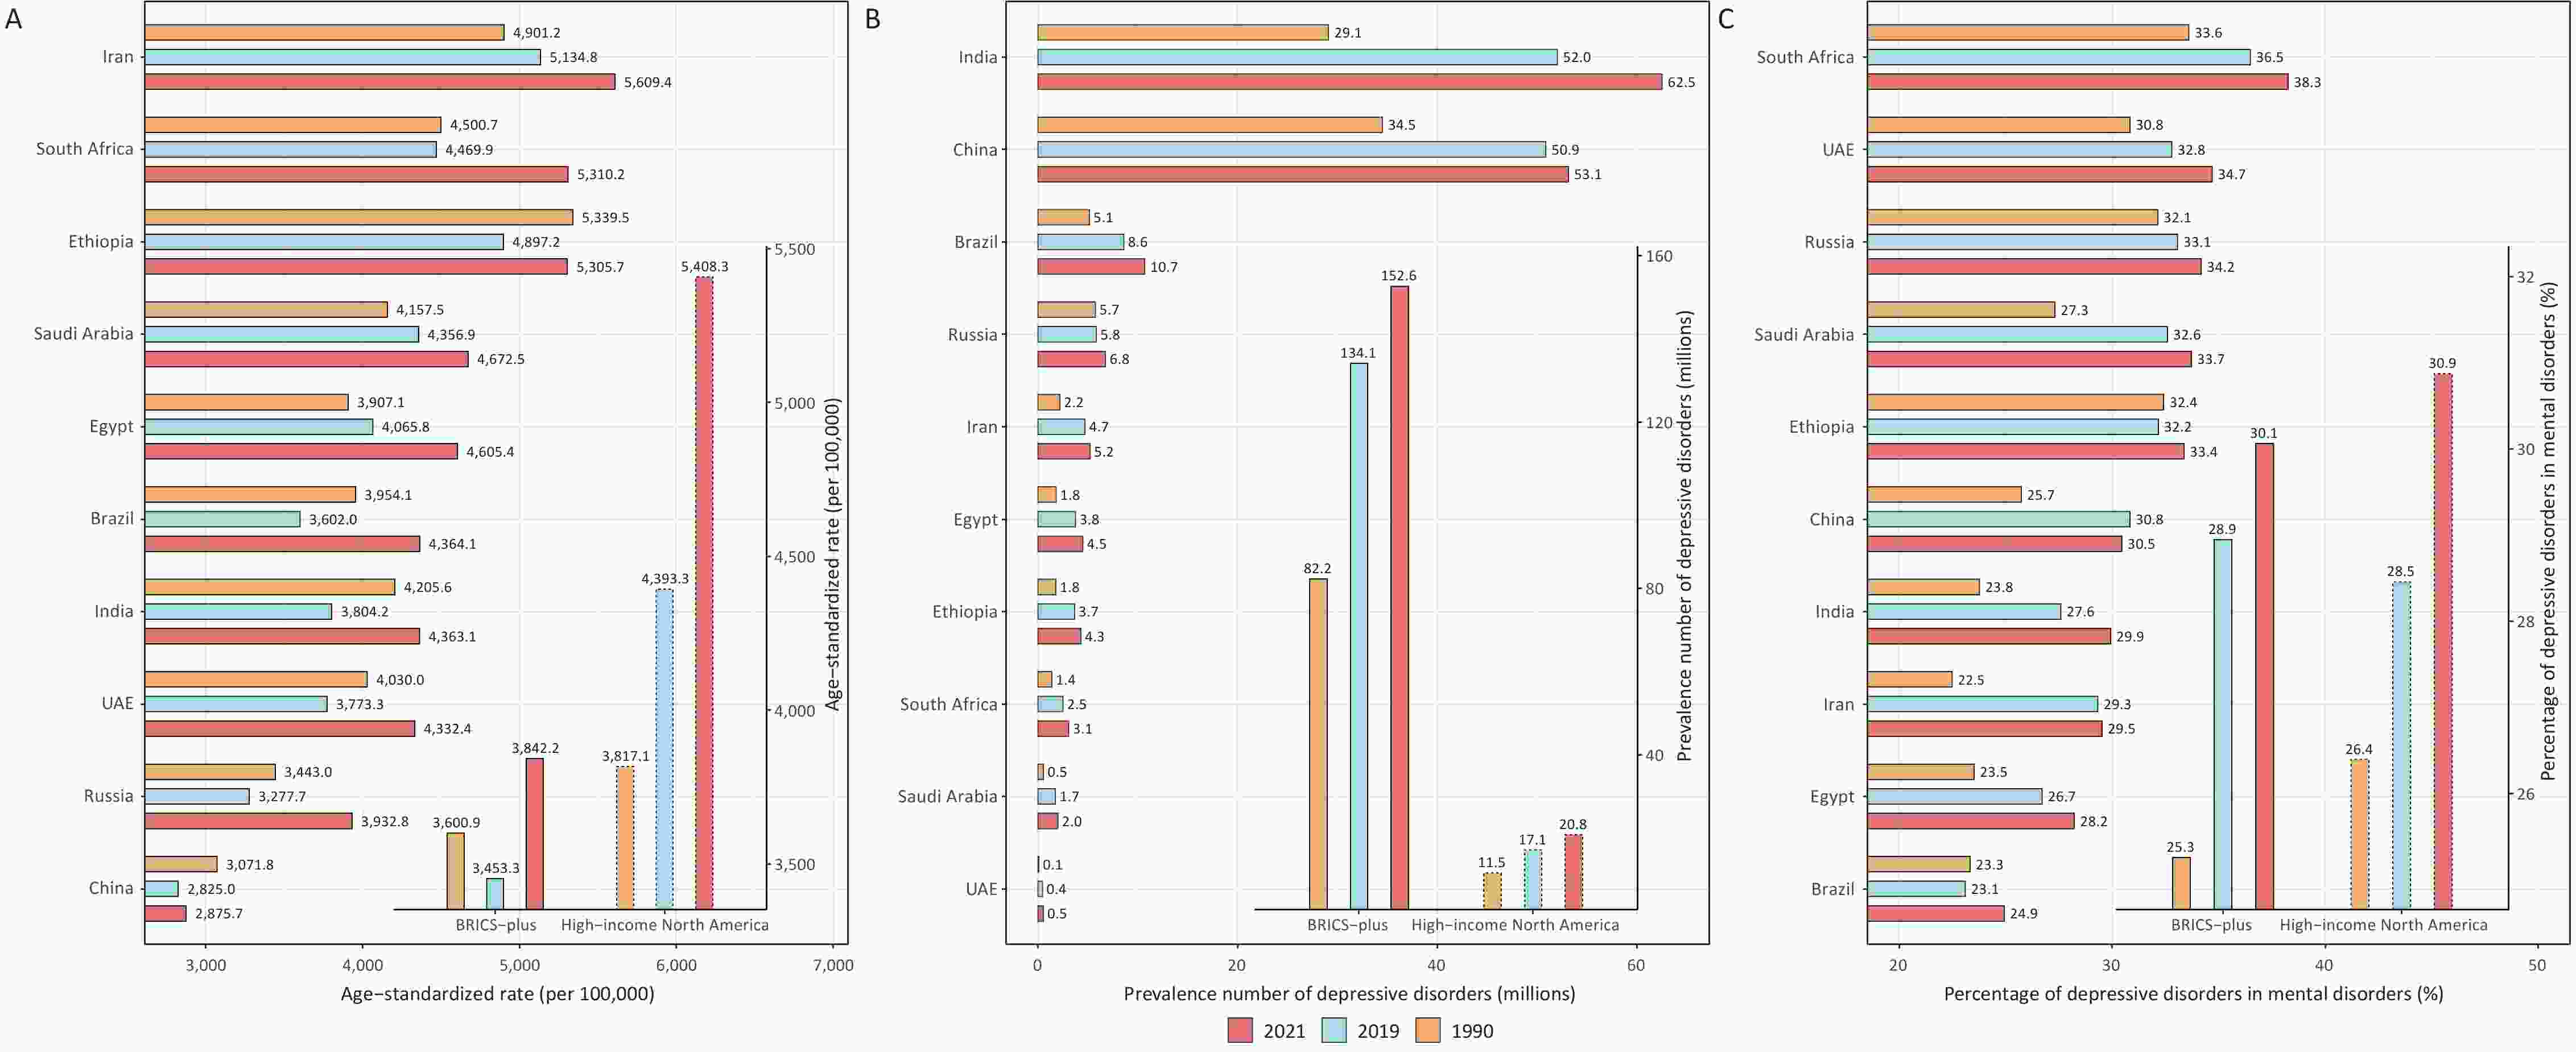
Figure 1. Age-standardized prevalence rates (A), total prevalence (B) of depressive disorders, and relative proportions of prevalences of all depressive disorders attributable to mental disorders (C) in BRICS Plus countries from 1992 to 2021. BRICS Plus = India, China, Brazil, Russia, Iran, Egypt, Ethiopia, South Africa, Saudi Arabia, and the UAE (United Arab Emirates); DALYs = disability-adjusted life years.
-
In this study, net drift was used to represent the overall annual percentage change in the depressive disorder burden during the study period, whereas local drift was used to indicate the annual percentage change in the depressive disorder burden for each age group relative to net drift.
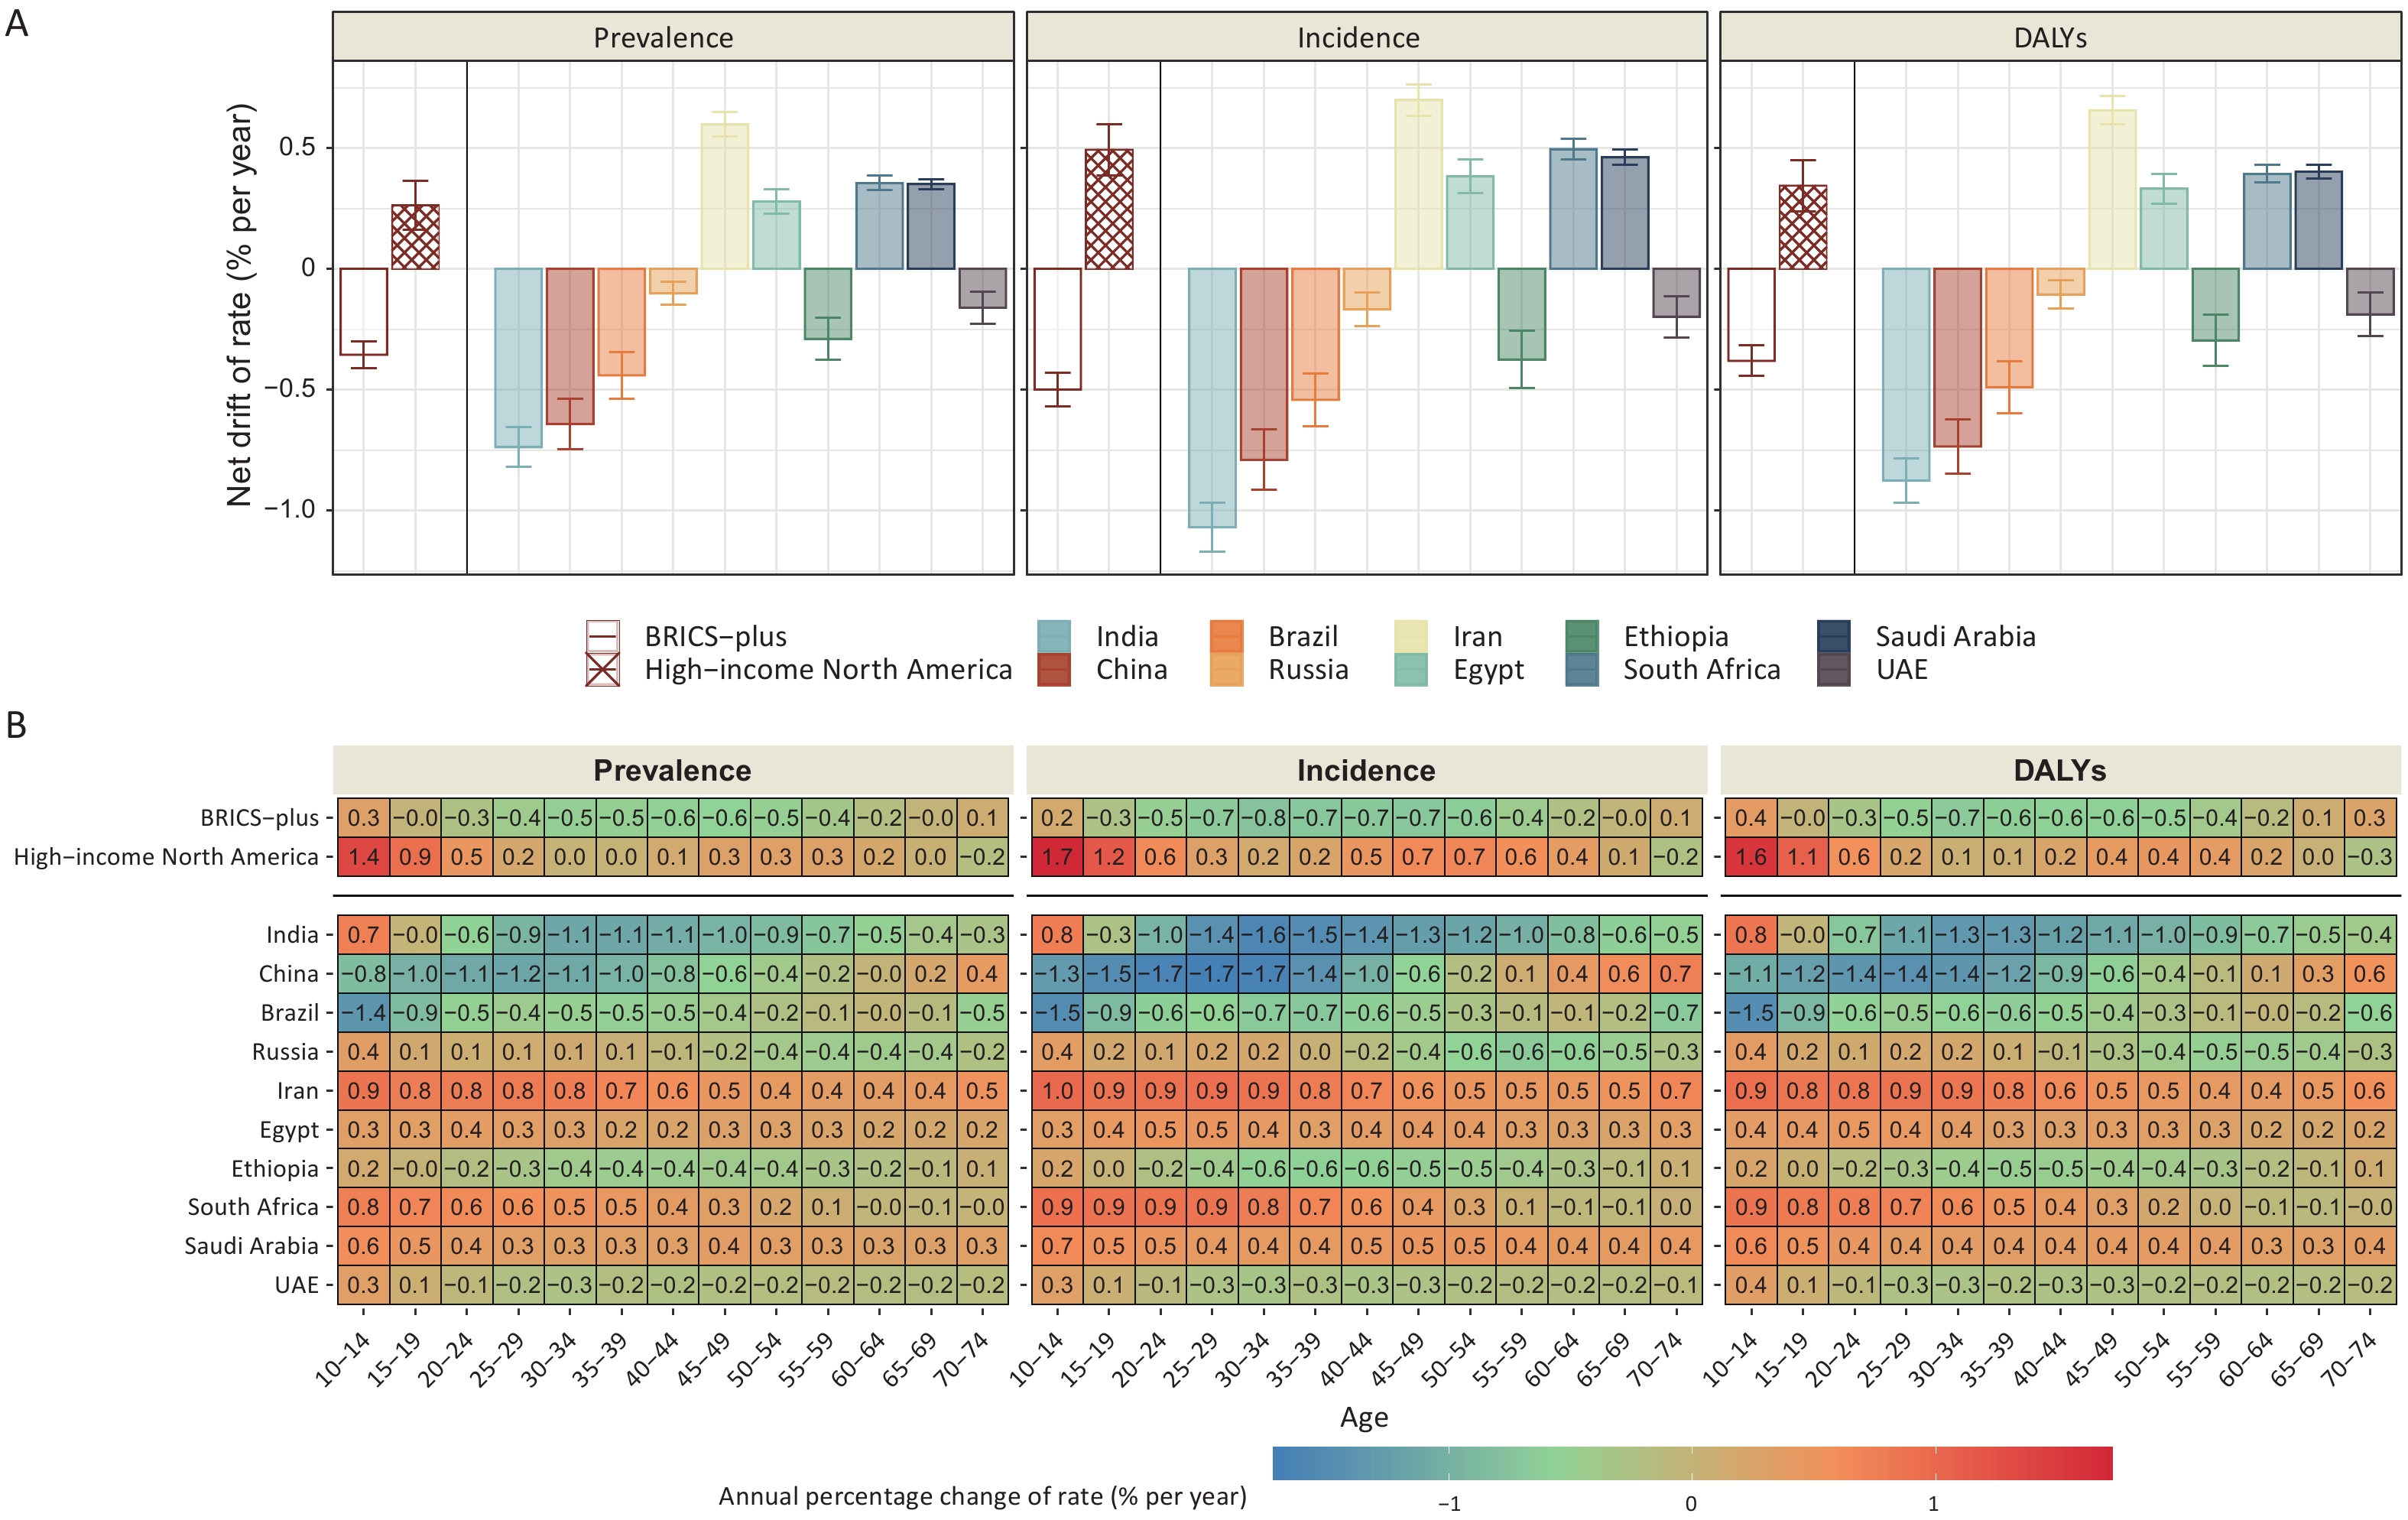
Figure 2, Supplementary Tables S4–S5, and Supplementary Figures S4–S5 display the net and local drifts of the ASPR, ASIR, and ASDR, respectively, for depressive disorders in BRICS Plus countries. The rates were decreasing annually at a rate of 0.36% (95% CI: 0.30–0.41) and 0.26% (95% CI: 0.16–0.36) in BRICS Plus countries and high-income North America, respectively. The most significant decline was observed in India (0.74%, 95% CI: 0.66–0.82), particularly among females (0.92%, 95% CI: 0.84–1.01). Brazil, Ethiopia, the UAE, and Russia exhibited varying degrees of decline. Conversely, Iran, South Africa, Saudi Arabia, and Egypt show increasing trends in the burden of depressive disorders. In particular, there was a substantial increase in the depressive disorder burden among males in Iran (0.75%; 95% CI: 0.70–0.81). Local trends indicated a significant increase in the prevalence of depressive disorders, with local drifts exceeding 0.50% per year among the 10–44-year-old age group in Iran, the 10–34-year-old age group in South Africa, and the 10–14-year-old age group in Saudi Arabia and India. However, there was a pronounced decrease in the depressive disorder burden among the 15–34 year age group in China, the 30–44 year age group in India, and the 10–14 year age group in Brazil, with local drifts exceeding –1.00% per year.
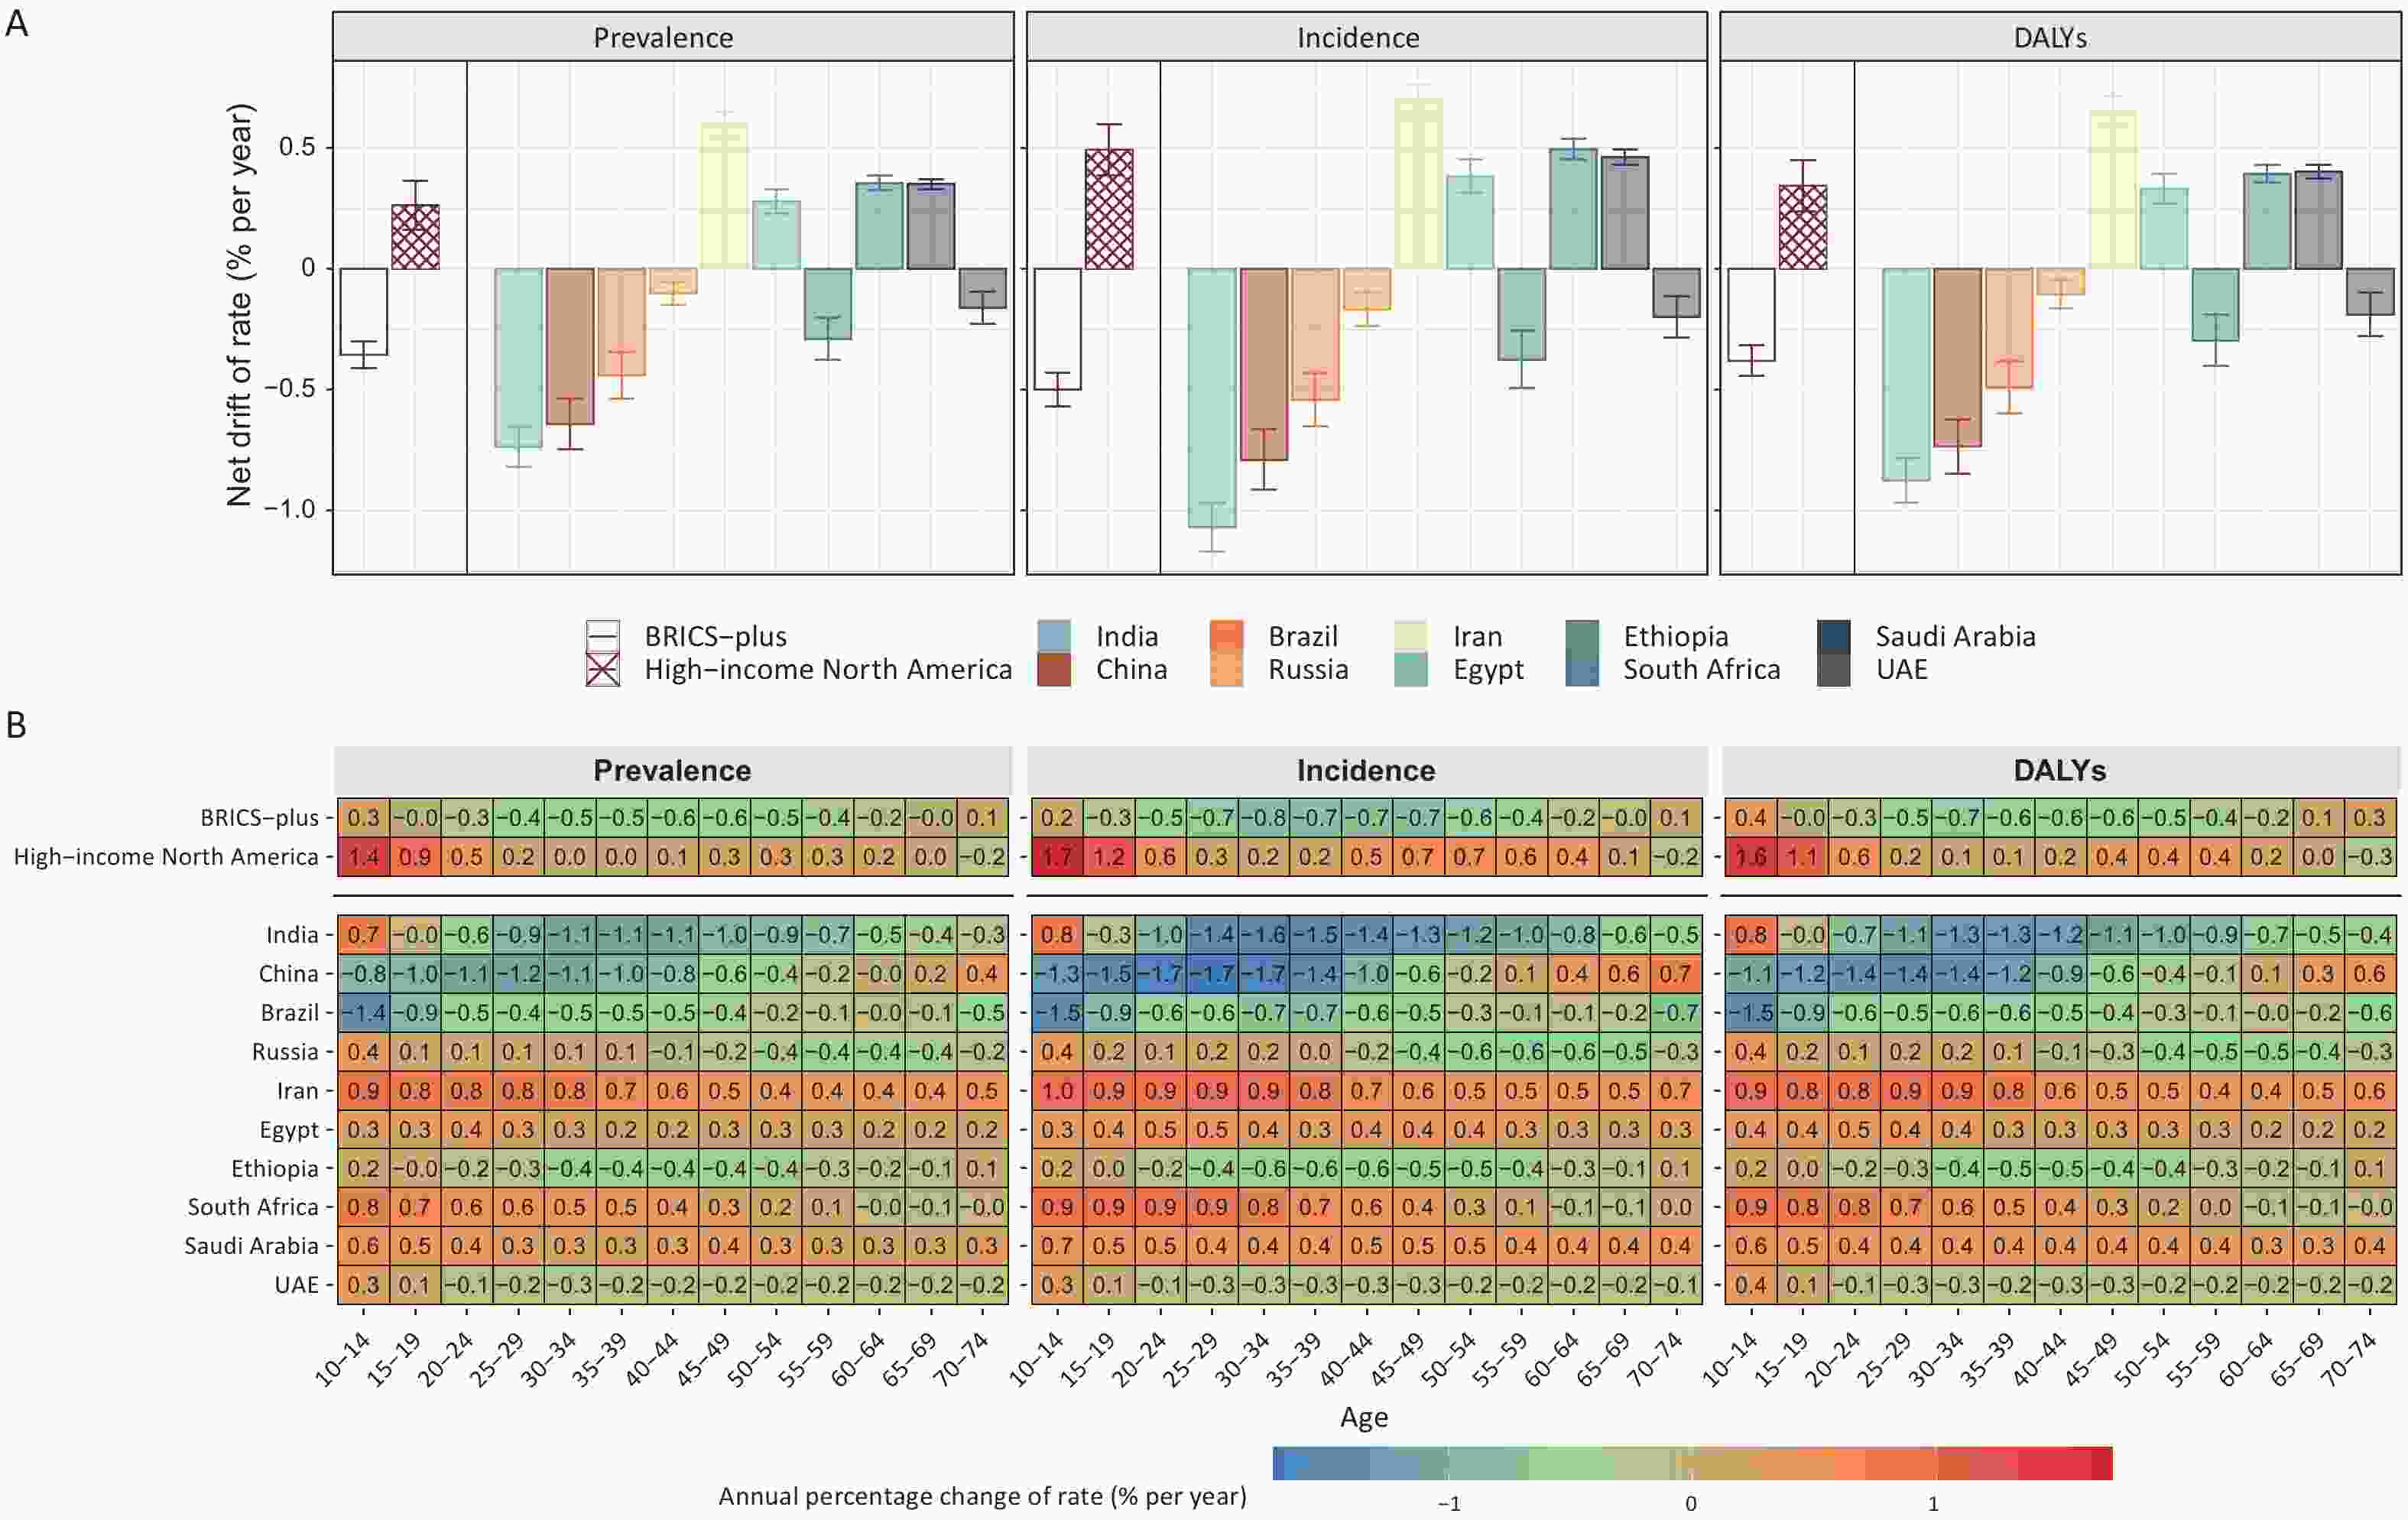
Figure 2. Net drift (A) with local drift values (B) for the prevalence, incidence, and DALYs due to depressive disorders in both sexes in BRICS Plus countries and high-income North America from 1992 to 2021. BRICS Plus = India, China, Brazil, Russia, Iran, Egypt, Ethiopia, South Africa, Saudi Arabia, and the UAE (United Arab Emirates); DALYs = disability-adjusted life years.
-
Figure 3, Supplementary Tables S6–S8, and Supplementary Figures S5–S6 present the estimates of age, period, and cohort effects on depressive disorders, revealing fluctuations in BRICS Plus countries. The age effect indicated that the depressive disorder burden increased with age until a decline began at more than 60 years of age in the BRICS Plus group. In contrast, in high-income North America, the peak prevalence, incidence, and DALYs of depressive disorders occurred in the 40–44, 20–24, and 20–24 year age groups, respectively. Among the 10 BRICS Plus countries, the age effect revealed an increasing trend in the depressive disorder burden across all age groups in South Africa, Russia, Ethiopia, and China. The depressive disorder burden peaked in the 40–44 years age group in the UAE, the 45–49 years age group in Iran, the 55–59 years age group in Saudi Arabia, Egypt, and Brazil, as well as the 60–64 years age group in India.
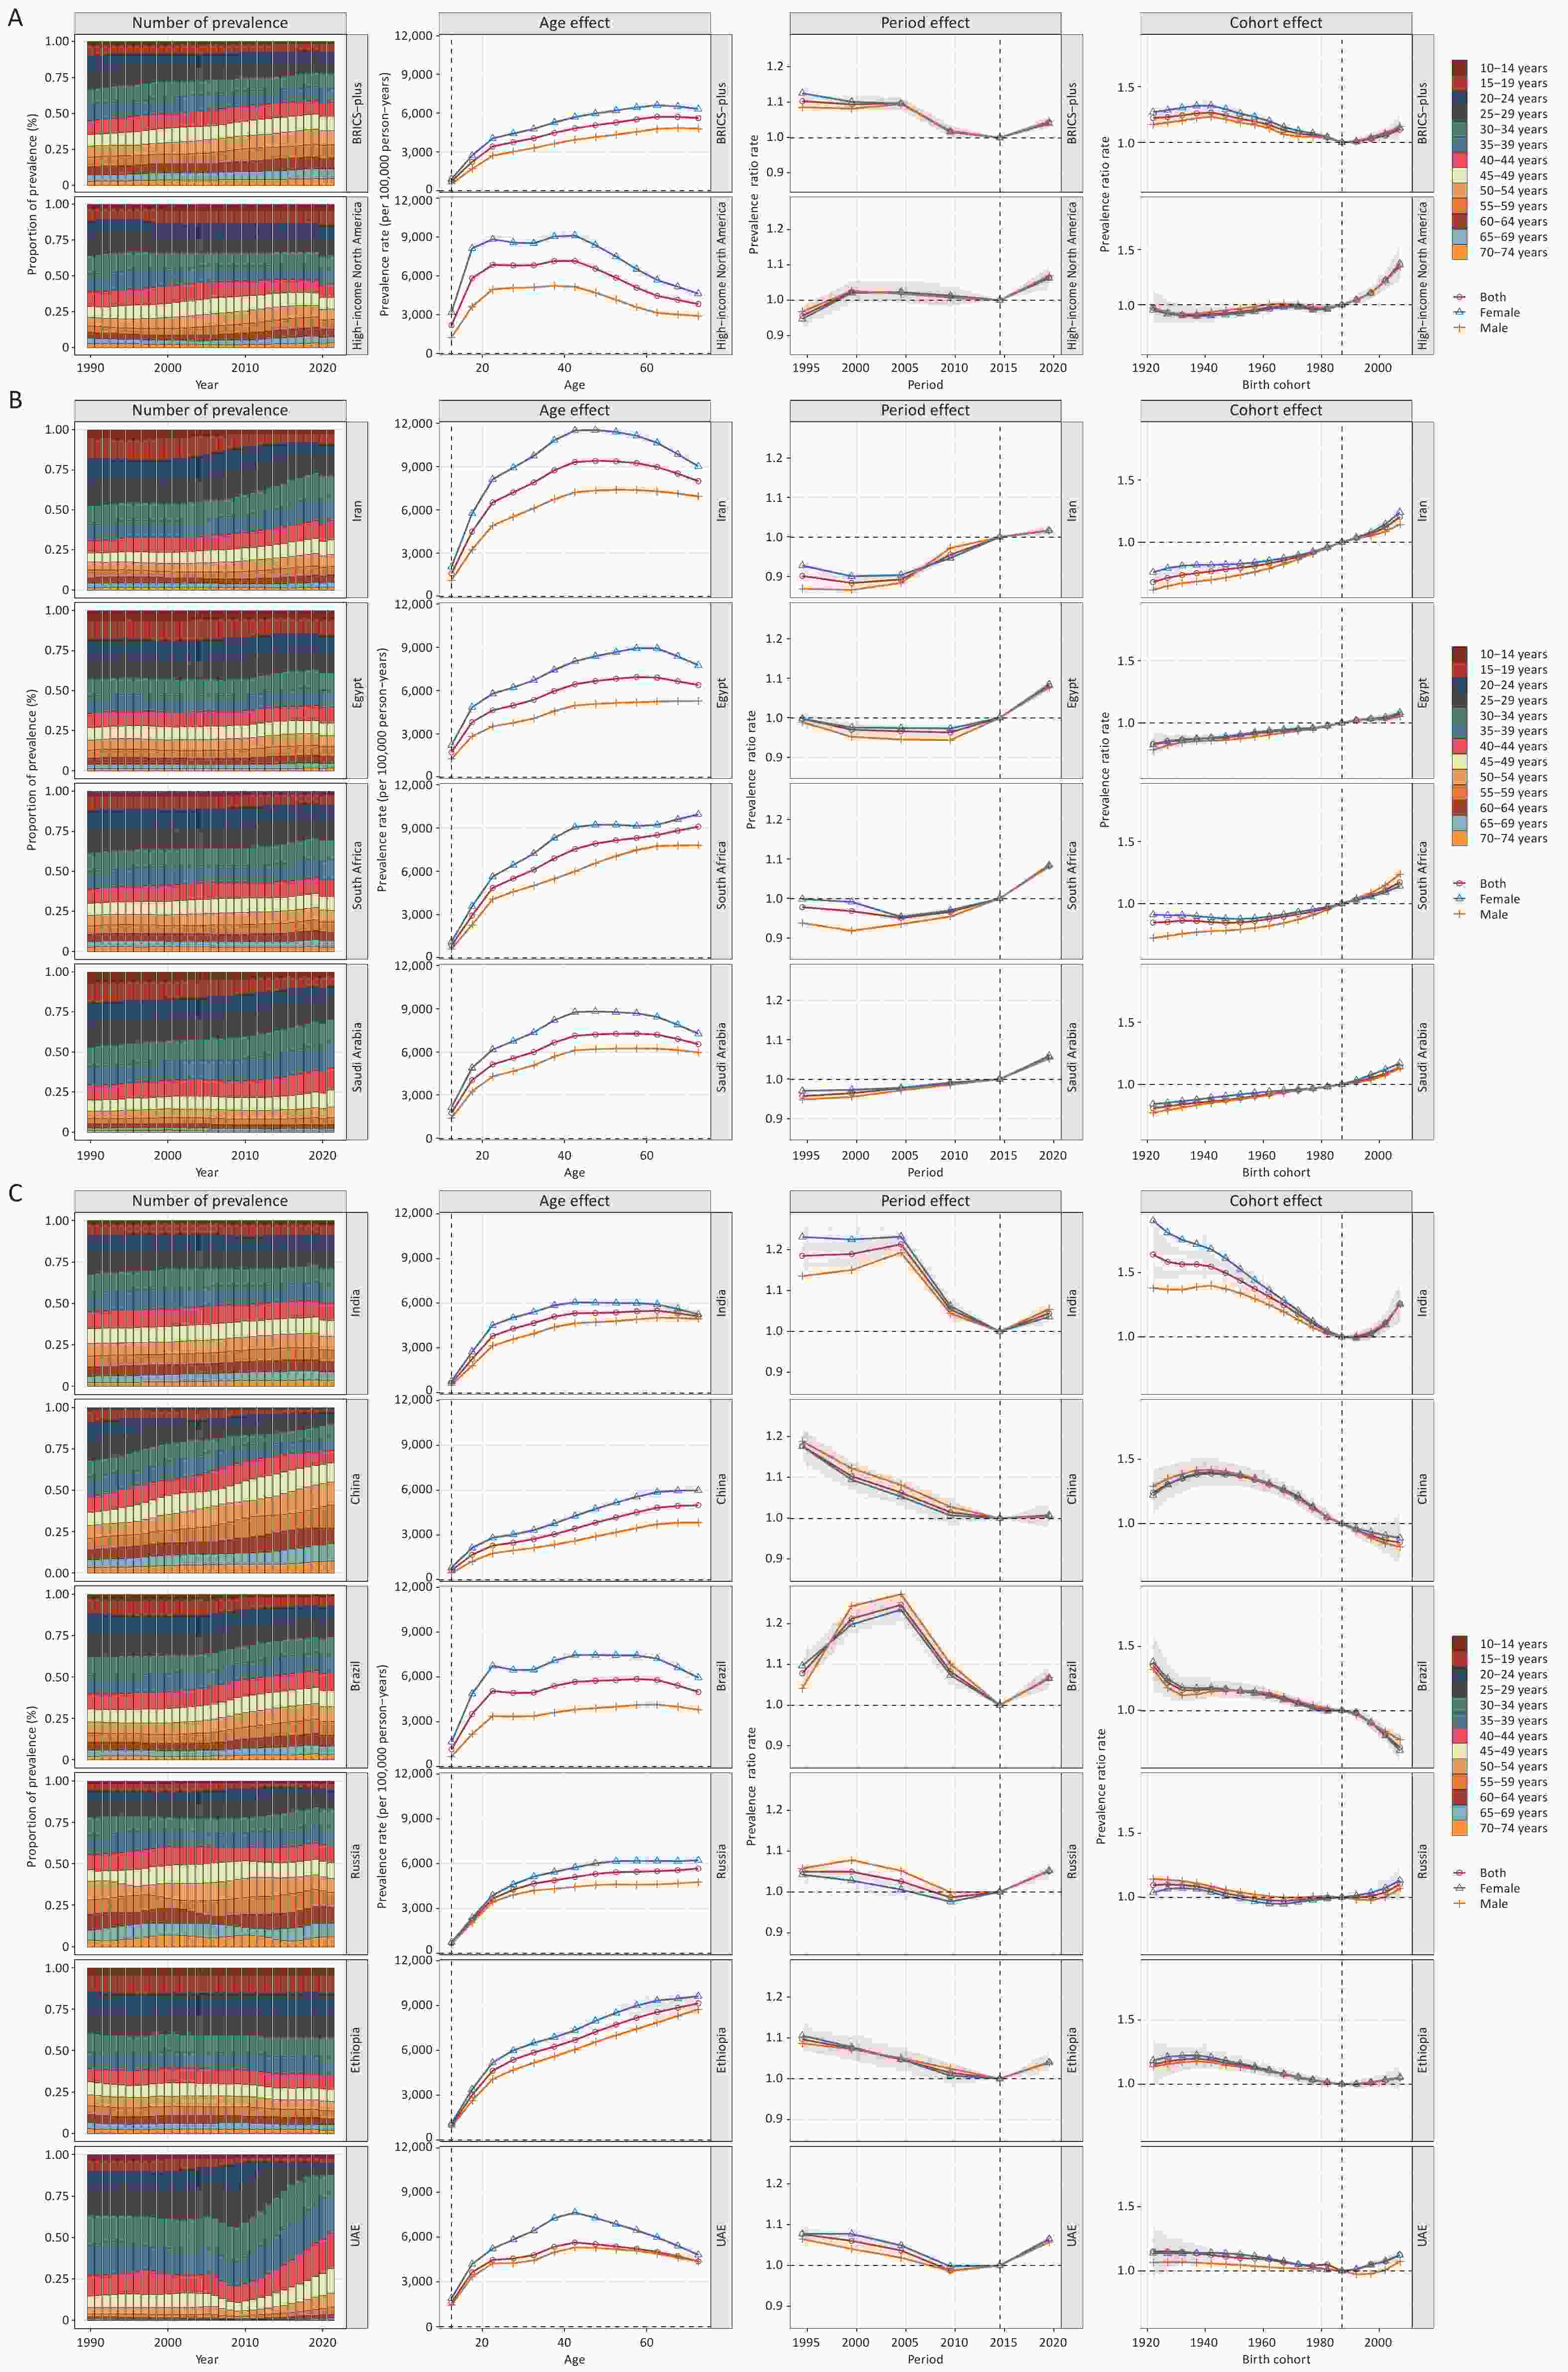
Figure 3. Parameter estimates of age, period, and cohort effects on the prevalence of depressive disorders and sex differences in BRICS Plus countries and high-income North America from 1992 to 2021.
Among countries (i.e., Iran, South Africa, Saudi Arabia, and Egypt) with an increasing depressive disorder burden (net drift > 0), the period effect indicated that the prevalence rates of depressive disorders began to rise after 1997–2001, 2002–2006, 1992–1996, and 2007–2011, respectively. The cohort effect showed that the risk of depressive disorders gradually increased in these four countries with a delay in birth years.
In countries where the depressive disorder burden decreased (net drift < 0), the period effect indicated that the risk of depressive disorders started to increase after 2007–2011 in Russia and the UAE Emirates. However, it began to rise after 2012–2016 in Ethiopia, Brazil, China, and India. In terms of the cohort effect, in India and Ethiopia, individuals born after 1990–1994 experienced a gradual increase in the risk of depressive disorders. In Russia, this upward trend appeared earlier for individuals born between 1965 and 1969. In the UAE, this trend emerged among those born between 1985 and 1989. However, China and Brazil experienced a reversal of the upward trend in depressive disorder burden.
Consistent with those for prevalence, age, period, and cohort effects were found in the incidence and DALYs of depressive disorders (Tables S6–S8 and Figures S4–S6). No significant sex differences were observed in age, period, or cohort effects. Joinpoint regression analysis, which served as a supplementary tool for the APC results, generated generally consistent results (Supplementary Tables S9–S11 and Supplementary Figure S7–S9).
-
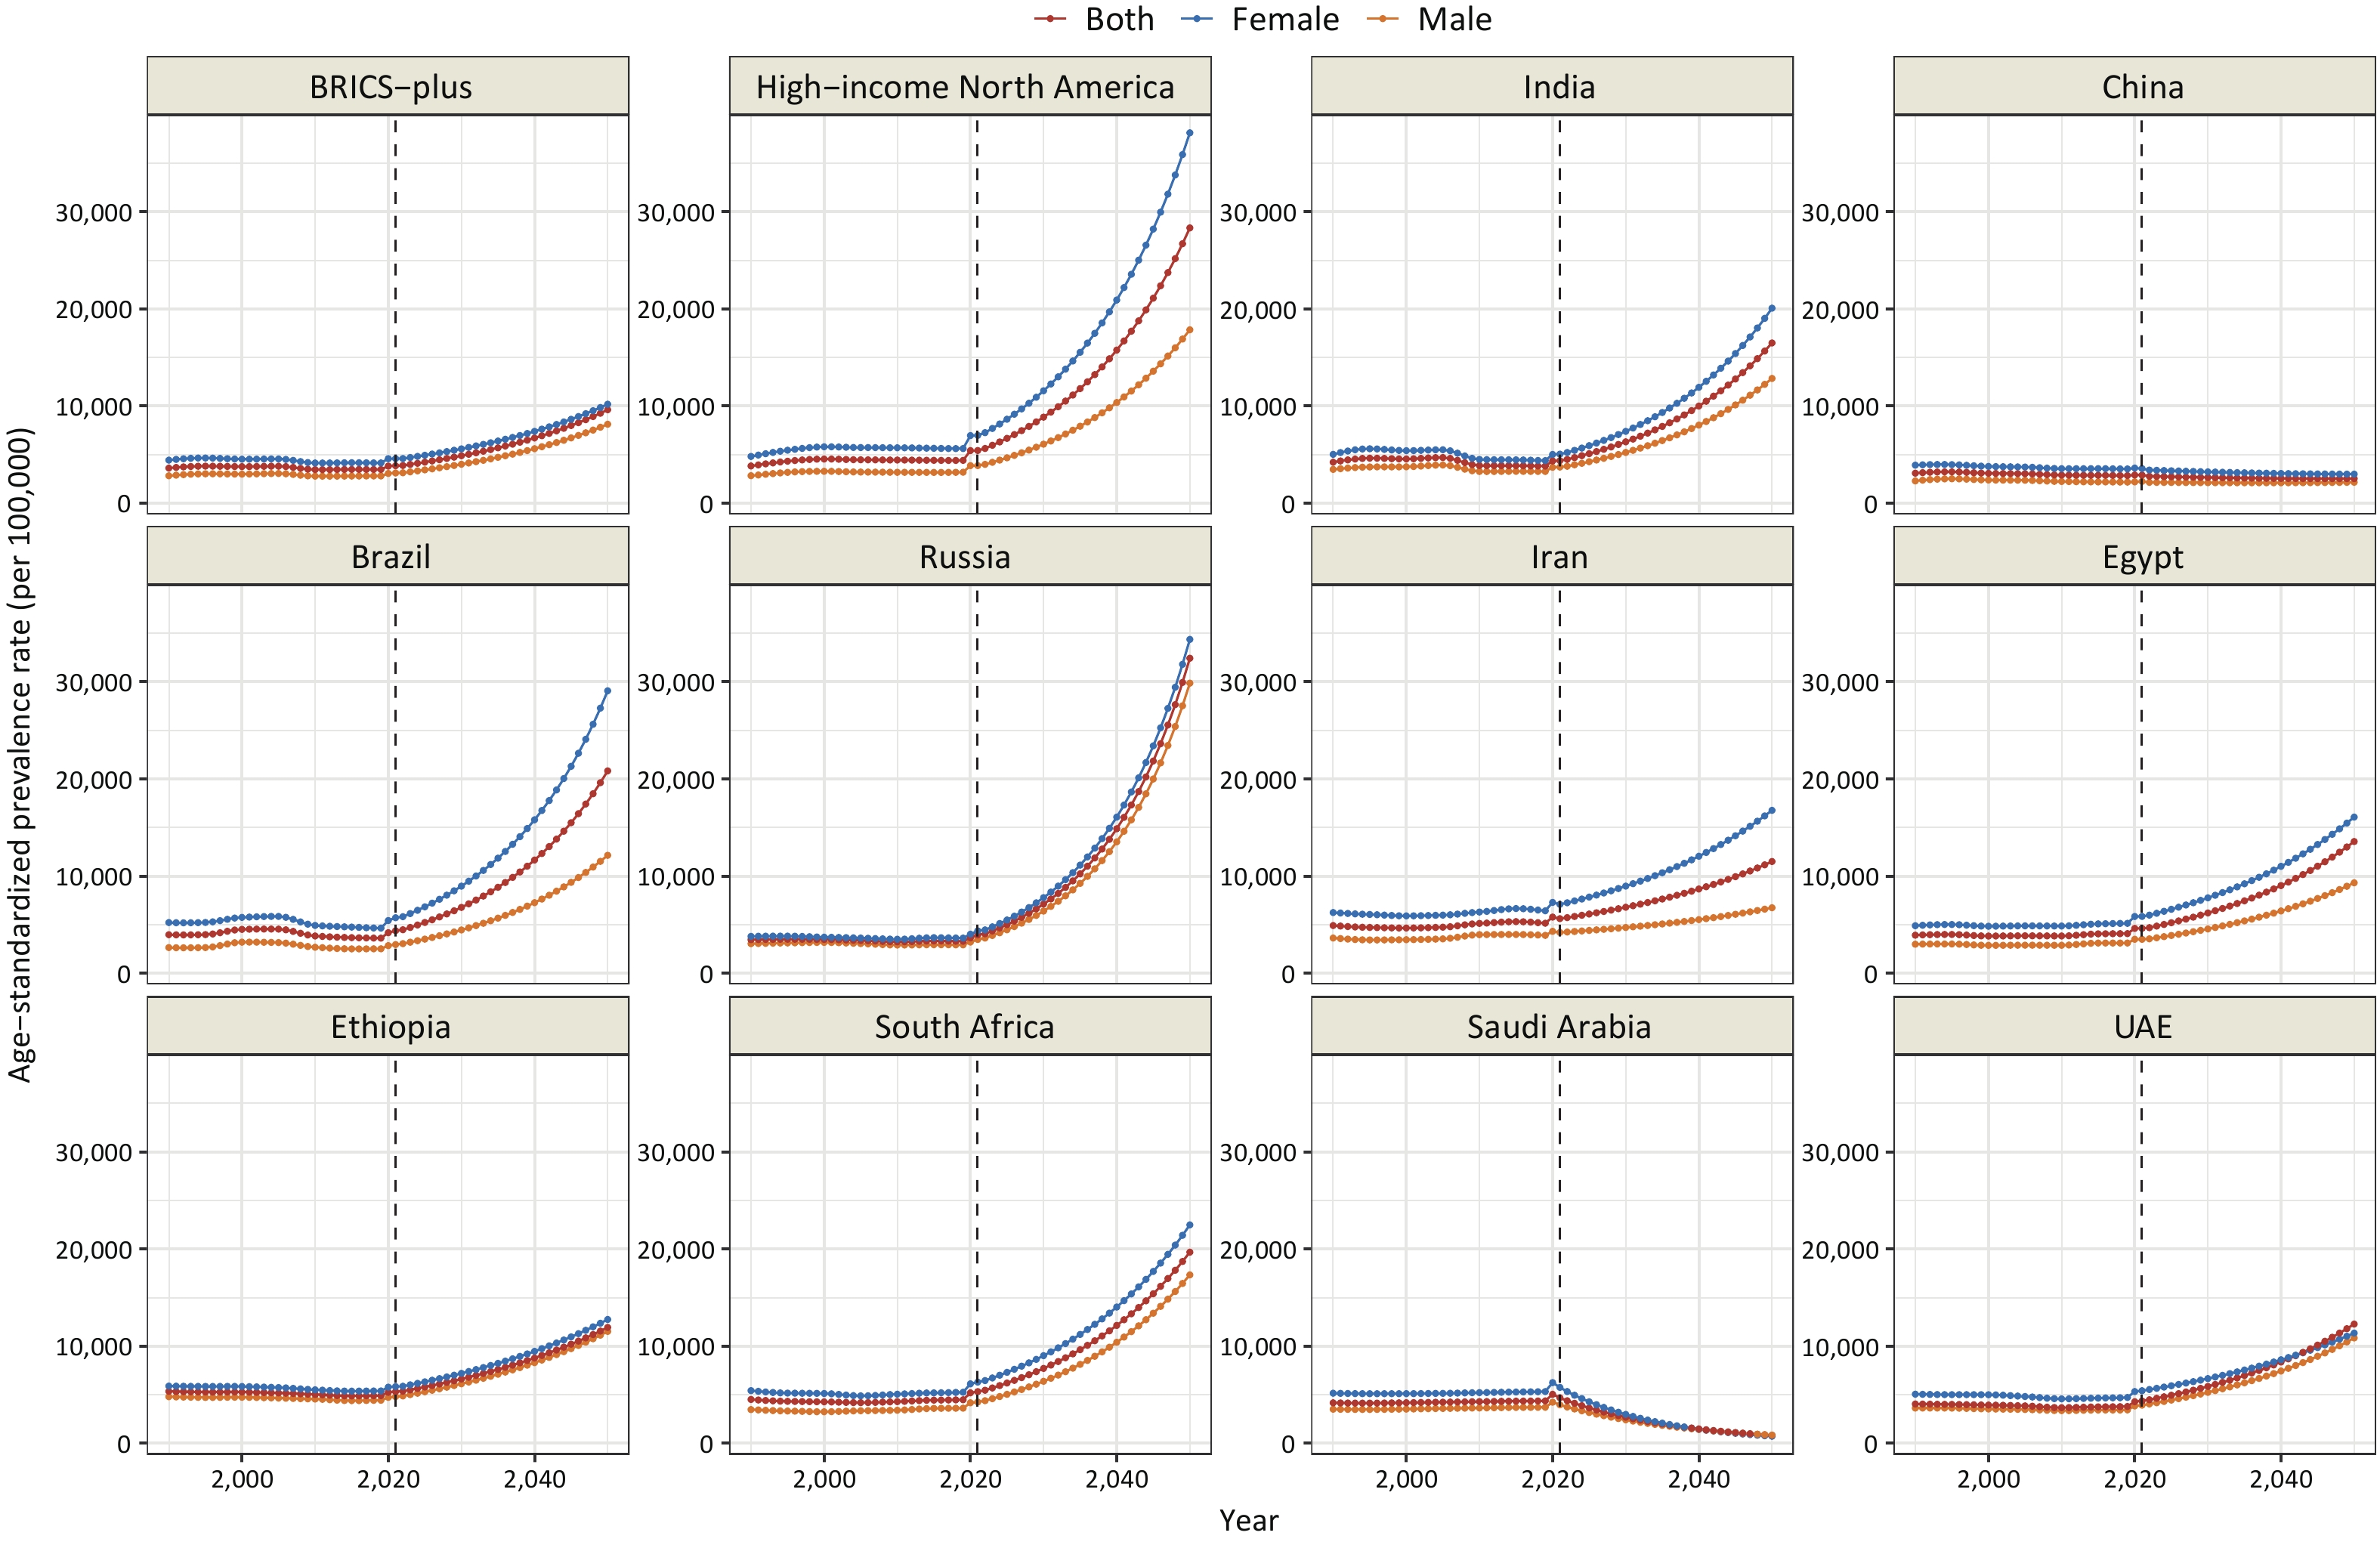
As shown in Figure 4, Supplementary Tables S12–S13, and Supplementary Figures S10–S11, the ASIR, ASPR, and ASDR for depressive disorders, if left uncontrolled, will increase by 179.50%, 150.00%, and 142.85%, respectively, by 2050. The most significant increase was observed in Russia, where the ASIR, ASPR, and ASDR for depressive disorders increased by 1,653.06%, 724.61%, and 1,108.97%, respectively. Significantly decreasing trends were observed in Saudi Arabia and China.
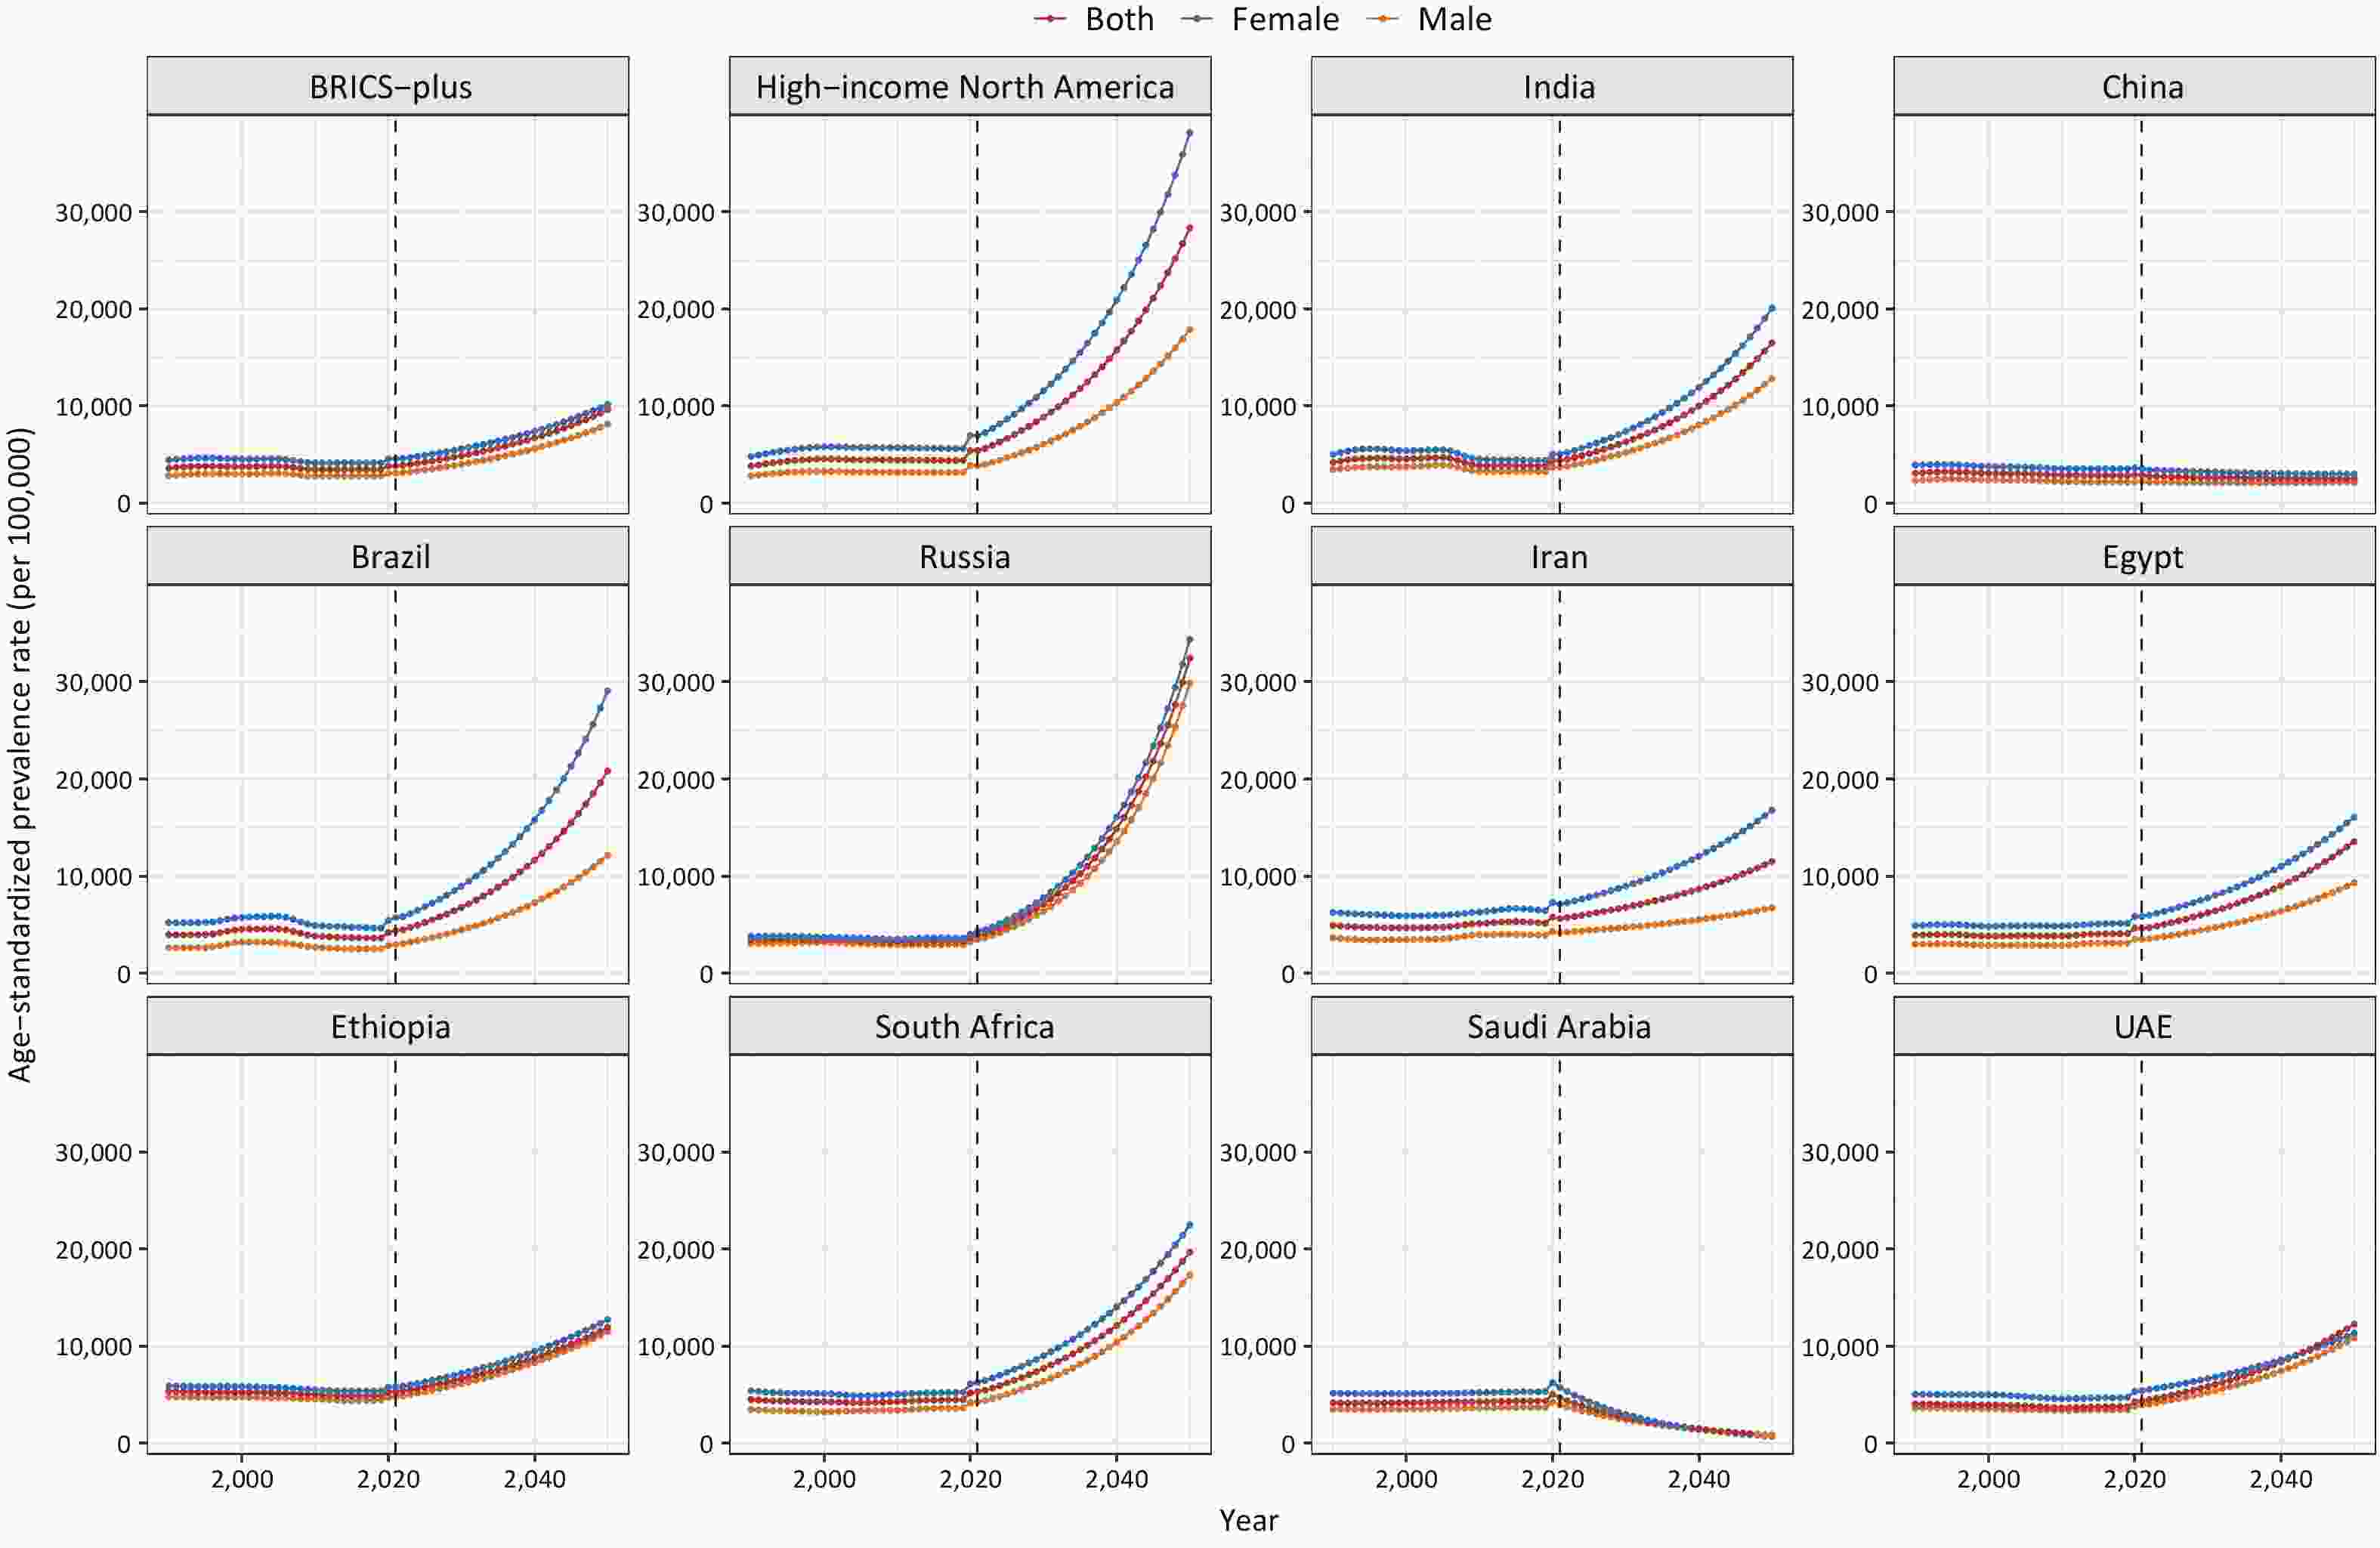
Figure 4. The trend of depressive disorder prevalence in BRICS Plus countries and high-income North America from 1990 to 2050. BRICS Plus = India, China, Brazil, Russia, Iran, Egypt, Ethiopia, South Africa, Saudi Arabia, and the UAE (United Arab Emirates).
-
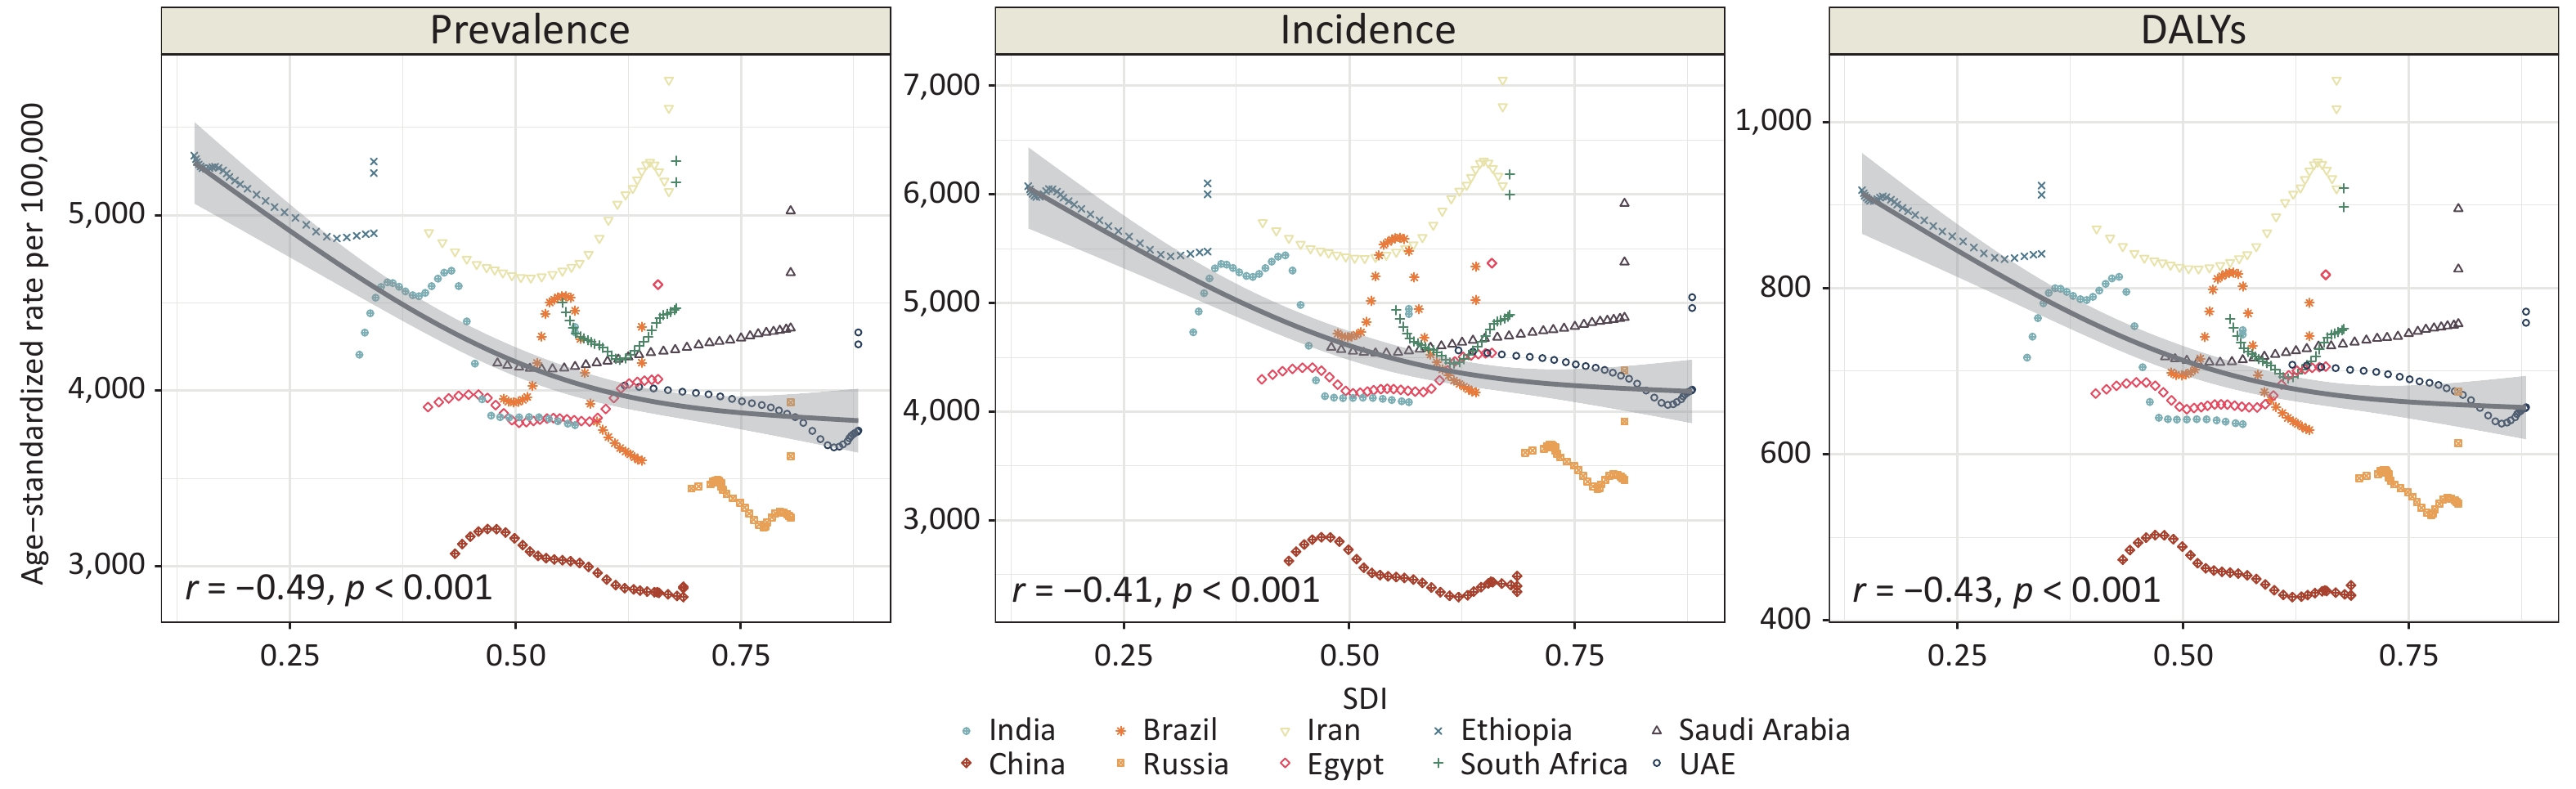
This study clarified the association between depressive disorder burden and SDIs in populations of all ages using BRICS Plus data from 1990 to 2021 (Figure 5). Overall, the burden attributable to depressive disorders in the BRICS Plus countries showed a negative correlation with SDIs (r = –0.49, –0.41, and –0.43 for the ASPR, ASIR, and ASDR, respectively). In addition, from the perspective of an individual country, the depressive disorder burden tended to decrease with increasing SDI.
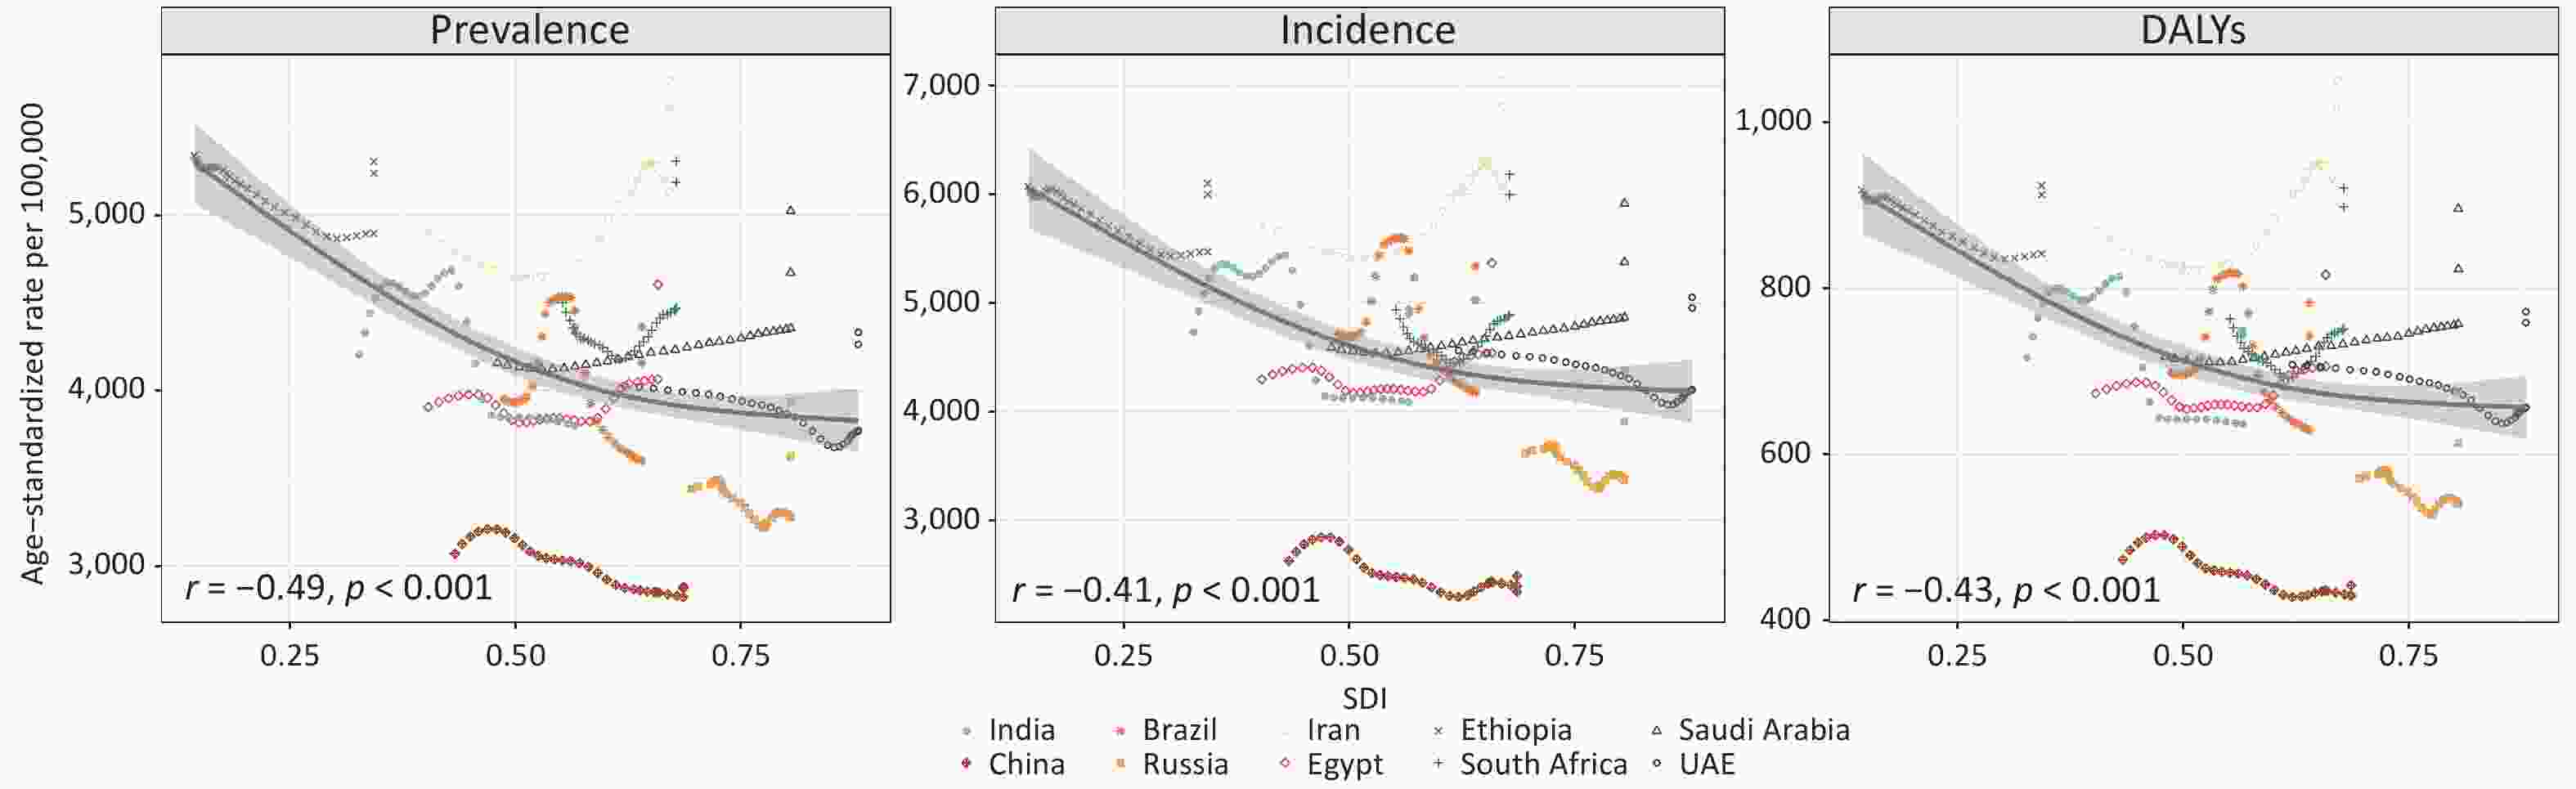
Figure 5. Associations of age-standardized prevalence, incidence, and DALYs of depressive disorders (per 100,000 population) with SDI in the populations of all ages in BRICS Plus countries from 1990 to 2021. BRICS Plus = India, China, Brazil, Russia, Iran, Egypt, Ethiopia, South Africa, Saudi Arabia, and the UAE (United Arab Emirates); DALYs = disability-adjusted life years; SDI = sociodemographic index.
-
This systematic analysis revealed a significant increase in the depressive disorder burden, and the proportion of this burden among mental disorders and NCDs generally increased in the BRICS Plus countries from 1990 to 2021. In 2021, among the ten BRICS Plus countries, Iran, South Africa, and Ethiopia had the highest burden of depressive disorders; in contrast, China, Russia, and the UAE had relatively lower burdens. Simultaneously, there was a significant increasing trend among adolescents and young adults in India, the UAE, and Russia; among older adults in China; and among almost all age groups in Iran, Egypt, South Africa, and Saudi Arabia. The period effects showed that the depressive disorder burden began to increase after 2012–2016 in all the countries. Cohort effects indicated that only China and Brazil experienced a reversal in the upward trend in the depressive disorder burden in recent cohorts. This study also noted differences in the burden of depressive disorder across countries and an association between the SDI and depressive disorder burden. In other words, greater depressive disorder burdens were found in low- and low-to-middle-SDI countries than in high-SDI countries. In addition, for depressive disorders in the BRICS Plus countries from 2021 to 2050, the anticipated increases in ASIRs, ASPRs, and ASDRs were 179.50%, 150.00%, and 142.85%, respectively. Therefore, it is imperative to formulate targeted preventive and therapeutic strategies based on national and global experience.
After 2012–2016, most BRICS Plus countries experienced an increased depressive disorder burden, in contrast to a downward trend, which was reversed by the outbreak of the COVID-19 pandemic in high-income North America. First, with the control of communicable diseases as well as improvements in reproductive health and nutrition, there is currently an increase in life expectancy, and the burden of disease has shifted to NCDs, such as depression[29]. Moreover, the implementation of strong policies may contribute to expanded access to healthcare resources, facilitating the detection of depressive disorders. For instance, South Africa enacted its first Mental Health Act in 2004[30], China introduced new healthcare reforms in 2009[31], Russia undertook its second phase of mental health reforms during the same period[32], and Egypt promulgated its first Mental Health Act[33]. Finally, the outbreak of the COVID-19 pandemic has globally increased the burden of mental disorders[14,34], contributing significantly to the increase in the occurrence of depressive disorders from 2020 to 2021, leading to a profound impact on the burden of depressive disorders. Moreover, each country has its own reasons for inconsistencies in the burden of depressive disorders.
In 2021, the prevalence of depressive disorders in India reached 62.5 million, ranking first in BRICS Plus countries. In 2014, India enacted its first dedicated mental health policy and launched the Ayushman Bharat (Healthy India) initiative in 2018, striving to provide comprehensive primary healthcare and health insurance[35,36]. Despite these efforts, there is still a suboptimal implementation of mental health services in India, marked by significant treatment gaps and inadequate evidence-based interventions. Currently, there is a severe shortage of mental health professionals and resources in India. According to the Mental Health ATLAS 2017, India has one of the lowest proportions of mental health personnel among the BRICS Plus countries, surpassing Ethiopia only[37]. Additionally, India still faces constant challenges, such as discrimination by healthcare workers towards individuals with mental illnesses and barriers to meeting these demands[38,39]. Collectively, the current situation in India includes low coverage of mental health services, insufficient awareness, and stigmatization of mental disorders. Consequently, there is a pressing need for substantial investment in mental health services to cope with the rapid increase in the depressive disorder burden in the future (the third-largest increase) in India[40].
From 1990 to 2021, there was a notable increase in the ASPR in Iran (ranking first in terms of burden and increase rate), Saudi Arabia, and Egypt. It may be attributed to economic and political turmoil, severe racial tensions, as well as the impact of Arab culture and traditional beliefs on mental health understanding and treatment in Middle Eastern countries[41]. In response to this problem, Iran, Saudi Arabia, and the UAE have implemented a series of health policies integrating mental health care into primary health centers, with improvement in access to medical services and detection, yet with limited impact[42]. Meanwhile, Egypt has restricted investments in mental health, necessitating a national assessment to identify system shortcomings and enhance access to mental health care for the Egyptian population[33]. Furthermore, the depressive disorder burden in South Africa and Ethiopia ranked second and third, respectively, among the 10 BRICS Plus countries in 2021. As in other African countries, both countries share the same causative factors, such as a high incidence of acquired immunodeficiency syndrome and tuberculosis, poverty, and high unemployment rates, all of which could increase the prevalence of depressive disorders[43,44]. In addition, the lack of mental health resources in both countries also contributes to the high burden of depression. For example, South Africa concentrates mental health care services at secondary and specialized hospitals, with limited resources allocated for care at other levels, particularly at the community level[30]. Besides, Ethiopia faces significant shortages in both its mental health workforce and financial investments in mental health[45].
In recent decades, China has made significant progress in depressive disorder prevention and treatment, which are strongly related to the substantial efforts devoted to mental health, such as the National 868 Program and measures implemented between 2015 and 2019[46]. These initiatives prioritize the management, treatment, and rehabilitation of individuals with mental illnesses[46]. However, there are still deficiencies, such as uneven distribution of mental health resources, as well as the absence of stable and localized community-based mental health service models, both of which are not conducive to depressive disorder detection[46]. Notably, the incidence and DALYs of depressive disorders in China began to increase after 2007–2011, especially in older adults, which is possibly attributable to the unique parenting philosophies in our country. Additionally, an increasing number of empty-nest older adults lack adequate care and social support under the circumstances of economic and social development. Consequently, the prevalence of depressive disorders in this population is gradually increasing and is expected to intensify with aging[47]. Predictions suggested a reduction in the depressive disorder burden in China, largely due to the implementation of effective measures by the Chinese government during 2020–2021 to mitigate the impact of the COVID-19 pandemic on mental health[14]. However, these results should be interpreted with caution, considering the increasing trend of depression in China over the past five years and the potential long-term impacts of the COVID-19 pandemic in the future[14]. Therefore, formidable challenges persist in China, despite notable achievements in mental health care governance, necessitating structural reforms in mental health services to effectively address the growing burden of depressive disorders[48].
With an overall lower burden of depressive disorders, Brazil is one of the few countries to have reversed the upward trend associated with the birth cohort effect. This trend may be related to Brazil's implementation of health policies that align well with international principles and standards[49]. Over the past few decades, Brazil has gradually replaced mental hospitals with community services and novel psychosocial care, promoting a fivefold increase in the population coverage of psychosocial care centers[50]. Similarly, Russia also had a significantly reduced burden of depression, which may be attributed to the flexible community and outpatient services in the country after two mental health reforms[32]. Despite considerable efforts, both countries experienced significant increases in ASPRs during the COVID-19 pandemic, with strong growth likely to persist if not controlled. Therefore, based on the actual situation in Brazil and Russia and in response to rapidly growing mental health needs, there is a need to expand the coverage of primary healthcare and enhance the coordination and quality of psychosocial care network services. However, mental health patterns and the reporting of health statistics in Russia may be remarkably influenced by recent geopolitical events, which should be a broad concern in the future.
To our knowledge, this study is the first to explore trends in depressive disorder burden in BRICS Plus countries using an age-period-cohort model. This allowed for a comprehensive mastery of shifts in the depressive disorder burden within each country, capturing significant trends in specific populations and providing valuable insights for tailored advice to individual nations. Despite general reports of a more severe burden of mental disorders in high-income countries by earlier studies, our study revealed an emerging upward trend in low- and middle-income countries, which is expected to expand further with increased investments in mental health resources and improved service systems. Finally, we conducted a comparative analysis of age, period, and cohort effects on depressive disorder burden between high-income North America and BRICS Plus countries. The findings of our study may offer important information for the development of affirmative measures and for encouraging the prioritization of the well-being of vulnerable groups in other countries.
This study had several limitations that should be acknowledged. First, some depressive disorder burden estimates relied on sparse datasets from certain countries (e.g., the UAE, Egypt, and Russia), with a lack of high-quality survey data. The accuracy of the research remains to be improved by strengthening primary data collection. Moreover, severity distribution estimates in the GBD 2021 were sourced primarily from studies in high-income countries, potentially underestimating the burden on regions with limited treatment access. Third, most of the epidemiological data in the dataset followed the DSM-IV and ICD-10 diagnostic classifications. This necessitates further consideration of the impact of changes in diagnostic classifications on GBD estimates, given the increasing use of the DSM-5 and ICD-11 models in epidemiological surveys. There was no analysis of the subtypes of depressive disorders (major depressive disorder and dysthymia), although their prevalence patterns were similar to those of all depressive disorders. Fourth, similar to other studies that use the APC model, population-level results may not necessarily be extrapolated to the individual level because of ecological fallacies. Therefore, the findings of our study should be validated in future studies that employ individual-level data. Fifth, GBD research has broader limitations as disability definitions may not fully capture societal impacts, and disability weights may not comprehensively represent symptoms in various environments. Hence, a survey based on disability weighting (a measure of disease severity) should be replicated in more locations to assess the generalizability of the estimates. Finally, beyond formal health care, informal social structures (e.g., family and community support) may have a place in managing depression, especially in rural or low-resource settings[51]. Though hard to quantify, these informal services may explain some regional differences where formal services are limited.
-
The present study, supported by the GBD 2021 data, suggests that depressive disorders constitute an increasing share of the burden of mental disorders and NCDs from 1990 to 2021 in BRICS Plus countries. The burden of depressive disorders tended to increase over time in the most recent birth cohort. Particular attention needs to be given to the increasing trend of the depressive disorder burden among adolescents, young adults, and older adults in BRICS Plus countries, as well as the high burden in low-SDI countries such as Iran, Egypt, and Ethiopia. Given the growing burden of depressive disorders in recent decades and the potential long-term psychological impact of the COVID-19 pandemic, it is necessary to address the causative factors of depressive disorders and enhance the quality and accessibility of mental health services in the BRICS Plus countries.
doi: 10.3967/bes2025.155
Time Trends in Depressive Disorder Burden Across BRICS Plus Countries: An Age-Period-Cohort Analysis for the Global Burden of Disease Study 2021
-
Abstract:
Objective To analyze trends in the depressive disorder burden across BRICS Plus countries and their associations with age, period, and cohort effects. Methods Prevalence, incidence, and disability-adjusted life years (DALYs) estimates of the depressive disorder burden were obtained from the Global Burden of Disease Study, 2021. This study further assessed the period and cohort effects on depressive disorders from 1992 to 2021 using an age-period-cohort model. Results In 2021, 152.6 million people had depressive disorders across the BRICS Plus countries, showing an increase of 85.6% from 1990, which caused 23.7 million DALYs. The age-standardized prevalence rate (ASPR) of depressive disorders declined by 4.1% from 1990 to 2019, followed by a substantial increase (11.3%) from 2019 to 2021. Furthermore, period and cohort effects showed that the depressive disorder burden increased over time and in the recent birth cohort. Meanwhile, the depressive disorder burden increased among adolescents, young adults, and older adults in the BRICS Plus group. Ultimately, projections for 2050 suggest a 150.0% increase in the ASPR. Conclusion This study revealed a heavy depressive disorder burden across BRICS Plus countries, especially among adolescents, young adults, and older adults. This highlights the need to strengthen specific public health strategies and policies targeting populations with different priorities. -
Key words:
- Depressive disorders /
- BRICS Plus /
- Prevalence /
- Age-period-cohort model
The authors declare that they have no competing interests
The University of Washington Institutional Review Board reviewed and approved the waiver of informed consent for open and aggregated data.
注释:1) Authors’ Contributions: 2) Competing Interests: 3) Ethics: -
Figure 1. Age-standardized prevalence rates (A), total prevalence (B) of depressive disorders, and relative proportions of prevalences of all depressive disorders attributable to mental disorders (C) in BRICS Plus countries from 1992 to 2021. BRICS Plus = India, China, Brazil, Russia, Iran, Egypt, Ethiopia, South Africa, Saudi Arabia, and the UAE (United Arab Emirates); DALYs = disability-adjusted life years.
Figure 2. Net drift (A) with local drift values (B) for the prevalence, incidence, and DALYs due to depressive disorders in both sexes in BRICS Plus countries and high-income North America from 1992 to 2021. BRICS Plus = India, China, Brazil, Russia, Iran, Egypt, Ethiopia, South Africa, Saudi Arabia, and the UAE (United Arab Emirates); DALYs = disability-adjusted life years.
Figure 3. Parameter estimates of age, period, and cohort effects on the prevalence of depressive disorders and sex differences in BRICS Plus countries and high-income North America from 1992 to 2021.
Figure 4. The trend of depressive disorder prevalence in BRICS Plus countries and high-income North America from 1990 to 2050. BRICS Plus = India, China, Brazil, Russia, Iran, Egypt, Ethiopia, South Africa, Saudi Arabia, and the UAE (United Arab Emirates).
Figure 5. Associations of age-standardized prevalence, incidence, and DALYs of depressive disorders (per 100,000 population) with SDI in the populations of all ages in BRICS Plus countries from 1990 to 2021. BRICS Plus = India, China, Brazil, Russia, Iran, Egypt, Ethiopia, South Africa, Saudi Arabia, and the UAE (United Arab Emirates); DALYs = disability-adjusted life years; SDI = sociodemographic index.
Table 1. Characteristics of the prevalence of depressive disorders in BRICS Plus countries and high-income North America from 1992 to 2021
Variables BRICS-plus High-income North America India 1990 2019 2021 1990 2019 2021 1990 2019 2021 Population Total (million) 2,546.8 3,558.6 3,606.6 281.4 366.9 370.2 853.1 1,388.6 1,414.5 Percentage of global population (%) 47.75 45.95 45.7 5.28 4.74 4.69 15.99 17.93 17.92 Prevalence number (million) 82.2 134.1 152.6 11.5
(10.4, 12.8)17.1
(15.6, 18.9)20.8
(18.8, 23.1)29.1
(25.9, 33.0)52.0
(47.0, 58.2)62.5
(56.0, 70.5)Relative proportion (%)# 3.60 4.08 4.57 4.51 5.03 6.02 3.79 4.04 4.77 Relative proportion (%)* 25.26 28.94 30.06 26.39 28.45 30.87 23.77 27.59 29.92 ASPR (per 100,000) 3,600.9 3,453.3 3,842.2 3,817.1
(3,439.5, 4,244.8)4,393.3
(3,986.6, 4,894.9)5,408.3
(4,846.9, 6,049.7)4,205.6
(3,774.2, 4,703.4)3,804.2
(3,460.9, 4,223.3)4,363.1
(3,925.7, 4,880.1)Variables China Brazil Russia 1990 2019 2021 1990 2019 2021 1990 2019 2021 Population Total (million) 1,176.5 1,414.4 1,422.7 148.5 216.8 220.4 151.0 145.9 144.9 Percentage of global population (%) 22.06 18.26 18.03 2.78 2.80 2.79 2.83 1.88 1.84 Prevalence number (million) 34.5
(31.1, 38.4)50.9
(45.8, 56.5)53.1
(47.4, 59.3)5.1
(9.3, 11.7)8.6
(15.7, 18.9)10.7
(18.9, 24.2)5.7
(10.2, 13.0)5.8
(10.4, 13.2)6.8
(12.0, 15.3)Relative proportion (%)# 3.28 3.89 4.03 3.81 4.26 5.17 4.15 4.29 5 Relative proportion (%)* 25.73 30.83 30.45 23.33 23.1 24.93 32.14 33.07 34.18 ASPR (per 100,000) 3,071.8
(2,779.1, 3,404.5)2,825.0
(2,550.4, 3,136.1)2,875.7
(2,590.0, 3,203.4)3,954.1
(3,564.6, 4,422.6)3,602.0
(3,284.4, 3,970.5)4,364.1
(3,881.4, 4,947.3)3,443.0
(3,063.0, 3,900.9)3,277.7
(2,923.5, 3,710.7)3,932.8
(3,503.8, 4,482.6)Variables Iran Egypt Ethiopia 1990 2019 2021 1990 2019 2021 1990 2019 2021 Population Total (million) 57.1 84.4 85.4 55.3 102.3 105.6 50.6 104.5 108.9 Percentage of global population (%) 1.07 1.09 1.08 1.04 1.32 1.34 0.95 1.35 1.38 Prevalence number (million) 2.2
(1.9, 2.6)4.7
(4.1, 5.5)5.2
(4.5, 6.1)1.8
(1.5, 2.2)3.8
(3.2, 4.5)4.5
(3.5, 5.5)1.8
(1.6, 2.0)3.7
(3.2, 4.2)4.3
(3.7, 5.0)Relative proportion (%)# 4.3 5.95 6.49 3.67 4.12 4.74 3.84 3.9 4.37 Relative proportion (%)* 22.49 29.33 29.52 23.52 26.71 28.22 32.42 32.16 33.38 ASPR (per 100,000) 4,901.2
(4,253.0, 5,695.7)5,134.8
(4,449.4, 5,973.9)5,609.4
(4,810.1, 6,488.0)3,907.1
(3,344.4, 4,612.1)4,065.8
(3,507.6, 4,806.0)4,605.4
(3,658.6, 5,580.1)5,339.5
(4,752.0, 6,090.4)4,897.2
(4,380.7, 5,567.6)5,305.7
(4,649.4, 6,114.9)Variables South Africa Saudi Arabia UAE 1990 2019 2021 1990 2019 2021 1990 2019 2021 Population Total (million) 37.0 56.0 56.9 15.9 36.2 37.7 1.9 9.5 9.6 Percentage of global population (%) 0.69 0.72 0.72 0.3 0.47 0.48 0.04 0.12 0.12 Prevalence number (million) 1.4
(1.2, 1.5)2.5
(2.3, 2.8)3.1
(2.7, t3.5)0.5
(0.5, 0.7)1.7
(1.5, 2.1)2.0
(1.6, 2.5)0.1
(0.1, 0.1)0.4
(0.4, 0.5)0.5
(0.4, 0.7)Relative proportion (%)# 4.26 4.95 5.98 3.75 5.14 5.61 4.31 4.93 5.69 Relative proportion (%)* 33.6 36.48 38.25 27.31 32.59 33.71 30.83 32.79 34.69 ASPR (per 100,000) 4,500.7
(4,081.3, 5,001.5)4,469.9
(4,054.1, 4,979.9)5,310.2
(4,712.5, 6,036.6)4,157.5
(3,573.2, 4,902.3)4,356.9
(3,814.5, 5,083.0)4,672.5
(3,737.3, 5,815.4)4,030.0
(3,503.8, 4,699.6)3,773.3
(3,255.0, 4,415.6)4,332.4
(3,484.9, 5,423.0)Note. BRICS Plus = India, China, Brazil, Russia, Iran, Egypt, Ethiopia, South Africa, Saudi Arabia, and the UAE (United Arab Emirates); ASPR = Age-standardized prevalence rate. #Relative proportion equals (number of individuals with depressive disorders) / (number of individuals with NCDs). *Relative proportion equals (number of individuals with depressive disorders) / (number of individuals with mental disorders).  下载: 导出CSV
-
[1] GBD 2019 Mental Disorders Collaborators. Global, regional, and national burden of 12 mental disorders in 204 countries and territories, 1990-2019: a systematic analysis for the Global Burden of Disease Study 2019. Lancet Psychiatry, 2022; 9, 137−50. doi: 10.1016/S2215-0366(21)00395-3 [2] World Health Organization. World misses most 2020 mental health targets; extension of WHO Mental Health Action Plan to 2030 provides new opportunity for progress. https://www.who.int/news/item/08-10-2021-who-report-highlights-global-shortfall-in-investment-in-mental-health. [2025-03-06]. [3] Patel V, Saxena S, Lund C, et al. The Lancet Commission on global mental health and sustainable development. Lancet, 2018; 392, 1553−98. doi: 10.1016/S0140-6736(18)31612-X [4] Fantom NJ, Prince WC. World development indicators 2014 (English). http://documents.worldbank.org/curated/en/752121468182353172/World-development-indicators-2014. [2023-12-24]. [5] Sumner A. IDS working paper: where do the world’s poor live? A new update. https://www.ids.ac.uk/download.php?file=files/dmfile/Wp393.pdf. [2023-12-09]. [6] Acharya S, Barber SL, Lopez-Acuna D, et al. BRICS and global health. Bull World Health Organ, 2014; 92, 386-386A. (查阅网上资料, 请确认页码结束页是否缩写) [7] Ferrari AJ, Charlson FJ, Norman RE, et al. Burden of depressive disorders by country, sex, age, and year: findings from the global burden of disease study 2010. PLoS Med, 2013; 10, e1001547. doi: 10.1371/journal.pmed.1001547 [8] Hong C, Liu Z, Gao L, et al. Global trends and regional differences in the burden of anxiety disorders and major depressive disorder attributed to bullying victimisation in 204 countries and territories, 1999-2019: an analysis of the Global Burden of Disease Study. Epidemiol Psychiatr Sci, 2022; 31, e85. doi: 10.1017/S2045796022000683 [9] Wu YH, Fan LY, Xia F, et al. Global, regional, and national time trends in incidence for depressive disorders, from 1990 to 2019: an age-period-cohort analysis for the GBD 2019. Ann Gen Psychiatry, 2024; 23, 28. doi: 10.1186/s12991-024-00513-1 [10] Baxter AJ, Charlson FJ, Cheng HG, et al. Prevalence of mental, neurological, and substance use disorders in China and India: a systematic analysis. Lancet Psychiatry, 2016; 3, 832−41. doi: 10.1016/S2215-0366(16)30139-0 [11] Bonadiman CSC, Malta DC, de Azeredo Passos VM, et al. Depressive disorders in Brazil: results from the Global Burden of Disease Study 2017. Popul Health Metr, 2020; 18, 6. doi: 10.1186/s12963-020-00204-5 [12] G20 Research Group. G20, G7 and BRICS health governance leaves mental health in the dark. http://www.g20.utoronto.ca/analysis/230910-pirzada.html. [2023-12-09]. [13] COVID-19 Mental Disorders Collaborators. Global prevalence and burden of depressive and anxiety disorders in 204 countries and territories in 2020 due to the COVID-19 pandemic. Lancet, 2021; 398, 1700−12. doi: 10.1016/S0140-6736(21)02143-7 [14] Kola L, Kohrt BA, Hanlon C, et al. COVID-19 mental health impact and responses in low-income and middle-income countries: reimagining global mental health. Lancet Psychiatry, 2021; 8, 535−50. doi: 10.1016/S2215-0366(21)00025-0 [15] Holmes EA, O'Connor RC, Perry VH, et al. Multidisciplinary research priorities for the COVID-19 pandemic: a call for action for mental health science. Lancet Psychiatry, 2020; 7, 547−60. doi: 10.1016/S2215-0366(20)30168-1 [16] Yang F, Lodder P, Huang N, et al. Thirty-year trends of depressive disorders in 204 countries and territories from 1990 to 2019: an age-period-cohort analysis. Psychiatry Res, 2023; 328, 115433. doi: 10.1016/j.psychres.2023.115433 [17] Yang Y, Schulhofer-Wohl S, Fu WJ, et al. The intrinsic estimator for age-period-cohort analysis: what it is and how to use it. Am J Sociol, 2008; 113, 1697−736. doi: 10.1086/587154 [18] Zou ZY, Liu GQ, Hay SI, et al. Time trends in tuberculosis mortality across the BRICS: an age-period-cohort analysis for the GBD 2019. eClinicalMedicine, 2022; 53, 101646. doi: 10.1016/j.eclinm.2022.101646 [19] GBD 2021 Diseases and Injuries Collaborators. Global incidence, prevalence, years lived with disability (YLDs), disability-adjusted life-years (DALYs), and healthy life expectancy (HALE) for 371 diseases and injuries in 204 countries and territories and 811 subnational locations, 1990-2021: a systematic analysis for the Global Burden of Disease Study 2021. Lancet, 2024; 403, 2133−61. doi: 10.1016/S0140-6736(24)00757-8 [20] Flaxman AD, Vos T, Murray CJL. An integrative metaregression framework for descriptive epidemiology. University of Washington Press. 2015. [21] GBD 2019 Demographics Collaborators. Global age-sex-specific fertility, mortality, healthy life expectancy (HALE), and population estimates in 204 countries and territories, 1950-2019: a comprehensive demographic analysis for the Global Burden of Disease Study 2019. Lancet, 2020; 396, 1160−203. doi: 10.1016/S0140-6736(20)30977-6 [22] GBD 2021 Diseases and Injuries Collaborators. Global incidence, prevalence, years lived with disability (YLDs), disability-adjusted life-years (DALYs), and healthy life expectancy (HALE) for 371 diseases and injuries in 204 countries and territories and 811 subnational locations, 1990-2021: a systematic analysis for the Global Burden of Disease Study 2021. Lancet, 2024; 403, 2133-61. (查阅网上资料, 本条文献与第19条文献重复, 请确认) [23] Zou ZY, Cini K, Dong B, et al. Time trends in cardiovascular disease mortality across the BRICS: an age-period-cohort analysis of key nations with emerging economies using the global burden of disease study 2017. Circulation, 2020; 141, 790−9. doi: 10.1161/CIRCULATIONAHA.119.042864 [24] Huang DL, Lai HY, Shi X, et al. Global temporal trends and projections of acute hepatitis E incidence among women of childbearing age: age-period-cohort analysis 2021. J Infect, 2024; 89, 106250. doi: 10.1016/j.jinf.2024.106250 [25] Rosenberg PS, Check DP, Anderson WF. A web tool for age-period-cohort analysis of cancer incidence and mortality rates. Cancer Epidemiol Biomarkers Prev, 2014; 23, 2296−302. doi: 10.1158/1055-9965.EPI-14-0300 [26] Du ZB, Chen W, Xia QE, et al. Trends and projections of kidney cancer incidence at the global and national levels, 1990-2030: a Bayesian age-period-cohort modeling study. Biomark Res, 2020; 8, 16. doi: 10.1186/s40364-020-00195-3 [27] Riebler A, Held L. Projecting the future burden of cancer: Bayesian age–period–cohort analysis with integrated nested Laplace approximations. Biom J, 2017; 59, 531−49. doi: 10.1002/bimj.201500263 [28] Kim HJ, Fay MP, Feuer EJ, et al. Permutation tests for joinpoint regression with applications to cancer rates. Stat Med, 2000; 19, 335−51. doi: 10.1002/(SICI)1097-0258(20000215)19:3<335::AID-SIM336>3.0.CO;2-Z [29] GBD 2019 Viewpoint Collaborators. Five insights from the Global Burden of Disease Study 2019. Lancet, 2020; 396, 1135−59. doi: 10.1016/S0140-6736(20)31404-5 [30] Sorsdahl K, Petersen I, Myers B, et al. A reflection of the current status of the mental healthcare system in South Africa. SSM - Ment Health, 2023; 4, 100247. doi: 10.1016/j.ssmmh.2023.100247 [31] Li X, Lu JP, Hu S, et al. The primary health-care system in China. Lancet, 2017; 390, 2584−94. doi: 10.1016/S0140-6736(17)33109-4 [32] Kolpakova SV. A journey through Russian mental health care: a review and evaluation. Int J Ment Health, 2019; 48, 106−32. doi: 10.1080/00207411.2019.1616352 [33] Elnemais Fawzy M. Mental health care in Egypt: review of current state, policy, and needs. Int J Ment Health, 2017; 46, 339−45. doi: 10.1080/00207411.2017.1367447 [34] The Lancet Psychiatry. COVID-19 and mental health. Lancet Psychiatry, 2021; 8, 87. doi: 10.1016/S2215-0366(21)00005-5 [35] Gangadhar BN, Kumar CN, Sadh K, et al. Mental Health Programme in India: has the tide really turned? Indian J Med Res, 2023; 157, 387-94. [36] Singh OP. Insurance for mental illness: government schemes must show the way. Indian J Psychiatry, 2019; 61, 113−4. [37] World Health Organization. Mental health atlas 2017 country profile: India. https://cdn.who.int/media/docs/default-source/mental-health/mental-health-atlas-2017-country-profiles/ind.pdf?sfvrsn=2afad897_1&download=true. [2025-03-06]. [38] Barik D, Thorat A. Issues of unequal access to public health in India. Front Public Health, 2015; 3, 245. [39] Firth J, Siddiqi N, Koyanagi A, et al. The Lancet Psychiatry Commission: a blueprint for protecting physical health in people with mental illness. Lancet Psychiatry, 2019; 6, 675−712. doi: 10.1016/S2215-0366(19)30132-4 [40] India State-Level Disease Burden Initiative Mental Disorders Collaborators. The burden of mental disorders across the states of India: the Global Burden of Disease Study 1990-2017. Lancet Psychiatry, 2020; 7, 148−61. doi: 10.1016/S2215-0366(19)30475-4 [41] Moradinazar M, Mirzaei P, Moradivafa S, et al. Epidemiological status of depressive disorders in the Middle East and North Africa from 1990 to 2019. Health Promot Perspect, 2022; 12, 301−9. doi: 10.34172/hpp.2022.39 [42] Sharifi V, Hajebi A, Damari B, et al. Specialized outpatient services: community mental health centers (CMHCs). Iran J Psychiatry, 2021; 16, 87−93. [43] Cuadros DF, Awad SF, Abu-Raddad LJ. Mapping HIV clustering: a strategy for identifying populations at high risk of HIV infection in sub-Saharan Africa. Int J Health Geogr, 2013; 12, 28. doi: 10.1186/1476-072X-12-28 [44] O'Laughlin B, Bernstein H, Cousins B, et al. Introduction: agrarian change, rural poverty and land reform in South Africa since 1994. J Agrar Change, 2013; 13, 1−15. doi: 10.1111/joac.12010 [45] Strand KB, Chisholm D, Fekadu A, et al. Scaling-up essential neuropsychiatric services in Ethiopia: a cost-effectiveness analysis. Health Policy Plan, 2016; 31, 504−13. doi: 10.1093/heapol/czv093 [46] Zhong SL, Wang XP. Mental health policy, system, and services in China. In: Okpaku SO. Innovations in Global Mental Health. Springer. 2021, 331-44. [47] Feng ZX, Jones K, Phillips DR. Social exclusion, self-rated health and depression among older people in China: evidence from a national survey of older persons. Arch Gerontol Geriatr, 2019; 82, 238−44. doi: 10.1016/j.archger.2019.02.016 [48] Fang M, Hall BJ, Lin YQ, et al. Structural changes to enhance mental health services in China: experience and challenges. Asian J Psychiatry, 2019; 43, 177−8. doi: 10.1016/j.ajp.2019.05.029 [49] Lociks de Araujo C. Mental health system reform in Brazil: innovation and challenges for sustainability. In: Okpaku SO. Innovations in Global Mental Health. Springer. 2021, 223-43. [50] Agência Nacional de Saúde Suplementar of Brazil. Mapa da utilização do SUS por beneficiários de planos privados de saúde. http://www.ans.gov.br/images/stories/Materiais_para_pesquisa/Materiais_por_assunto/beneficiarios_sus_2017.pdf. [2023-12-22]. [51] Mair C, Diez Roux AV, Morenoff JD. Neighborhood stressors and social support as predictors of depressive symptoms in the Chicago Community Adult Health Study. Health Place, 2010; 16, 811−9. doi: 10.1016/j.healthplace.2010.04.006 -

 点击查看大图
计量
- 文章访问数: 30
- HTML全文浏览量: 12
- PDF下载量: 0
- 被引次数: 0

 Quick Links