-
As the social economy develops and lifestyles evolve, especially with the rapid aging of the population and ongoing urbanization, unhealthy habits among residents have become more widespread and concerning. The impact of cardiovascular disease (CVD) risk factors on public health has grown significantly, with the incidence of CVD continuing to rise. As a result, CVD has placed an increasingly heavy economic burden on both individuals and society and has emerged as a major public health challenge. Therefore, there is an urgent need to strengthen the government-led CVD prevention and control efforts. Since 2005, the National Center for Cardiovascular Diseases has organized experts from relevant national fields to compile the Report on Cardiovascular Health and Diseases in China (hereafter referred to as the “Annual Report”). This year marks the 20th anniversary of the publication of annual reports. Over the past 20 years, the Annual Report, as a leading source of information on CVD prevention and control, has reflected the dedication of generations of expert reviewers, authors, and publishers. It has also embodied the vision of leaders in cardiovascular medicine and has played a vital role in China’s efforts in CVD prevention and control. This article interprets the key contents of the newly published Report on Cardiovascular Health and Diseases in China 2024[1], aiming to provide a scientific basis for CVD prevention and control and the formulation of relevant policies.
-
According to data from the Global Burden of Disease (GBD) study, the number of CVD cases, incidence rate, and standardized incidence rate in China’s total population increased from 5.3007 million cases, 447.81 per 100,000, and 646.20 per 100,000 in 1990 to 12.3411 million cases, 867.65 per 100,000, and 652.21 per 100,000 in 2019, respectively. The age-standardized incidence rate of CVD among Chinese residents showed an overall upward trend from 1990 to 2019, and the predicted incidence, mortality, and disability-adjusted life years (DALY) rates of CVD are expected to continue rising from 2020 to 2030[2].
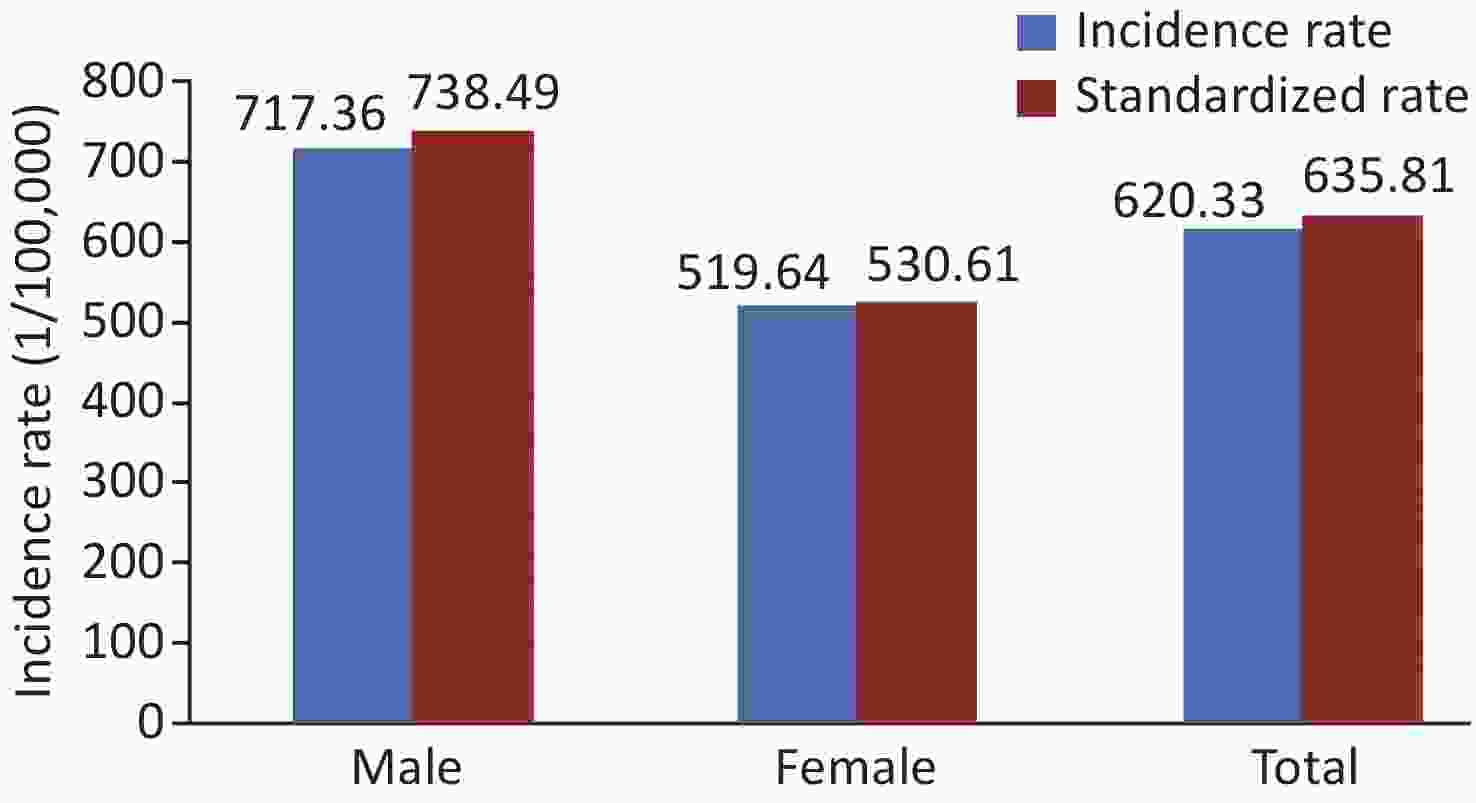
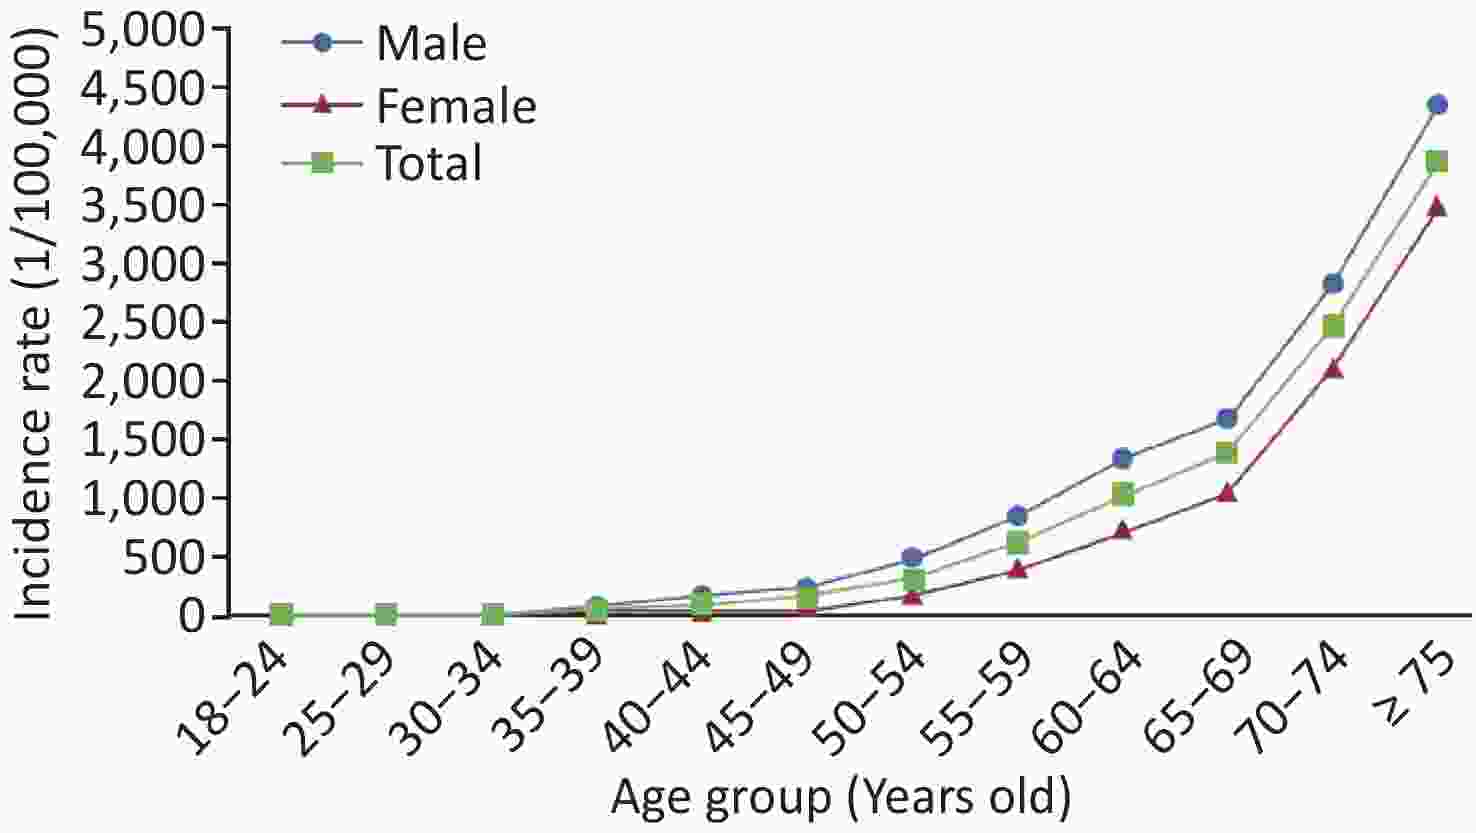
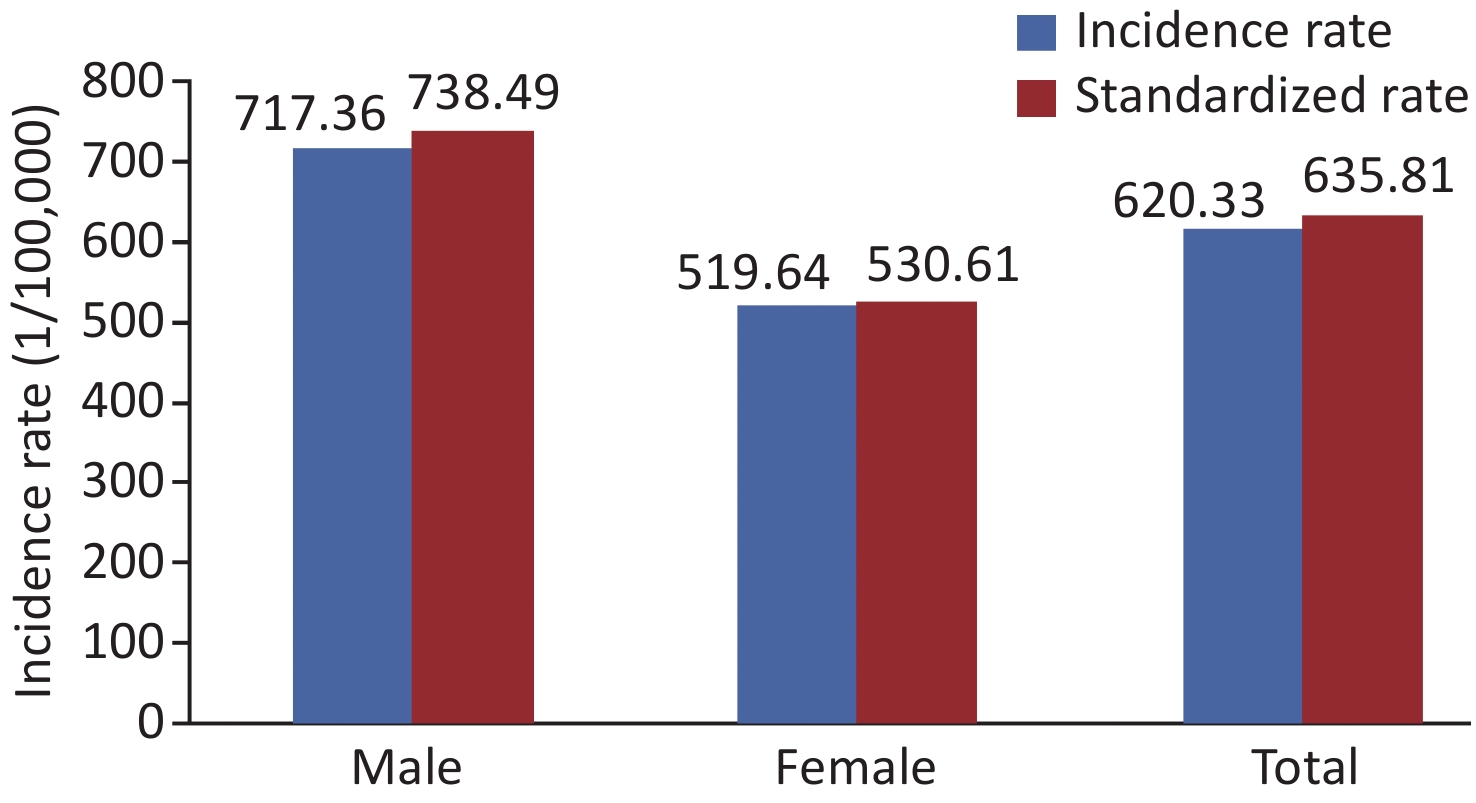
Between January and December 2023, a statistical analysis of data from 262 monitoring sites across 30 provinces (autonomous regions, municipalities directly under the Central Government) and the Xinjiang Production and Construction Corps in the “Surveillance of Cardiovascular and Cerebrovascular Events among Chinese Residents” project found that the crude incidence rate of cardiovascular and cerebrovascular diseases [including acute myocardial infarction (AMI), angina pectoris with percutaneous transluminal coronary angioplasty (PTCA)/stent implantation and/or coronary artery bypass graft (CABG), stroke, and sudden cardiac death] among Chinese residents aged 18 years and above was 620.33 per 100,000 (age-standardized rate: 635.81 per 100,000). The incidence rate among male (crude rate: 717.36 per 100,000; standardized rate: 738.49 per 100,000) was higher than that among female (crude rate: 519.64 per 100,000; standardized rate: 530.61 per 100,000) (Figure 1). The incidences of cardiovascular and cerebrovascular diseases showed a rapidly increasing trend with increasing age (Figure 2).
-
In 2021, the mortality rate of CVD remained the highest, exceeding that of tumors and other diseases (Figures 3, 4)[3].
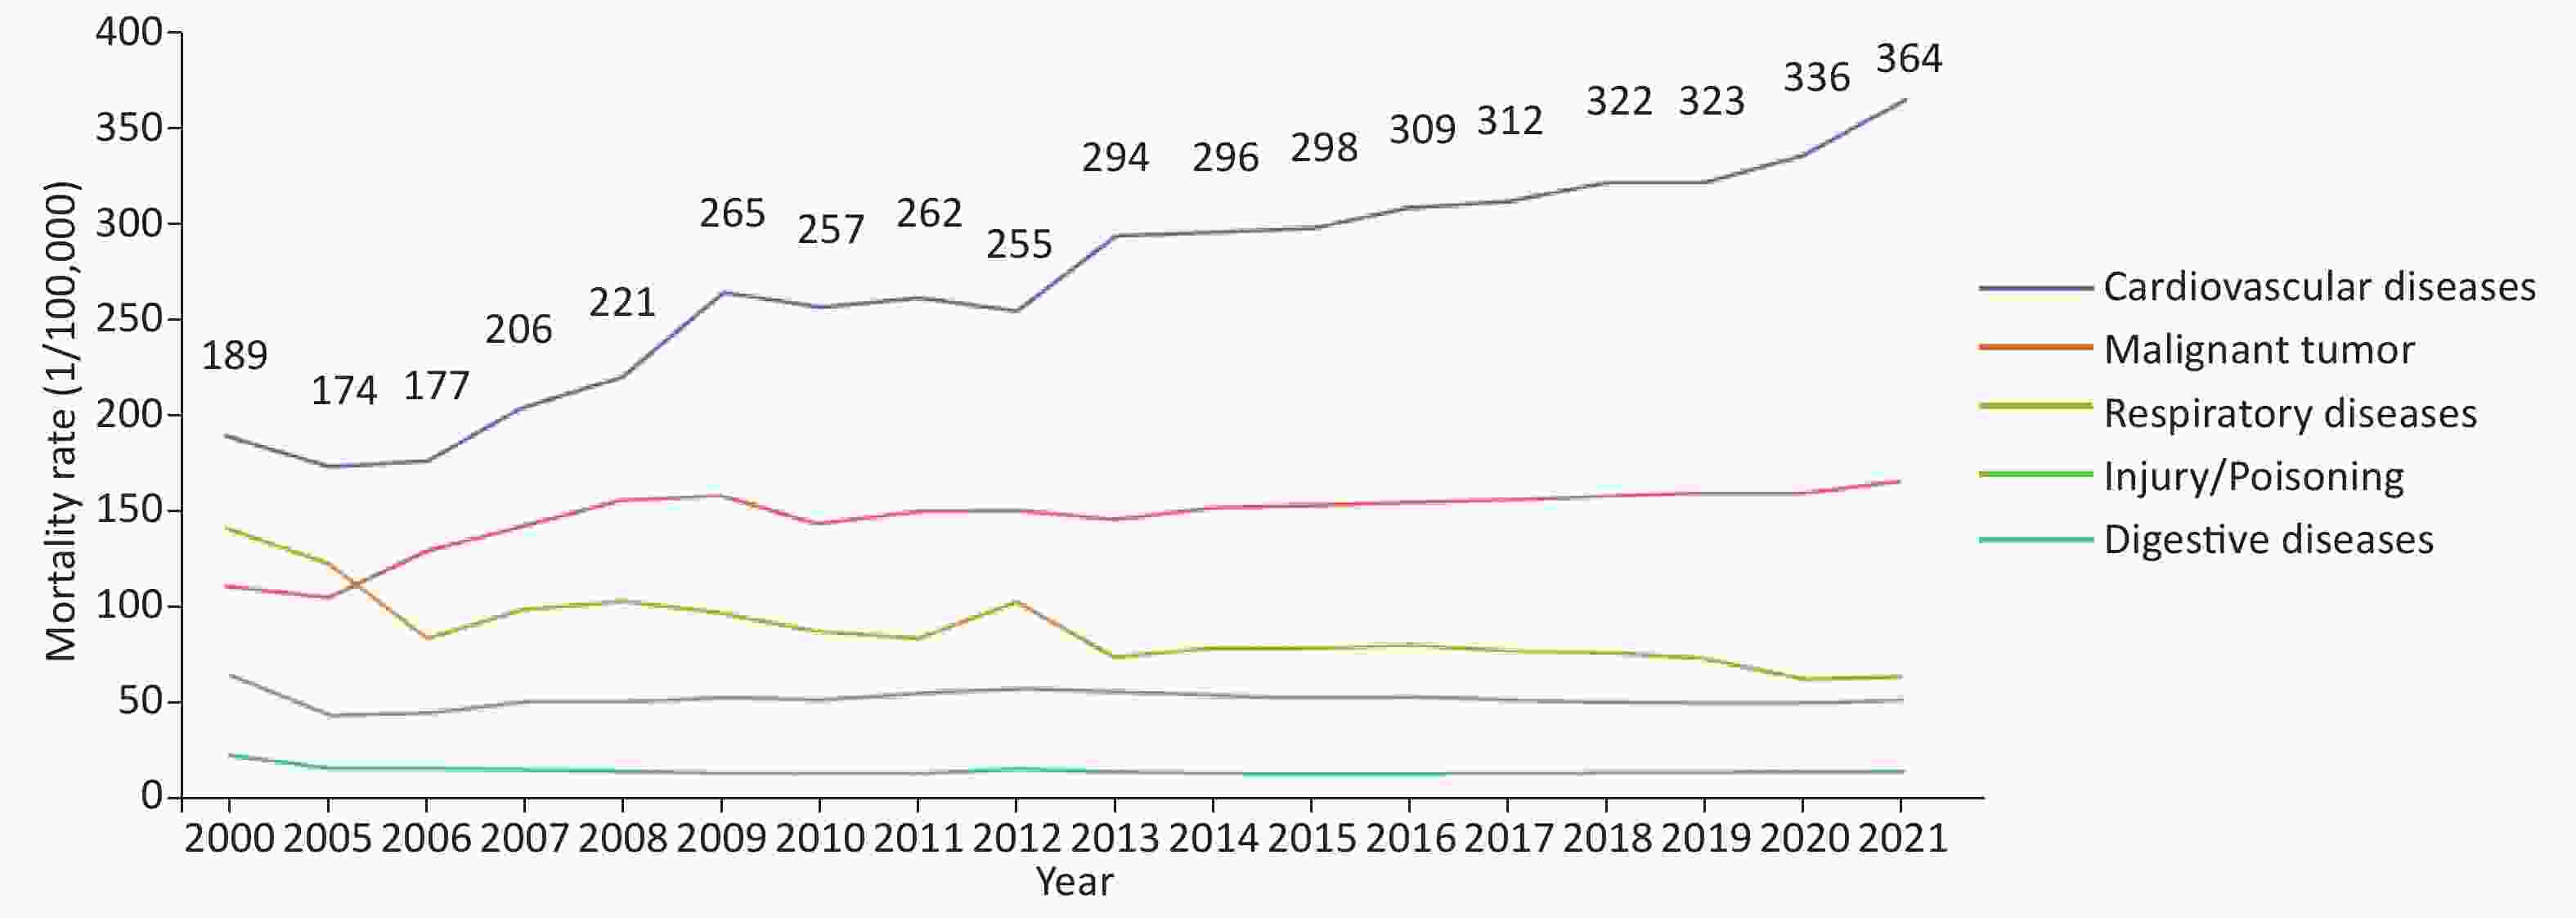
Figure 3. Changes in mortality rates of major diseases among rural residents in China between 2000 and 2021.
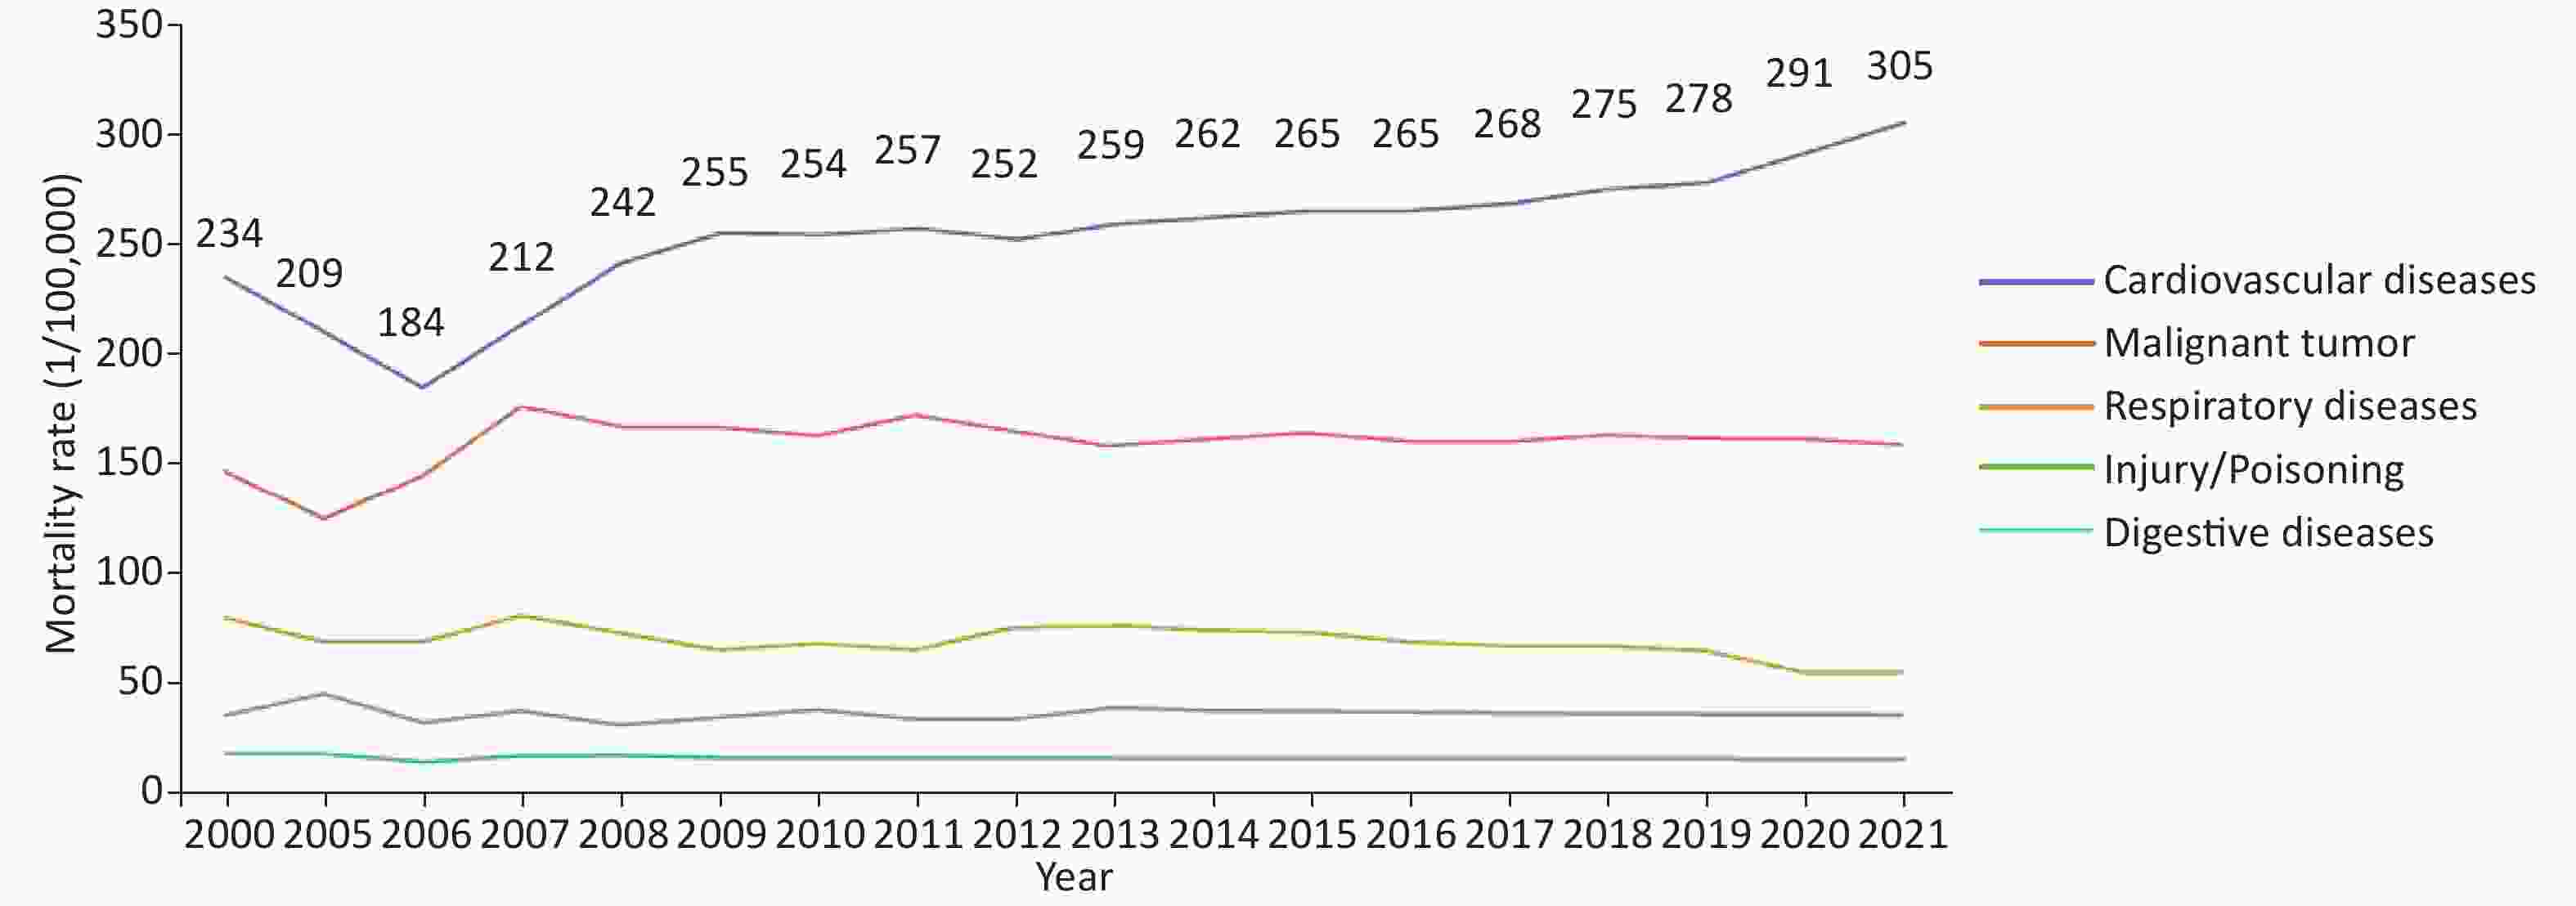
Figure 4. Changes in mortality rates of major diseases among urban residents in China between 2000 and 2021.
Since 2009, the CVD mortality rate in rural areas exceeded and remained higher than that in urban areas (Figure 5). In 2021, the crude CVD mortality rate in rural areas was 364.16 per 100,000, with heart disease accounting for 188.58 per 100,000. In urban areas, the crude CVD mortality rate was 305.39 per 100,000, with heart disease accounting for 165.37 per 100,000, indicating higher mortality rates in rural areas than in urban areas. The mortality rate of coronary heart disease (CHD) in both urban and rural areas was higher in male than in female[3].
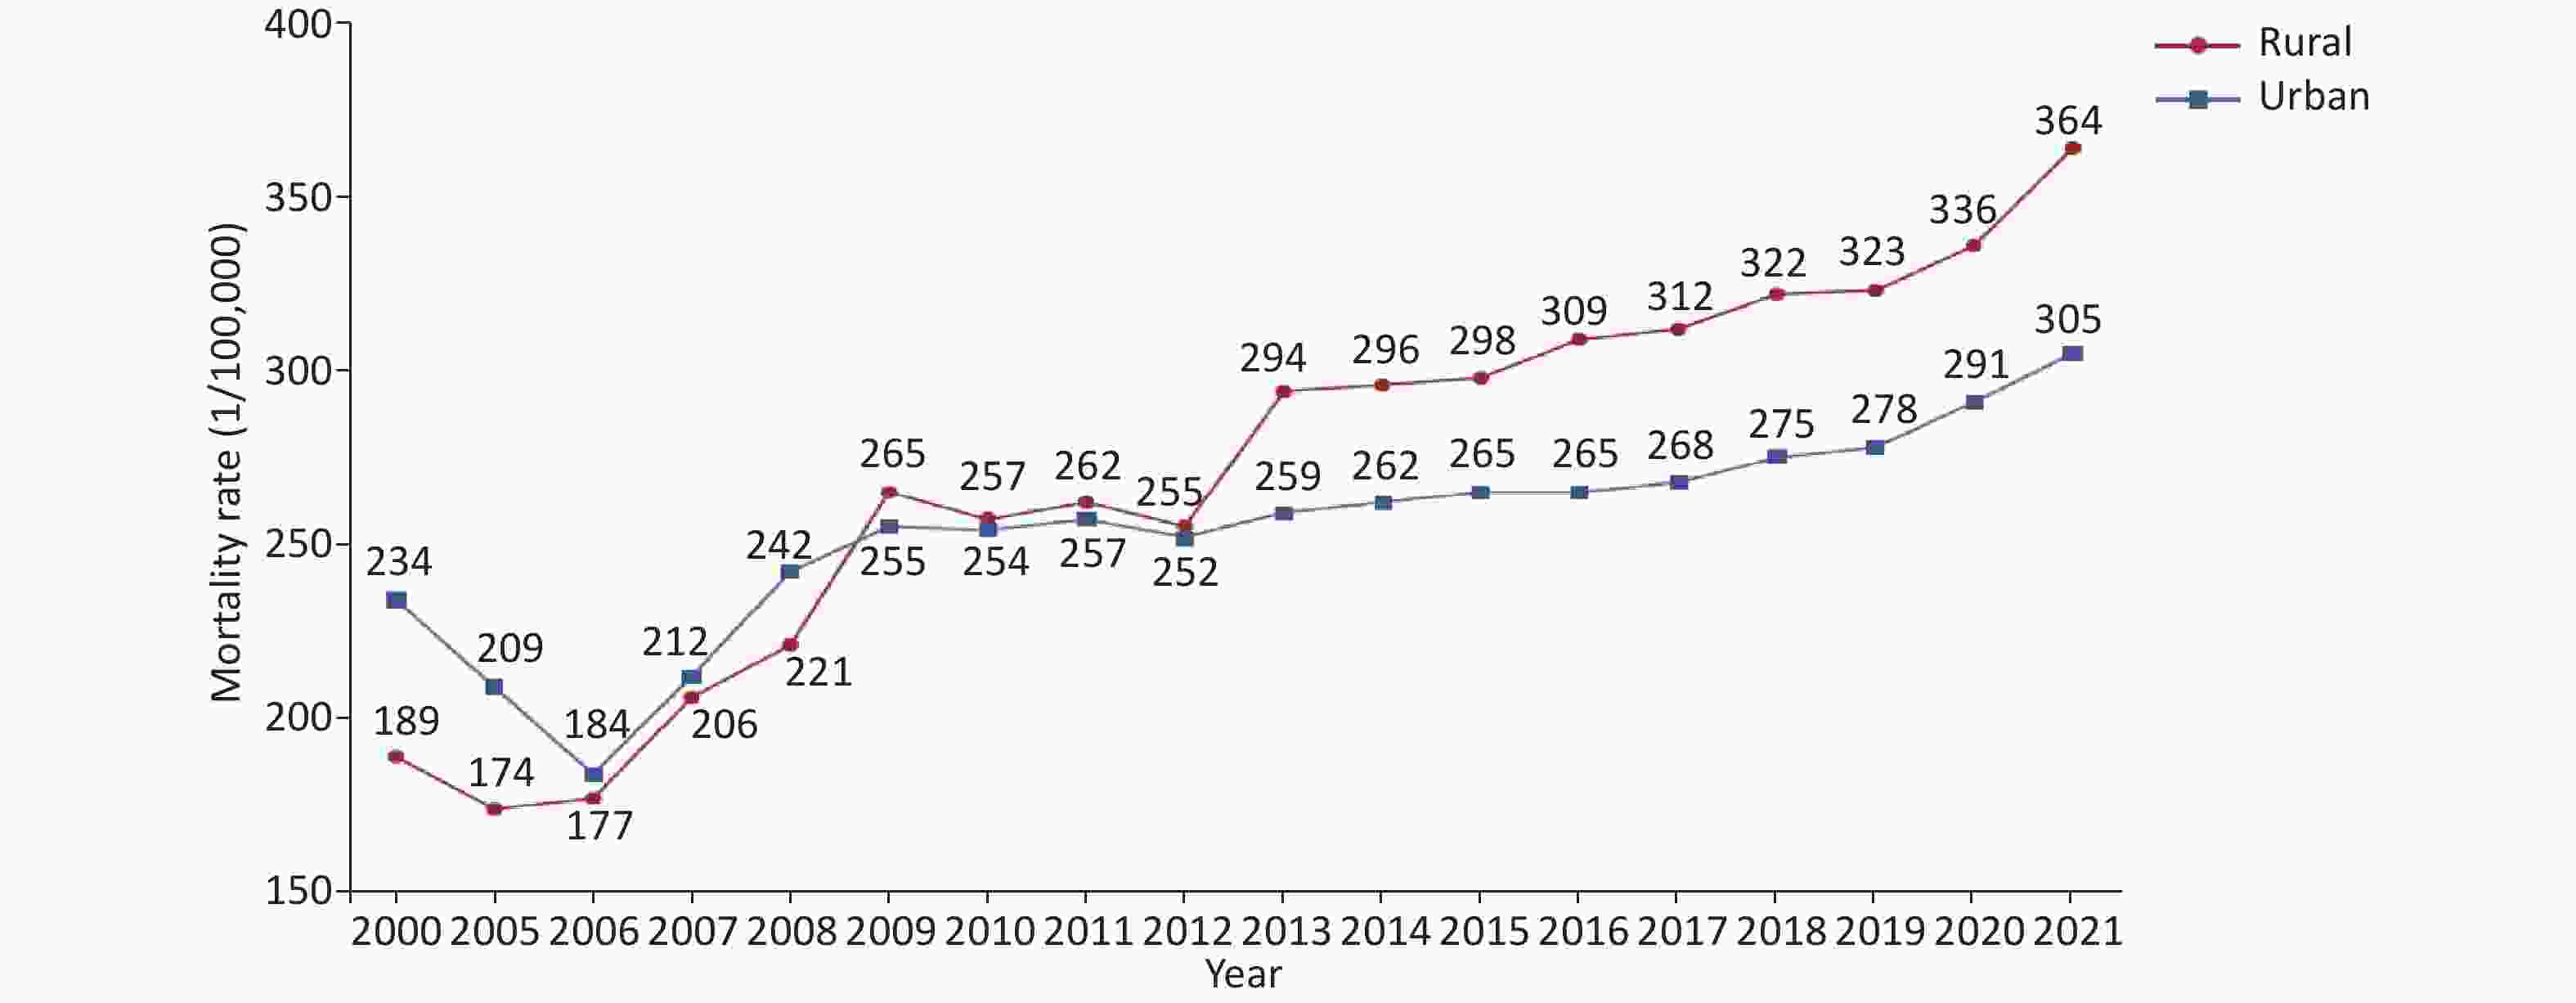
Figure 5. Changes in the mortality rate of cardiovascular diseases among urban and rural residents in China between 2000 and 2021.
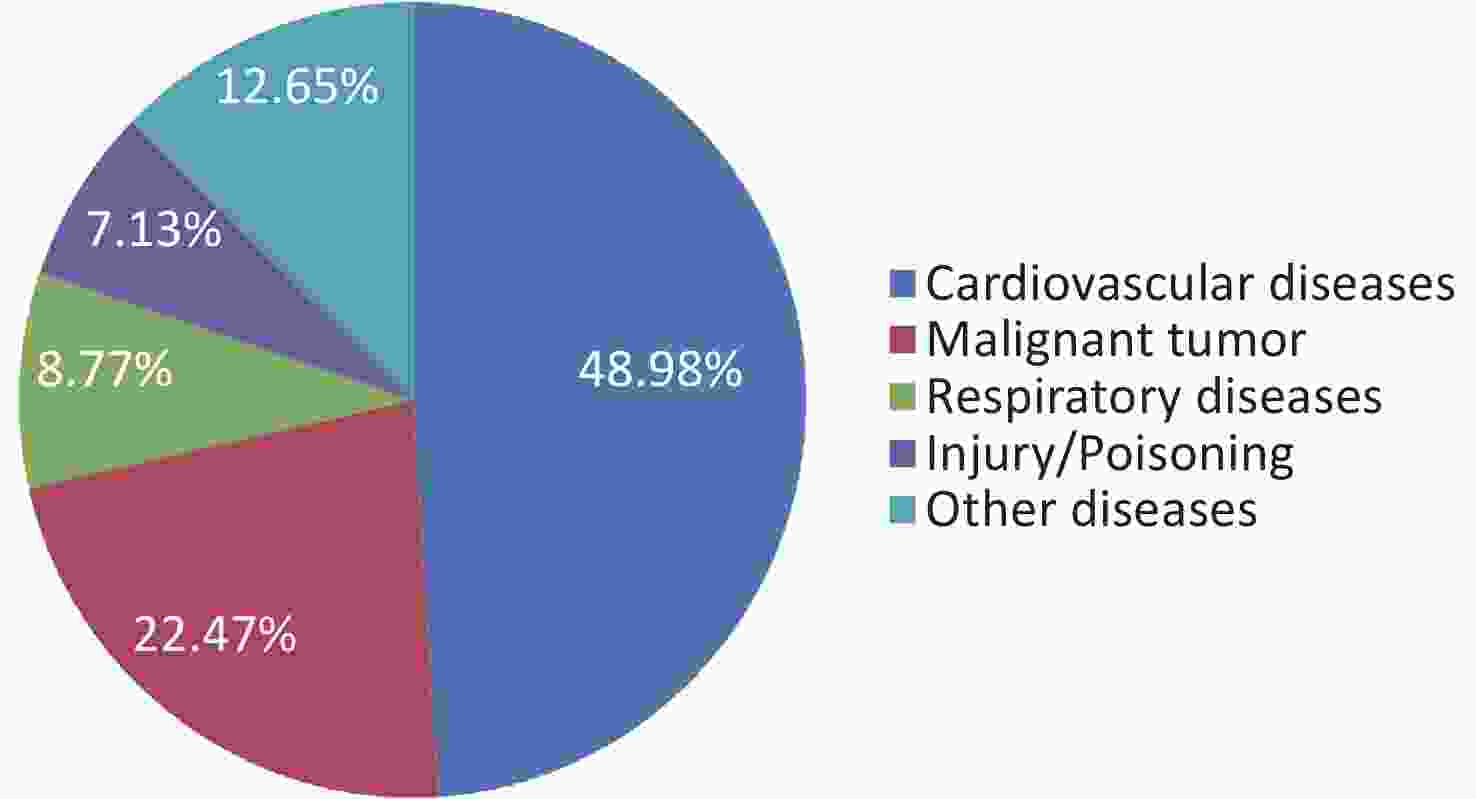
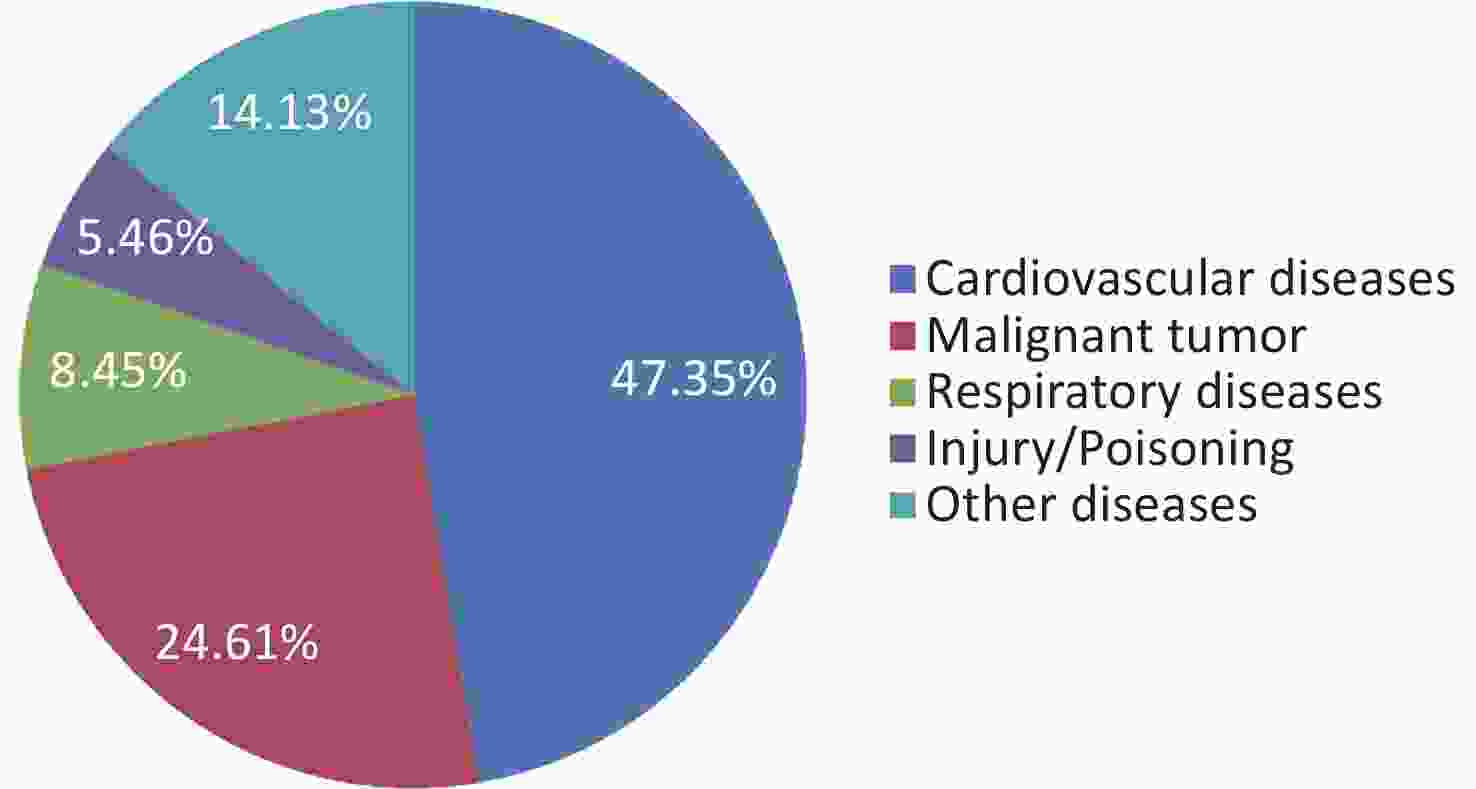
In 2021, CVD was the leading cause of death in both urban and rural areas, accounting for 48.98% of total deaths in rural regions and 47.35% in urban areas.
CVD accounted for the highest proportion of deaths among both urban and rural residents. In 2021, it was responsible for 48.98% of deaths in rural areas and 47.35% in urban areas (Figures 6, 7).
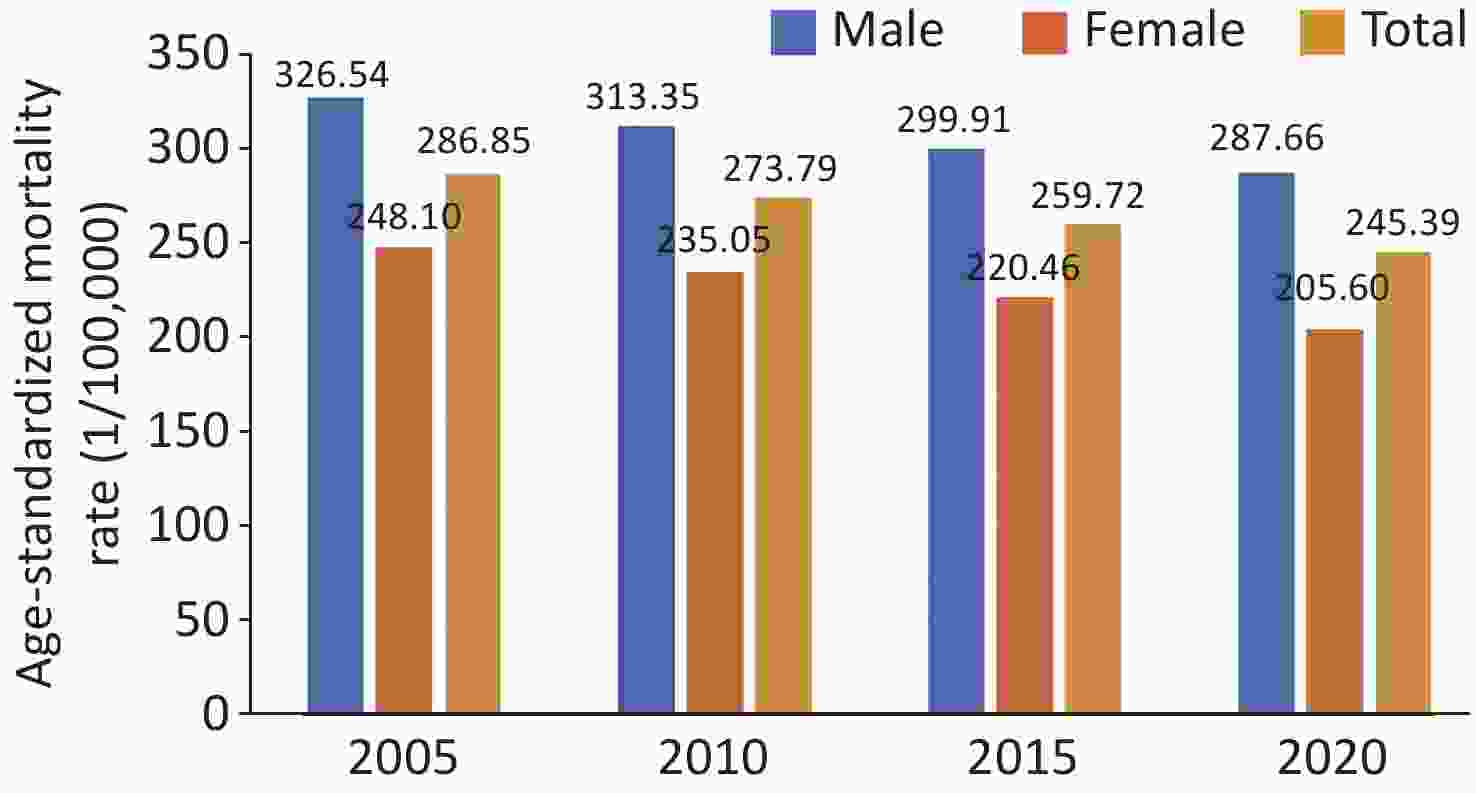
According to data from the National Mortality Surveillance System (NMSS),[4] the age-standardized mortality rate (ASMR) of CVD in China decreased from 286.85 per 100,000 in 2005 to 245.39 per 100,000 in 2020. The ASMR for males was consistently higher than that for females in each survey year (Figure 8). In 2020, the burden of premature CVD deaths decreased by 19.27% compared to 2005. Despite this reduction, the burden of premature CVD deaths remains high, and the absolute number of CVD deaths continues to rise. In 2020, the number of CVD deaths increased by 48.06% compared to that in 2015, primarily due to population aging, followed by population growth. In 2020, ischemic heart disease (IHD), hemorrhagic stroke, and ischemic stroke were the three main causes of CVD deaths in China. Among individuals aged 15–50 years, IHD accounted for 50%–60% of the premature CVD death burden. There were significant regional differences in the number of CVD deaths, its subcategories, and ASMR, with lower rates observed in economically developed regions compared to economically underdeveloped regions.
-
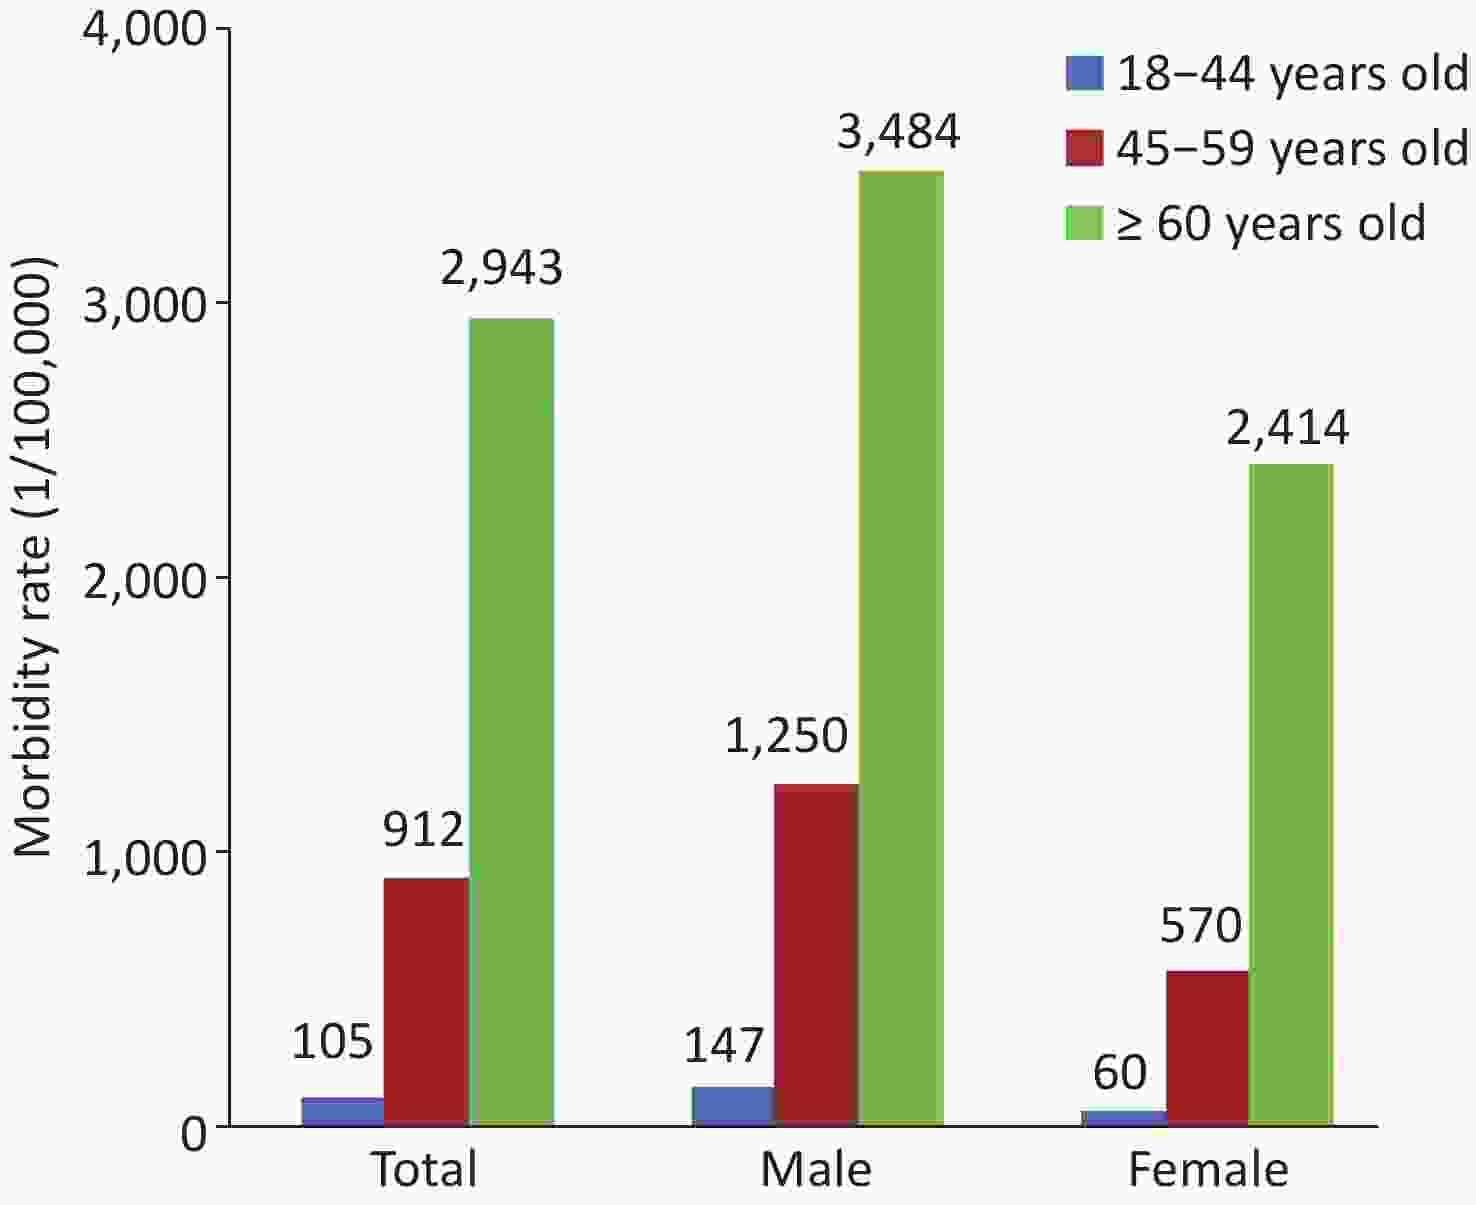
Between 2020 and 2022, the China Cardiovascular Disease and Risk Factors Surveillance Project was conducted in 31 provinces (autonomous regions and municipalities directly under the central government) with 262 monitoring sites. Preliminary results showed that the morbidity of CHD (including myocardial infarction, stent implantation surgery, CABG, and hospitalization for unstable angina) among residents aged 18 years and older in China was 758 per 100,000. Morbidity was higher in males (940 per 100,000) than in females (570 per 100,000) and higher in urban areas (892 per 100,000) than in rural areas (639 per 100,000). Morbidity due to CHD increased rapidly with age. The morbidity of CHD among residents of different sexes and ages is shown in Figure 9.
-
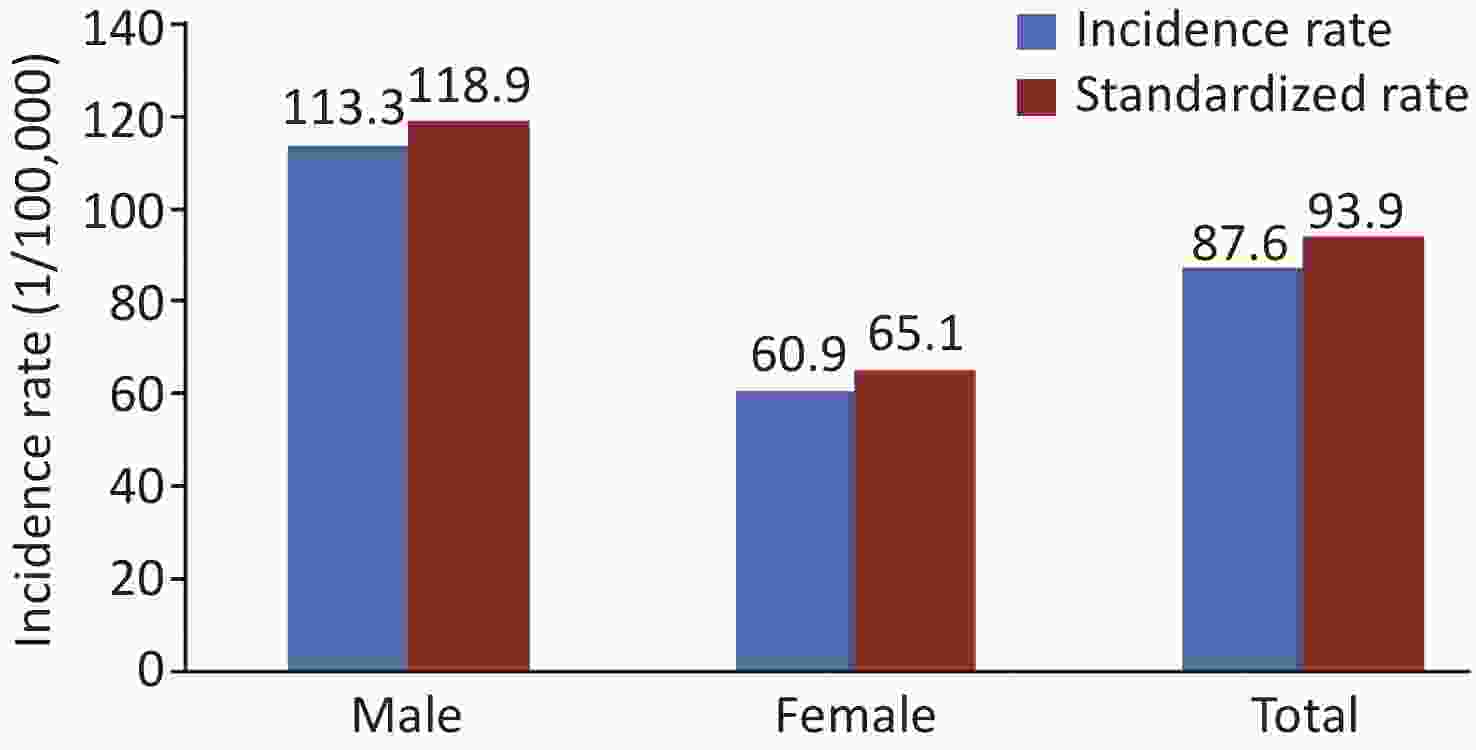
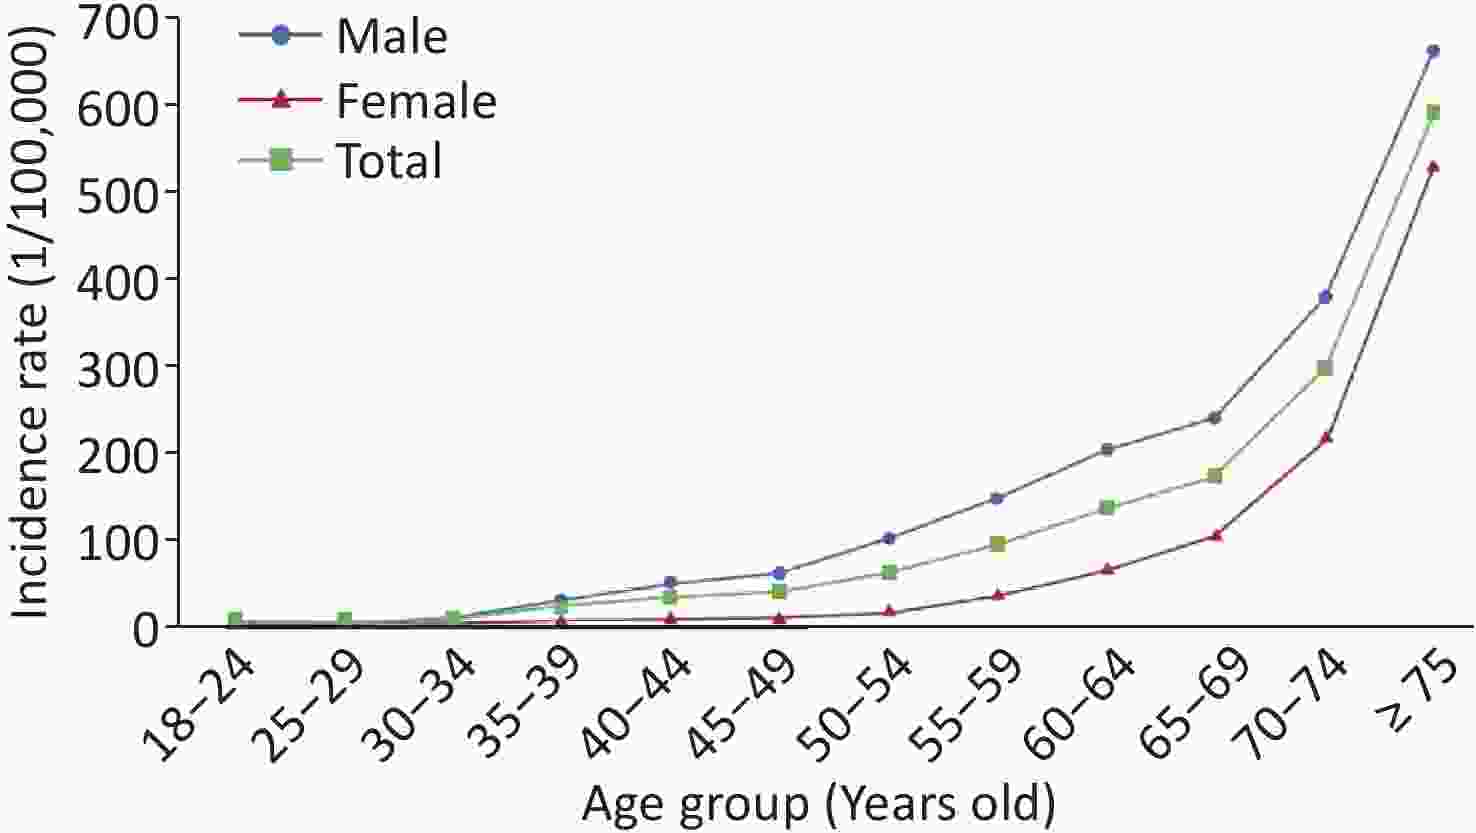
Between January and December 2023, data from the “Surveillance of Cardiovascular and Cerebrovascular Events among Chinese Residents” project, covering 30 provinces (autonomous regions, municipalities directly under the central government) and the Xinjiang Production and Construction Corps, with 262 monitoring sites, showed that the crude incidence rate of AMI among residents aged 18 years and above was 87.6 per 100,000 (age-standardized rate 93.9 per 100,000), higher in males (113.3 per 100,000) than in females (60.9 per 100,000). The incidence of AMI increased rapidly with age (Figures 10 and 11).
-
Data from the China Health Statistics Yearbook 2022[3] showed that in 2021, the crude mortality rates of CHD in urban and rural residents in China were 135.08 per 100, 000, and 148.19 per 100, 000, respectively. The CHD mortality rate in both urban and rural areas was higher in males than in females (Figure 12).
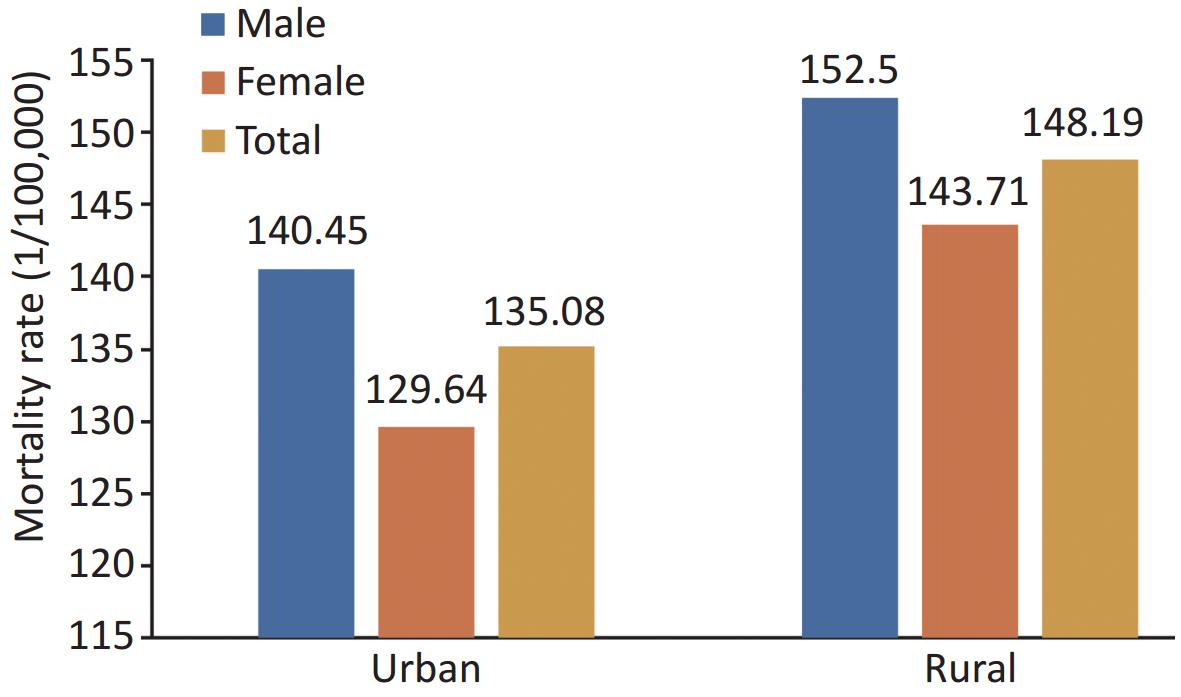
Figure 12. Mortality rate of coronary heart disease by sex in urban and rural areas of China in 2021.
The mortality rate of CHD has continued to increase since 2012 (Figure 13), with a notable increase in rural areas, surpassing urban rates by 2016.
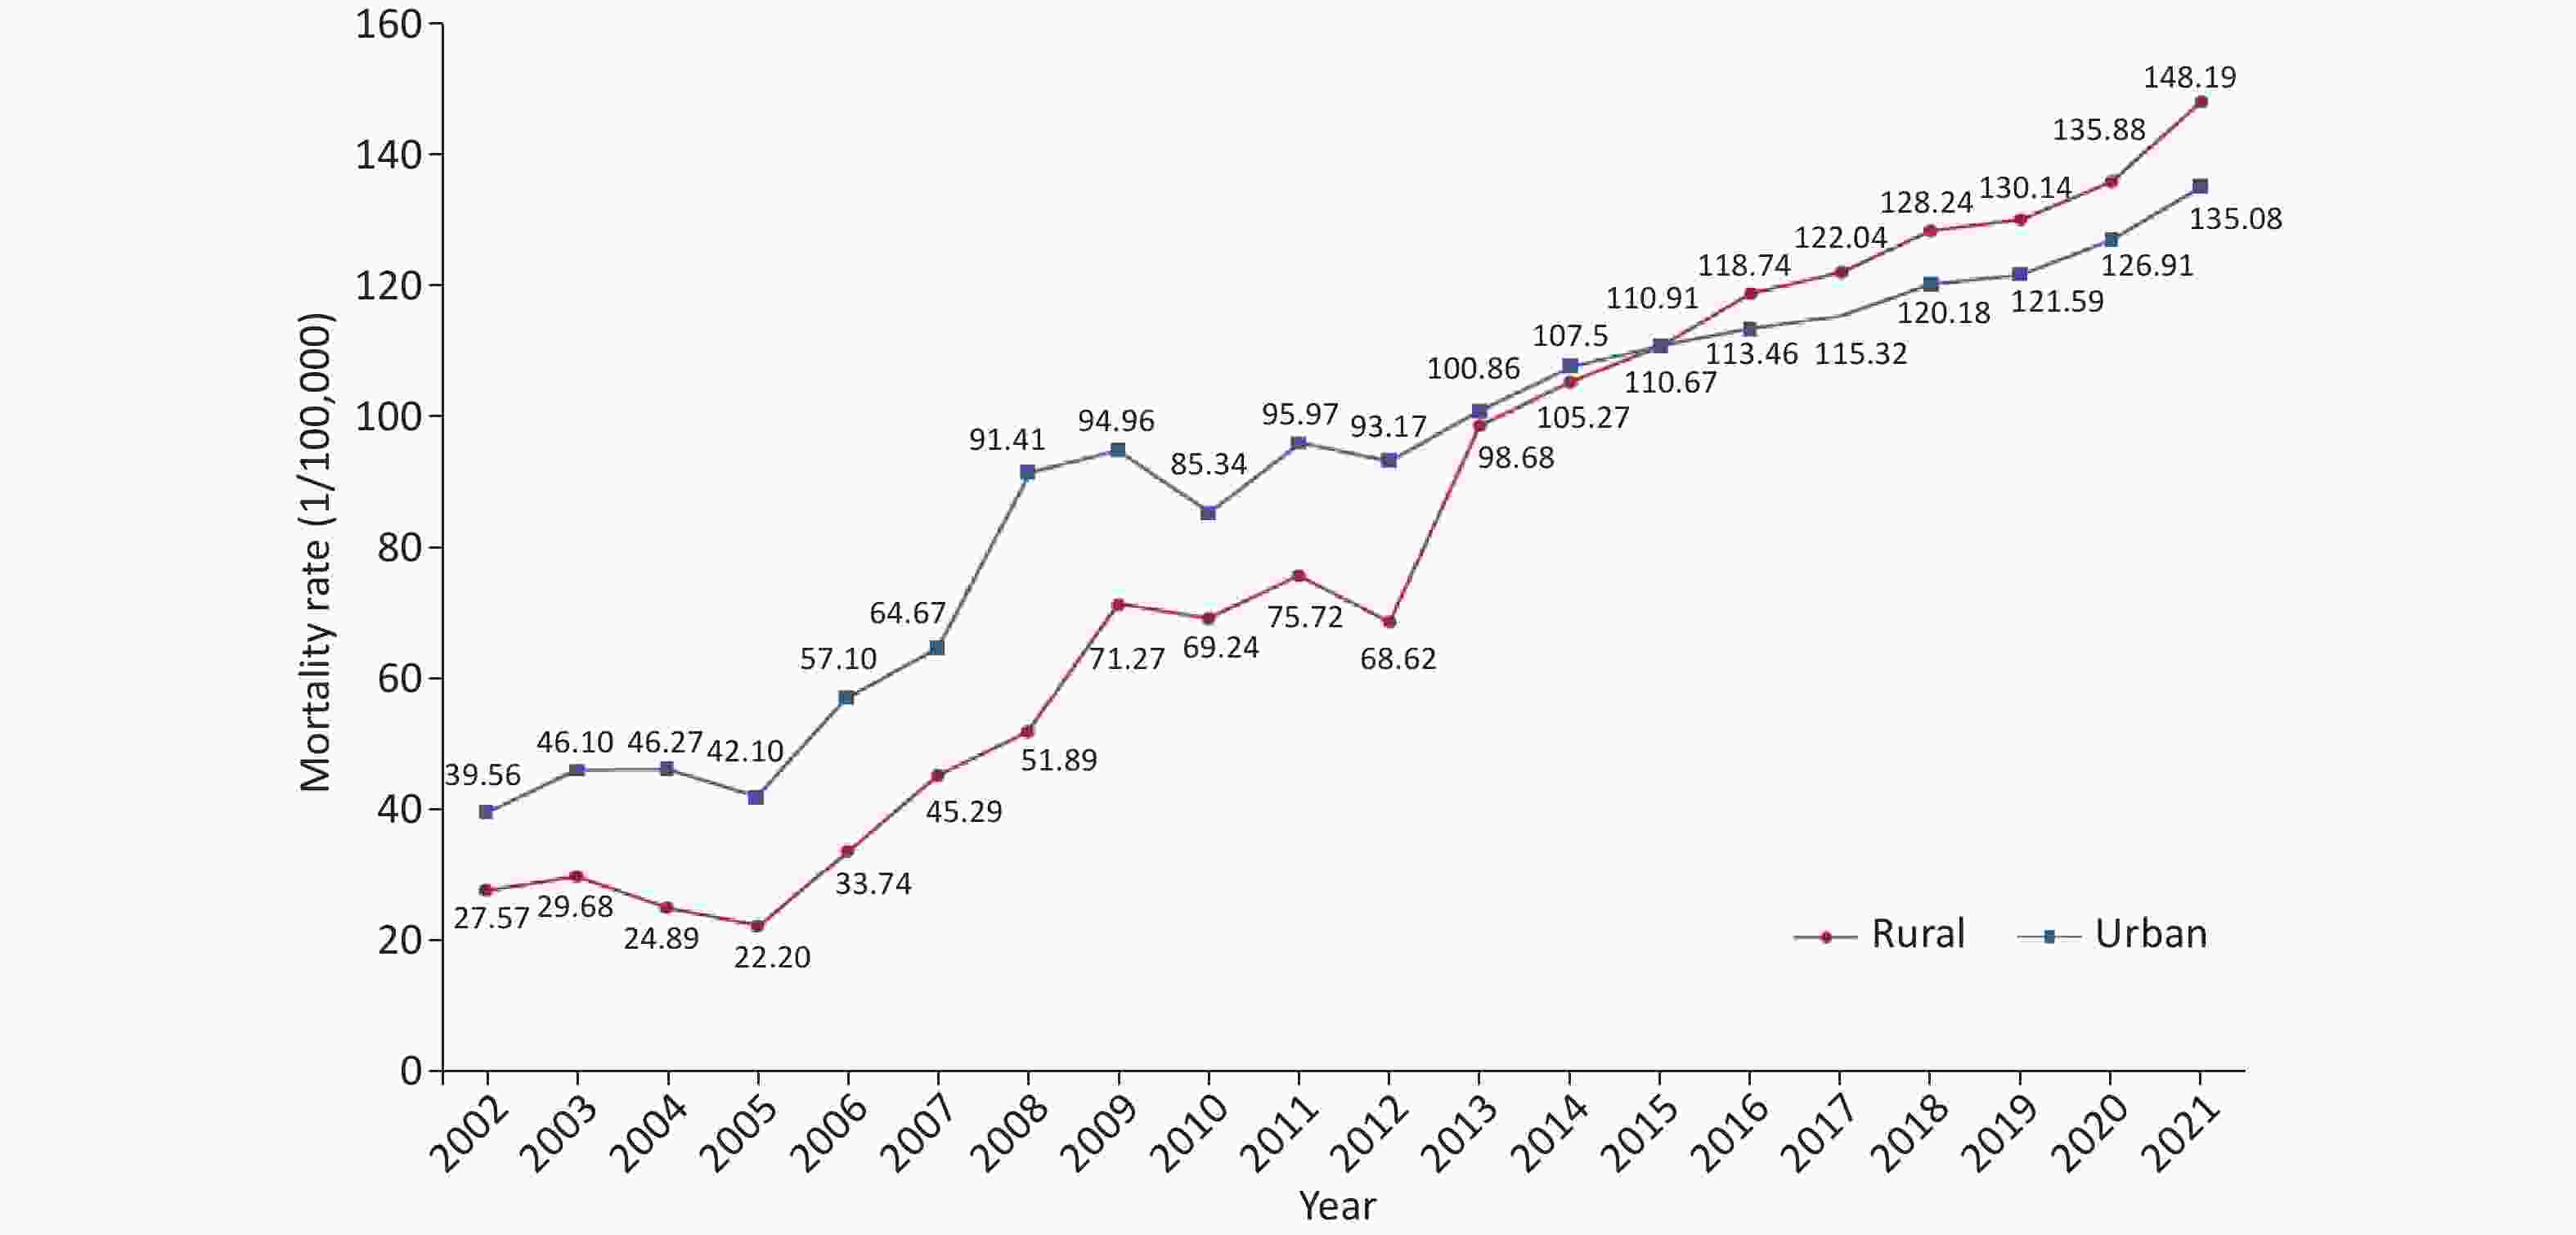
Figure 13. Changing trend of coronary heart disease mortality in urban and rural areas of China between 2002 and 2021.
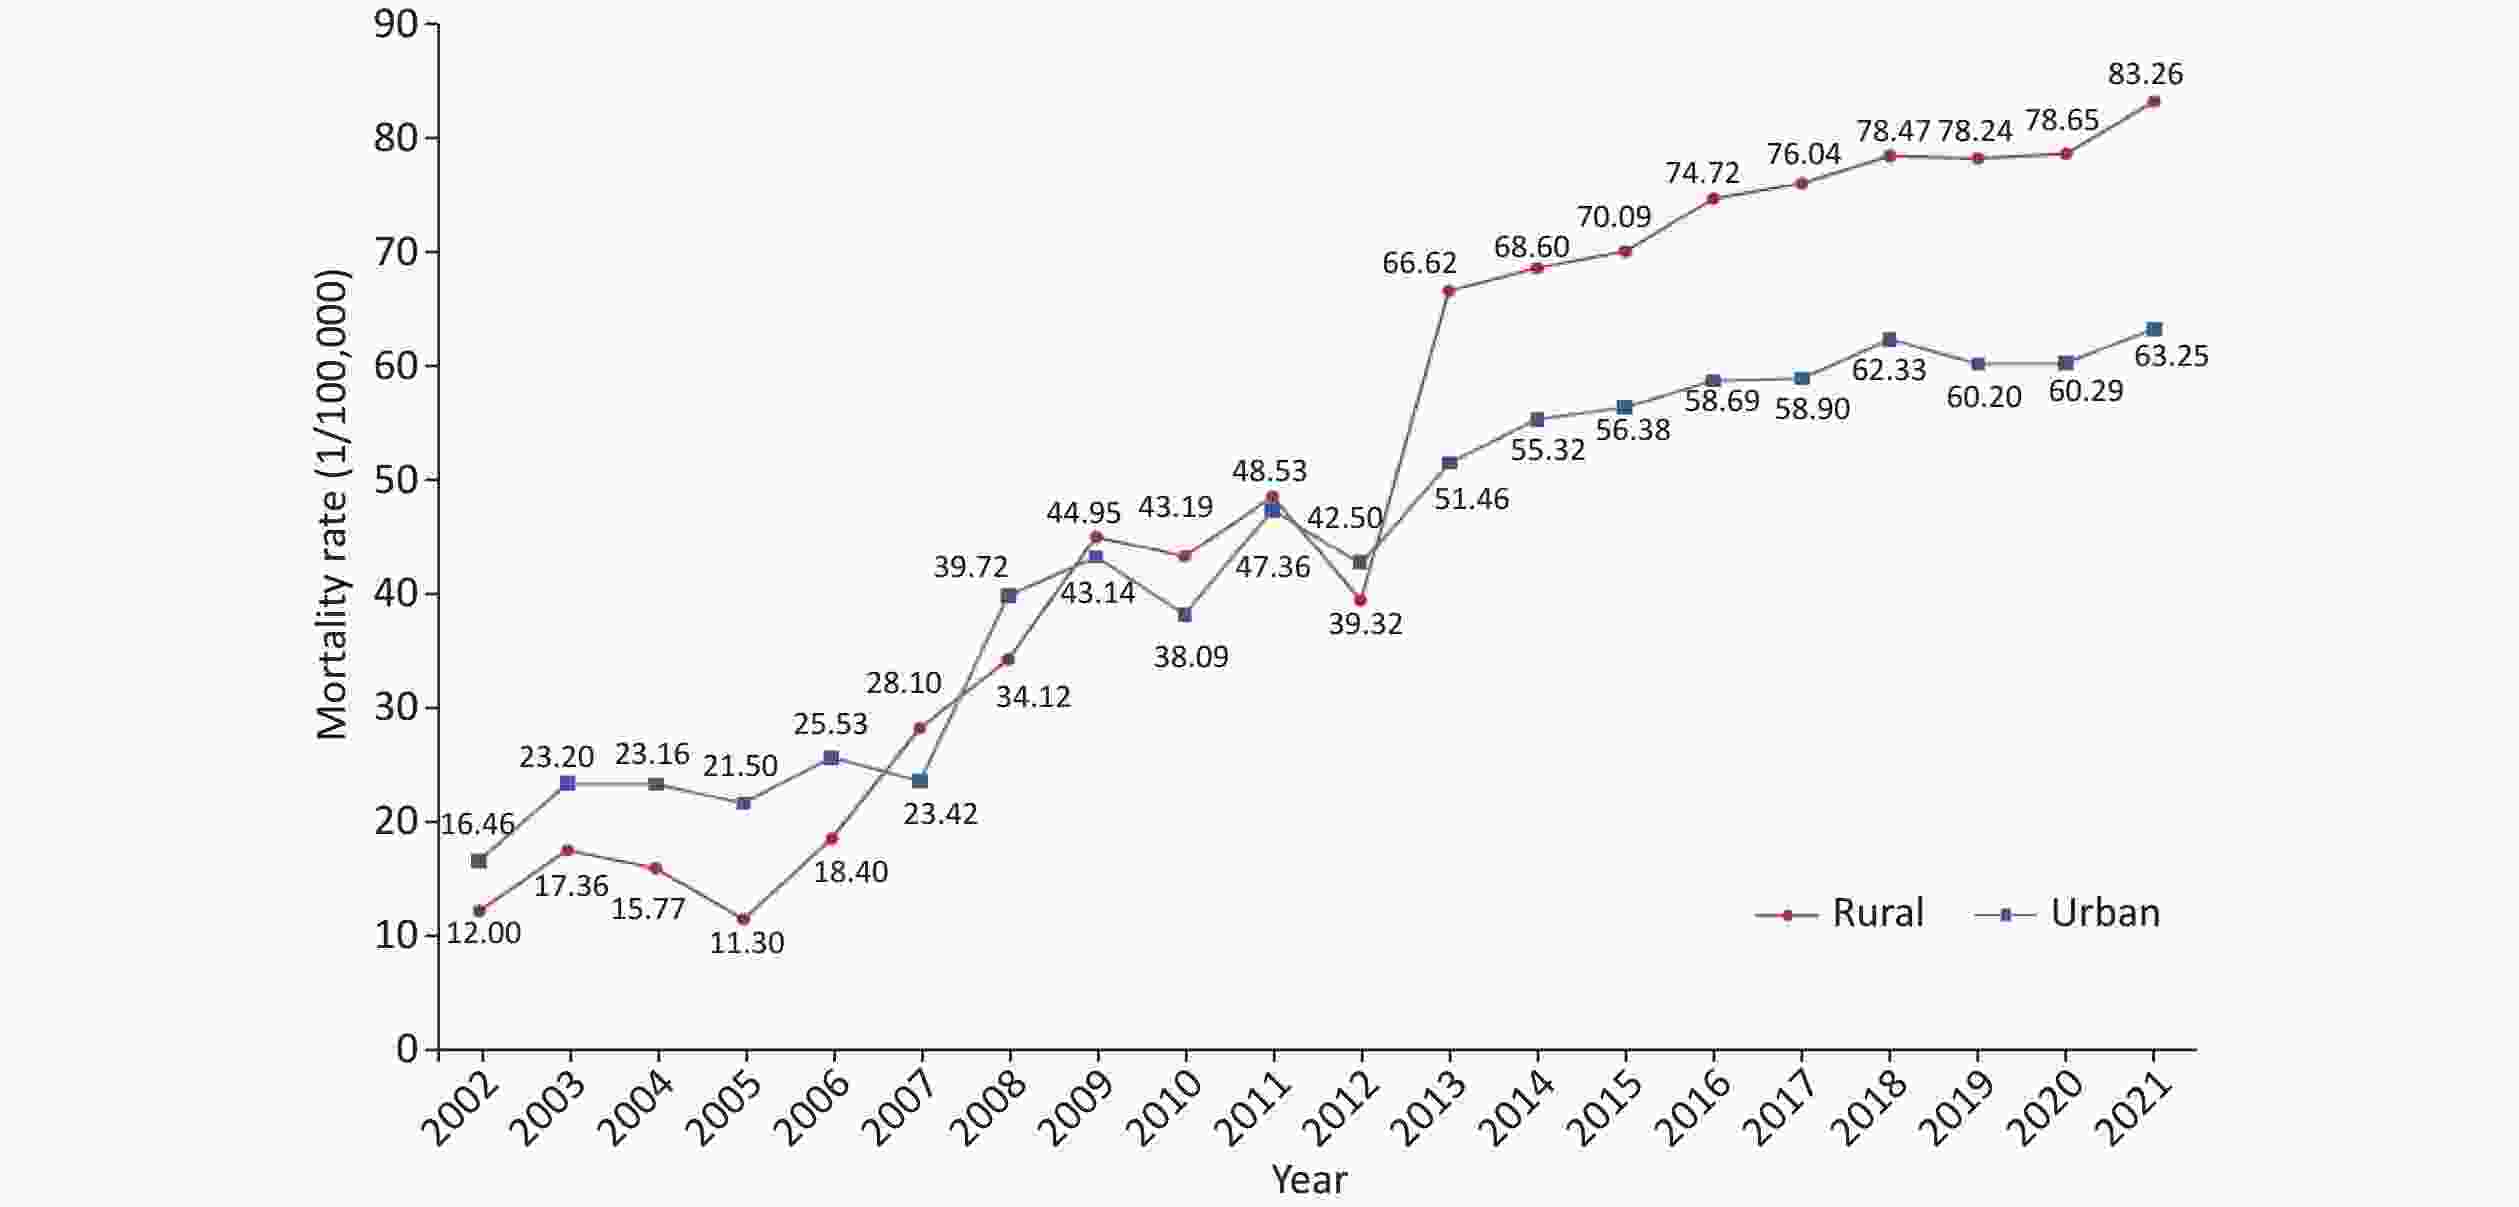
Between 2002 and 2021, the mortality rate of AMI showed an overall upward trend. Since 2005, the mortality rate associated with AMI has rapidly increased. The mortality rate of AMI in rural areas not only exceeded that of urban areas in 2007, 2009, 2010, and 2011 but also increased significantly from 2012, remaining higher than that of urban areas since 2013 (Figure 14).
-
According to the GBD 2021 study, there were 26.34 million stroke patients in China in 2021, representing a 145.4% increase compared to 1990. Among stroke subtypes, ischemic stroke (IS) had the largest rise in prevalence (216.3%), followed by intracerebral hemorrhage (ICH) with a 40.8% increase, and subarachnoid hemorrhage (SAH) with a 19.8% increase. In 2021, the age-standardized prevalence of stroke was 1,301.4 per 100,000 population, comprising 1,018.8 for IS, 222.1 for HS, and 68.9 for SAH. Compared to 1990, the overall age-standardized prevalence increased by 11.5%. IS rose by 34.2%, whereas HS and SAH decreased by 28.0% and 36.2%, respectively.
-
According to the GBD 2021 study, China recorded 4.09 million new stroke cases in 2021, a 142.6% increase from 1990. Among stroke subtypes, IS showed the greatest increase in incidence (264.2%), followed by HS with a 51.6% rise, whereas SAH saw a slight decline of 3.6%. In 2021, the age-standardized incidence rate of stroke was 204.8/100,000 population, 135.8 for IS, 61.8 for HS, and 7.8 for SAH. Compared to 1990, the overall age-standardized incidence rate of stroke decreased by 9.8%, with HS and SAH decreasing by 43.9% and 56.5%, respectively, whereas the rate for IS increased by 35.7%.
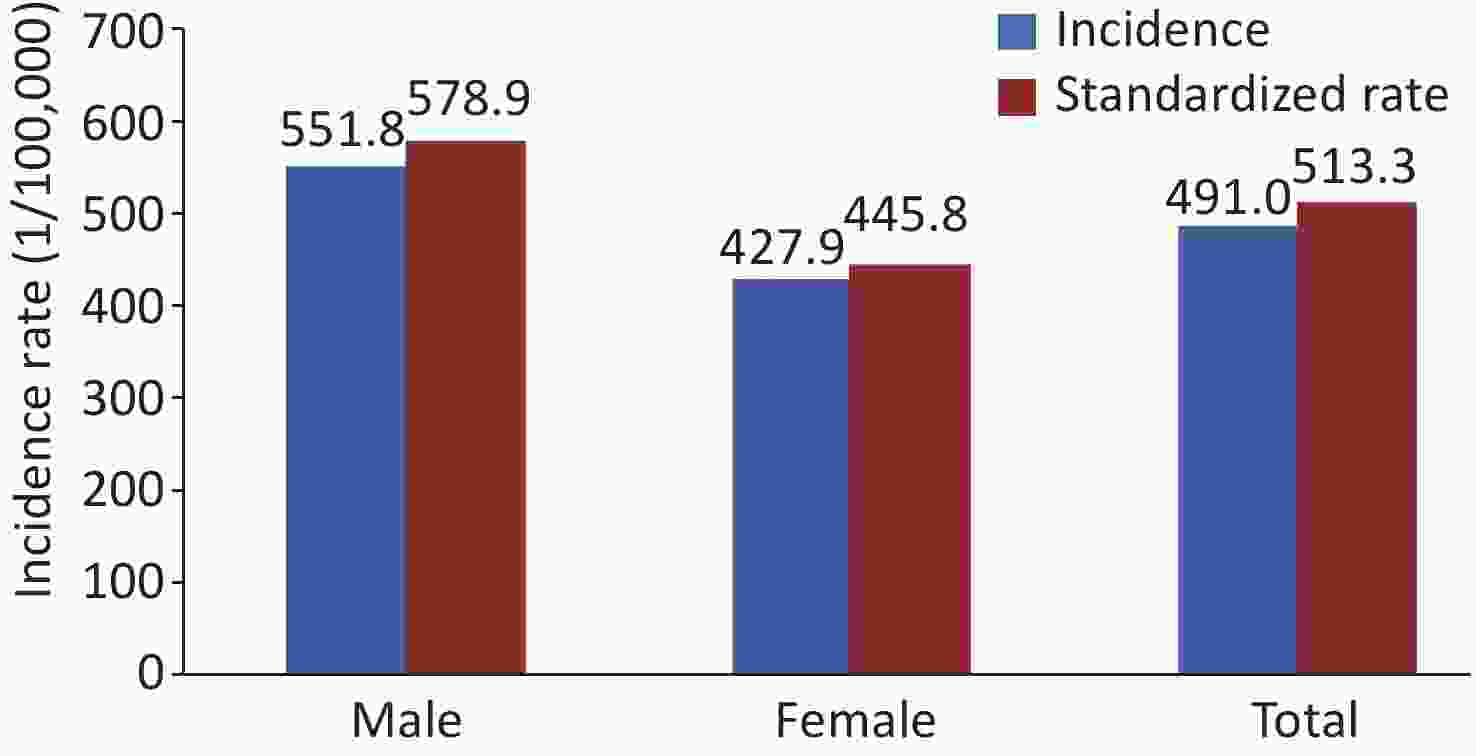
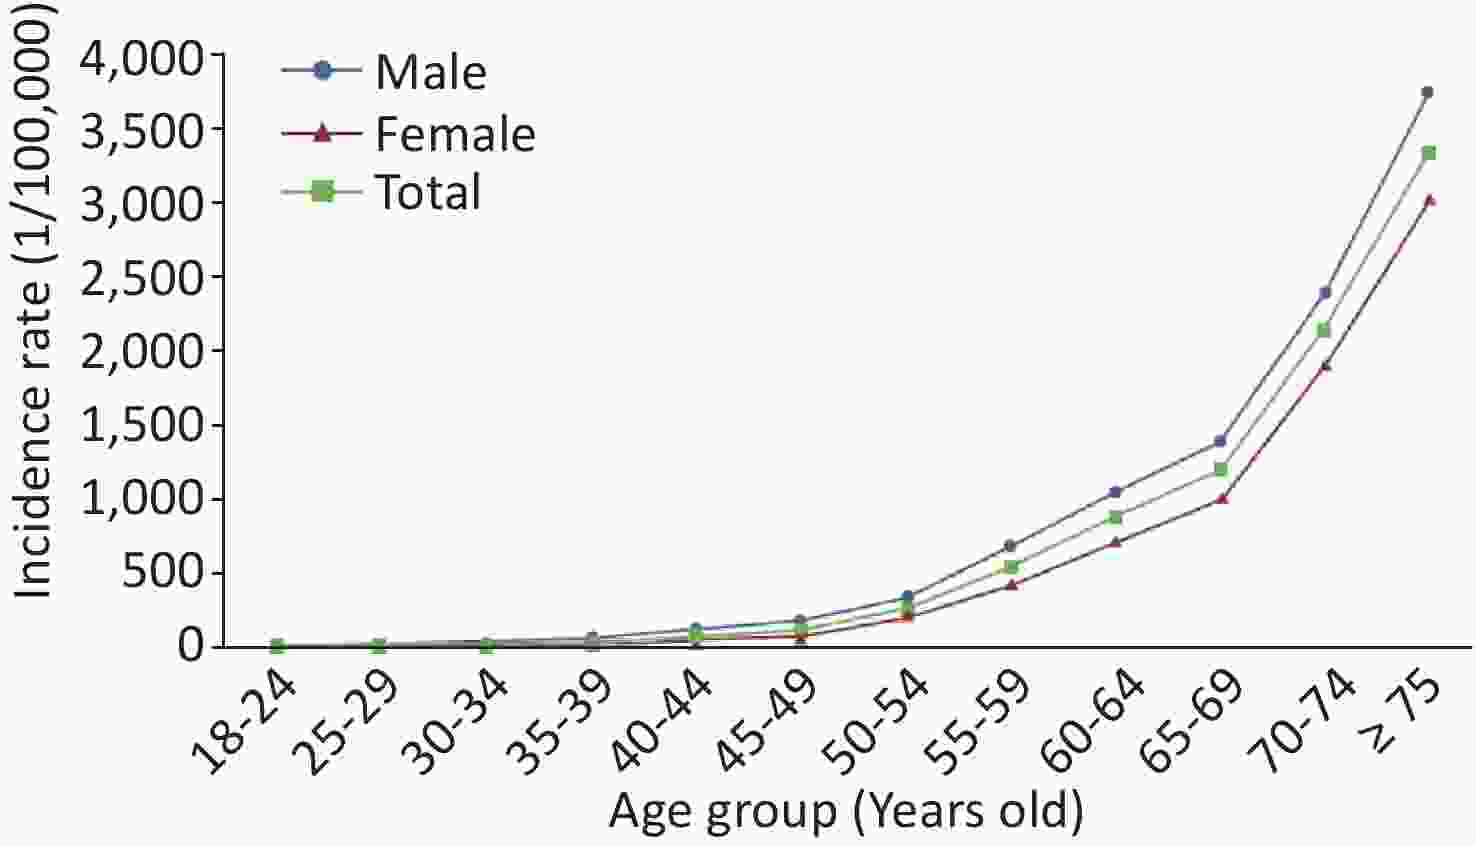
Between January and December 2023, data from the “Surveillance of Cardiovascular and Cerebrovascular Events among Chinese Residents” project, covering 30 provinces (autonomous regions, municipalities directly under the central government) and the Xinjiang Production and Construction Corps, with 262 monitoring sites, showed that the incidence rate of stroke among residents aged 18 years and above was 491.0 per 100,000 (age-standardized rate 513.3 per 100,000), with higher rate in males (551.8 per 100,000) than in females (427.9 per 100,000). The incidence of stroke increased with age (Figures 15 and 16).
-
In 2021, the mortality rate of cerebrovascular disease in China was as follows: According to the China Health Statistics Yearbook 2022[3], the crude mortality rate of cerebrovascular disease in urban residents was 140.02 per 100,000, accounting for 21.71% of total deaths in urban areas and ranking third among all causes of death. In rural residents, the crude mortality rate was 175.58 per 100,000, accounting for 23.62% of total deaths in rural areas and ranked second among all causes of death. The mortality rate of cerebrovascular disease was higher in males than in females, and higher in rural areas than in urban areas (Figure 17).
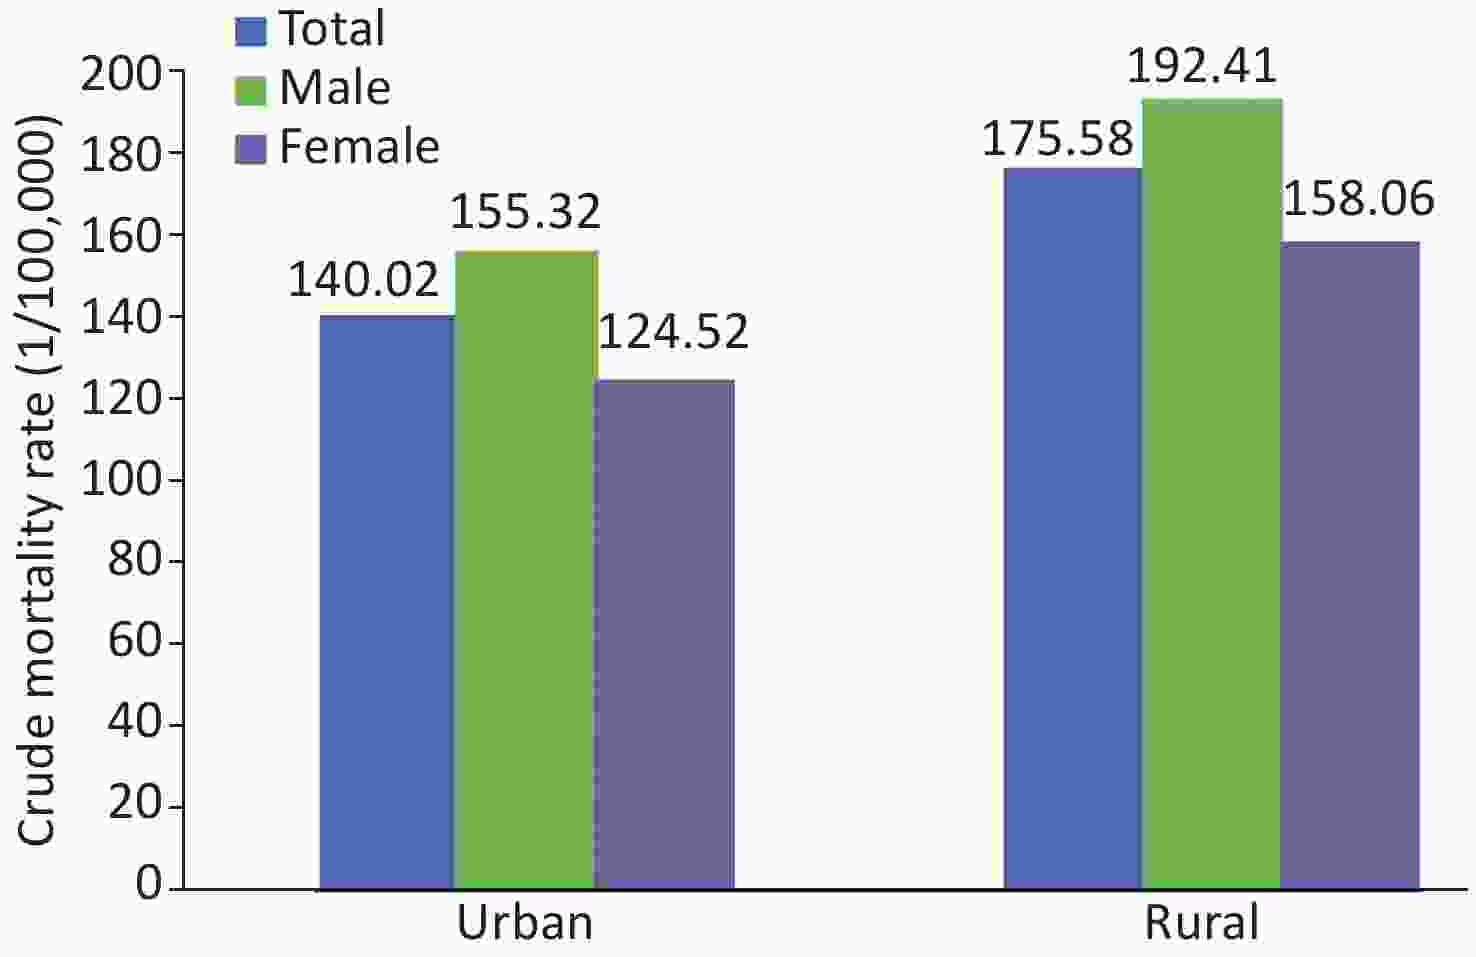
Figure 17. Mortality rate of cerebrovascular diseases by sex in urban and rural areas of China in 2021.
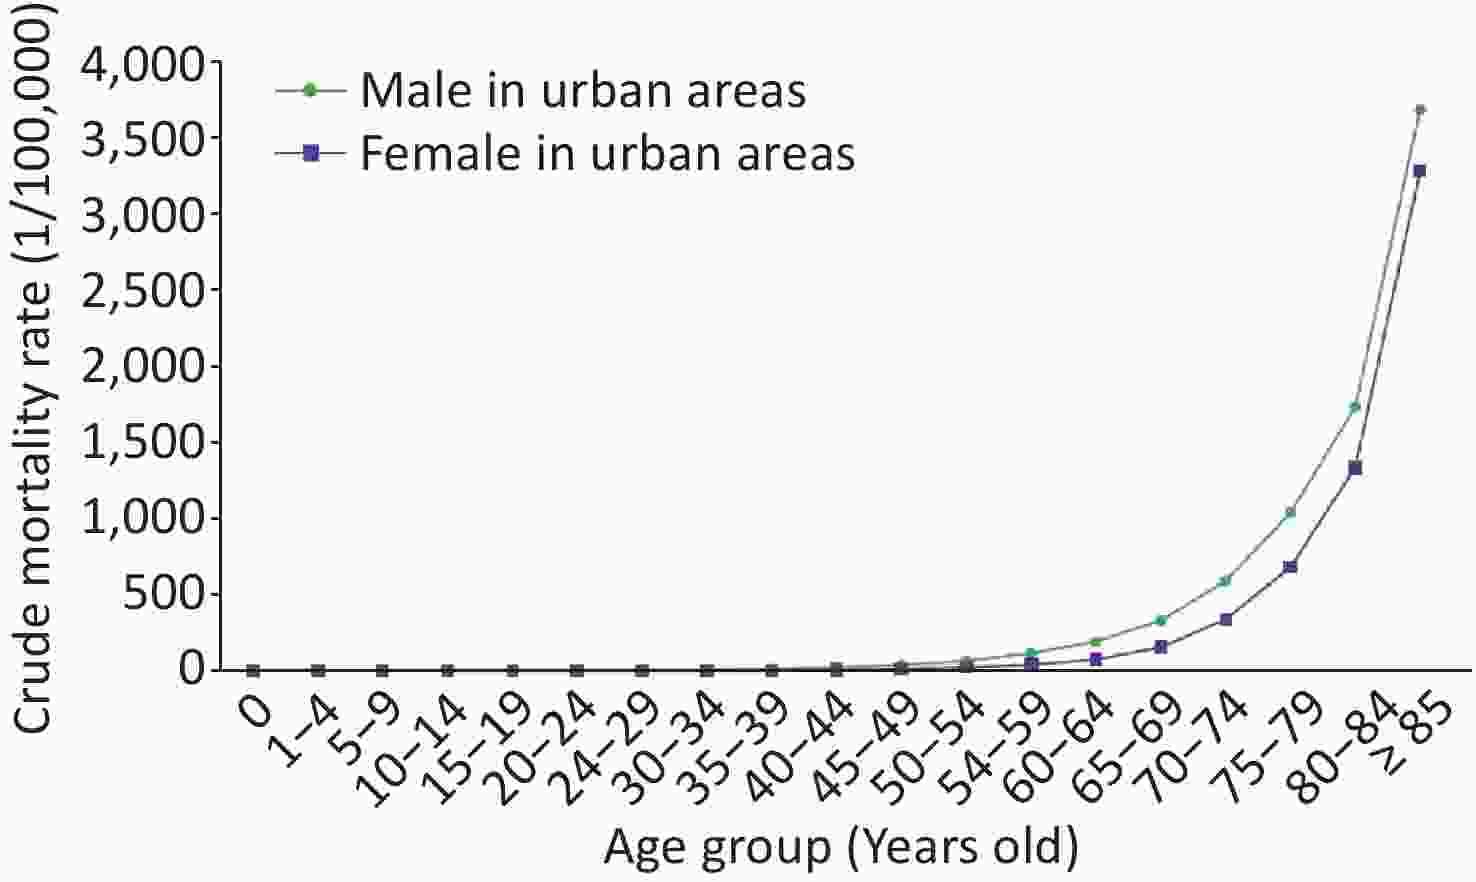
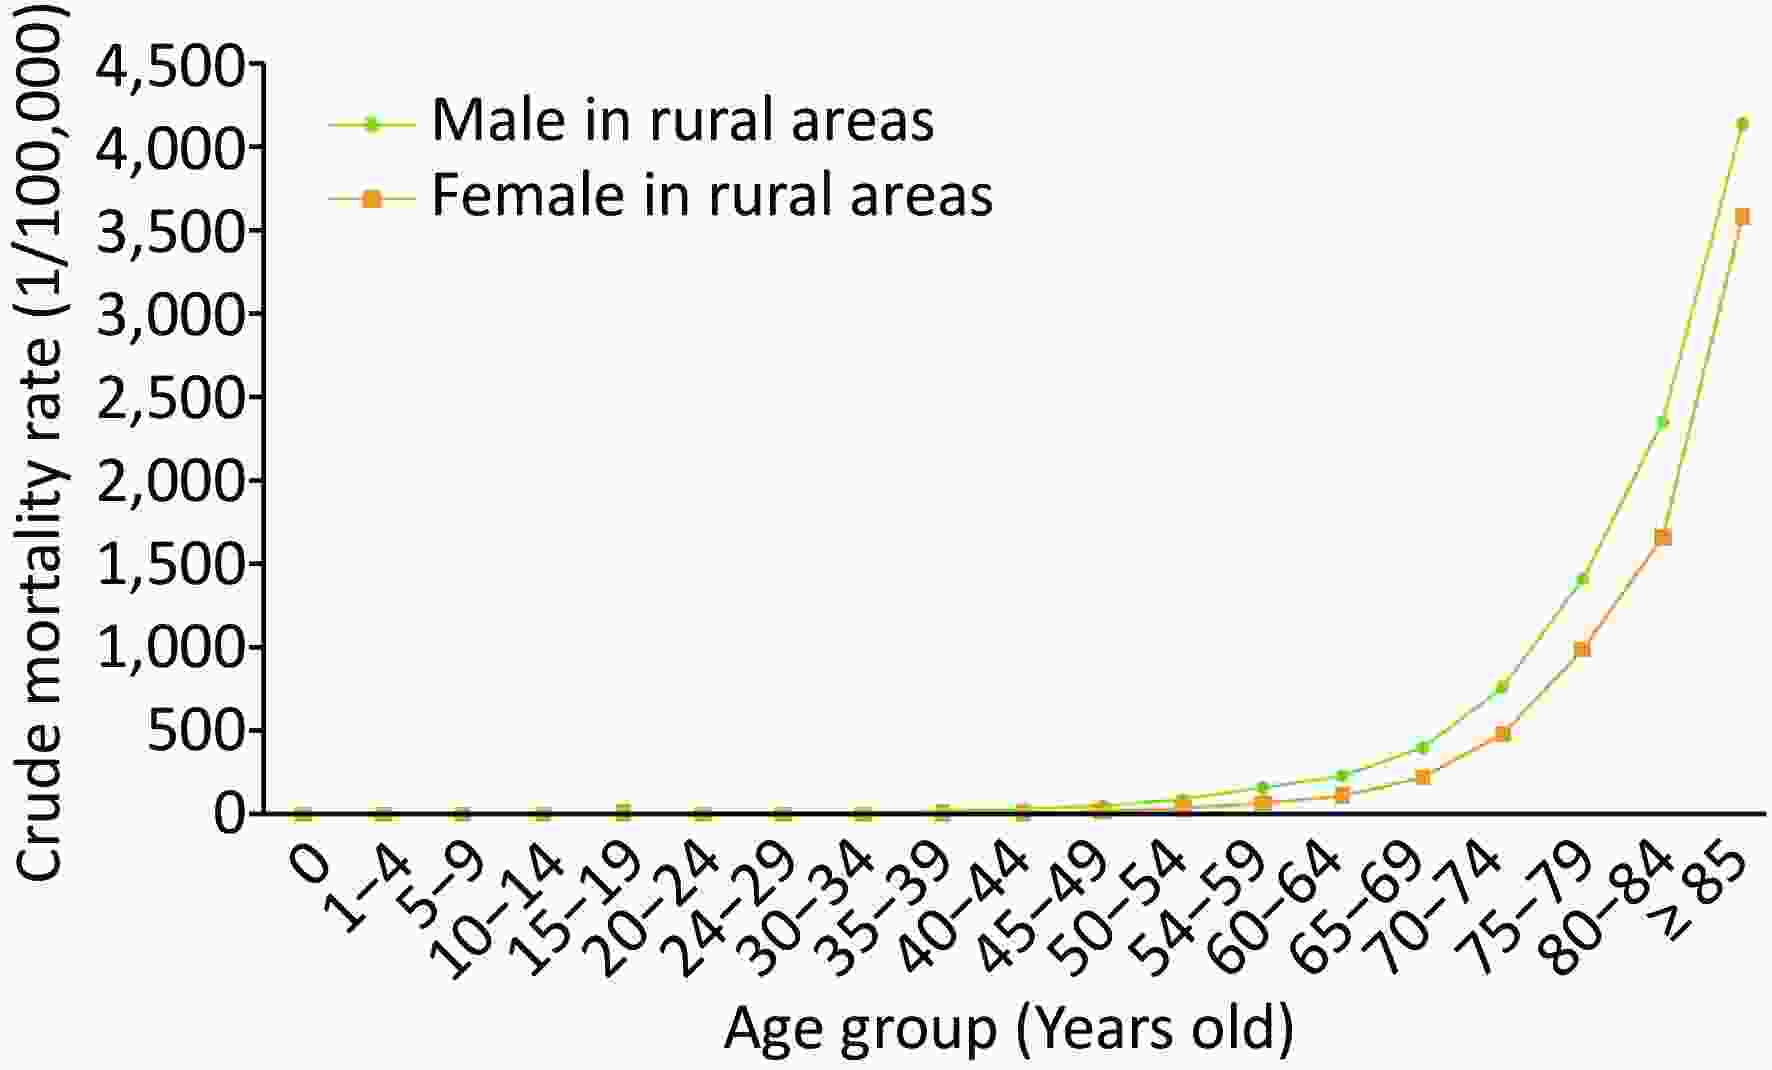
According to the China Health Statistics Yearbook 2022[3], the crude mortality rate of cerebrovascular disease in both urban and rural residents increased with age, and the mortality rate in males was higher than that in females in each age group, with an increasing trend approximating an exponential relationship (Figures 18 and 19).
-
The adult smoking rate in China decreased from 28.1% in 2010 to 24.1% in 2022, a decline of 14.2% over 12 years[5]. Results from local adult tobacco surveys showed that in 2020, the adult smoking rate was less than 20.0% in Shanghai and the Xizang Autonomous Region but exceeded 30.0% in Yunnan and Guizhou. Additionally, 18 provinces had smoking rates between 20.0% and 24.9%, and 9 provinces had rates between 25.0% and 29.9%[6].
In 2023, the smoking attempt rate among middle school students was 13.7%, with initial cigarette use recognized as a significant indicator of smoking initiation. Compared to 2021, the smoking attempt rate among middle school students decreased from 16.7% to 13.7%, an 18.0% reduction. The smoking rate among middle school students in 2023 was 4.2%, unchanged from 2021, with an estimated 3.76 million middle school students smoking nationwide. The proportion of regular smokers (smoking 20 days or more per month) was 1.2%, and the daily smoking rate was 0.8%. Compared to female students, male students had higher smoking rates (19.1%, 6.4%, 2.0%, and 1.4%, respectively), whereas female students had smoking rates of 7.8%, 1.8%, 0.3%, and 0.2%, respectively. The smoking rate was highest in vocational high schools (22.3%, 9.6%, 3.6%, and 2.6%), followed by high schools (14.7%, 3.8%, 1.3%, and 0.9%), with junior high schools having the lowest rates at 11.2%, 3.1%, 0.6%, and 0.4%, respectively. In 2023, 54.5% of middle school students reported being exposed to secondhand smoke, with the highest exposure occurring in outdoor (40.2%) and indoor public places (37.5%). Other locations included homes (29.4%) and public transportation (20.2%). Of the middle school students, 35.4% reported exposure to secondhand smoke at school in the past 30 days, and 8.3% reported seeing teachers smoke almost every day at school[7].
-
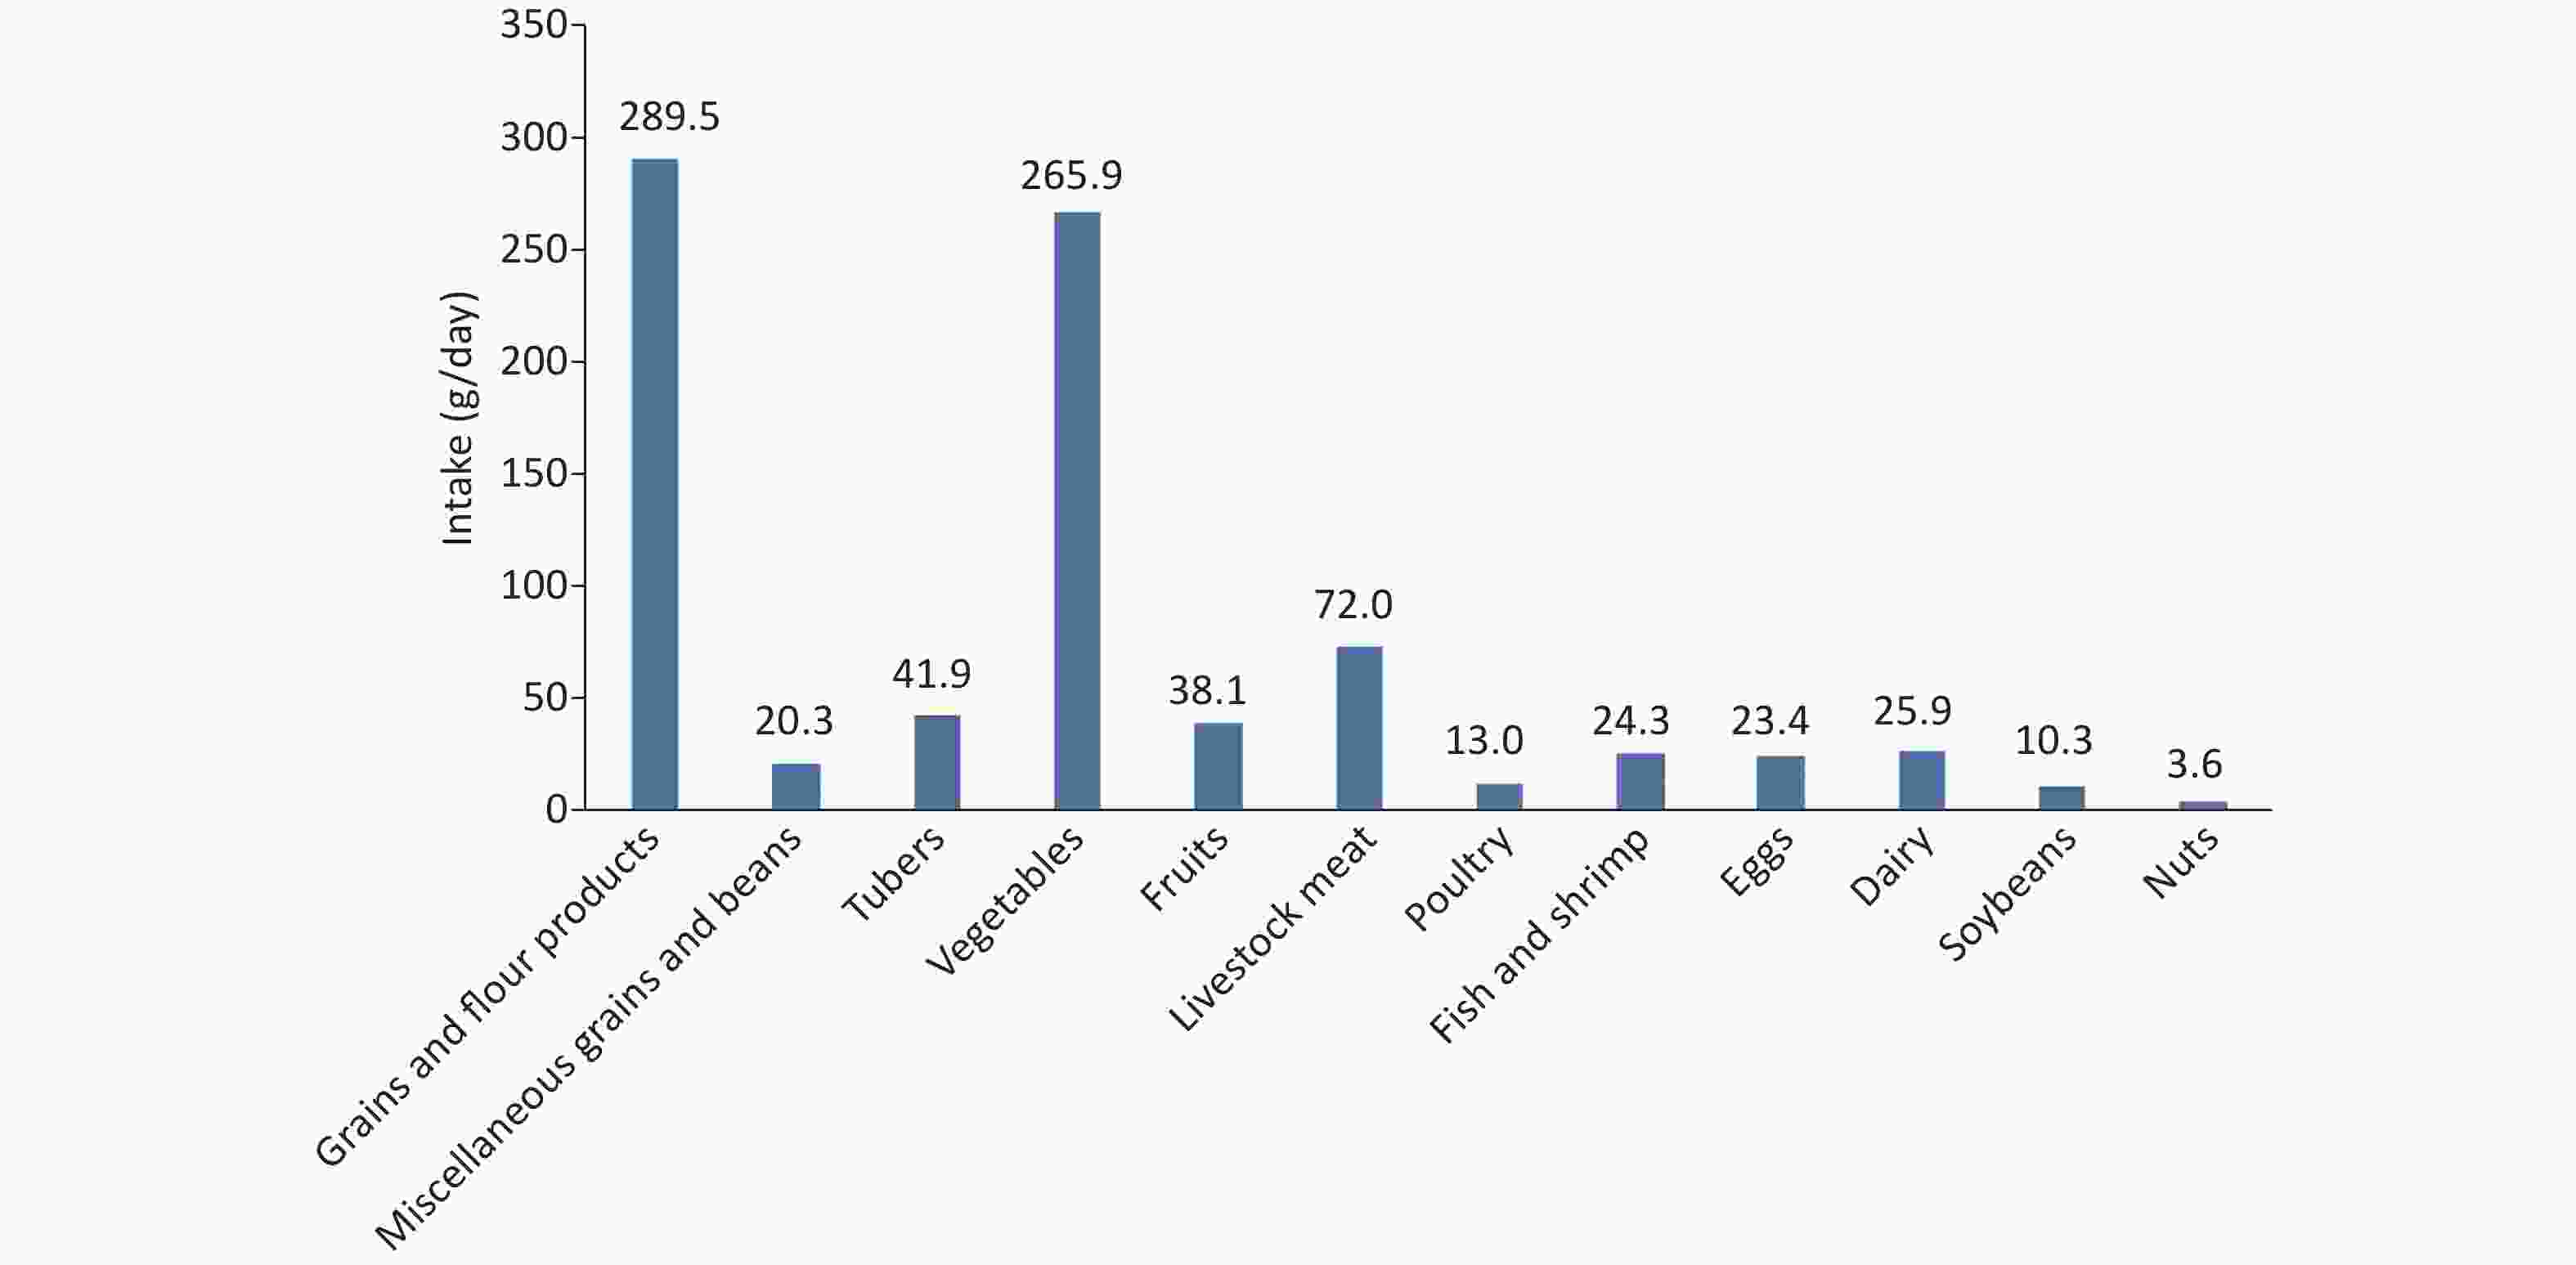
Data from the National Nutrition Survey (1982 to 2015–2017)[8,9] showed a general decline in grain and vegetable intake among Chinese residents, particularly in the consumption of whole grains and tubers. The structure of animal food intake remained imbalanced, characterized by excessive intake of livestock meat, especially pork, and insufficient intake of poultry and aquatic products. The intake of fruits, eggs, dairy, and soy products remained consistently low, with a significant decrease below the recommended levels (Figure 20). Cooking oil intake continued to increase. Although household cooking salt use decreased, the intake of cooking oil (43.2 g/day) and salt (9.3 g/day) in 2015–2017 far exceeded recommended amounts.
The Report on Nutrition and Chronic Diseases of Chinese Residents (2020) indicated that the total energy intake of Chinese residents was adequate, with an average daily intake of 2,007.4 kcal per standard person per day. However, a long-term downward trend in energy intake was observed[8]. Regarding the energy sources, the carbohydrate energy ratio showed a significant downward trend, whereas the fat energy ratio continued to increase. Since 2002, the fat energy ratio in urban residents exceeded the upper limit of the recommended amount by 30%, and in 2015–2017, the fat energy ratio in rural residents exceeded the recommended upper limit of 30% for the first time, reaching 33.2%[8-10]. Based on data from the China Health and Nutrition Survey (CHNS) and the 2022–2023 China Development and Nutrition Health Impact Cohort in ten provinces (autonomous regions)[11], compared to 2018, the energy intake of adult residents slightly decreased in 2022–2023, the fat energy ratio further increased to an average of 40.08%, the carbohydrate energy ratio decreased to 44.06%, and the protein energy ratio remained stable at 13.02%. In 2020, the fat to energy ratio among Chinese children aged 6–17 years was 33.7%[12].
-
In 2020, the compliance rate for moderate-to-vigorous physical activity among children aged 3–6 years was 62.3%, which was higher in urban areas (63.1%) than in rural areas (58.6%), and the compliance rate for screen time was 52.8%[13]. In 2016 among primary and secondary school students, 85.2% attended two or more physical education classes per week, and 31.5% participated in extracurricular sports training five or more times per week. On weekends, 23.7%, 27.7%, and 17.5% of the students spent two or more hours watching TV, using mobile phones, and using computers, respectively[14]. In 2017, the activity compliance rate of primary and middle school students was higher than that in 2016[15,16] but declined significantly from 2017 to 2019 (32.61% vs. 25.33%; 28.15% vs. 17.61%). The compliance rate of primary school students with a screen time of less than 2 h also decreased significantly (86.47% vs. 80.55%)[17]. In 2019, 39.3% of the students engaged in muscle-strengthening exercises three or more times per week[18]. Between 1985 and 2014, the excellence rate of physical fitness among students showed an overall declining trend[19].
-
National surveys such as the China National Health and Nutrition Survey (CNHS), China Chronic Disease and Risk Factor Surveillance (CCDRFS), CHNS, and the National Student Physical Health Survey have shown a rising prevalence of overweight and obesity among Chinese residents, with faster increases in rural areas than in urban areas. Although rates vary by sex, age, and region, the overall trend is upward[8,9,20,21].
The “National Science and Technology Basic Resources Survey Project during the 13th Five-Year Plan Period—Systematic Survey and Application of Nutrition and Health for Children Aged 0–18 in China”, which surveyed 105,000 children across seven major regions, reported that in 2020, the prevalence of overweight and obesity among children aged 0–5 years was 7.8% (overweight: 5.7%, obesity: 2.1%). Rates were higher in rural areas than in urban areas, and higher among boys than girls. Among children and adolescents aged 6–17 years, the combined prevalence of overweight and obesity was 26.5% (overweight: 14.5%, obese: 12.0%), with higher rates in urban areas than in rural areas and higher among boys than in girls.
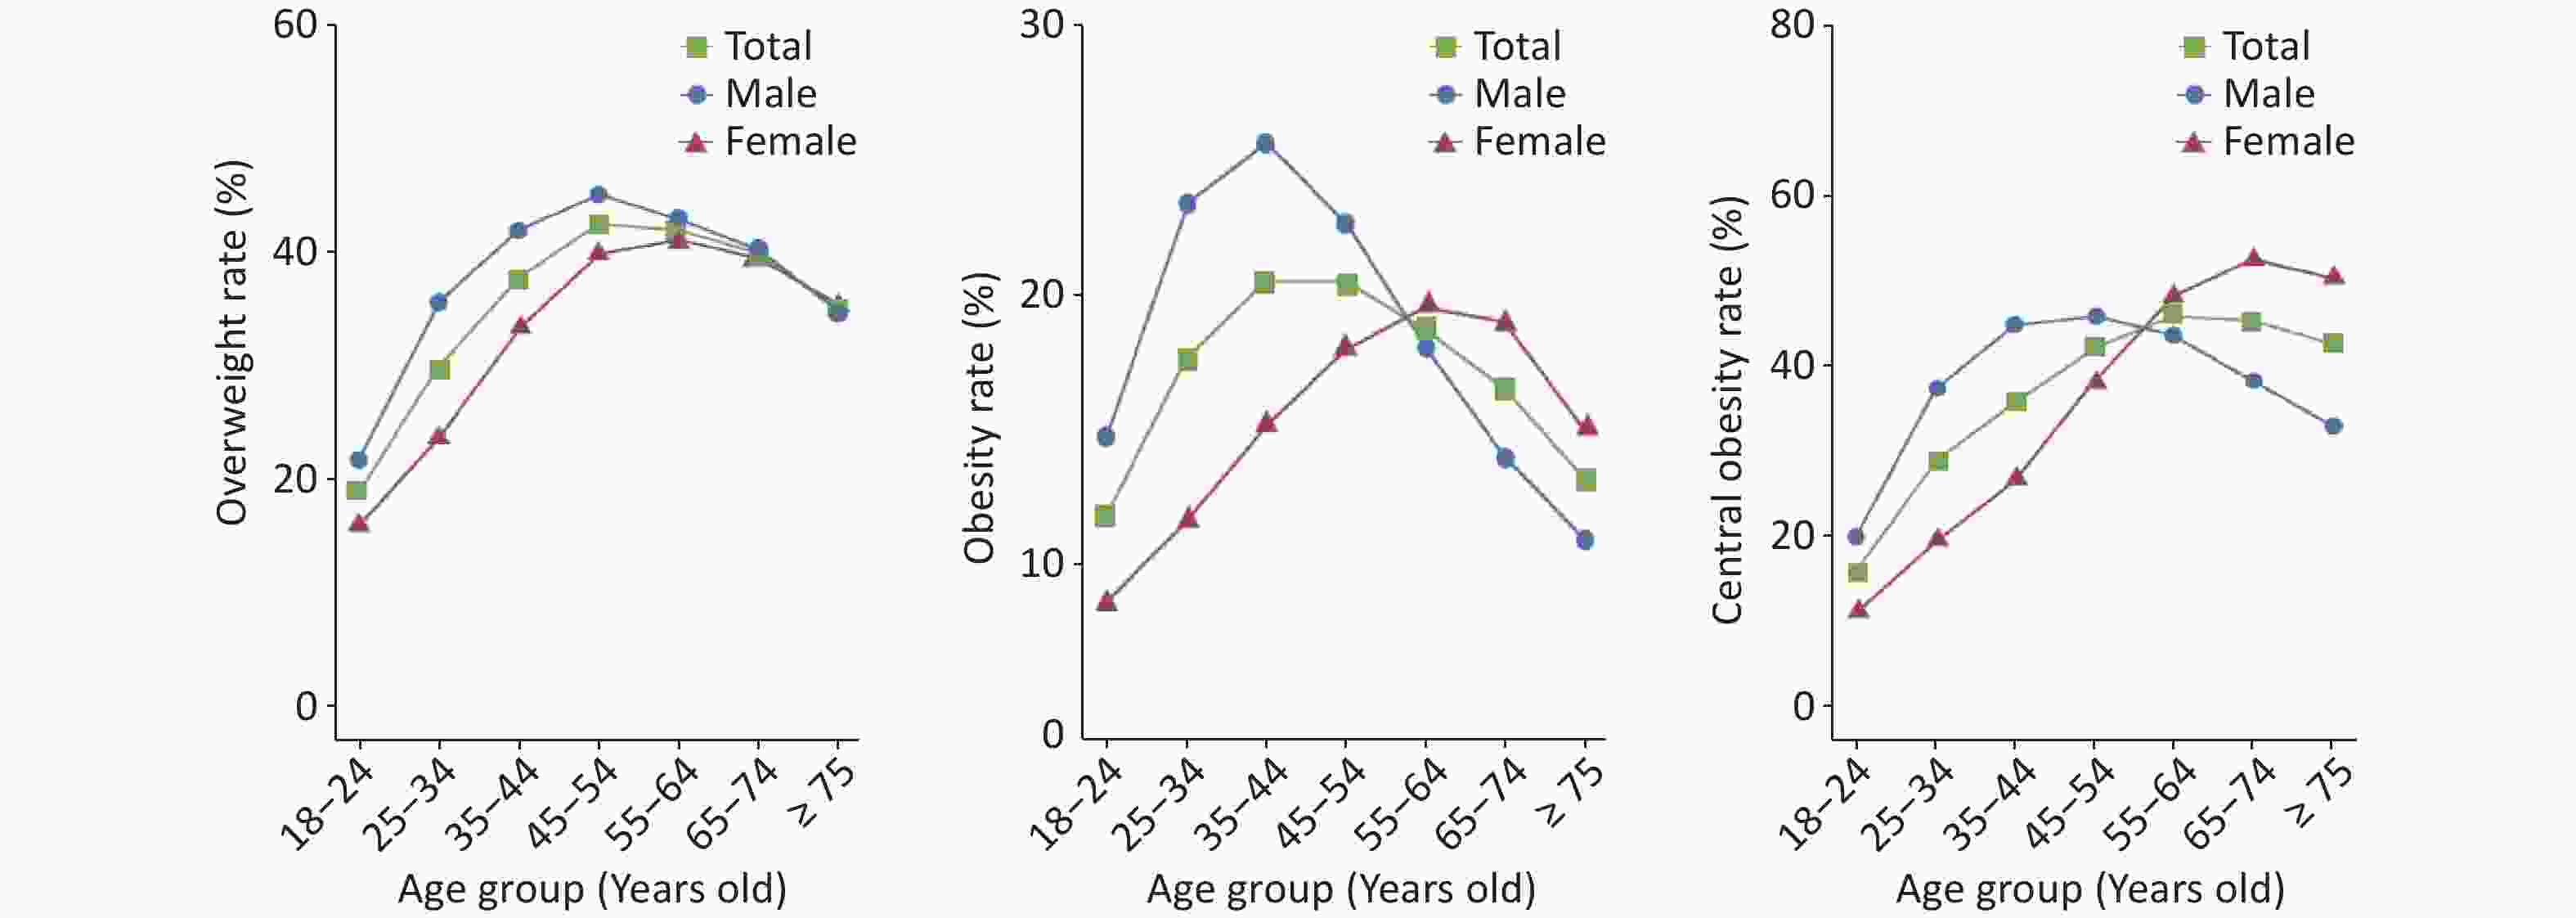
Report on Nutrition and Chronic Diseases of Chinese Residents (2020)[8] showed that the rates of overweight and obesity among adults aged 18 years and above were 34.3% and 16.4%, respectively, representing increases of 4.2 and 4.5%, respectively, compared to the numbers observed in 2012. The China Cardiovascular Disease and Risk Factors Surveillance project, conducted in 31 provinces (autonomous regions, municipalities directly under the central government) with 262 monitoring sites from 2020 to 2022, with an effective sample size of 293,022 people, preliminarily showed that the rate of overweight, obesity, and central obesity among adults aged 18 years and above was 34.6%, 17.8%, and 34.9%, respectively. Obesity rates were higher in males (20.5%) than in females (15.0%), and higher in rural areas (18.7%) than in urban areas (16.7%). The prevalence of overweight and obesity initially increased, and then decreased with age (Figure 21).
-
Nationwide sampling surveys of the prevalence of hypertension between 1958 and 2022 indicated an overall upward trend. Preliminary results from the China Cardiovascular Disease and Risk Factors Surveillance project (2020–2022), conducted in 31 provinces, autonomous regions, and municipalities directly under the central government with 262 monitoring sites and an effective sample size of 298,438 people, showed that the prevalence of hypertension among adults aged 18 years and above was 31.6%, higher in males (36.8%) than in females (26.3%), and higher in rural (33.7%) than in urban (29.1%) areas. The prevalence of hypertension increased rapidly with age.
A prospective cohort survey of 12,952 Chinese adults aged 18 years and above from the CHNS[22] revealed that the age-standardized incidence rate of hypertension increased from 40.8 per 1,000 person-years in 1993–1997 to 48.6 per 1,000 person-years in 2011–2015.
Multiple nationwide surveys on the awareness, treatment, and control rates of hypertension have shown an upward trend. Data from six national CCDRFS surveys[23] showed that the awareness, treatment, and control rates of hypertension among Chinese adults aged 18–69 years increased from 2004 to 2018 (Figure 22).
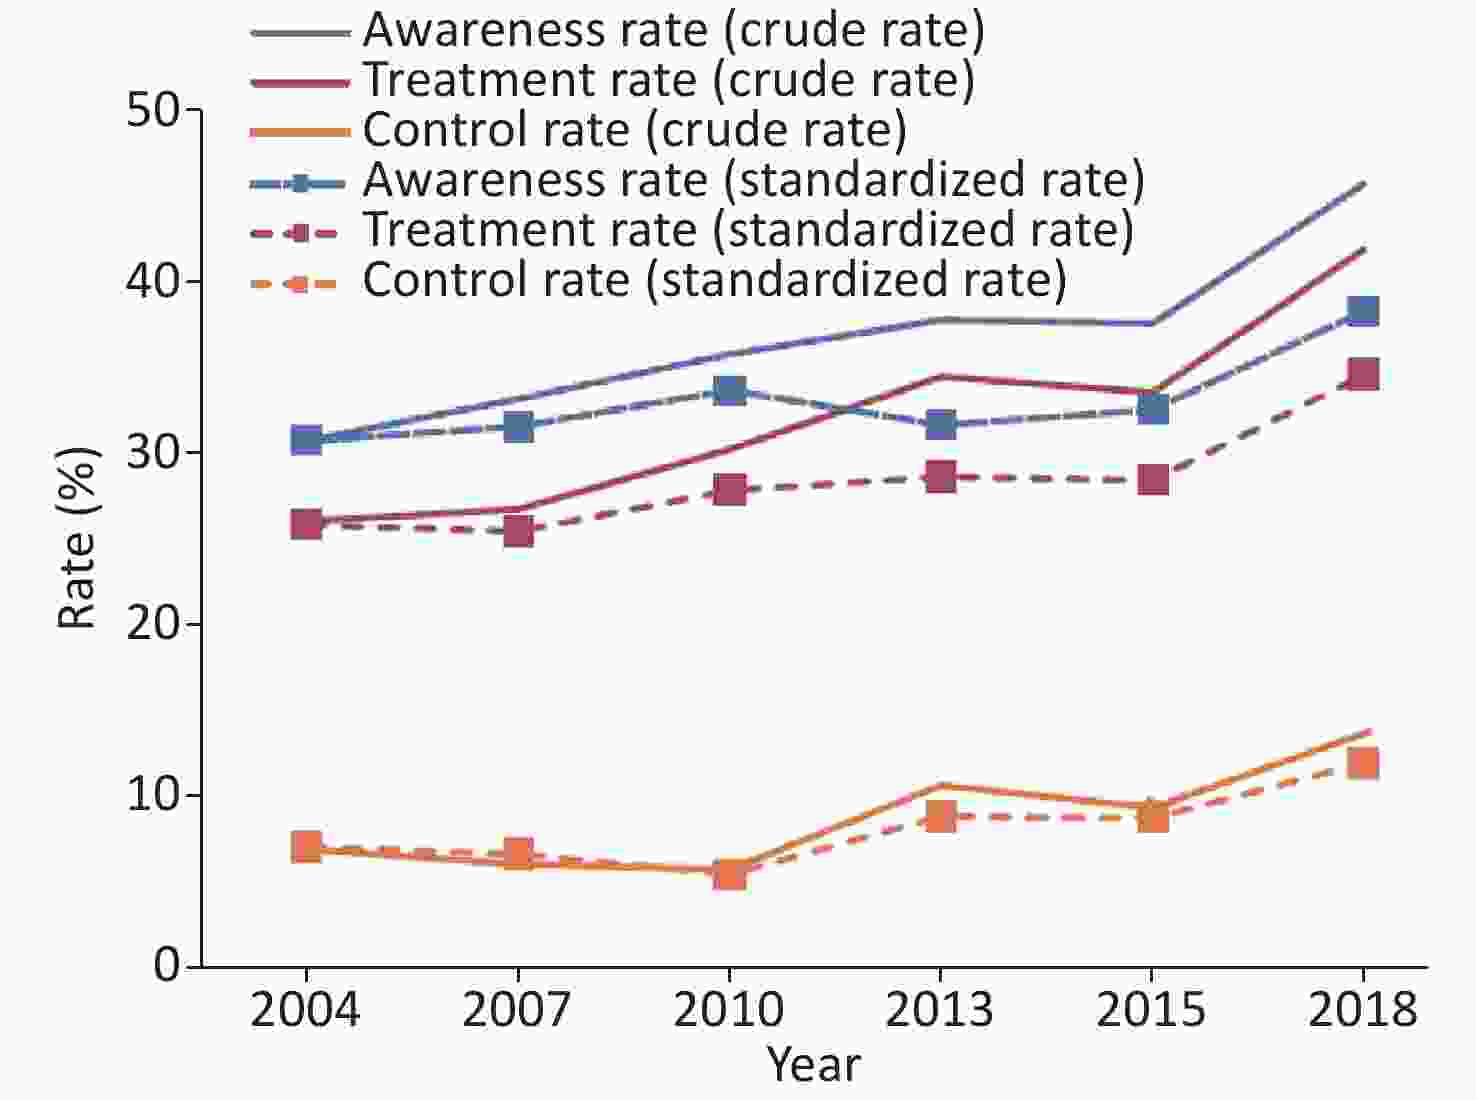
Figure 22. Trends in awareness, treatment and control rates of hypertension among Chinese adults, 2004–2018.
The China Cardiovascular Disease and Risk Factors Surveillance project, conducted in 31 provinces (autonomous regions, municipalities directly under the central government) with 262 monitoring sites between 2020 and 2022, with an effective sample size of 298,438 people, preliminarily showed that the awareness, treatment, and control rates of hypertension among adults aged 18 years and above were 43.3%, 38.7%, and 12.9%, respectively.
-
The China Cardiovascular Disease and Risk Factors Surveillance project, conducted in 31 provinces (autonomous regions and municipalities directly under the central government) with 262 monitoring sites between 2020 and 2022, surveyed 275,961 people, and preliminarily showed that the mean levels of total cholesterol (TC), triglycerides (TG), high-density lipoprotein cholesterol (HDL-C), and low-density lipoprotein cholesterol (LDL-C) among adults aged 18 years and above were 185.8 mg/dL, 141.0 mg/dL, 50.7 mg/dL, and 110.7 mg/dL, respectively. Males had higher TG levels than females (Figure 23).
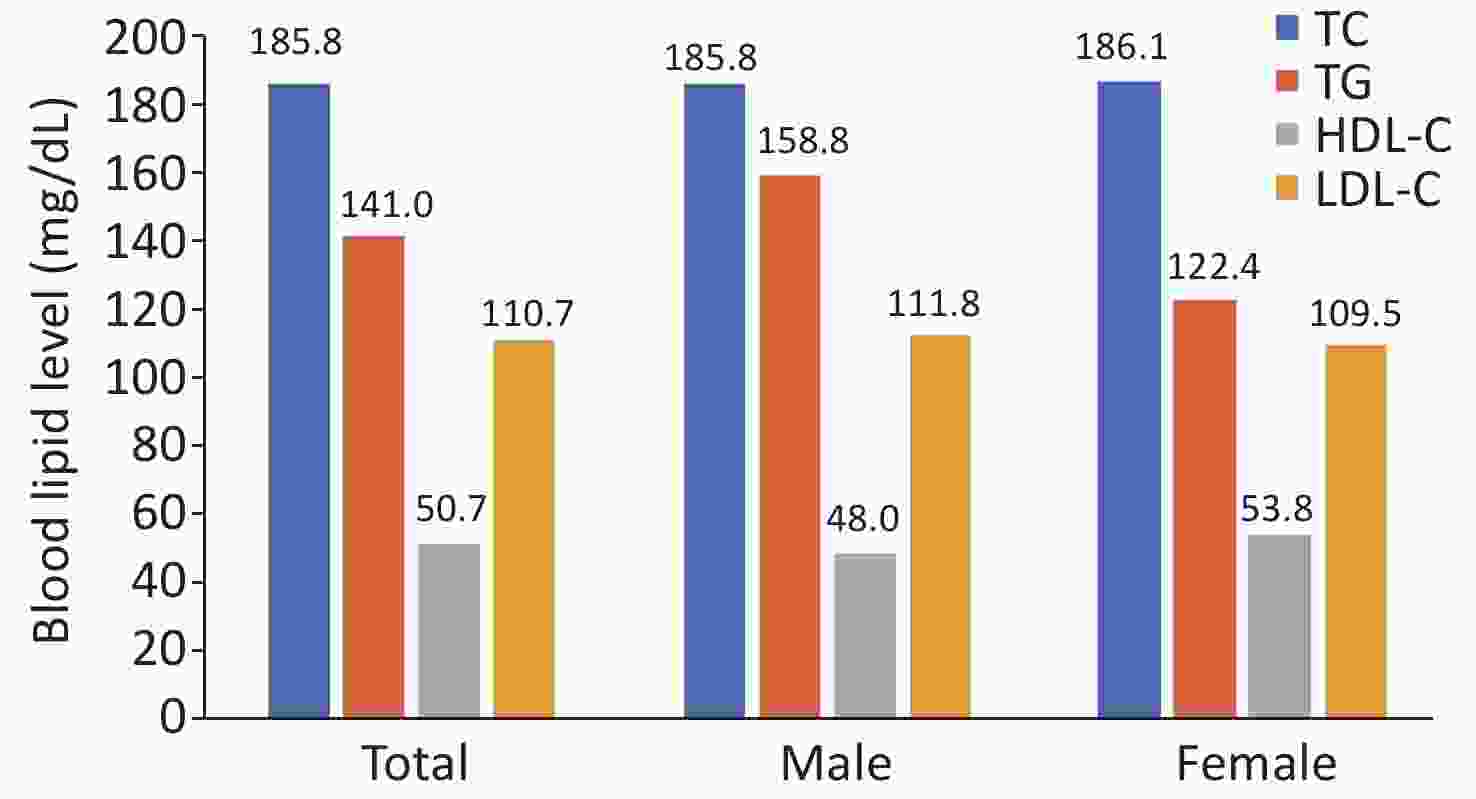
Figure 23. Levels of TC, TG, HDL-C and LDL-C in adults aged 18 years and above in China. TC, total cholesterol; TG, triglycerides; HDL-C, high-density lipoprotein cholesterol; and LDL-C, low-density lipoprotein cholesterol.
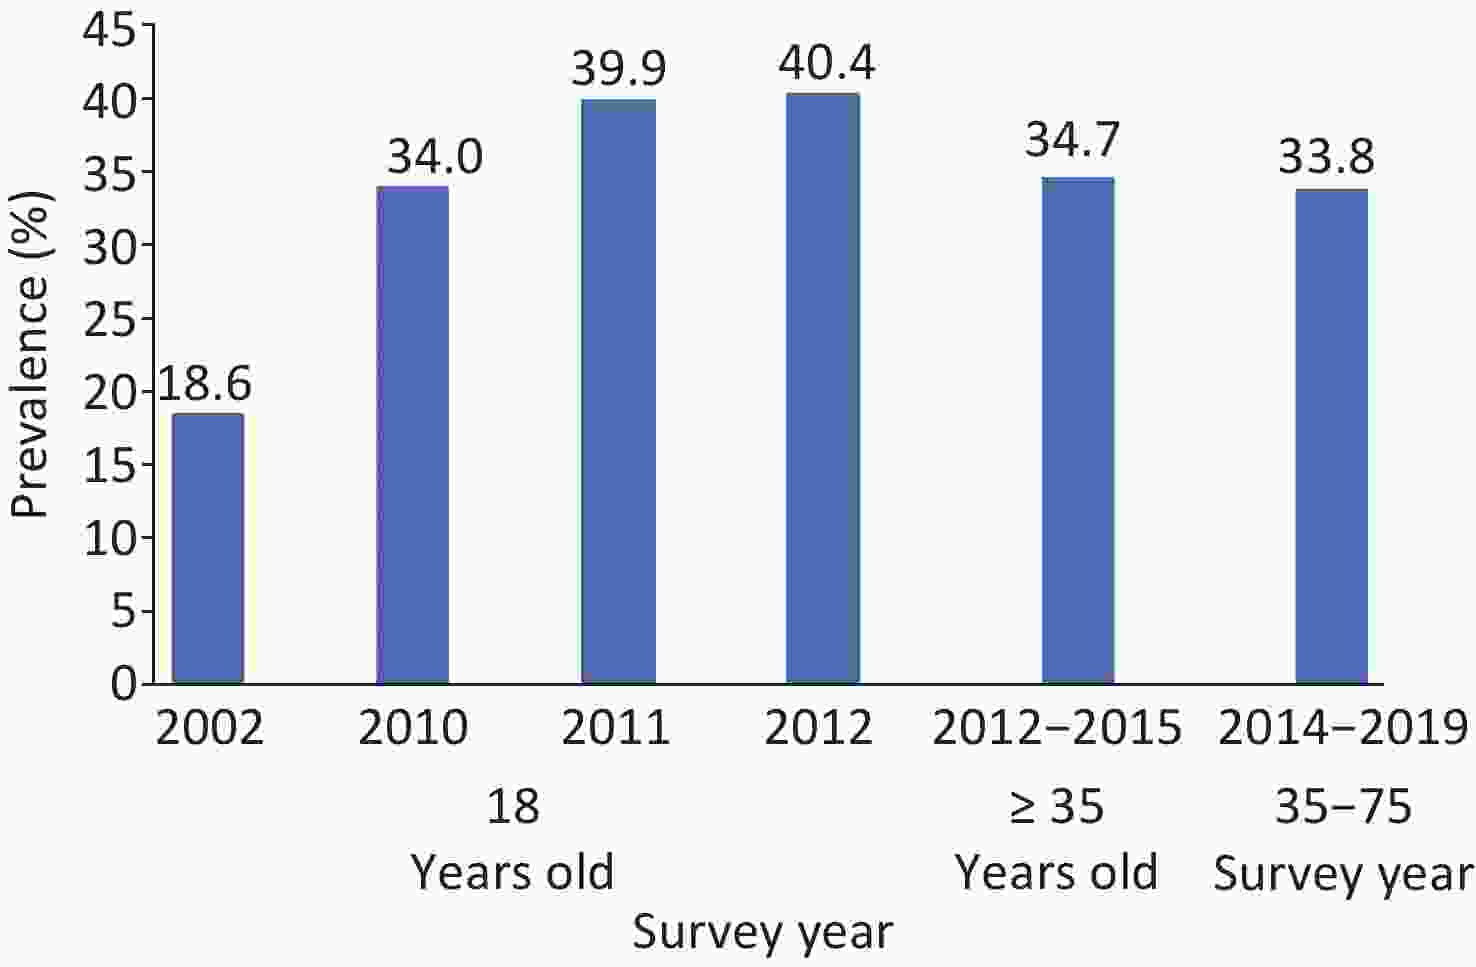
If dyslipidemia is defined as any abnormality in lipid levels (TC ≥ 551.71 mg/dL, LDL-C ≥ 160.22 mg/dL, HDL-C < 40.25 mg/dL, TG ≥ 87.46 mg/dL) or current use of lipid-lowering medication, several national surveys have demonstrated a significant increase in its prevalence among Chinese adults aged 18 years and older. These include the CHNS[24] in 2002, the China Chronic Kidney Disease Working Group Survey (CNSCKD)[25] in 2010, another CHNS[26] in 2011, and the China Nutrition and Chronic Disease Status Survey[27] in 2012. Among adults aged 35 and above the prevalence of dyslipidemia was found to be similar in both the China Hypertension Survey (CHS)[28] conducted from 2012 to 2015 and the China Cardiovascular Disease High-Risk Population Early Screening and Comprehensive Intervention Project (ChinaHEART)[29] from 2014 to 2019 (Figure 24).
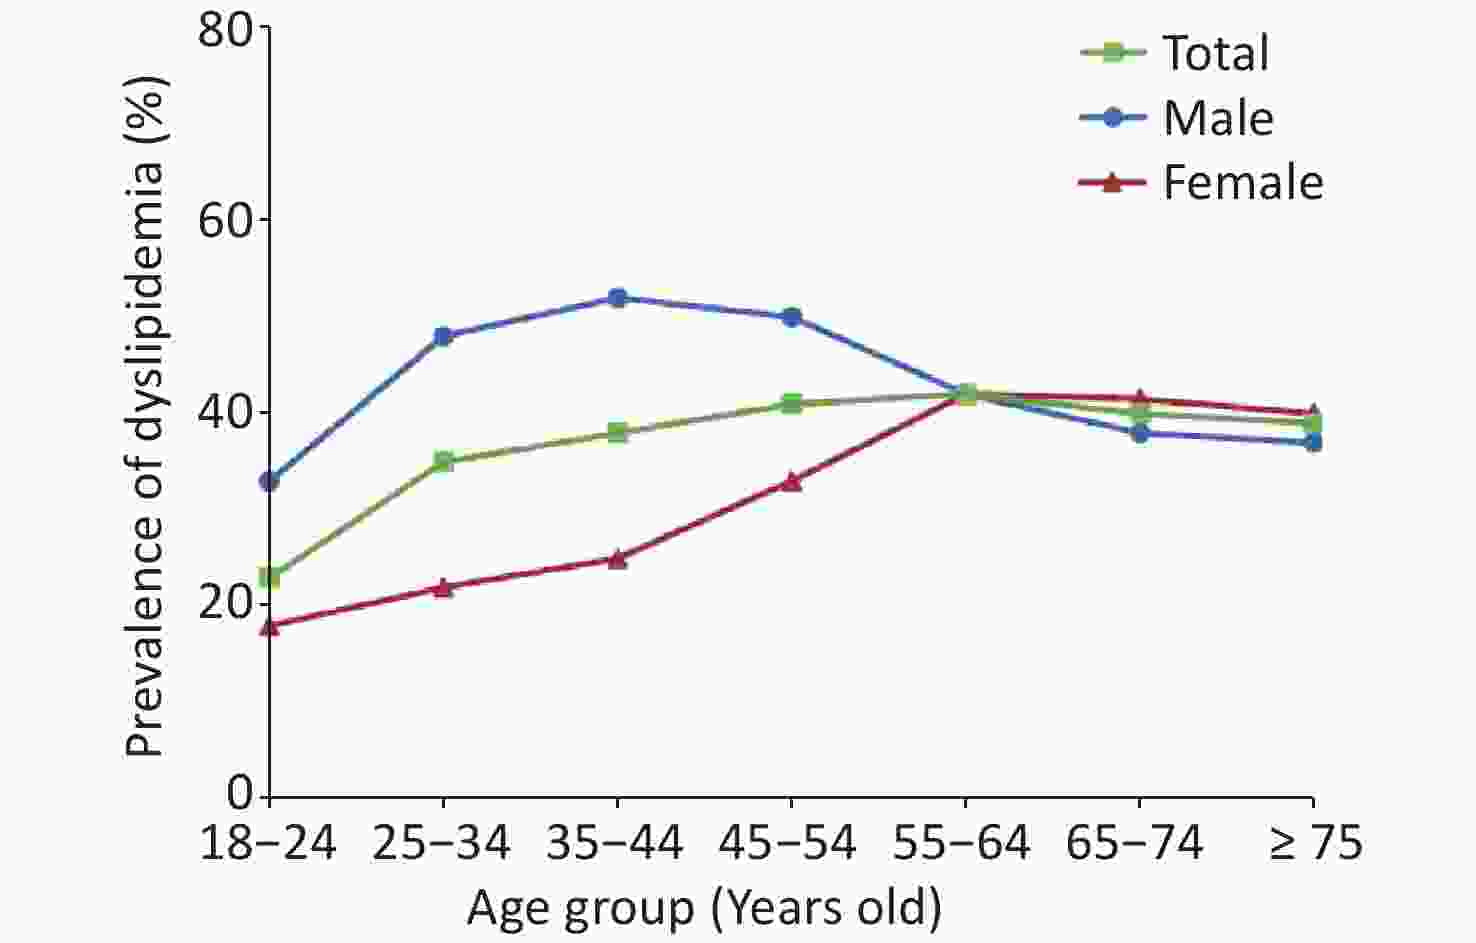
The China Cardiovascular Disease and Risk Factors Surveillance project, conducted in 31 provinces (autonomous regions and municipalities directly under the central government) with 262 monitoring sites between 2020 and 2022 and an effective sample size of 275,961 people, preliminarily showed that the prevalence of dyslipidemia among residents aged 18 years and above was 38.1%, with males (46.1%) having a higher prevalence than females (29.6%), and urban areas (38.9%) having a higher prevalence than rural areas (37.4%). The prevalence of dyslipidemia increased with age and then decreased (Figure 25).
-
The “China Chronic Disease and Risk Factors Surveillance” conducted cross-sectional surveys of 170,287 and 173,642 adults aged 18 and above in mainland China during 2013–2014 and 2018–2019, respectively[30]. Using the American Diabetes Association (ADA) diagnostic criteria, the prevalence of diabetes increased from 10.9% (95% CI, 10.4%–11.5%) in 2013 to 12.4% (95% CI, 11.8%–13.0%) in 2018. The prevalence of prediabetes increased from 35.7% (95% CI, 34.2%–37.3%) in 2013 to 38.1% (95% CI, 36.4%–39.7%) (fasting blood glucose: 100–125 mg/dL or HbA1c: 5.7%–6.4%) in 2018. In 2018, the awareness, treatment, and control rates of diabetes were 36.7% (95% CI, 34.7%–38.6%), 32.9% (95% CI, 30.9%–34.8%), and 50.1% (95% CI, 47.5%–52.6%), respectively, showing little change from 2013. Between 2013 and 2018, the prevalence of diabetes and prediabetes significantly increased in rural areas.
-
With economic development and social changes, the prevalence and etiological spectrum of chronic kidney disease (CKD) in China have changed. Preventable and treatable conditions such as diabetes, hypertension, and urinary tract obstruction have become the leading causes of CKD. In 2011, diabetes-related CKD surpassed chronic glomerulonephritis as the most common cause of CKD among patients hospitalized in tertiary hospitals and became the first[31]. According to the annual report of the China Kidney Network (CK-NET), in 2016, among patients hospitalized in tertiary hospitals in China, the proportions of diabetic nephropathy, hypertensive nephropathy, and obstructive nephropathy were 26.7%, 21.4%, and 16.0%, respectively, which were higher than those of chronic glomerulonephritis (14.4%)[32].
Between August 2018 and June 2019, the Sixth National Chronic Disease and Risk Factors Surveillance[33] included 176,874 adults aged 18 and older in 31 provinces, autonomous regions, and municipalities directly under the central government. The prevalence of albuminuria and renal dysfunction was 6.7% and 2.2%, respectively, with an overall CKD prevalence of 8.2%, which was lower than the 10.8%[34] reported in 2009–2010. The prevalence of CKD was higher in the subgroups of older age, female sex, non-Han ethnicity, residence in rural, northern, and central China, lower education level, lower income, former smokers, non-drinkers, lack of physical activity, obesity, hypertension, diabetes, dyslipidemia, and self-reported CVD. The prevalence rates of CKD among individuals without hypertension, those with newly diagnosed hypertension, and those with previously diagnosed hypertension were 4.5%, 14.3%, and 23.5%, respectively.
Between 2015 and 2019, the Cardiovascular Disease High-Risk Population Early Screening and Comprehensive Intervention Project effectively screened the urine albumin-to-creatinine ratio (UACR) among 269,026 adults aged 35 and above in 31 provinces, autonomous regions, and municipalities directly under the central government. The prevalence of albuminuria (UACR ≥ 30 mg/g) was 8.75%, including 7.38% with moderately increased albuminuria (30 mg/g ≤ UACR < 300 mg/g) and 1.37% with severely increased albuminuria (UACR ≥ 300 mg/g).
The prevalence of albuminuria increases with age, as well as with lower income levels and lower educational attainment. It was higher in females (age-standardized prevalence rate 8.33% vs. 7.27%) than in males, and slightly higher in rural areas than in urban areas. Albuminuria prevalence was higher among individuals with comorbid hypertension, diabetes, dyslipidemia, Body Mass Index (BMI) ≥ 24 kg/m2, or BMI < 18.5 kg/m2 and lower among those with healthy dietary habits and adequate physical activity. Regional disparities in albuminuria prevalence were observed, with the highest rates in Central China (9.35% [95% CI, 9.01%–9.71%]), followed by Southwest (8.95% [95% CI, 8.69%–9.23%]) and East China (8.16% [95% CI, 7.95%–8.38%]), and the lowest rates in South China (5.98% [95% CI, 5.67%–6.30%]) and Northwest China (7.41% [95% CI, 7.10%–7.72%]), after age and sex standardization.
-
In 2024, a meta-analysis of 32 sleep studies involving over 370,000 Chinese individuals assessed sleep quality using the Pittsburgh Sleep Quality Index (PSQI). With a cutoff score of 7, the prevalence of poor sleep quality was 19.0% (95% CI, 15.8%–22.8%). Lower educational levels (Q = 4.12, P = 0.042) and living in less developed areas (Q = 60.28, P < 0.001) were identified as more susceptible factors. The PSQI evaluates seven dimensions: subjective sleep quality, sleep latency, sleep duration, sleep efficiency, sleep disturbances, hypnotic medications, and daytime dysfunction, with a total score ranging from 0 to 21, where higher scores indicated poorer sleep quality[35].
Among children, a study using the Patient Health Questionnaire Depression Scale (PHQ-9) and Generalized Anxiety Disorder-7 (GAD-7) surveyed the emotional states of over 30,000 primary and junior high school students before and after the implementation of the “Double Reduction” policy. After the policy was implemented, the prevalence of depressive symptoms in students decreased from 12.1% to 9.2% and the prevalence of anxiety symptoms decreased from 8.9% to 6.2%[36].
-
The GBD identified air pollution and non-optimal temperatures as the top two leading environmental factors affecting health in China. In both 2013 and 2021, non-optimal temperatures ranked eighth among risk factors for disease-related mortality, contributing to over 400,000 excess CVD deaths in 2021. Air pollution, which was the top risk factor in 2013, dropped to third place in 2021. Despite this decline in rank, its impact remained significant, with 1.467 million excess deaths, including 1.21 million of which were attributed to ambient particulate matter pollution. Although China has made some progress in improving air quality in recent years, the health burden of air pollution remain significant.
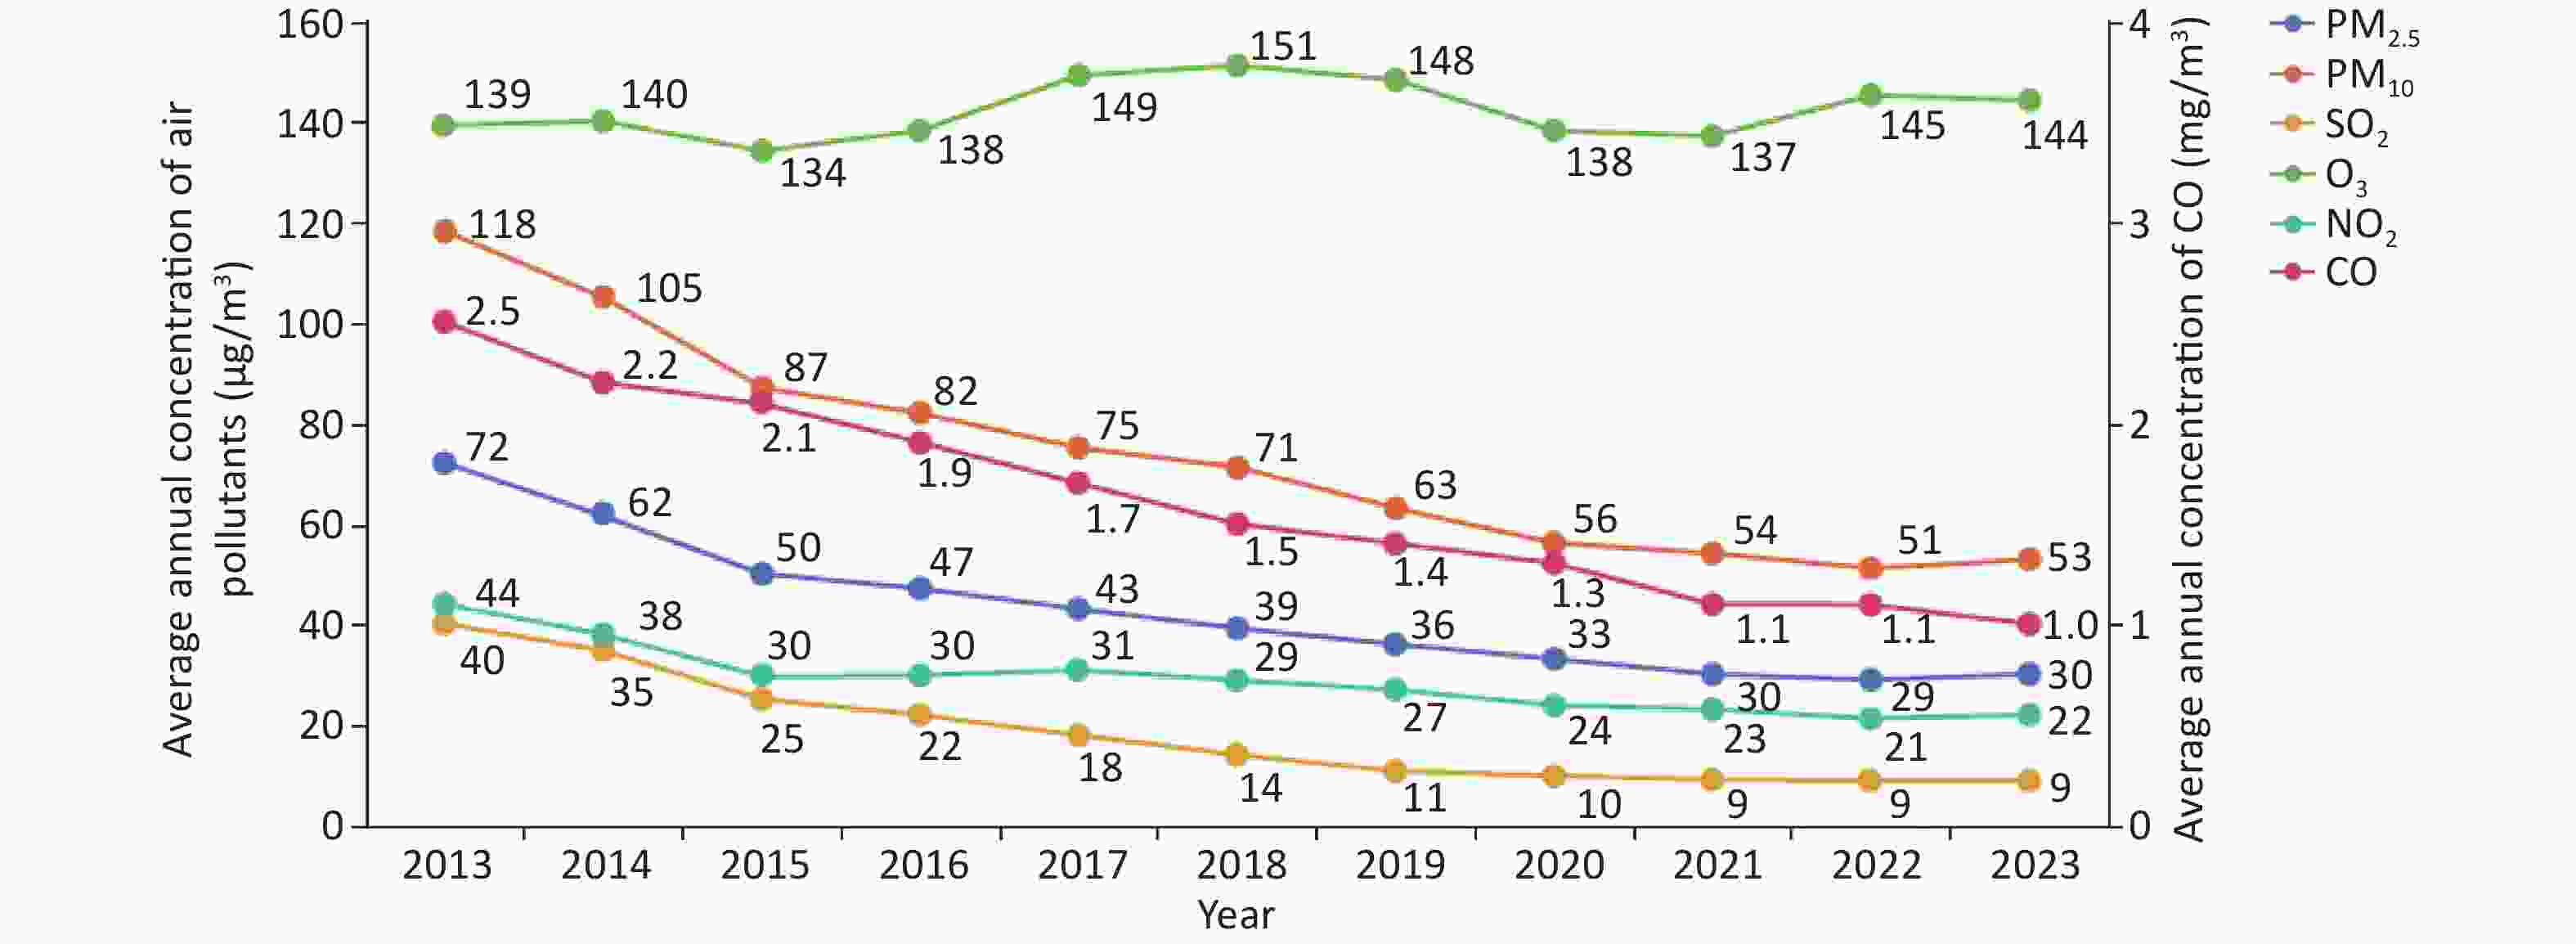
The Report on the State of the Ecology and Environment in China showed that in 2023, among 339 prefecture-level and higher cities nationwide, 203 met the outdoor air quality standards, with a compliance rate of 59.9%. The levels of six major atmospheric pollutants (PM2.5, PM10, SO2, NO2, CO, O3) all decreased compared to their levels in 2022 (Figure 26). PM2.5, the primary pollutant, accounted for 40.1% of the non-compliant days. The annual average concentration of ambient air PM2.5 in 339 cities ranged from 5 to 54 μg/m3, with an average of 30 μg/m3, an increase of 3.4% compared to 2022. Satellite remote sensing assessments of high-resolution (1 km × 1 km) outdoor PM2.5 concentrations in China from 2000 to 2016 showed that the most severe pollution was in the Beijing-Tianjin-Hebei region[37]. From 2016 to 2023, the national average PM2.5 concentration decreased by 28.6%, from 42 μg/m3 to 30 μg/m3. Outdoor air pollution is influenced by meteorological factors, such as temperature, humidity, wind speed, and wind direction.
-
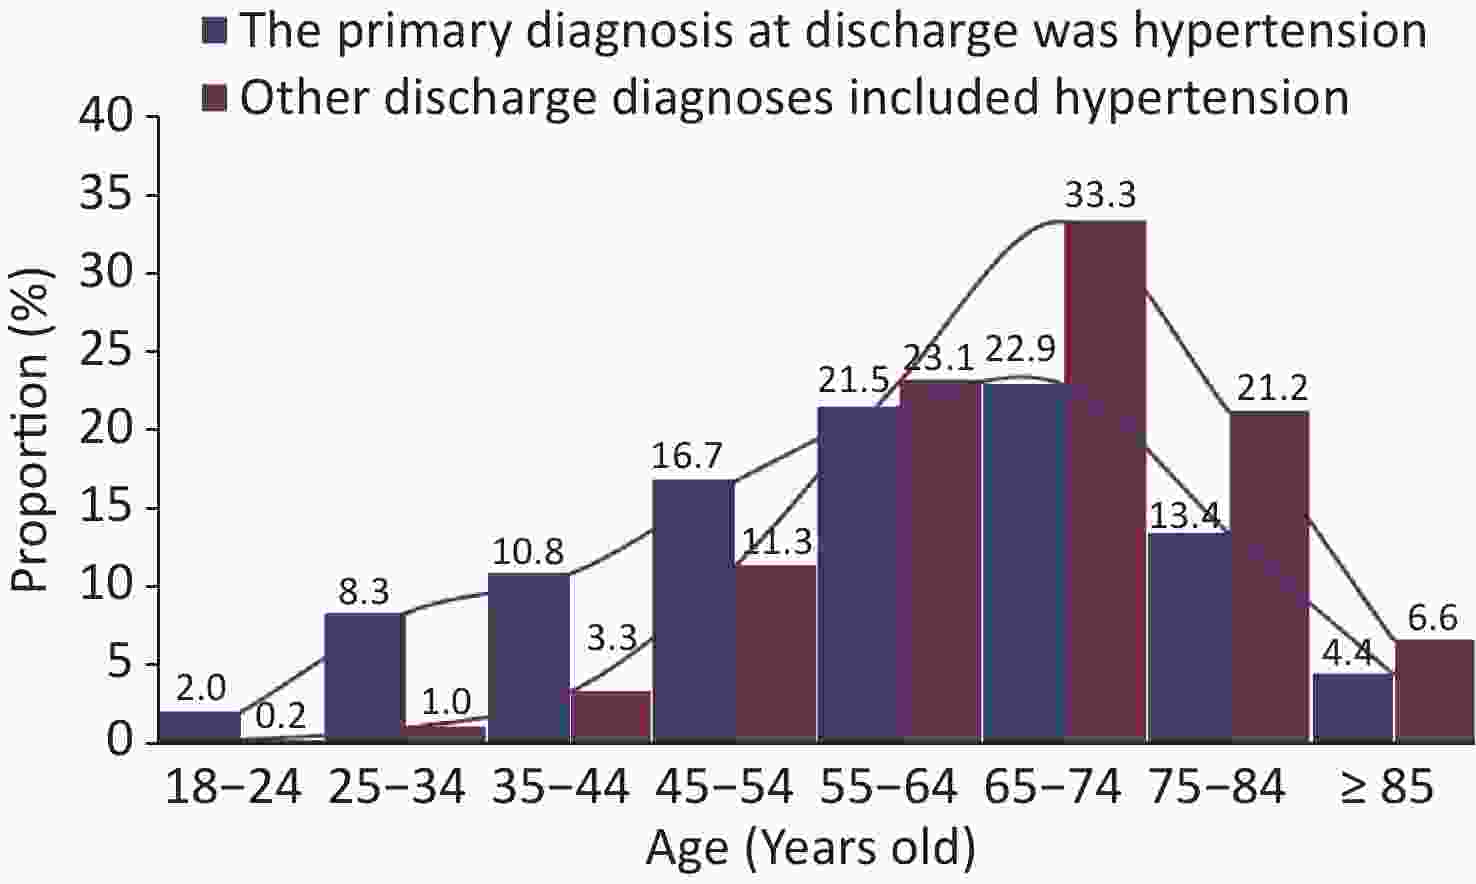
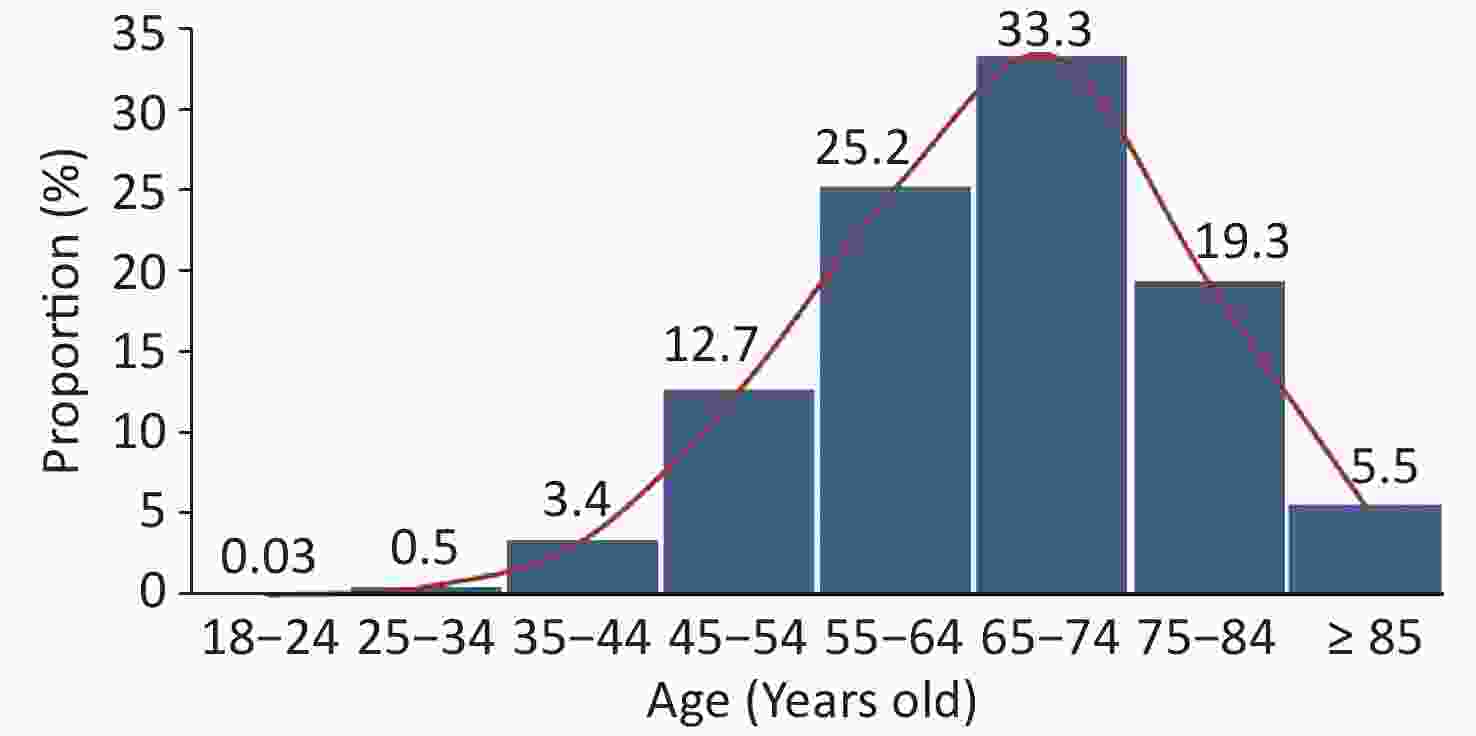
According to the Hospital Quality Monitoring System (HQMS), 6,748 hospitals treated inpatients with hypertension in 2023 (aged ≥ 18 with hypertension as a primary or secondary diagnosis), accounting for 83.1% of all hospitals treating inpatients with CVD. Among them, 2,286 were tertiary hospitals and 4,462 were secondary hospitals. A total of 50.37 million inpatients with hypertension were treated, representing 65.8% of inpatients with CVD. Among them, 1.85 million had hypertension as the primary diagnosis, with an average age of 58.6 ± 16.7 years, and 54.5% were females. Patients with hypertension as a secondary diagnosis had an average age of 66.8 ± 12.5 years, with 47.2% being females. The age distribution of the inpatients with hypertension is shown in Figure 27.
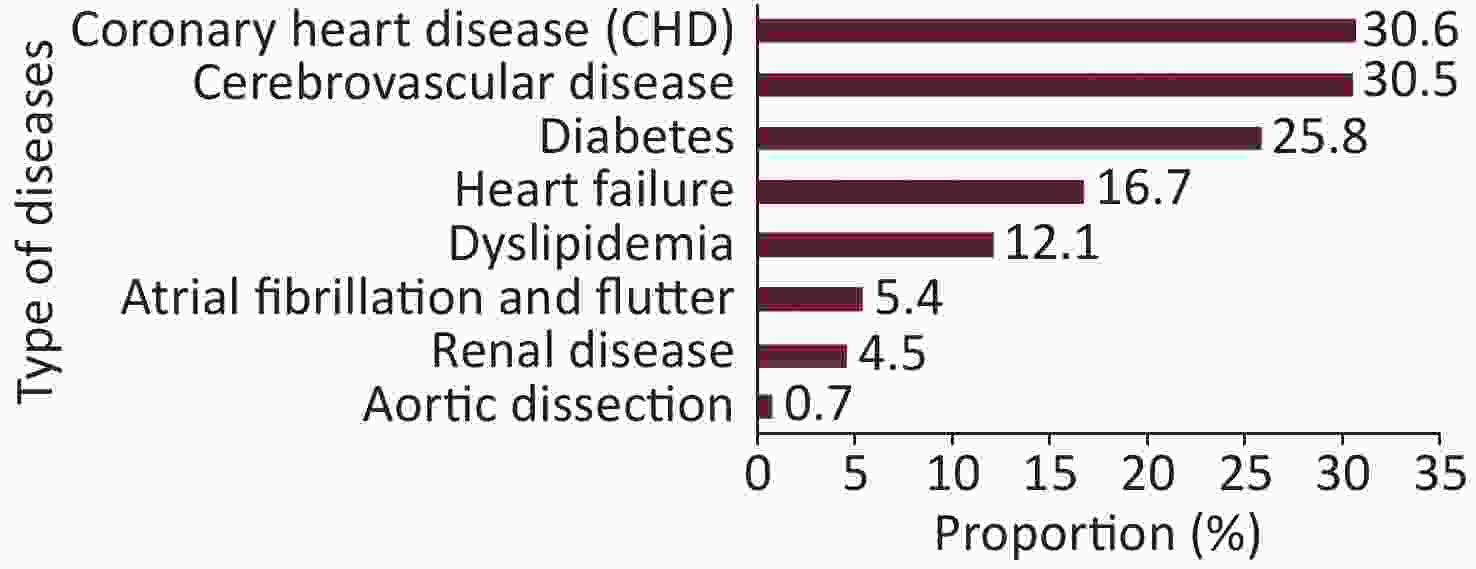
The top three comorbidities among inpatients with hypertension were CHD (30.6%), cerebrovascular disease (30.5%), and diabetes (25.8%) (Figure 28).
Among inpatients with CVD, 994,000 had secondary hypertension, accounting for 2.0% of all inpatients with hypertension. The leading causes of secondary hypertension were renal parenchymal hypertension (41.3%), obstructive sleep apnea syndrome (OSAS, 28.8%), and renal vascular hypertension (11.0%).
In 2023, the in-hospital mortality rate for patients discharged with a primary diagnosis of hypertension was 0.1%, while 3.8% of patients were discharged without recovery, including deaths in hospital or against medical advice.
-
Data from the HQMS showed that in 2023, 6,581 hospitals treated inpatients with CHD (aged ≥ 18 years with CHD as the primary diagnosis), accounting for 81.1% of hospitals treating inpatients with CVD. Among them, 2,169 were tertiary hospitals and 4,412 were secondary hospitals. These hospitals treated 8.368 million inpatients with CHD, including 5.677 million in tertiary hospitals and 2.691 million in secondary hospitals. The average age of the inpatients was 66.5 years, and 43.0% were females. Patients aged 55–84 years accounted for 77.8% of the total, whereas those aged < 55 years accounted for 16.7% (Figure 29).
Among inpatients with CHD, 61.3% had comorbid hypertension and 27.5% had comorbid type 2 diabetes mellitus (T2DM).
The top three primary discharge diagnoses among the inpatients with CHD were unstable angina, unspecified CHD, and stable angina, with proportions of 40.0%, 29.0%, and 15.1%, respectively (Figure 30).
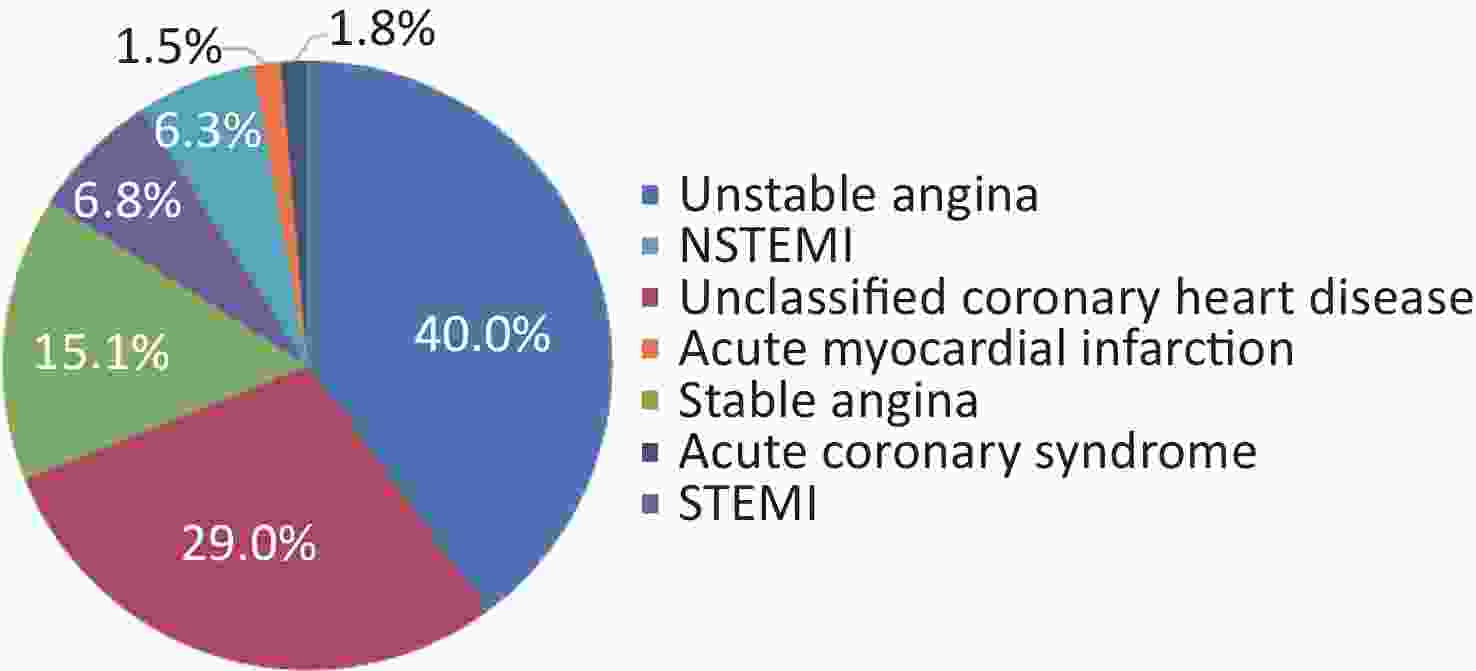
Figure 30. Proportion of main discharge diagnosis categories among inpatients with coronary heart disease. NSTEMI, non-ST-segment elevation myocardial infarction; STEMI, ST-segment elevation myocardial infarction.
In 2023, 1.222 million inpatients with AMI were treated, including ST-segment elevation myocardial infarction (STEMI, 46.7%), non-ST-segment elevation myocardial infarction (NSTEMI, 43.1%), and unclassified AMI (10.2%).
The in-hospital mortality rate for patients with AMI was 4.0%, and the non-recovery discharge (in-hospital death or non-medically advised discharge) rate was 12.8%. The mortality rate was higher in females (5.5%) than in males (3.3%) and the non-recovery discharge rate was higher in females (15.9%) than in males (11.6%).
In 2023, 1.901 million patients underwent percutaneous coronary intervention (PCI), accounting for 22.7% of the patients with CHD. Coronary angiography alone was performed in 2.029 million patients (24.2%). The average age of the patients undergoing PCI was 63.3 years, with 28.6% being female. Patients aged 45–74 years accounted for 78.7%, and those aged ≥ 75 years accounted for 15.6%.
Among the inpatients with CHD undergoing interventional treatment, PCI accounted for the largest proportion (68.8%), whereas PTCA was the lowest (5.7%), followed by other interventional treatments (Figure 31).
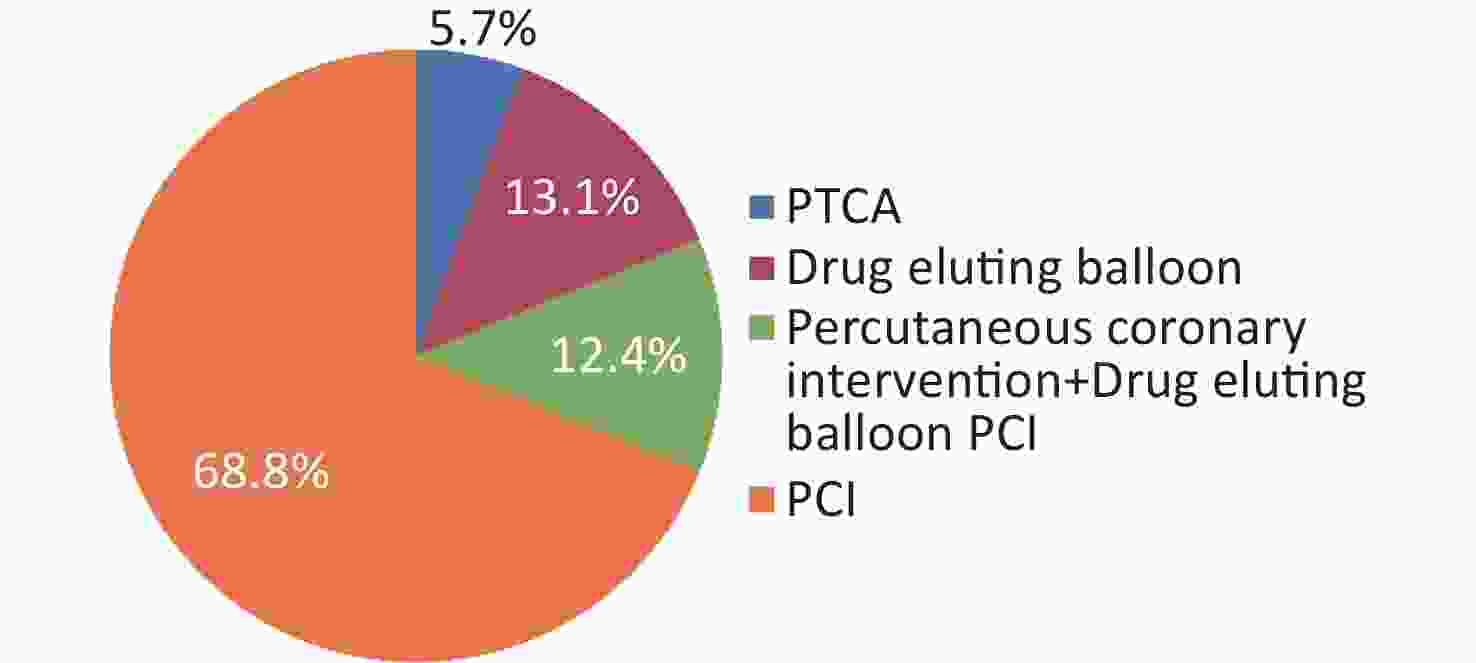
Figure 31. Proportion of interventional therapy types among patients with coronary heart disease who received coronary intervention. PTCA, Percutaneous transluminal coronary angioplasty; PCI, Percutaneous coronary intervention.
In the 2023 HQMS data, 654 hospitals performed at least one CABG, with 61,000 isolated CABG procedures. Regional disparities in CABG volume were significant, with the top three provinces accounting for 52% of national cases. The average age of patients with CABG was 62.2 ± 8.9 years, with 75.3% aged 55–74 and 8.0% aged ≥ 75.
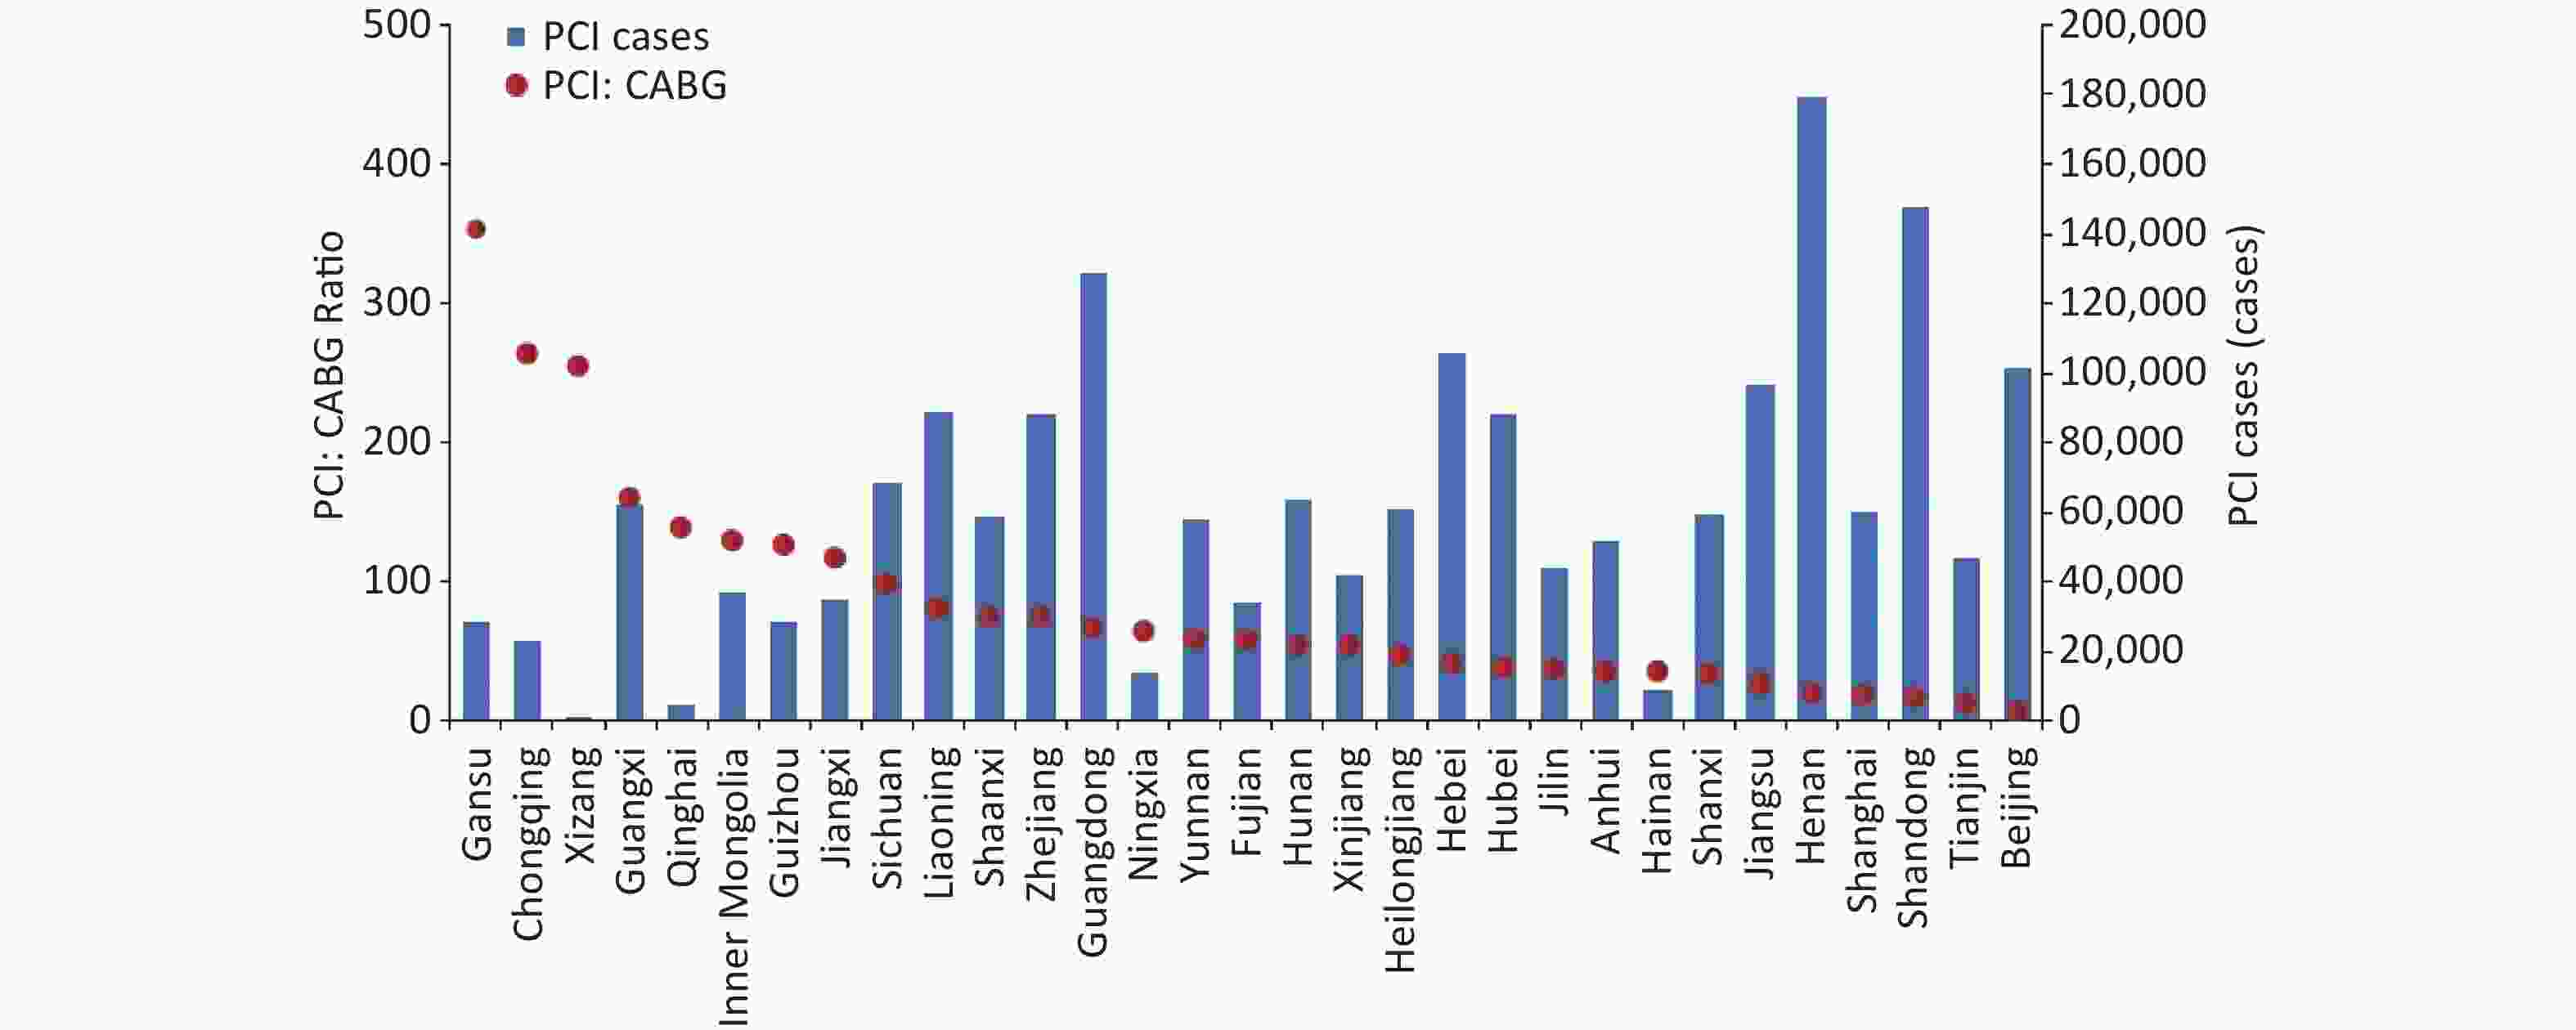
The PCI to CABG ratio in 2023 is 31.4:1. The ratios and numbers of coronary interventions in each province (autonomous regions and municipalities directly under the Central Government) are shown in Figure 32.
-
In 2023, 7,583 hospitals provided arrhythmia diagnosis and treatment services, accounting for 93.4% of hospitals treating CVD. Among these, 2,485 were tertiary hospitals (32.8%) and 5,098 were secondary hospitals (67.2%).
A total of 11.132 million inpatients with arrhythmia (principal discharge diagnosis or other discharge diagnoses, including arrhythmia) were treated in 2023. The top three arrhythmia types were atrial tachycardia/atrial flutter/fibrillation (37.84%), atrial premature beats (18.11%), and ventricular premature beats (17.10%) (Figure 33). Atrial arrhythmias accounted for 55.9% of cases, reflecting China’s aging population.
Approximately 342,000 ablation procedures were performed for arrhythmias, accounting for 3.1% of inpatients with arrhythmia. Left atrial appendage closure was performed in 19,000 cases, and device implantation was performed in 166,000 cases, including dual-chamber pacemakers (100,000), single-chamber pacemakers (21,000), unspecified pacemakers (25,000), implantable cardioverter defibrillators (ICD, 10,000), cardiac resynchronization therapy defibrillators (CRT-D, 5,755), and CRT devices (3,727) (Figure 34). Conventional pacemakers accounted for over 75% of the implanted devices.
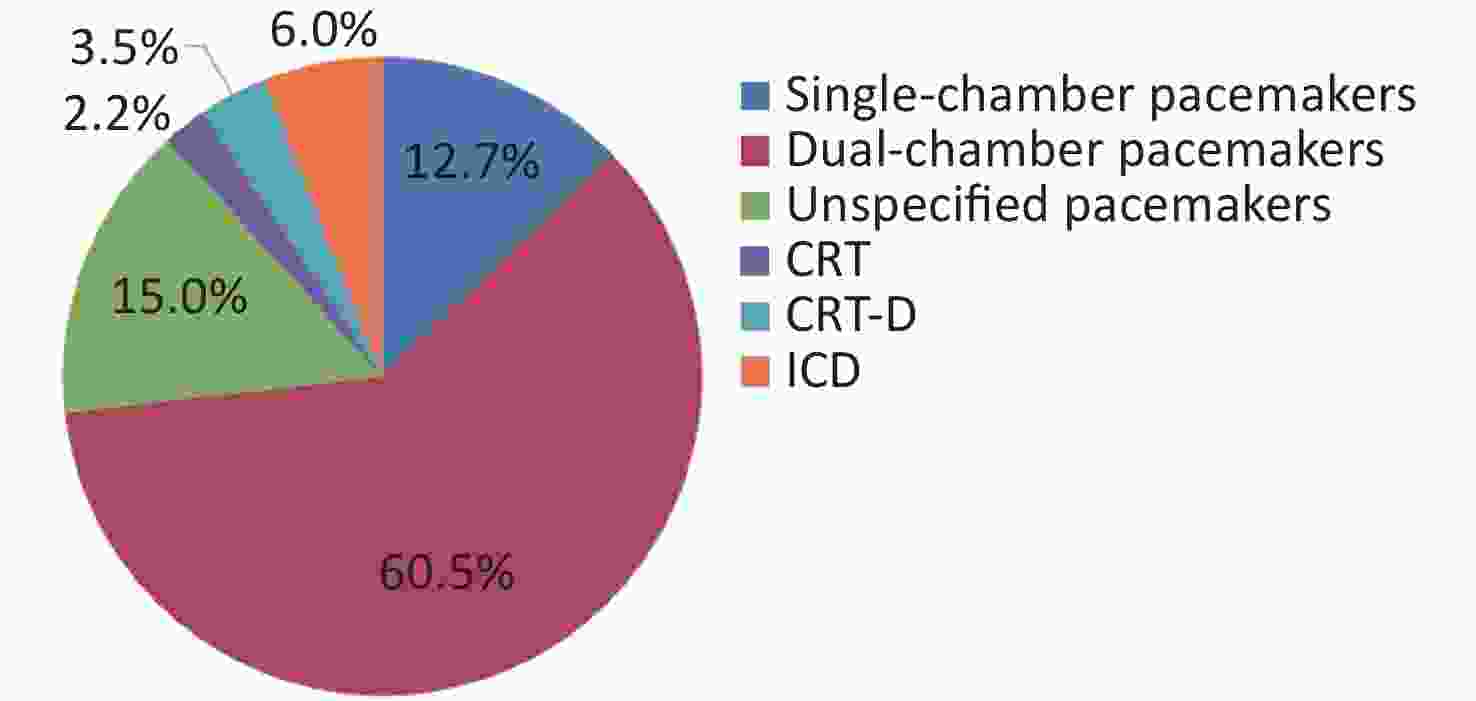
Figure 34. Proportion of different types of device implants in 2023. ICD, implantable cardioverter-defibrillators; CRT-D, cardiac resynchronization therapy defibrillators; CRT, cardiac resynchronization therapy.
In terms of in-hospital mortality, nonrecovery discharge rates, and 30-day readmission rates, combined ablation and closure procedures had the highest rates, followed by left atrial appendage closure, with catheter ablation having the lowest rate. Radiofrequency ablation and cryoablation has yielded similar outcomes. Device implantation maintained low rates for all the three metrics. Among the 220,000 inpatients with syncope, 49.9% had no identified cause and only 20% were diagnosed with vasovagal syncope, which was significantly lower than the international rate of over 50%, suggesting room for improvement in syncope diagnosis and coding practices.
-
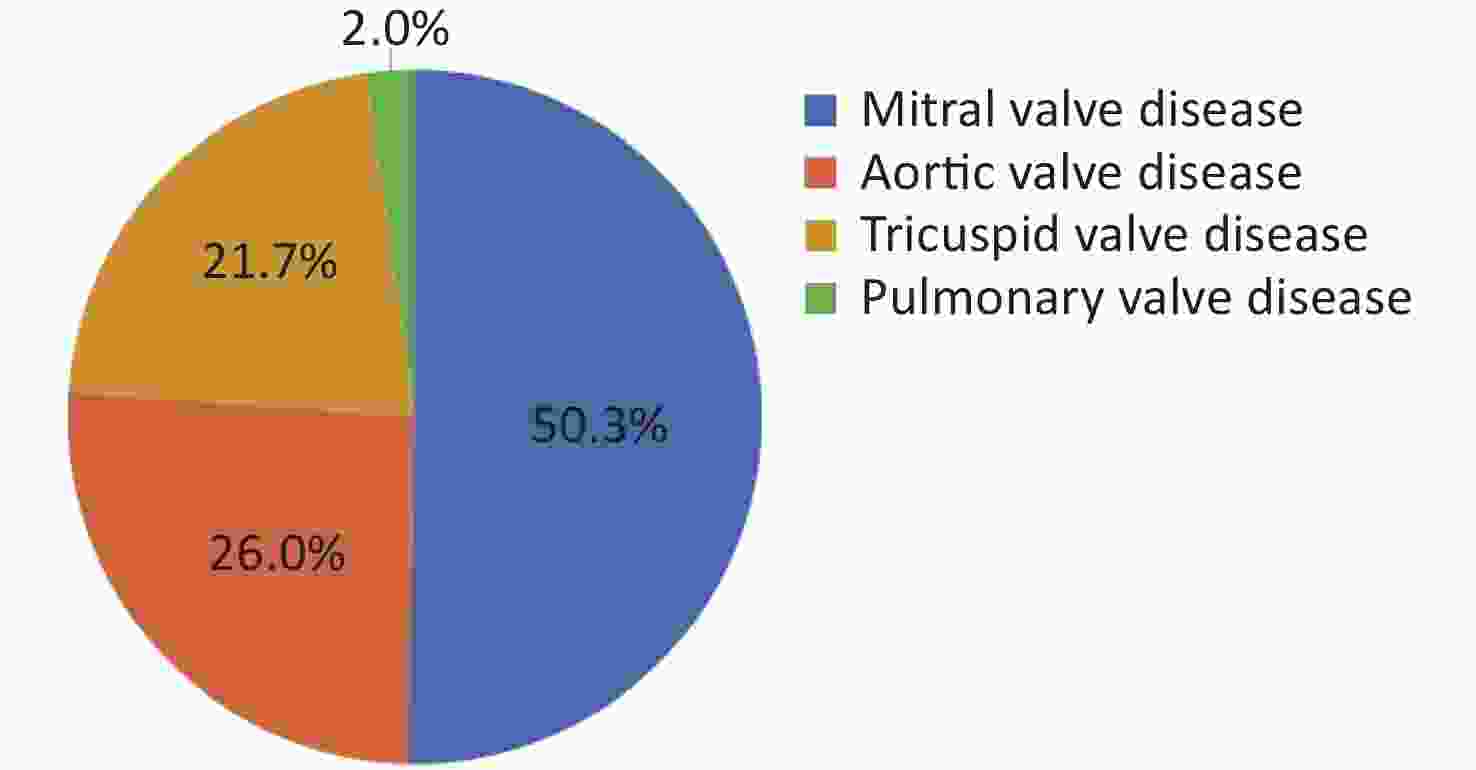
According to HQMS data from 2023, 6,794 hospitals treated inpatients with valvular heart disease, accounting for 83.7% of the hospitals treating CVD, with 2,402 tertiary hospitals and 4,392 secondary hospitals. These hospitals treated 2.661 million inpatients with valvular heart disease (discharge diagnosis, including valvular heart disease), with mitral valve disease being the most common (1.339 million, 50.3%), followed by aortic, tricuspid, and pulmonary valve diseases (Figure 35).
In 2023, 9,928 isolated surgical aortic valve replacements (SAVR) were performed, with bioprosthetic valves used in 46.8% of cases. Older patients predominantly received bioprosthetic valve replacements. Transcatheter aortic valve replacement (TAVR) was performed in 9,629 cases, approaching the volume of SAVR (Figure 36), with 41.5% of the TAVR patients being female.
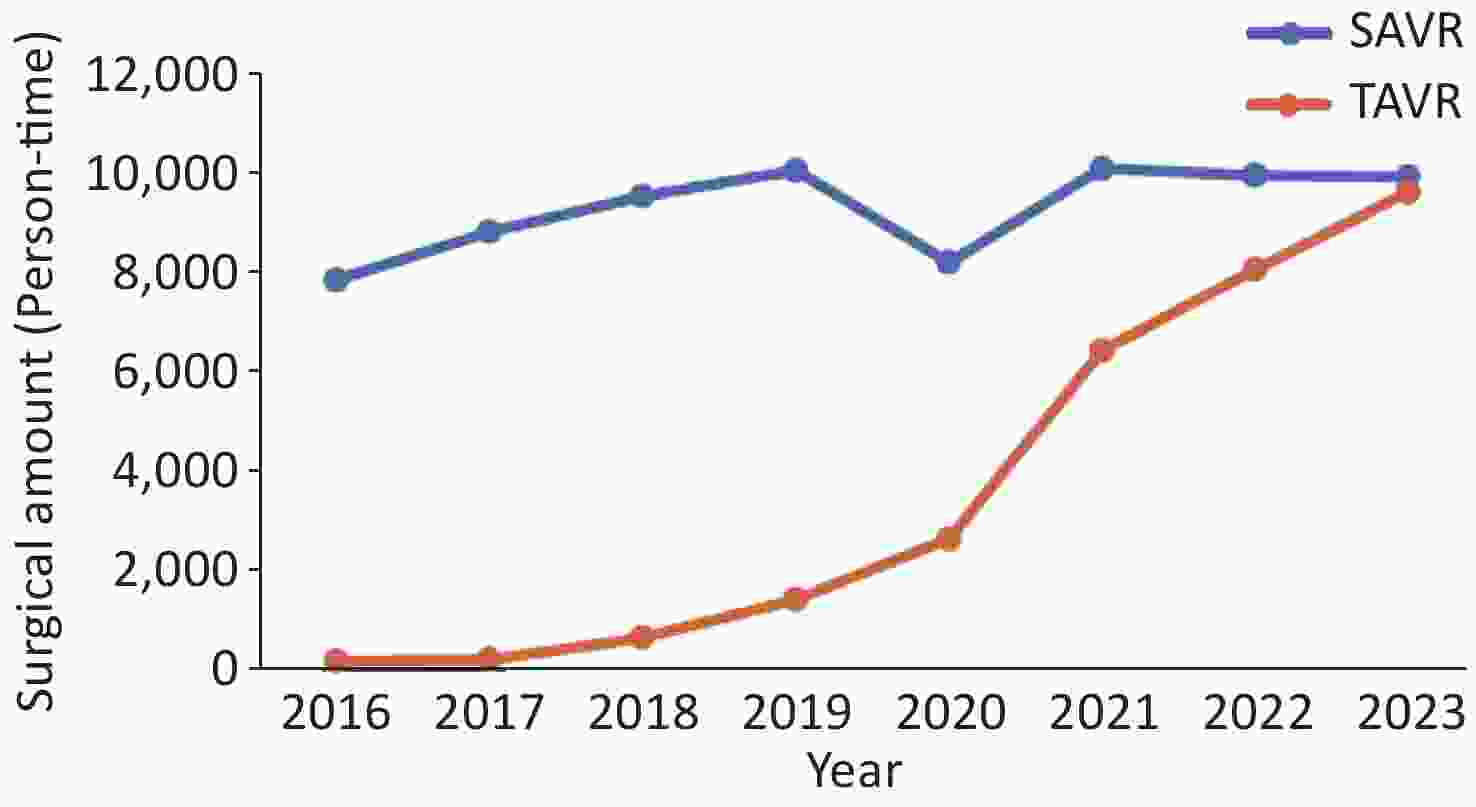
Figure 36. Growth of TAVR and SAVR over the past eight years. SAVR, surgical aortic valve replacements; TAVR, transcatheter aortic valve replacement.
In 2023, 28,000 isolated mitral valve surgeries were performed, including valve repair (32.4%) and replacement (67.6%). The proportion of repairs decreased with age, whereas that of replacements increased (78.0% in patients < 18 vs. 38.9% in those > 85 years). Among mitral valve replacements, bioprosthetic valves were used in 45.6% of cases, with mechanical valve use declining and bioprosthetic valve use rising with age (92.8% mechanical in patients < 18 vs. 0% in those > 85 years).
In 2023, 3,019 mitral valve interventional procedures were performed, with mitral valve clipping being the most common (49.7%) (Figure 37).
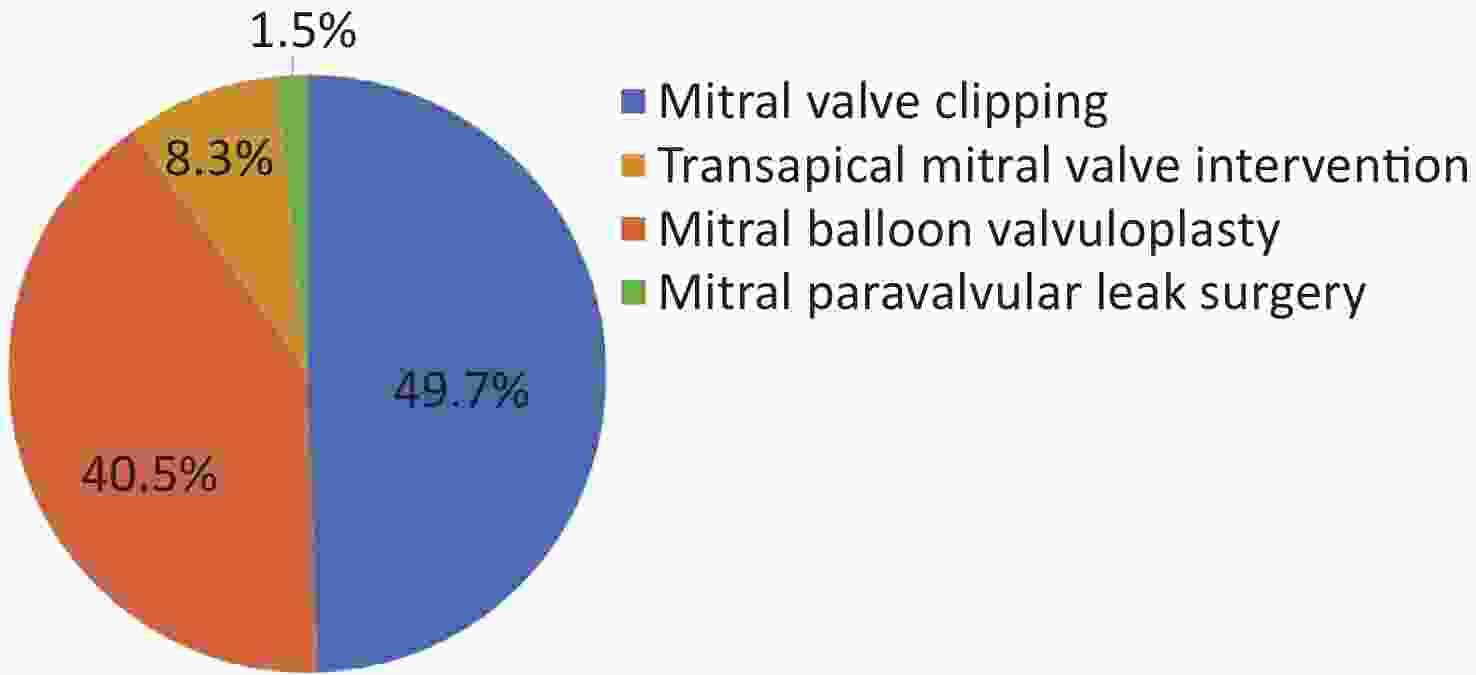
Figure 37. Proportion of mitral valve intervention types. Transapical mitral valve intervention includes transapical mitral valve artificial chordae implantation and transapical mitral valve replacement.
In 2023, 45,000 tricuspid valve surgeries (mostly combined procedures) were performed, with 77.6% of the patients aged > 45 years and 45.4% male patients. The non-recovery discharge rate is 3.1%, with a significant decline from 2022. Tricuspid valve interventional procedures were performed in 165 patients, of whom 62.4% were female. The in-hospital mortality and non-recovery discharge rates for these procedures were both 0.6%.
In 2023, 1,307 pulmonary valve surgeries were performed, with 694 patients (53.1%) aged < 18 years and 44.9% being male. The non-recovery discharge rate was 2.4%, which is a significant decline from 2022. Interventional pulmonary valve procedures were performed in 740 patients, 54.7% of whom were female. The in-hospital mortality and nonrecovery discharge rates were 0.1% and 0.7%, respectively.
-
In 2023, 7,374 hospitals treated inpatients with HF (aged ≥ 18 years with HF as a primary or secondary diagnosis) from HQMS data, accounting for 90.8% of hospitals treating CVD, with 2,415 tertiary hospitals and 4,959 secondary hospitals. These hospitals treated 14.29 million inpatients with HF, with tertiary hospitals accounting for 59.2%, and secondary hospitals accounting for 40.8%. Among these patients, 27.9% were admitted to the emergency department, 69.2% through outpatient clinics, and 2.9% through other routes (e.g., transfers).
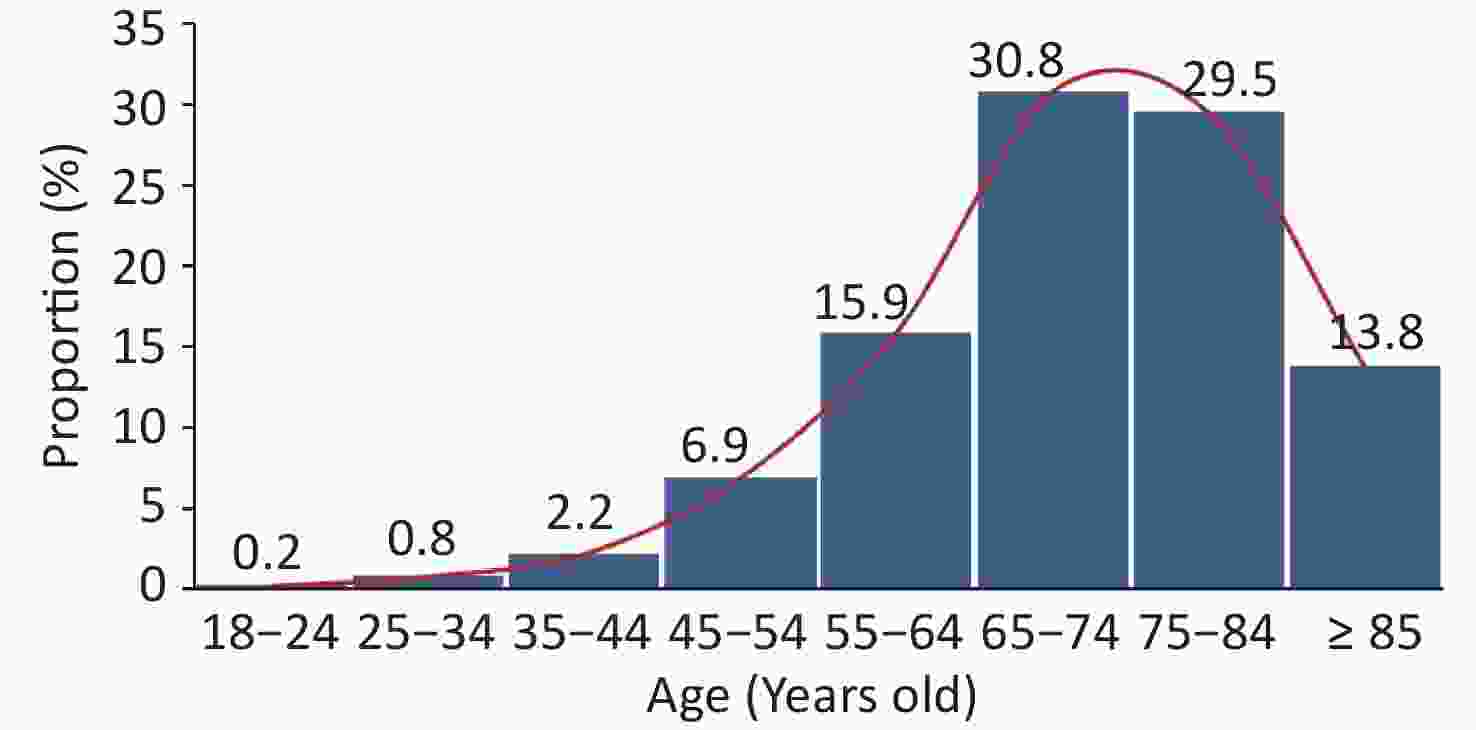
The average age of inpatients with HF was 71.2 ± 12.6 years, with 45.3% being female. Age distribution is shown in Figure 38.
Cardiovascular comorbidities included CHD (68.7%), hypertension (58.9%), atrial fibrillation/flutter (19.8%), cardiomyopathy (2.9%), and cardiogenic shock (1.1%). Non-cardiovascular comorbidities included stroke (40.5%), chronic obstructive pulmonary disease (COPD, 28.2%), and diabetes mellitus (27.0%).
The non-recovery discharge (in-hospital death or non-medically advised discharge) rate for inpatients with HF was 10.2%, with an in-hospital mortality rate of 2.6%, and a non-medically advised discharge rate of 7.6%. The 30-day readmission rate was 11.0%.
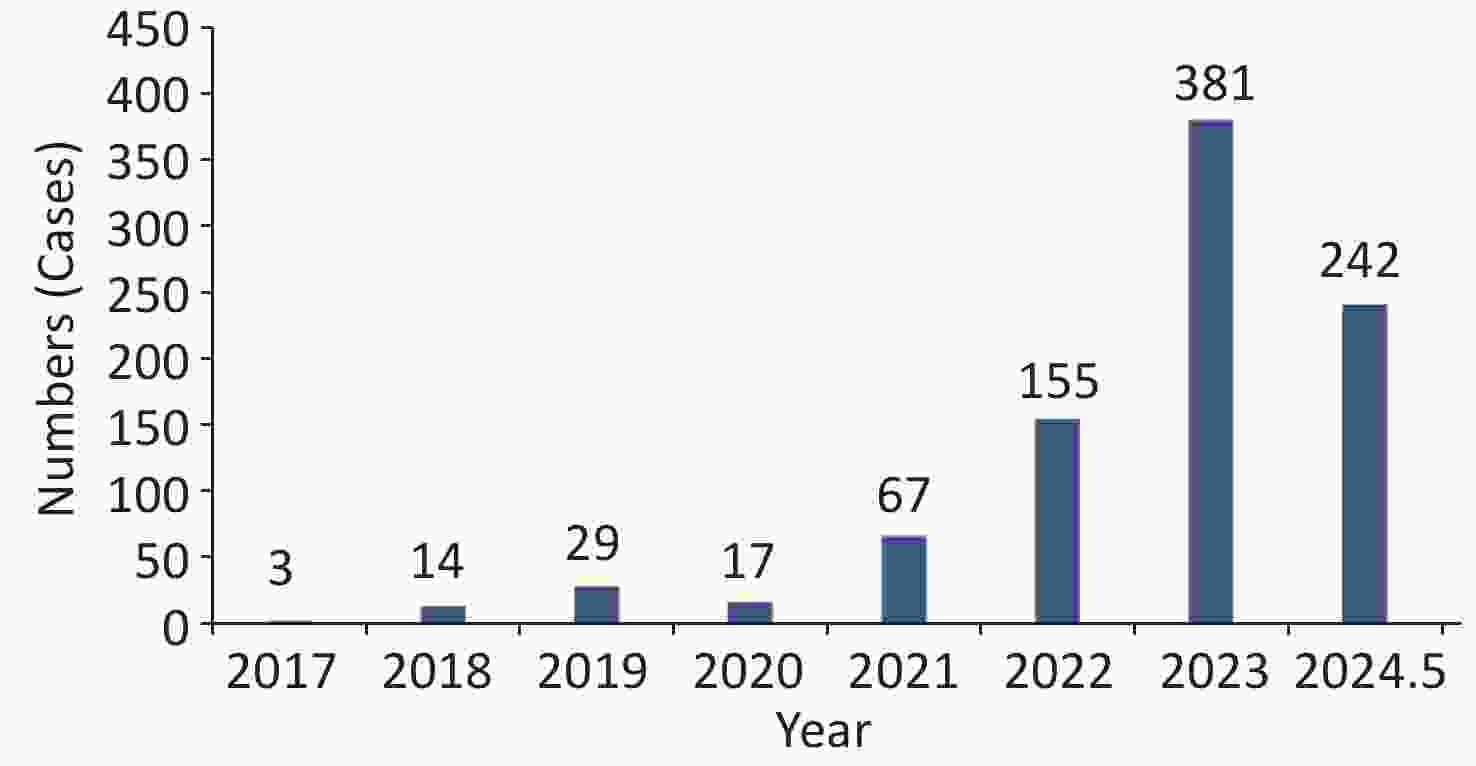
Left ventricular assist devices (LVAD) significantly improved the survival and quality of life of patients with advanced HF. Since the first long-term LVAD implantation in June 2017, 908 LVAD procedures have been performed at 132 hospitals as of May 2024 (Figure 39). Among these, 27 patients (3.0%) transitioned to heart transplantation, 19 (2.1%) recovered cardiac function, the device was removed, and 133 died during follow-up. The longest survival time with an LVAD was 26.9 years, with an average duration of 1.02 years. By June 2024, Fuwai Hospital implanted 140 long-term LVADs, including 21 EVAHEART, 75 CH-VAD, and 44 CorHeart6 devices. The CH-VAD was China’s first fully magnetically levitated LVAD.
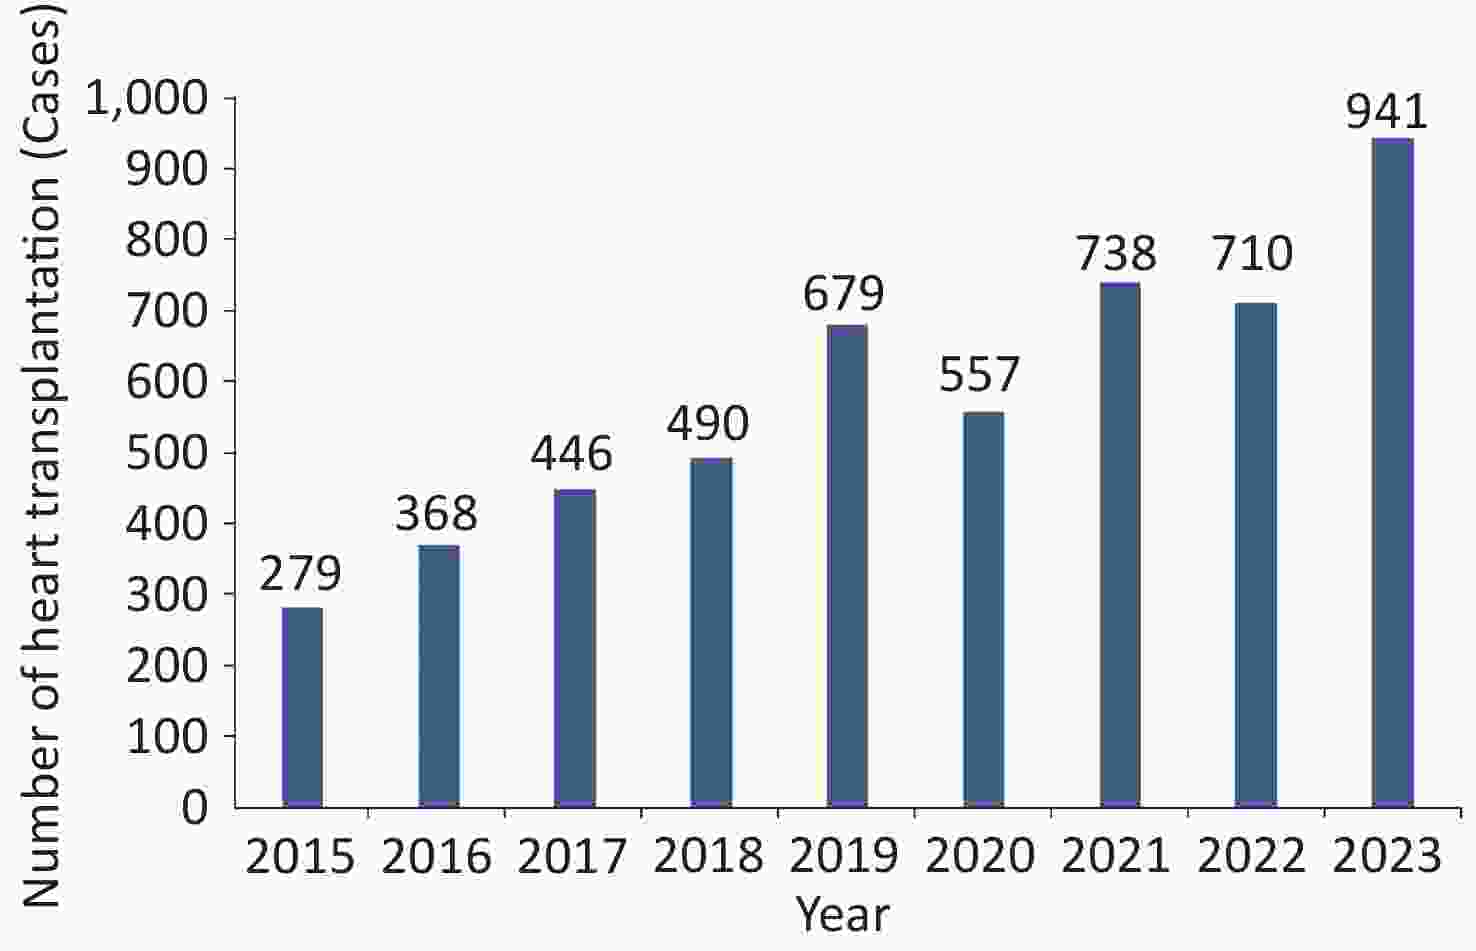
Heart transplantation is the most effective and widely accepted treatment for end-stage cardiomyopathy. According to the China Heart Transplant Registry, 5,208 heart transplants were performed and reported by Chinese centers between 2015 and 2023 (Figure 40).
-
According to the 2023 HQMS data, 4,239 hospitals treated inpatients with CHD, accounting for 52.9% of the hospitals providing CVD diagnosis and treatment services. Among these, 1,974 were tertiary hospitals (77.4% of all tertiary hospitals) and 2,265 were secondary hospitals (40.7% of all secondary hospitals). These hospitals treated 2.024 million inpatients with CHD, with 339,000 having CHD as the primary diagnosis. Among the primary CHD diagnoses, atrial septal defect (ASD) accounted for 41.71%, ventricular septal defect (VSD) for 9.72%, patent ductus arteriosus (PDA) for 4.64%, aortic coarctation for 1.01%, endocardial cushion defect for 0.66%, and tetralogy of Fallot for 0.86%. Among the patients with CHD, 5.82% were neonates or infants (< 1 year), 19.76% were children (1–17 years), and 74.42% were adults (≥ 18 years).
In 2023, 177,000 inpatients with CHD underwent surgical or interventional treatment, accounting for 47.3% of inpatients with CHD. Among these, 160,000 (90.4%) had simple CHD, and 17,000 (9.6%) had complex CHD. A total of 61,000 patients (34.2% of all inpatients with CHD) received surgical treatment, with complex CHD accounting for 26.8% of this surgical group.
Among the surgically treated CHD patients in 2023, children aged 1–17 years accounted for the largest proportion (45.42%), followed by adults (33.53%). Additionally, 1,378 neonatal CHD surgeries were performed (Figure 41).
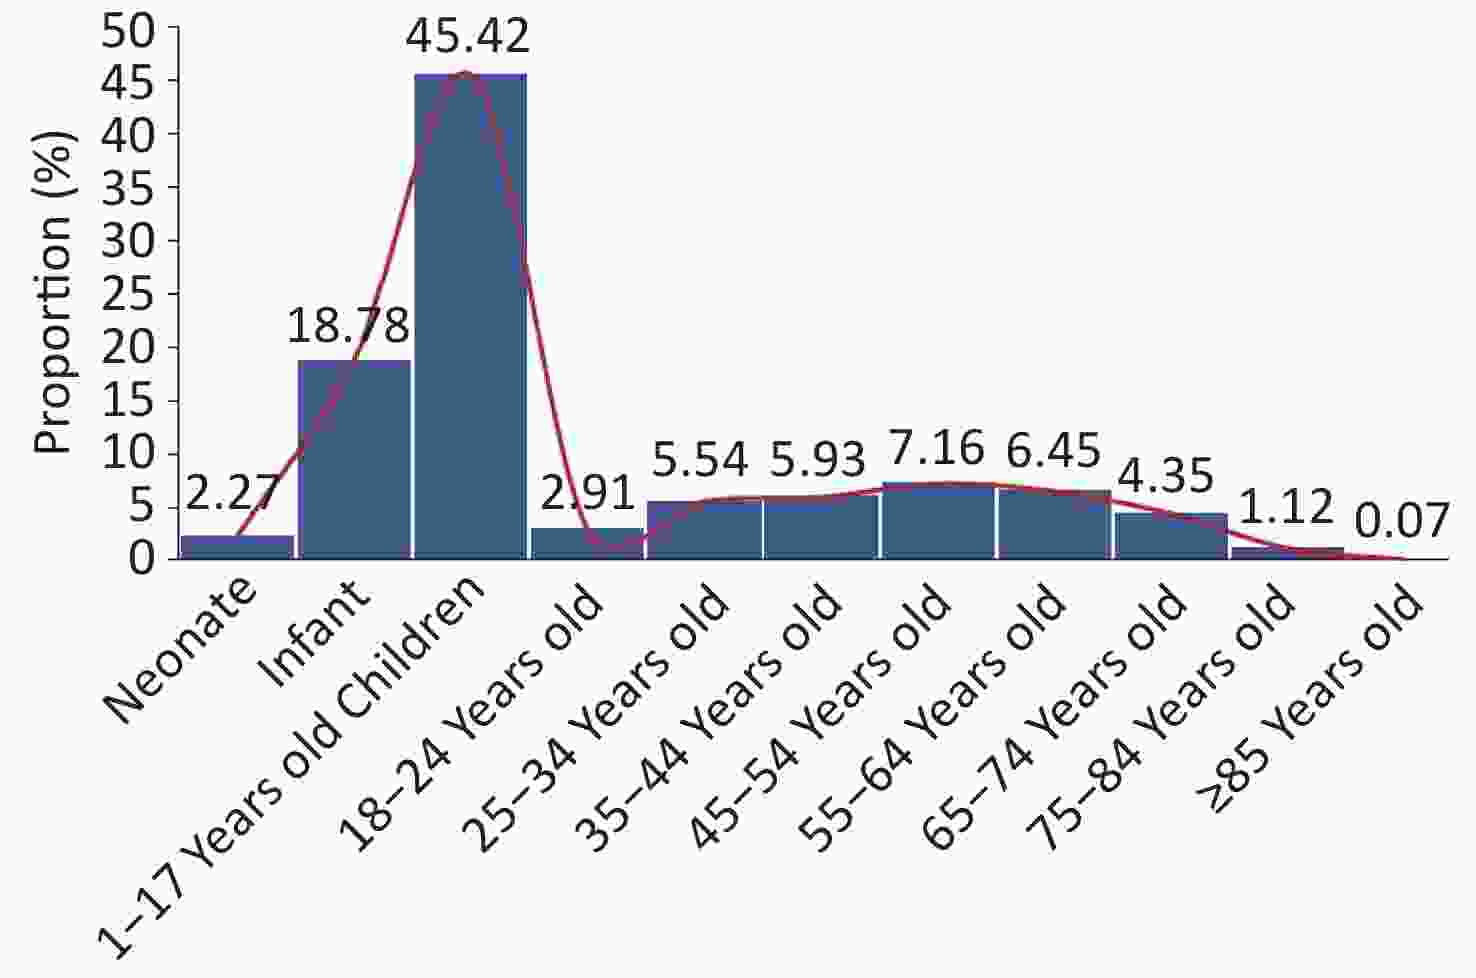
Figure 41. Age distribution of patients with congenital heart disease who underwent surgical treatment.
There were 20,000 adult CHD surgeries performed in patients aged 18 years and older, excluding adult mitral or aortic valve procedures. Among these, ASD repair accounted for the largest proportion, comprising 49.86% of all adult CHD surgeries.
The in-hospital mortality rate for surgically treated CHD was 0.7%, and the non-recovery discharge (in-hospital death or non-medically advised discharge) rate was 1.7%. For simple CHD, these rates were 0.3% and 0.8%, respectively, whereas for complex CHD, they were 2.2% and 3.9%, respectively.
In 2023, among the patients with CHD who underwent interventional treatment, the patent foramen ovale (PFO) closure was the most common (47.2%), followed by ASD closure, PDA closure, VSD closure, and pulmonary valve intervention (Figure 42).
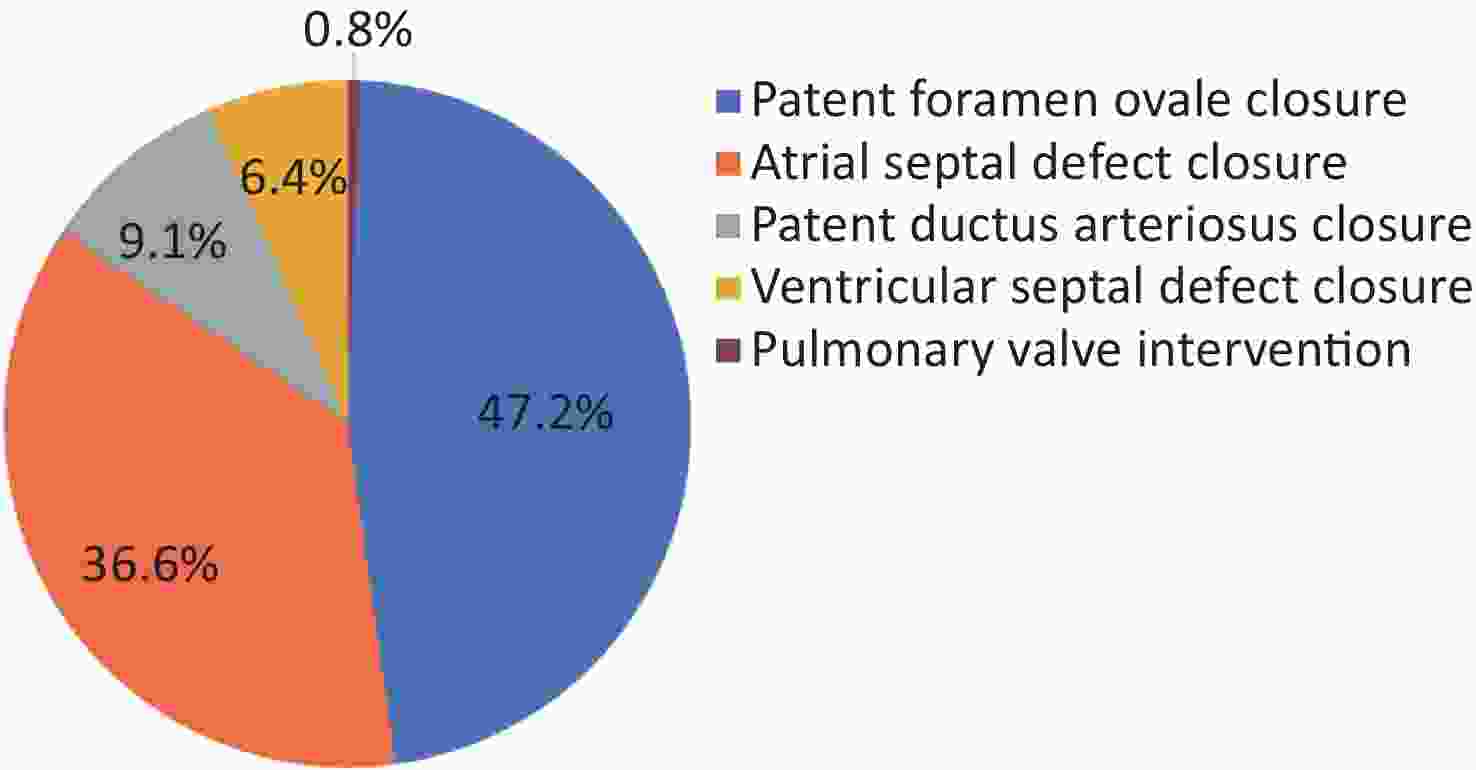
Figure 42. Proportion of congenital heart disease types among patients receiving interventional therapy.
Among 117,000 patients with interventional CHD, 27.8% were children (aged < 18 years). The most common procedure performed in the children was ASD closure (42.9%), followed by PDA closure, VSD closure, PFO closure, and pulmonary valve intervention. In adults, PFO closure (59.4%) was most common, followed by ASD closure (34.1%).
The in-hospital mortality rate for interventional CHD treatment was 0.01%, and the non-recovery discharge (in-hospital death or non-medically advised discharge) rate was 0.44%. For children, these rates were 0.01% and 0.67%, respectively; for adults, they were 0.01% and 0.35%, respectively.
-
According to the data from the HQMS, in 2023, 4,400 hospitals provided diagnosis and treatment services for aortic disease, accounting for 50.2% of hospitals treating CVD. A total of 155,400 inpatients aged 18 and above were treated for aortic disease as the primary diagnosis. Aortic dissection was the most common subtype, accounting for 47.4% of cases, followed by aortic aneurysms at 24.7% (Figure 43).
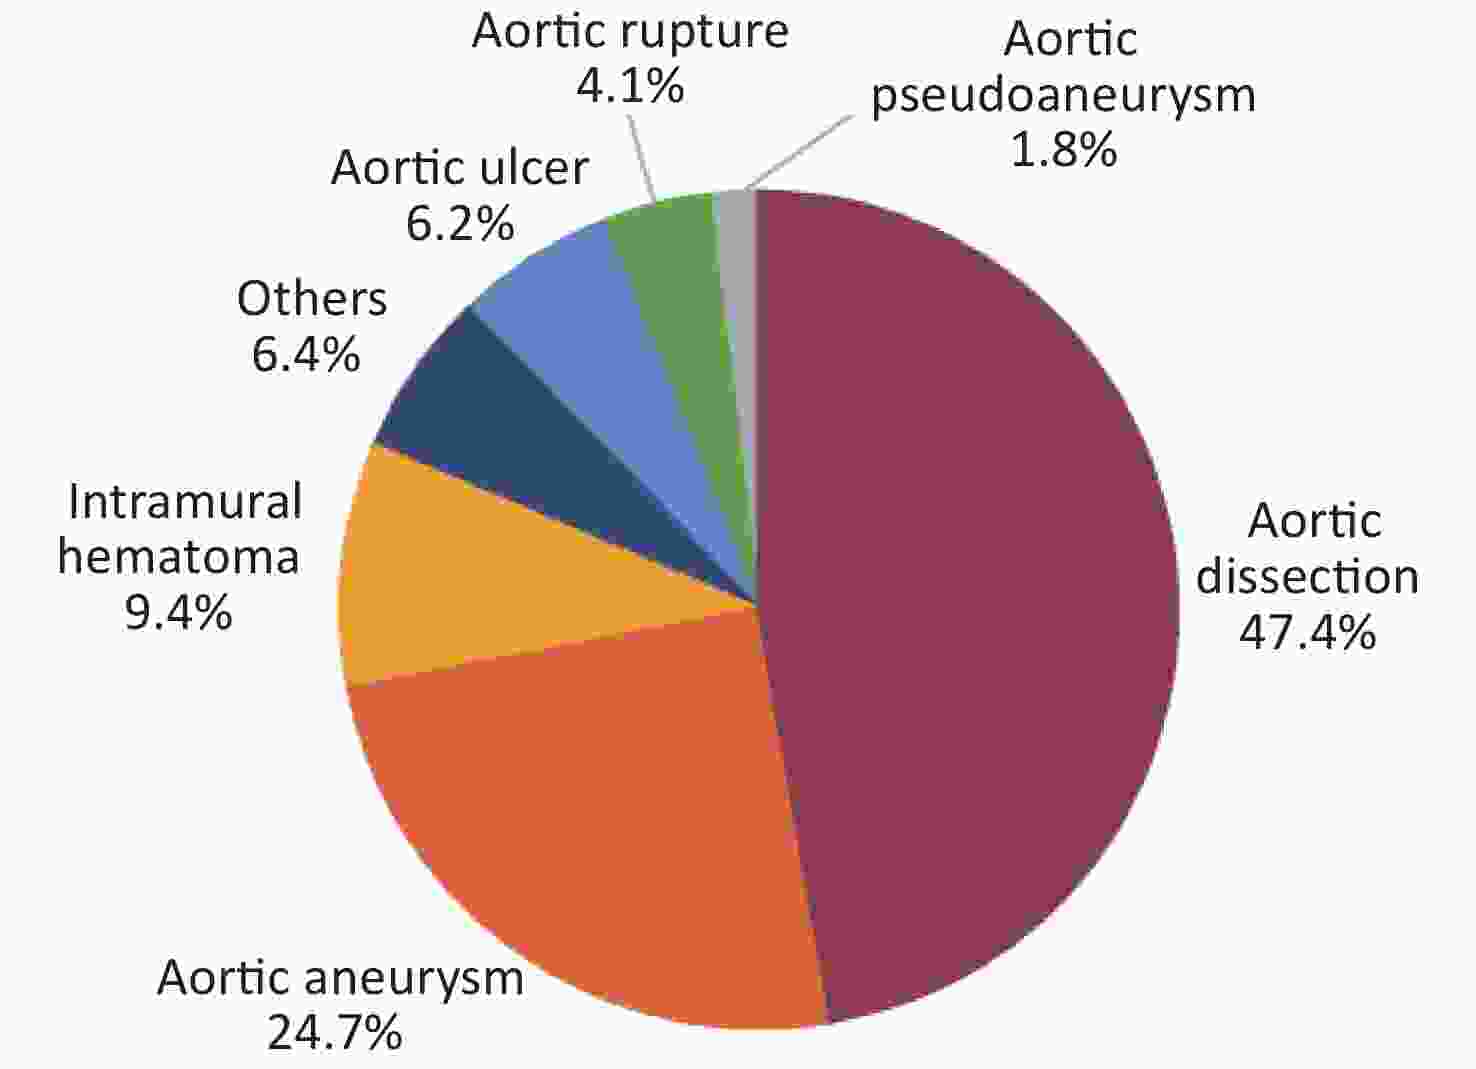
Figure 43. Proportion of various disease types among patients with aortic diseases in 2023. Others include Takayasu arteritis, aortic coarctation, aortic embolism, traumatic aortic dissection/aneurysm, et al.
In 2023, 3,926 hospitals treated inpatients with aortic dissection, accounting for 48.4% of the hospitals treating CVD. A total of 74,000 inpatients with aortic dissection were treated, and 58.6% were admitted to the emergency department.
The average age of inpatients with aortic dissection was 58.5 ± 13.8 years, with 24.2% being female. Comorbid hypertension was 77.3%.
Endovascular surgery was performed in 34.5% of inpatients with aortic dissection, open surgery in 18.5%, and no surgical treatment in 47.0 %.
The in-hospital mortality rate for aortic dissection was 4.5%, and the non-recovery discharge (in-hospital death or non-medically advised discharge) rate was 17.4%.
The HQMS data showed that 2,606 hospitals treated inpatients with aortic aneurysm, accounting for 32.1% of the hospitals treating CVD in 2023. A total of 41,000 inpatients with aortic aneurysms were treated and 22.3% were admitted to the emergency department. The average age was 67.5 ± 11.8 years, with 20.3% being female.
Hypertension was present in 62.0% of the inpatients with aortic aneurysms. Endovascular surgery was performed in 48.9% of patients, open surgery in 13.8%, and no surgical treatment in 37.3%.
The in-hospital mortality rate for aortic aneurysms was 0.5% and the non-recovery discharge (in-hospital death or non-medically advised discharge) rate was 6.9%. For surgically treated patients, the rates were 0.6% and 2.0%, respectively.
-
In 2023, 4,077 hospitals treated carotid atherosclerosis stenosis/occlusion, and 5,426 hospitals treated lower extremity varicose veins, accounting for 50.2% and 66.8% of the hospitals treating CVD, respectively. A total of 224,000 inpatients with carotid atherosclerosis stenosis/occlusion and 381,000 with lower extremity varicose veins were treated. In addition, 48,000 patients with lower-extremity arterial occlusive disease were treated.
The average age of inpatients with carotid atherosclerosis stenosis/occlusion was 67.2 ± 10.2 years, with 29.6% being female.
The in-hospital mortality rate of inpatients with surgically treated carotid atherosclerosis stenosis/occlusion was 0.5%, and the non-recovery discharge (in-hospital death or non-medically advised discharge) rate was 3.0%.
-
In 2023, 6,238 hospitals treated inpatients with PH, including 2,312 tertiary and 3,926 secondary hospitals. A total of 1.638 million inpatients with PH (aged ≥ 18 years with PH as a diagnosis) were treated, with 27.1% admitted through the emergency department and 70.6% through outpatient clinics.
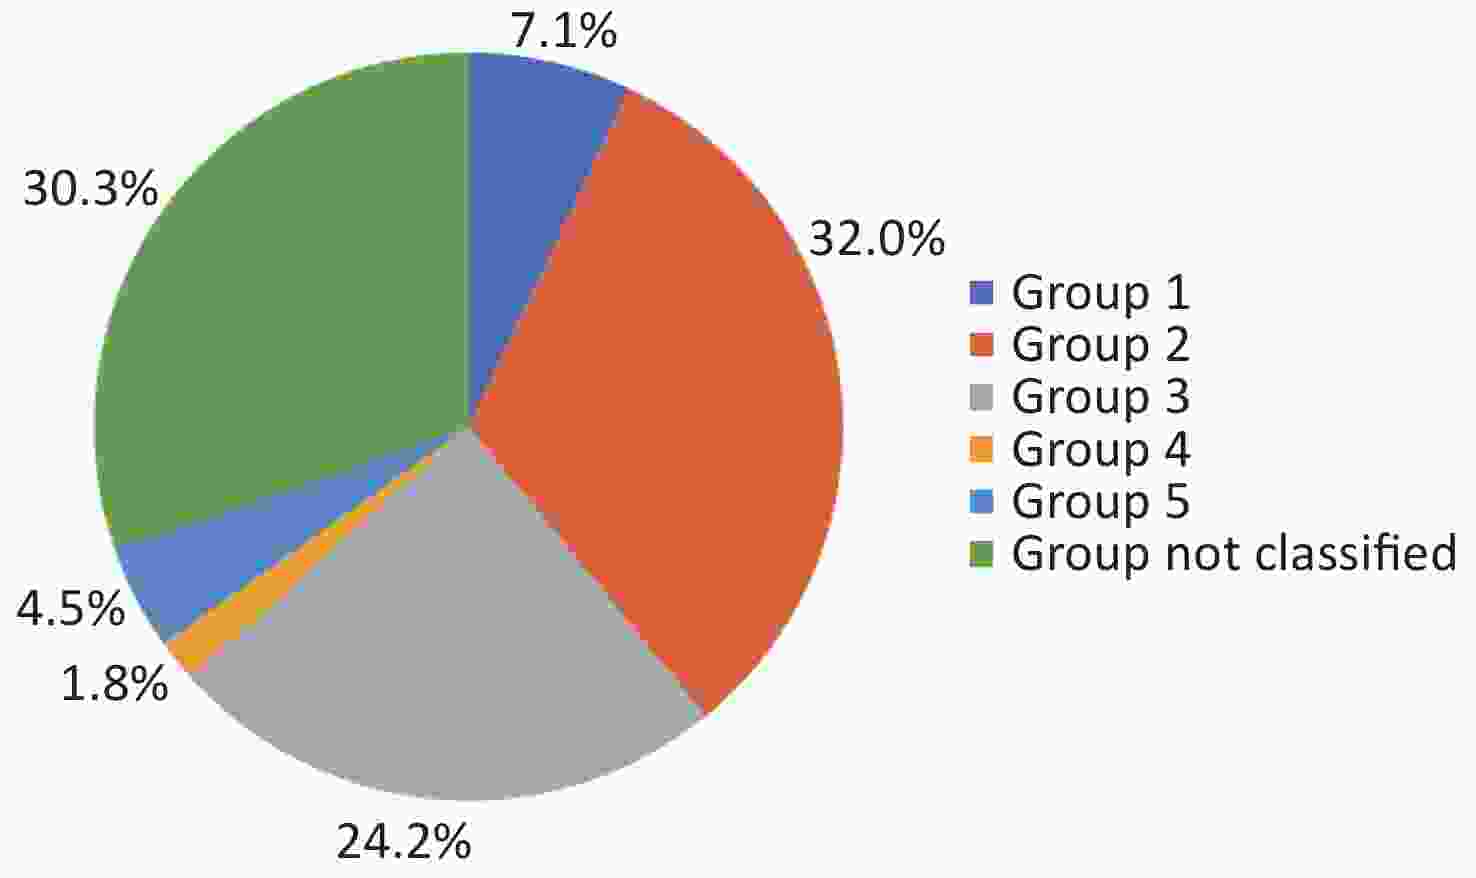
The distribution of PH according to clinical classification is as follows: Group 1 (7.1%), Group 2 (32.0%), Group 3 (24.2%), Group 4 (1.8%), and Group 5 (4.5%) (Figure 44).
The average age of inpatients with PH was 67.5 ± 18.7 years, with 49.1% being female. Group 1 patients with PH were the youngest and had the highest proportion of females, whereas Groups 2 and 3 were more common in older adults, with Group 3 being more prevalent in males.
The in-hospital mortality rate for PH was 1.6%, and the non-recovery discharge (in-hospital death or non-medically advised discharge) rate was 9.6%.
-
In 2023, 5,632 hospitals treated inpatients with pulmonary embolism (PE), and 6,766 hospitals treated inpatients with deep vein thrombosis (DVT). A total of 337,000 inpatients with PE (aged ≥ 18 years with PE as a diagnosis) were treated, accounting for 0.4% of inpatients with CVD. Among these, 32.1% were admitted to the emergency department and 65.8% were admitted to outpatient clinics. A total of 1.868 million inpatients with DVT were treated, accounting for 2.2% of the inpatients with CVD.
Among the inpatients with PE, 56.3% had a history of surgery, 35.8% had DVT, and 23.3% had a malignancy.
The in-hospital mortality and non-recovery discharge rates for PE were 5.7% and 15.5 %, respectively. The DVT rates were 2.3% and 10.3%, respectively.
-
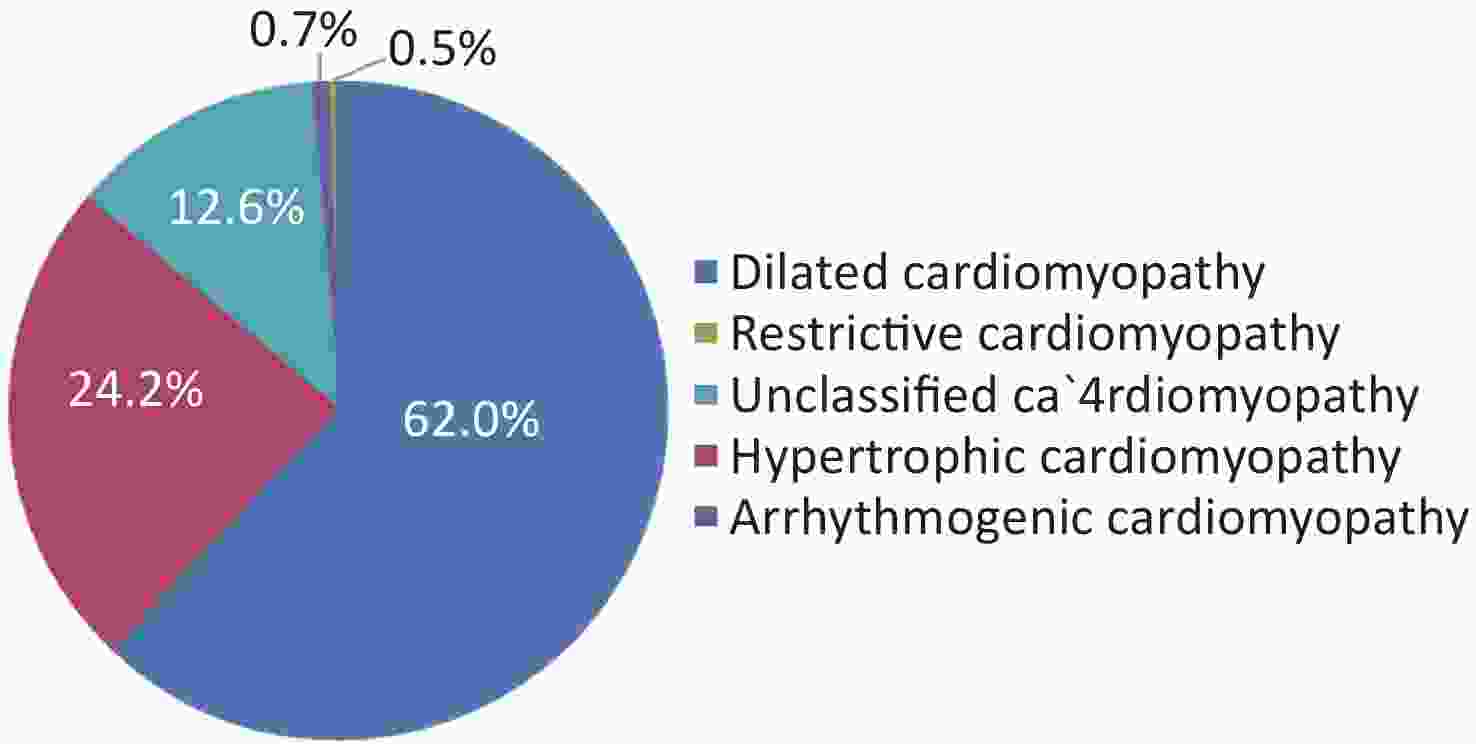
In 2023, 6,411 hospitals treated inpatients with cardiomyopathy (cardiomyopathy as a diagnosis), accounting for 79.0% of the hospitals treating CVD. Among these, 4,065 were secondary hospitals and 2,346 were tertiary hospitals. A total of 849,000 inpatients with cardiomyopathy were treated, including 197,000 with cardiomyopathy as the primary diagnosis. Dilated cardiomyopathy (DCM) accounted for 62.0% of the cases, and hypertrophic cardiomyopathy (HCM) accounted for 24.2% (Figure 45).
Among patients with cardiomyopathy, 37.2% were female. The proportion of females varied by type: DCM (36.2%), HCM (39.9%), restrictive cardiomyopathy (45.1%), arrhythmogenic cardiomyopathy (ACM) (40.6%), and unclassified cardiomyopathy (40.6%). The in-hospital mortality rate for cardiomyopathy was 0.9%, and the non-recovery discharge (in-hospital death or non-medically advised discharge) rate was 6.2%.
-
Data from the HQMS showed that in 2023, the number of people who had undergone coronary artery intervention reached 3.503 million (defined those identified as “post-coronary artery intervention” through either surgical procedures or disease diagnosis). Of these, 366,000 (10.5%) underwent cardiac rehabilitation.
-
In 2023, 4,995 hospitals provided diagnosis and treatment services for OSA, accounting for 61.5% of hospitals treating CVD. Among these, 1,302 (16.0%) offered overnight sleep apnea studies and 2,257 (27.8%) provided noninvasive positive pressure ventilation therapy. A total of 363,000 CVD inpatients with OSA (aged ≥ 18 years with OSA as a diagnosis) were treated, accounting for 0.5% of inpatients with CVD. OSA was the primary discharge diagnosis in 8.1% of cases, and other discharge diagnoses in 91.9% of cases.
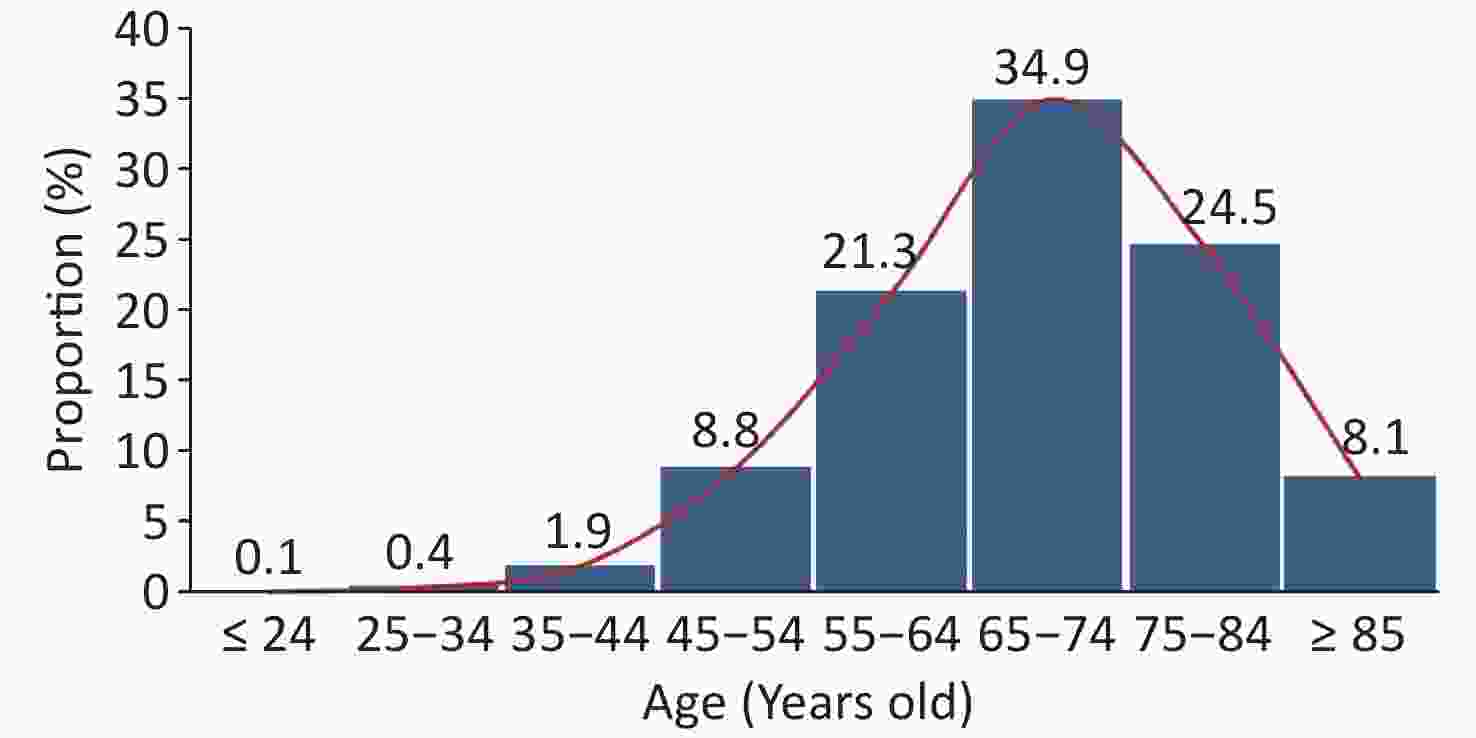
The average age of inpatients with cardiovascular diseases complicated by OSA was 56.9 ± 14.8 years, with 27.1% being female. The 55–64 age group accounted for the highest proportion (24.9%).
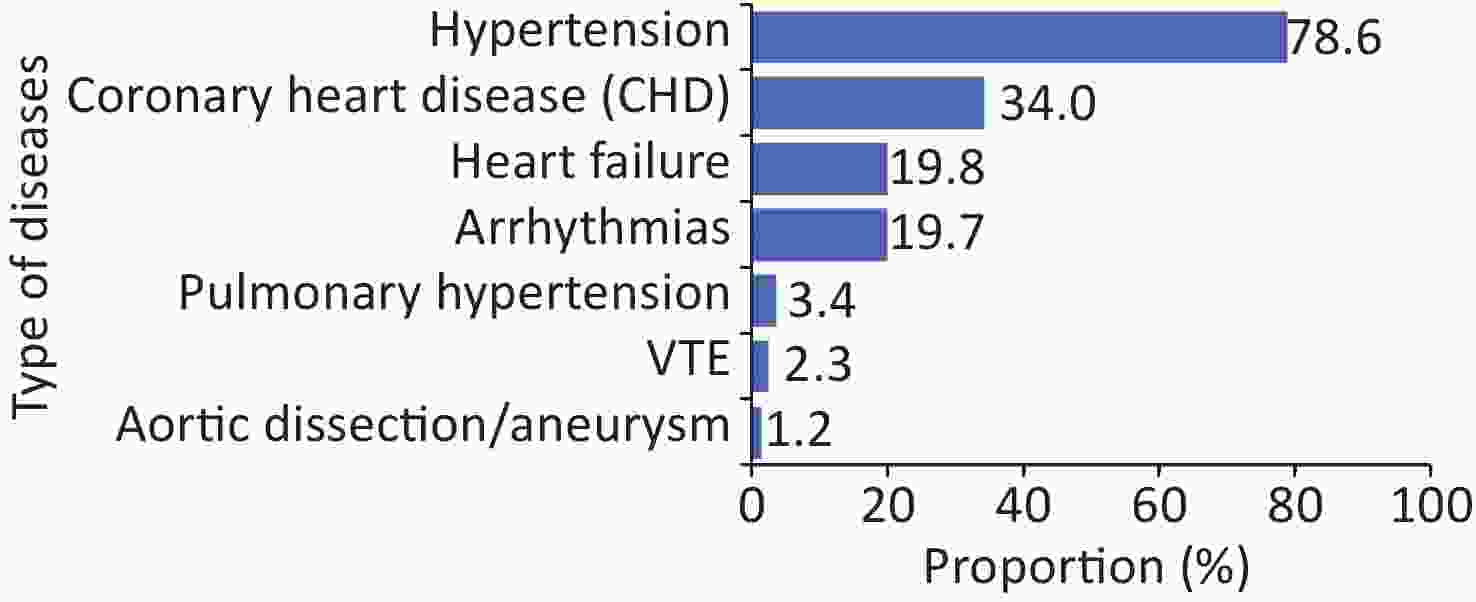
The top four comorbidities among inpatients with OSA were hypertension (78.6%), CHD (34.0%), HF (19.8%), and arrhythmias (19.7%) (Figure 46).
-
According to HQMS data, in 2023, 7,471 hospitals treated CVD inpatients with chronic kidney disease (CKD), 5,951 treated those with acute kidney injury (AKI), 4,063 provided hemodialysis, 1,840 offered peritoneal dialysis, and 3,388 administered continuous renal replacement therapy (CRRT). These figures accounted for 92.0%, 73.3%, 50.0%, 22.7%, and 41.7%, respectively, of the 8,119 hospitals treating CVD. These proportions were lower in the secondary hospitals than in the tertiary hospitals.
Among the 82.740 million hospitalized patients with CVD in 2023, 9.866 million had CKD, 492,000 had AKI, 1.134 million received hemodialysis, 221,000 received peritoneal dialysis, and 280,000 received CRRT. The prevalence of these conditions among hospitalized patients are shown in Figure 47.
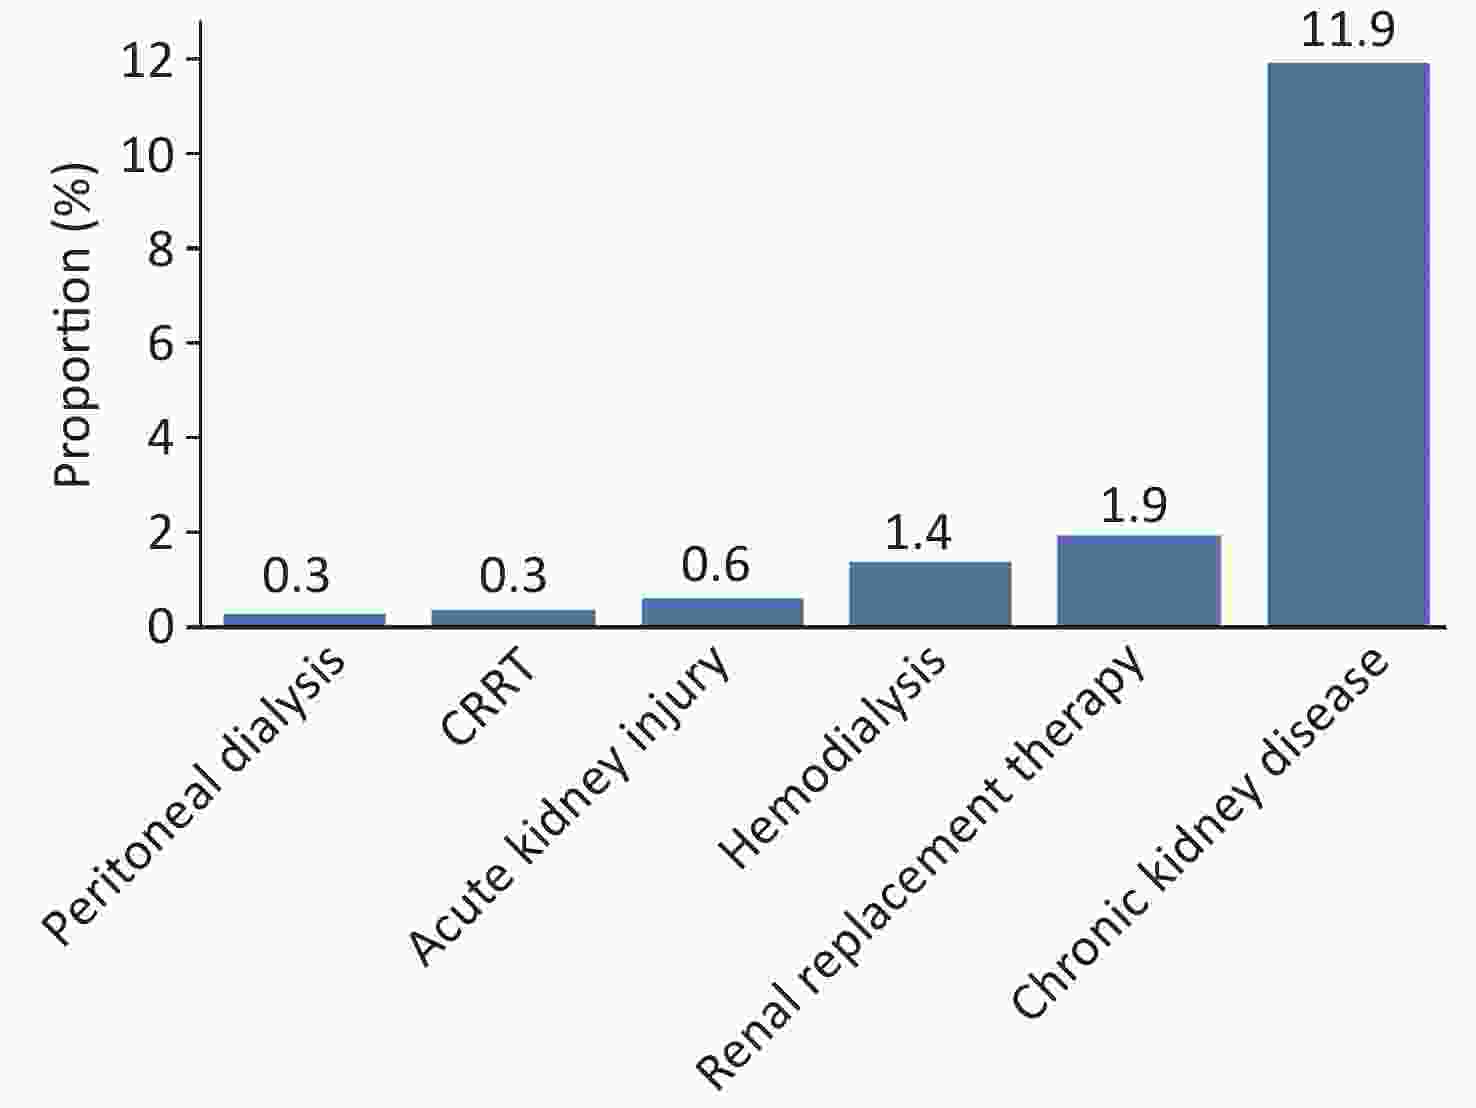
Figure 47. Proportion of kidney diseases and replacement therapy among hospitalized patients with CVD in 2023.
Among hospitalized patients with CVD, the prevalence of CKD was higher in males (13.3%) than in females (10.3%), and the prevalence of AKI was higher in males (0.7%) than in females (0.5%).
Inpatients with CVD and CKD had higher in-hospital mortality (2.4% vs. 0.7%), non-recovery to discharge (10.3% vs. 5.8%), and AKI incidence (1.4% vs. 0.6%) rates than those without CKD.
Inpatients with CVD and AKI had higher mortality (14.7% vs. 0.8%), non-recovery discharge (35.0% vs. 6.2%), and renal replacement therapy (17.2% vs. 2.1%) rates than those without AKI.
-
In 2023, 7,640 hospitals treated inpatients with stroke (with cerebral infarction, intracerebral hemorrhage, or subarachnoid hemorrhage as diagnoses), including 2,466 tertiary and 5,174 secondary hospitals.
A total of 16.638 million inpatients with stroke were treated, with cerebral infarction accounting for 94.0% of the cases. Stroke was recorded as the primary diagnosis in 49.9% of cases. The average age was 68.9 ± 11.7 years. For specific stroke types, the average ages were 69.3 ± 11.3 years for cerebral infarction, 62.9 ± 14.3 years for intracerebral hemorrhage, and 60.9 ± 15.4 years for subarachnoid hemorrhage. The age distribution of inpatients with stroke is shown in Figure 48. Males accounted for the majority of cases (55.0 %) of cerebral infarctions and 63.5% of intracerebral hemorrhages, while females accounted for a slightly higher proportion of subarachnoid hemorrhages (51.2%).
The most common comorbidities among inpatients with stroke were hypertension (66.5%), CHD (30.3%), and diabetes (27.7%). The in-hospital mortality and non-recovery discharge rates for stroke were 1.2% and 8.0 %, respectively.
In 2023, 6,994 hospitals treated cardiac inpatients with cerebrovascular disease, accounting for 90.1% of hospitals providing cardiac care. Among them, 2,338 were tertiary hospitals and 4,656 were secondary hospitals.
Among 24.567 million inpatients with CHD, 21.1% had cerebrovascular disease. Among the 4.803 million inpatients with atrial fibrillation/flutter, 21.4% had cerebrovascular disease. Among 1.930 million patients who underwent PCI, 6.5% had cerebrovascular disease. Among the 74,000 patients who underwent CABG, 10.7% had cerebrovascular disease.
Cardiac inpatients with cerebrovascular disease had higher in-hospital mortality and non-recovery discharge rates than those without cerebrovascular disease.
-
High-quality basic research on CVD in mainland China began to emerge in 2005. In recent years, an increasing number of influential papers have been published in high-impact journals, such as Nature, Cell, Circulation, European Heart Journal, Circulation Research, Signal Transduction and Targeted Therapy. A review of publications in Nature and its subjournals, Cell and its subjournals, Circulation, European Heart Journal, Circulation Research, Nature Communications, Advanced Science, and Cardiovascular Research revealed rapid progress in both the quality and quantity of basic cardiovascular research in China.
Between 2023 and 2024, 206 basic research papers with corresponding lead authors from mainland China (including Hong Kong and Macau) explored cardiac and vascular anatomy, development, and function/pathogenesis. This represents a significant increase compared with previous years. The research areas included myocardial infarction, HF, ischemia-reperfusion injury, arrhythmias, cardiomyopathies (hypertrophic, dilated, diabetic, and viral myocarditis), cardiac remodeling (hypertrophy and fibrosis), aneurysms, atherosclerosis, hypertension, vascular aging, and vascular remodeling. Cardiac protection and regeneration, and gene therapy are the most popular research topics. Geographically, most high-quality publications originate from economically developed regions such as East China (Shanghai, Zhejiang, Jiangsu), North China (Beijing, Tianjin), and South China (Guangdong), highlighting the link between cardiovascular research and economic development.
-
In recent years, CVD research in China has flourished, with both quantity and quality improvements. China now ranks second globally in terms of the number of CVD-related publications, trailing only the United States (the U.S.). Since 2018, the growth rate of Chinese publications has surpassed that of the U.S. The most common subspecialties were CHD, hypertension, arrhythmia, and HF. The number of publications on CHD and hypertension has exceeded that of the U.S.
In 2023, 20 high-impact clinical research papers covering CHD, hypertension, arrhythmias, HF, congenital heart disease, cardiomyopathies, and CVD risk factors were published. Hot topics included CHD, hypertension, exploration, and interventions for CVD risk factors.
-
Between July 20, 2023, and July 31, 2024, the National Medical Products Administration (NMPA) approved 74 medical devices for the special review procedure for innovative medical devices, including 36 cardiovascular products (48.6%). Notably, 72 were original domestically developed innovations, accounting for 97.3% of the total, demonstrating the dominant role of cardiovascular innovation in China’s medical device sector.
During the same period, the NMPA approved 11 innovative medical devices as a priority review procedure, including one cardiovascular product. No Class III cardiovascular devices received clinical trial approval during this period, reflecting the lowered barriers to clinical trials for most cardiovascular devices. The NMPA approved 206 Class III cardiovascular device registrations, including 178 domestic products, two of which had entered a special review procedure for innovative medical devices.
Regionally, the Yangtze River Delta, Pearl River Delta, and Beijing remain the core hubs for cardiovascular device innovation, accounting for nearly 80% of national approvals, with the Yangtze River Delta alone contributing nearly 50%.
-
In 2022, the total number of hospital discharges for cardiovascular and cerebrovascular diseases in China was 26.3387 million person-time, accounting for 14.73% of all hospital discharges. Cardiovascular disease accounted for 54.1% (14.2520 million person-time), and cerebrovascular disease accounted for 45.9% (12.0867 million person-time) (Figure 49).
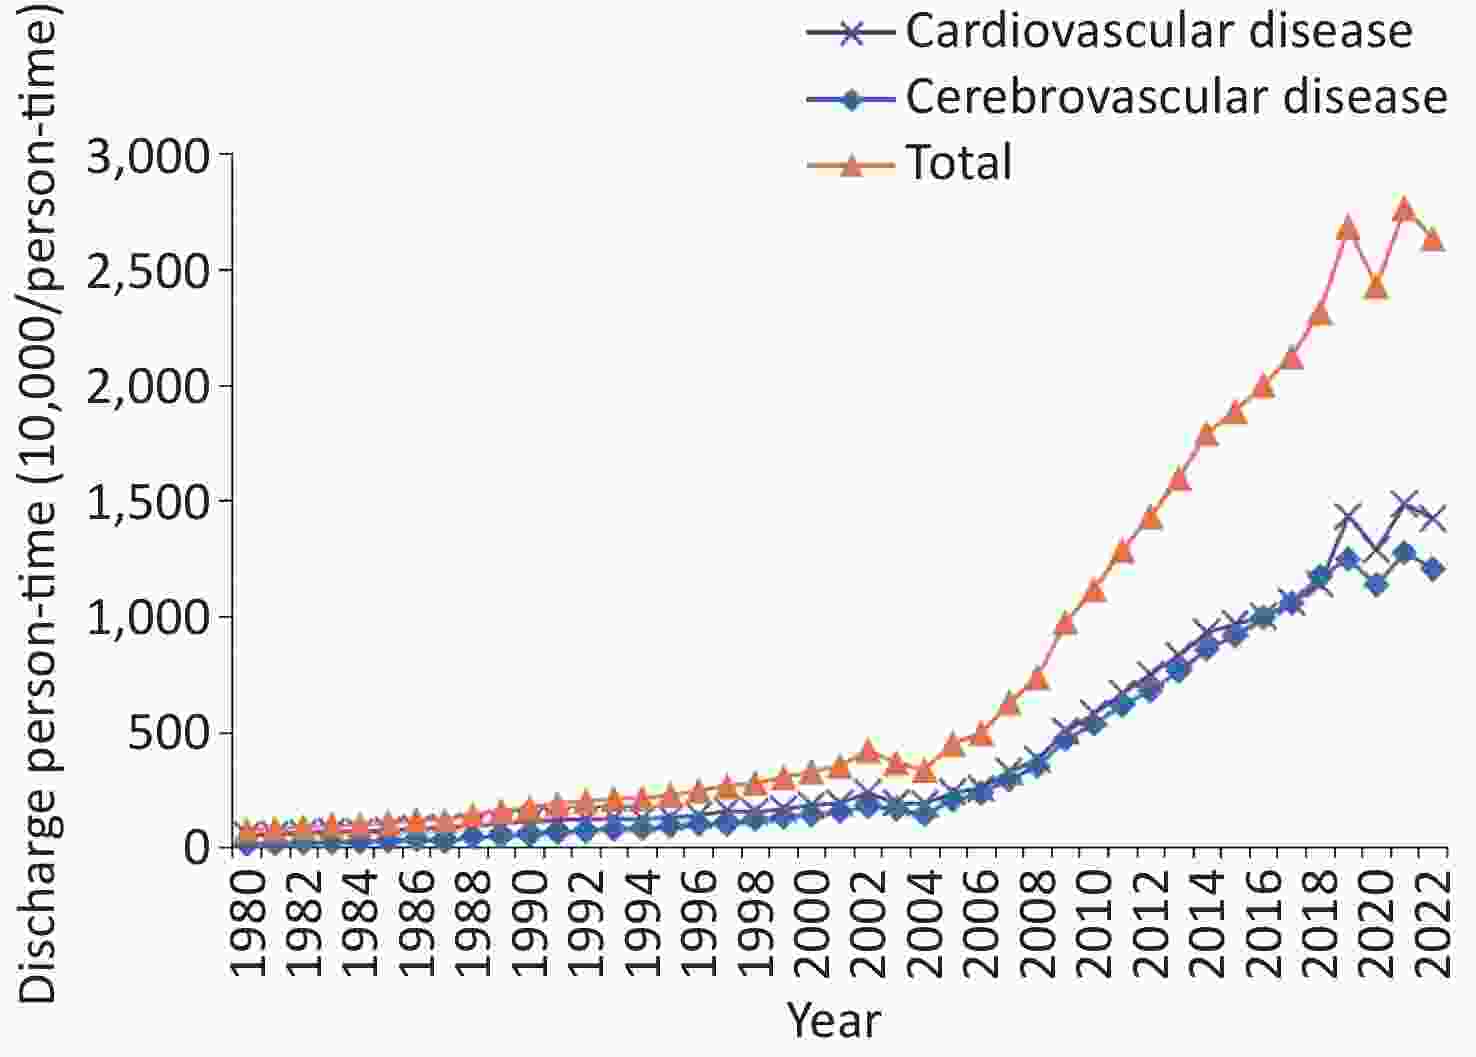
Figure 49. Number of discharged patients with cardiovascular and cerebrovascular diseases in China between 1980 and 2022. Cardiovascular and cerebrovascular diseases include ischemic heart disease (angina, acute myocardial infarction and others), chronic rheumatic heart disease, acute rheumatic fever, pulmonary embolism, arrhythmia, heart failure, hypertension (including hypertensive heart disease and kidney disease) and cerebrovascular diseases (cerebral hemorrhage and cerebral infarction). Among them, before 2002, Ischemic heart disease is called coronary heart disease in the annual health statistics report. Chronic rheumatic heart disease was not included in 2021.
Among the cardiovascular and cerebrovascular discharges, IHD (8.7640 million, including 4.1765 million person-time for angina and 1.4597 million person-time for AMI) and cerebral infarction (8.2530 million person-time) were the most common, accounting for 33.27% and 31.33%, respectively. Other conditions included hypertension (1.7407 million person-times, including 237,000 person-times for hypertensive heart and kidney disease), HF (2.5112 million person-times), intracerebral hemorrhage (1.3850 million person-times), arrhythmias (985,400 person-times), PE (133,800 person-times), chronic rheumatic heart disease (106,800 person-times), and acute rheumatic fever (10,100 person-time) (Figure 50).
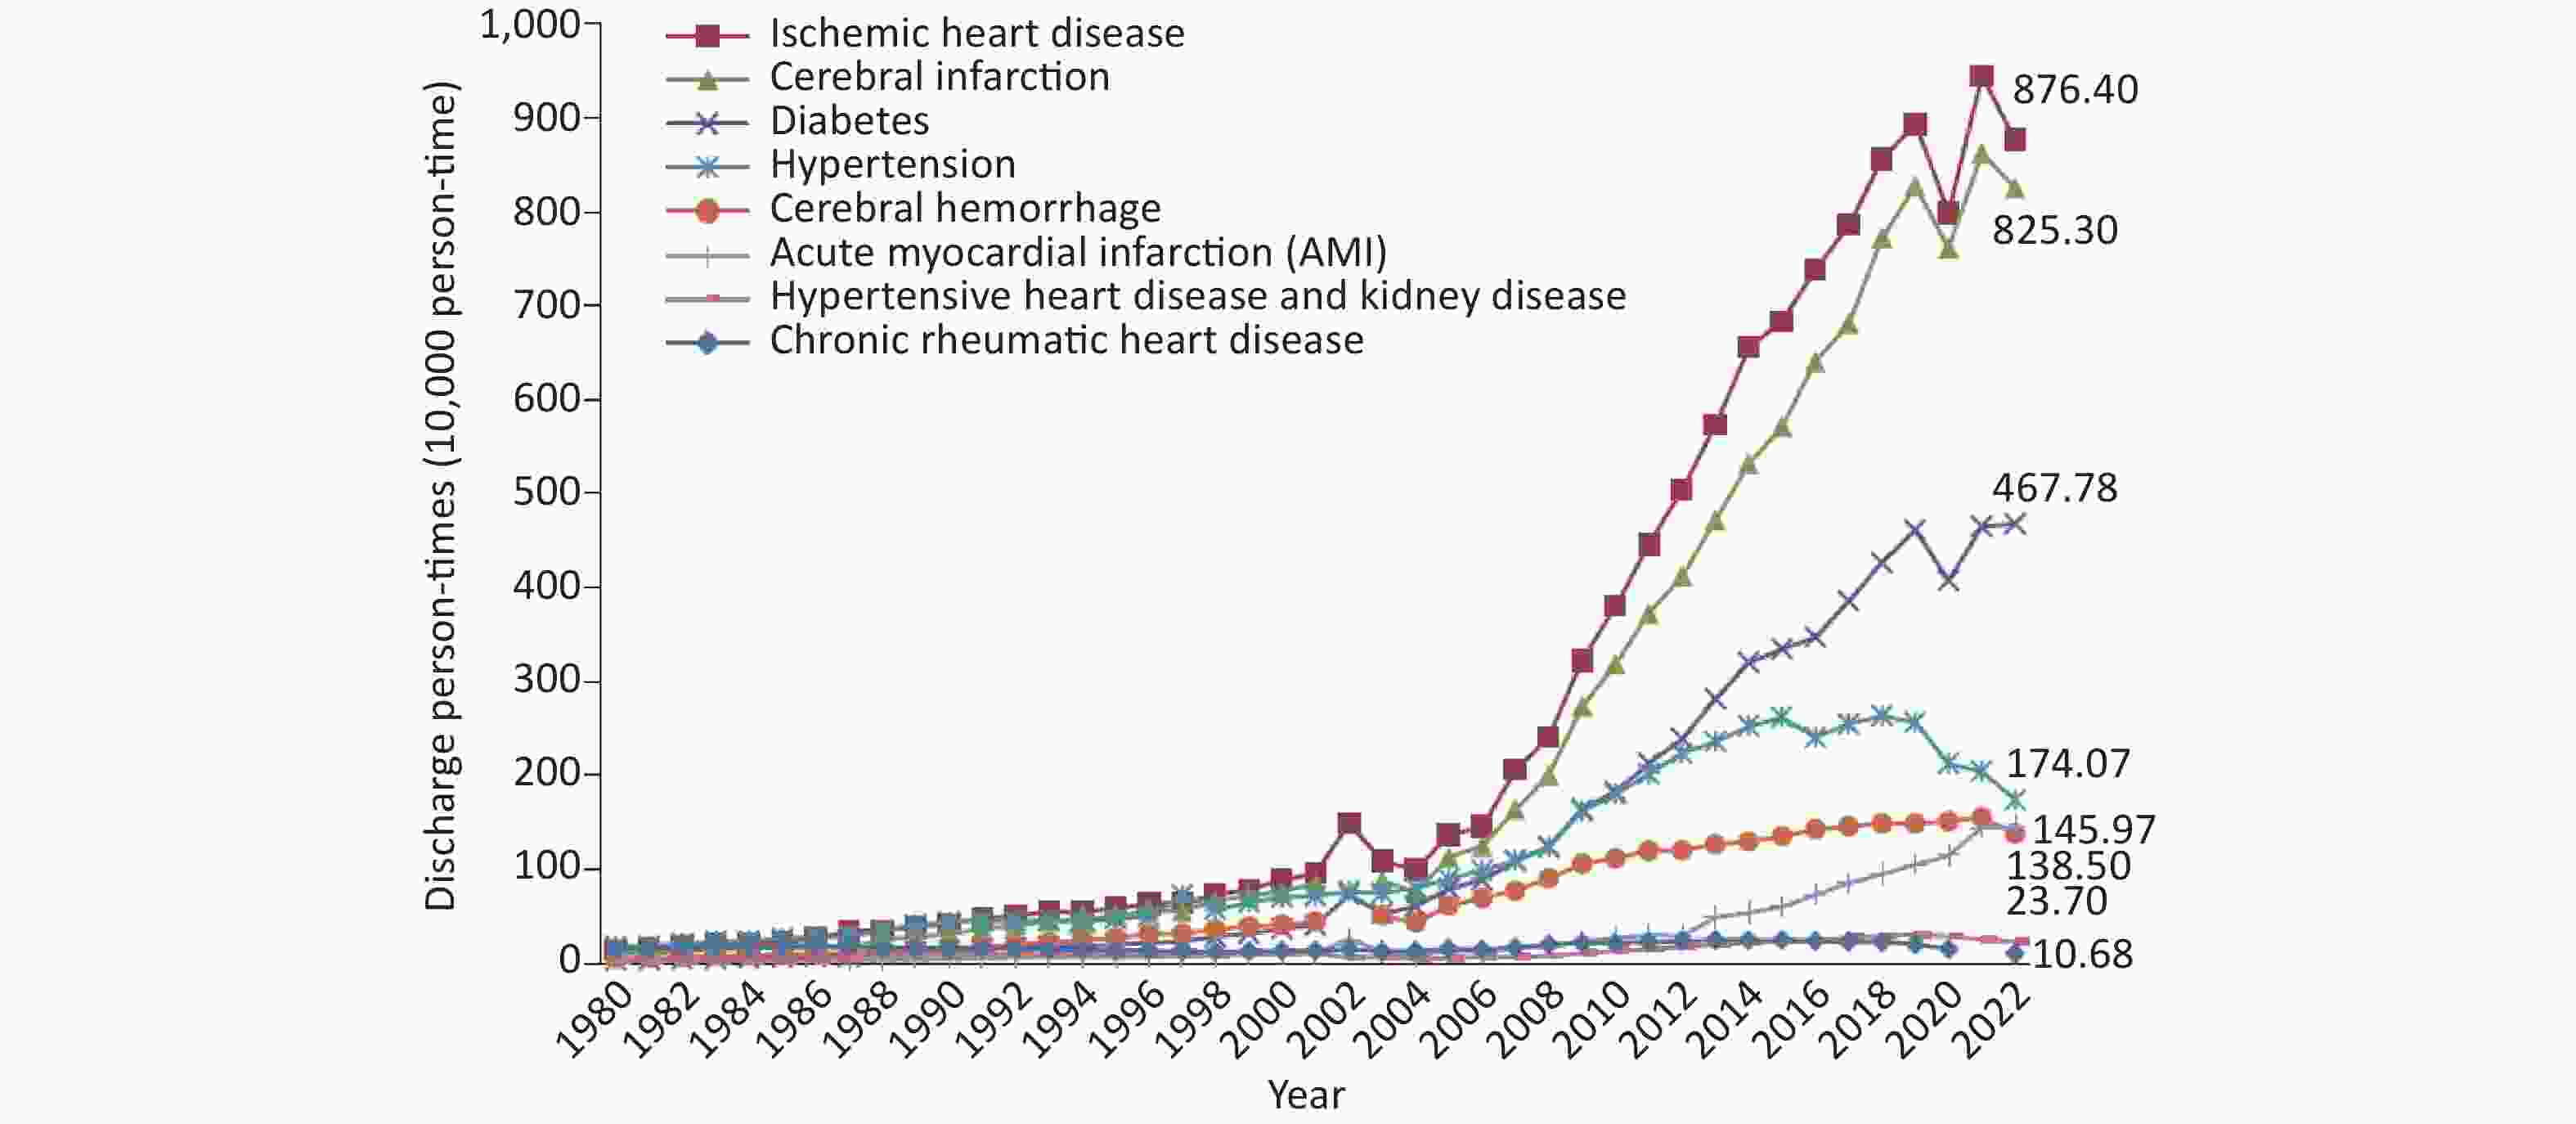
Figure 50. Number of discharged patients with cardiovascular and cerebrovascular diseases and diabetes in China between 1980 and 2022. Chronic rheumatic heart disease was not reported in 2021.
From 1980 to 2022, the average annual growth rates for hospital discharges were as follows: diabetes (12.34%), cerebral infarction (11.00%), IHD (10.16%), intracerebral hemorrhage (7.99%), hypertension (5.54%), hypertensive heart and kidney disease (4.84%), and chronic rheumatic heart disease (–0.87%). Between 1987 and 2022, AMI discharges grew at an average annual rate of 10.98%. Between 2018 and 2022, HF discharges grew at 21.41%, angina at 14.33%, PE at 9.07%, arrhythmias at –1.90%, and acute rheumatic fever at –13.05%.
According to the 2023 HQMS data, CHD accounted for the highest discharge and total hospitalization costs among inpatients with CVD as the primary diagnosis. Among patients with CHD, unstable angina was the most common primary diagnosis (40.0%, 3.344 million person-time), followed by unclassified CHD (27.0%, 2.258 million person-time), stable angina (17.1%, 1.430 million person-time), STEMI (6.8%, 571,000 person-time), NSTEMI (6.3%, 526,000 person-time), AMI (1.5%, 125,000 person-time), and acute coronary syndrome ACS (1.3%, 114,000 person-time).
Among total hospitalization costs for inpatients with CHD in 2023, unstable angina accounted for the largest share (40.8%, 48.64 billion CNY), followed by unclassified CHD (18.8%, 17.54223 billion CNY), STEMI (13.3%, 15.83 billion CNY), stable angina (12.3%, 14.68 billion CNY), NSTEMI (10.6%, 12.63 billion CNY), AMI (2.5%, 3.01 billion CNY), and ACS (1.7%, 2.00 billion CNY) (Figure 51).
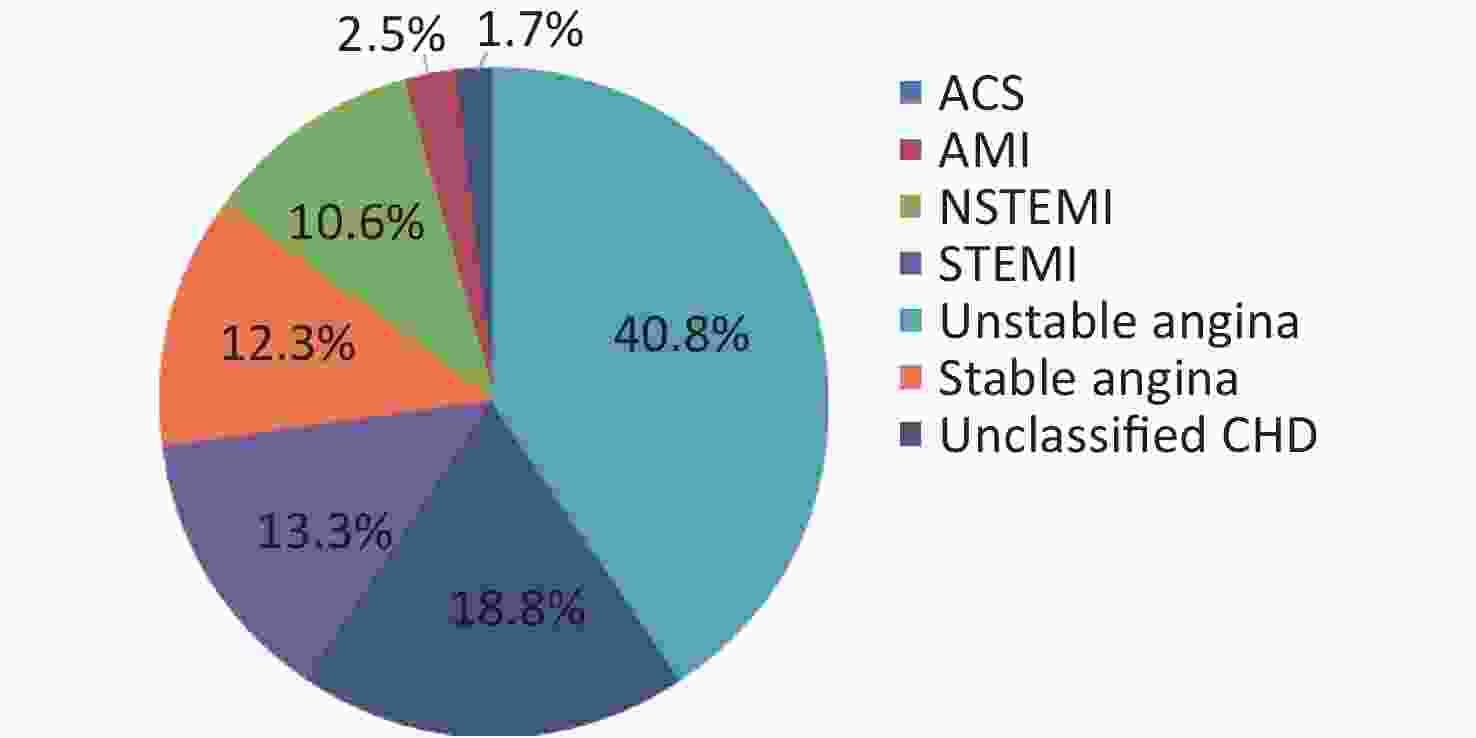
Figure 51. Disease composition of the total hospitalization cost for coronary heart disease in 2023. ACS, acute coronary syndrome; AMI, acute myocardial infarction; NSTEMI, non-ST-segment elevation myocardial infarction; STEMI, ST-segment elevation myocardial infarction.
According to HQMS data from 2023, the average total hospitalization cost per CVD inpatient was 15,944.0 CNY, with material costs accounting for the highest proportion (35.7%, 5,689.8 CNY), followed by diagnostic fees (21.5%, 3,421.5 CNY), medication costs (15.3%, 2,431.7 CNY), and treatment fees (13.7%, 2,179.2 CNY). The surgical treatment costs (1,705.6 CNY) was significantly higher than the nonsurgical cost (570.4 CNY). Western medicine costs (2,100.9 CNY) exceeded traditional Chinese medicine costs (330.9 CNY). Surgical materials accounted for the largest share of material costs (4,229.4 CNY).
Valvular heart disease had the highest average total hospitalization cost (71,274.3 CNY), followed by arrhythmias (30,067.6 CNY), CHD (14,234.6 CNY), HF (9,724.5 CNY), and hypertension (6,239.8 CNY). Material costs accounted for a higher proportion of total costs for CHD, arrhythmias, and valvular heart disease, whereas diagnostic fees were dominant for HF and hypertension.
Among inpatients with CHD, those with STEMI had the highest average total hospitalization, diagnostic, treatment, and material costs, whereas those with AMI had the highest medication costs. Surgical treatment, Western medicine, and surgical material costs were consistently higher across all CHD and their subgroups.
In 2023, the average length of stay for inpatients with CVD was 8.3 days. Valvular heart disease was associated with the longest stay (13.2 days), followed by HF (10.4 days), hypertension (8.9 days), CHD (7.8 days), NSTEMI (8.6 days), STEMI (8.3 days), stable angina (7.1 days), unstable angina (6.6 days), and arrhythmias (6.4 days).
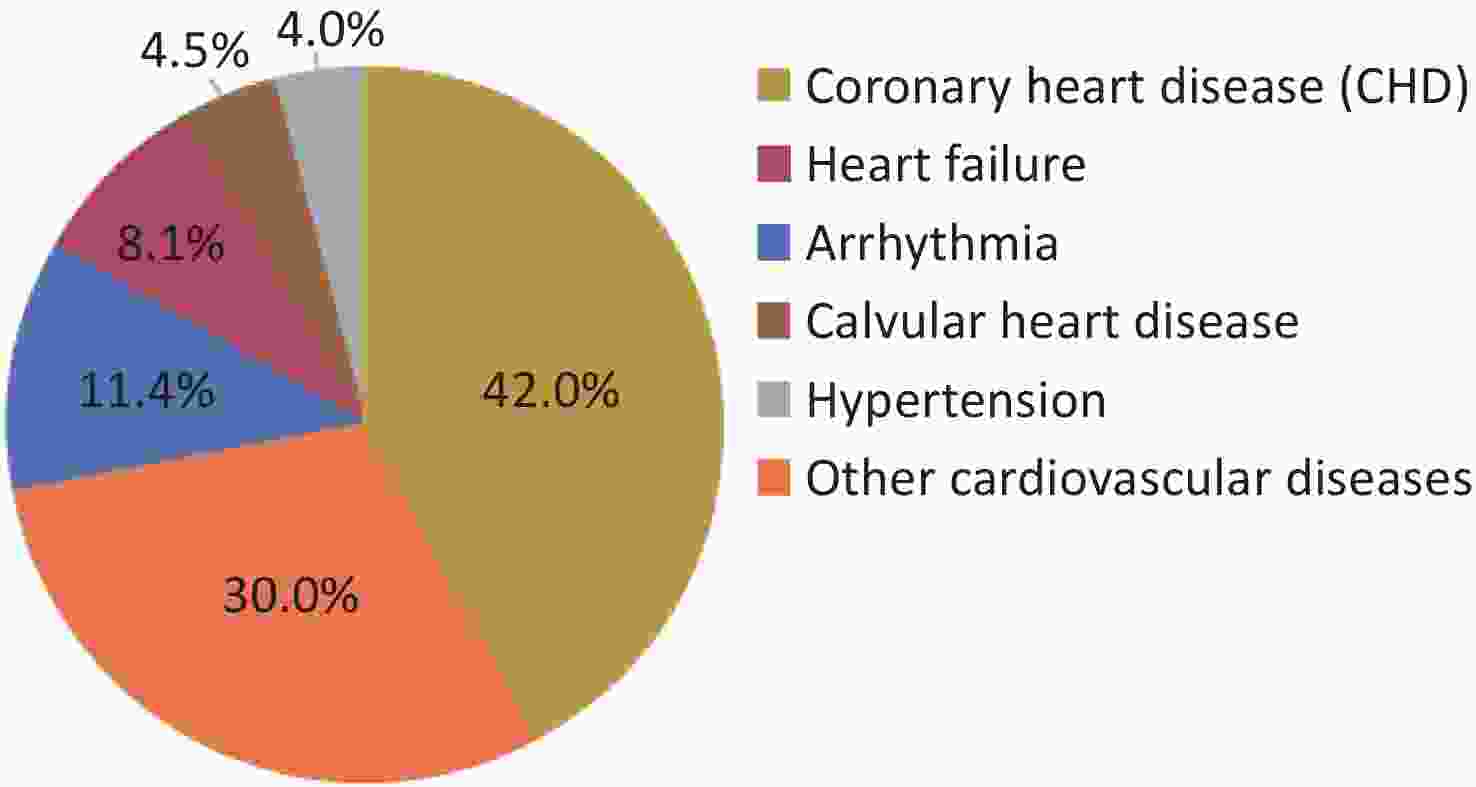
The total hospitalization cost for inpatients with CVD in 2023 amounted to 283.43 billion CNY. CHD accounted for the largest share (42.0%, 119.11 billion CNY), followed by arrhythmias (11.4%, 32.39 billion CNY), HF (8.1%, 22.98 billion CNY), valvular heart disease (4.5%, 12.84 billion CNY), hypertension (4.0%, 11.35 billion CNY), aortic and peripheral arterial disease (8.9%, 25.29 billion CNY), congenital heart disease (2.7%, 7.70 billion CNY), pulmonary vascular disease (2.6%, 7.39 billion CNY), and cardiomyopathies (1.1%, 3.20 billion CNY) (Figure 52).
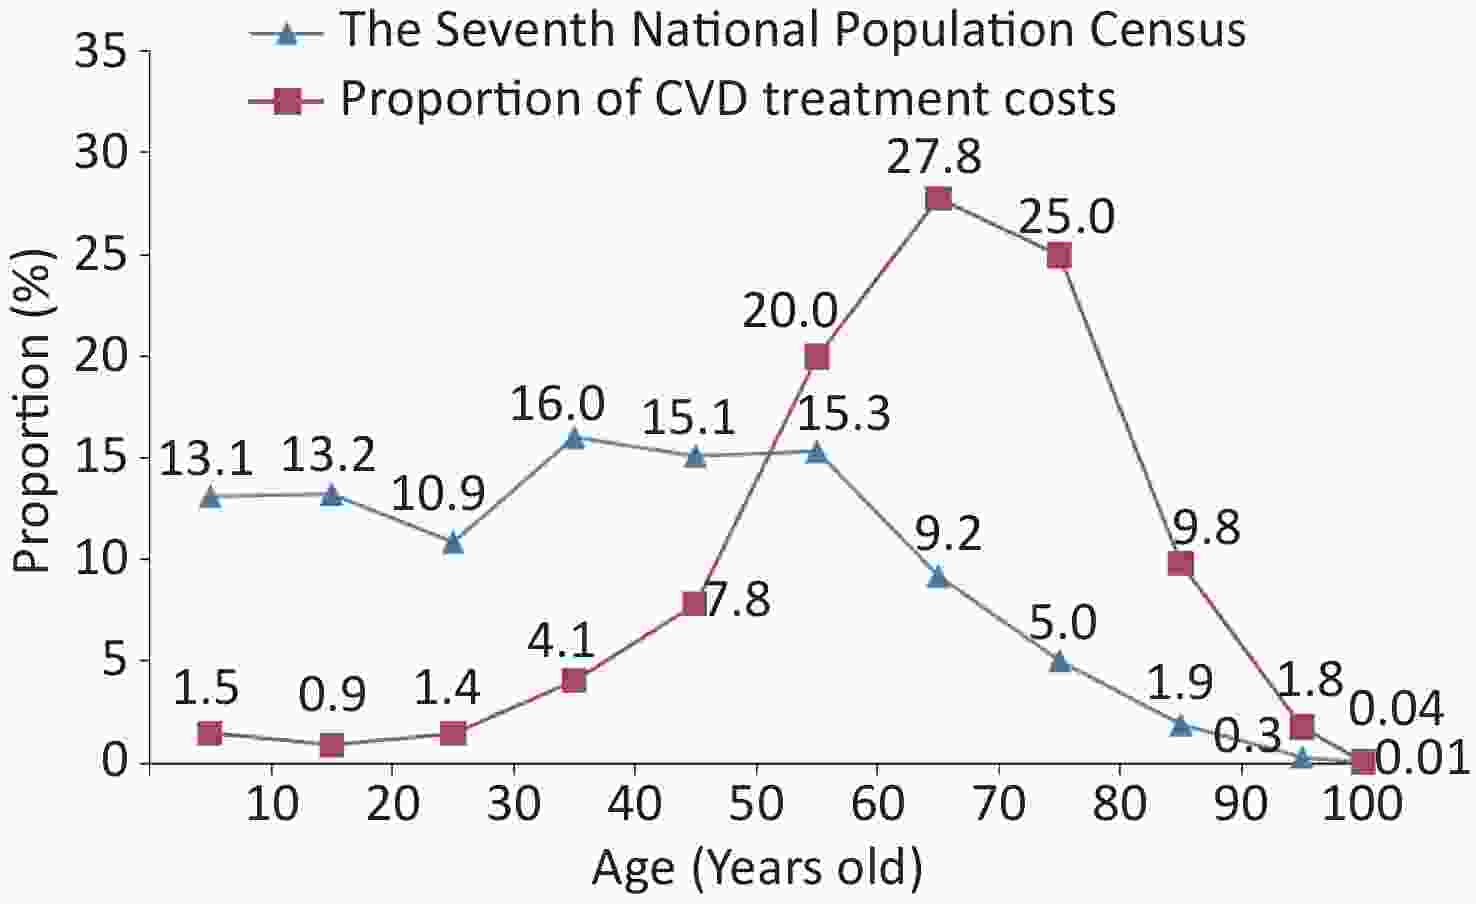
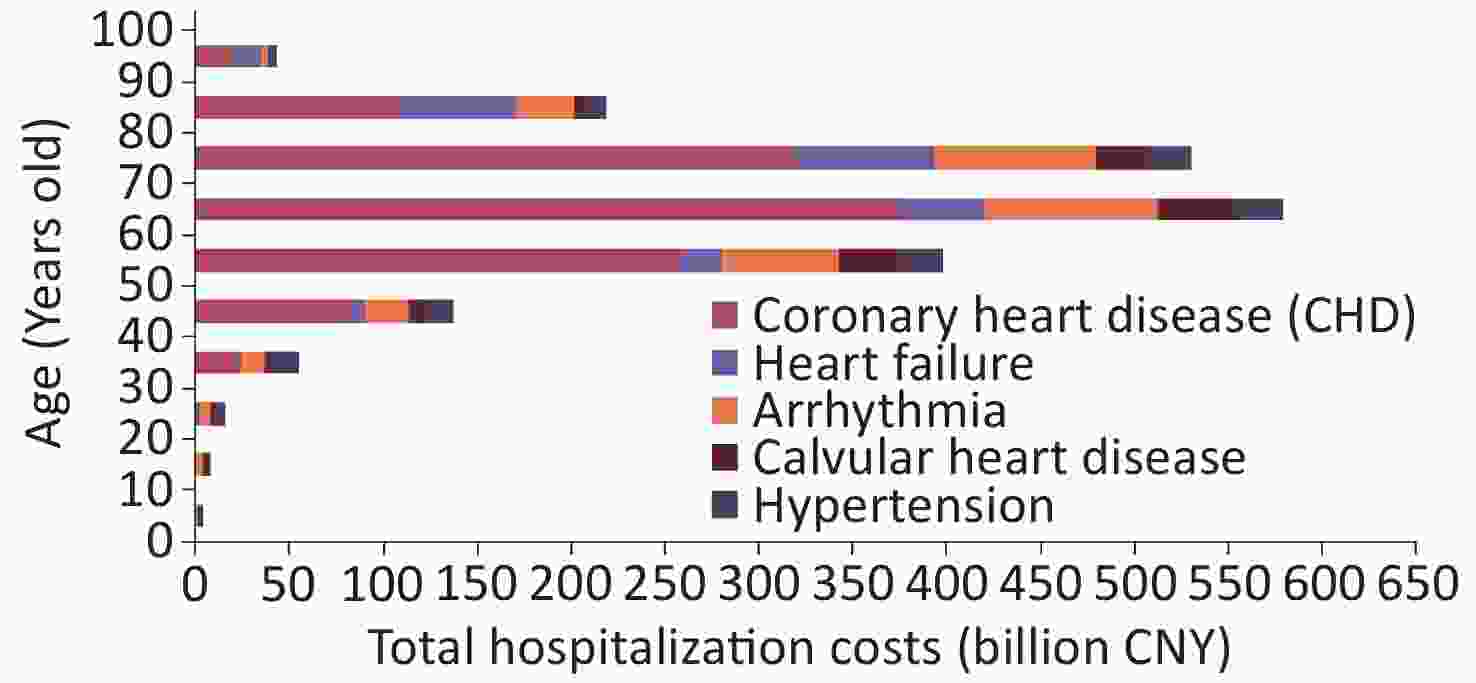
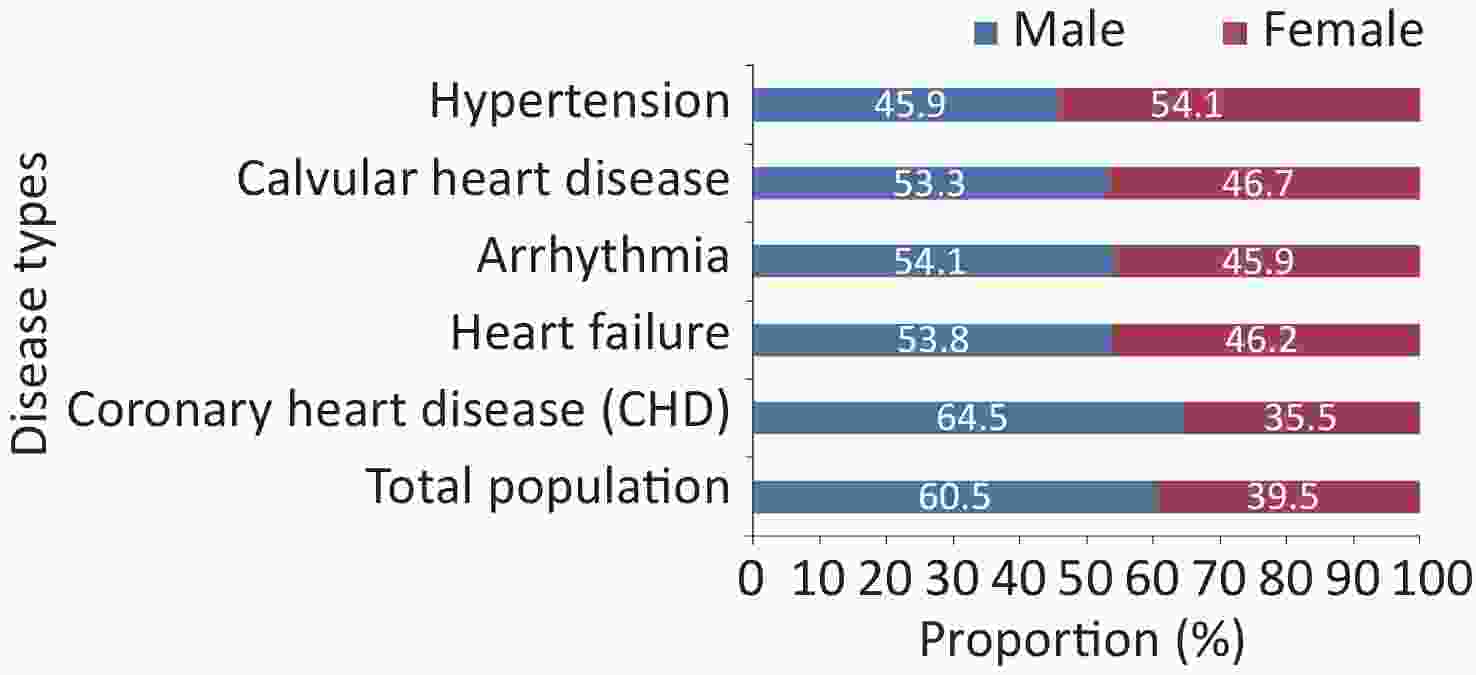
In 2023, 64.3% of CVD treatment costs were incurred by individuals aged 60 years and above. Starting at the age of 50 years, the proportion of CVD treatment costs exceeded the proportion of the population according to the age composition ratio from the Seventh National Population Census. The disparity peaked in the 70–79 age group, which accounted for 5.0% of the population but 25.0% of the CVD treatment costs (Figure 53). Among patients aged 30 and above, CHD accounted for the largest share of treatment costs (60.7%), whereas arrhythmias were the primary cost driver among those under 30 (Figure 54). Males accounted for a higher proportion of CVD treatment costs than females (60.5%), with greater expenses for CHD, HF, arrhythmias, and valvular heart disease observed in males (Figure 55).
-
A study on the return on investment for preventing and treating overweight and obesity in Chinese children and adolescents[38] used a deterministic Markov cohort model to predict the impact of evidence-based interventions on morbidity and mortality between 2025 and 2092. Five interventions were modeled: a 20% tax on sugar-sweetened beverages, restrictions on marketing unhealthy foods to children, mobile phone messaging to promote breastfeeding knowledge, school-based obesity interventions, and physician-provided nutritional counseling. Without intervention, China would face 3.3 billion disability adjusted life years (DALYs) and 218 trillion CNY in losses over this period, averaging 2.5 million CNY per affected child. Implementing all five interventions could avert 179.4 million DALYs and generate 13.1 trillion CNY of economic benefits. Fiscal and regulatory policies, such as sugar-sweetened beverage taxes and marketing restrictions, offer the highest health and economic returns, with benefits emerging within a decade.
Another study used a decision-analytic simulation model to evaluate the cost-effectiveness of pharmacological treatment for Chinese adults with systolic/diastolic blood pressure (SBP/DBP) of 130–139/80–89 mmHg and high cardiovascular risk over 10 years and lifetime horizons[39]. Over 10 years, antihypertensive drug therapy yielded 0.034 incremental quality-adjusted life years (QALYs) at an incremental cost-effectiveness ratio (ICER) of 13,321.29 USD/QALY, well below the cost-effectiveness threshold of one-time per capita GDP (21,318 USD). Lifetime treatment was highly cost-effective across all age groups, with the greatest benefits for the young and middle-aged populations.
doi: 10.3967/bes2025.099
Interpretation of Annual Report on Cardiovascular Health and Diseases in China 2024
-
Abstract: Cardiovascular diseases (CVD) and their risk factors have an increasingly considerable impact on public health, with their incidence rates continuing to rise globally. This article interprets the essentials of the newly published Annual Report on Cardiovascular Health and Diseases in China (2024), aiming to offer scientific evidence for CVD prevention, treatment, and the formulation of relevant policies.
-
Key words:
- Cardiovascular diseases /
- Epidemiology /
- Burden of disease /
- Risk factors /
- Prevalence /
- Mortality /
- Rehabilitation /
- Basic research /
- Medical device development /
- Expense
-
Figure 49. Number of discharged patients with cardiovascular and cerebrovascular diseases in China between 1980 and 2022. Cardiovascular and cerebrovascular diseases include ischemic heart disease (angina, acute myocardial infarction and others), chronic rheumatic heart disease, acute rheumatic fever, pulmonary embolism, arrhythmia, heart failure, hypertension (including hypertensive heart disease and kidney disease) and cerebrovascular diseases (cerebral hemorrhage and cerebral infarction). Among them, before 2002, Ischemic heart disease is called coronary heart disease in the annual health statistics report. Chronic rheumatic heart disease was not included in 2021.
-
[1] National Center for Cardiovascular Diseases. Annual report on cardiovascular health and diseases in China (2024). Peking Union Medical College Press. 2025. (In Chinese) [2] Sheng BH, Zhang XY, Yang HX, et al. Change trends and prediction of the burden of cardiovascular and chronic respiratory diseases in Chinese residents from 1990 to 2019. Chin J Public Health, 2024; 40, 477−83. (In Chinese) [3] National Health Commission of the People’s Republic of China. China health statistics yearbook 2022. Peking Union Medical College Press. 2022. (In Chinese) [4] Wang W, Liu YN, Liu JM, et al. Mortality and years of life lost of cardiovascular diseases in China, 2005-2020: empirical evidence from national mortality surveillance system. Int J Cardiol, 2021; 340, 105−12. doi: 10.1016/j.ijcard.2021.08.034 [5] Diao FC. After nearly 20 years of tobacco control, when will the inflection point of declining tobacco production and sales in China arrive?. https://m.thepaper.cn/newsDetail_forward_28541881. [2024-08-30]. (In Chinese) [6] Chinese Center for Disease Control and Prevention. Data chart of smoking rates among people aged 15 and above in various regions in 2020. https://www.chinacdc.cn/jksj/jksj04/202407/t20240731_287942.html. [2024-08-30]. (In Chinese) [7] Zeng XY, Liu SW, Xiao L. Cigarette use and secondhand smoke exposure among secondary school students—China, 2023. China CDC Wkly, 2024; 6, 509−15. doi: 10.46234/ccdcw2024.098 [8] National Disease Control and Prevention Administration. Report on Chinese residents’ chronic diseases and nutrition 2020. People's Medical Publishing House. 2022. (In Chinese) [9] Zhao LY, Ding GQ, Zhao WH. Report on nutrition and health surveillance of Chinese residents 2015 - 2017. People's Medical Publishing House. 2022. (In Chinese) [10] Yuan XR, Wei YL, Jiang HR, et al. Longitudinal relationship between the percentage of energy intake from macronutrients and overweight/obesity among Chinese adults from 1991 to 2018. Nutrients, 2024; 16, 666. doi: 10.3390/nu16050666 [11] Jia XF, Su C, He YN, et al. Macronutrient intake status and food sources in adult residents from 10 provinces (autonomous regions) of China in 2022-2023. J Hyg Res, 2024; 53, 862−9. (In Chinese) [12] Zhao WH, Li SJ, Yang ZY, et al. Nutrition and health atlas of Chinese children. SinoMaps Press. 2024. (In Chinese) [13] Wang H, Zhang YF, Wu DM, et al. Spatial distribution and related factors of physical activity, screen time and sleep time compliance rates of Chinese children from 3 to 6 years old. China Sport Sci, 2023; 43, 26−33. (In Chinese) [14] Chen PJ. Report on physical activity and fitness in China, the youth study 2016. Science Press. 2016. (In Chinese) [15] Fan X, Cao ZB. Physical activity among Chinese school-aged children: national prevalence estimates from the 2016 physical activity and fitness in China-the Youth Study. J Sport Health Sci, 2017; 6, 388−94. doi: 10.1016/j.jshs.2017.09.006 [16] Zhu Z, Tang Y, Zhuang J, et al. Physical activity, screen viewing time, and overweight/obesity among Chinese children and adolescents: an update from the 2017 physical activity and fitness in China-the youth study. BMC Public Health, 2019; 19, 197. doi: 10.1186/s12889-019-6515-9 [17] Guo MM, Koh KT, Wang XZ. Trends of physical activity and recreational screen time among Chinese children and adolescents: a national study from 2017 to 2019. BMC Public Health, 2024; 24, 1305. doi: 10.1186/s12889-024-18822-1 [18] Xin F, Zhu Z, Chen ST, et al. Prevalence and correlates of meeting the muscle-strengthening exercise recommendations among Chinese children and adolescents: results from 2019 Physical Activity and Fitness in China-The Youth Study. J Sport Health Sci, 2022; 11, 358−66. doi: 10.1016/j.jshs.2021.09.010 [19] Song Y, Luo DM, Hu PJ, et al. Trends of prevalence of excellent health status and physical fitness among Chinese Han students aged 13 to 18 years from 1985 to 2014. J Peking Univ (Health Sci), 2020; 52, 317−22. (In Chinese) [20] Dong YH, Chen L, Liu JY, et al. Epidemiology and prediction of overweight and obesity among children and adolescents aged 7-18 years in China from 1985 to 2019. Chin J Prev Med, 2023; 57, 461−9. (In Chinese) [21] Wang LM, Zhou B, Zhao ZP, et al. Body-mass index and obesity in urban and rural China: findings from consecutive nationally representative surveys during 2004-18. Lancet, 2021; 398, 53−63. doi: 10.1016/S0140-6736(21)00798-4 [22] Luo YM, Xia F, Yu XX, et al. Long-term trends and regional variations of hypertension incidence in China: a prospective cohort study from the China Health and Nutrition Survey, 1991-2015. BMJ Open, 2021; 11, e042053. doi: 10.1136/bmjopen-2020-042053 [23] Zhang M, Wu J, Zhang X, et al. Prevalence and control of hypertension in adults in China, 2018. Chin J Epidemiol, 2021; 42, 1780−9. (In Chinese) [24] Zhao WH, Zhang J, You Y, et al. Epidemiologic characteristics of dyslipidemia in people aged 18 years and over in China. Chin J Prev Med, 2005; 39, 306−10. (In Chinese) [25] Pan L, Yang ZH, Wu Y, et al. The prevalence, awareness, treatment and control of dyslipidemia among adults in China. Atherosclerosis, 2016; 248, 2−9. doi: 10.1016/j.atherosclerosis.2016.02.006 [26] Dai J, Min JQ, Yang YJ. A study on the epidemic characteristics of dyslipidemia in adults of nine provinces of China. Chin J Cardiol, 2018; 46, 114−8. (In Chinese) [27] National Disease Control and Prevention Administration. Report on Chinese residents’ chronic diseases and nutrition 2015. People's Medical Publishing House. 2015. (In Chinese) [28] Li SN, Zhang LF, Wang X, et al. Status of dyslipidemia among adults aged 35 years and above in China. Chin Circ J, 2019; 34, 681−7. (In Chinese) [29] Lu Y, Zhang HB, Lu JP, et al. Prevalence of dyslipidemia and availability of lipid-lowering medications among primary health care settings in China. JAMA Netw Open, 2021; 4, e2127573. doi: 10.1001/jamanetworkopen.2021.27573 [30] Wang LM, Peng W, Zhao ZP, et al. Prevalence and treatment of diabetes in China, 2013-2018. JAMA, 2021; 326, 2498−506. doi: 10.1001/jama.2021.22208 [31] Yang C, Wang HB, Zhao XJ, et al. CKD in China: evolving spectrum and public health implications. Am J Kidney Dis, 2020; 76, 258−64. doi: 10.1053/j.ajkd.2019.05.032 [32] Zhang LX, Zhao MH, Zuo L, et al. China kidney disease network (CK-NET) 2016 annual data report. Kidney Int Suppl (2011), 2020; 10, e97−185. doi: 10.1016/j.kisu.2020.09.001 [33] Wang LM, Xu X, Zhang M, et al. Prevalence of chronic kidney disease in China: results from the Sixth China chronic disease and risk factor surveillance. JAMA Intern Med, 2023; 183, 298−310. doi: 10.1001/jamainternmed.2022.6817 [34] Zhang LX, Wang F, Wang L, et al. Prevalence of chronic kidney disease in China: a cross-sectional survey. Lancet, 2012; 379, 815−22. doi: 10.1016/S0140-6736(12)60033-6 [35] Chen P, Lam MI, Si TL, et al. The prevalence of poor sleep quality in the general population in China: a meta-analysis of epidemiological studies. Eur Arch Psychiatry Clin Neurosci, 2024; 274, 1−14. [36] Wang DF, Li HL, Zhang XT, et al. Changes and relevant factors in depressive and anxiety symptoms among Chinese adolescents after the “Double Reduction” policy: a repeated cross-sectional survey with a nested longitudinal subsample. J Affec Disord, 2024; 367, 88−95. doi: 10.1016/j.jad.2024.08.191 [37] Liang FC, Xiao QY, Huang KY, et al. The 17-y spatiotemporal trend of PM2.5 and its mortality burden in China. Proc Natl Acad Sci USA, 2020; 117, 25601−8. doi: 10.1073/pnas.1919641117 [38] Ma GS, Meyer CL, Jackson-Morris A, et al. The return on investment for the prevention and treatment of childhood and adolescent overweight and obesity in China: a modelling study. Lancet Reg Health West Pac, 2023; 43, 100977. [39] Li JT, Zhao D, Cai J, et al. Cost-effectiveness of treatment in adults with blood pressure of 130-139/80-89 mmHg and high cardiovascular risk in China: a modelling study. Lancet Reg Health West Pac, 2024; 42, 100962. -


 下载:
下载:




 Quick Links