-
To implement and realize a shift from hospitals to the community as the main locus of cardiovascular disease (CVD) prevention and control efforts, the National Center for Cardiovascular Diseases compiles the “Report on Cardiovascular Health and Diseases in China” by experts in related fields nationwide, every year since 2005. The materials selected for inclusion are representative, published, and high-quality research results such as large-sample cross-sectional and cohort population epidemiological investigations, randomized controlled clinical studies, large-sample registry studies, and typical cases of community prevention and control. After the collective discussion of the expert team of the compilation group, to ensure that the content is comprehensive, accurate, complete, and fully reflects representativeness and authority, this year’s report also incorporates the project materials undertaken by the National Center for Cardiovascular Diseases. These first-hand data have greatly enriched the report and reflect the status of CVD prevention and treatment in China in a timely and comprehensive manner.
Since 1990, hospital-based clinical technology service capabilities have been persistently enhanced, and the accessibility and quality index of medical care have made remarkable progress in China, ranking first among middle-income countries. The number of inpatients with CVD has increased rapidly in China. Numerous cardiovascular technologies are at or near the leading levels globally, hospital deaths from many diseases have declined, and substantial progress has been achieved in China in solving the problem of “treatment difficulty” of CVD. However, owing to accelerated population aging and the prevalence of CVD risk factors, CVD remains the leading cause of death among both urban and rural residents in China. In 2021, CVD accounted for 48.98% and 47.35% of the causes of death in rural and urban areas, respectively, with two out of every five deaths attributed to CVD.
Prevention remains the most economical and effective health strategy. China has entered a new transition phase from high-speed to high-quality development. Accordingly, CVD prevention and control should also shift from a previous emphasis on scale-oriented growth to focusing on strategic and key technological development to curb the growing incidence and mortality rates of CVD. The National Health Commission, in conjunction with multiple departments, has formulated the “Healthy China Action—Implementation Plan for the Prevention and Control of Cardiovascular and Cerebrovascular Diseases (2023–2030)”, proposing to adhere to the focus on the grassroots level, prioritize prevention, attach equal importance to both traditional Chinese and Western medicine, innovate institutional mechanisms and working models, promote the transformation from “centering on treating diseases” to “centering on people’s health”, and enhance the health literacy level of the people. Moreover, this plan aims to integrate health into all policies, mobilize the whole society to take action, strengthen policy guidance and resource coordination, and strive to establish a comprehensive prevention, control, early diagnosis, and early treatment system for cardiovascular and cerebrovascular diseases covering the whole country by 2030. The prevention and treatment capabilities and quality of cardiovascular and cerebrovascular diseases in medical and health institutions at all levels will be further improved; the health literacy related to cardiovascular and cerebrovascular diseases of the individuals will be markedly enhanced; and major breakthroughs will be achieved in the prevention and treatment technologies of cardiovascular and cerebrovascular diseases. The upward trend of the incidence rate and risk factor level of cardiovascular and cerebrovascular diseases will be effectively controlled, while the mortality rate of cardiovascular and cerebrovascular diseases will reduced to less than 190.7/100,000.
-
The prevalence of CVD has been growing in China, and the number of patients with CVD is estimated to be 330 million: 13 million with stroke, 11.39 million with coronary heart disease (CHD), 8.9 million with heart failure (HF), 5 million with pulmonary heart disease, 4.87 million with atrial fibrillation, 2.5 million with rheumatic heart disease, 2 million with congenital heart disease, 45.3 million with peripheral arterial disease (PAD), and 245 million with hypertension.
-
According to the data from the Global Burden of Disease (GBD)[1], from 1990 to 2019, the age-standardized incidence rate of CVD (including rheumatic heart disease, ischemic heart disease [IHD], stroke, hypertensive heart disease, non-rheumatic valvular heart disease, cardiomyopathy and myocarditis, atrial fibrillation and atrial flutter, aortic aneurysm, PAD, endocarditis and other cardiovascular and circulatory system diseases) among the Chinese population aged 1–79 years rose from 646.2/100,000 person-years to 652.2/100,000 person-years. The age-standardized incidence rate of CHD increased from 177.1/100,000 person-years in 1990 to 203.7/100,000 person-years in 2010 and decreased to 197.4/100,000 person-years in 2019.
From July 2021 to June 2022, the “Monitoring of Cardiovascular and Cerebrovascular Events among Chinese Residents” project analyzed data from 103 monitoring points in 20 provinces, autonomous regions, and municipalities directly under the Central Government. Reportedly, the crude incidence rate of CVD [including acute myocardial infarction (AMI) angina pectoris treated with percutaneous transluminal coronary angioplasty (PTCA)/percutaneous coronary intervention (PCI) and/or coronary artery bypass grafting (CABG), stroke and sudden cardiac death] among residents aged ≥ 18 years in China was 600.9/100,000 (the age-standardized incidence rate was 411.8/100,000). The incidence rate among males (the crude incidence rate was 689.5/100,000, and the age-standardized incidence rate was 501.9/100,000), which was higher than that among females (the crude incidence rate was 510.7/100,000, and the age-standardized incidence rate was 324.9/100,000). The crude incidence rate of AMI was 79.7/100,000 (the age-standardized incidence rate was 55.8/100,000) and was higher among males (99.0/100,000) than among females (60.1/100,000).
-
The China Mortality Surveillance System, covering 300 million individuals (accounting for 24% of the Chinese population) at 605 monitoring points in 31 provinces of China, revealed that the number of CVD deaths in China increased from 3.09 million in 2005 to 4.58 million in 2020. The age-standardized mortality rate of CVD decreased from 286.85/100,000 in 2005 to 245.39/100,000 in 2020. In each surveyed year, the age-standardized mortality rate was higher among males than among females[2].
In 2020, the burden of premature CVD mortality in China was reduced by 19.27% when compared with that in 2005. Although the burden of premature CVD mortality has decreased, it remains relatively high, and the number of CVD-related mortalities is still increasing, with a 48.06% increase in 2020 when compared with 2015. Aging has been identified as the main underlying reason, followed by the increase in the population. In 2020, IHD, hemorrhagic stroke, and ischemic stroke were the three main causes of CVD mortality in China. Among individuals aged 15–50 years, IHD accounted for 50%–60% of the burden of premature CVD mortality.
According to the China Health Statistics Yearbook 2022, CVD ranks first among the composition ratios of diseases causing deaths among urban and rural residents. In 2021, CVD accounted for 48.98% and 47.35% of the causes of death in rural and urban areas, respectively (Figure 1)[3]. The mortality rate of CVD in rural areas has exceeded and remained higher than that in urban areas since 2009 (Figure 2). In 2021, the mortality rate of CVD in rural areas was 364.16/100,000, among which the mortality rate of heart disease was 188.58/100,000 and that of cerebrovascular disease was 175.58/100,000. The mortality rate of CVD in urban areas was 305.39/100,000, among which the mortality rate of heart disease was 165.37/100,000, and that of cerebrovascular disease was 140.02/100,000.
-
According to the GBD research data[4,5], from 1990 to 2016, the disability-adjusted life years (DALY) of CVD increased by 33.7%, among which the increase in males (51.8%) was substantially higher than that in females (12.1%). The diseases with the fastest growth in burden were atrial fibrillation and atrial flutter (147.0%), IHD (122.0%), PAD (108.9%), ischemic stroke (80.4%), and aortic aneurysm (49.1%).
Although the absolute value of the overall CVD burden was increasing, the age-standardized DALY rate decreased by 33.3% from 1990 to 2016, with a greater decrease observed among females (–43.7%) than among males (–24.7%). The age-standardized DALY rates of all types of CVD decreased to varying degrees, with larger reductions in rheumatic heart disease (–77.6%), other CVD (–68.7%), hypertensive heart disease (–54.8%), and hemorrhagic stroke (–52.6%).
The reduction in the CVD burden has been closely associated with social development. The higher the degree of economic development, the greater the reduction in the CVD burden. In 2016, Beijing, Macao, and Hong Kong (China), which had the highest sociodemographic index (SDI) scores, all experienced a reduction over 45% in the CVD burden than that in the past 26 years. In contrast, the reduction in the CVD burden was less than 25% in Tibet, Guizhou, Gansu, and Yunnan, which recorded lower SDI scores (Figure 3).
-
From 2020 to 2022, the preliminary survey results of the “Chinese Residents CVD and Its Risk Factors Surveillance” project, conducted at a total of 262 monitoring points in 31 provinces, autonomous regions, and municipalities directly under the Central Government, found that the prevalence of CHD (including patients with AMI, patients with PCI, patients with CABG, and patients hospitalized for unstable angina pectoris) among residents aged ≥ 18 years in China was 758/100,000. The prevalence was higher among males (940/100,000) than among females (570/100,000), and higher in urban areas (892/100,000) than in rural areas (639/100,000).
In 2021, data from China Health Statistics Yearbook 2022 revealed that mortality due to CHD was 135.08/100,000 among urban residents and 148.19/100,000 among rural residents, which had been increasing since 2012 (Figure 4A). Both in urban and rural areas, the mortality rate of CHD among males is higher than that among females. The mortality due to CHD in rural areas increased significantly and exceeded that in urban areas by 2016[3].
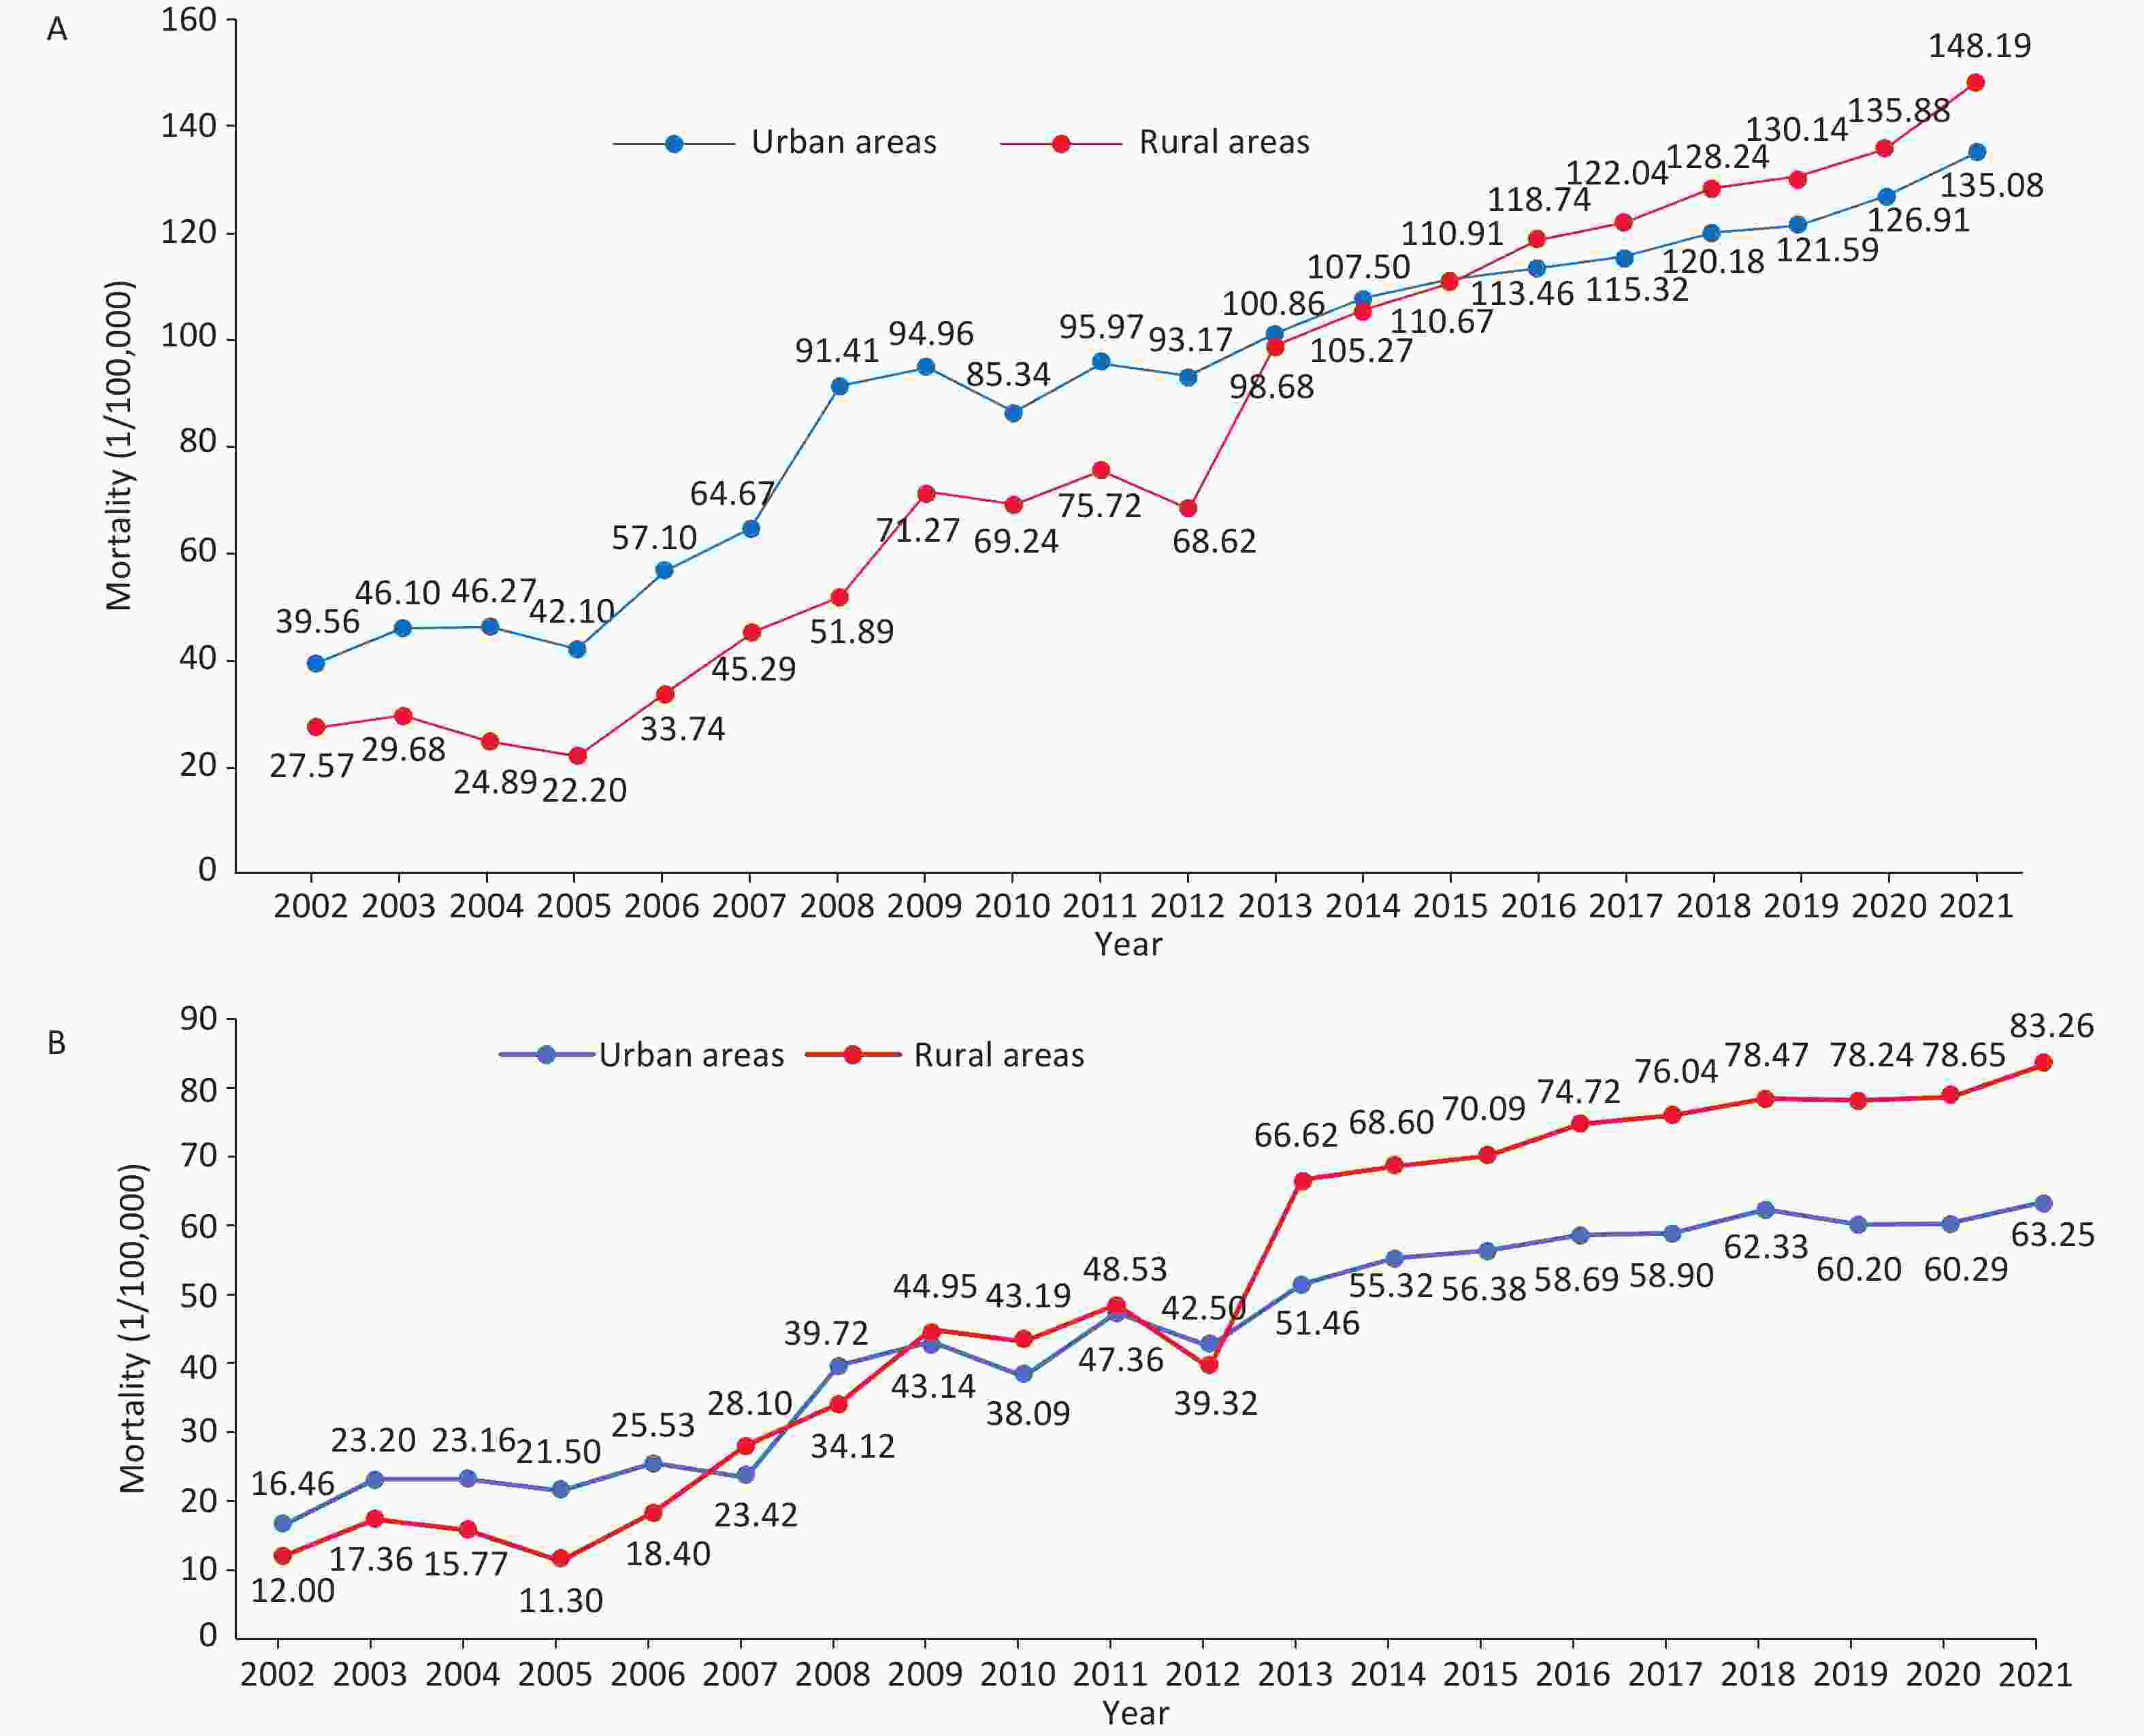
Figure 4. Trends in the mortality of CHD (A) and AMI (B) among urban and rural residents in China from 2002 to 2021. CHD, coronary heart disease; AMI, acute myocardial infarction.
According to the China Health Statistics Yearbook 2022, from 2002 to 2021, mortality due to AMI showed an increasing trend in urban and rural areas of China and has increased substantially since 2012. In 2013, the mortality of AMI in rural areas exceeded that in urban areas (Figure 4B)[3].
-
The GBD 2019 data[6] showed that the total number of stroke incidences in China was 28.76 million, with an increase of 147.5% when compared with that recorded in 1990. Considering the different subtypes of stroke, from 1990 to 2019, the number of patients with ischemic stroke showed the highest increase (195.2%), followed by those with subarachnoid hemorrhage (54.8%) and intracerebral hemorrhage (43.0%). In 2019, the age-standardized incidence of stroke was 1,468.9/100,000, with ischemic stroke comprising 1,255.9/100,000, hemorrhagic stroke comprising 214.6/100,000, and subarachnoid hemorrhage comprising 81.4/100,000. Compared with that in 1990, the age-standardized incidence of stroke increased by 13.2% in 2019, with ischemic stroke increasing by 33.5% and hemorrhagic stroke and subarachnoid hemorrhage decreasing by 31.9 and 21.9%, respectively.
From July 2021 to June 2022, after analyzing data from 103 monitoring points in 20 provinces, autonomous regions, and municipalities directly under the Central Government through the “Surveillance of Cardiovascular and Cerebrovascular Events among Chinese Residents” project, the crude incidence rate of stroke among residents aged ≥ 18 years was 496.7/100,000 (the age-standardized incidence rate was 338.6/100,000), which was higher among males than among females.
According to the China Health Statistical Yearbook 2022, cerebrovascular disease mortality among urban residents was 140.02/100,000 in 2021, accounting for 21.71% of the total deaths and ranking third among all causes of death. Among rural residents, mortality due to cerebrovascular disease was 175.58/100,000, accounting for 23.62% and ranking second. Mortality due to cerebrovascular disease was higher among males than among females and higher in rural areas than in urban areas[3].
Based on the China Health Statistical Yearbook 2022, from 2003 to 2021, the mortality rate of CVD in China showed an overall increasing trend. Compared with 2003, the mortality rate of CVD in urban areas increased by 1.37 times in 2021, with an increase of 1.58 times in rural areas. The crude mortality rate of CVD in rural areas was higher than that in urban areas each year (Figure 5)[3].

Figure 5. Trends of the crude mortality rate of cerebrovascular diseases among urban and rural residents in China from 2003 to 2021.
According to the results of GBD 2019, 2.189 million individuals died of stroke in China in 2019. From 1990 to 2019, the total number of deaths due to stroke increased by 59.0%. The number of deaths due to ischemic stroke and cerebral hemorrhage increased by 171.1% and 37.4%, respectively, while the number of deaths from subarachnoid hemorrhage decreased by 58.7%. In 2019, the age-standardized mortality rate of stroke in China was 127.2/100,000, with 62.2/100,000 attributed to ischemic stroke, 60.1/100,000 to cerebral hemorrhage, and 5.0/100,000 to subarachnoid hemorrhage. Compared with that in 1990, the age-standardized mortality rate of stroke decreased by 39.8% in 2019. Among them, the change in ischemic stroke was not significant, showing a decrease of 3.3%. Cerebral hemorrhage and subarachnoid hemorrhage decreased by 48.1% and 84.1% respectively[6,7].
-
The GBD 2019 study reported that between 1990 and 2019, the number of deaths caused by smoking in China increased from 1.5 million to 2.4 million, an increase of 57.9%[8]. Notably, China is the largest tobacco consumer worldwide. According to the China Adult Tobacco Survey, the rate of smoking among individuals aged ≥ 15 years in China was 26.6%. There are over 300 million smokers, and approximately 183.5 million of them suffer from tobacco dependence[9]. Compared to 2010 and 2015, the results of the Chinese Adult Tobacco Survey decreased by 1.55% and 1.13%, respectively. The smoking rate among males (50.5%) was higher than that among females (2.1%), and the rate in rural areas (28.9%) was higher than that in urban areas (25.1%). From 2010 to 2018, the smoking rate among individuals aged 25–44 and 45–64 decreased substantially (Figure 6). Among individuals with different educational levels, the greatest reduction in the smoking rate was observed among those with a college degree or above, from 26.6% to 20.5%.
A collaboration between the Chinese Academy of Medical Sciences and the University of Oxford conducted a study among 512,000 adults aged 30–79 years in 10 regions of China from 2004 to 2008. After a median follow-up of 11 years, smoking was markedly associated with the risk of onset of 15 types of circulatory system diseases, including aortic aneurysm and aortic dissection, arterial embolism and thrombosis, other pulmonary heart diseases, pulmonary embolism, other aneurysms, AMI, cardiac arrest, atherosclerosis, HF, heart disease complications and ill-defined heart diseases, chronic IHD, cerebral infarction, angina pectoris, and varicose veins[10].
In Beijing, the Beijing Tobacco Control Act was implemented in June 2015. Five years later, the number of smokers in Beijing decreased by 550,000. The study estimated that after the policy implementation, the hospitalization rate of AMI decreased by 5.4%, the long-term growth trend of stroke slowed down by 15.3% annually; the hospitalization rate of chronic obstructive pulmonary disease decreased immediately by 14.7%, and the long-term trend was delayed by 3.0% annually. It was estimated that 18,137 cases of stroke and 5,581 cases of chronic obstructive pulmonary disease hospitalizations were avoided within 25 months of implementing this policy[11,12].
In Shenzhen, the Regulation of Shenzhen Special Economic Zone on the Smoking Control was implemented in March 2014. In March 2017, smoking was completely banned in all indoor public places, public venues, and public transportation. An analysis of approximately 12 million individuals in Shenzhen from 2012 to 2016 found that following the smoke-free legislation, the incidence of AMI decreased by 9%, and that of hemorrhagic and ischemic stroke decreased by 7% and 6%, respectively, annually[13].
-
According to data from the China Nutrition and Health Surveillance (CNHS) (2015–2017), Chinese residents receive a sufficient supply of total energy from dietary intake. The total energy intake among Chinese residents showed a downward trend from the perspective of long-term trends, with the carbohydrate-to-energy supply ratio significantly decreasing. However, the fat-to-energy supply ratio increased and exceeded the recommended upper limit of 30% for urban residents since 2002. From 2015 to 2017, the fat-to-energy supply ratio in rural areas exceeded the recommended upper limit by 30% for the first time, reaching 33.2%[14,15].
Data from 72,231 adults aged ≥ 18 years in the CNHS from 2015 to 2017 revealed that micronutrient intake among Chinese adults was notably insufficient, with the rate of insufficient intake ranging from 2.58% to 97.63%. Among them, the percentage of calcium intake was most insufficient, followed by vitamin B2 (Figure 7). However, sodium intake was markedly elevated, averaging 5,139.61 mg/day, and only one-fourth of Chinese adults were below the intake recommended by the World Health Organization (WHO)[16].
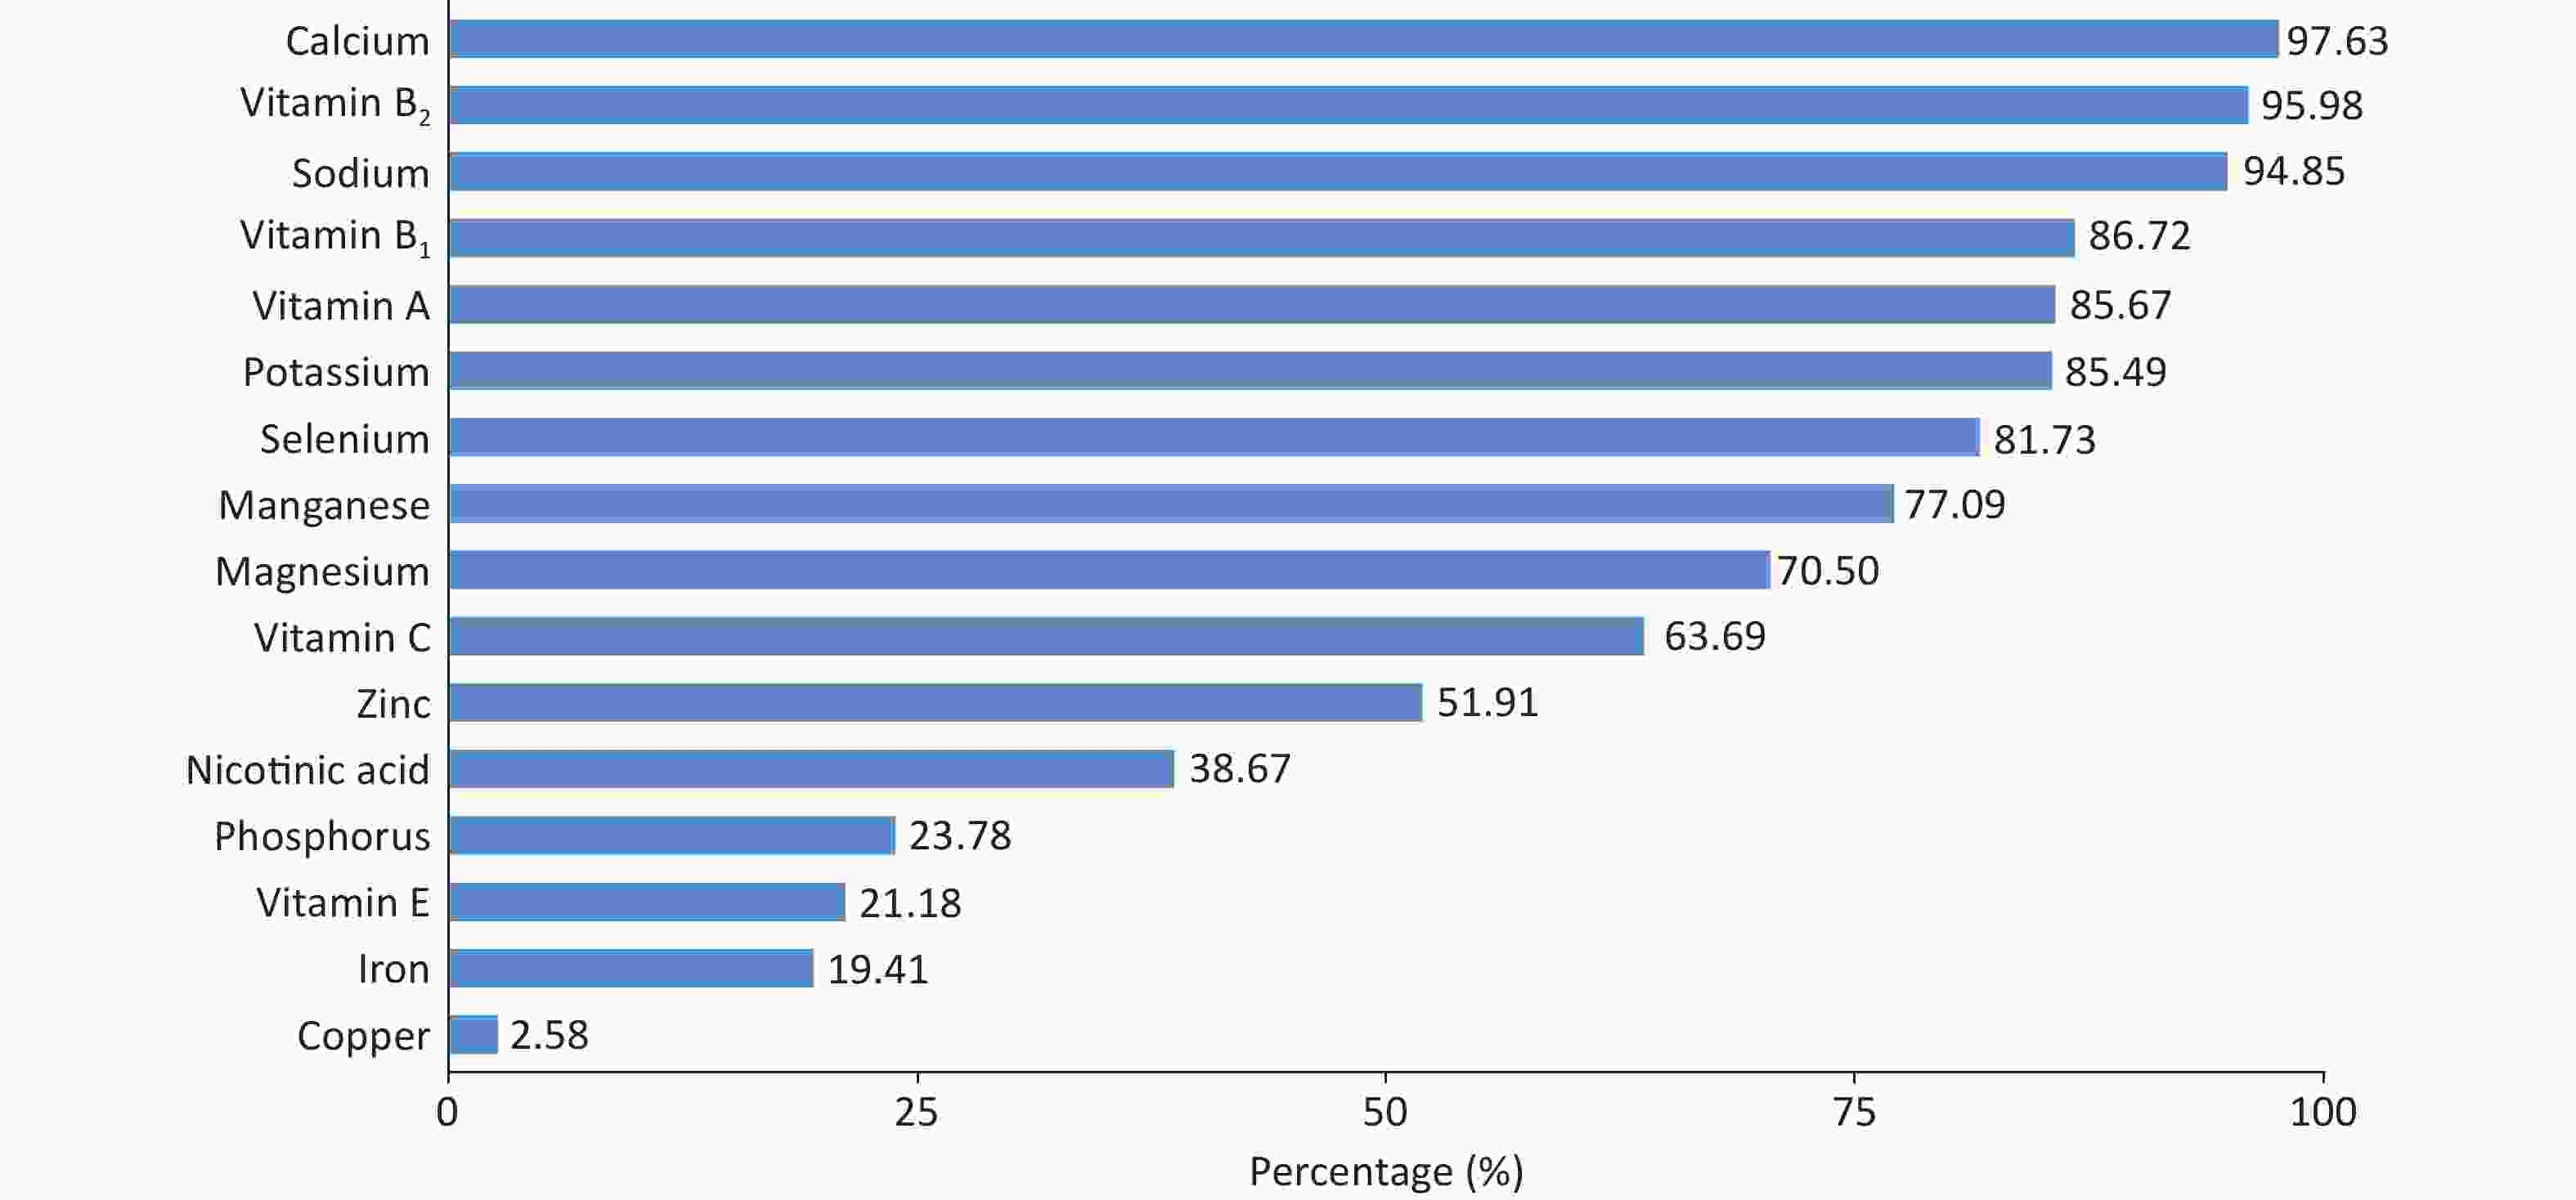
Figure 7. The percentage of insufficient dietary micronutrient intake among Chinese adults based on EAR or AI. The bar corresponding to sodium in the figure shows the percentage of Chinese adults whose sodium intake exceeds the AI. EAR, estimated average requirement; AI, adequate intake.
The dietary structure of Chinese residents remains illogical. From 2002 to 2018, data from the China Chronic Disease and Risk Factors Surveillance (CCDRFS) showed an upward trend in the intake of whole grains, vegetables, fruits, red meat, soybeans, and nuts among Chinese residents aged ≥ 20 years (Figure 8). The intake of red meat and sugar-sweetened beverages exceeded the intake recommended in the Chinese Dietary Guidelines, while the intake of other foods was lower than the recommended intake. Among them, the average daily intake of whole grains (21.2 g/day) and fruits (114.1 g/day) reached only half of the recommended intake (50.0–100.0 g/day for whole grains and 200.0–350.0 g/day for fruits)[17].

Figure 8. The changes in the intake of various foods among Chinese residents aged ≥ 20 from 2002 to 2018.
An analysis of 179,985 residents aged ≥ 18 years by the CCDRFS in 2018 showed that the proportion of insufficient vegetable and fruit intake was 44.7%. The proportion was higher among males (45.8%) than among females (43.6%) and higher in rural areas (51.1%) than in urban areas (38.6%), with a downward trend with the increase in per capita annual income, educational level, and body mass index (BMI)[18].
In a community-based cohort study of neurological diseases conducted from 2018 to 2020, the analysis of 23,296 residents aged ≥ 55 years showed that, compared with 2018, the daily intake of livestock meat, poultry meat, and eggs increased in 2020, whereas the daily intake of wheat flour, other cereals, potatoes, soybeans, fruits, and aquatic products decreased. The proportions of excessive intake of cereals, livestock and poultry meat, and eggs were 46.3%, 36.6%, and 26.6%, respectively, while the proportions of insufficient intake of coarse grains and miscellaneous beans, potatoes, soybeans, dairy products, fruits, vegetables, and aquatic products were 98.4%, 80.3%, 74.0%, 94.6%, 94.3%, 75.8%, and 86.5%, respectively. More than 50% of the study subjects did not consume dairy products, nuts, whole grains, and miscellaneous beans[19].
According to the National Nutrition Survey data, compared with that recorded in 1982, the per capita daily edible oil intake among Chinese individuals increased in 2015 (18.2 g/day vs. 43.2 g/day), and the amount of salt used for home cooking decreased (12.7 g/day vs. 9.3 g/day), although both markedly exceeded recommended limits[14].
The 2016–2017 survey on Nutrition and Health Monitoring of Chinese Children and Breastfeeding Mothers, which examined 16,042 children aged 6–17 years, revealed that most children had adequate intake of grains and livestock and poultry meat; however, the intake of whole grains and mixed beans, fresh vegetables, fresh fruits, fish and shrimp, dairy products and their products, nuts and soybeans was deemed insufficient[20].
The “Systematic Investigation and Application of Nutrition and Health for Children Aged 0–18 in China” project from 2019 to 2021 investigated the average daily intake of main foods among 6,413 children aged 6–17 years. Among the total amount of grains, the proportion of mixed grain intake was 3.7%–10.1%, while the proportion of pork intake was 50.9%–71.4% in the total amount of livestock and poultry meat consumed. The median beverage intake of children aged 11–14 years was 42.7 g/day. The proportions of children who did not drink beverages, those who had an intake of < 150 g/day, and those who had an intake of ≥ 150 g/day were 33.2%, 32.8%, and 34.0%, respectively[21].
Data analysis based on CNNS, CCDRFS, hypertension surveys, and National Cause of Death Surveillance System found that from 2002 to 2018, insufficient intake of fruits, whole grains, and vegetables was the main dietary risk factor for IHD, ischemic stroke, hemorrhagic stroke, and other strokes, while the intake of nuts, soybeans, and sugar-sweetened beverages was only related to the mortality rate of IHD. The number and mortality rate of cardiovascular deaths attributed to unhealthy diets showed an upward trend, which was higher in males than in females, revealing a notable upward trend with increasing age. In 2018, the mortality rates of IHD, ischemic stroke, hemorrhagic stroke and other strokes attributed to dietary risk factors nationwide were 77.9/100,000, 34.1/100,000, and 32.8/100,000 respectively (Figure 9)[17].
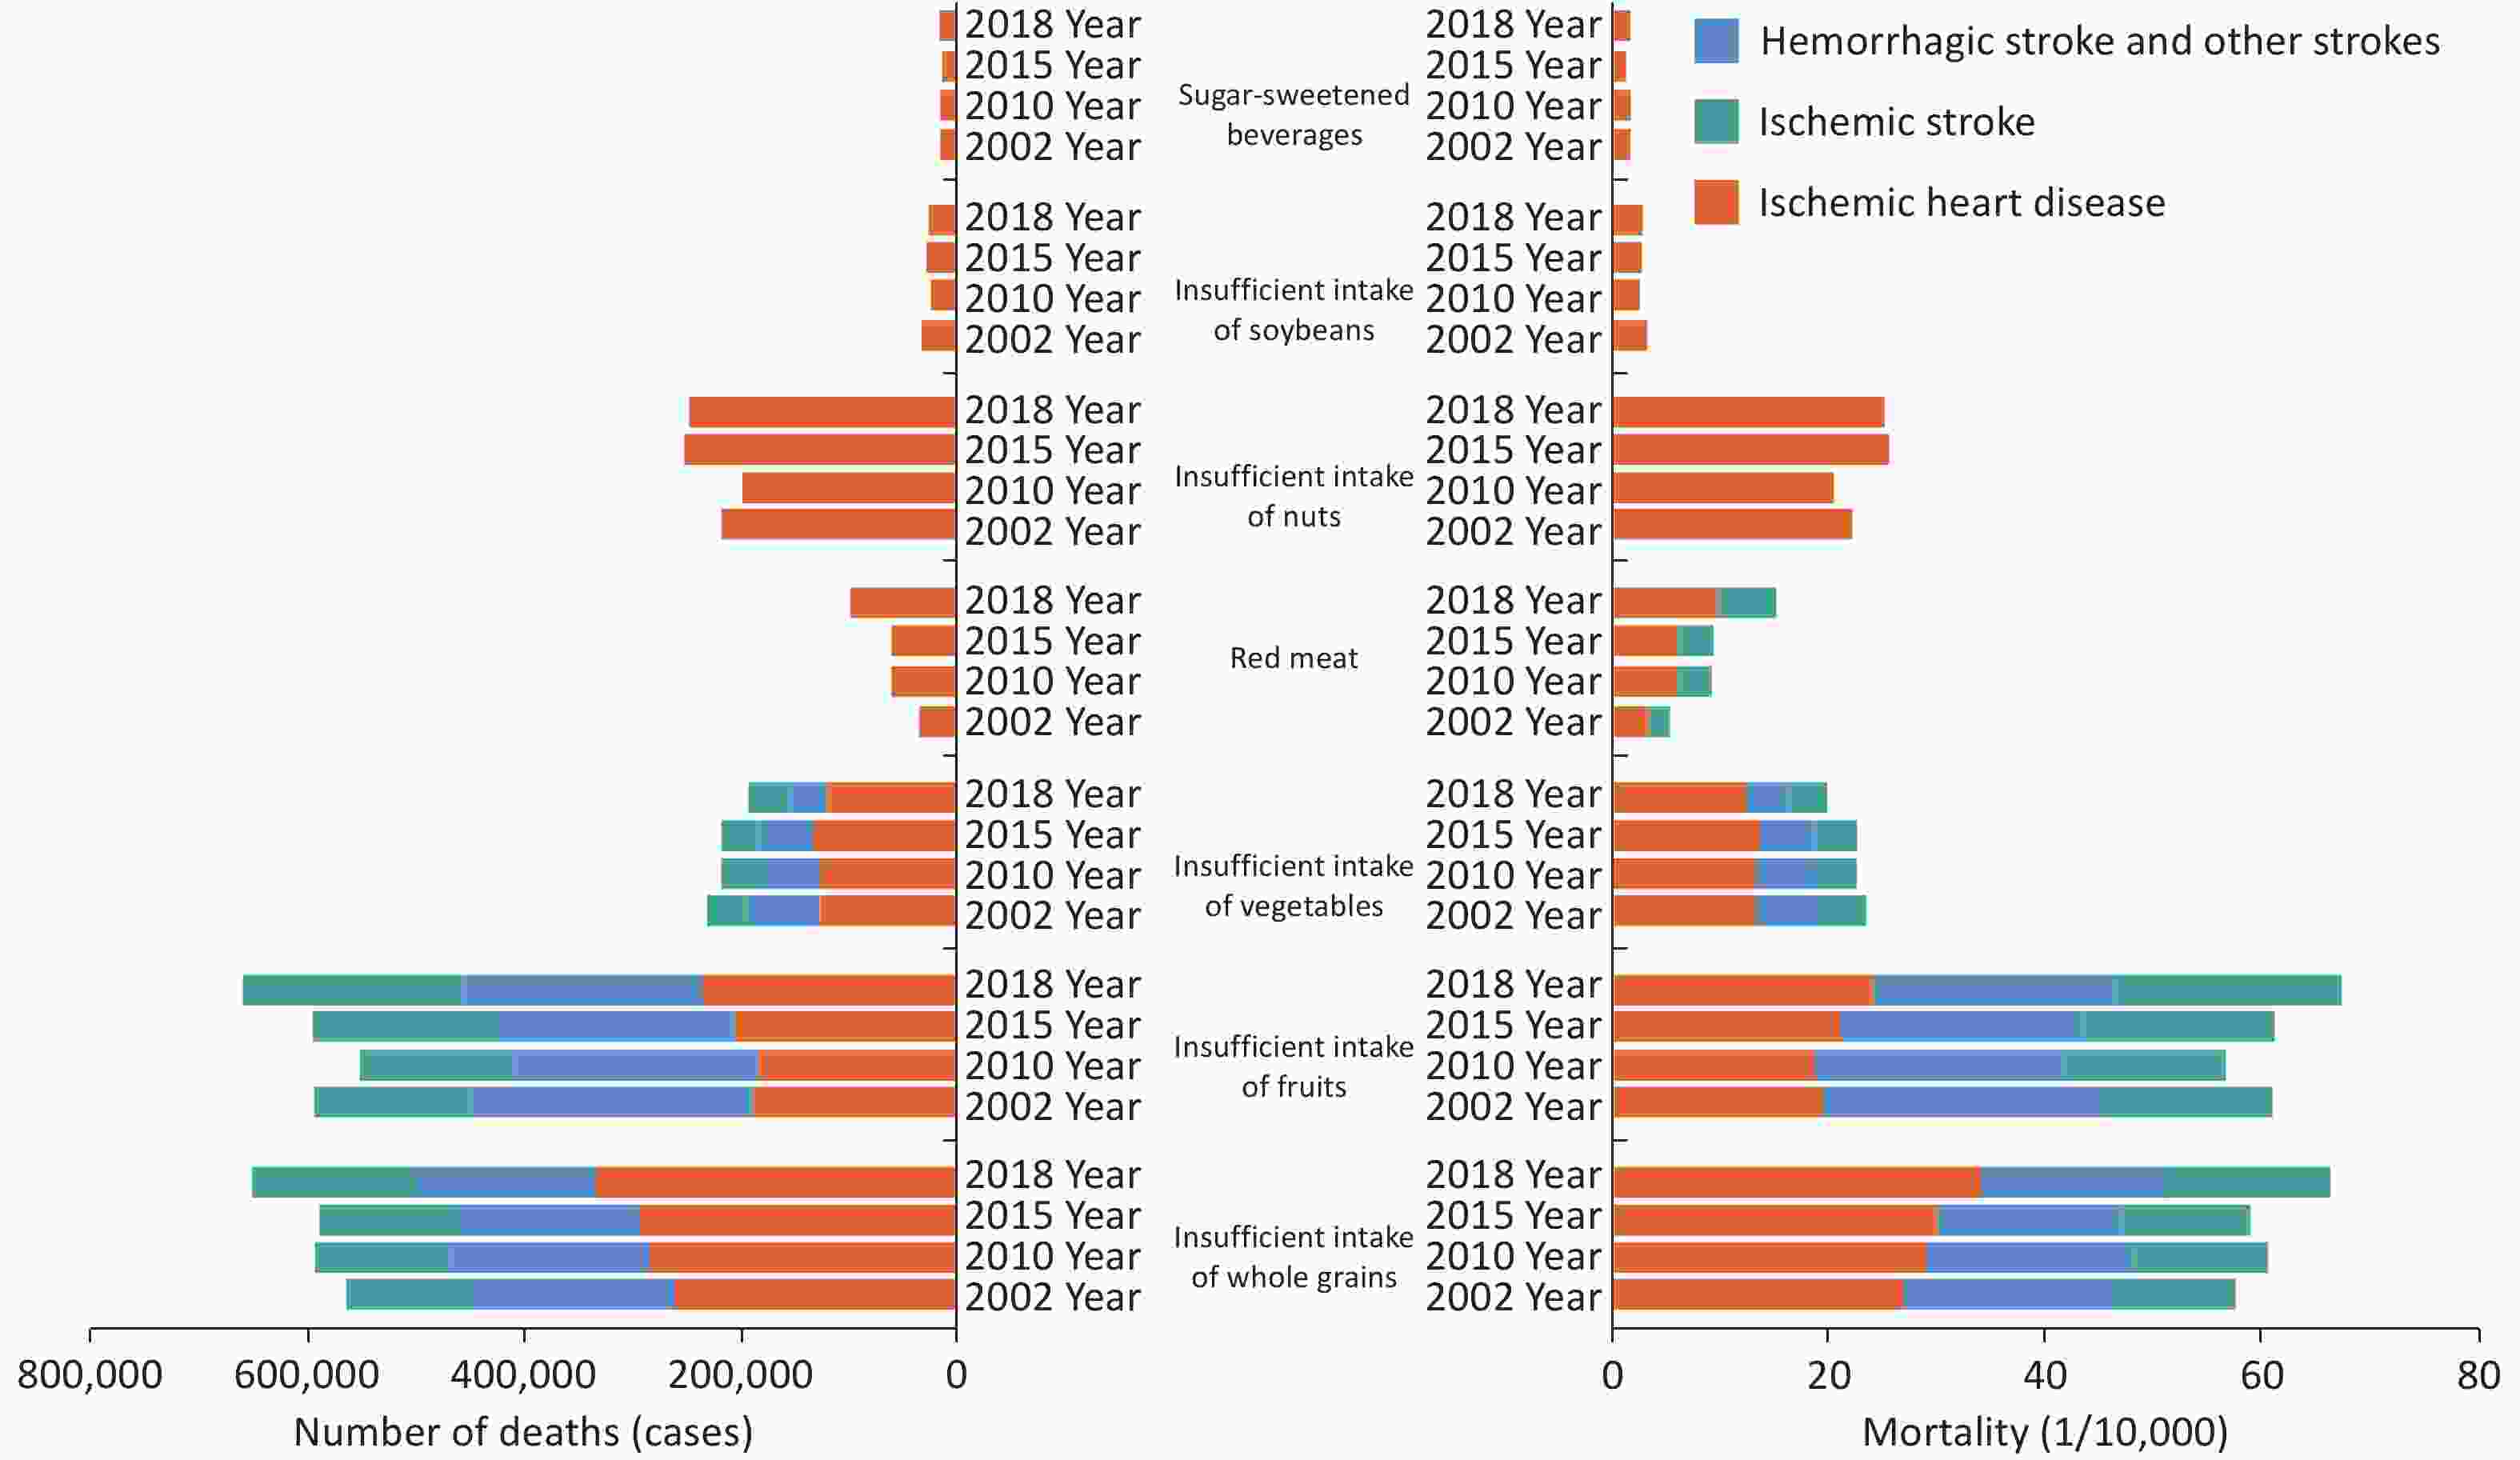
Figure 9. The number of deaths and mortality of stroke and IHD attributed to dietary risk factors in China from 2002 to 2018. IHD, ischemic heart disease.
The 2019 GBD data showed that in 2019, 16.38% of IHD deaths in China could be attributed to a high-salt diet. The age-standardized mortality rate and age-standardized DALY rate of IHD due to a high-salt diet were 16.88/100,000 and 352.24/100,000, respectively, which were markedly higher than those globally (9.78/100,000 and 210.38/100,000, respectively) and different SDI regions. The number of deaths and DALY rate of IHD attributed to a high-salt diet increased by 1.46% and 0.73%, respectively, in 2019 when compared with those in 1990[22].
According to the 2019 GBD data, among Chinese residents aged ≥ 15 years in China, the dietary factors that led to the burden of type 2 diabetes in descending order were high intake of red meat, low whole grain intake, low fruit intake, high processed meat intake, high sugar-sweetened beverage intake, low dietary fiber intake, and low nut and seed intake. From 1990 to 2019, the composition ratio of the burden of type 2 diabetes attributed to dietary factors was 26.13%–26.79%, indicating a growing trend[23].
From 2011 to 2016, the Chinese Cardiometabolic Disease and Cancer Cohort (4C) study followed up 79,922 residents aged ≥ 40 years without diabetes for a median of 3.8 years and 5,886 individuals with diabetes. There was a linear and dose-dependent negative correlation between the intake of fresh fruits and the risk of type 2 diabetes. For every 100 g/day increase in intake, the risk of diabetes decreased by 2.8%, and the risk of diabetes in individuals with normal glucose tolerance decreased by 15.2%. Considering individuals with normal blood glucose levels, the risk of diabetes decreased by 48.6% in individuals who consumed fruits more than 7 times weekly when compared with that in individuals who consumed fruits less than once weekly[24].
From 1997 to 2011, the China Health and Nutrition Survey (CHNS) study analyzed 12,849 adults aged ≥ 20 years. Compared with those without ultra-processed food intake, after adjusting for confounding factors, the odds ratios (ORs) of diabetes in individuals with ultra-processed food intake of 1–19 g/day, 20–49 g/day, and ≥ 50 g/day were 1.21 (95% confidence interval [CI]: 0.98–1.48), 1.49 (95% CI: 1.19–1.86), and 1.40 (95% CI: 1.08–1.80), respectively[25].
Analyzing 15,054 adults aged ≥ 20 years in the CHNS study from 1997 to 2015, a total of 4,329 new cases of hypertension were detected following an average follow-up of 9.5 years. After adjusting for confounding factors, the hazard risk (HR) values of hypertension in individuals with ultra-processed food intake of 1–49 g/day, 50–99 g/day and > 100 g/day were 1.00 (95% CI: 0.90–1.12), 1.17 (95% CI: 1.04–1.33), and 1.20 (95% CI: 1.06–1.35), respectively, when compared with HR values of those who did not consume ultra-processed foods[26].
The results of the Shanghai Men’s Health Study (including 59,770 male residents, with an average follow-up of 12.8 years and 8,711 deaths) and the Shanghai Women’s Health Study (including 74,735 female residents, with an average follow-up of 18.2 years and 10,501 deaths) showed that after adjusting for confounding factors, dietary glycemic index (GI), dietary glycemic load (GL), and carbohydrates were all associated with an increased risk of CVD mortality. Male GL [HRmax (Q4 vs. Q1) = 1.21, 95% CI: 1.09–1.35] and carbohydrate intake [HRmax (Q4 vs. Q1) = 1.26, 95% CI: 1.13–1.40] were associated with an increased CVD mortality rate, and dietary GI in females positively correlated with CVD mortality [HRmax (Q4 vs. Q1) = 1.10, 95% CI: 1.00–1.22][27].
A survey of 61,747 adults aged 18 years in the CNHS from 2015 to 2017 showed that the characteristics of dietary patterns beneficial to blood pressure included higher intakes of fresh vegetables and fruits, mushrooms/edible fungi, dairy products, seaweed, fresh eggs, nuts and seeds, beans and their products, aquatic products, and coarse grains, and a lower intake of refined grains and alcohol, benefiting both the prevention (Q5 vs. Q1, OR = 0.842, 95% CI: 0.791–0.896) and control (Q5 vs. Q1, OR = 0.762, 95% CI: 0.629–0.924) of hypertension[28].
-
The cross-sectional survey of the data from the China Chronic Disease and Nutrition Surveillance in 298 districts and counties from 31 provinces, autonomous regions, and municipalities directly under the Central Government across the country showed that the rate of adults aged ≥ 18 years who regularly participated in physical activities was 12.5% in 2015. The rate was higher in cities (18.1%) than in rural areas (8.5%). In 2018, the amateur static behavior time increased substantially, compared with that observed in 2010 (3.2 h/day vs. 2.7 h/day)[29,30].
From 1985 to 2014, the excellent rate of students’ physical health standards tended to decline overall[31]. From 2004 to 2015, the static behavior increased by 1.8 h/week, with the rate of insufficient activity increasing by 5.5%[32]. In 2016, the proportions of primary and secondary school students with physical education classes ≥ 2 sessions/week and extracurricular physical training ≥ 5 times/week were 85.2% and 31.5%, respectively. The proportions of ≥ 2 h screen time among primary and secondary school students were 23.7%, 27.7%, and 17.5% for television, mobile phones, and computers, respectively[33]. The activity compliance rates of primary and junior high school students were higher in 2017 than those in 2016[34,35]. In 2019, the proportion of those who exercised muscle strength ≥ 3 times/week reached 39.3%[36].
According to the 2016 WHO report, meeting physical activity standards could reduce the risk of premature death among individuals aged 40–74 years in China by 18.3%, equivalent to avoiding 1.0165 million premature deaths annually[37].
In the China Kadoorie Biobank (CKB) study, the risk of CVD death for ≥ 33.8 metabolic equivalents of task (MET)·h/day decreased by 41% when compared with a physical activity volume of ≤ 9.1 MET·h/day. For every 4 MET·h/day increase in physical activity volume, the risk of CVD death decreased by 12%[38]. In the CKB study, compared with the risk in non-active commuters, the risk of IHD in pedestrians and commuters decreased by 10%, and the risks of IHD and ischemic stroke in cyclists decreased by 19% and 8%, respectively[39]. In the China-PAR study, compared with those who did not meet the activity standards at baseline, those who met the activity standards had a 26% lower CVD risk, and those who were highly active had a 38% lower CVD risk. Compared with those who were inactive during both baseline and follow-up periods, those who remained active had a 43% lower CVD risk[40].
In the Guangzhou Heart Study, every 1 MET·h/7 day increase in housework reduced the risk of all-cause death by 1%, and every 1 MET·h/7 day increase in brisk walking or health care gymnastics/yangko dance reduced the risk of all-cause death by 46%[41]. In the China Health and Retirement Longitudinal Study (CHARLS), compared with the lowest level of the three levels of grip strength, the highest grip strength [(41.10 ± 6.16) kg] was associated with a 53% and 49% reduction in the risk of death among males and females, respectively, and young males (OR = 0.29) experienced the greater benefits than older males (OR = 0.49)[42].
-
Both overweight and obesity among children and adults are growing rapidly in China. Data from seven National Student Physical Fitness and Health Surveys from 1985 to 2019[43] revealed that in 2019, the total detection rate of overweight/obesity among children and adolescents aged 7–18 years in China was 23.4% (the detection rates of overweight and obesity were 13.9% and 9.6%, respectively), with a higher rate in cities (25.4%) than in rural areas (21.5%), and the rate among young males (28.4%) being higher than that among young females (18.4%). In terms of growth rate, the total detection rate of overweight/obesity and the detection rate of obesity among children and adolescents aged 7–18 years in China has continued to increase. The total detection rate of overweight/obesity increased from 1.2% in 1985 to 23.4% in 2019, with an increase of 18.1 times; the detection rate of obesity increased from 0.1% in 1985 to 9.6% in 2019, with an increase of 75.6 times. It is estimated that by 2030, the detection rates of overweight/obesity and obesity will increase to 32.7% and 15.1%, respectively (Figure 10). In 2019, the total detection rate of overweight/obesity among urban boys and girls and rural boys and girls increased by 22.3 times, 11.7 times, 54.2 times, and 10.1 times, respectively, compared with respective values recorded in 1985, with the fastest growth rate observed among rural boys.
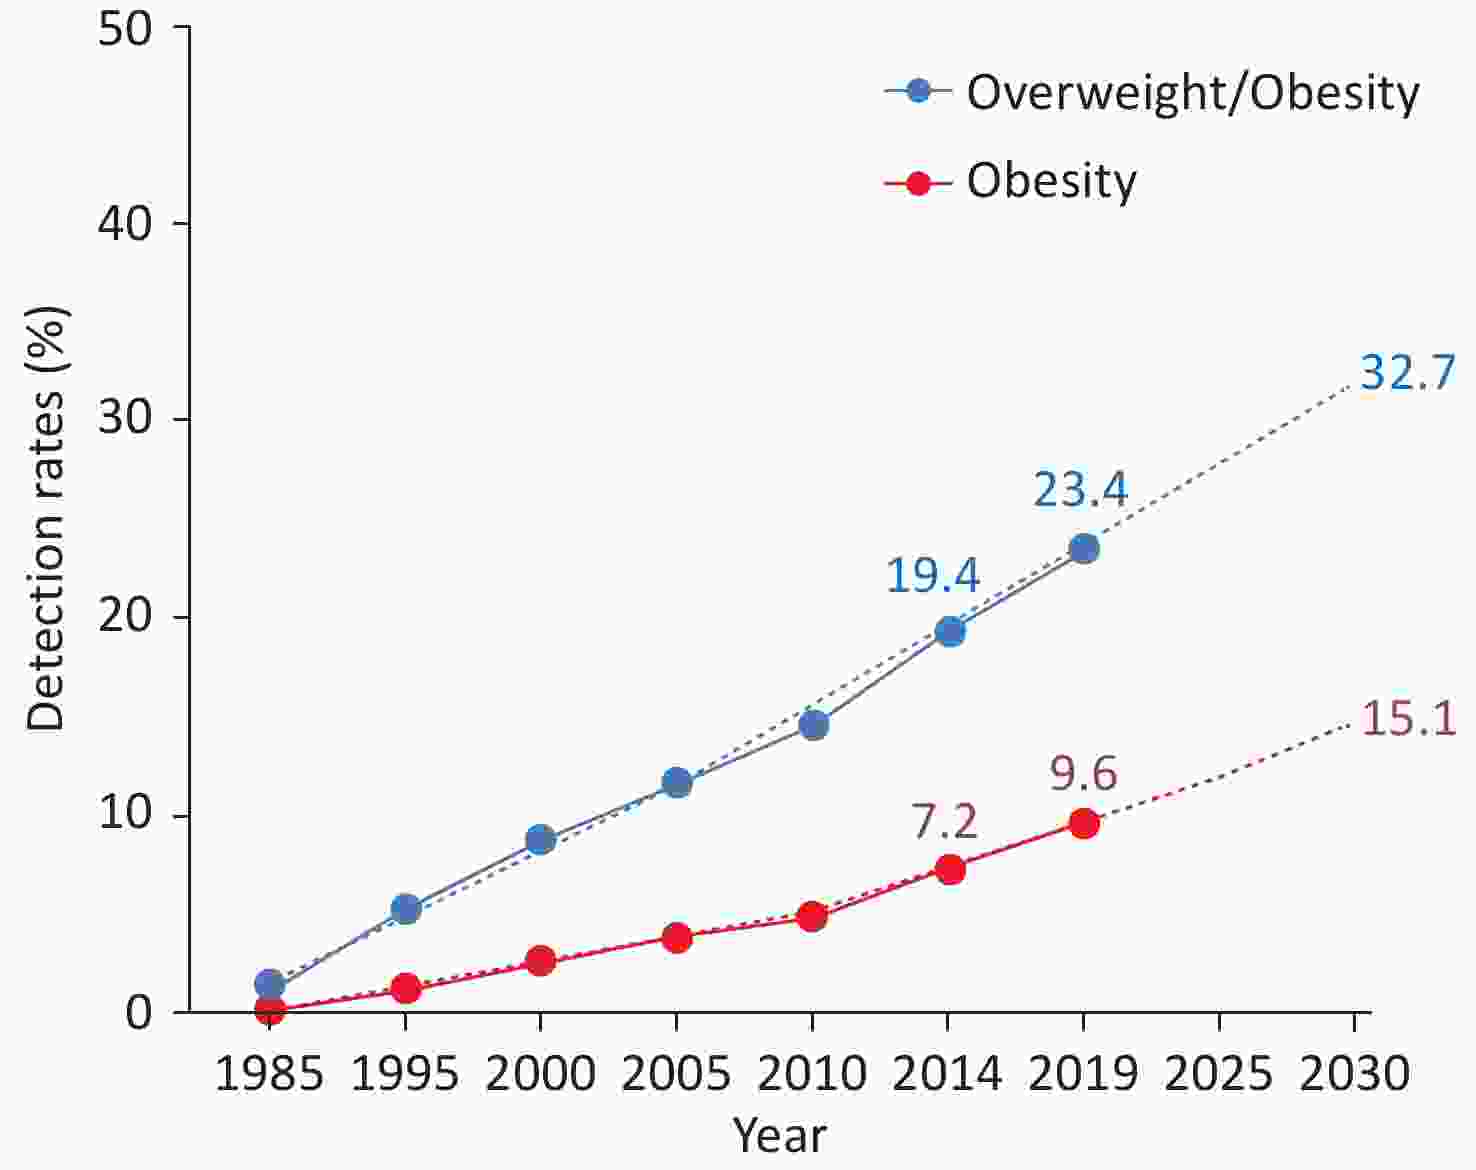
Figure 10. Detection rates and predicted detection rates of overweight/obesity and obesity among children and adolescents aged 7–18 years in China from 1985 to 2019 and predicted detection rates. The “BMI Classification Standard for Screening Overweight and Obesity among School-aged Children and Adolescents in China”, established by the Working Group on Obesity in China, is utilized for determining overweight and obesity. BMI, body mass index.
From 2020 to 2022, the preliminary investigation results of the “Chinese Residents CVD and Its Risk Factors Surveillance” project, conducted at 262 monitoring points in 31 provinces, autonomous regions, and municipalities directly under the Central Government involving 293,022 residents, revealed that rates of overweight, obesity, and central obesity among residents aged ≥ 18 years were 34.6%, 17.8%, and 34.9%, respectively. The obesity rate among males (20.5%) was higher than that among females (15.0%). Additionally, the obesity rate in rural areas (18.7%) was higher than that in urban areas (16.7%). With increasing age, both overweight and obesity rates showed a trend of first increasing and then decreasing (Figure 11).
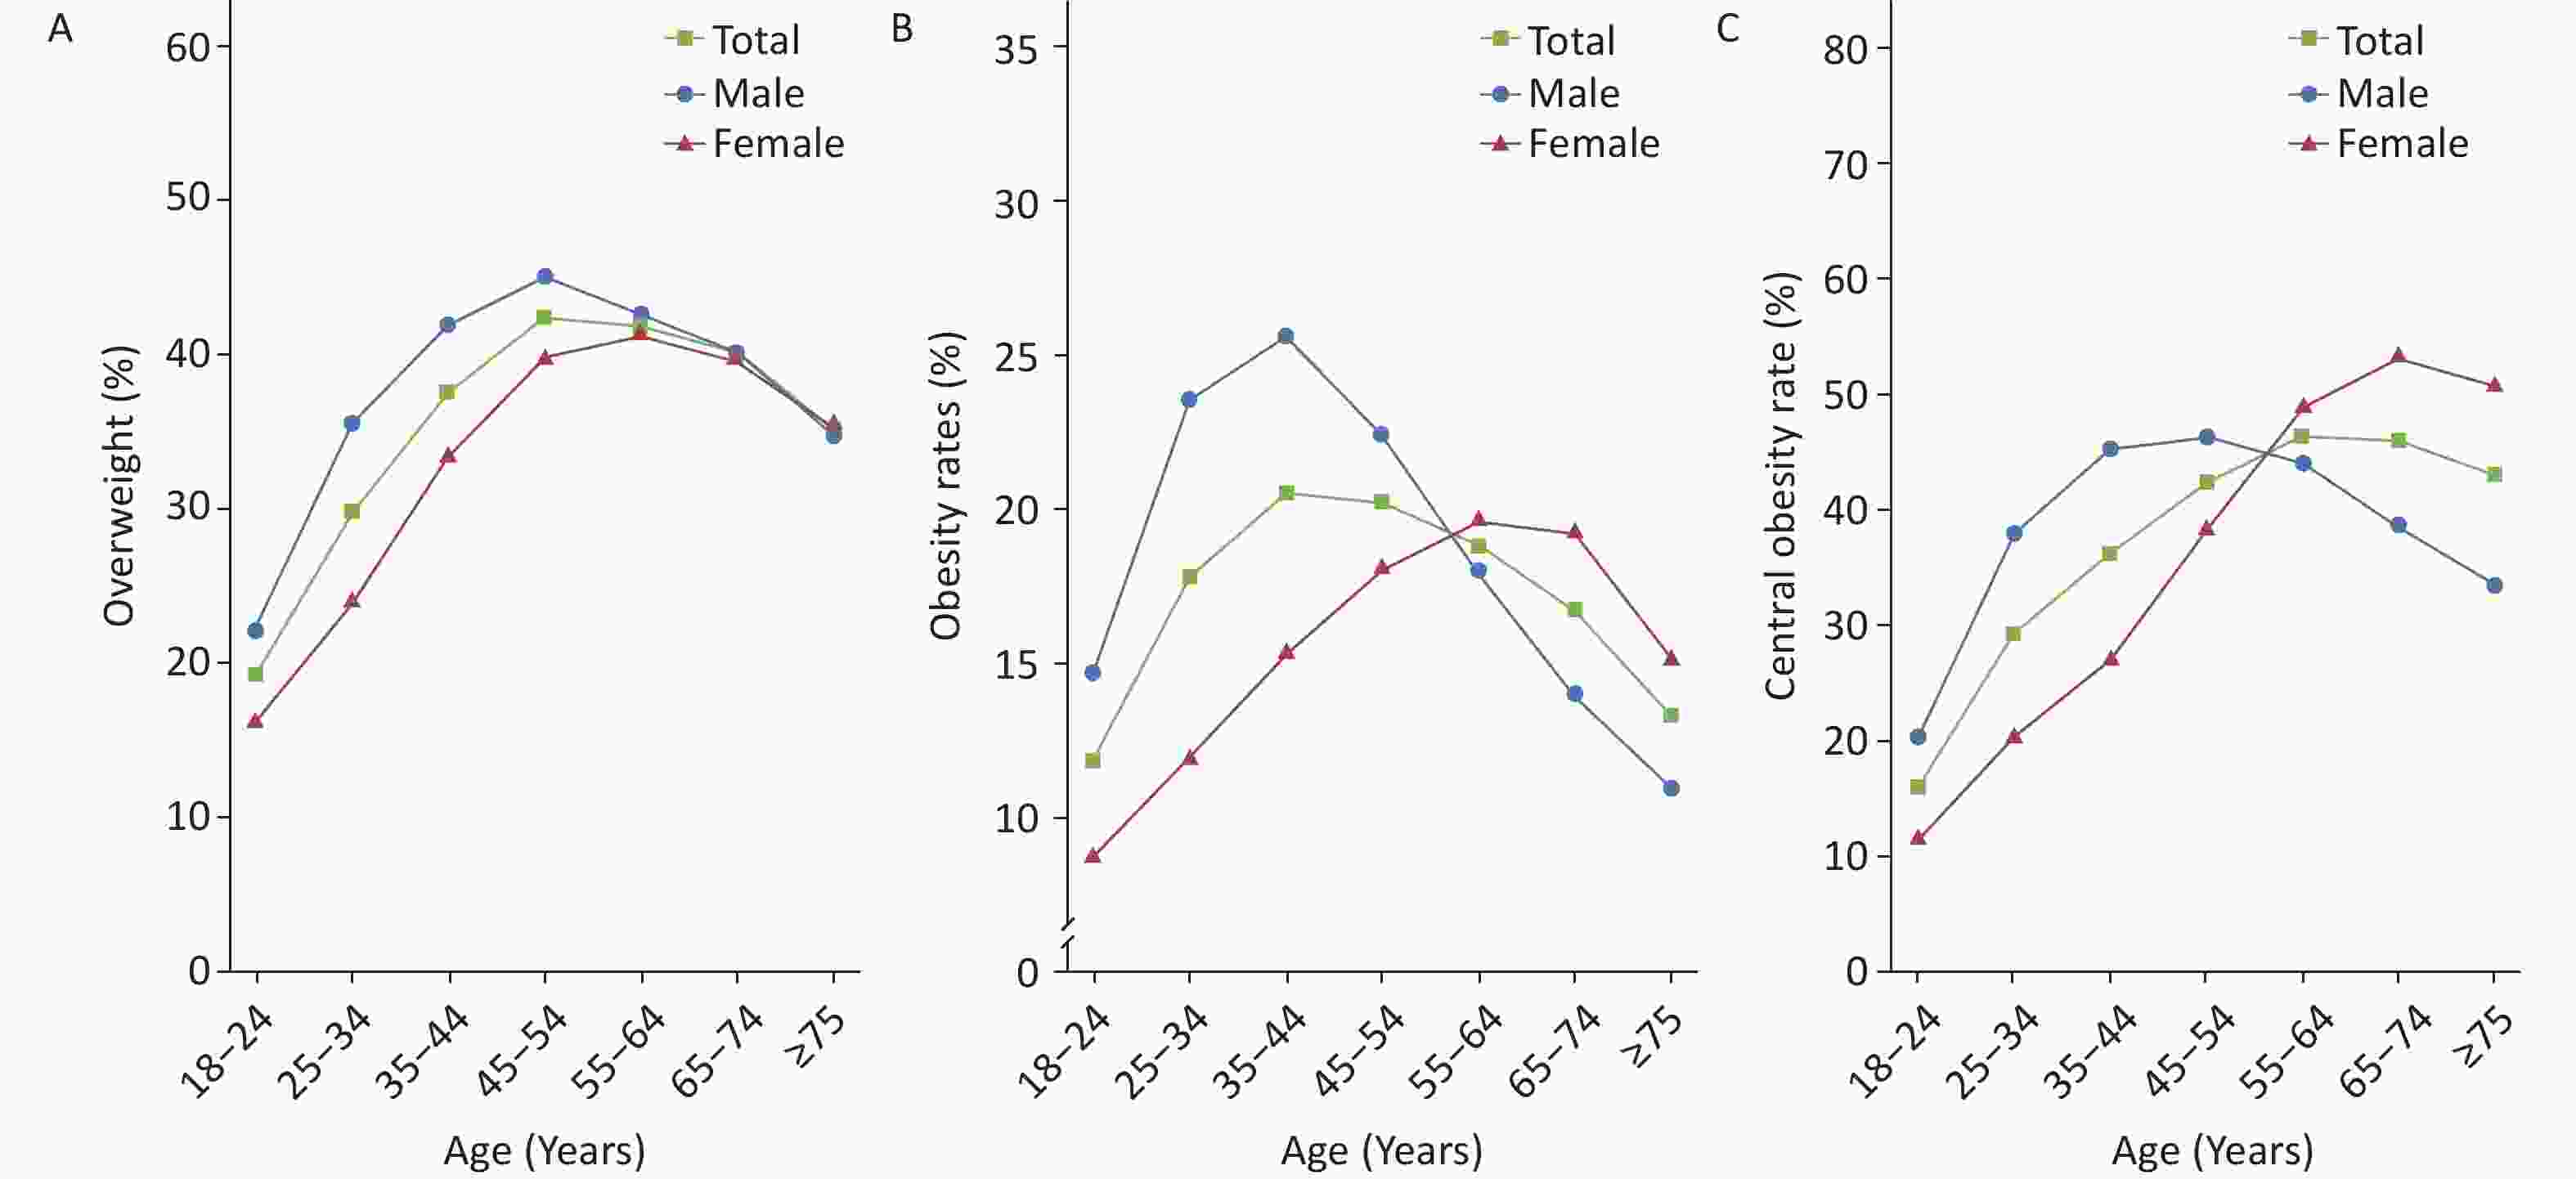
Figure 11. The rates of overweight (A), obesity (B), and central obesity (C) among residents of different sexes and ages in China from 2020 to 2022. Overweight and obesity are determined based on Chinese criteria (Overweight: 24 kg/m2 ≤ BMI < 28 kg/m2; Obesity: BMI ≥ 28 kg/m2. Central obesity: Male waist circumference > 90 cm and female waist circumference > 85 cm). BMI: body mass index.
From 2006 to 2010, the Kailuan cohort conducted a median follow-up of 68,603 adults (average age of 55.46 years) who did not have CVD or cancer for 7 years. Among them, 3,325 individuals had CVD. Compared with the stable-low normal weight group, the stable-high normal weight group, the stable-overweight group, the stable-low obesity group, and the stable-high obesity group had a higher risk of CVD. This suggests that long-term overweight and obesity are associated with an increased risk of lifetime CVD[44].
Overweight/obesity will increase the burden of CVD diseases. According to the estimation of GBD data, in 2019, the number of CVD deaths attributed to high BMI in China was 549,500, and the age-standardized mortality rate of CVD attributed to high BMI was 38.64/100,000, with 11.98% of CVD deaths attributed to high BMI[45].
After a median follow-up of 13.0 years among 94,136 CVD-free residents in the Kailuan study, 7,327 CVD events occurred. The analysis found that 47.81% of the association between overweight and CVD was mediated by the triglyceride-glucose index (TyG-index), accounting for 37.94% of the obese population. When central obesity was determined based on three criteria, i.e., waist circumference, waist-hip ratio, and waist-height ratio, the proportions of the association between central obesity and CVD mediated by the TyG-index were 32.01%, 35.02%, and 31.06%, respectively[46].
-
From 1958 to 2022, sampling surveys on the prevalence of hypertension across China indicated that the prevalence of hypertension showed an overall upward trend (Table 1). The 2018 CCDRFS survey showed that the weighted rate of the prevalence of hypertension among residents aged ≥ 18 years was 27.5%, with a higher rate detected among males than among females (30.8% vs. 24.2%)[47]. From 2020 to 2022, the preliminary investigation results of the “Chinese Residents CVD and Its Risk Factors Surveillance” project, which was conducted at 262 monitoring points in 31 provinces, autonomous regions, and municipalities directly under the Central Government involving 298,438 individuals, showed that the prevalence of hypertension among residents aged ≥ 18 years was 31.6%. The rate was higher among males (36.8%) than among females (26.3%) and higher in rural areas (33.7%) than in urban areas (29.1%).
Table 1. Survey results on the prevalence of hypertension in China from 1958 to 2022
Study name Year Age (years old) Sampling method Sample size (number of individuals) Prevalence (%) Key project of Chinese Academy of Medical Sciences: Hypertension Research 1958–1959 ≥ 15 Non-random sampling 739,204 5.1 National Hypertension Sampling Survey 1979–1980 ≥ 15 Random sampling 4,012,128 7.7 National Hypertension Sampling Survey 1991 ≥ 15 Stratified random sampling 950,356 13.6 China Health and Nutrition Survey 2002 ≥ 18 Multi-stage stratified cluster random sampling 272,023 18.8 Chinese Residents Nutrition and Chronic Diseases Survey 2012 ≥ 18 Multi-stage stratified random sampling − 25.2 China Hypertension Survey 2012–2015 ≥ 18 Multi-stage stratified random sampling 451,755 27.9 (weighted rate 23.2) China Health and Nutrition Survey 2015 ≥ 20–79 Multi-stage stratified cluster random sampling 8,907 34.1 (standardized rate 25.6) China Chronic Disease and Risk Factor Surveillance 2018 ≥ 18 Multi-stage stratified cluster random sampling 179,873 27.5 (weighted rate) Chinese Residents CVD and Its Risk Factors Surveillance 2020–2022 ≥ 18 Multi-stage stratified cluster random sampling 298,438 31.6 (weighted rate) Note. −: No specific data. According to the 2019 National Student Physical Fitness and Health Survey (190,000 individuals, aged 7–17, Han ethnicity), the prevalence of hypertension among children and adolescents was 13.0%, with a higher rate noted among young females than among males (13.2% vs. 12.7%), higher rate in rural areas than in urban areas (14.1% vs. 11.9%), and a gradually increasing trend with age[48]. The prospective cohort survey of 12,952 Chinese residents aged ≥ 18 years in the CHNS study showed[49] that the age-standardized incidence rate of hypertension increased from 40.8/1,000 person-years from 1993 to 1997 to 48.6/1,000 person-years from 2011 to 2015. Several survey studies showed that there was an upward trend in the awareness rate, treatment rate, and control rate of hypertension across China (Table 2).
Table 2. Awareness, treatment, and control rates of hypertension in various studies in China
Study name Year Age (years) Sampling method Sample size (number of individuals) Awareness rate (%) Prevalence (%) Control rate (%) National Hypertension Sampling Survey 1991 ≥ 15 Multi-level random sampling 950,356 27.0 12.0 3.0 China Health and Nutrition Survey 2002 ≥ 18 Multi-stage stratified cluster random sampling 272,023 30.2 24.7 6.1 Chinese Residents Nutrition and Chronic Diseases Survey 2012 ≥ 18 Multi-stage stratified random sampling − 46.5 41.1 13.8 China Nutrition and Health Surveillance 2010–2012 ≥ 18 Multi-stage stratified cluster random sampling 120,428 46.5 41.1 14.6 Investigation of the prevalence, awareness, treatment, and control rates of hypertension in the Chinese working population 2012–2013 18–60 Multi-stage cluster sampling 37,856 57.6
(standardized rate 47.8)30.5
(standardized rate 20.6)11.2
(standardized rate 8.5)China Hypertension Survey 2012–2015 ≥ 18 Multi-stage stratified random sampling 451,755 51.6
(weighted rate 46.9)45.8
(weighted rate 40.7)16.8
(weighted rate 15.3)Early screening and comprehensive intervention program for high-risk groups of cardiovascular disease in China 2014 35–75 Convenience sampling 640,539 46.5 (standardized rate) 38.1 (standardized rate) 11.1 (standardized rate) China Health and Nutrition Survey 2015 20–79 Multi-stage stratified cluster random sampling 8,907 43.8 (standardized rate 27.2) 39.2 (standardized rate 23.6) 13.8 (standardized rate 8.4) China Chronic Disease and Risk Factor Surveillance 2018 ≥ 18 Multi-stage stratified cluster random sampling 179,873 41.0 (weighted rate) 34.9 (weighted rate) 11.0 (weighted rate) Chinese Residents CVD and Its Risk Factors Surveillance 2020–2022 ≥ 18 Multi-stage stratified cluster random sampling 298,438 43.3 (weighted rate) 38.7 (weighted rate) 12.9 (weighted rate) Note. −: No specific data. According to the data from six national surveys of CCDRFS from 2004 to 2018, the awareness rate, treatment rate, and control rate of hypertension among adults aged 18–69 years all showed an upward trend in China (Figure 12)[50]. From 2020 to 2022, the preliminary survey results of the “Chinese Residents CVD and Its Risk Factors Surveillance” project, conducted at 262 surveillance sites in 31 provinces, autonomous regions, and municipalities directly under the Central Government among 298,438 residents, showed that the awareness rate, treatment rate, and control rate of hypertension among those aged ≥ 18 years were 43.3%, 38.7%, and 12.9%, respectively.
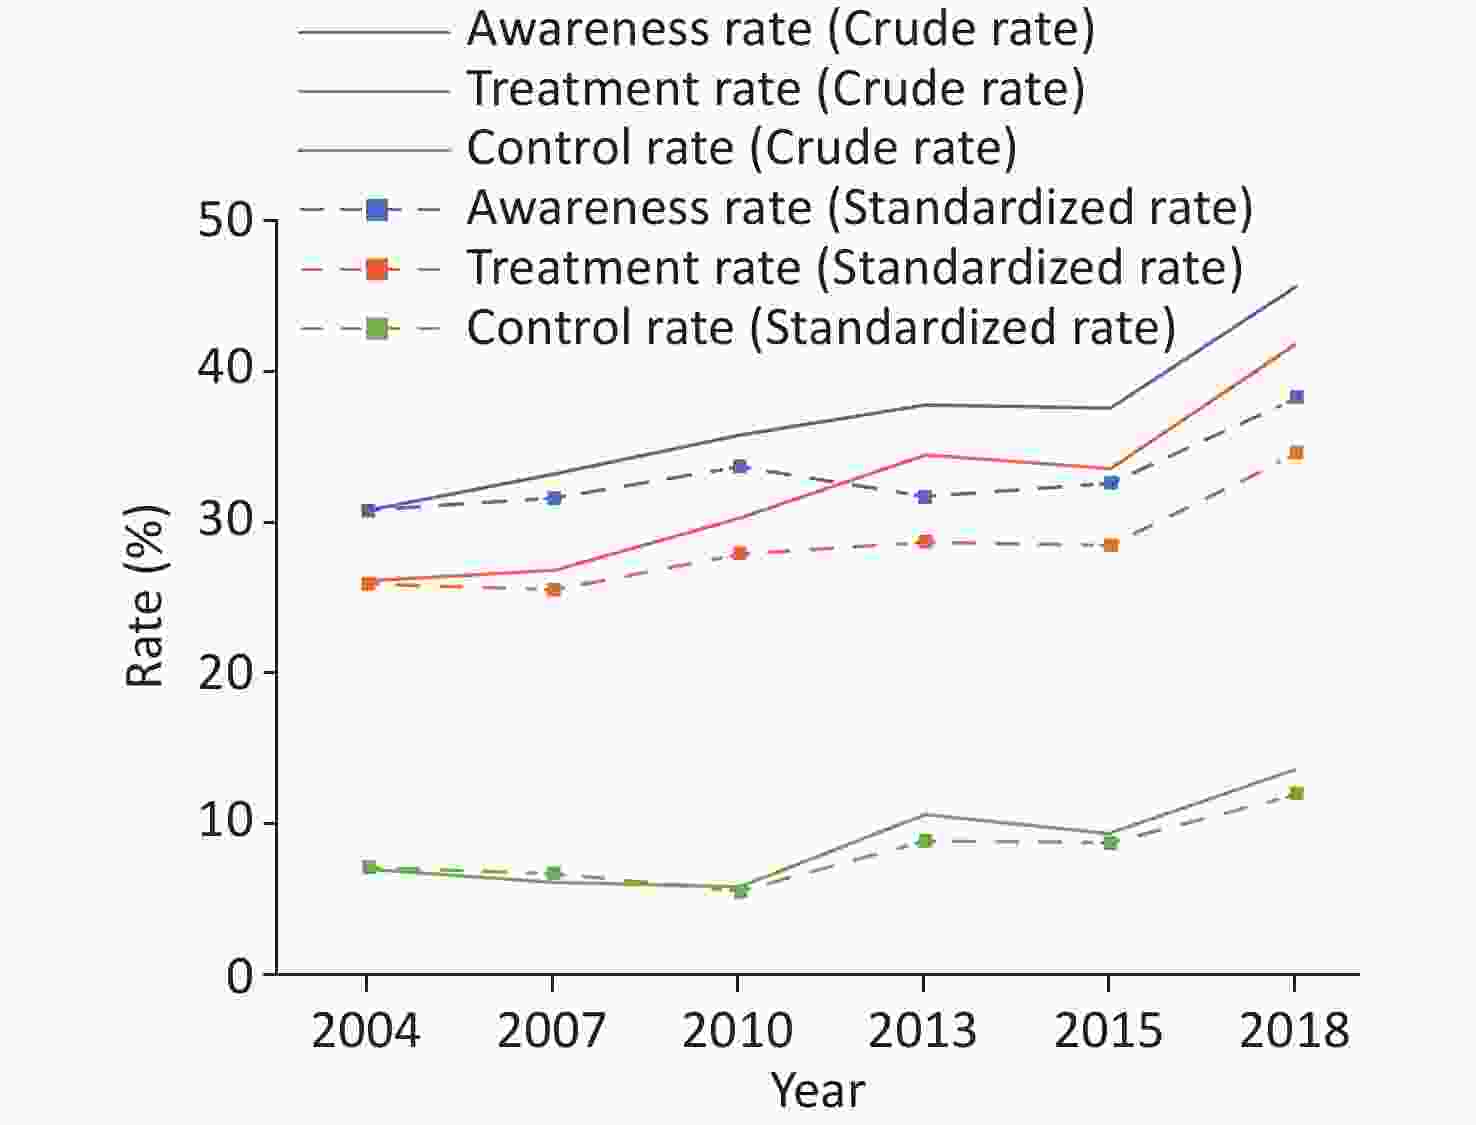
Figure 12. Changes in the awareness rate, treatment rate, and control rate of hypertension in adults aged 18–69 years in China from 2004 to 2018.
The results of the CHNS showed that the age-standardized detection rate of high-normal blood pressure among adults aged ≥ 18 years in China increased from 30.1% in 1991 to 43.1% in 2015[51]. The China Hypertension Survey (CHS) found that the crude detection rate of high-normal blood pressure among adults aged ≥ 18 years in China from 2012 to 2015 was 39.1%, with a weighted rate of 41.3%. It is estimated that there are 435 million individuals with high-normal blood pressure in China[52]. The results of CHS showed that the weighted value of systolic blood pressure in the population was 126.1 mmHg (1 mmHg = 0.133 kPa), and the weighted value of diastolic blood pressure was 76.0 mmHg. Systolic blood pressure was found to increase with age, while diastolic blood pressure increased initially and then decreased with age[50].
The DECIDE-Salt study assessing older Chinese adults showed that the use of potassium-rich low-sodium salt (substitute salt) can effectively reduce the blood pressure in these individuals and substantially reduce the risk of cardiovascular events. Although the substitute salt can increase the incidence of hyperkalemia, it does not increase adverse clinical outcomes[53].
According to the study on mortality, morbidity, and risk factors in China and its provinces from 1990 to 2017, high systolic blood pressure is one of the four major risk factors for death and DALY. In 2017, high systolic blood pressure caused 2.54 million deaths, of which 95.7% were due to CVD[54]. The study on the burden of CVD attributed to high systolic blood pressure in China and its provinces from 2005 to 2018 found that the number of CVD deaths caused by high systolic blood pressure has continued to rise, from 1.98 million in 2005 to 2.67 million in 2018. The years of life lost related to CVD have also continued to rise, from 40.14 million person-years in 2005 to 48.16 million person-years in 2018[55].
-
The findings of the CHNS study in 2002[56], the investigation of the Chinese Chronic Kidney Disease Working Group (CNSCKD) in 2010[57], the CHNS study in 2011[58], and the Chinese Residents Nutrition and Chronic Diseases Survey in 2012[59] all indicated that the prevalence of dyslipidemia among adults aged ≥ 18 years in China had increased considerably, with the survey of the prevalence of dyslipidemia among adults aged ≥ 35 years in the CHS study from 2012 to 2015[60] and the million-population project of early screening and comprehensive intervention for high-risk groups of CVD in China (China-PEACE MPP) from 2014 to 2019[61] reporting similar results (Figure 13). The definition of dyslipidemia used in the above studies was the presence of any type of abnormal blood lipid level, including total cholesterol (TC) ≥ 6.22 mmol/L, low-density lipoprotein cholesterol (LDL-C) ≥ 4.14 mmol/L, high-density lipoprotein cholesterol (HDL-C) < 1.04 mmol/L, triglyceride (TG) ≥ 2.26 mmol/L, or currently taking lipid-regulating drugs.
From 2020 to 2022, the preliminary survey results of the “Chinese Residents CVD and Its Risk Factors Surveillance” project, conducted in 262 surveillance sites in 31 provinces, autonomous regions, and municipalities directly under the Central Government among 275,961 individuals, showed that the prevalence of dyslipidemia among residents aged ≥ 18 years was 38.1%. The prevalence was higher among males (46.1%) than among females (29.6%) and higher in urban areas (38.9%) than in rural areas (37.4%).
According to the data from the fourth CCDRFS[62] 2013–2014 and the Chinese Adults Nutrition and Chronic Diseases Surveillance (CANCDS) 2015[63], the survey results of the 2014 China Stroke Screening and Prevention Project (CNSSPP)[64] and the 2014–2019 China-PEACE MPP Project (currently, known as the China-HEART project) revealed that low HDL-C and high TG are the main types of dyslipidemia in China (Figure 14)[61].
The Non-Communicable Disease Risk Factor Collaborative Group pooled data from 1,127 population studies worldwide, testing the blood lipid levels of 102.6 million individuals aged ≥ 18 years, and evaluated and analyzed the trends of average TC, non-HDL-C and HDL-C levels in 200 countries from 1980 to 2018. The highest increase in the average non-HDL-C levels was recorded in East Asian countries (such as China) and Southeast Asian countries. The age-standardized average non-HDL-C levels increased by 0.23 mmol/L every 10 years. Under this trend, although China was one of the countries with the lowest average non-HDL-C levels globally in 1980, by 2018, it had reached or even exceeded many high-income Western countries[65].
High LDL-C can substantially impact the attributable mortality and disability burden among the Chinese population. In 2017, the attributable mortality rate of high LDL-C in the Chinese population was 61.08/100,000, and the DALY caused by high LDL-C was 18.1621 million person-years[66]. The attributable risk percentages of high LDL-C to the disease burden of CHD and stroke were 41.9% and 9.6%, respectively[67,68]. Upon assessing 179,728 residents aged ≥ 18 years, the survey results of the CANCDS project showed that the levels of TC, LDL-C, non-HDL-C, and TG of Chinese residents were all higher in 2015 than those in 2002 (Figure 15)[63].
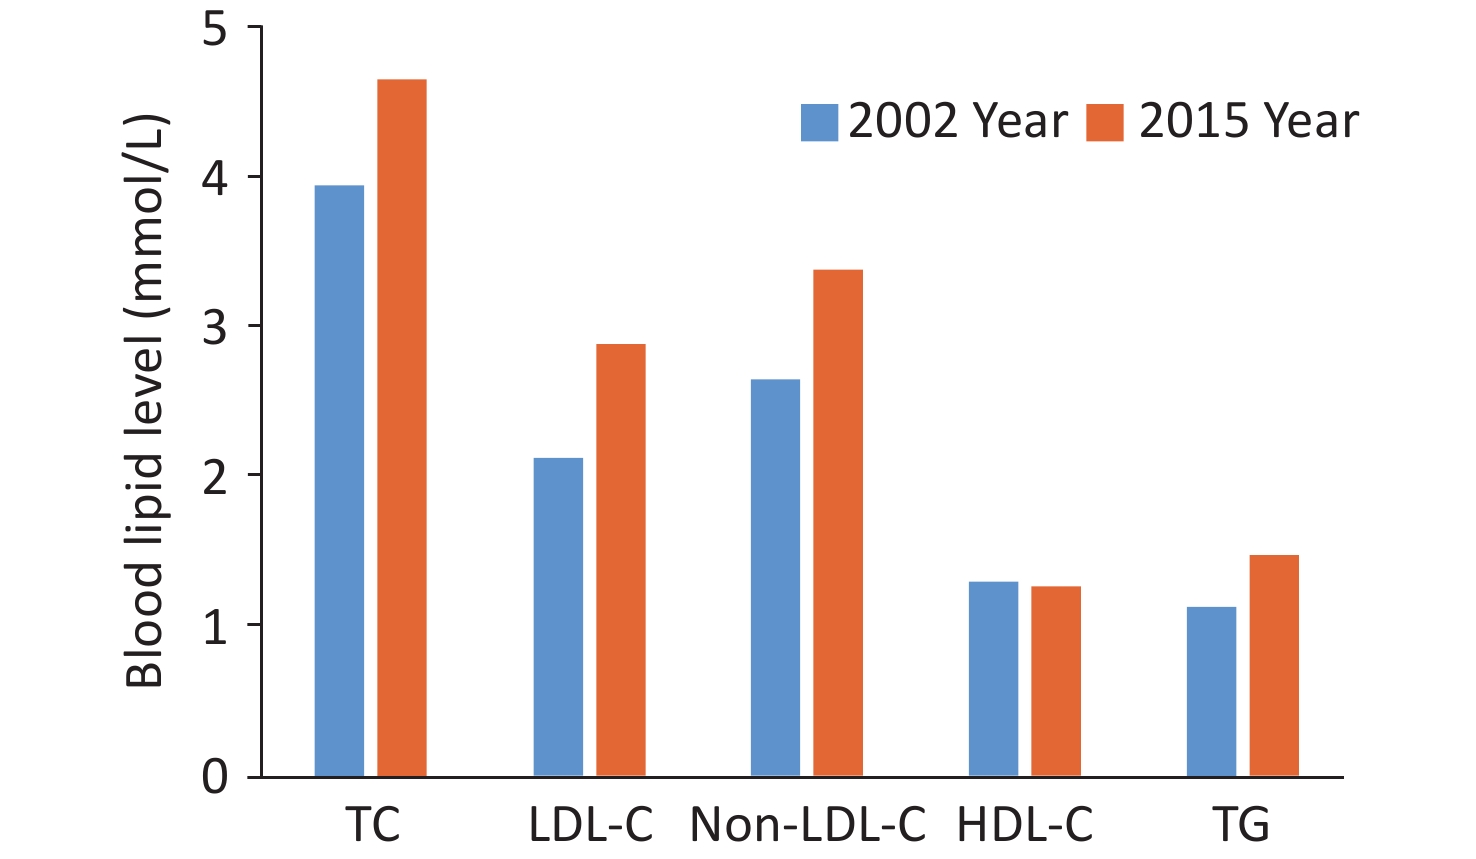
Figure 15. Comparison of blood lipid levels in Chinese adults aged ≥ 18 years in 2002 and 2015. TC, total cholesterol; LDL-C, low-density lipoprotein cholesterol; HDL-C, high-density lipoprotein cholesterol; TG, triglyceride.
From 2020 to 2022, the preliminary analysis results of the “Chinese Residents CVD and Its Risk Factors Surveillance” project, conducted across 262 surveillance sites in 31 provinces, autonomous regions, and municipalities directly under the Central Government, revealed that the awareness rate, treatment rate, and control rate of dyslipidemia among residents aged ≥ 18 years old (n = 275,961 individuals) in China were 11.7%, 10.1%, and 4.8% respectively; these values were higher than those recorded in the Chinese Chronic Disease Surveillance Project in 2010 (awareness rate 10.93%, treatment rate 6.84%, control rate 3.53%)[69].
From 2007 to 2008, the China Diabetes and Metabolic Disorders Study (CNDMDS) (n = 46,239, ≥ 20 years) conducted a survey on the population with hypercholesterolemia type of dyslipidemia, including adults with elevated (TC ≥ 6.22 mmol/L or LDL-C ≥ 4.14 mmol/L) or borderline elevated (TC: 5.18–6.21 mmol/L or LDL-C: 3.37–4.14 mmol/L) cholesterol or self-reported individuals taking cholesterol-lowering drugs. The results showed that the awareness rate, treatment rate, and control rate of hypercholesterolemia were all low, and these values were markedly lower in rural areas than in urban areas (Figure 16)[70].
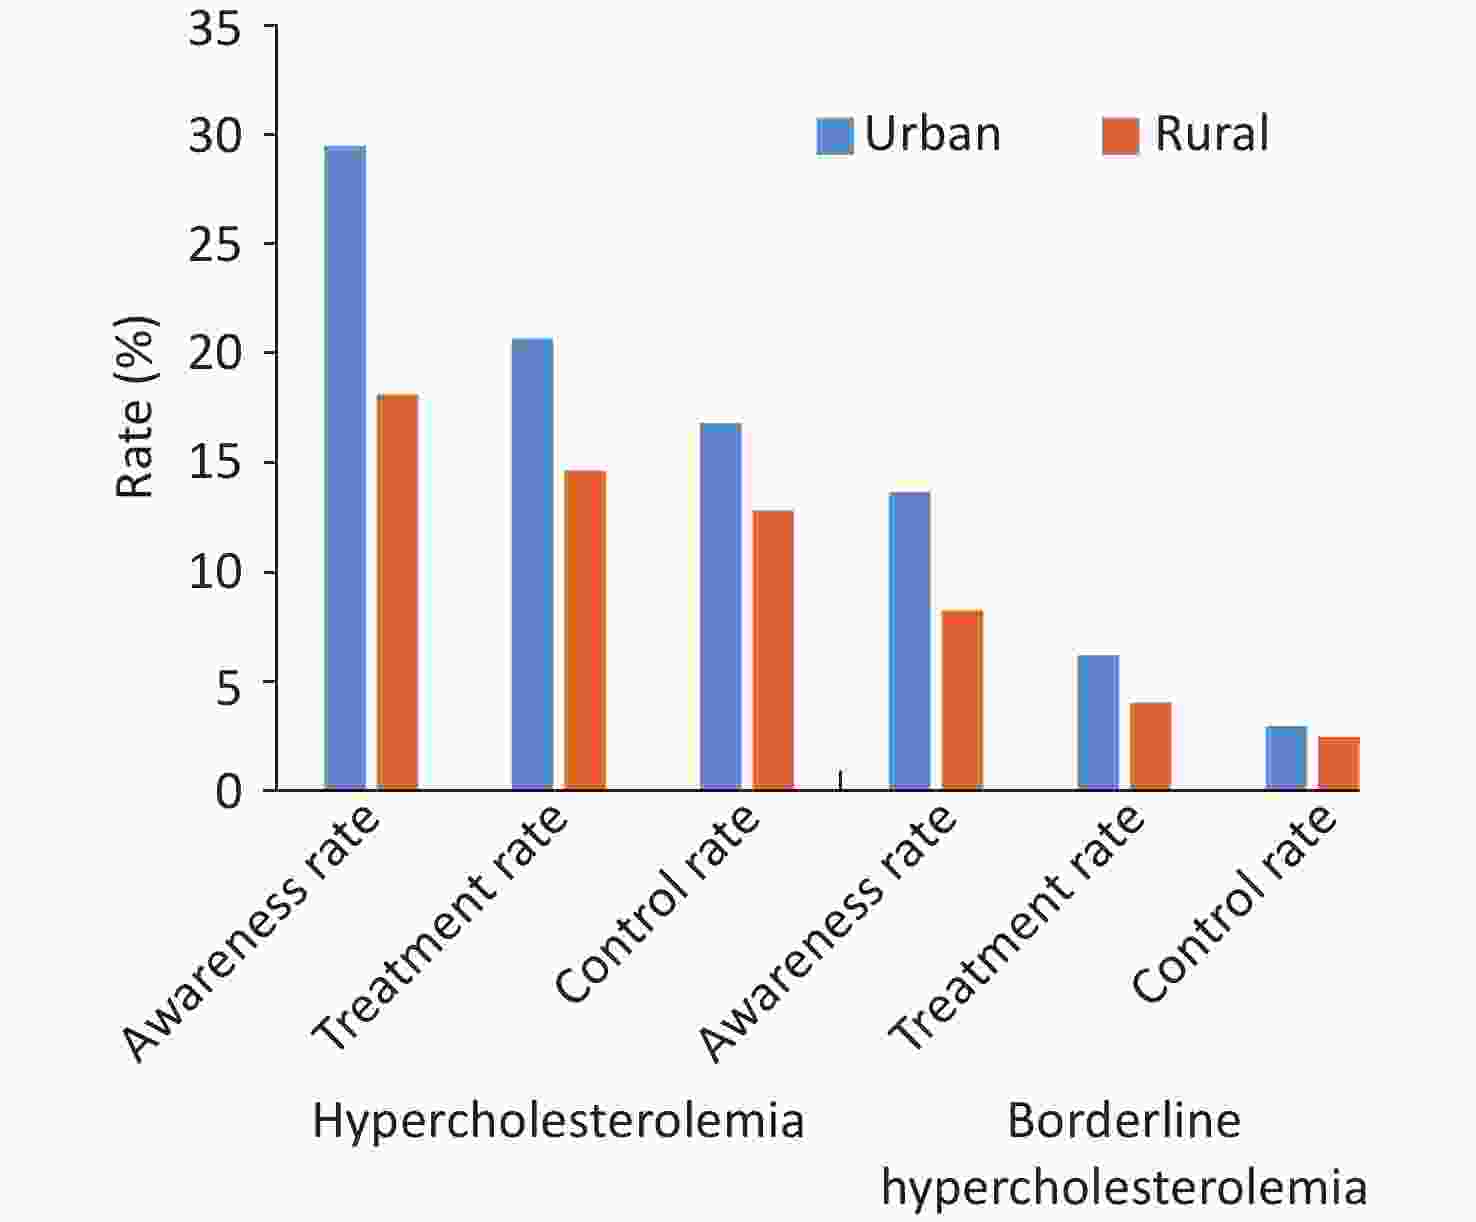
Figure 16. Awareness rate, treatment rate, and control rate of hypercholesterolemia in urban and rural residents in China from 2007 to 2008.
Based on the risk stratification defined by the 10-year atherosclerotic CVD (ASCVD) risk assessment process in the 2016 Chinese Guideline for the Management of Dyslipidemia in Adults (Revised version in 2016), the China-HEART survey identified 236,579 individuals (10.2% of the total population) at high risk for ASCVD over 10 years. The attainment rate for LDL-C < 2.6 mmol/L was 42.9%, whereas the treatment rate for those not meeting the target was only 4.5%. Among them, 71,785 individuals (3.2% of the total population) were at an extremely high risk of ASCVD, with an compliance rate of 26.6% for LDL-C < 1.8 mmol/L and a treatment compliance rate of 14.1%. The treatment compliance rate of LDL-C was 44.8%[62]. Patients with familial hypercholesterolemia (FH) are at high risk of ASCVD for life. The China-PEACE MPP project screened 1,383 patients with FH from among 1,059,936 subjects using the Chinese consensus standard. The treatment rate of LDL-C was only 18.1%, and no patient had LDL-C < 1.8 mmol/L[71].
The China Cardiovascular Care Improvement (CCC) project evaluated 80,282 patients registered in 192 hospitals across the country who were hospitalized for acute coronary syndrome (ACS). In patients with recurrent ACS, the lipid-lowering treatment rate at admission was 50.8%, and the compliance rate of LDL-C (< 1.8 mmol/L) was 36.1%; among them, the treatment rate of statins at admission was even lower among those aged ≥ 75 years (only 33.9%) and the compliance rate of LDL-C (< 1.8 mmol/L) was also lower (only 24.7%)[72,73].
The DYSIS II-China study included 1,103 inpatients with ACS from 28 tertiary hospitals in the cardiology department from September 2017 to May 2019. At the 6-month follow-up, the blood lipid levels of 752 patients who received lipid-lowering therapy were re-examined. The results showed that the compliance rate of LDL-C treatment (< 1.8 mmol/L) was 41.2%[74].
In the China-HEART cohort, simulating intensifying lipid-lowering therapy among individuals who had failed to reach the corresponding LDL-C targets showed that the use of atorvastatin 20 mg could enable more than 99% of the low- or moderate-risk population to reach the LDL-C target; 11.3% of the high-risk and 24.5% of the extremely high-risk warranted additional non-statin drugs for treatment. Following the additional use of ezetimibe, 4.8% of the high-risk and 11.3% of the extremely high-risk still needed evolocumab; 99% of the patients in these two groups could reach the LDL-C target after using evolocumab[75].
-
The prevalence of diabetes in the Chinese population has shown a markedly growing trend (Figure 17). From 2015 to 2017, a cross-sectional survey of 75,880 adults aged > 18 years in 31 provinces, autonomous regions, and municipalities indicated that, according to the World Health Organization (WHO) standard, the prevalence of diabetes was 11.2% (95% CI: 10.5%–11.9%), the detection rate of diabetes in early stages was 35.2% (95% CI: 33.5%–37.0%)[76]. Based on the American Diabetes Association diagnostic criteria, the prevalence of diabetes was 12.8% (95% CI: 12.0%–13.6%), of which the prevalence of previously diagnosed diabetes was 6.0% (95% CI: 5.4%–6.7%), and newly diagnosed diabetes was 6.8% (95% CI: 6.1%–7.4%). An estimated 129.8 million adults have diabetes in China (70.4 million males and 59.4 million females). The 2017 survey revealed that the awareness rate of diabetes in China was 43.3%, the treatment rate was 49.0%, and the control rate was 49.4%.
-
In 2011, among patients admitted to tertiary hospitals in China, diabetes-induced chronic kidney disease surpassed chronic glomerulonephritis for the first time and ranked first[77]. From August 2018 to June 2019, among 176,874 adults aged ≥ 18 years included in “The 6th National Surveillance on Chronic Diseases and Risk Factors” in 31 provinces, autonomous regions, and municipalities directly under the Central Government across the country, the prevalence rates of albuminuria and impaired renal function were 6.7% and 2.2%, respectively, and the total prevalence rate of chronic kidney disease was 8.2%[78], which was lower than 10.8% reported in 2009–2010[79].
According to the annual report of the China Kidney Network (CK-NET), among patients admitted to tertiary hospitals in China, the proportions of diabetic nephropathy, hypertensive nephropathy, and obstructive nephropathy in 2016 were 26.7%, 21.4%, and 16.0%, respectively, which were all higher than that of chronic glomerulonephritis (14.4%)[80].
From 2015 to 2019, the “Early Screening and Comprehensive Intervention Project for High-risk Groups of Cardiovascular Diseases” surveyed 269,026 adults aged ≥ 35 years across 31 provinces, autonomous regions, and municipalities directly under the Central Government. The prevalence rate of morning urine albumin-creatinine ratio (UACR) ≥ 30 mg/g was 8.75%, among which those with 30–300 mg/g accounted for 7.38% and those with UACR ≥ 300 mg/g accounted for 1.37%. Within the entire range of UACR, the risks of all-cause death, cardiovascular death, and CVD-specific death increased with increasing UACR levels. The risks of these deaths were substantially increased even at UACR levels within the traditionally considered normal range (< 30 mg/g) when compared with the risk at UACR < 5 mg/g.
-
In 2019, a survey of 107,650 residents over the age of 15 in 31 provinces, autonomous regions, and municipalities directly under the Central Government in China found that the age-standardized prevalence rate of sleep difficulties was 21.25%. Among them, 90.27% had difficulty falling asleep, and 75.70% had sleep interruption or early awakening[81]. In 2020, a meta-analysis of 13,920 patients with hypertension showed that the prevalence rate of sleep difficulties was 52.5% (95% CI: 46.1%–58.9%), which was substantially higher than the prevalence rate of sleep difficulties in healthy controls [32.5% (95% CI: 19.0%–49.7%), OR = 2.66 (95% CI: 1.80–3.93)][82].
-
A 2012 national epidemiological survey of mental disorders surveyed 32,552 individuals and found that the lifetime prevalence of depressive disorders was 6.8%, while the 12-month prevalence was 3.6%; the lifetime prevalence of anxiety disorders was 7.6%, while the 12-month prevalence was 5.0%[83]. A national study published in 2021 included a total of 47,841 individuals (≥ 45 years) covering 7 regions in China[84]. The Center for Epidemiologic Studies Depression Scale (CES-D) was used to assess depressive symptoms, and the Self-Rating Anxiety Scale (SAS) was used to assess anxiety symptoms. The prevalence rates of depressive and anxiety symptoms in patients with HF were 12.0% and 9.1% respectively, and 10.9% and 7.9% respectively in patients with stroke. The prevalence rates of depressive and anxiety symptoms in females with ≥ 3 kinds of CVDs were 9.7% and 7.3% respectively, and 6.3% and 3.5% respectively in males.
In a 2022 study of the CKB cohort, methods such as face-to-face screening and review with the WHO Composite International Diagnostic Interview Short Form (CIDI-SF) were used to determine symptoms of persistent anxiety and panic attacks[85]. Panic attacks increased the risk of new-onset CVD (HR = 1.08, 95% CI: 1.04–1.13), IHD (HR = 1.10, 95% CI: 1.02–1.19), hemorrhagic stroke (HR = 1.20, 95% CI: 1.05–1.38), and ischemic stroke (HR = 1.20, 95% CI: 1.11–1.30). Persistent anxiety was positively correlated with new-onset CVD (HR = 1.12, 95% CI: 1.04–1.20) and IHD (HR = 1.21, 95% CI: 1.07–1.37).
-
According to GBD data, the top two environmental factors affecting the health of the Chinese population are air pollution and inappropriate temperatures. In 2013 and 2019, inappropriate temperatures ranked eighth among the risk factors for disease death burden in China. In 2019, inappropriate temperatures resulted in 400,000 excess deaths due to CVD. In China, air pollution ranked third among the risk factors for disease-related deaths in 2013 and dropped to fourth in 2019. However, the number of excess deaths (1.842 million) remained high, and the number of excess deaths from CVD related to PM2.5 exposure was 1.140 million.
From 2000 to 2016, the number of deaths attributed to PM2.5 pollution in China reached 30.8 million. Since 2013, the total number of annual deaths due to PM2.5 exposure in China has shown a gradual downward trend.
From 2006 to 2017, a time-series study on the impact of high temperatures in summer on mortality conducted in 353 locations in China found that high-temperature events were associated with a 12.95% increase (95% CI: 12.82%–13.09%) in excess deaths from CVD[86]. An association study on the relationship between high-temperature heat waves and the risk of CVD death conducted in 272 cities in different regions of China from 2013 to 2015 found that the risk of total CVD and CHD deaths related to heat waves increased by 14% (RR = 1.14, 95% CI: 1.09–1.18) and 13% (RR = 1.13, 95% CI: 1.07–1.19), respectively[87].
From 2013 to 2015, a study assessing the relationship between low-temperature exposure and CVD death conducted in 272 cities in China found that, compared with the threshold temperature (the temperature with the lowest population mortality rate of 22.8 °C), the risk of CVD death increased during low-temperature cold wave exposure (RR = 1.92, 95% CI: 1.75–2.10)[88]. A case-control study conducted across 15 cities in China found that 15.8% (95% CI: 13.1–17.9%) of CVD deaths (305,902 deaths) could be attributed to low-temperature exposure[89].
The Report on the State of the Ecology and Environment in China showed that among 339 prefecture-level and above cities across the country, the outdoor air quality of 218 cities met the standards in 2021, with a compliance rate of 64.3%, an increase of 3.5% when compared with that recorded in 2020. The levels of six major air pollutants (PM2.5, PM10, sulfur dioxide, nitrogen dioxide, carbon monoxide, and ozone) were reduced when compared with those recorded in 2020 (Figure 18)[90].
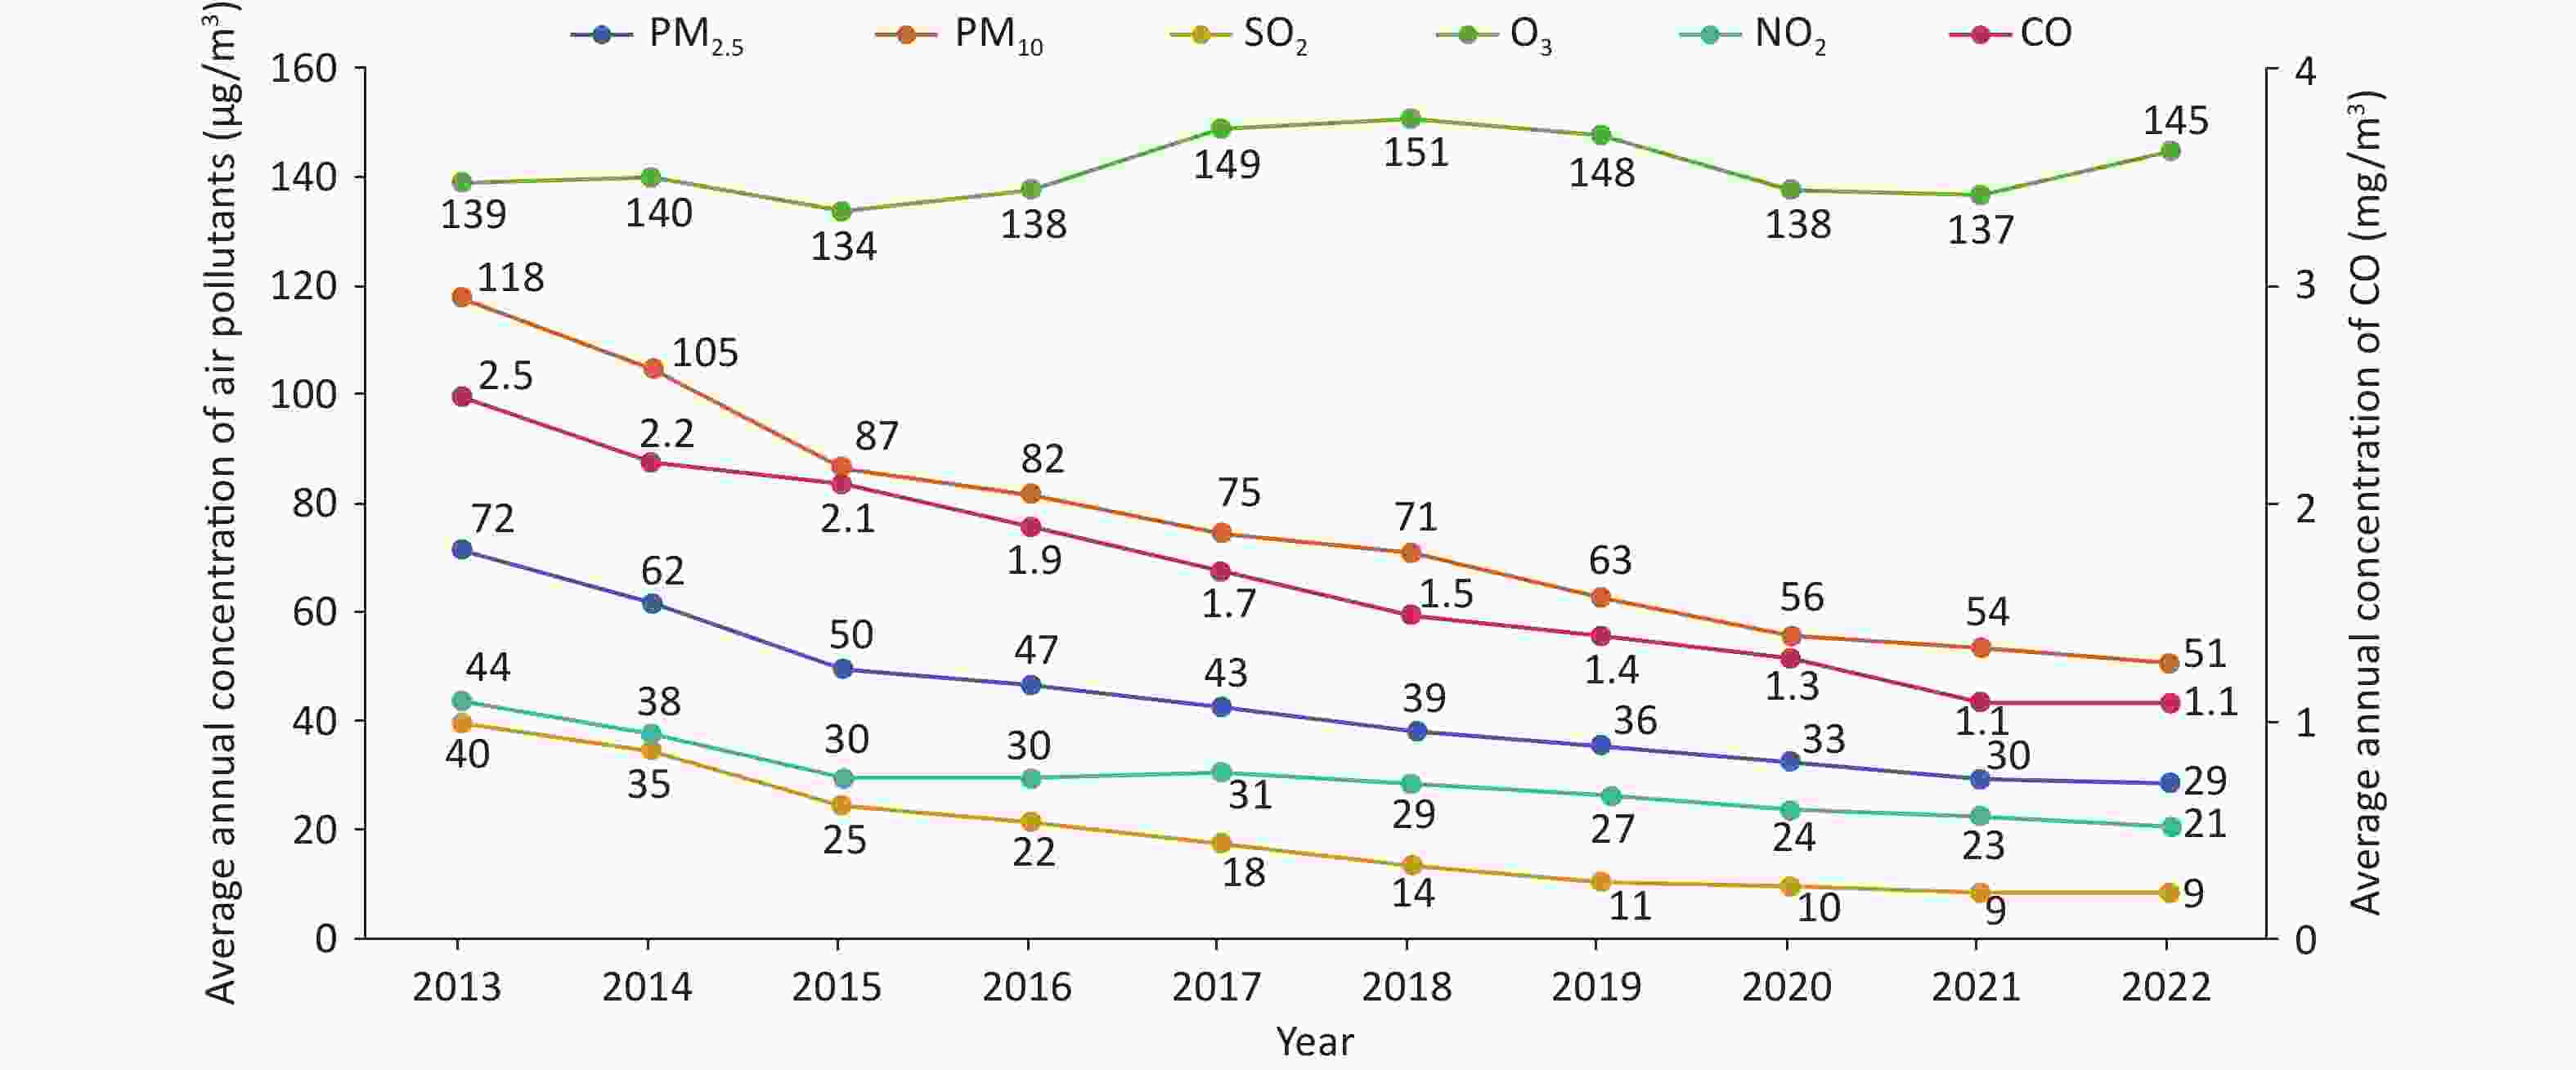
Figure 18. Trends of six major air pollutants from 2013 to 2022. SO2, sulfur dioxide; O3, ozone; NO2, nitrogen dioxide; CO, carbon monoxide.
According to a prospective cohort study assessing 226,000 urban residents in China, cooking with solid fuels markedly increased the risks of cardiopulmonary diseases and all-cause mortality among residents. Compared with residents who have persistently cooked with clean fuels, residents cooking with solid fuels had increased risks of all-cause death, CVD death, and respiratory disease death by 19% (95% CI: 10%–28%), 24% (95% CI: 10%–39%), and 43% (95% CI: 10%–85%), respectively[91-92]. Moreover, studies have shown that the use of clean energy and stove upgrades can reduce the risk of premature death caused by cardiopulmonary diseases among residents[93].
According to the CHS sub-cohort data, residents using solid fuels for heating have a 44% (HR = 1.44, 95% CI: 1.00–2.08) and 55% (HR = 1.55, 95% CI: 1.10–2.17) increased risk of stroke and all-cause death, respectively, compared with residents using clean fuels for heating[94].
-
The Hospital Quality Monitoring System (HQMS) data[95] comprises a total of 51.948 million inpatients with CVD in the discharge diagnosis from January 1, 2022 to December 31, 2022. Among them, there were 12.462 million patients whose main discharge diagnosis was CVD (hospitalized with CVD as the main reason), with 68.6% admitted to tertiary hospitals. There were 39.486 million patients whose other discharge diagnoses contained CVD (hospitalized with non-CVD as the main reason), with 68.0% admitted to tertiary hospitals (Figure 19). In 2022, there were a total of 5,648 hospitals that treated inpatients with CVD (2,169 tertiary hospitals and 3,479 secondary hospitals, excluding military hospitals).
-
The HQMS data[95] revealed that in 2022, 5,000 hospitals treated inpatients with hypertension (whose main or other discharge diagnoses included hypertension and were aged ≥ 18 years), accounting for 88.5% of the number of hospitals treating inpatients with CVD in HQMS. Among them, there were 1,921 tertiary hospitals and 3,079 secondary hospitals. A total of 35.243 million inpatients with hypertension were treated, accounting for 68.4% of inpatients with CVD. A total of 1.303 million patients had a main discharge diagnosis of hypertension, and the average age of inpatients whose main discharge diagnosis was hypertension was (61.8 ± 15.1) years, with 50.2% being female. Considering patients whose other discharge diagnoses included hypertension, the average age was (66.6 ± 12.4) years, with 46.1% being female. The top three comorbidities of inpatients with hypertension were cerebrovascular diseases, CHD, and diabetes, accounting for 32.7%, 30.5%, and 28.4%, respectively. Among inpatients with CVD, there were 755,000 patients with secondary hypertension, accounting for 2.1% of inpatients with hypertension. The top three causes of secondary hypertension were renal parenchymal hypertension, obstructive sleep apnea syndrome (OSAS), and renovascular hypertension, accounting for 48.15%, 28.49%, and 10.89%, respectively (Figure 20A). Among 82,000 patients with renovascular hypertension, 7.9% had a clear cause diagnosis, among which atherosclerosis accounted for 6.4%, Takayasu arteritis accounted for 1.4%, and fibromuscular dysplasia accounted for 0.1% (Figure 20B). In 2022, the inpatient mortality rate of patients whose main discharge diagnosis was hypertension was 0.2%, and the non-rehabilitation discharge rate (discharge methods were inpatient death or non-medical advice discharge) was 3.8%.
-
The HQMS data[95] showed that in 2022, 4,961 hospitals treated inpatients with CHD (whose main discharge diagnosis was CHD and whose age was ≥ 18 years), accounting for 87.8% of the number of hospitals treating inpatients with CVD in HQMS. Among them, there were 1,886 tertiary hospitals and 3,075 secondary hospitals. The above-mentioned hospitals treated a total of 6.127 million inpatients with CHD, including 4.195 million in tertiary hospitals and 1.932 million in secondary hospitals. Among the main discharge diagnoses of inpatients with CHD, the top three were unstable angina pectoris, unclassified CHD, and stable angina pectoris, accounting for 38.1%, 28.0%, and 15.3%, respectively (Figure 21A). Among inpatients with CHD, the proportion of those with hypertension was the highest (60.9%), followed by diabetes (26.3%) and atrial fibrillation or atrial flutter (19.1%), as shown in Figure 21B.
-
In 2022, a total of 1.034 million patients with AMI were admitted. Among them, ST-segment elevation myocardial infarction (STEMI) accounted for 47.4%, non-ST-segment elevation myocardial infarction (NSTEMI) accounted for 41.1%, and unclassified AMI accounted for 11.5%. Among inpatients with AMI, 7.8% were complicated with cardiogenic shock, 2.3% were complicated with cardiac arrest, and 2.2% were complicated with ventricular tachycardia (Figure 22A). The in-hospital mortality rate of patients with AMI was 4.3%, and the non-rehabilitation discharge rate was 13.4%.
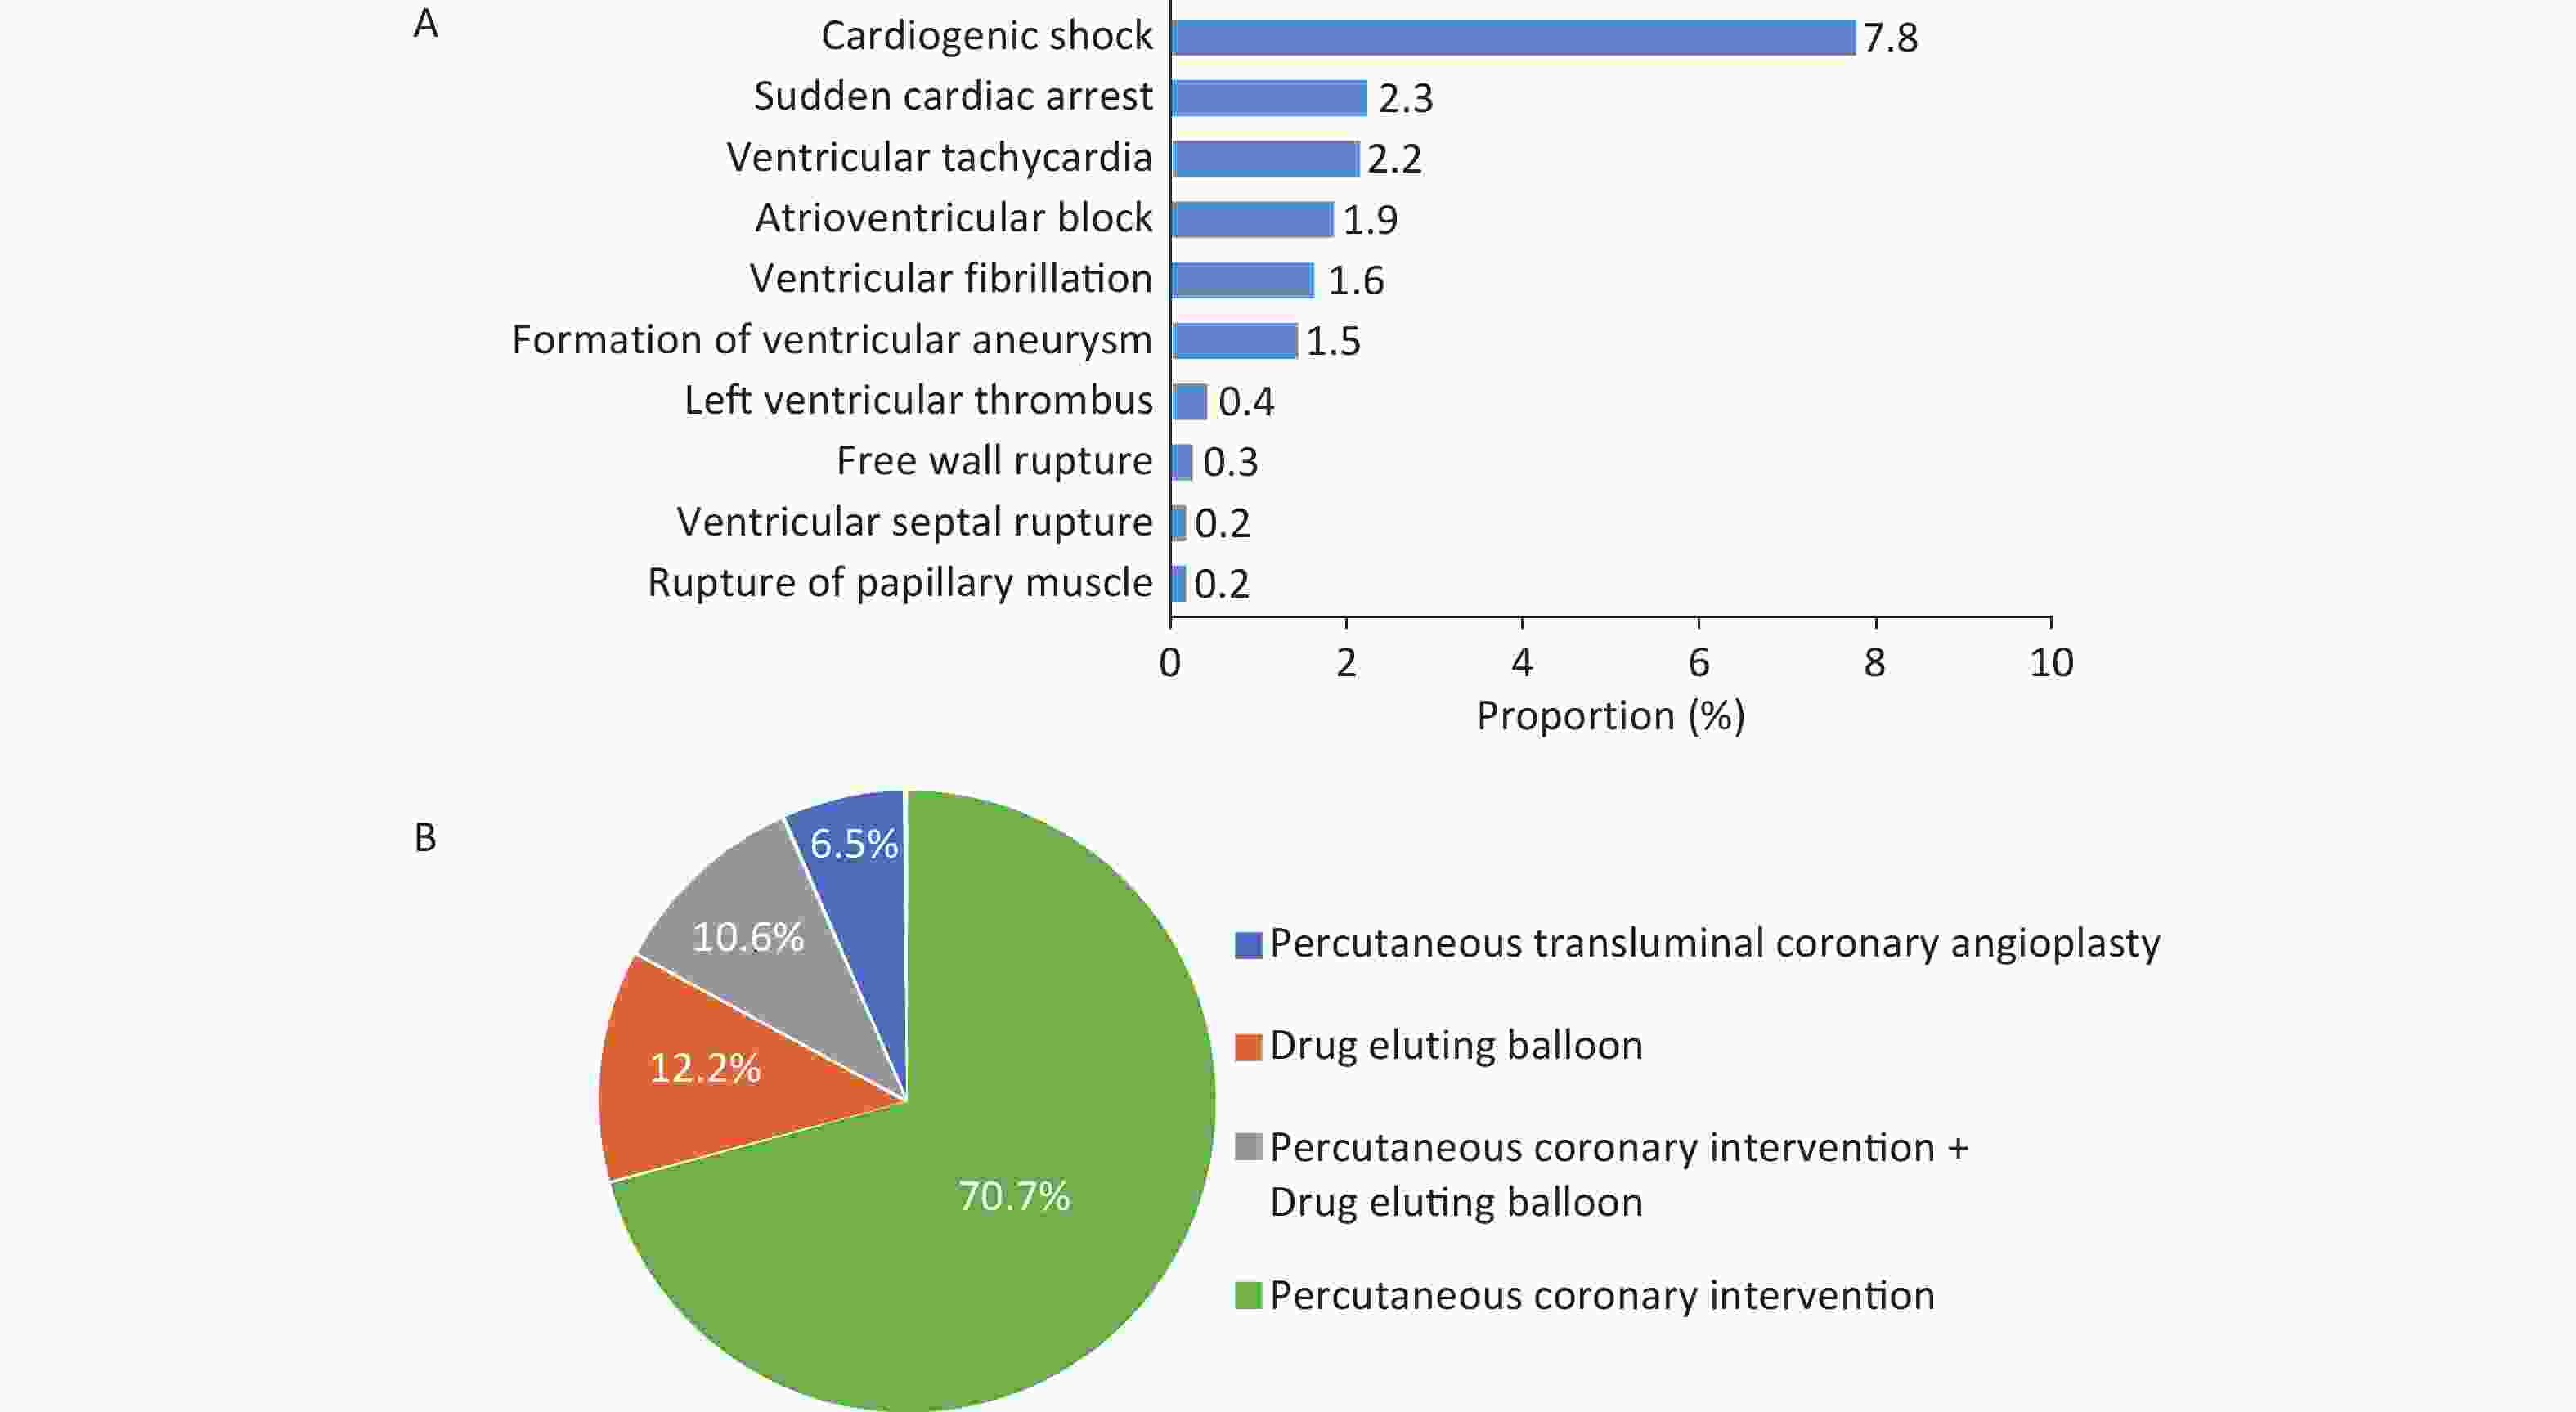
Figure 22. Incidence of complications in hospitalized patients with AMI (A) and proportion of types of interventional therapy in patients with CHD undergoing coronary intervention (B). CHD, coronary heart disease; AMI, acute myocardial infarction.
In 2022, 1.421 million patients underwent PCI, accounting for 23.2% of the total number of inpatients with CHD. A total of 1.539 million patients underwent simple coronary angiography, accounting for 25.1% of the total number of inpatients with CHD. Among inpatients with CHD who received interventional therapy, 12.2% received drug-eluting balloons, and 10.6% received simultaneous PCI and drug-eluting balloons (Figure 22B).
Among inpatients with CHD who received interventional treatment, 8.1% of patients underwent intravascular ultrasound of coronary arteries, 1.5% underwent optical coherence tomography, and 1.0% underwent intravascular pressure measurement of coronary arteries or coronary flow reserve fraction/quantitative flow ratio. The inpatient mortality rate of patients who underwent PCI was 0.7%, and the non-rehabilitation discharge rate was 2.7%. The inpatient mortality rate of patients undergoing simple coronary angiography was 0.2%, and the non-rehabilitation discharge rate was 2.9%.
In 2022, a total of 571 hospitals performed at least one CABG, with a total of 49,000 surgical cases, among which 45,000 cases were simple CABGs. There were 124 hospitals with an annual surgical volume of more than 50 cases, and 35 hospitals with an annual surgical volume exceeding 500 cases completed 61.0% of the surgeries. Among patients undergoing CABG, 74.9% were aged 55–74 years, and 8.3% were patients aged ≥ 75 years. Among the patients undergoing CABG, the proportion of patients with hypertension was the highest (61.7%), the proportion of patients with diabetes was 38.3%, and the proportion of patients with stroke was 29.8%. The proportions of patients with liver diseases, previous PCI, chronic obstructive pulmonary disease, kidney diseases, secondary surgeries, and malignant tumors were 14.0%, 11.7%, 8.9%, 6.4%, 1.0%, and 0.9%, respectively.
In 2022, the scale ratio of PCI to CABG among inpatients with CHD was 28.8 : 1.0. The ratios and the number of PCIs in different provinces, autonomous regions, and municipalities directly under the Central Government in China are shown in Figure 23. The inpatient mortality rate of patients with simple CABG was 1.4%, and the non-rehabilitation discharge rate was 2.9%.
-
A retrospective cohort study included 21,866 patients with isolated CABG to evaluate the impact of different surgical scheduling sequences on the prognosis of patients. Based on the findings, the scheduling sequence of on-pump CABG was not substantially associated with the prognosis of patients, whereas for off-pump CABG, when the surgeon was not performing the first operation of the day, the risk of composite adverse events [in-hospital death, myocardial infarction, stroke, acute kidney injury (AKI), reoperation] in patients increased by 29%[96].
The Medical Priority Dispatch System (MPDS) is one of the most widely used types of emergency dispatch systems. A retrospective study analyzed the impact of using and not using MPDS on the emergency medical service system (EMS) in treating patients with ACS. The research data comprised 9,806 patients with ACS from 43 EMS centers in China from January 1, 2016 to December 31, 2020. Upon multivariate logistic regression and propensity score matching analyses, the overall diagnostic consistency of patients in centers using MPDS was higher than that in the centers not using MPDS; the use of MPDS shortened the time from calling EMS to arrival[97].
-
The HQMS data[95] showed that in 2022, there were 5,481 hospitals providing arrhythmia diagnosis and treatment services, accounting for 96.8% of the hospitals providing CVD diagnosis and treatment services in HQMS. Among them, 3,348 were tertiary hospitals, accounting for 61.1%, and 2,133 were secondary hospitals, accounting for 38.9%.
In 2022, there were 8.32 million inpatients with arrhythmia (whose main discharge diagnosis or other discharge diagnoses included arrhythmia), and the top three disease types were atrial fibrillation/atrial flutter, atrial premature contractions, and ventricular premature contractions, accounting for 33.4%, 14.2%, and 13.9%, respectively (Figure 24).
Overall, there were more male patients with arrhythmia, although there were differences among different types of arrhythmia. Some diseases showed notable sex-based differences. For example, in Brugada syndrome, the ratio of male to female was as high as 6.3 : 1.0, while in long QT interval syndrome, the ratio of male to female was 1.0 : 1.6 (Figure 25). Patients aged ≤ 40 years accounted for 55.6%, and the age distribution also differed between different diseases (Figure 26).
-
In inpatients with arrhythmias, approximately 233,000 ablation surgeries for various arrhythmias were performed, accounting for 2.8% of the total inpatient visits of patients with arrhythmias. Medical catheter ablation accounts for 96.6%, and the number of surgeries is on an increasing trend. More than 13,000 left atrial appendage occlusions and more than 120,000 pacemaker implantations were performed.
-
A total of 141,000 ablation surgeries were performed, including 126,000 radiofrequency catheter ablations, over 7,680 cryoablations, 6,556 surgical ablations, and 703 minimally invasive ablations under surgical thoracoscopy. More than 13,000 cases of left atrial appendage occlusion were performed, which was slightly decreased compared with 2021. Among them, the “ablation + occlusion” one-stop surgeries accounted for 56.0%. The in-hospital mortality rate and non-rehabilitation discharge rate (discharge methods were in-hospital death or discharge against medical advice) in patients with atrial fibrillation (whose main discharge diagnosis or other diagnoses included atrial fibrillation) who received left atrial appendage occlusion were 0.2% and 0.6%, respectively. The in-hospital mortality and non-rehabilitation discharge rates among patients with atrial fibrillation who received medical radiofrequency catheter ablation treatment were 0.1% and 0.5%, respectively.
-
Among inpatients whose main discharge diagnosis or other discharge diagnoses included ventricular tachycardia, 6.5% of the patients received surgical treatment. Among patients who received surgical treatment, the majority underwent catheter ablation surgery, accounting for 68.1%. Among the 22,000 patients with the main diagnosis of ventricular tachycardia (including those treated with medication only), the in-hospital mortality and the non-rehabilitation discharge rates were 0.6 and 7.7%, respectively.
-
In 2022, the total number of pacemaker implantations exceeded 120,000. Among them, the implantation of ordinary pacemakers accounted for 87.9% of all patients receiving pacemaker implantations. There were 1,488 cases of electrode removal and approximately 2,554 cases of diagnosed pacemaker infections. The implantation numbers of implantable cardioverter defibrillator (ICD) and cardiac resynchronization therapy (CRT) showed a slow growth, while the number of His-Purkinje system pacing increased rapidly. The clinical outcomes of inpatients who received different types of pacemaker implantations were different. The in-hospital mortality rate and non-rehabilitation discharge rates of patients who underwent ICD implantations were 0.2% and 1.0%, respectively, and those of patients who underwent ordinary pacemaker implantations were 1.1% and 3.5%, respectively.
-
Syncope is a common clinical symptom of arrhythmia. In 2022, there were 158,000 inpatients whose main diagnosis and other diagnoses included syncope. Among them, 48.0% of the patients had no clear cause at discharge (Figure 27). Among the patients with a clear cause, the leading cause was vasovagal syncope (57.7%), followed by cardiogenic syncope (38.8%).
-
According to the HQMS data[95], 5,129 hospitals admitted patients with valvular heart disease in 2022, accounting for 90.8% of the hospitals that admitted patients with CVD in HQMS. Among them, there were 2,069 tertiary hospitals and 3,060 secondary hospitals. Overall, these hospitals admitted 1.882 million patients with valvular heart disease (whose discharge diagnosis included valvular heart disease). Among them, the number of patients with mitral valve disease was the largest, at 980,000, accounting for 45.4%, followed by tricuspid valve disease (28.5%), aortic valve disease (24.3%), and pulmonary valve disease (1.8%).
Among inpatients with valvular heart disease, 45.0% were female, and the average age of the patients was (60.7 ± 16.3) years. Among the comorbidities of inpatients with valvular heart disease, HF, hypertension, and CHD ranked in the top three, accounting for 46.8%, 43.0%, and 33.0%, respectively (Figure 28).
-
Surgical aortic valve replacement (SAVR): In 2022, a total of 9,961 cases of simple SAVR were performed. Among patients who underwent simple SAVR, the usage rate of biological valves was 44.3%, with older patients mostly selecting the use of biological valves (Figure 29). The in-hospital mortality rate of simple SAVR was 1.0%, and the non-rehabilitation discharge rate was 2.2%.

Figure 29. The proportion of valve types in patients of different age groups undergoing simple surgical aortic valve replacement.
Transcatheter aortic valve replacement (TAVR): In 2022, there were a total of 8,068 inpatients who underwent TAVR, which was close to SAVR (9,961 cases) (Figure 30A), among which 41.2% were female. The age distribution of patients who underwent TAVR is shown in Figure 30B. The overall surgical prognosis of patients who underwent TAVR was good, with an in-hospital mortality rate of 1.9% and a non-rehabilitation discharge rate of 3.7%.
-
Simple mitral valve surgery: In 2022, a total of 24,000 simple mitral valve surgeries were performed, among which 31.6% were mitral valvuloplasty and 68.4% were mitral valve replacement. Upon assessing different age groups, the proportion of patients undergoing mitral valvuloplasty showed a downward trend with increasing age, and the proportion of patients receiving mitral valve replacement showed an upward trend (the proportion of patients receiving mitral valvuloplasty was 40.3% for those aged < 18 years and 2.1% for those aged ≥ 85 years). Among the patients undergoing simple mitral valve replacement, the rate of bioprosthetic usage was 42.0%. With increasing age, the proportion of mechanical valve usage showed a downward trend, and the proportion of bioprosthetic valves showed an upward trend (the proportion of choosing mechanical valves was 84.0% for those aged < 18 years, and 8.3% for those aged ≥ 85 years, Figure 31). The in-hospital mortality rate of patients with simple mitral valve surgery was 1.2%, and the non-rehabilitation discharge rate (discharge methods were in-hospital death or discharge against medical advice) was 2.9%.

Figure 31. Proportion of mitral valvuloplasty and replacement in patients of different age groups (A) and proportion of valve types (B).
Mitral valve intervention surgery: In 2022, a total of 1,773 mitral valve intervention surgeries were performed in China. Among them, mitral valve clamping accounted for the highest proportion (49.7%). The in-hospital mortality rate of mitral valve intervention surgery was 0.8%, and the non-rehabilitation discharge rate was 2.0%.
-
Tricuspid valve surgery: In 2022, a total of 36,000 tricuspid valve replacement or valvuloplasty surgeries were performed, mainly as combined surgeries for left heart system diseases or congenital heart diseases. Patients over 45 years old accounted for 78.9%, and males accounted for 45.2%. The non-rehabilitation discharge rate of patients undergoing tricuspid valve surgery was 5.0%. Tricuspid valve intervention surgery: In 2022, a total of 133 tricuspid valve intervention surgeries were performed, among which females accounted for 63.2%. The in-hospital mortality rate of tricuspid valve intervention surgery was 0.8%, and the non-rehabilitation discharge rate was 1.5%.
-
Pulmonary valve surgery: In 2022, a total of 903 pulmonary valve surgical replacements or valvuloplasty were performed. Among them, 464 (51.4%) patients were under 18 years, with males accounting for 47.3%. The non-rehabilitation discharge rate was 5.3%. Pulmonary valve intervention surgery: In 2022, a total of 560 pulmonary valve intervention surgeries were performed, with females accounting for 50.7%. The in-hospital mortality rate of pulmonary valve intervention surgery was 1.1%, and the non-rehabilitation discharge rate was 3.4%.
-
According to HQMS data[95], in 2022, 5,402 hospitals admitted patients with HF (hospitals where HF was included in the main discharge diagnosis or other diagnoses and the age was ≥ 18 years old), accounting for 95.6% of the number of hospitals that admitted patients with CVD in HQMS. Among them, 2,078 and 3,324 were tertiary and secondary hospitals, respectively. The above hospitals admitted a total of 10,290 million inpatients with HF, with tertiary and secondary hospitals accounting for 61.0 and 39.0% of admitted patients, respectively.
In total, 31.0% of patients with HF were admitted through the emergency department, 65.7% were admitted through the outpatient department, and 3.3% were admitted through other channels (such as transfer from other hospitals). The average age of inpatients with HF was (71.0 ± 12.7) years, with females accounting for 44.6%. The proportion of inpatients with HF complicated with CHD was 68.9%, the proportion complicated with hypertension was 58.6%, and the proportion complicated with stroke was 34.2% (Figure 32A). Among inpatients with HF, 2.5% of patients received mechanical ventilation during hospitalization, 0.3% underwent hemofiltration, and 0.2% were treated with intra-aortic balloon counterpulsation (Figure 32B). The in-hospital mortality rate of patients with HF was 2.6%. The non-rehabilitation discharge (discharge method is in-hospital death or discharge against medical advice) and 30-day readmission rates were 10.2% and 10.0%, respectively.

Figure 32. Comorbidities in patients with HF (A) and proportion of surgeries and procedures performed during hospitalization (B). HF, heart failure; COPD, chronic obstructive pulmonary disease; IABP, intra-aortic balloon pump; CRT, cardiac resynchronization therapy; ICD, implantable cardioverter-defibrillator; ECMO, extracorporeal membrane oxygenation.
Analysis of 41,708 hospitalized patients with HF with preserved ejection fraction (HFpEF) from January 2017 to June 2021 revealed that ischemia (26.6%), infection (14.4%), and arrhythmia (10.5%) were the three most common inducing factors for hospitalization in patients with HF. Additionally, 67.4% of patients have three or more comorbidities. Hypertension (65.2%), CHD (60.3%), and atrial fibrillation (41.2%) were identified as the three most common comorbidities in Chinese patients with HFpEF[98].
The second phase study of the China Heart Failure Registry (China-HF) assessed 34,938 hospitalized patients with HF from 113 hospitals, revealing that the standardized treatment rate of HF drugs in China has substantially improved when compared with the results of the first-phase China-HF[99] (Figure 33).
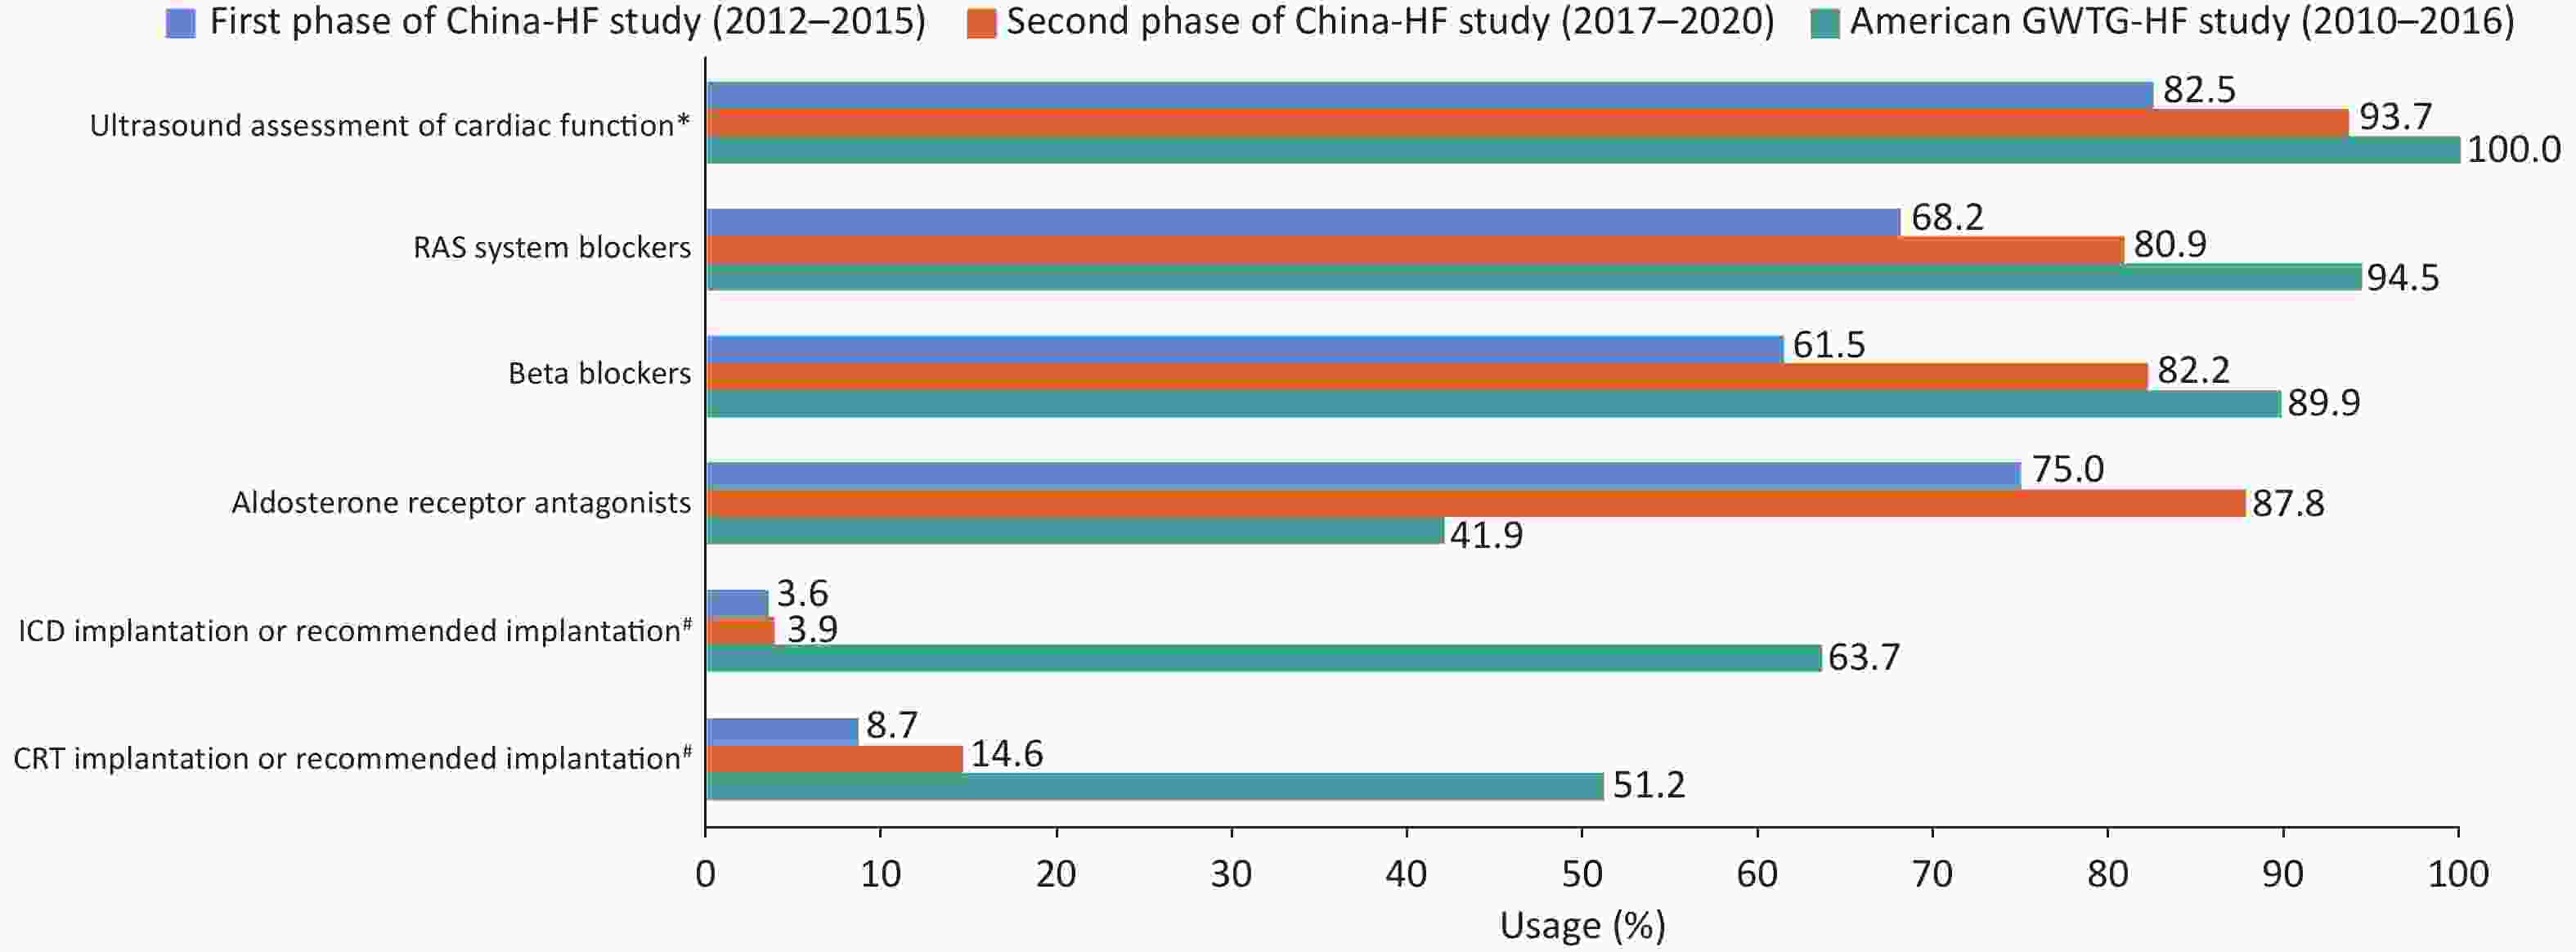
Figure 33. Comparison of the standardized treatment of HF between the China-HF study and the American GWTG-HF study. China-HF study, China Heart Failure Registry Study; GWTG-HF study, Get with the Guidelines-Heart Failure Registry Study; RAS, renin-angiotensin system; ICD, Implantable cardioverter-defibrillator; CRT, cardiac resynchronization therapy; LVEF, left ventricular ejection fraction. *In the GWTG-HF study, patients with missing LVEF data were excluded during enrollment. Therefore, the rate of ultrasound assessment of cardiac function in the GWTG-HF study is 100%. #In the China-HF study, this value refers to the implantation rate of ICD/CRT, while in the GWTG-HF study, it refers to the implantation or recommended implantation rate of ICD/CRT.
Since the implantation of the first long-term left ventricular assist device in June 2017, a total of 85 hospitals in China have performed 515 left ventricular assist device implantations. As of December 2023, Fuwai Hospital, Chinese Academy of Medical Sciences, has completed 110 implantation procedures involving three types of long-term left ventricular assist devices, including 20 cases of EVAHEARTI, 54 cases of CH-VAD, and 36 cases of CorHeart 6. Seven cases (6.4%) were transitioned to heart transplantation, five cases (4.5%) had the device removed due to recovery of heart function, and 85 cases (77%) had long-term survival. The longest survival time with the pump was 2,360 days (6.5 years), and the average carrying time was 728 days.
According to the data of the Chinese Heart Transplant Registry System, from 2015 to 2022, the annual surgical volume of heart transplantation reported by various transplantation centers in Chinese mainland was 279, 368, 446, 490, 679, 557, 738, and 710 cases, respectively. A total of 4,267 cases were completed and reported in eight years.
In 2022, among Chinese heart transplant recipients, non-ischemic cardiomyopathy accounted for 76.2%; among child heart transplant recipients, non-ischemic cardiomyopathy accounted for 13.4%. In 2022, the in-hospital survival rate of Chinese heart transplant recipients was 92.1%. Multiple organ failure and transplant HF accounted for about 40% of the early causes of death. From 2015 to 2022, the one-year survival rate after heart transplantation was 81.4% in China, while the three-year survival rate was 76.1%. Among them, the one- and three-year survival rates after heart transplantation were 80.8% and 75.6% in adults, and 87.2% and 81.3% in children, respectively.
-
According to the HQMS data[95], 4,947 hospitals admitted and diagnosed patients with congenital heart disease in 2022, accounting for 87.6% of the total hospitals providing CVD diagnosis and treatment services in HQMS. Among them, 2,059 were tertiary hospitals, accounting for 94.9%, and 2,888 were secondary hospitals, accounting for 83.0%.
In 2022, the above hospitals treated a total of 1.508 million inpatients with diagnoses including congenital heart disease. Among them, 57.0% were diagnosed with atrial septal defect/patent foramen ovale, 14.1% with patent ductus arteriosus, 5.8% with ventricular septal defect, 1.3% with aortic coarctation, 0.4% with endocardial cushion defect, and 0.3% with tetralogy of Fallot (Figure 34A). Among inpatients with congenital heart disease in 2022, patients in the neonatal and infantile periods (hospitalized age < 1 year) accounted for 38.95%, patients aged 1 to 17 years (1 year ≤ hospitalized age < 18 years) accounted for 7.57%, and adults (hospitalized age ≥ 18 years) accounted for 53.48% (Figure 34B).
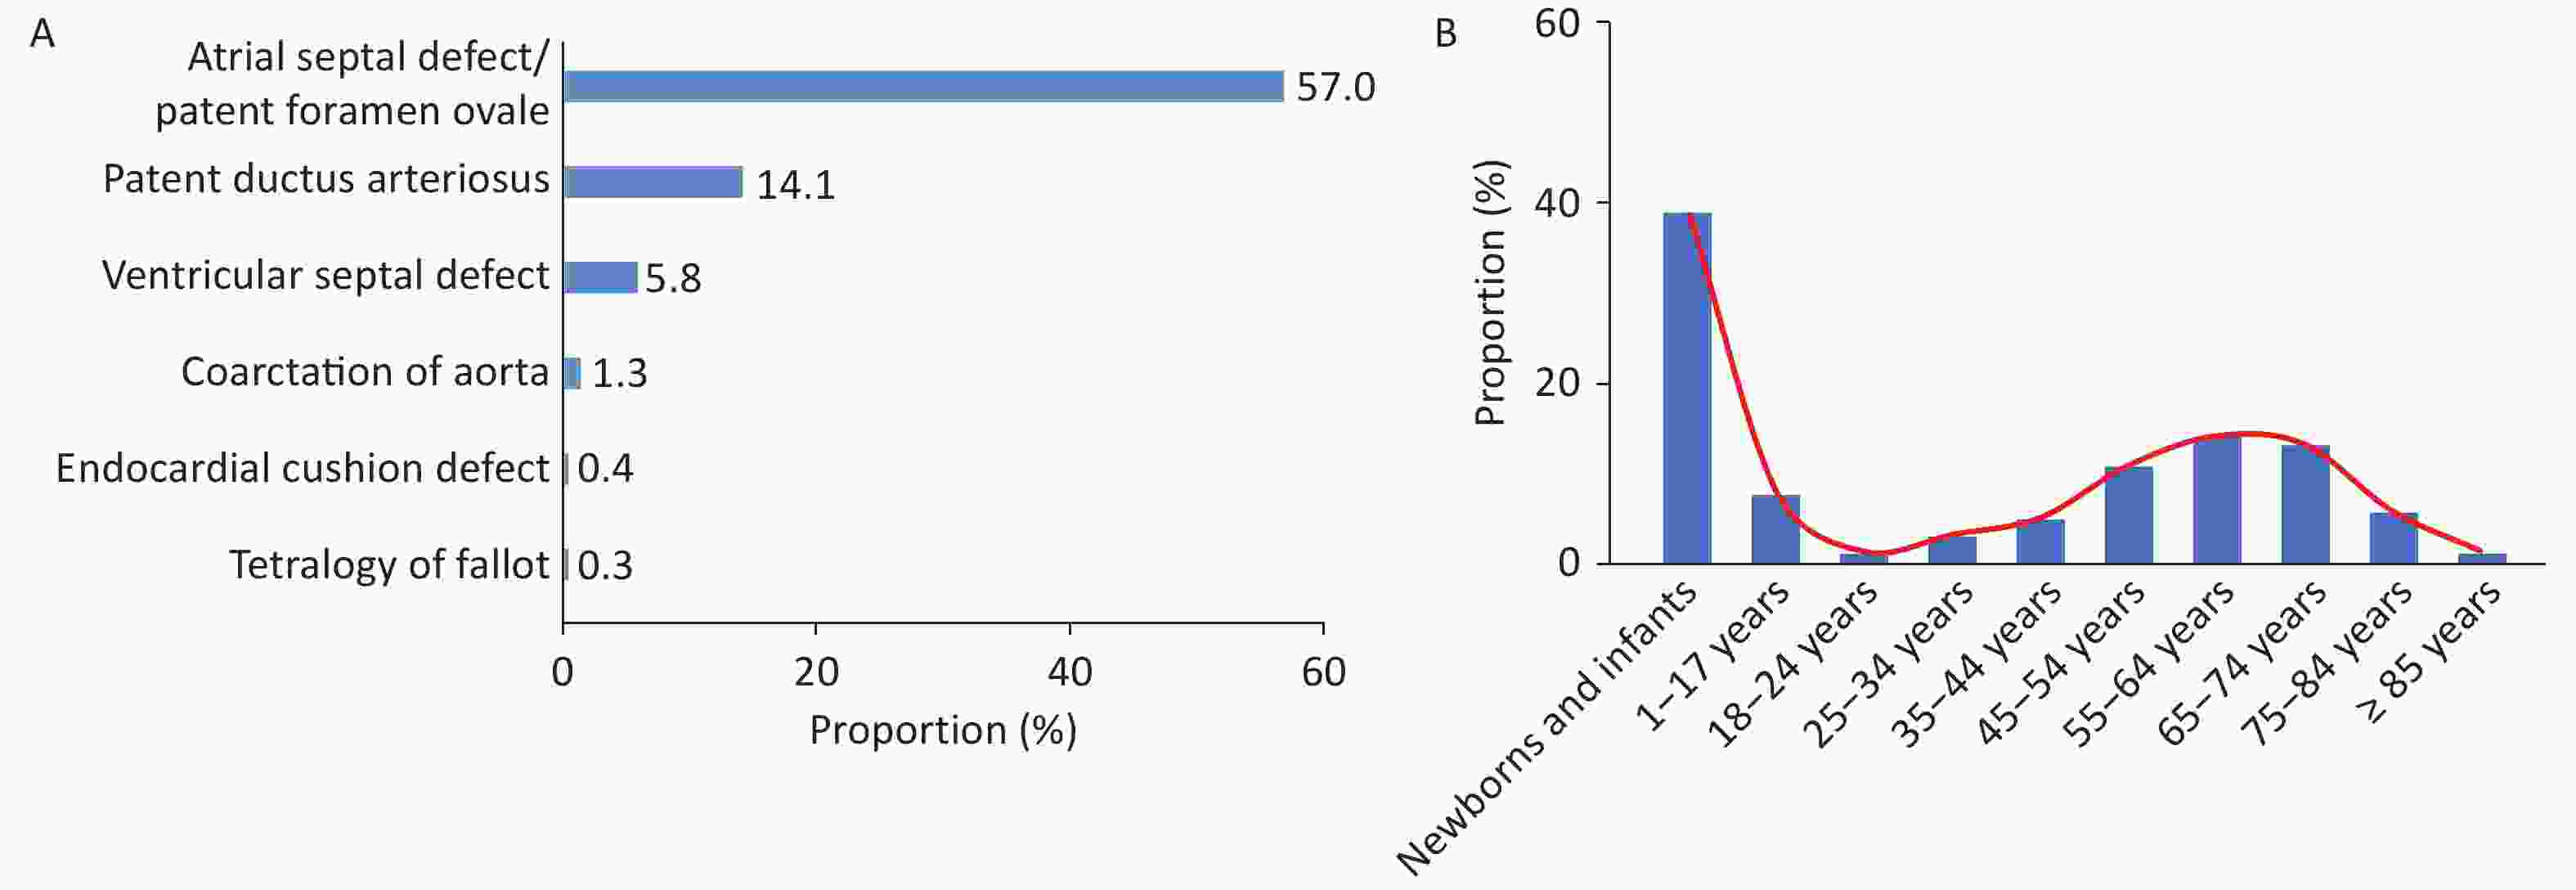
Figure 34. Hospitalization rate of patients with common congenital heart disease (A) and age composition of hospitalized patients with congenital heart disease (B).
Based on data from HQMS[95], 131,000 hospitalized patients with congenital heart disease received surgical or interventional treatment in 2022, accounting for 8.7% of those admitted and diagnosed with congenital heart disease. Among those who received surgical or interventional treatment, there were 116,000 cases of simple congenital heart disease (including atrial septal defect, ventricular septal defect, patent ductus arteriosus, pulmonary valve stenosis, cor triatriatum, unroofed coronary sinus syndrome, partial anomalous pulmonary venous drainage, double aortic arch, and coronary artery fistula), and 15,000 cases of complex congenital heart disease (including tetralogy of Fallot, double outlet right ventricle, complete transposition of the great arteries, corrected transposition of the great arteries, pulmonary atresia, total anomalous pulmonary venous drainage, pulmonary vein stenosis, common arterial trunk, aortic coarctation, coarctation of the aortic arch, interruption of the aortic arch, congenital aortic valve stenosis, supravalvular aortic stenosis, subaortic membrane, congenital aortic valve insufficiency, endocardial cushion defect, congenital mitral valve stenosis, supravalvular mitral membrane, congenital mitral valve insufficiency, mitral valve atresia, congenital tricuspid valve insufficiency, congenital tricuspid valve stenosis, Ebstein’s anomaly, tricuspid valve atresia, absence of pulmonary valve, abnormal origin of pulmonary artery, absence of pulmonary artery, single ventricle, pulmonary artery sling, aberrant subclavian artery malformation, abnormal origin of coronary artery, coronary artery atresia, aortopulmonary window, hypoplastic left heart syndrome, hypoplastic right heart syndrome, rupture of aortic sinus aneurysm, and tracheal stenosis), accounting for 88.6% and 11.4%, respectively. A total of 49,000 patients with congenital heart disease received surgical treatment, accounting for 37.1% of inpatients with congenital heart disease who received surgical or interventional treatment. Among the surgical cases, complex congenital heart disease accounted for 30.8%.
According to data collected by the Extracorporeal Circulation Branch of the Chinese Society for Biomedical Engineering from 728 hospitals nationwide (including Hong Kong) that carry out cardiac surgery, a total of 69,000[100] congenital heart disease surgeries were performed. The difference in the number of congenital heart disease surgeries from different data sources can be attributed to the fact that HQMS data does not include military hospitals and Hong Kong.
According to HQMS data[95], among patients with congenital heart disease who received surgical treatment in 2022, patients aged 1 to 17 years accounted for the largest proportion (42.8%), followed by adults (35.2%). In addition, 1,316 neonatal congenital heart disease surgeries were performed. Among the 1,316 neonatal patients (surgical age ≤ 28 days) who received congenital heart disease surgery, aortic coarctation/interruption surgery accounted for the largest proportion (21.0%), followed by surgeries related to conotruncal malformations (19.0%). Among the 9,402 infant patients (28 days < surgical age ≤ 1 year) who underwent surgery for congenital heart disease, ventricular septal defect repair surgery accounted for 52.3%, atrial septal defect surgical treatment accounted for 12.2%, patent ductus arteriosus surgery accounted for 7.2%, and tetralogy of Fallot surgery accounted for 7.0%.
Among patients with congenital heart disease aged 1 to 17 years, 20,000 received surgical treatment. Among them, the number of ventricular septal defect repair surgeries was the largest, accounting for 37.8% of congenital heart disease surgeries in this age group. This was followed by atrial septal defect repair (26.5%) and patent ductus arteriosus ligation or incision and suture surgery, accounting for 6.2%. A total of 17,000 adults (surgical age ≥ 18 years) underwent congenital heart disease surgeries (excluding adult mitral or aortic valve surgeries). Among them, atrial septal defect repair accounted for the highest proportion, accounting for 41.8% of all adult congenital heart disease surgeries.
According to HQMS data[95], in 2022, the inpatient mortality rate associated with congenital heart disease surgical treatment was 1.0%, and the non-rehabilitation discharge rate (discharge method is inpatient death or non-doctor discharge order) was 2.1%. Among them, the inpatient mortality rate of simple congenital heart disease was 0.4%, and the non-rehabilitation discharge rate was 1.1%. The inpatient mortality rate of complex congenital heart disease was 2.5%, and the non-rehabilitation discharge rate was 4.3%.
Based on HQMS data[95], 83,000 patients with congenital heart disease underwent interventional treatment in 2022, of which patients under 18 years old accounted for 30.8%. Among inpatients aged < 18 years who received interventional treatment, atrial septal defect or patent foramen ovale closure treatment was the most common, accounting for 55.1% of patients who received interventional treatment, followed by patent ductus arteriosus closure, ventricular septal defect closure, and pulmonary valve balloon dilation (Figure 35A). Among adult inpatients with congenital heart disease who received interventional treatment, atrial septal defect or patent foramen ovale closure treatment was the most common, accounting for 93.2% (Figure 35B).
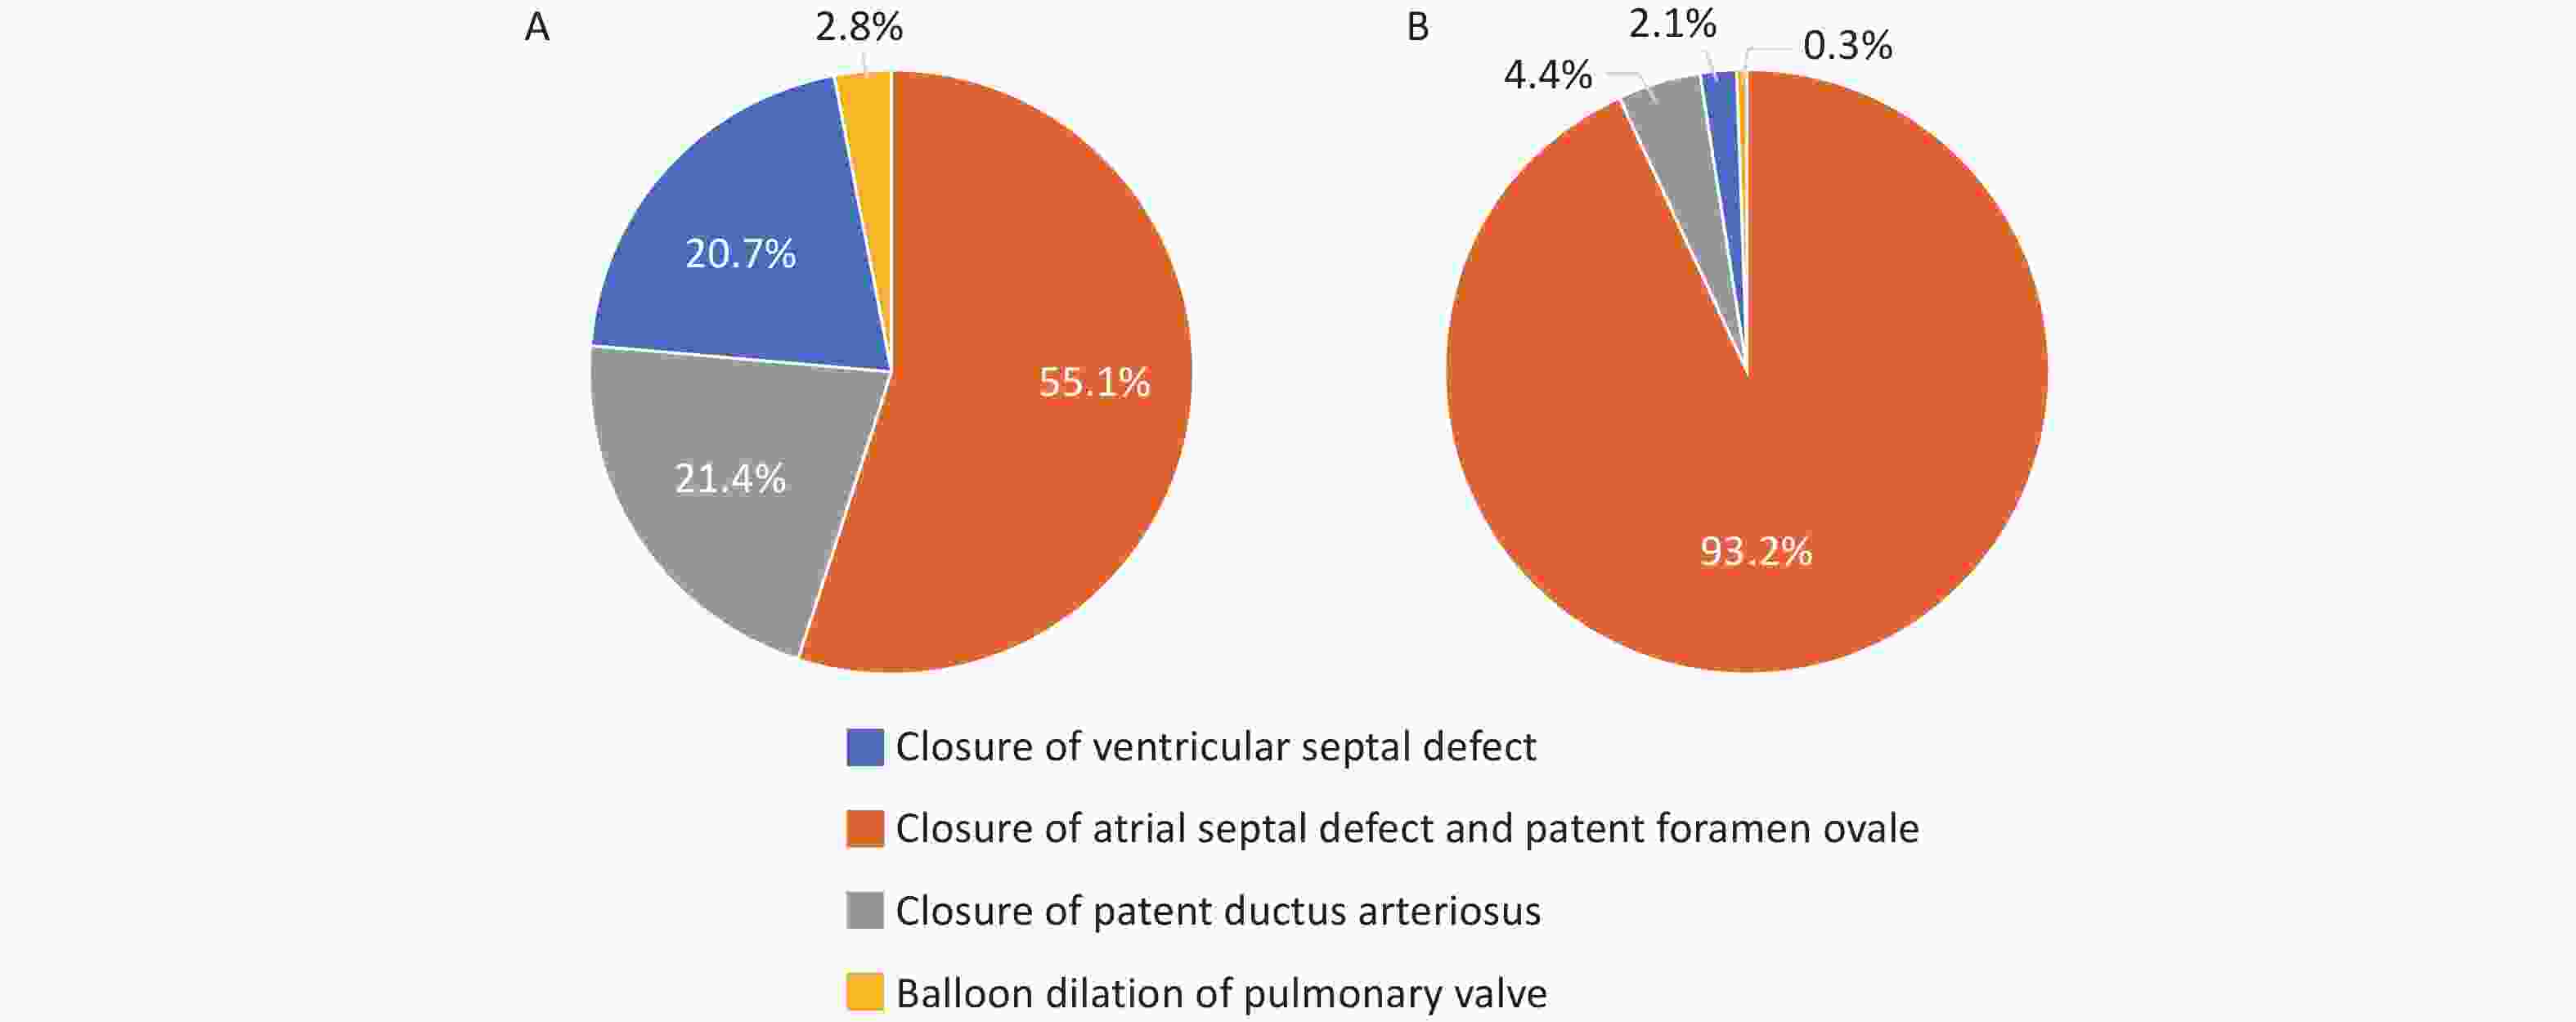
Figure 35. Types of congenital heart disease in patients aged less than 18 years (A) and adult patients (B) who received interventional treatment.
According to HQMS data[95], in 2022, the inpatient mortality rate associated with congenital heart disease interventional treatment was 0.01%, and the non-rehabilitation discharge rate (discharge method is inpatient death or non-doctor discharge order) was 0.46%. The inpatient mortality rate was 0.01% in both child and adult patients. The non-rehabilitation discharge rate for child patients was 0.78%, and for adult patients was 0.33%.
-
According to HQMS data[95], 3,722 hospitals provided diagnosis and treatment services for aortic diseases in 2022, accounting for 65.9% of the number of hospitals providing CVD diagnosis and treatment services in HQMS. In 2022, 128,000 inpatients with aortic diseases (the main discharge diagnosis includes aortic diseases, and the age is ≥ 18 years old) were admitted, accounting for 0.2% of inpatients with CVD included in the diagnosis. Among patients with aortic diseases, aortic dissection accounts for the highest proportion (48.2%), followed by aortic aneurysm (23.1%; Figure 36).

Figure 36. Proportion of patients with aortic disease by disease type in 2022. *Others include Takayasu arteritis, aortic coarctation, aortic embolism, and traumatic aortic dissection/aneurysm, among others.
According to HQMS data[95], 3,344 hospitals provided diagnosis and treatment services for aortic dissection in 2022, accounting for 59.2% of the number of hospitals providing CVD diagnosis and treatment services in HQMS. In 2022, there were approximately 62,000 inpatients with aortic dissection as the main diagnosis. There were 20,000 patients with type A aortic dissection, 28,000 patients with type B aortic dissection, and 13,000 patients with dissection whose types could not be clearly determined. Overall, 60.5% of inpatients were admitted through the emergency department.
In 2022, the average age of inpatients with aortic dissection as the main diagnosis was (58.2 ± 13.8) years old, with females accounting for 24.7%. The proportion of inpatients with aortic dissection complicated with hypertension was 76.5%. Reportedly, 30.0% of inpatients with aortic dissection underwent endovascular surgery, 19.2% of patients underwent open surgery, and 50.8% of patients did not receive surgical treatment.
In 2022, the mortality rate of inpatients with aortic dissection was 4.8%, and the non-rehabilitation discharge rate (discharge method is inpatient death or non-doctor discharge order) was 16.6%. Among them, the inpatient mortality rate of type A aortic dissection was 9.2%, and the non-rehabilitation discharge rate was 24.0%. The inpatient mortality rate of type B aortic dissection was 1.7%, and the non-rehabilitation discharge rate was 10.8%.
The inpatient mortality rate of patients who underwent surgery was 3.2%, and the non-rehabilitation discharge rate was 8.0%. Among them, the inpatient mortality rate of patients who underwent endovascular surgery was 1.0%, and the non-rehabilitation discharge rate was 3.9%; the inpatient mortality rate of patients who underwent open surgery was 6.5%, and the non-rehabilitation discharge rate was 14.3%. Among patients who did not undergo surgery, 58.5% of patients were discharged on doctor’s orders, 12.7% of patients were transferred on doctor’s orders, 19.3% of patients were discharged without doctor’s orders, 6.7% of patients died, and 2.8% were discharged by other methods.
A study analyzed the treatment effect of total aortic arch replacement + frozen elephant trunk surgery (TAR + FET) in 1,445 patients with acute type A aortic dissection. Among them, 89 patients (6.2%) died during postoperative hospitalization or within 30 days, 169 (11.7%) received continuous renal replacement therapy (CRRT), 82 (5.7%) had a stroke, 65 (4.5%) had a secondary thoracotomy, and 36 (2.5%) had a tracheotomy. Based on the observations, TAR + FET could be an effective method for treating acute type A aortic dissection, although factors such as advanced age, impaired renal function, and prolonged cardiopulmonary bypass may be related to poor prognosis of patients[101]. A domestic multicenter registry study including a total of 1,058 cases of acute type A aortic dissection from 2018 to 2021 revealed that the interval from onset to treatment for such patients was 10.65 h, and the time from treatment to surgery was 13 h; 88.7% of patients underwent TAR surgery, and 75.6% underwent FET surgery. The mortality rate during postoperative hospitalization was 7.6%[102].
A study analyzed 338 patients with uncomplicated type B aortic dissection from 2003 to 2014. Overall, 184 patients underwent thoracic endovascular aortic repair (TEVAR), and 154 patients received simple drug treatment. Long-term follow-up results showed that the risk of aortic-related events and all-cause mortality risk were markedly reduced in the TEVAR group when compared with those in the simple drug treatment group[103].
According to HQMS data[95], 2,244 hospitals provided diagnosis and treatment services for aortic aneurysms in 2022, accounting for 39.8% of hospitals providing CVD diagnosis and treatment services in HQMS. In 2022, 31,000 inpatients with aortic aneurysms as the main diagnosis were admitted, among which 23.9% of inpatients were admitted through the emergency department. In 2022, the average age of inpatients with aortic aneurysms was (67.5 ± 12.2) years, with females accounting for 20.6%. The proportion of inpatients with aortic aneurysms complicated with hypertension was 59.6%. Additionally, 42.5% of inpatients with aortic aneurysms underwent endovascular surgery, 13.5% of patients underwent open surgery, and 44.0% of patients did not receive surgical treatment.
In 2022, the inpatient mortality rate of inpatients with aortic aneurysms was 0.8%, and the non-rehabilitation discharge rate (discharge method is inpatient death or non-doctor discharge order) was 7.5%. The inpatient mortality rate of patients who received surgery was 0.7%, and the non-rehabilitation discharge rate was 2.3%. Among them, the inpatient mortality rate of patients who underwent endovascular surgery was 0.5%, and the non-rehabilitation discharge rate was 2.3%; the inpatient mortality rate of patients who underwent open surgery was 1.2%, and the non-rehabilitation discharge rate was 2.5%. Among patients who did not undergo surgery, 79.3% of patients were discharged on doctor’s orders, 3.8% were transferred on doctor’s orders, 13.4% were discharged without doctor’s orders, 0.9% died, and 2.6% were discharged through other routes.
-
According to HQMS data[95], 3,262 hospitals provided diagnosis and treatment services for carotid atherosclerotic stenosis and occlusive diseases in 2022, accounting for 57.8% of the hospitals providing CVD diagnosis and treatment services. In 2022, 171,000 inpatients with carotid atherosclerotic stenosis and occlusive diseases were admitted. The average age of inpatients with carotid atherosclerotic stenosis and occlusive diseases in 2022 was (58.2 ± 13.8) years, with females accounting for 24.7%. Additionally, 47,000 patients (27.66%) received surgical treatment, with 38,000 (22.2%) receiving carotid artery interventional surgery and 9,647 (5.6%) receiving carotid artery open surgery.
In 2022, the in-hospital mortality rate after surgery among inpatients with carotid atherosclerotic stenosis and occlusive diseases was 0.7%, and the non-rehabilitation discharge rate (discharge method is inpatient death or discharge against medical advice) was 2.2%. Among them, the in-hospital mortality rate after carotid artery interventional surgery was 0.8%, and the non-rehabilitation discharge rate was 2.9%. The in-hospital mortality rate after carotid artery open surgery was 0.4%, and the non-rehabilitation discharge rate was 2.4%. Among patients who did not receive surgery, 90.6% of patients were discharged on medical advice, 0.9% were transferred on medical advice, 5.3% were discharged against medical advice, 0.5% died, and 2.6% were discharged through other routes.
According to HQMS data[95], 4,098 hospitals provided diagnosis and treatment services for varicose veins of the lower extremities in 2022, accounting for 72.6% of the hospitals providing CVD diagnosis and treatment services in HQMS. In 2022, 174,000 inpatients with varicose veins of the lower extremities were admitted. The average age of inpatients with varicose veins of the lower extremities was (58.8 ± 11.2) years, with females accounting for 43.4%. Among inpatients with varicose veins of the lower extremities, 150,000 (86.4%) received surgical treatment. Among them, 131,000 patients (75.1%) received traditional stripping surgery, 17,000 (10.0%) received radiofrequency ablation, and 38,000 (21.7%) received laser surgery.
-
Based on HQMS data[95], 4,875 hospitals admitted patients with pulmonary hypertension in 2022, accounting for 86.3% of the number of hospitals that admitted patients with CVD in HQMS. In total, 1.131 million adult inpatients with pulmonary hypertension (discharge diagnosis includes pulmonary hypertension and age ≥ 18 years) were admitted, accounting for 1.9% of inpatients with CVD included in the discharge diagnosis. Additionally, 29.3% of inpatients were admitted through the emergency department, and 68.2% of patients were admitted through the outpatient department.
In 2022, among the clinical classifications of pulmonary hypertension, the proportions of the first to fifth categories of pulmonary hypertension were as follows: arterial pulmonary hypertension, pulmonary hypertension due to left heart disease, pulmonary hypertension due to lung disease and/or hypoxia, pulmonary hypertension due to pulmonary artery obstruction, and pulmonary hypertension of unknown mechanism and/or caused by multiple factors were 7.6%, 33.0%, 23.1%, 2.0%, and 4.8%, respectively. Pulmonary hypertension that cannot be classified temporarily accounted for 29.5%. These findings indicated that there may be some irregularities in the diagnosis of pulmonary hypertension in China, and a more standardized diagnostic terminology system and diagnostic process need to be established.
In 2022, a total of 86,000 patients with pulmonary hypertension in the first category were admitted. Among them, patients with pulmonary hypertension related to atrial septal defect accounted for 37.5%, those with pulmonary hypertension related to ventricular septal defect accounted for 15.5%, and those with pulmonary hypertension related to patent ductus arteriosus accounted for 12.6%. Accordingly, patients with congenital heart disease-related pulmonary hypertension are the main population of pulmonary hypertension in the first category.
The average age of inpatients with pulmonary hypertension was (66.9 ± 19.1) year, with females accounting for 48.2%. The average age and proportion of females in the five major categories of pulmonary hypertension are shown in Figure 37. Among them, inpatients with pulmonary hypertension in the first category were the youngest, and the proportion of females was the highest. Pulmonary hypertension in the second and third categories was mainly diagnosed in older adults, while pulmonary hypertension in the third category was more common in males.

Figure 37. Average age (A) and proportion of females (B) in the five categories of pulmonary hypertension in 2022. The age in Figure 37A is ± 1 standard deviation of the mean age.
In 2022, the rate of right heart catheterization in the overall population with pulmonary hypertension was 1.0%. The proportions in pulmonary hypertension from category 1 to category 5 were 6.6%, 0.5%, 0.3%, 7.2%, and 0.2%, respectively. The inpatient mortality rate of patients with pulmonary hypertension was 1.6%, and the non-rehabilitation discharge rate (discharge method is inpatient death or non-doctor’ discharge order) was 9.9%. Among patients with pulmonary hypertension from categories 1 to 5, the inpatient mortality rates and non-rehabilitation discharge rates were 1.0%, 1.5%, 2.0%, 2.6%, and 1.4% and 7.0%, 8.9%, 11.4%, 11.2%, and 11.3%, respectively.
In total, 21.5% of patients with atrial septal defect-related pulmonary hypertension underwent surgical repair or interventional closure of atrial septal defect. Additionally, 11.7% of patients with ventricular septal defect-related pulmonary hypertension underwent surgical repair or interventional closure of ventricular septal defect. Furthermore, 6.7% of patients with patent ductus arteriosus-related pulmonary hypertension underwent surgical ligation or interventional closure of patent ductus arteriosus. These data suggestted that the proportion of patients with congenital heart disease-related pulmonary hypertension who underwent surgical or interventional treatment was relatively small, which was related to the fact that not all patients with congenital heart disease-related pulmonary hypertension warrant surgical treatment. A comprehensive and detailed assessment of such patients was needed to determine the treatment plan.
In 2022, among 22,000 patients diagnosed with chronic thromboembolic pulmonary hypertension, 0.4% underwent pulmonary endarterectomy, and 5.6% underwent balloon pulmonary angioplasty. Accordingly, the treatment strategy for chronic thromboembolic pulmonary hypertension was yet to be popularized and widely applied in China.
An observational cohort study explored the efficacy and safety of percutaneous transluminal pulmonary angioplasty (PTPA) in the treatment of Takayasu’s arteritis complicated with pulmonary hypertension (TA-PH). From January 2016 to December 2019, a total of 50 patients with TA-PH who completed PTPA (PTPA group) and 21 patients who refused PTPA (non-PTPA group) were included. With an average follow-up of (37 ± 14) months, there were 3 deaths (6.0%) and 1 complication (2.0%) in the PTPA group and 6 deaths (28.6%) in the non-PTPA group. Cox regression analysis revealed that PTPA was significantly associated with a reduced all-cause mortality rate in patients with TA-PH (RR = 0.18; 95% CI: 0.05–0.73; P = 0.017)[104].
-
VTE is divided into pulmonary embolism (PE) and deep vein thrombosis (DVT). According to the HQMS data[95], 4,516 hospitals admitted inpatients with PE in 2022, accounting for 80.0% of the number of hospitals that admitted patients with CVD in HQMS. In 2022, 5,092 hospitals admitted patients with DVT, accounting for 90.2% of the number of hospitals that admitted patients with CVD in HQMS.
The above hospitals admitted 260,000 adult inpatients with PE (discharge diagnosis includes PE and age ≥ 18 years), accounting for 0.4% of inpatients with CVD included in the discharge diagnosis. The hospitals admitted 1.321 million adult inpatients with DVT, accounting for 2.2% of inpatients with CVD included in the diagnosis. The inpatient mortality rate of patients with PE was 6.0%, and the non-rehabilitation discharge rate was 15.9%; for inpatients with DVT, these rates were 2.0% and 9.7%, respectively.
Additionally, 56.1% of patients with PE had a history of surgical procedures, 35.3% had DVT, and 25.0% had malignant tumors. Moreover, 64.1% of inpatients with DVT had a history of surgical procedures, 6.9% of patients had PE, and 26.8% of patients had malignant tumors (Figure 38).
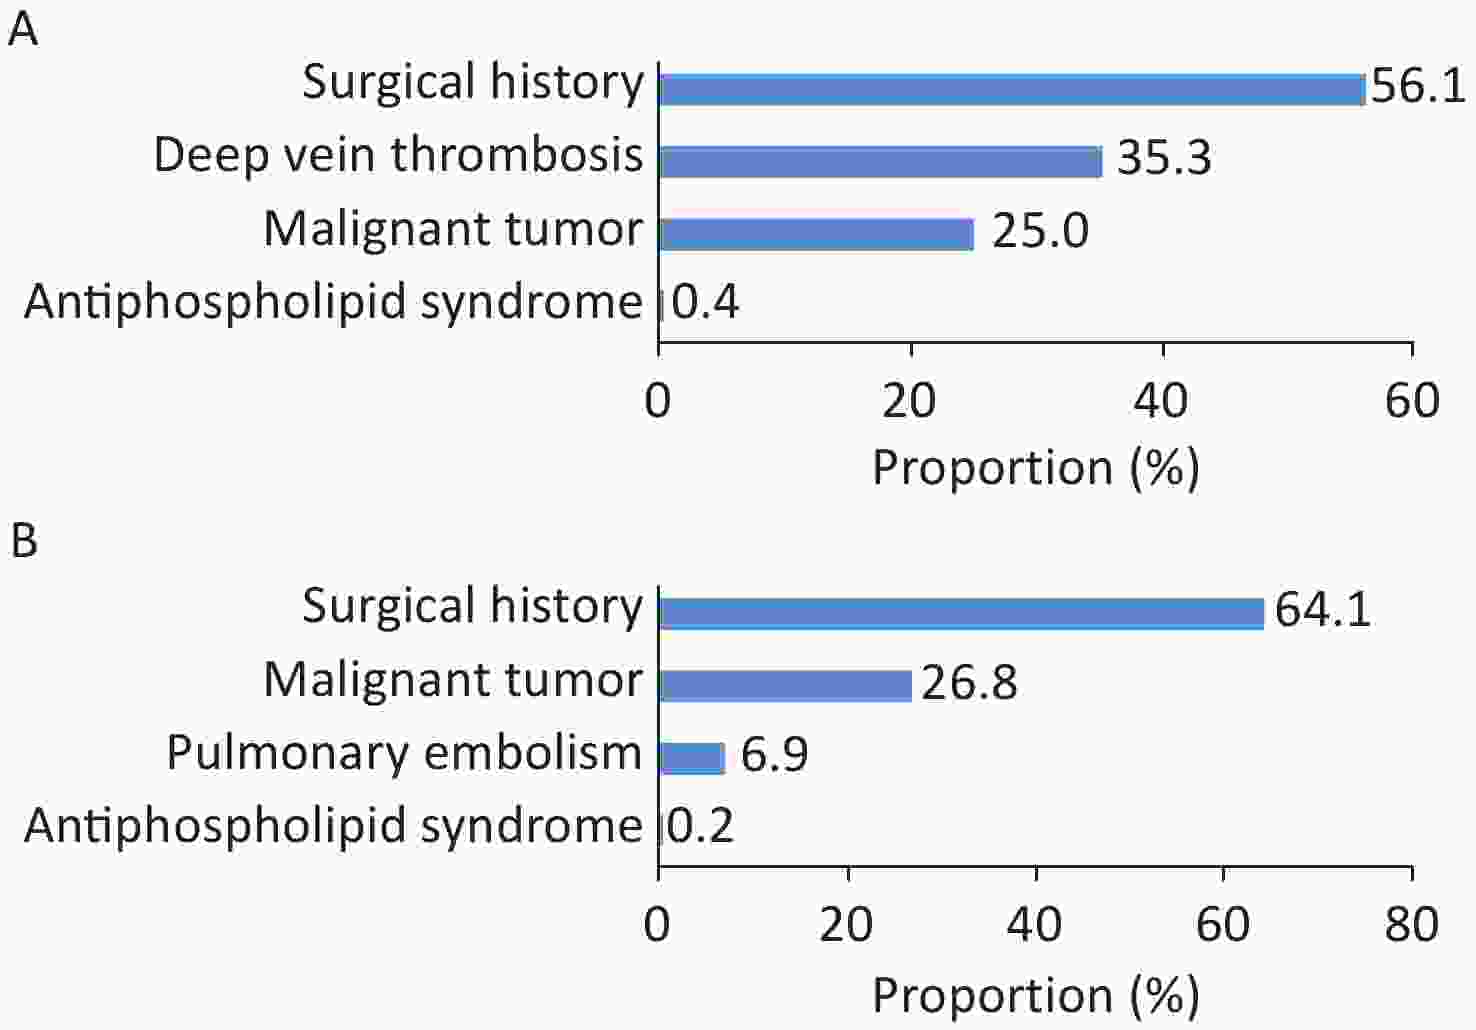
Figure 38. Combined risk factors of hospitalized patients with pulmonary embolism (A) and hospitalized patients with deep vein thrombosis (B).
Among inpatients with PE, 2.8% underwent catheter-directed thrombolysis during hospitalization, and 0.4% underwent pulmonary thrombectomy. Among patients with DVT, 1.7% of patients underwent catheter-directed thrombolysis during hospitalization, 7.0% underwent venous filter installation, 0.2% underwent surgical thrombectomy, and 0.8% underwent interventional thrombectomy. The inpatient mortality rate of patients with PE was 6.0%, and the non-rehabilitation discharge rate was 15.9%; for inpatients with DVT, the inpatient mortality rate was 2.0%, and the non-rehabilitation discharge rate was 9.7%.
-
According to HQMS data[95], 4,928 hospitals admitted patients with cardiomyopathy (cardiomyopathy is included in the main discharge diagnosis or other diagnoses) in 2022, accounting for 86.3% of the number of hospitals that admitted patients with CVD in HQMS. The above hospitals admitted a total of 562,000 patients with cardiomyopathy. Among them, 26.6% of patients had a main diagnosis of cardiomyopathy. Among all patients with cardiomyopathy, dilated cardiomyopathy (DCM) accounted for the highest proportion (69.9%), followed by hypertrophic cardiomyopathy (HCM; 18.6%). Unclassified cardiomyopathy, restrictive cardiomyopathy, and arrhythmogenic cardiomyopathy accounted for 10.3%, 0.6%, and 0.6%, respectively.
Among 103,000 hospitalized patients with DCM, anemic heart disease as a secondary etiology was the most common (45.1%), followed by uremic cardiomyopathy (21.5%) (Figure 39A). A total of 6,261 patients were hospitalized due to secondary HCM, with Fabry disease being the most common diagnosis (37.7%), followed by cardiac amyloidosis (22.1%) (Figure 39B).
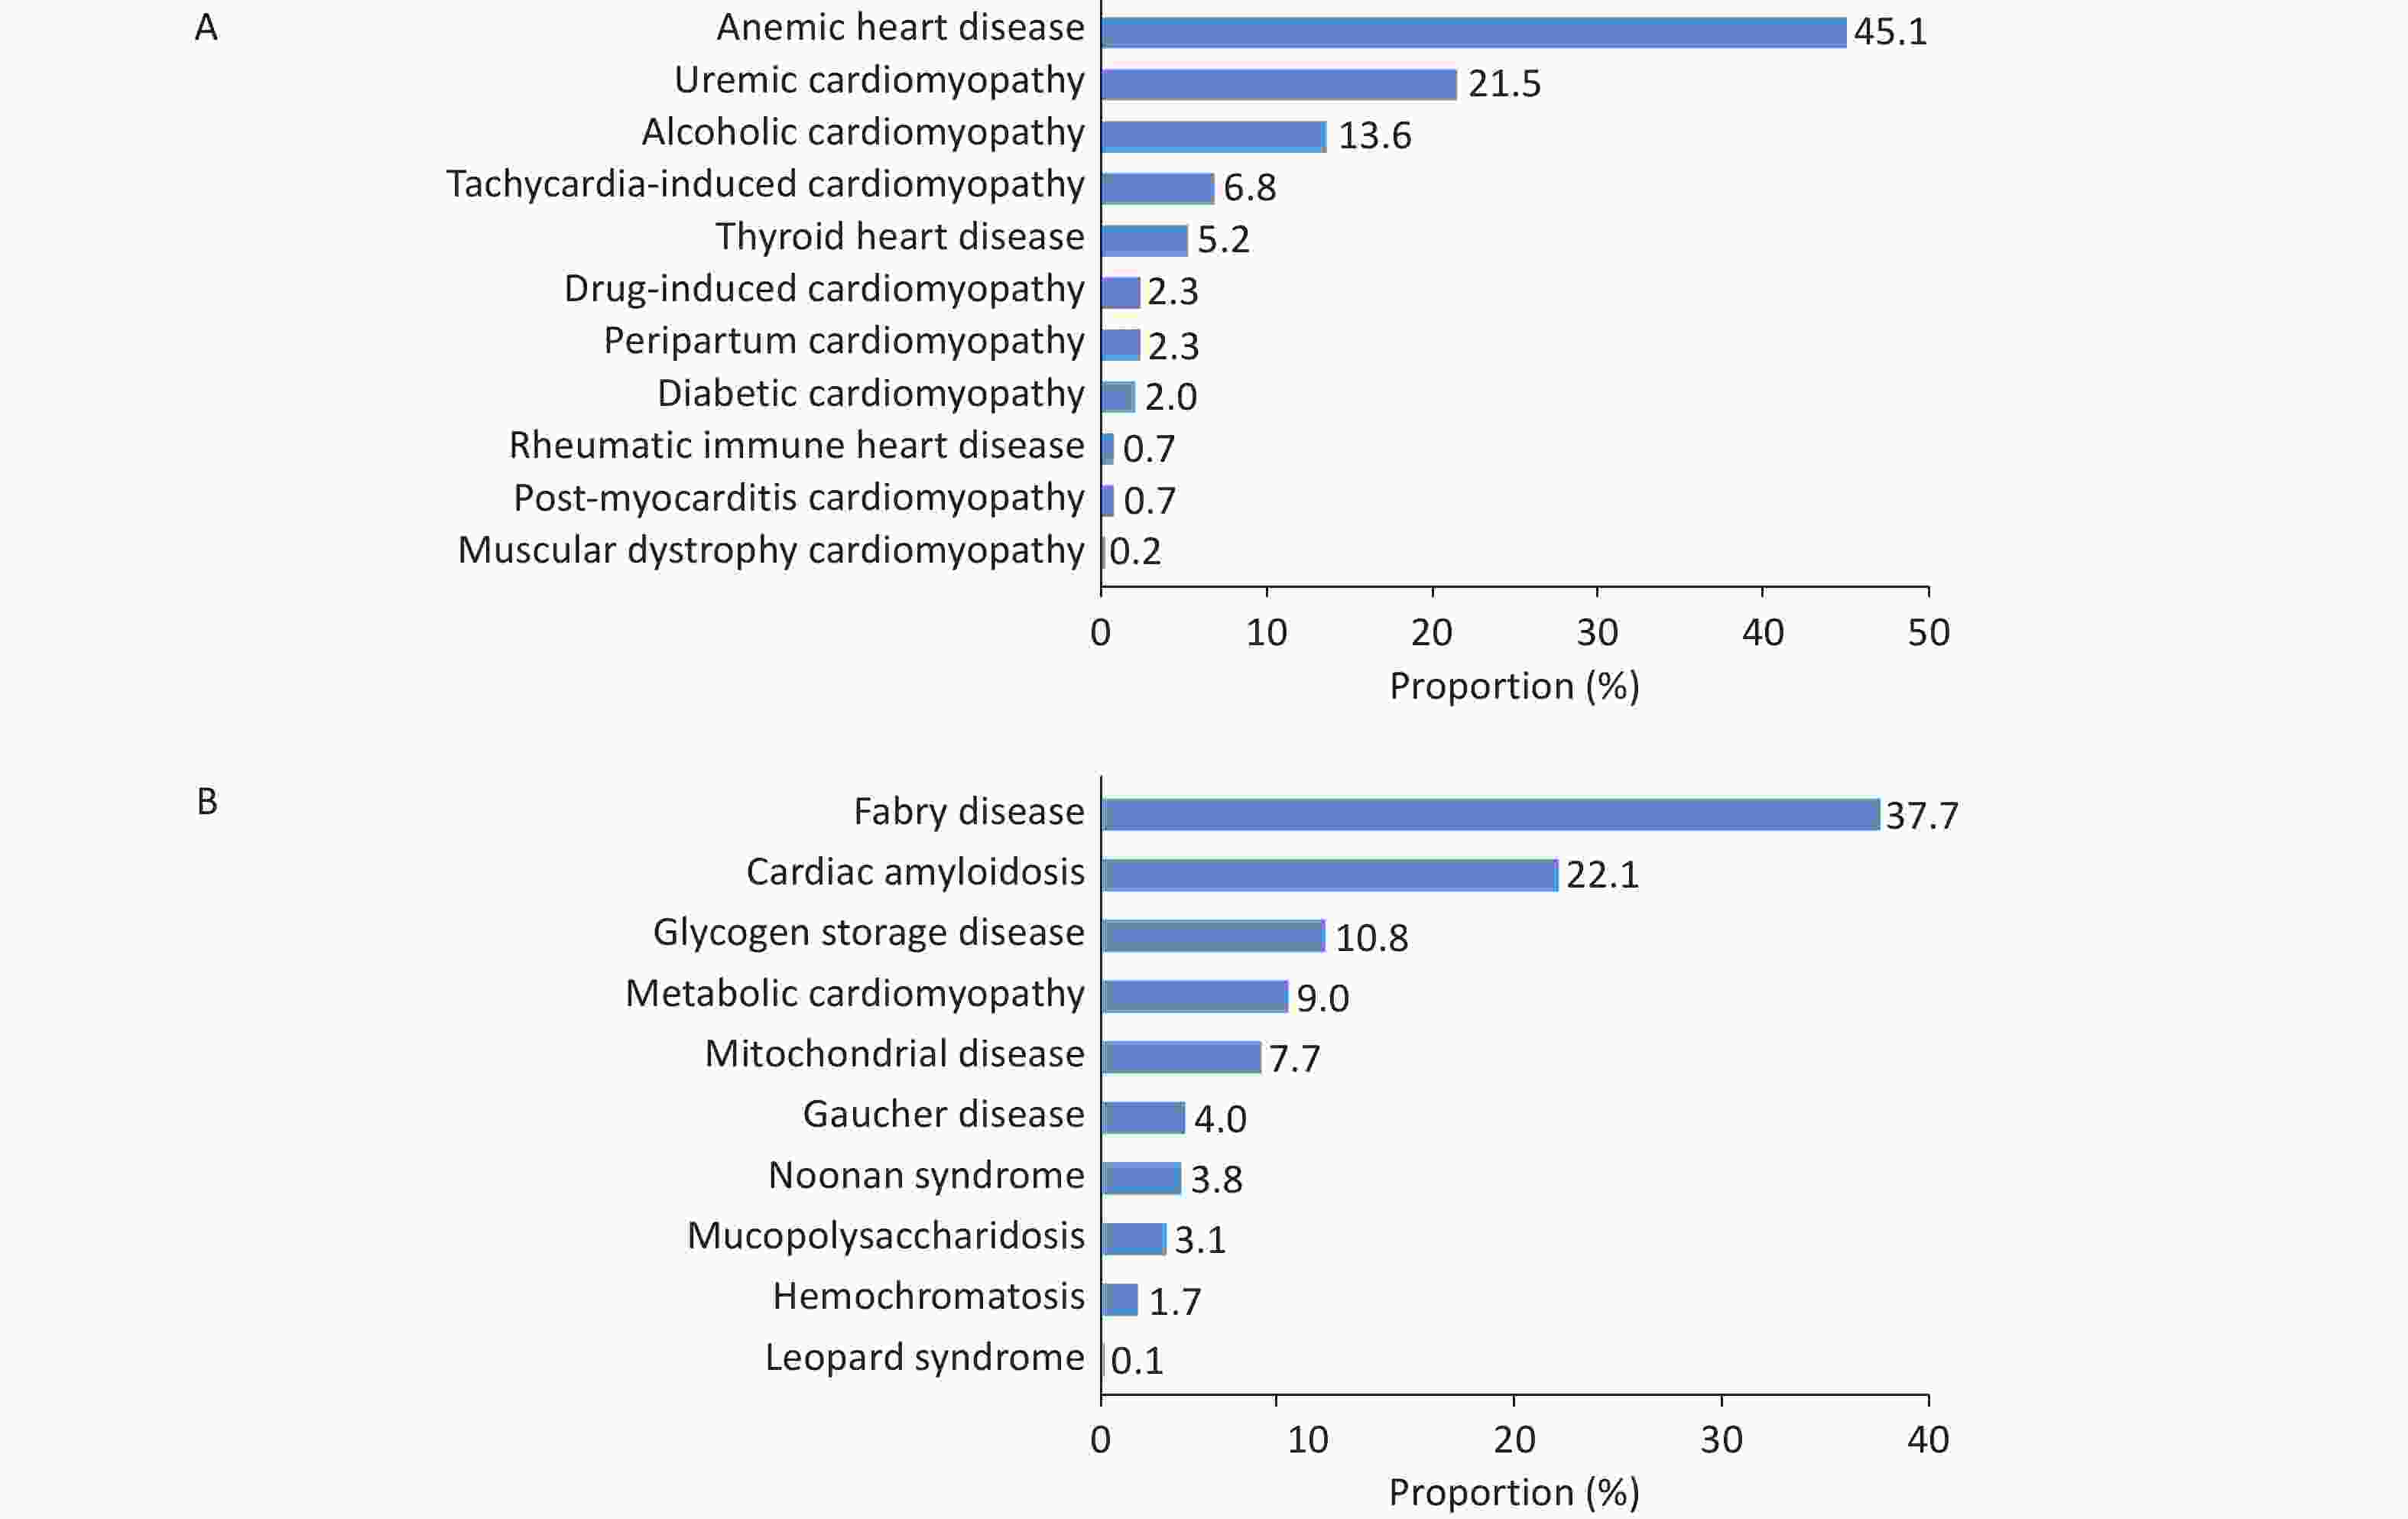
Figure 39. Proportion of hospitalized patients with secondary dilated cardiomyopathy (A) and secondary hypertrophic cardiomyopathy (B).
In 2022, female patients accounted for 34.4% of hospitalized patients with cardiomyopathy. The proportions of different types of cardiomyopathy tend to differ based on sex. Females accounted for 32.3% of patients with DCM, 39.1% of those with HCM, 44.4% of those with restrictive cardiomyopathy, 40.6% of those with arrhythmogenic cardiomyopathy, and 40.0% of those with other types of cardiomyopathy. Additionally, 80.7% of hospitalized patients had HF. The proportion of patients with atrial fibrillation/atrial flutter was 25.7%, and the proportion of patients with ventricular tachycardia was 7.5%. The proportions of patients with pulmonary hypertension, sudden death, syncope, and ventricular fibrillation were 9.5%, 0.8%, 0.5%, and 0.5%, respectively.
A total of 107 hospitals performed 835 myocardial biopsies, accounting for 0.56% of the number of hospitalizations of patients with cardiomyopathy as the main diagnosis. Among them, the numbers of hospitals with an annual myocardial biopsy volume of < 10 cases, 10–19 cases, and ˃ 20 cases were 92, 9, and 6, respectively. The number of hospitals performing endomyocardial biopsy accounts for 2.2% of all hospitals that diagnose and treat cardiomyopathy.
Notably, 0.5% of patients with cardiomyopathy received ICD treatment, and 0.6% received CRT/cardiac resynchronization therapy defibrillator (CRT-D) treatment. Among patients with cardiomyopathy and atrial fibrillation/atrial flutter, 1.0% underwent radiofrequency catheter ablation, accounting for 3.0% of the total number of treated patients with atrial fibrillation/atrial flutter. Among hospitalized patients with HCM, 1.6% of patients underwent Morrow surgery/modified Morrow surgery, 0.1% underwent CRT/CRT-D treatment, 0.5% underwent septal ablation, and 0.5% received ICD. Among patients with HCM, 20.4% of patients had atrial fibrillation/atrial flutter. Among them, 2.1% underwent medical ablation for atrial fibrillation, and 0.3% underwent surgical ablation for atrial fibrillation.
The hospital mortality rate of hospitalized patients with cardiomyopathy was 1.3%, and the non-rehabilitation discharge rate (discharge method was hospital death or discharge against medical advice) was 8.0%. The hospital mortality rate of patients with HCM undergoing Morrow surgery/modified enlarged Morrow surgery was 1.9%, and the non-rehabilitation discharge rate was 3.5%. The hospital mortality rate associated with HCM septal ablation was 0.3%, and the non-rehabilitation discharge rate was 1.0%.
-
According to HQMS data[95], among patients with CVD, the number of patients with HF undergoing rehabilitation treatment was 1.094 million times in 2022, which was followed by patients after PCI, which was 339,000 person-times. The numbers of patients receiving rehabilitation treatment after valvular heart disease surgery and CABG were 45,000 and 34,000 times, respectively.
According to HQMS data[95], the average length of hospital stay among patients who underwent rehabilitation after CABG was 11.2 days in 2022, and the average length of hospital stay among those who did not receive rehabilitation was 17.8 days. The average length of hospital stay for patients who received rehabilitation after valvular heart disease surgery was 11.3 days, and the average length of hospital stay among patients who did not receive rehabilitation treatment was 17.4 days.
A survey examined the current status of cardiac prevention and rehabilitation work in 159 Chinese hospitals in 33 provincial-level administrative regions (except Qinghai Province) from February 2012 to December 2021. Among 19,896 patients with CVD, 73.12% of patients underwent phase II rehabilitation, 8.01% of patients underwent phase III rehabilitation, and 18.87% of patients underwent phase II + phase III rehabilitation[105].
-
Based on HQMS data[95], a total of 4,051 hospitals provided OSA diagnosis and treatment services in 2022, accounting for 71.7% of the hospitals providing CVD diagnosis and treatment services in HQMS. Among them, 1,017 (25.1%) hospitals could conduct nocturnal sleep breathing monitoring, and 1,695 (41.8%) hospitals could provide non-invasive positive pressure ventilation treatment. In 2022, a total of 276,000 patients with CVD complicated with OSA (discharge diagnosis includes OSA and age ≥ 18 years) were hospitalized, accounting for 0.5% of hospitalized patients with CVD. The average age of hospitalized patients was (57.2 ± 15.1) years, with females accounting for 27.5%.
Among comorbidities of hospitalized patients with OSA, hypertension, CHD, HF, and arrhythmia rank in the top four, accounting for 77.9%, 34.8%, 21.3%, and 21.1%, respectively. The proportions of patients with VTE, pulmonary hypertension, and aortic dissection/aneurysm were 6.4%, 3.5%, and 1.2%, respectively. Among 276,000 person-times of CVD patients with OSA, 18,000 person-times (6.5%) of patients received non-invasive positive pressure ventilation treatment during hospitalization. In 2022, the non-rehabilitation discharge rate of hospitalized patients with CVD complicated with OSA was 3.5%, with a mortality rate of 0.4%.
According to HQMS data[95], among hospitals providing CVD diagnosis and treatment services in China, the proportion of hospitals conducting nocturnal sleep breathing monitoring was less than 30% in 2022. Among hospitalized patients with CVD, approximately 0.5% of patients were diagnosed with OSA.
-
According to HQMS data[95], among hospitals admitting patients with CVD (excluding cerebrovascular diseases), in 2022, there were 5,375, 4,687, 3,260, 1,551, and 2,663 hospitals capable of diagnosing chronic kidney disease, diagnosing AKI, performing hemodialysis, peritoneal dialysis, and CRRT, respectively, accounting for 95.2%, 83.0%, 57.7%, 27.5%, and 47.2%, respectively. Among hospitalized patients with CVD in 2022, there were 6.211 million patients with chronic kidney disease, 341,000 with AKI, 815,000 undergoing hemodialysis, 176,000 receiving peritoneal dialysis, and 160,000 receiving CRRT. Among hospitalized patients with CVD, the proportions of patients with chronic kidney disease, hemodialysis, AKI, CRRT, and peritoneal dialysis in 2022 were 12.2%, 1.6%, 0.7%, 0.3%, and 0.3%, respectively. Among patients with HF, atrial fibrillation, valvular heart disease, and AMI, the proportions of those with chronic kidney disease are 21.0%, 17.6%, 17.0%, and 15.6%, respectively.
Among patients with chronic kidney disease, 69.3% were diagnosed with chronic renal insufficiency or chronic renal failure. Additionally, among patients with chronic kidney disease, the proportions of those with hypertension, diabetes, and renal artery stenosis were 78.8%, 32.6%, and 0.5%, respectively. Among hospitalized patients with CVD in 2022, patients with chronic kidney disease exhibited higher rates of hospital mortality (2.5% vs. 0.9%), non-rehabilitation discharge (10.6% vs. 6.3%), and incidence of AKI (1.1% vs. 0.6%) than those without chronic kidney disease, and the length of hospital stay among the former was also longer [8 (5, 12) days vs. 7 (4, 11) days].
Among hospitalized patients with CVD, patients with AKI had substantially higher rates of mortality (13.8% vs. 1.0%), non-rehabilitation discharge (34.2% vs. 6.7%), and receipt of CRRT treatment (12.9% vs. 2.1%) than those without AKI; the length of hospital stay of the former was also longer [9 (5, 16) days vs. 7 (4, 11) days].
-
According to HQMS data[95], 5,501 hospitals admitted patients with stroke (discharge diagnosis includes cerebral infarction, cerebral hemorrhage, or subarachnoid hemorrhage) in 2022, including 2,133 tertiary hospitals and 3,368 secondary hospitals. In 2022, 12,762 million patients with stroke were admitted, with cerebral infarction accounting for 92.7% of admissions. Among all patients with stroke admitted, patients with stroke as the main discharge diagnosis accounted for 49.7%. The average age of hospitalized patients with stroke was (68.5 ± 12.0) years. Male patients accounted for the majority of patients with cerebral infarction and cerebral hemorrhage, i.e., 56.1% and 63.0%, respectively. Among hospitalized patients with stroke, hypertension, CHD, and diabetes were the most common comorbidities identified, accounting for 66.6%, 29.1%, and 25.6%, respectively. The hospital mortality rate among hospitalized patients with stroke was 1.3%, and the non-rehabilitation discharge rate was 8.6%.
According to HQMS data[95], 5,213 hospitals admitted patients with heart disease complicated with cerebrovascular disease in 2022, accounting for 93.9% of the number of hospitals providing heart disease diagnosis and treatment services in HQMS. Among them, there are 2,035 tertiary hospitals and 3,178 secondary hospitals. Among the 17,159 million hospitalized patients with CHD in the discharge diagnosis in 2022, the proportion of those with cerebrovascular disease was 30.1%. The proportion of patients with cerebrovascular disease among those with atrial fibrillation/atrial flutter was 33.0%. Additionally, the proportion of patients with cerebrovascular disease among those who underwent PCI and CABG was 15.3 and 19.6%, respectively.
-
In Chinese mainland, high-level cardiovascular basic research gained momentum after 2005, with high-impact papers published in journals such as Circulation, Cir Res, Signal Transduct and Target Ther, Cell Discovery, and Nature Commun. Data from journals such as Nature, Circulation, Eur Heart J, Cir Res, Nature Commun, and Cardiovasc Res clearly underscore the rapid development of high-level cardiovascular basic research in China in recent years (Figure 40).
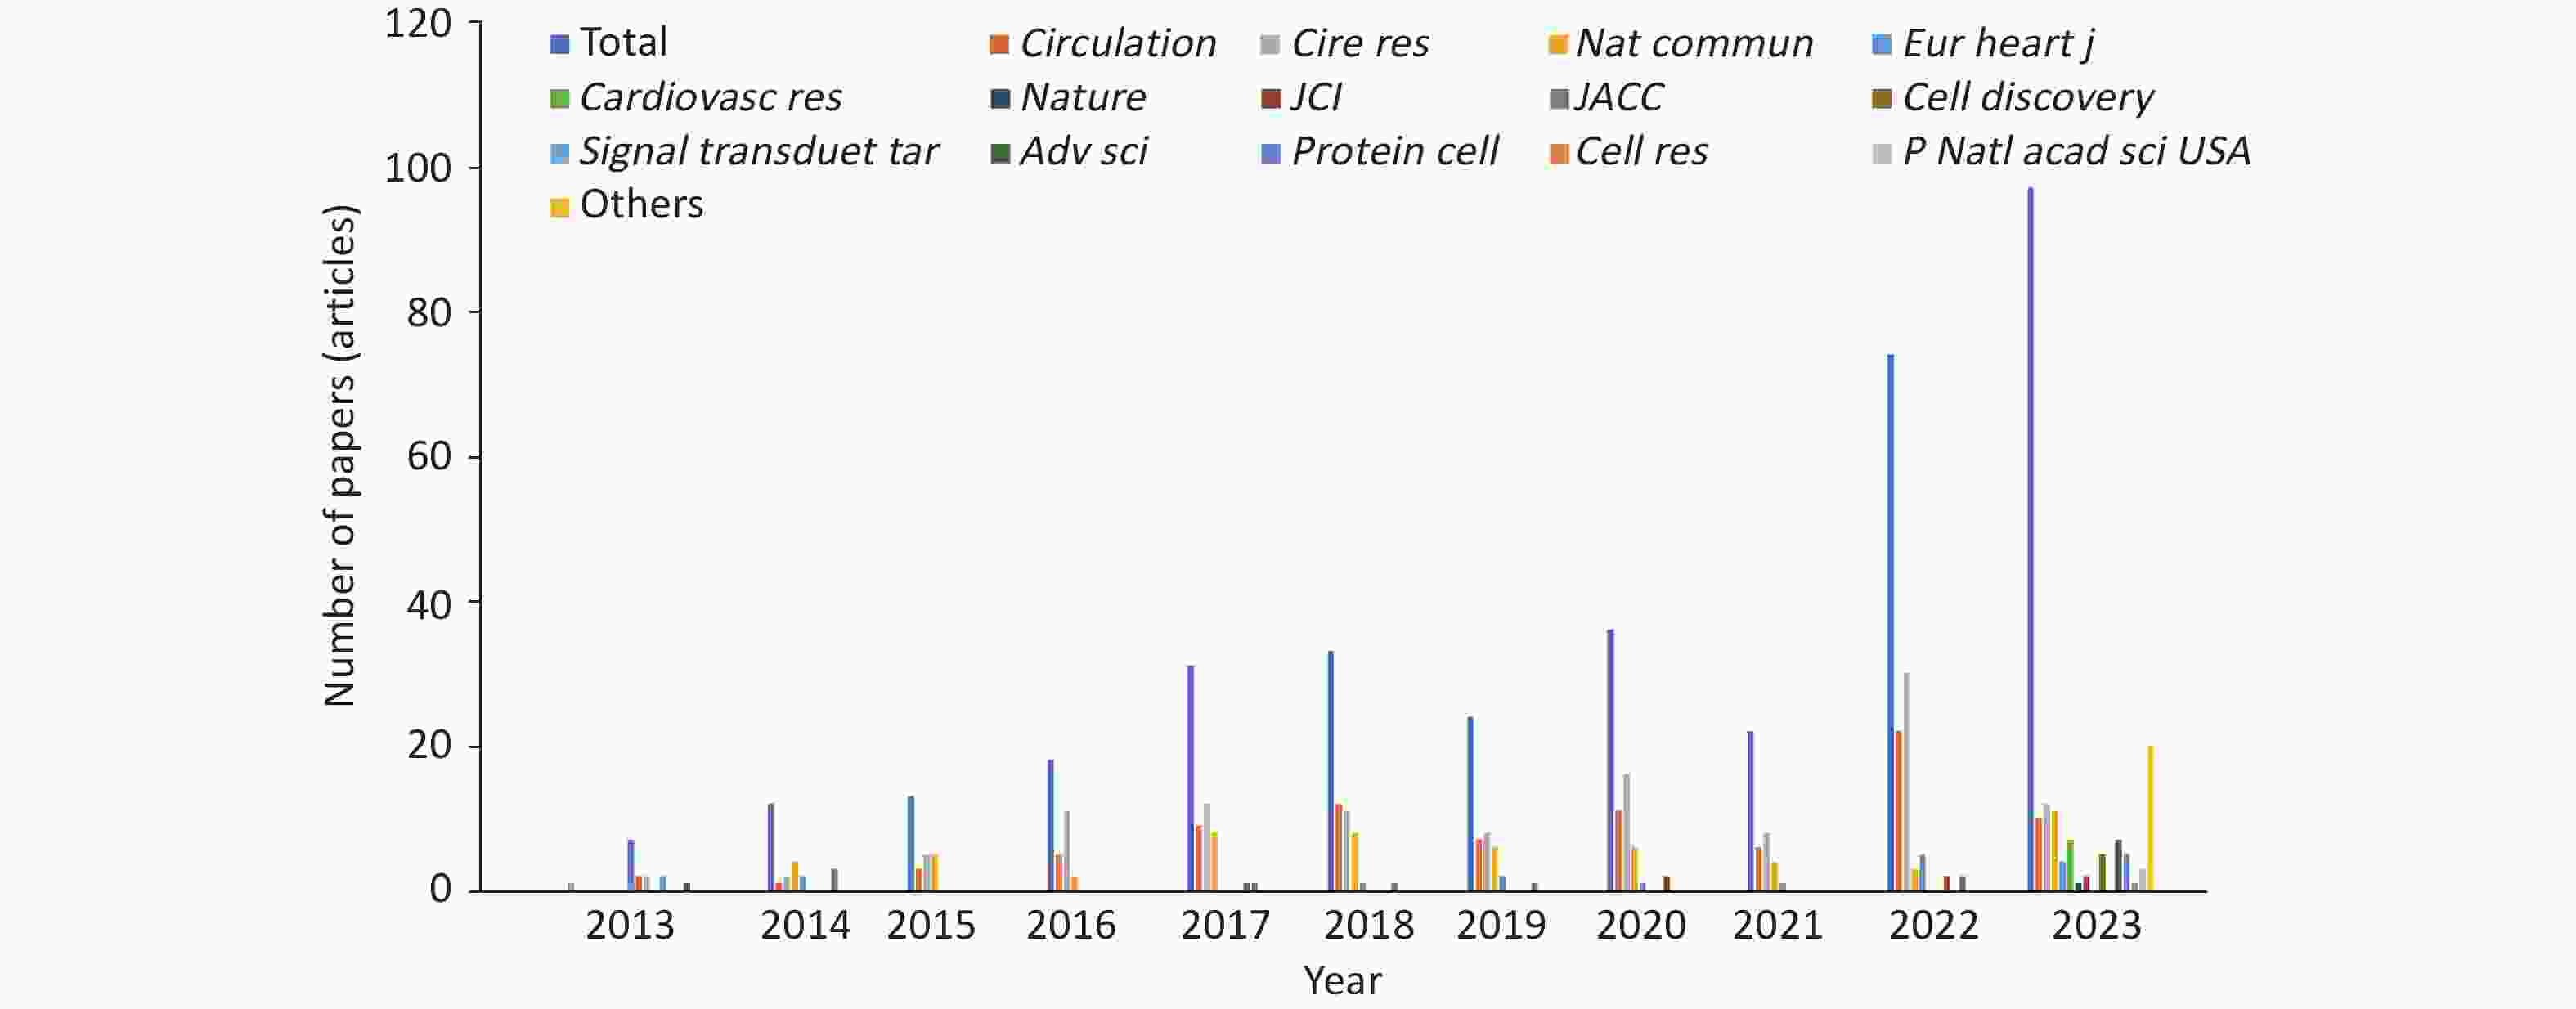
Figure 40. The number of basic research papers on cardiovascular diseases published by the first unit and the corresponding author’s unit in China from 2013 to 2023.
From 2022 to 2023, a total of 97 basic research papers with corresponding authors and main authors from Chinese mainland were published. These reports explored the anatomy, development, function/pathogenesis of the heart and blood vessels. These papers examined aspects such as myocardial infarction, HF, ischemia-reperfusion injury, cardiomyopathy, cardiac remodeling, arterial dissection, atherosclerosis, and vascular remodeling. Among them, hot research topics include cardiac protection and regeneration, as well as gene therapy (Table 3).
Table 3. Summary of cardiovascular research progress in 2022–2023
August 2021 to August 2022 (74 articles) August 2022 to October 2023 (97 articles) 1 CHD, heart injury/remodeling/regeneration 1 CHD, heart injury/remodeling/regeneration Non-coding RNA, MSC transplantation, TRIM16, macrophages, brown fat exosomes, CaMKII-δ, tyrosine-protein kinase, obesity, histone-binding protein 2, immunoglobulin E, epigenetics, LARP7, PTPMT1, GSDMD, LSD1, liver-heart axis, sodium channel inhibitor, phosphodiesterase 4B, RalGAPα1-RalA signaling axis, pioglitazone, and cardiolipin. CircRNA (Samd4), lysine crotonylation, LPA, FNDC5, PUFA, USP25 (deubiquitination), Fap, PIASy, ketone body, MG53, 3D printing, PDCD5, small molecule inhibitor s89, METTL14, DUSP6, TREM2, MMPP, TRPC, single cell, MRPS5, HIPK1, ACADL, FOXP1, cardiac patch, exosome, cell transplantation therapy, optogenetics, Tisp40, M2 macrophage, APOE, RNF27, ABRO1, gut microbiota, BACH1, TMEM, α-myosin heavy chain lactylation, and glutathione reductase 2 Arrhythmia 2 Sinoatrial node/arrhythmia/atrial fibrillation Calbindin 1 Hippo, LCR, Herg/PATL1, KCNQ1 gating characteristics, and neutrophil extracellular trap 3 Cardiomyopathy (hypertrophic cardiomyopathy and dilated cardiomyopathy) 3 Cardiomyopathy (hypertrophic cardiomyopathy, dilated cardiomyopathy, diabetic cardiomyopathy) Gene therapy, histone-binding protein 1, ubiquitin ligase, and glycosylation Cannabinoid receptor 2, Jmjd4, Dectin-1 macrophage, single-cell sequencing, Kaposi's sarcoma-associated herpesvirus infection, Schisandra chinensis, mitochondrial function, gene therapy, metformin, and Ago2 4 Arterial dissection/aneurysm 4 Arterial dissection/aneurysm Erythropoietin, MALAT1, regulatory T cells, naringenin, Lgmn gene, succinic acid, and NR1D1 gene Best3, and endothelial tight junction 5 Atherosclerosis 5 Atherosclerosis S-adenosyl-L-cysteine, deubiquitinating enzyme USP9X, transcription factor BACH1, CTH/H2S, coagulation factor prekallikrein, YAP-TGF-β, PCSK9, PGC-1α, liver-derived angiotensinogen, shear stress, non-coding RNA, nuclear factor of activated T-cells c3, gut microbiota, autophagy, and nitric oxide synthase Cholesterol, gut microbiota, APOE, eosinophil, CCL17, GMD, brown fat, ultrasound-targeted nanomedicine, plastic particles, periodontitis-atherosclerosis association, and ANGPTL8 6 Vascular injury/remodeling/regeneration/calcification 6 Vascular injury/remodeling/regeneration/calcification Mitochondrial fusion protein 2, protein tyrosine phosphatase, tetrahydrobiopterin, matrix protein Nidogen-2, FcγRIIB, shear force, endothelial-mesenchymal transition (brain), heart valve, transcriptional mediator Med23, fibronectin FNDC5, and phospholipid small molecule LPA2 Nidogen-2, LncRNA (PSR), PHCDH, bile acid-FXR axis, endothelin, fish oil, Sema34, ferroptosis, and Sirtuin 2 7 Pulmonary hypertension miRNA-182, statins 7 Hypertension OVGP1 methylation and lymphangiogenesis-blood pressure 8 Others
Lineage tracing, cardiovascular events8 Others
Lineage tracing, platelets, heart transplantation, cardio-oncology, cardiorenal interaction, CIB2, cardiac imaging, stem cell related, PTBP1, heart development, mitochondrial disease model, anti-postoperative adhesion (Jaus gel), and myocarditisNote. RNA, ribonucleic acid; MSC, mesenchymal stem cell; TRIM, tripartite motif protein; CircRNA, circular RNA; CaMKII, calcium/calmodulin-dependent protein kinase II; LARP, La-related protein; FNDC5, fibronectin type III domain-containing protein 5; PUFA, polyunsaturated fatty acid; LSD1, Lysine-specific demethylase 1; PDCD5, programmed cell death molecule 5; DUSP6, dual specificity phosphatase 6; TREM2, microglial receptor-adaptor complex; MMPP, magnetic resonance imaging melanin nanoparticles; TRPC, canonical transient receptor potential; MRPS5, mitochondrial ribosomal protein S5; HIPK1, homeodomain-interacting protein kinase 1; ACADL, long-chain acyl-CoA dehydrogenase; MALAT1, metastasis-associated lung adenocarcinoma transcript 1; USP9X, ubiquitin-specific protease 9X; CTH, cystathionine-γ-lyase; H2S, hydrogen sulfide; YAP, Yes-associated protein; TGF-β, transforming growth factor-β; PCSK9, proprotein convertase subtilisin/kexin type 9; PGC-1α, peroxisome proliferator-activated receptor γ coactivator-1α; LCR, Local calcium release; FcγRIIB, Receptor IIB for the Fc portion of immunoglobulin G; LPA, lysophosphatidic acid; miRNA: microRNA; GMD, Nyingchi derivative; CCL17, CC motif chemokine ligand 17; ANGPTL8, angiopoietin-like protein 8; FXR, farnesoid X receptor; PHCDH, Phosphoglycerate dehydrogenase; Sirtuin 2, Sirtuin 2; LncRNA, Long non-coding RNA; OVGP1, oviductal glycoprotein 1; PTBP1, polypyrimidine tract-binding protein 1; CIB2, calcium and integrin-binding protein 2. CHD, coronary heart disease. -
In recent years, research in the field of cardiovascular diseases in China has advanced considerably, with continuous improvement in both quantity and quality. Currently, the number of papers in the field of cardiovascular diseases in China ranks second globally, second only to the United States. Since 2018, the growth rate of paper numbers has exceeded that of the United States. The most active subspecialties include CHD, hypertension, arrhythmia, and HF. Among them, the number of papers on CHD and hypertension has exceeded that of the United States.
In 2022, 14 clinical research articles were published in the six comprehensive medical journals with the highest impact and four cardiovascular journals. The most common type of study was randomized controlled clinical trials, followed by large prospective cohort studies. This reflects that the focus of clinical researchers in China has shifted from understanding the laws of disease development to scientifically evaluating the effects of interventional measures. The intervention measures evaluated in these studies were treatment plans proposed based on clinical practice or disease prevention measures proposed based on China’s national conditions.
-
From August 5, 2022 to July 31, 2023, the National Medical Products Administration approved a total of 68 medical devices to enter the review channel for innovative medical devices. Among them, 42 were cardiovascular products, indicating that innovation in the cardiovascular field played a dominant role in China’s medical device innovation field, accounting for 61.5%. There were 67 domestic original products, accounting for 98.5% of the new medical devices.
During the same period, the National Medical Products Administration approved a total of 196 registration certificates for Class III medical devices in the cardiovascular field. Among them, 156 are domestic products, and 4 products have entered the review channel for national innovative medical devices. Among these 156 domestic products, 125 were interventional products, 4 were imaging products, 6 were blood flow measurement systems, 4 were open surgery products, 3 were active surgery products, 6 were artificial intelligence software products, and 8 were diagnostic products.
-
According to the China Health Statistics Yearbook 2022, the total number of discharges of patients with cardiovascular and cerebrovascular diseases in China was 27.6498 million in 2021, accounting for 15.36% of the total number of discharges in the same period (including all inpatient diseases). Among them, 14.8723 million discharges involved patients with CVD, accounting for 8.26% of the total, and 12.7775 million discharges involved patients with cerebrovascular disease, accounting for 7.10%[3] (Figure 41).
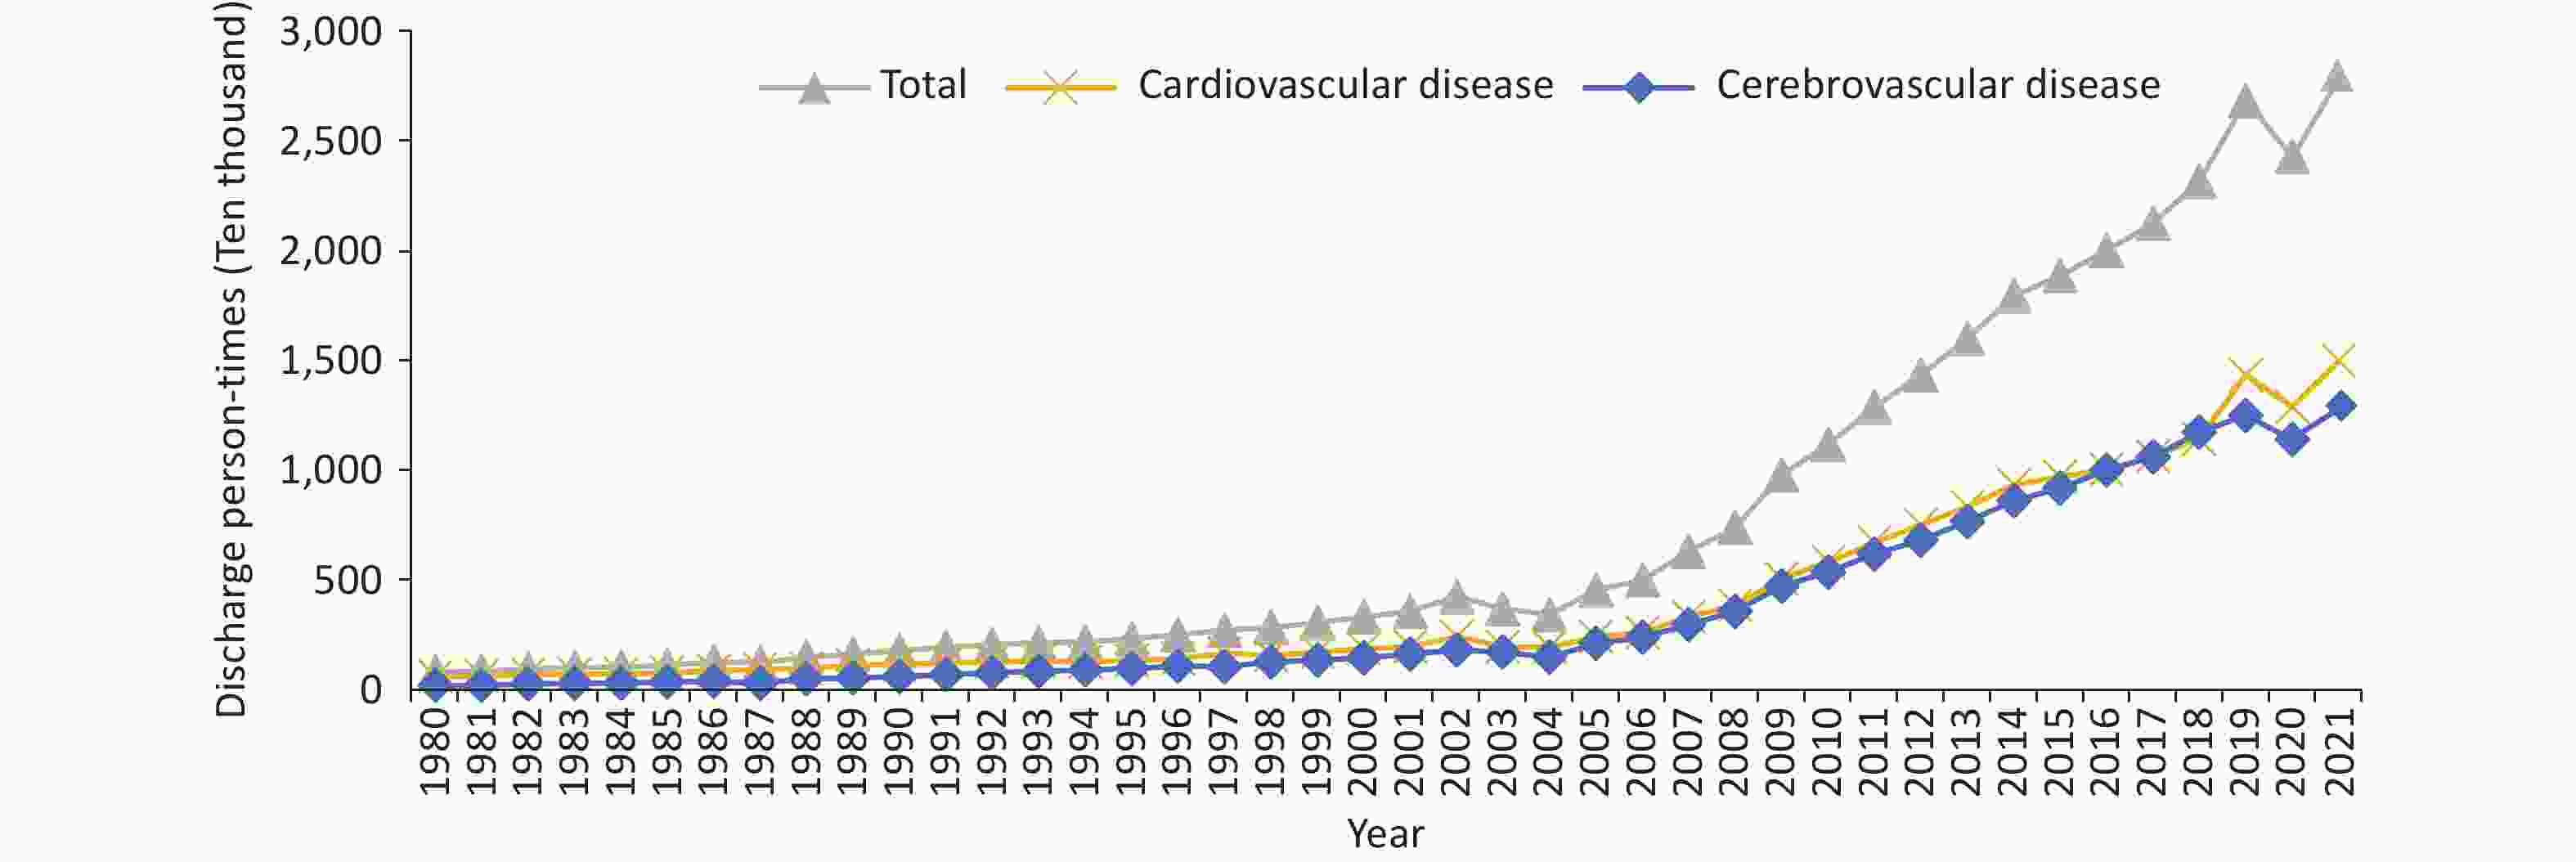
Figure 41. Trend of discharge person-times of patients with cardiovascular and cerebrovascular diseases in China from 1980 to 2021. Cardiovascular and cerebrovascular diseases include IHD (angina pectoris, AMI, and other IHDs), chronic rheumatic heart disease, acute rheumatic fever, pulmonary embolism, arrhythmia, HF, hypertension (including hypertensive heart disease and kidney disease), and cerebrovascular disease (including cerebral hemorrhage and cerebral infarction). Chronic rheumatic heart disease is not included in 2021. AMI, acute myocardial infarction. IHD, ischemic heart disease
Among the number of discharges of patients with cardiovascular and cerebrovascular diseases in 2021, IHD (9.4490 million person-times, including 4.1678 million person-times of angina pectoris and 1.1480 million person-times of AMI) and cerebral infarction (8.6243 million person-times) were identified as the main diagnoses, accounting for 34.17% and 31.19%, respectively. Figure 42 illustrated the changing trend in the number of discharges of patients with cardiovascular and cerebrovascular diseases and diabetes in China.
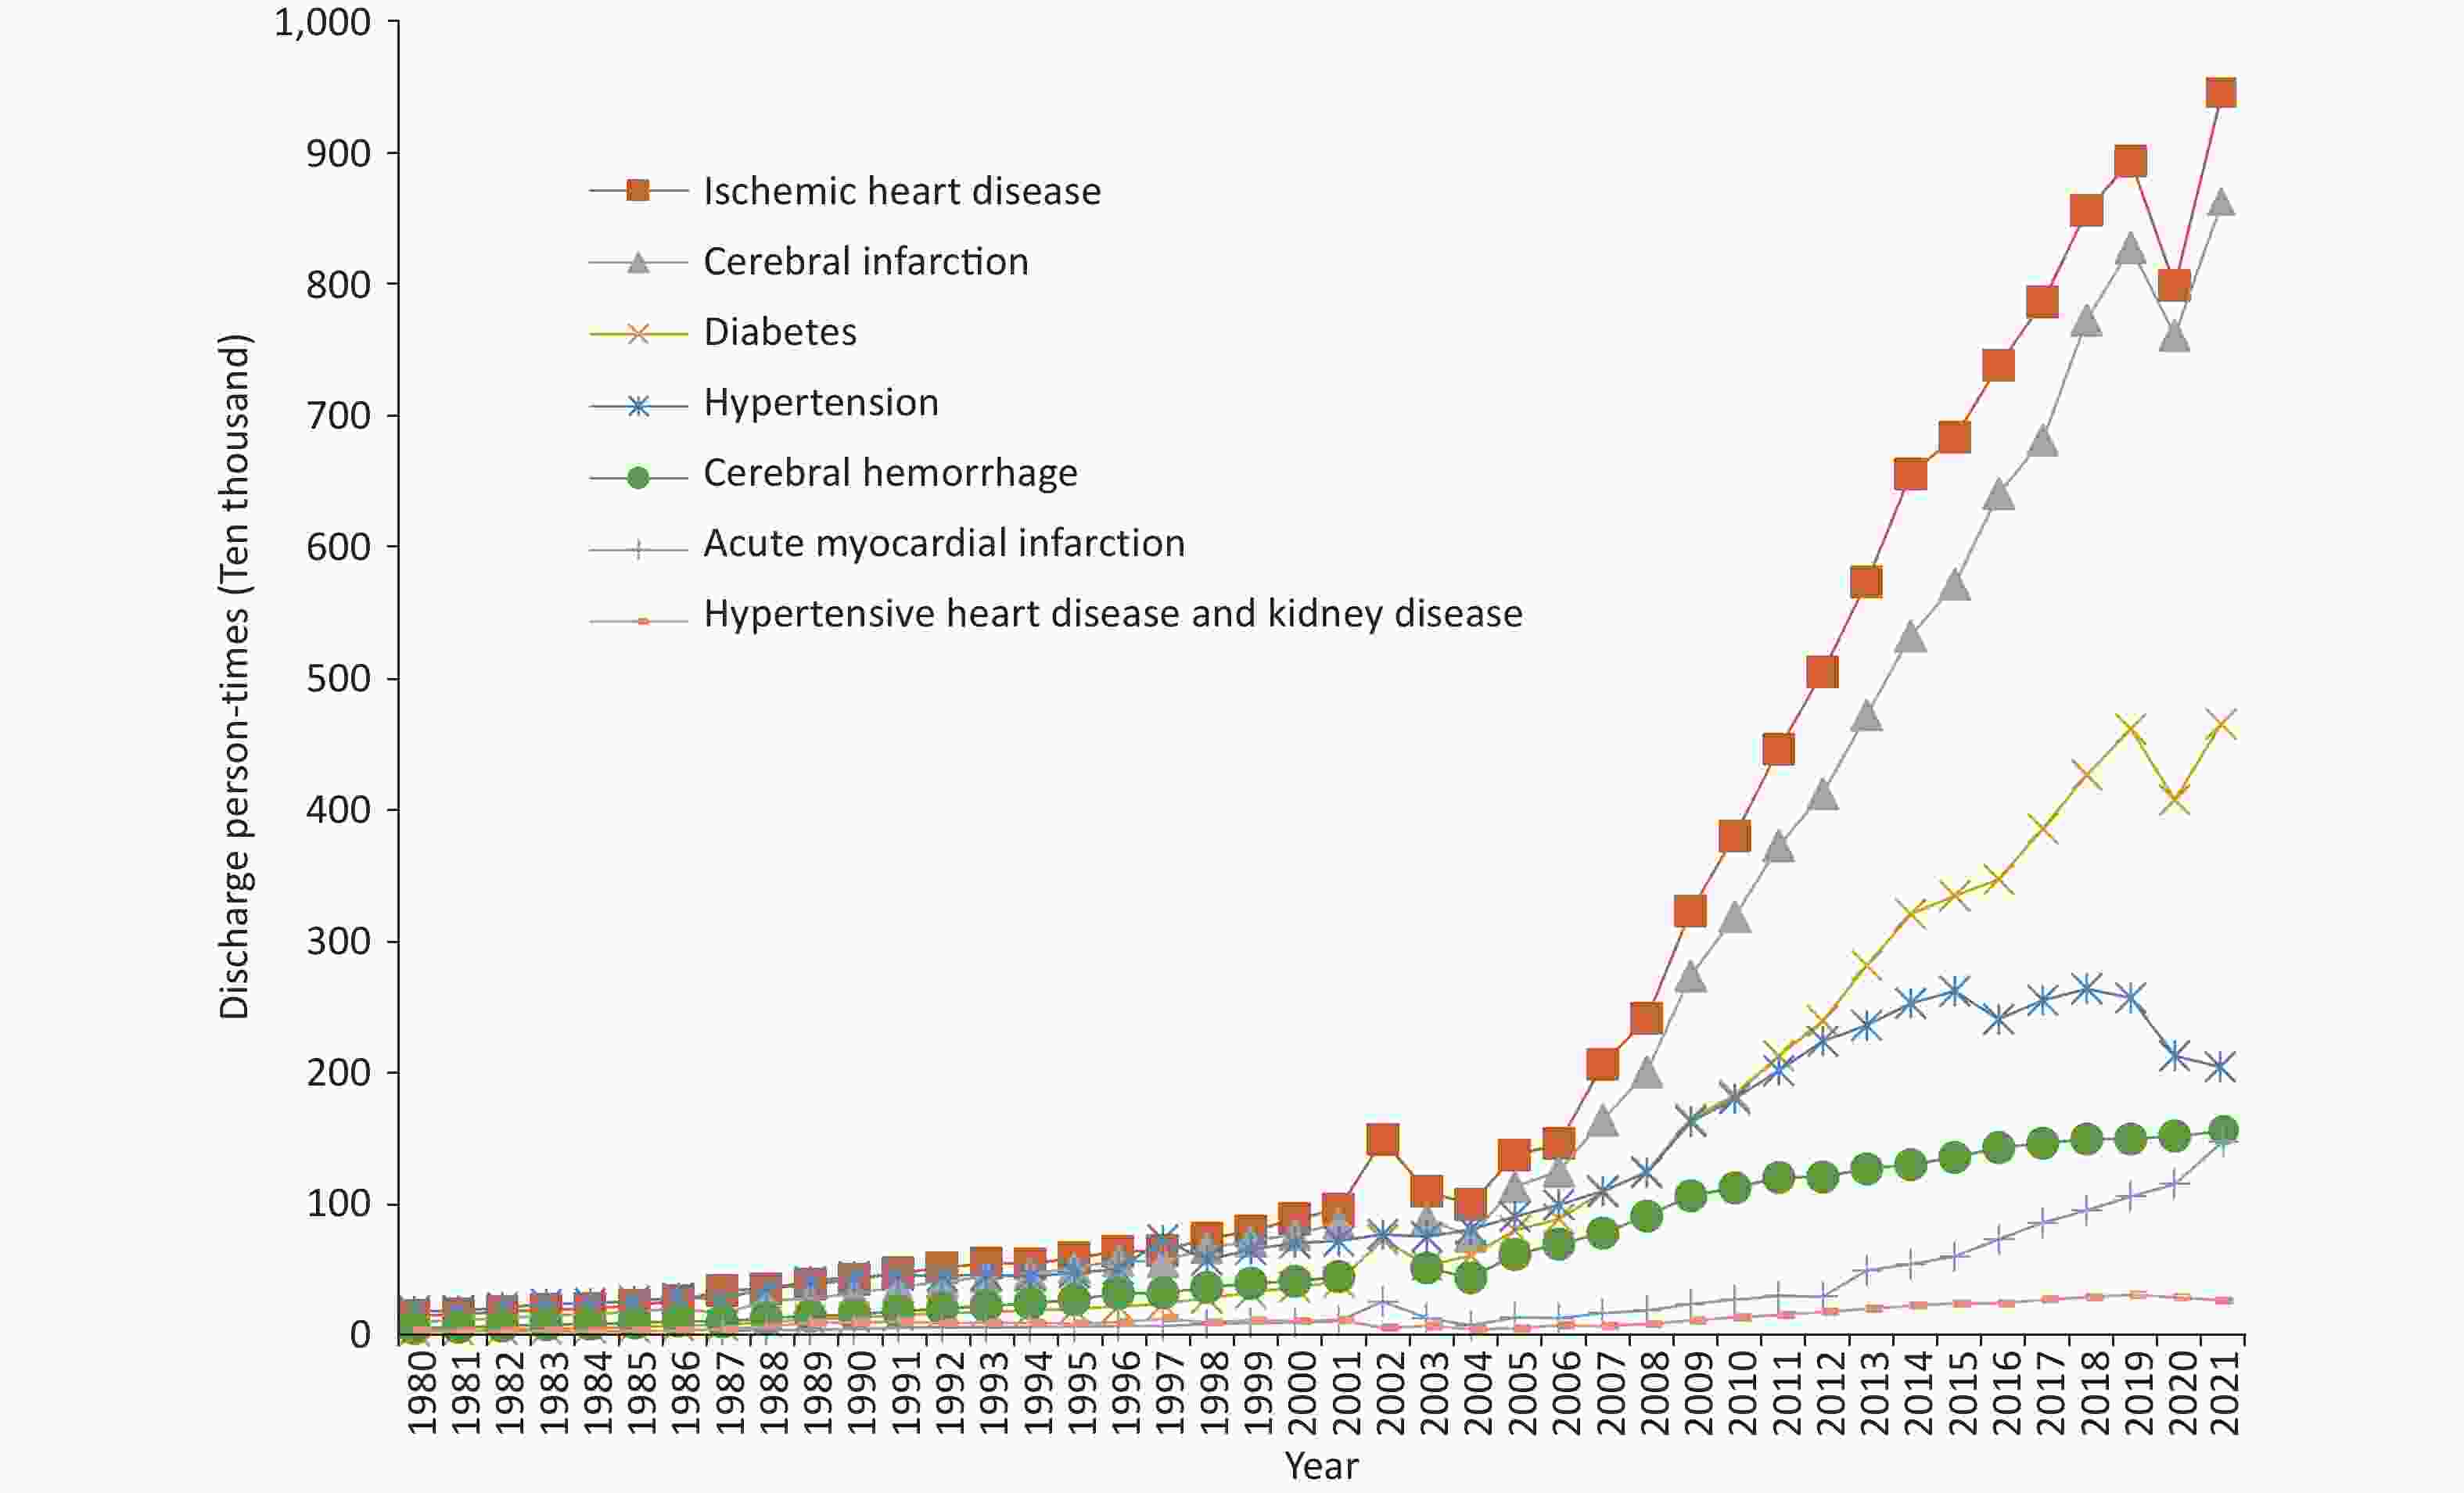
Figure 42. Trend of discharge person-times of certain patients with cardiovascular and cerebrovascular diseases and diabetes in China from 1980 to 2021.
According to HQMS data[95], the total number of discharges of patients with CVD based on the main diagnosis or non-main diagnosis was 51.870 million person-times in 2022. Hypertension accounted for the largest proportion of patients (67.9%, 35.243 million person-times), followed by CHD (33.1%, 17.145 million person-times), HF (19.8%, 10.290 million person-times), arrhythmia (16.0%, 8.318 million person-times), and valvular heart disease (3.6%, 1.882 million person-times).
In 2022, the total number of discharges of patients with CVD based on the main diagnosis was 12.254 million. Among the total number of discharges of patients with CVD, CHD accounted for the largest proportion of patients (50.0%, 6.127 million person-times), followed by HF (13.7%, 1.680 million person-times), hypertension (10.6%, 1.303 million person-times), arrhythmia (6.5%, 0.801 million person-times), and valvular heart disease (1.2%, 0.152 million person-times).
According to the HQMS data[95], the total hospitalization cost for CVD (excluding cerebrovascular disease) as the main diagnosis was 212.11 billion yuan in 2022, with the total hospitalization cost of CHD accounting for 43.9% (93.18 billion yuan). The remaining proportions of the total hospitalization cost were as follows: arrhythmia (10.7%, 22.76 billion yuan); HF (8.1%, 17.06 billion yuan); valvular heart disease (4.6%, 9.77 billion yuan); hypertension (4.4%, 9.30 billion yuan); aortic disease and PAD (3.9%, 8.32 billion yuan); congenital heart disease (2.6%, 5.60 billion yuan); pulmonary vascular disease (2.6%, 5.44 billion yuan); and cardiomyopathy (1.0%, 2.20 billion yuan).
In 2022, the average hospitalization cost per patient with CVD as the main diagnosis was 17,312.8 yuan. The average total hospitalization cost per patient with valvular heart disease was the highest (64,375.7 yuan), followed by arrhythmia (28,421.4 yuan), CHD (15,212.3 yuan), HF (10,156.7 yuan), and hypertension (7,135.1 yuan). In CHD and valvular heart disease, the proportion of material costs in the total hospitalization cost was higher than other costs, whereas the proportion of diagnosis costs was higher in HF, arrhythmia, and hypertension (Figure 43).
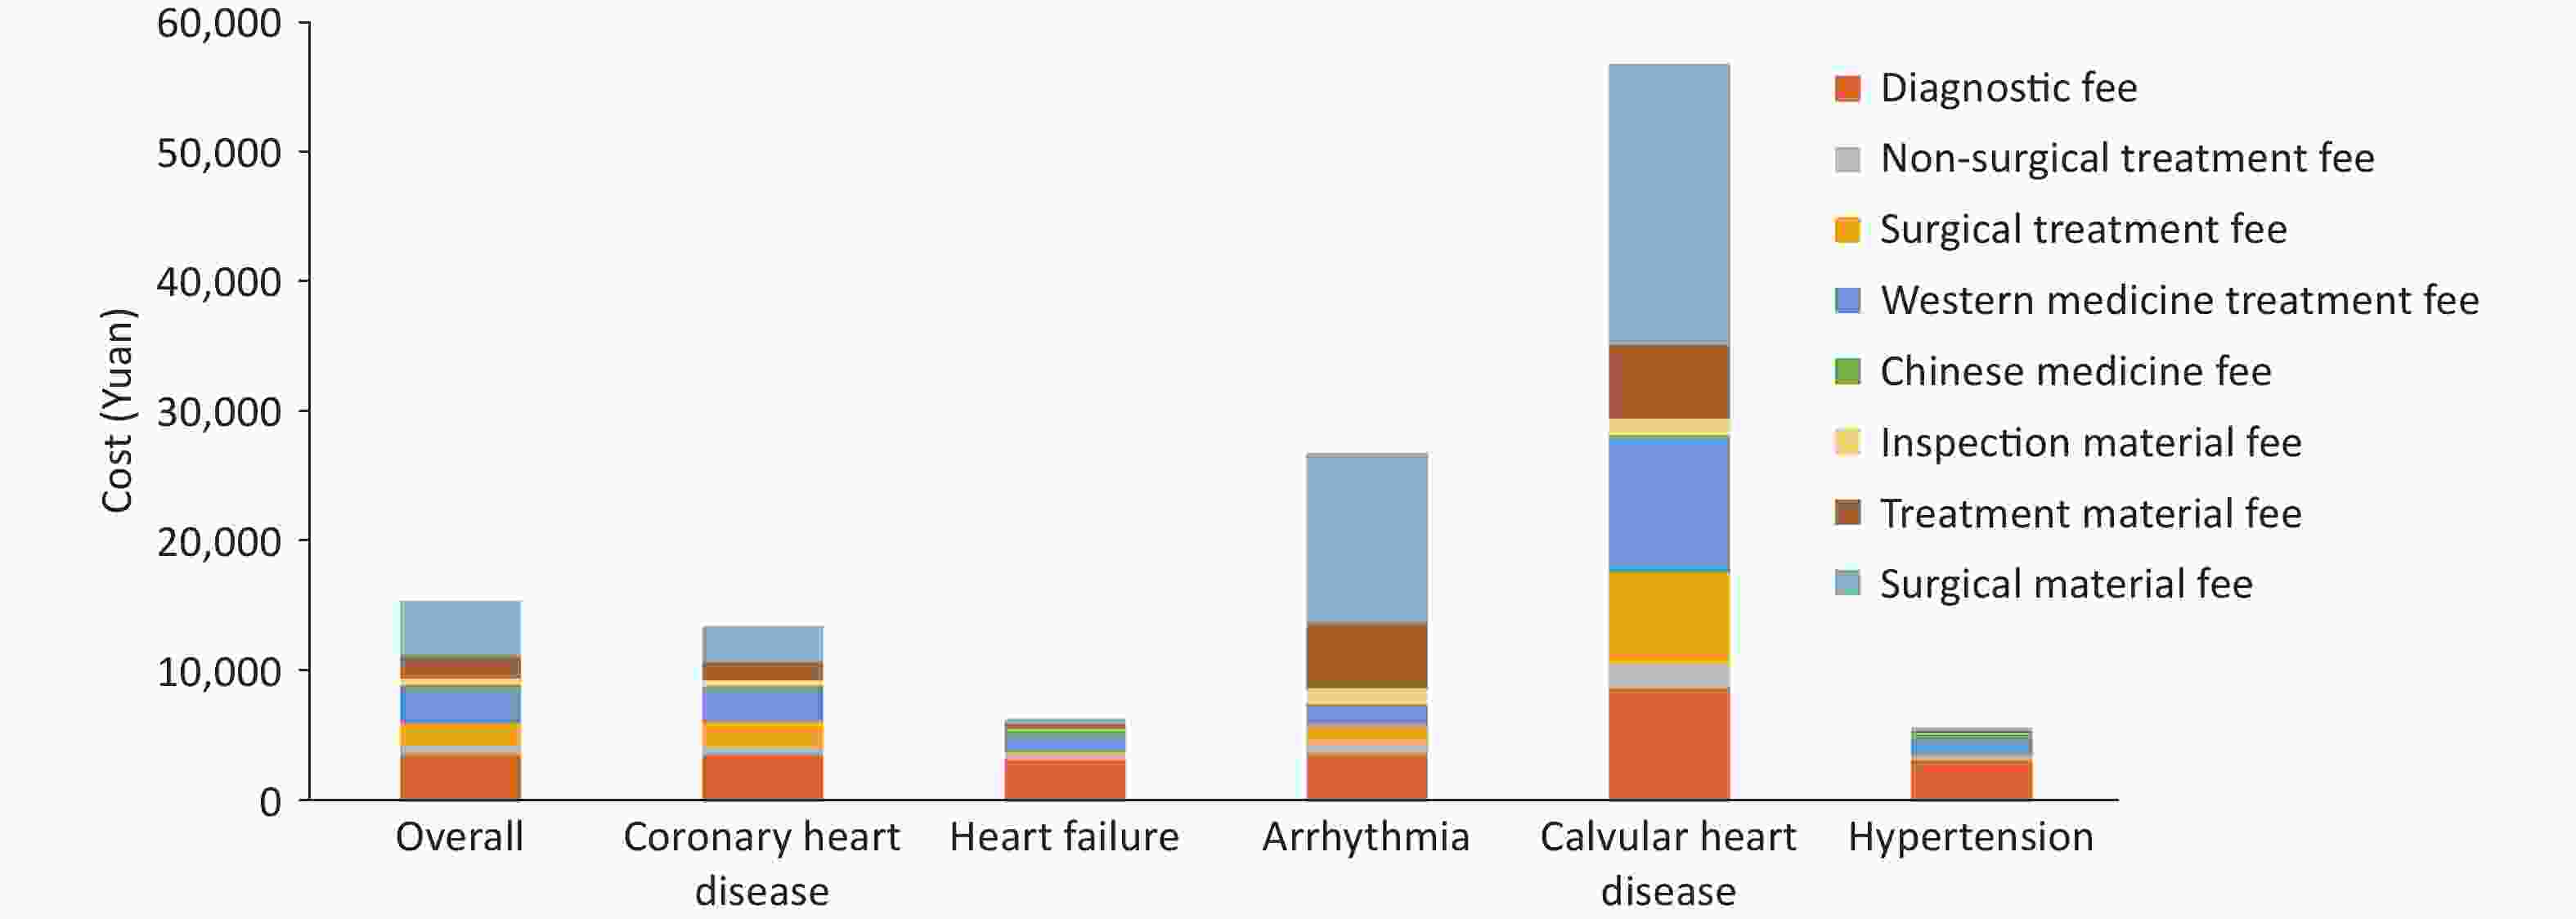
Figure 43. The average hospitalization expenses for cardiovascular diseases in general and different disease types in 2022.
In 2022, CVD treatment costs were concentrated among the older population. Overall, 64.9% of CVD treatment costs were spent on individuals aged ≥ 60 years. According to the age composition ratio of the seventh national census, starting from the age of 50, the proportion of CVD treatment costs begins to exceed the age composition ratio of the population. The largest gap was observed in those aged 70–79 years. Although this age group accounts for 5.0% of the total population, 24.6% of cardiovascular treatment costs were spent on these individuals (Figure 44).

Figure 44. Distribution of treatment costs for patients with cardiovascular diseases by age group in 2022.
Patients with CHD aged ≥ 30 years had the highest proportion of treatment costs (61.8%). Among patients under 30 years, the proportion of treatment costs for arrhythmia was higher, reaching 51.8% (Figure 45). Males had a higher proportion of CVD treatment costs (61.6%) than females. Among patients with CHD, HF, arrhythmia, valvular heart disease, and hypertension, males had a higher disease economic burden.
doi: 10.3967/bes2024.162
-
Abstract: Since 1990, China has made considerable progress in resolving the problem of “treatment difficulty” of cardiovascular diseases (CVD). The prevalent unhealthy lifestyle among Chinese residents has exposed a massive proportion of the population to CVD risk factors, and this situation is further worsened due to the accelerated aging population in China. CVD remains one of the greatest threats to the health of Chinese residents. In terms of the proportions of disease mortality among urban and rural residents in China, CVD has persistently ranked first. In 2021, CVD accounted for 48.98% and 47.35% of deaths in rural and urban areas, respectively. Two out of every five deaths can be attributed to CVD. To implement a national policy “focusing on the primary health institute and emphasizing prevention” and truly achieve a shift of CVD prevention and treatment from hospitals to communities, the National Center for Cardiovascular Diseases has organized experts from relevant fields across China to compile the “Report on Cardiovascular Health and Diseases in China” annually since 2005. The 2024 report is established based on representative, published, and high-quality big-data research results from cross-sectional and cohort population epidemiological surveys, randomized controlled clinical trials, large sample registry studies, and typical community prevention and treatment cases, along with data from some projects undertaken by the National Center for Cardiovascular Diseases. These firsthand data not only enrich the content of the current report but also provide a more timely and comprehensive reflection of the status of CVD prevention and treatment in China.
-
Key words:
- Cardiovascular disease /
- Risk factor /
- Prevalence /
- Mortality /
- Rehabilitation /
- Basic research /
- Medical device development /
- Health economics
注释:1) Conflicts of interest: -
Figure 10. Detection rates and predicted detection rates of overweight/obesity and obesity among children and adolescents aged 7–18 years in China from 1985 to 2019 and predicted detection rates. The “BMI Classification Standard for Screening Overweight and Obesity among School-aged Children and Adolescents in China”, established by the Working Group on Obesity in China, is utilized for determining overweight and obesity. BMI, body mass index.
Figure 11. The rates of overweight (A), obesity (B), and central obesity (C) among residents of different sexes and ages in China from 2020 to 2022. Overweight and obesity are determined based on Chinese criteria (Overweight: 24 kg/m2 ≤ BMI < 28 kg/m2; Obesity: BMI ≥ 28 kg/m2. Central obesity: Male waist circumference > 90 cm and female waist circumference > 85 cm). BMI: body mass index.
Figure 14. Prevalence of different types of dyslipidemia among Chinese adults.
CCDRFS, China Chronic Disease and Risk Factors Surveillance; CANCDS, Chinese Adults Nutrition and Chronic Diseases Surveillance; China-PEACE MPP, China-PEACE Million Persons Project; CNSSPP, China Stroke Screening and Prevention Project. TC, Total cholesterol; LDL-C, low-density lipoprotein cholesterol; HDL-C, High-density lipoprotein cholesterol; TG, triglyceride.
Figure 32. Comorbidities in patients with HF (A) and proportion of surgeries and procedures performed during hospitalization (B). HF, heart failure; COPD, chronic obstructive pulmonary disease; IABP, intra-aortic balloon pump; CRT, cardiac resynchronization therapy; ICD, implantable cardioverter-defibrillator; ECMO, extracorporeal membrane oxygenation.
Figure 33. Comparison of the standardized treatment of HF between the China-HF study and the American GWTG-HF study. China-HF study, China Heart Failure Registry Study; GWTG-HF study, Get with the Guidelines-Heart Failure Registry Study; RAS, renin-angiotensin system; ICD, Implantable cardioverter-defibrillator; CRT, cardiac resynchronization therapy; LVEF, left ventricular ejection fraction. *In the GWTG-HF study, patients with missing LVEF data were excluded during enrollment. Therefore, the rate of ultrasound assessment of cardiac function in the GWTG-HF study is 100%. #In the China-HF study, this value refers to the implantation rate of ICD/CRT, while in the GWTG-HF study, it refers to the implantation or recommended implantation rate of ICD/CRT.
Figure 41. Trend of discharge person-times of patients with cardiovascular and cerebrovascular diseases in China from 1980 to 2021. Cardiovascular and cerebrovascular diseases include IHD (angina pectoris, AMI, and other IHDs), chronic rheumatic heart disease, acute rheumatic fever, pulmonary embolism, arrhythmia, HF, hypertension (including hypertensive heart disease and kidney disease), and cerebrovascular disease (including cerebral hemorrhage and cerebral infarction). Chronic rheumatic heart disease is not included in 2021. AMI, acute myocardial infarction. IHD, ischemic heart disease
Table 1. Survey results on the prevalence of hypertension in China from 1958 to 2022
Study name Year Age (years old) Sampling method Sample size (number of individuals) Prevalence (%) Key project of Chinese Academy of Medical Sciences: Hypertension Research 1958–1959 ≥ 15 Non-random sampling 739,204 5.1 National Hypertension Sampling Survey 1979–1980 ≥ 15 Random sampling 4,012,128 7.7 National Hypertension Sampling Survey 1991 ≥ 15 Stratified random sampling 950,356 13.6 China Health and Nutrition Survey 2002 ≥ 18 Multi-stage stratified cluster random sampling 272,023 18.8 Chinese Residents Nutrition and Chronic Diseases Survey 2012 ≥ 18 Multi-stage stratified random sampling − 25.2 China Hypertension Survey 2012–2015 ≥ 18 Multi-stage stratified random sampling 451,755 27.9 (weighted rate 23.2) China Health and Nutrition Survey 2015 ≥ 20–79 Multi-stage stratified cluster random sampling 8,907 34.1 (standardized rate 25.6) China Chronic Disease and Risk Factor Surveillance 2018 ≥ 18 Multi-stage stratified cluster random sampling 179,873 27.5 (weighted rate) Chinese Residents CVD and Its Risk Factors Surveillance 2020–2022 ≥ 18 Multi-stage stratified cluster random sampling 298,438 31.6 (weighted rate) Note. −: No specific data. Table 2. Awareness, treatment, and control rates of hypertension in various studies in China
Study name Year Age (years) Sampling method Sample size (number of individuals) Awareness rate (%) Prevalence (%) Control rate (%) National Hypertension Sampling Survey 1991 ≥ 15 Multi-level random sampling 950,356 27.0 12.0 3.0 China Health and Nutrition Survey 2002 ≥ 18 Multi-stage stratified cluster random sampling 272,023 30.2 24.7 6.1 Chinese Residents Nutrition and Chronic Diseases Survey 2012 ≥ 18 Multi-stage stratified random sampling − 46.5 41.1 13.8 China Nutrition and Health Surveillance 2010–2012 ≥ 18 Multi-stage stratified cluster random sampling 120,428 46.5 41.1 14.6 Investigation of the prevalence, awareness, treatment, and control rates of hypertension in the Chinese working population 2012–2013 18–60 Multi-stage cluster sampling 37,856 57.6
(standardized rate 47.8)30.5
(standardized rate 20.6)11.2
(standardized rate 8.5)China Hypertension Survey 2012–2015 ≥ 18 Multi-stage stratified random sampling 451,755 51.6
(weighted rate 46.9)45.8
(weighted rate 40.7)16.8
(weighted rate 15.3)Early screening and comprehensive intervention program for high-risk groups of cardiovascular disease in China 2014 35–75 Convenience sampling 640,539 46.5 (standardized rate) 38.1 (standardized rate) 11.1 (standardized rate) China Health and Nutrition Survey 2015 20–79 Multi-stage stratified cluster random sampling 8,907 43.8 (standardized rate 27.2) 39.2 (standardized rate 23.6) 13.8 (standardized rate 8.4) China Chronic Disease and Risk Factor Surveillance 2018 ≥ 18 Multi-stage stratified cluster random sampling 179,873 41.0 (weighted rate) 34.9 (weighted rate) 11.0 (weighted rate) Chinese Residents CVD and Its Risk Factors Surveillance 2020–2022 ≥ 18 Multi-stage stratified cluster random sampling 298,438 43.3 (weighted rate) 38.7 (weighted rate) 12.9 (weighted rate) Note. −: No specific data. Table 3. Summary of cardiovascular research progress in 2022–2023
August 2021 to August 2022 (74 articles) August 2022 to October 2023 (97 articles) 1 CHD, heart injury/remodeling/regeneration 1 CHD, heart injury/remodeling/regeneration Non-coding RNA, MSC transplantation, TRIM16, macrophages, brown fat exosomes, CaMKII-δ, tyrosine-protein kinase, obesity, histone-binding protein 2, immunoglobulin E, epigenetics, LARP7, PTPMT1, GSDMD, LSD1, liver-heart axis, sodium channel inhibitor, phosphodiesterase 4B, RalGAPα1-RalA signaling axis, pioglitazone, and cardiolipin. CircRNA (Samd4), lysine crotonylation, LPA, FNDC5, PUFA, USP25 (deubiquitination), Fap, PIASy, ketone body, MG53, 3D printing, PDCD5, small molecule inhibitor s89, METTL14, DUSP6, TREM2, MMPP, TRPC, single cell, MRPS5, HIPK1, ACADL, FOXP1, cardiac patch, exosome, cell transplantation therapy, optogenetics, Tisp40, M2 macrophage, APOE, RNF27, ABRO1, gut microbiota, BACH1, TMEM, α-myosin heavy chain lactylation, and glutathione reductase 2 Arrhythmia 2 Sinoatrial node/arrhythmia/atrial fibrillation Calbindin 1 Hippo, LCR, Herg/PATL1, KCNQ1 gating characteristics, and neutrophil extracellular trap 3 Cardiomyopathy (hypertrophic cardiomyopathy and dilated cardiomyopathy) 3 Cardiomyopathy (hypertrophic cardiomyopathy, dilated cardiomyopathy, diabetic cardiomyopathy) Gene therapy, histone-binding protein 1, ubiquitin ligase, and glycosylation Cannabinoid receptor 2, Jmjd4, Dectin-1 macrophage, single-cell sequencing, Kaposi's sarcoma-associated herpesvirus infection, Schisandra chinensis, mitochondrial function, gene therapy, metformin, and Ago2 4 Arterial dissection/aneurysm 4 Arterial dissection/aneurysm Erythropoietin, MALAT1, regulatory T cells, naringenin, Lgmn gene, succinic acid, and NR1D1 gene Best3, and endothelial tight junction 5 Atherosclerosis 5 Atherosclerosis S-adenosyl-L-cysteine, deubiquitinating enzyme USP9X, transcription factor BACH1, CTH/H2S, coagulation factor prekallikrein, YAP-TGF-β, PCSK9, PGC-1α, liver-derived angiotensinogen, shear stress, non-coding RNA, nuclear factor of activated T-cells c3, gut microbiota, autophagy, and nitric oxide synthase Cholesterol, gut microbiota, APOE, eosinophil, CCL17, GMD, brown fat, ultrasound-targeted nanomedicine, plastic particles, periodontitis-atherosclerosis association, and ANGPTL8 6 Vascular injury/remodeling/regeneration/calcification 6 Vascular injury/remodeling/regeneration/calcification Mitochondrial fusion protein 2, protein tyrosine phosphatase, tetrahydrobiopterin, matrix protein Nidogen-2, FcγRIIB, shear force, endothelial-mesenchymal transition (brain), heart valve, transcriptional mediator Med23, fibronectin FNDC5, and phospholipid small molecule LPA2 Nidogen-2, LncRNA (PSR), PHCDH, bile acid-FXR axis, endothelin, fish oil, Sema34, ferroptosis, and Sirtuin 2 7 Pulmonary hypertension miRNA-182, statins 7 Hypertension OVGP1 methylation and lymphangiogenesis-blood pressure 8 Others
Lineage tracing, cardiovascular events8 Others
Lineage tracing, platelets, heart transplantation, cardio-oncology, cardiorenal interaction, CIB2, cardiac imaging, stem cell related, PTBP1, heart development, mitochondrial disease model, anti-postoperative adhesion (Jaus gel), and myocarditisNote. RNA, ribonucleic acid; MSC, mesenchymal stem cell; TRIM, tripartite motif protein; CircRNA, circular RNA; CaMKII, calcium/calmodulin-dependent protein kinase II; LARP, La-related protein; FNDC5, fibronectin type III domain-containing protein 5; PUFA, polyunsaturated fatty acid; LSD1, Lysine-specific demethylase 1; PDCD5, programmed cell death molecule 5; DUSP6, dual specificity phosphatase 6; TREM2, microglial receptor-adaptor complex; MMPP, magnetic resonance imaging melanin nanoparticles; TRPC, canonical transient receptor potential; MRPS5, mitochondrial ribosomal protein S5; HIPK1, homeodomain-interacting protein kinase 1; ACADL, long-chain acyl-CoA dehydrogenase; MALAT1, metastasis-associated lung adenocarcinoma transcript 1; USP9X, ubiquitin-specific protease 9X; CTH, cystathionine-γ-lyase; H2S, hydrogen sulfide; YAP, Yes-associated protein; TGF-β, transforming growth factor-β; PCSK9, proprotein convertase subtilisin/kexin type 9; PGC-1α, peroxisome proliferator-activated receptor γ coactivator-1α; LCR, Local calcium release; FcγRIIB, Receptor IIB for the Fc portion of immunoglobulin G; LPA, lysophosphatidic acid; miRNA: microRNA; GMD, Nyingchi derivative; CCL17, CC motif chemokine ligand 17; ANGPTL8, angiopoietin-like protein 8; FXR, farnesoid X receptor; PHCDH, Phosphoglycerate dehydrogenase; Sirtuin 2, Sirtuin 2; LncRNA, Long non-coding RNA; OVGP1, oviductal glycoprotein 1; PTBP1, polypyrimidine tract-binding protein 1; CIB2, calcium and integrin-binding protein 2. CHD, coronary heart disease. -
[1] Wang H, Zhang H, Zou ZY. Changing profiles of cardiovascular disease and risk factors in China: a secondary analysis for the Global Burden of Disease Study 2019. Chin Med J, 2023; 136, 2431−41. doi: 10.1097/CM9.0000000000002741 [2] Wang W, Liu YN, Liu JM, et al. Mortality and years of life lost of cardiovascular diseases in China, 2005-2020: empirical evidence from national mortality surveillance system. Int J Cardiol, 2021; 340, 105−12. doi: 10.1016/j.ijcard.2021.08.034 [3] National Health Commission. China health statistics yearbook 2022. Peking Union Medical College Press. 2022. (In Chinese) [4] Li YC, Liu SW, Zeng XY, et al. Report on burden of cardiovascular diseases from 1990 to 2016 in China. Chin Circ J, 2019; 34, 729−40. (In Chinese) [5] Liu SW, Li YC, Zeng XY, et al. Burden of cardiovascular diseases in China, 1990-2016: findings from the 2016 Global Burden of Disease Study. JAMA Cardiol, 2019; 4, 342−52. doi: 10.1001/jamacardio.2019.0295 [6] Ma QF, Li R, Wang LJ, et al. Temporal trend and attributable risk factors of stroke burden in China, 1990-2019: an analysis for the Global Burden of Disease Study 2019. Lancet Public Health, 2021; 6, e897−906. doi: 10.1016/S2468-2667(21)00228-0 [7] Sun T, Chen SY, Wu K, et al. Trends in incidence and mortality of stroke in China from 1990 to 2019. Front Neurol, 2021; 12, 759221. doi: 10.3389/fneur.2021.759221 [8] GBD 2019 Tobacco Collaborators. Spatial, temporal, and demographic patterns in prevalence of smoking tobacco use and attributable disease burden in 204 countries and territories, 1990-2019: a systematic analysis from the Global Burden of Disease Study 2019. Lancet, 2021; 397, 2337−60. doi: 10.1016/S0140-6736(21)01169-7 [9] Liu Z, Li YH, Cui ZY, et al. Prevalence of tobacco dependence and associated factors in China: findings from nationwide China Health Literacy Survey during 2018-19. Lancet Reg Health West Pac, 2022; 24, 100464. [10] Chan KH, Wright N, Xiao D, et al. Tobacco smoking and risks of more than 470 diseases in China: a prospective cohort study. Lancet Public Health, 2022; 7, e1014−26. doi: 10.1016/S2468-2667(22)00227-4 [11] Zheng YT, Wu YQ, Wang MY, et al. Impact of a comprehensive tobacco control policy package on acute myocardial infarction and stroke hospital admissions in Beijing, China: interrupted time series study. Tob Control, 2021; 30, 434−42. doi: 10.1136/tobaccocontrol-2020-055663 [12] Wu YQ, Wang ZJ, Zheng YT, et al. Trends in hospital admissions for chronic obstructive pulmonary diseases after comprehensive tobacco control policies in Beijing, China. Nicotine Tob Res, 2022; 24, 1978−84. doi: 10.1093/ntr/ntac137 [13] Shi YL, Xiong JF, Liu LQ, et al. Impact of smoke-free legislation on acute myocardial infarction and subtypes of stroke incidence in Shenzhen, China, 2012-2016: an Interrupted time series analysis. Biomed Environ Sci, 2023; 36, 527−36. [14] National Disease Control and Prevention Administration. Report on nutrition and chronic diseases of Chinese residents (2020). People’s Medical Publishing House. 2021. (In Chinese) [15] Zhao LY, Ding GQ, Zhao WH. Surveillance report on nutrition and health status of Chinese residents from 2015 to 2017. People’s Medical Publishing House. 2022. (In Chinese) [16] Huang K, Fang HY, Yu DM, et al. Usual intake of micronutrients and prevalence of inadequate intake among Chinese adults: data from CNHS 2015-2017. Nutrients, 2022; 14, 4714. doi: 10.3390/nu14224714 [17] Fang YH, Xia J, Lian YY, et al. The burden of cardiovascular disease attributable to dietary risk factors in the provinces of China, 2002-2018: a nationwide population-based study. Lancet Reg Health West Pac, 2023; 37, 100784. [18] Liu CY, Wang LM, Gao XX, et al. Intake of vegetables and fruit among adults in China in 2018. Chin J Prev Control Chronic Dise, 2022; 30, 561−6. (In Chinese) [19] Zhang ST, Wang LS, Jia XF, et al. A comparison between dietary consumption status and healthy dietary pattern among adults aged 55 and older in China. Nutrients, 2022; 14, 2778. doi: 10.3390/nu14132778 [20] Ju LH, Zhao LY, Fang HY, et al. Main food intakes of Chinese children aged 6 – 17 years, 2016 – 2017: surveillance data-based evaluation. Chin J Public Health, 2023; 39, 550−5. (In Chinese) [21] Xu Y, Gan Q, Zhang Q, et al. Association of beverages intake with myopia among 11-14-year-old Chinese children in 2019-2021. J Hyg Res, 2023; 51, 707−12,719. (In Chinese) [22] Zhu JF, Gu JC, Yang MQ, et al. Ischemic heart disease burden attributable to high-salt diet and the trend change from 1990 to 2019 in China. Chin Circ J, 2023; 38, 337−42. (In Chinese) [23] Xu Y, Li ZX, Ma Y, et al. Disease burden of type 2 diabetes mellitus attributable to dietary factors in Chinese residents aged 15 and above from 1990 to 2019. Chin Circ J, 2022; 37, 1016−22. (In Chinese) [24] Li L, Yang HY, Ma Y, et al. Whole fresh fruit intake and risk of incident diabetes in different glycemic stages: a nationwide prospective cohort investigation. Eur J Nutr, 2023; 62, 771−782. [25] Li M, Shi ZM. Association between ultra-processed food consumption and diabetes in Chinese Adults-results from the China Health and Nutrition Survey. Nutrients, 2022; 14, 4241. doi: 10.3390/nu14204241 [26] Li M, Shi ZM. Ultra-processed food consumption associated with incident hypertension among Chinese adults-results from China Health and Nutrition Survey 1997-2015. Nutrients, 2022; 14, 4783. doi: 10.3390/nu14224783 [27] Zhao LG, Li HL, Liu DK, et al. Dietary glycemic index, glycemic load, and cause-specific mortality: two population-based prospective cohort studies. Eur J Clin Nutr, 2022; 76, 1142−9. doi: 10.1038/s41430-022-01083-9 [28] Yang YX, Yu DM, Piao W, et al. Nutrient-derived beneficial for blood pressure dietary pattern associated with hypertension prevention and control: based on China Nutrition and Health Surveillance 2015-2017. Nutrients, 2022; 14, 3108. doi: 10.3390/nu14153108 [29] Chinese Center for Disease Control and Prevention, Chronic Non communicable Disease Prevention and Control Center of China Center for Disease Control and Prevention. Report on chronic disease risk factor surveillance in China 2018. People's Health Publishing House. 2021. (In Chinese) [30] Li C, Wang LM, Zhang X, et al. Leisure-time physical activity among Chinese adults — China, 2015. China CDC Wkly, 2020; 2, 671−7. [31] Song Y, Luo DM, Hu PJ, et al. Trends of prevalence of excellent health status and physical fitness among Chinese Han students aged 13 to 18 years from 1985 to 2014. J Peking Univ (Health Sci), 2020; 52, 317−22. (In Chinese) [32] Yang X, Leung AW, Jago R, et al. Physical activity and sedentary behaviors among Chinese children: recent trends and correlates. Biomed Environ Sci, 2021; 34, 425−38. [33] Chen PJ. Report on physical activity and fitness in China the youth study (2016). Science Press. 2018. (In Chinese) [34] Cai YJ, Zhu XH, Wu XP. Physical activity among Chinese school-aged children: national prevalence estimates from the 2016 Physical Activity and Fitness in China-The Youth Study. J Sport Health Sci, 2017; 6, 404−9. doi: 10.1016/j.jshs.2017.09.002 [35] Zhu Z, Tang Y, Zhuang J, et al. Physical activity, screen viewing time, and overweight/obesity among Chinese children and adolescents: an update from the 2017 physical activity and fitness in China-the youth study. BMC Public Health, 2019; 19, 197. doi: 10.1186/s12889-019-6515-9 [36] Xin F, Zhu Z, Chen ST, et al. Prevalence and correlates of meeting the muscle-strengthening exercise recommendations among Chinese children and adolescents: results from 2019 physical activity and fitness in China-the youth study. J Sport Health Sci, 2022; 11, 358−66. doi: 10.1016/j.jshs.2021.09.010 [37] Strain T, Brage S, Sharp SJ, et al. Use of the prevented fraction for the population to determine deaths averted by existing prevalence of physical activity: a descriptive study. Lancet Glob Health, 2020; 8, e920−30. doi: 10.1016/S2214-109X(20)30211-4 [38] Bennett DA, Du HD, Clarke R, et al. Association of physical activity with risk of major cardiovascular diseases in Chinese men and women. JAMA Cardiol, 2017; 2, 1349−58. doi: 10.1001/jamacardio.2017.4069 [39] Fan MY, Lv J, Yu CQ, et al. Association between active commuting and incident cardiovascular diseases in Chinese: a prospective cohort study. J Am Heart Assoc, 2019; 8, e012556. doi: 10.1161/JAHA.119.012556 [40] Liu Q, Liu FC, Huang KY, et al. Beneficial effects of moderate to vigorous physical activity on cardiovascular disease among Chinese adults. J Geriatr Cardiol, 2020; 17, 85−95. [41] Hu P, Zheng MR, Huang J, et al. Association of habitual physical activity with the risk of all-cause mortality among Chinese adults: a prospective cohort study. Frontiers Public Health, 2022; 10, 919306. doi: 10.3389/fpubh.2022.919306 [42] Wang YH, Liu Y, Hu JJ, et al. Association of handgrip strength with all-cause mortality: a nationally longitudinal cohort study in China. J Sci Med Sport, 2022; 25, 878−83. doi: 10.1016/j.jsams.2022.08.005 [43] Dong YH, Chen L, Liu JY, et al. Epidemiology and prediction of overweight and obesity among children and adolescents aged 7-18 years in China from 1985 to 2019. Chin J Prev Med, 2023; 57, 461−9. (In Chinese) [44] Yang YP, Song LL, Wang LL, et al. Effect of body mass index trajectory on lifetime risk of cardiovascular disease in a Chinese population: a cohort study. Nutr Metab Cardiovasc Dis, 2023; 33, 523−31. doi: 10.1016/j.numecd.2022.11.025 [45] Global Burden Disease 2019. Global health data exchange. (2022-08-27)[2024-07-06]. [46] Tian X, Chen SH, Wang PL, et al. Insulin resistance mediates obesity-related risk of cardiovascular disease: a prospective cohort study. Cardiovasc Diabetol, 2022; 21, 289. doi: 10.1186/s12933-022-01729-9 [47] Zhang M, Wu J, Zhang X, et al. Prevalence and control of hypertension in adults in China, 2018. Chin J Epidemiol, 2021; 42, 1780−9. (In Chinese) [48] Chen L, Zhang Y, Ma T, et al. Prevalence trend of high normal blood pressure and elevated blood pressure in Chinese Han children and adolescents aged 7-17 years from 2010 to 2019. Chin J Prev Med, 2023; 57, 499−507. (In Chinese) [49] Luo YM, Xia F, Yu XX, et al. Long-term trends and regional variations of hypertension incidence in China: a prospective cohort study from the China Health and Nutrition Survey, 1991-2015. BMJ Open, 2021; 11, e042053. doi: 10.1136/bmjopen-2020-042053 [50] Zhang M, Shi Y, Zhou B, et al. Prevalence, awareness, treatment, and control of hypertension in China, 2004-18: findings from six rounds of a national survey. BMJ, 2023; 380, e071952. [51] Yi Q, Zha MM, Yang QW, et al. Trends in the prevalence of hypertension according to severity and phenotype in Chinese adults over two decades (1991-2015). J Clin Hypertens (Greenwich), 2021; 23, 1302−15. doi: 10.1111/jch.14306 [52] Wang ZW, Chen Z, Zhang LF, et al. Status of hypertension in China: results from the China Hypertension Survey, 2012-2015. Circulation, 2018; 137, 2344−56. doi: 10.1161/CIRCULATIONAHA.117.032380 [53] Yuan YF, Jin AM, Neal B, et al. Salt substitution and salt-supply restriction for lowering blood pressure in elderly care facilities: a cluster-randomized trial. Nat Med, 2023; 29, 973−81. doi: 10.1038/s41591-023-02286-8 [54] Zhou MG, Wang HD, Zeng XY, et al. Mortality, morbidity, and risk factors in China and its provinces, 1990-2017: a systematic analysis for the Global Burden of Disease Study 2017. Lancet, 2019; 394, 1145−58. doi: 10.1016/S0140-6736(19)30427-1 [55] Cao X, Zhao ZP, Kang YT, et al. The burden of cardiovascular disease attributable to high systolic blood pressure across China, 2005-18: a population-based study. Lancet Public Health, 2022; 7, e1027−40. doi: 10.1016/S2468-2667(22)00232-8 [56] Zhao WH, Zhang J, You Y, et al. Epidemiologic characteristics of dyslipidemia in people aged 18 years and over in China. Chin J Prev Med, 2005; 39, 306−10. (In Chinese) [57] Pan L, Yang ZH, Wu Y, et al. The prevalence, awareness, treatment and control of dyslipidemia among adults in China. Atherosclerosis, 2016; 248, 2−9. doi: 10.1016/j.atherosclerosis.2016.02.006 [58] Dai J, Min JQ, Yang YJ. A study on the epidemic characteristics of dyslipidemia in adults of nine provinces of China. Chin J Cardiol, 2018; 46, 114−8. (In Chinese) [59] National Health and Family Planning Commission. Report on the status of nutrition and chronic diseases among Chinese residents (2015). People’s Health Publishing House. 2015. (In Chinese) [60] Li SN, Zhang LF, Wang X, et al. Status of dyslipidemia among adults aged 35 years and above in China. Chin Circ J, 2019; 34, 681−7. (In Chinese) [61] Lu Y, Zhang HB, Lu JP, et al. Prevalence of dyslipidemia and availability of lipid-lowering medications among primary health care settings in China. JAMA Network Open, 2021; 4, e2127573. doi: 10.1001/jamanetworkopen.2021.27573 [62] Zhang M, Deng Q, Wang LH, et al. Prevalence of dyslipidemia and achievement of low-density lipoprotein cholesterol targets in Chinese adults: a nationally representative survey of 163, 641 adults. Int J Cardiol, 2018; 260, 196−203. doi: 10.1016/j.ijcard.2017.12.069 [63] Song PK, Man QQ, Li H, et al. Trends in lipids level and dyslipidemia among Chinese adults, 2002-2015. Biomed Environ Sci, 2019; 32, 559−70. [64] Opoku S, Gan Y, Fu WN, et al. Prevalence and risk factors for dyslipidemia among adults in rural and urban China: findings from the China National Stroke Screening and prevention project (CNSSPP). BMC Public Health, 2019; 19, 1500. doi: 10.1186/s12889-019-7827-5 [65] NCD Risk Factor Collaboration (NCD-RisC). Repositioning of the global epicentre of non-optimal cholesterol. Nature, 2020; 582, 73−7. doi: 10.1038/s41586-020-2338-1 [66] Xu XH, Yang J, Wang LJ, et al. Burden of disease attributed to high level serum low-density lipoprotein cholesterol in China in 2017. Chin J Epidemiol, 2020; 41, 839−44. (In Chinese) [67] Dai HJ, Much AA, Maor E, et al. Global, regional, and national burden of ischaemic heart disease and its attributable risk factors, 1990-2017: results from the Global Burden of Disease Study 2017. Eur Heart J- Qual Care Clin Outcomes, 2022; 8, 50−60. doi: 10.1093/ehjqcco/qcaa076 [68] GBD 2019 Stroke Collaborators. Global, regional, and national burden of stroke and its risk factors, 1990-2019: a systematic analysis for the Global Burden of Disease Study 2019. Lancet Neurol, 2021; 20, 795−820. doi: 10.1016/S1474-4422(21)00252-0 [69] Li JH, Wang LM, Zhang M, et al. Awareness rate, treatment rate and control rate of dyslipidemia in Chinese adults, 2010. Chin J Prev Med, 2012; 46, 687−91. (In Chinese) [70] Yang WY, Xiao JZ, Yang ZJ, et al. Serum lipids and lipoproteins in Chinese men and women. Circulation, 2012; 125, 2212−21. doi: 10.1161/CIRCULATIONAHA.111.065904 [71] Teng HB, Gao Y, Wu CQ, et al. Prevalence and patient characteristics of familial hypercholesterolemia in a Chinese population aged 35-75 years: results from China PEACE Million Persons Project. Atherosclerosis, 2022; 350, 58−64. doi: 10.1016/j.atherosclerosis.2022.03.027 [72] Xing YY, Liu J, Hao YC, et al. Prehospital statin use and low-density lipoprotein cholesterol levels at admission in acute coronary syndrome patients with history of myocardial infarction or revascularization: findings from the Improving Care for Cardiovascular Disease in China (CCC) project. Am Heart J, 2019; 212, 120−8. doi: 10.1016/j.ahj.2019.02.019 [73] Xing YY, Liu J, Liu J, et al. Statin use and low-density lipoprotein cholesterol levels in patients aged 75 years and older with acute coronary syndrome in China. Chin J Cardiol, 2019; 47, 351−9. (In Chinese) [74] Gong YJ, Li X, Ma X, et al. Lipid goal attainment in post-acute coronary syndrome patients in China: results from the 6-month real-world dyslipidemia international study II. Clin Cardiol, 2021; 44, 1575−85. doi: 10.1002/clc.23725 [75] Bi L, Yi JY, Wu CQ, et al. Atherosclerotic cardiovascular disease risk and lipid-lowering therapy requirement in China. Front Cardiovasc Med, 2022; 9, 839571. doi: 10.3389/fcvm.2022.839571 [76] Li YZ, Teng D, Shi XG, et al. Prevalence of diabetes recorded in mainland China using 2018 diagnostic criteria from the American Diabetes Association: national cross sectional study. BMJ, 2020; 369, m997. [77] Yang C, Wang HB, Zhao XJ, et al. CKD in China: evolving spectrum and public health implications. Am J Kidney Dis, 2020; 76, 258−64. doi: 10.1053/j.ajkd.2019.05.032 [78] Wang LM, Xu X, Zhang M, et al. Prevalence of chronic kidney disease in China: results from the Sixth China Chronic Disease and Risk Factor Surveillance. JAMA Intern Med, 2023; 183, 298−310. doi: 10.1001/jamainternmed.2022.6817 [79] Zhang LX, Wang F, Wang L, et al. Prevalence of chronic kidney disease in China: a cross-sectional survey. Lancet, 2012; 379, 815−22. doi: 10.1016/S0140-6736(12)60033-6 [80] Zhang LX, Zhao MH, Zuo L, et al. China Kidney Disease Network (CK-NET) 2016 Annual Data Report. Kidney Int Suppl (2011), 2020; 10, e97−185. doi: 10.1016/j.kisu.2020.09.001 [81] Wang J, Wu JX, Liu JM, et al. Prevalence of sleep disturbances and associated factors among Chinese residents: a web-based empirical survey of 2019. J Glob Health, 2023; 13, 04071. doi: 10.7189/jogh.13.04071 [82] Li L, Li L, Chai JX, et al. Prevalence of poor sleep quality in patients with hypertension in China: a meta-analysis of comparative studies and epidemiological surveys. Front Psychiatry, 2020; 11, 591. [83] Huang YQ, Wang Y, Wang H, et al. Prevalence of mental disorders in China: a cross-sectional epidemiological study. Lancet Psychiatry, 2019; 6, 211−24. doi: 10.1016/S2215-0366(18)30511-X [84] Jia ZX, Du X, Du J, et al. Prevalence and factors associated with depressive and anxiety symptoms in a Chinese population with and without cardiovascular diseases. J Affect Disord, 2021; 286, 241−7. doi: 10.1016/j.jad.2021.02.006 [85] Wu M, Zhu YQ, Lv J, et al. Association of anxiety with cardiovascular disease in a Chinese cohort of 0.5 million adults. J Affect Disord, 2022; 315, 291−6. doi: 10.1016/j.jad.2022.08.008 [86] Fang W, Li ZX, Gao JH, et al. The joint and interaction effect of high temperature and humidity on mortality in China. Environ Int, 2023; 171, 107669. doi: 10.1016/j.envint.2022.107669 [87] Yin P, Chen RJ, Wang LJ, et al. The added effects of heatwaves on cause-specific mortality: a nationwide analysis in 272 Chinese cities. Environ Int, 2018; 121, 898−905. doi: 10.1016/j.envint.2018.10.016 [88] Chen RJ, Yin P, Wang LJ, et al. Association between ambient temperature and mortality risk and burden: time series study in 272 main Chinese cities. BMJ, 2018; 363, k4306. [89] Yang J, Yin P, Zhou MG, et al. Cardiovascular mortality risk attributable to ambient temperature in China. Heart, 2015; 101, 1966−72. doi: 10.1136/heartjnl-2015-308062 [90] Ministry of Ecology and Environment of the People’s Republic of China. 2021 Report on the state of the ecology and environment. (2022-05-26)[2024-05-26]. (In Chinese) [91] Yu K, Lv J, Qiu GK, et al. Cooking fuels and risk of all-cause and cardiopulmonary mortality in urban China: a prospective cohort study. Lancet Glob Health, 2020; 8, e430−9. doi: 10.1016/S2214-109X(19)30525-X [92] Qiu SY, Chen XF, Chen XF, et al. Solid fuel use, socioeconomic indicators and risk of cardiovascular diseases and all-cause mortality: a prospective cohort study in a rural area of Sichuan, China. Int J Epidemiol, 2022; 51, 501−13. doi: 10.1093/ije/dyab191 [93] Meng WJ, Shen GF, Shen HZ, et al. Synergistic health benefits of household stove upgrading and energy switching in rural China. Environ Sci Technol, 2021; 55, 14567−75. doi: 10.1021/acs.est.1c04242 [94] Cao X, Tang HS, Zheng CY, et al. Association of heating fuel types with mortality and cardiovascular events among non-smokers in China. Environ Pollut, 2021; 291, 118207. doi: 10.1016/j.envpol.2021.118207 [95] National Center for Cardiovascular Quality Improvement. Report on the national medical service and quality safety in 2023. China Union Medical College Press. 2024. (In Chinese) [96] Zhang DW, Gu DC, Rao CF, et al. Outcome differences between surgeons performing first and subsequent coronary artery bypass grafting procedures in a day: a retrospective comparative cohort study. BMJ Qual Saf, 2023; 32, 192−201. doi: 10.1136/bmjqs-2021-014244 [97] Dong XJ, Ding F, Zhou SD, et al. Optimizing an emergency medical dispatch system to improve prehospital diagnosis and treatment of acute coronary syndrome: nationwide retrospective study in China. J Med Internet Res, 2022; 24, e36929. doi: 10.2196/36929 [98] Cai AP, Qiu WD, Zhou YL, et al. Clinical characteristics and 1-year outcomes in hospitalized patients with heart failure with preserved ejection fraction: results from the China cardiovascular association database-heart failure center registry. Eur J Heart Fail, 2022; 24, 2048−62. doi: 10.1002/ejhf.2654 [99] Zhang YH, Gao CY, Greene SJ, et al. Clinical performance and quality measures for heart failure management in China: the China-heart failure registry study. ESC Heart Fail, 2023; 10, 342−52. doi: 10.1002/ehf2.14184 [100] Chinese Society of Biomedical Engineering Extracorporeal Circulation Branch. White book of Chinese cardiovascular surgery and extracorporeal circulation in 2022. Chin J Extracorpor Circ, 2023; 21, 197−200. (In Chinese) [101] Lin HY, Chang Y, Zhou HY, et al. Early results of frozen elephant trunk in acute type-A dissection in 1445 patients. Int J Cardiol, 2023; 389, 131213. doi: 10.1016/j.ijcard.2023.131213 [102] Zhao R, Qiu JT, Dai L, et al. Current surgical management of acute type A aortic dissection in China: a multicenter registry study. JACC: Asia, 2022; 2, 869−78. doi: 10.1016/j.jacasi.2022.08.009 [103] Qin YL, Wang F, Li TX, et al. Endovascular repair compared with medical management of patients with uncomplicated type B acute aortic dissection. J Am Coll Cardiol, 2016; 67, 2835−42. doi: 10.1016/j.jacc.2016.03.578 [104] Zhou YP, Wei YP, Yang YJ, et al. Percutaneous pulmonary angioplasty for patients with Takayasu arteritis and pulmonary hypertension. J Am Coll Cardiol, 2022; 79, 1477−88. [105] Zhang SS, Ding RJ, Chen SK, et al. Availability and trend of dissemination of cardiac rehabilitation in China: report from the multicenter national registration platform between 2012 and 2021. Front Cardiovasc Med, 2023; 10, 1210068. doi: 10.3389/fcvm.2023.1210068 [106] National Center for Cardiovascular Diseases. Report on cardiovascular health and diseases in China 2023: an updated summary. Peking Union Medical College Press. 2024. (In Chinese) -


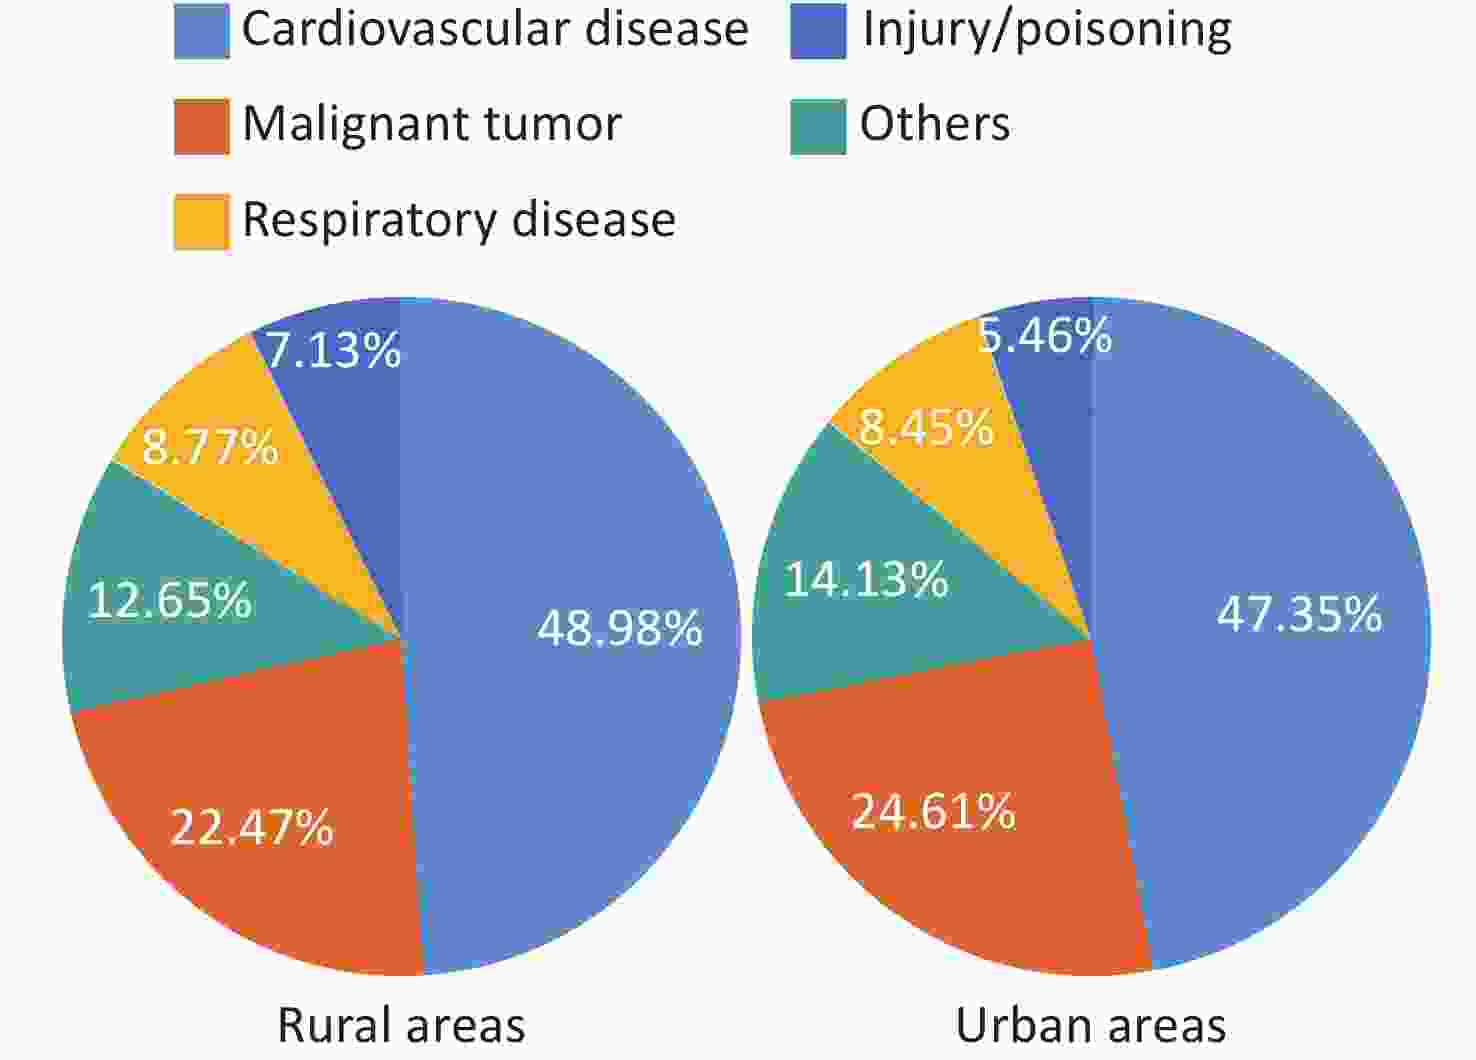
 下载:
下载:
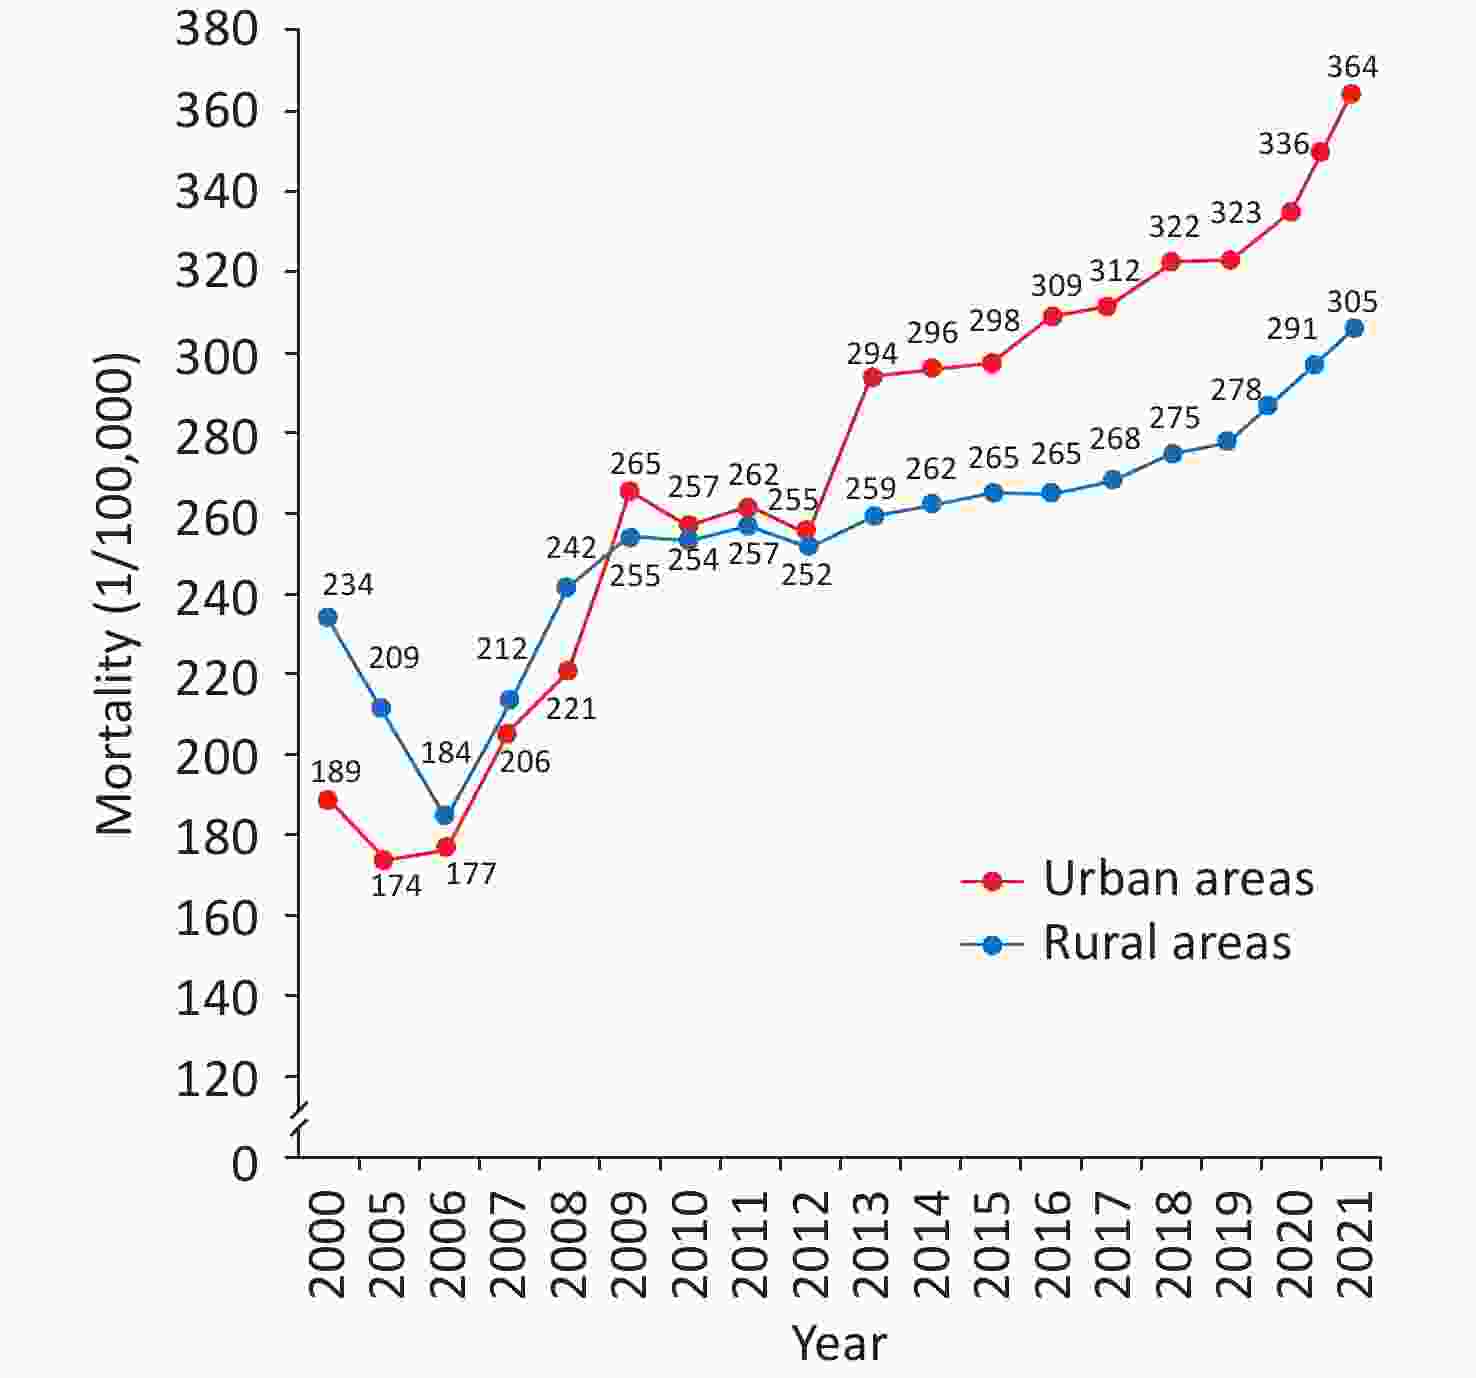
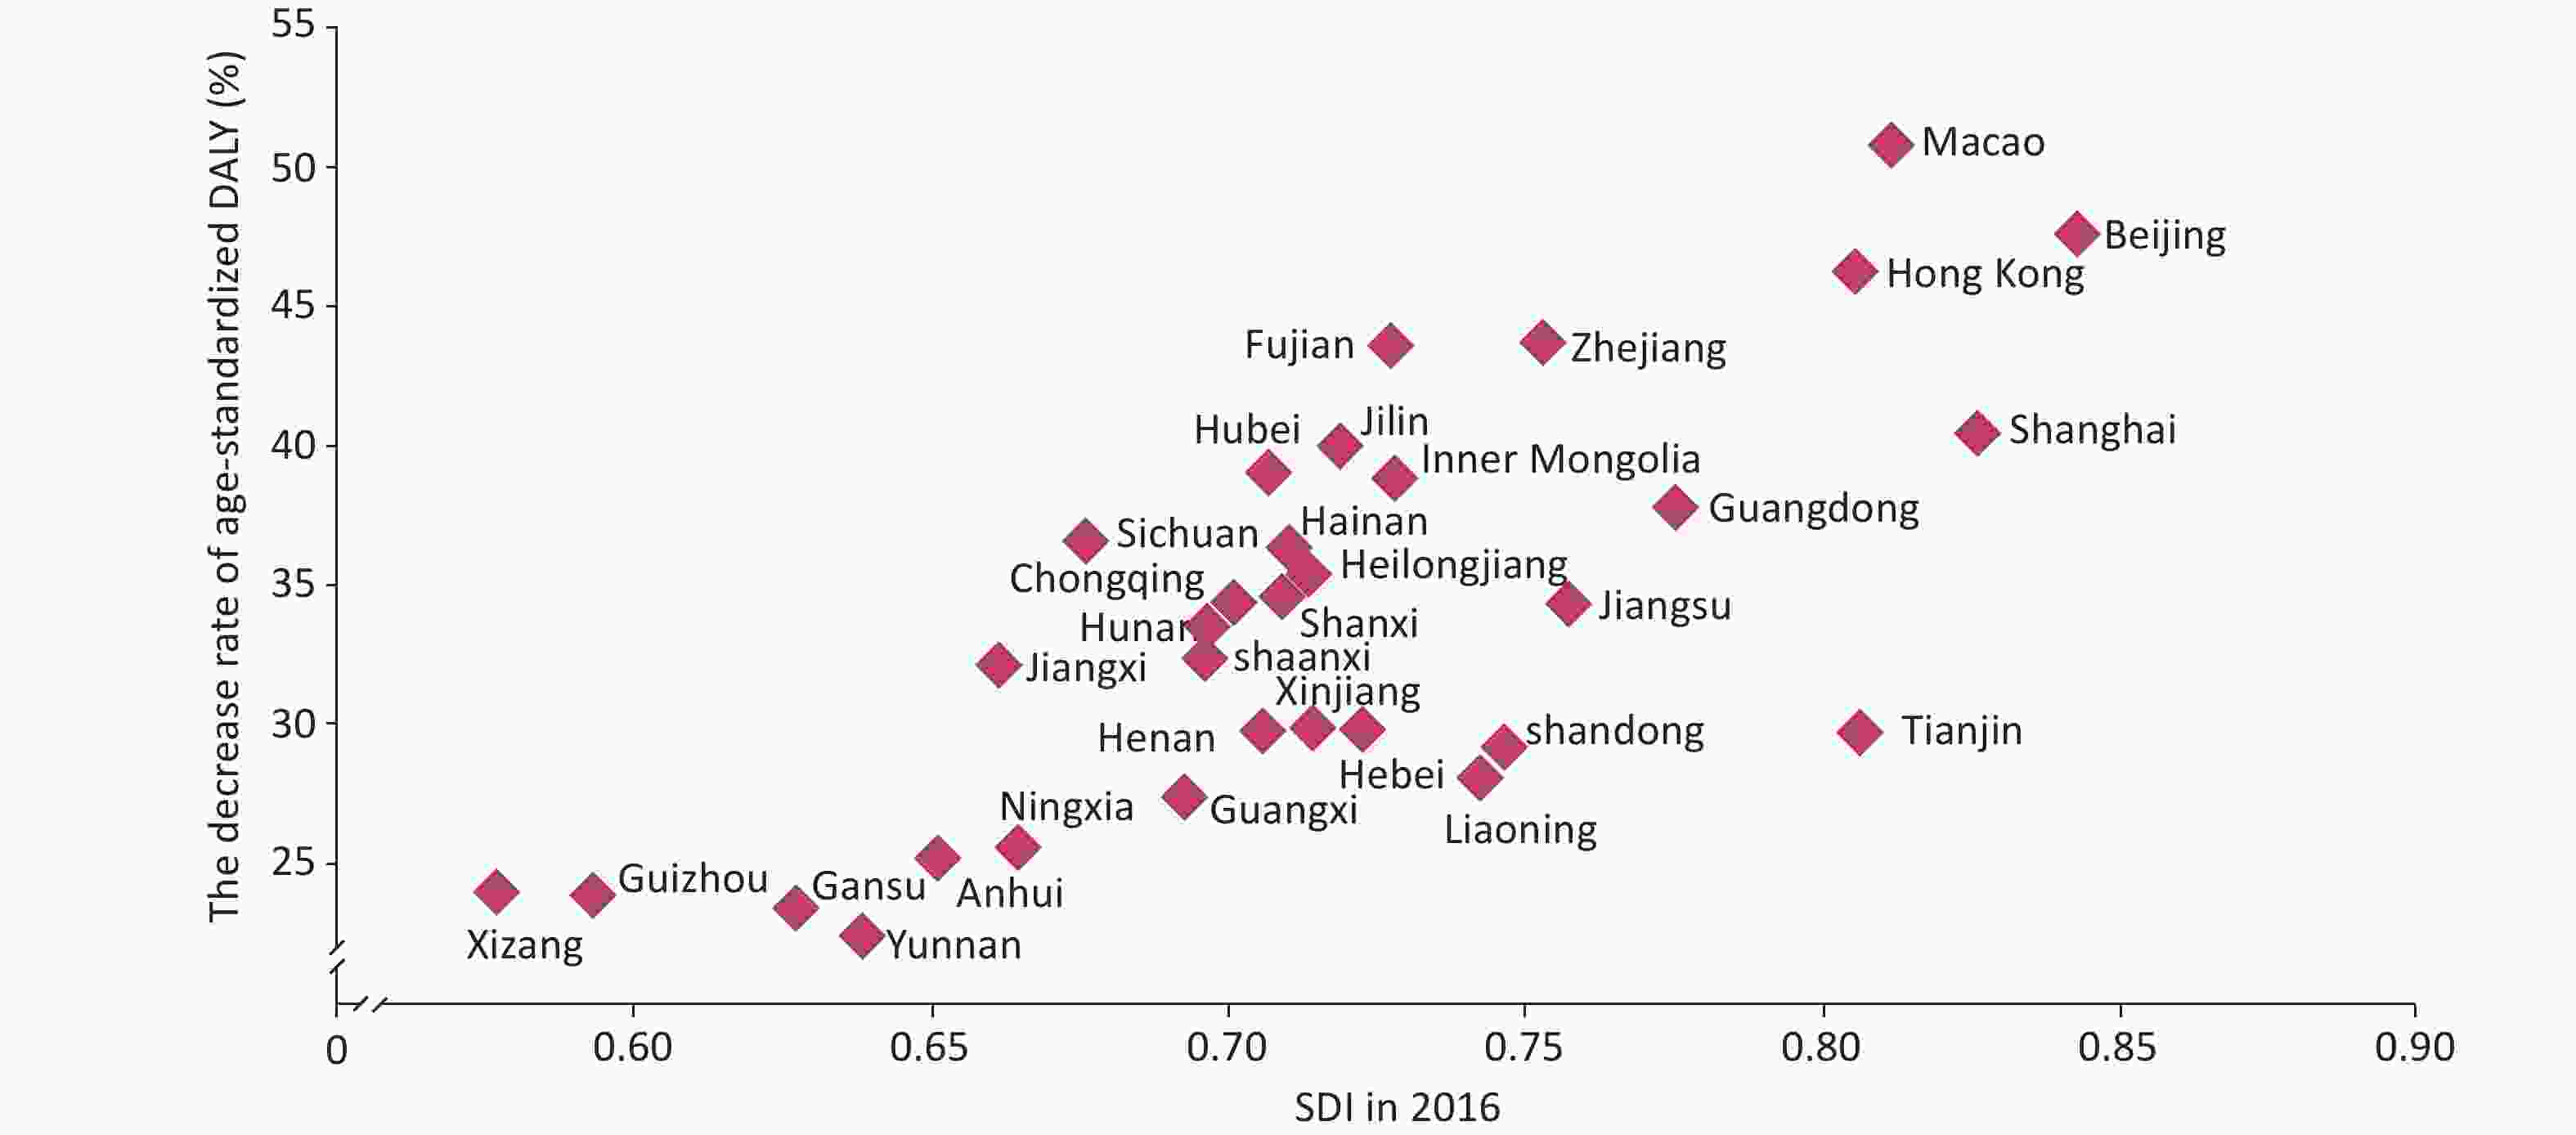

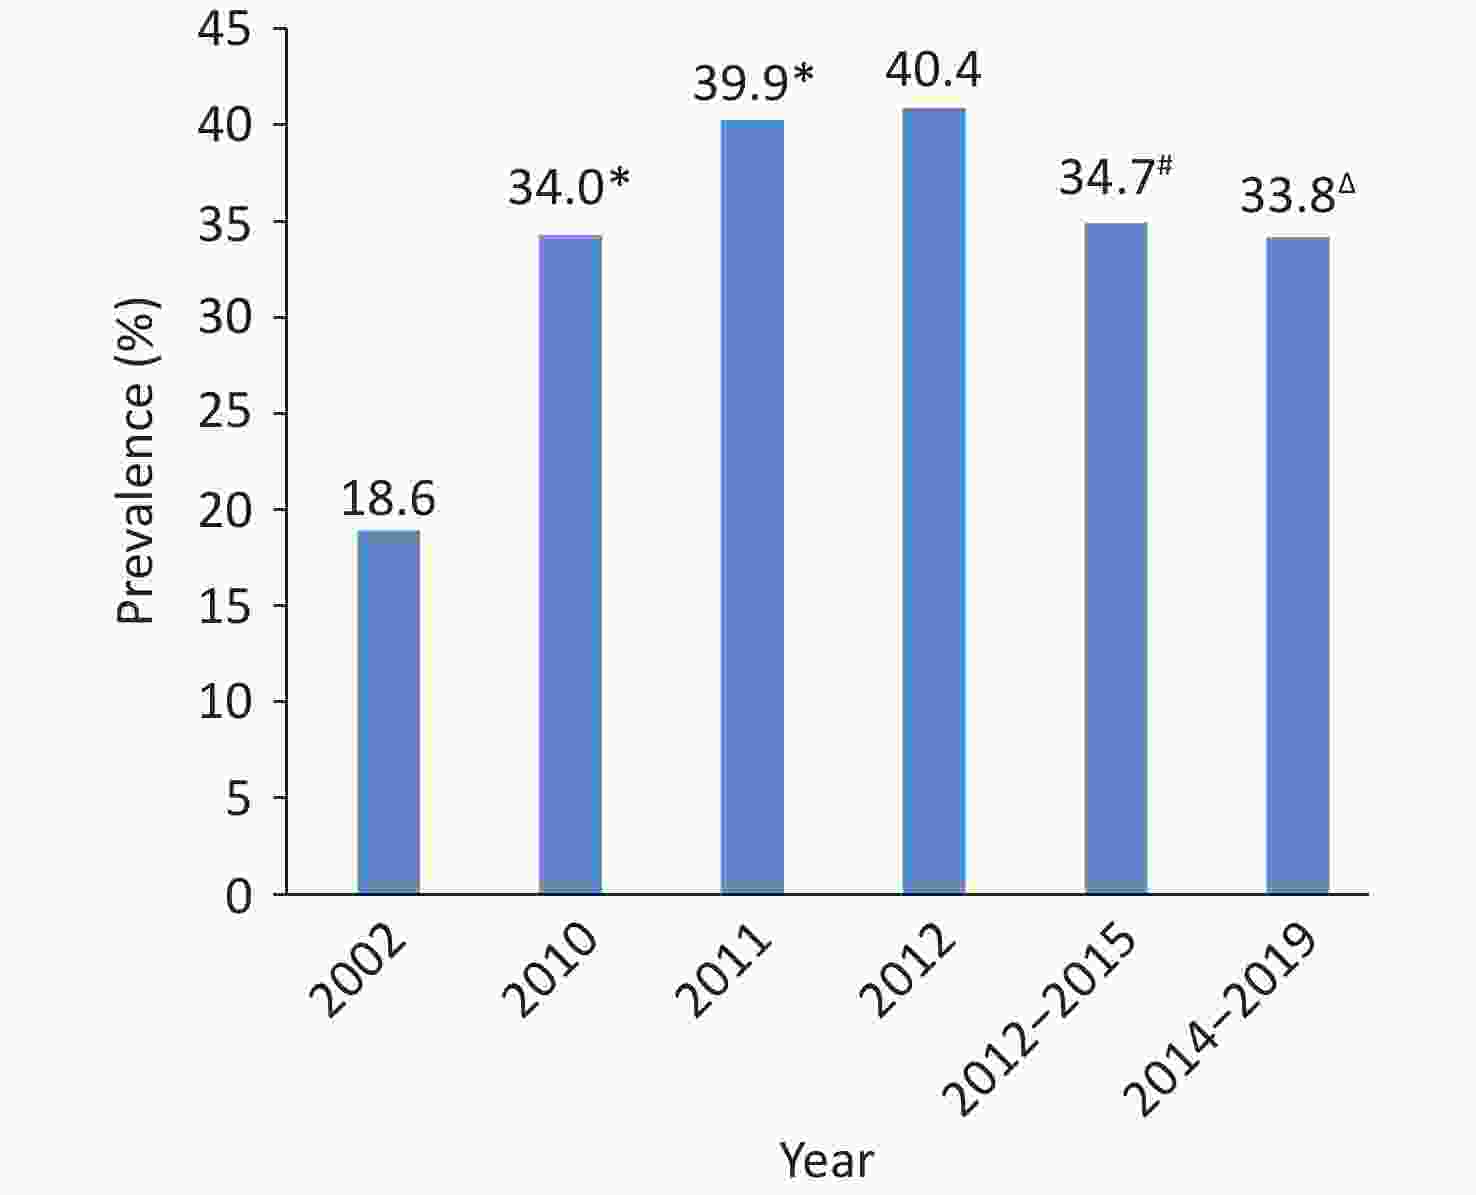
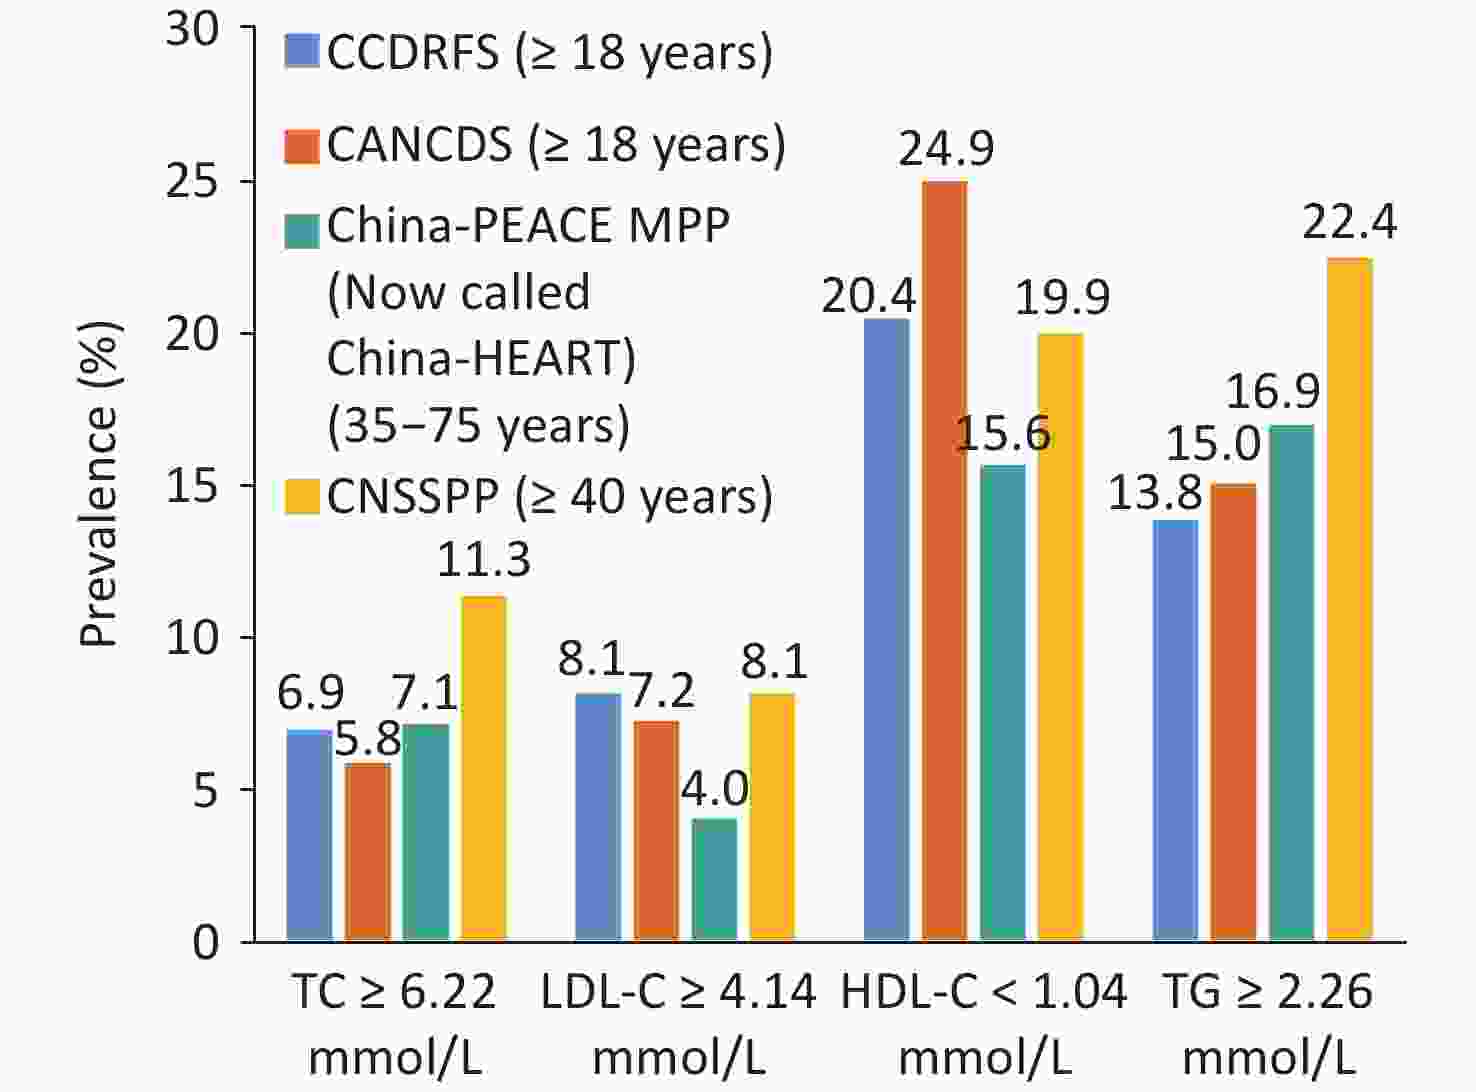
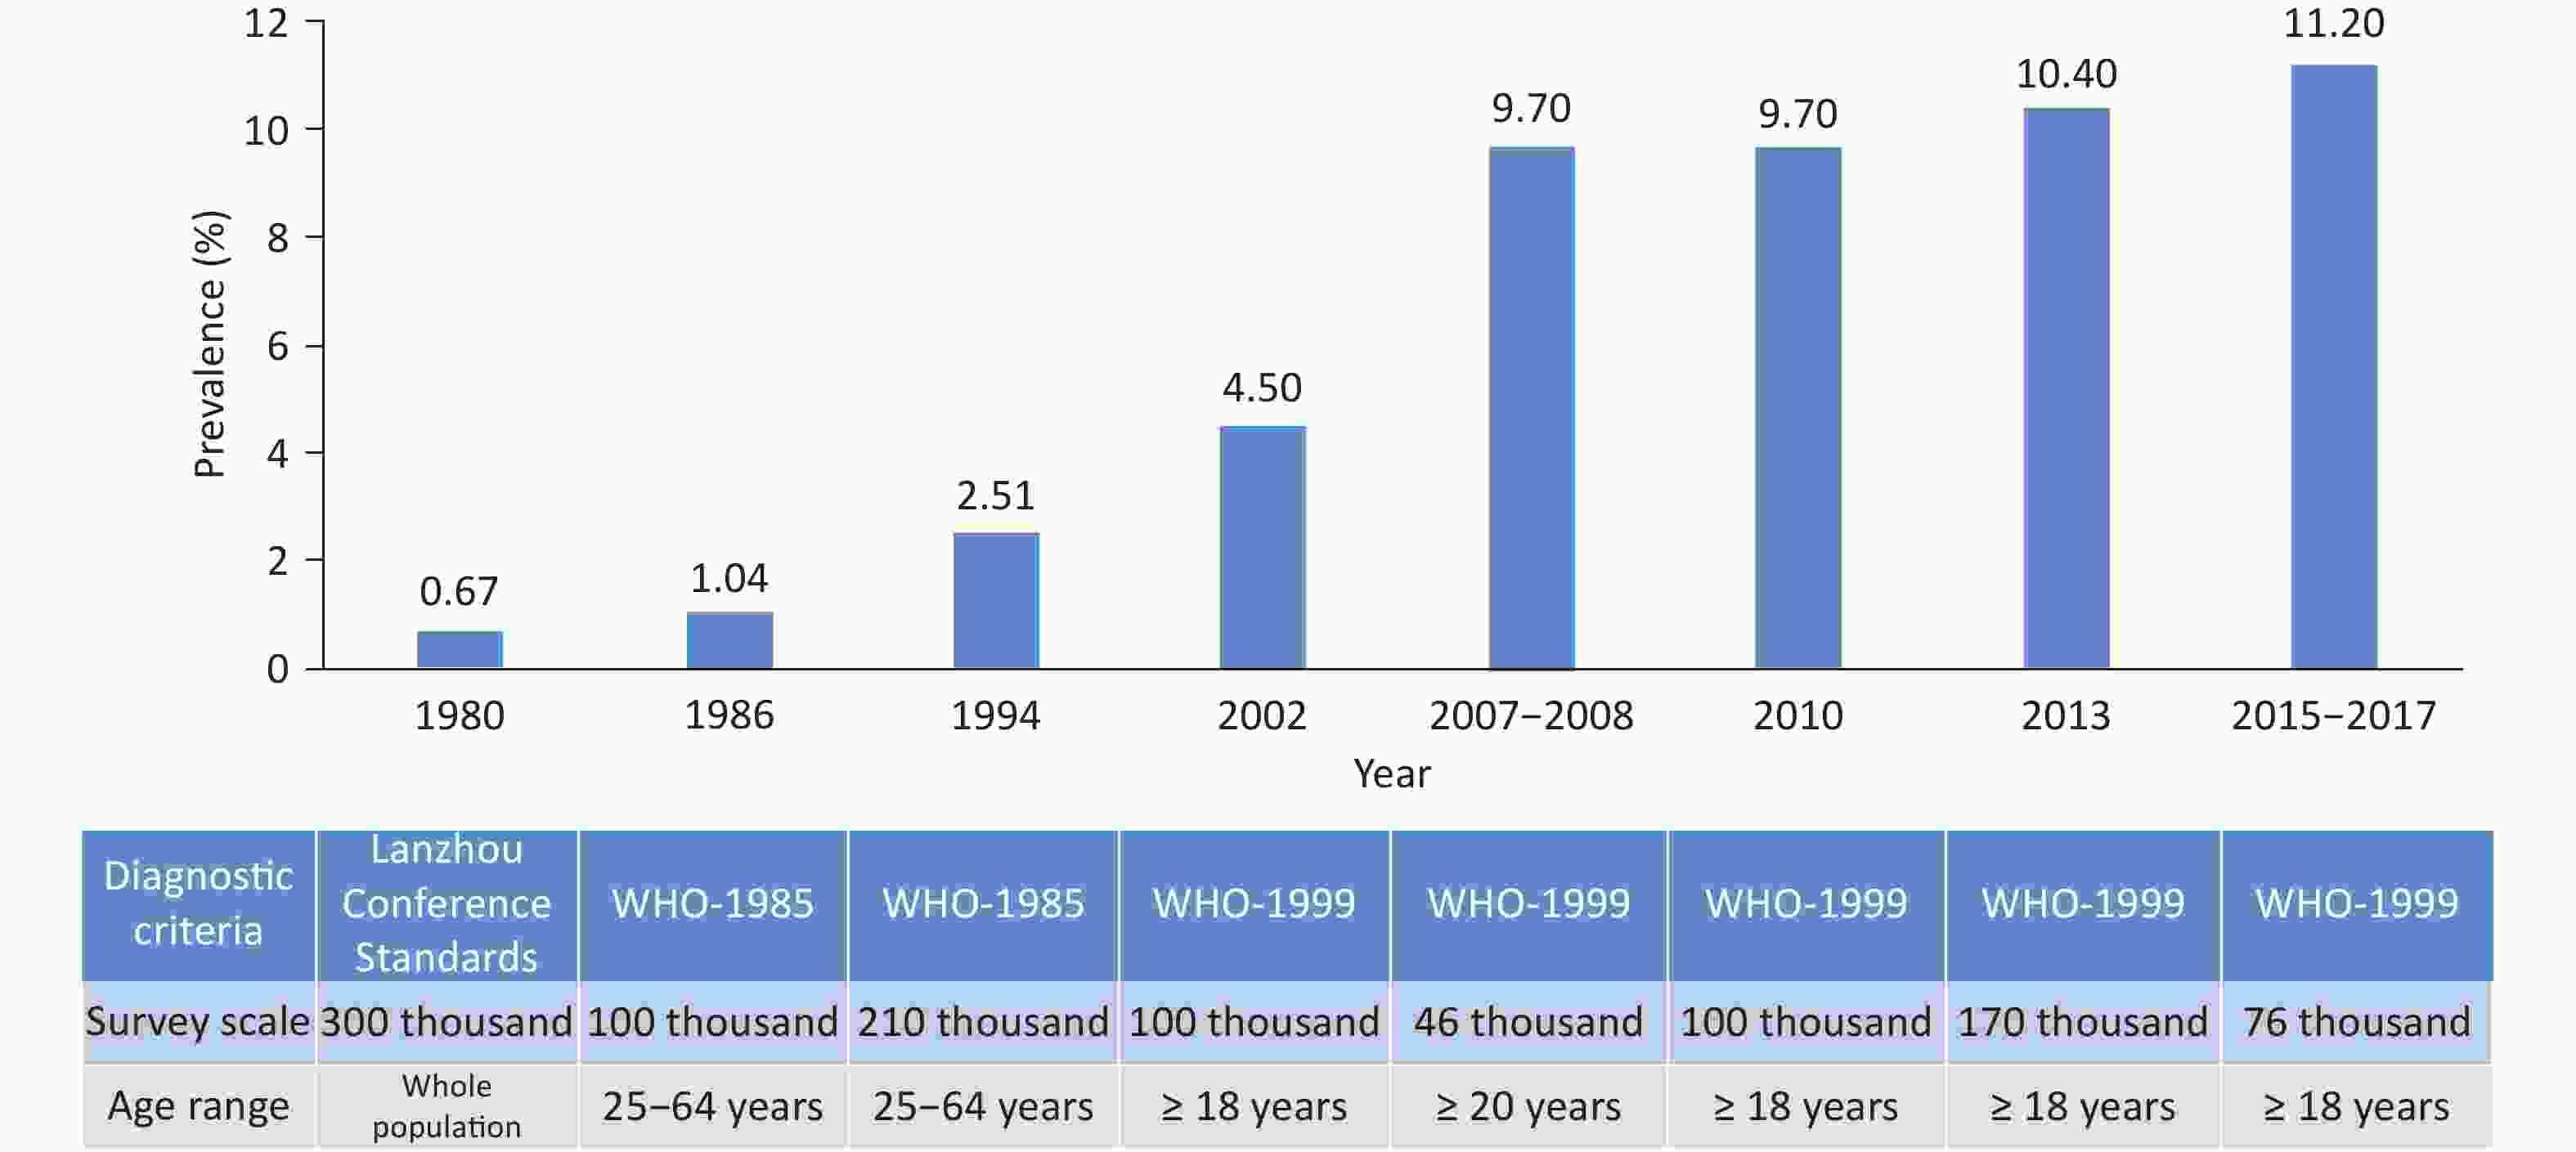
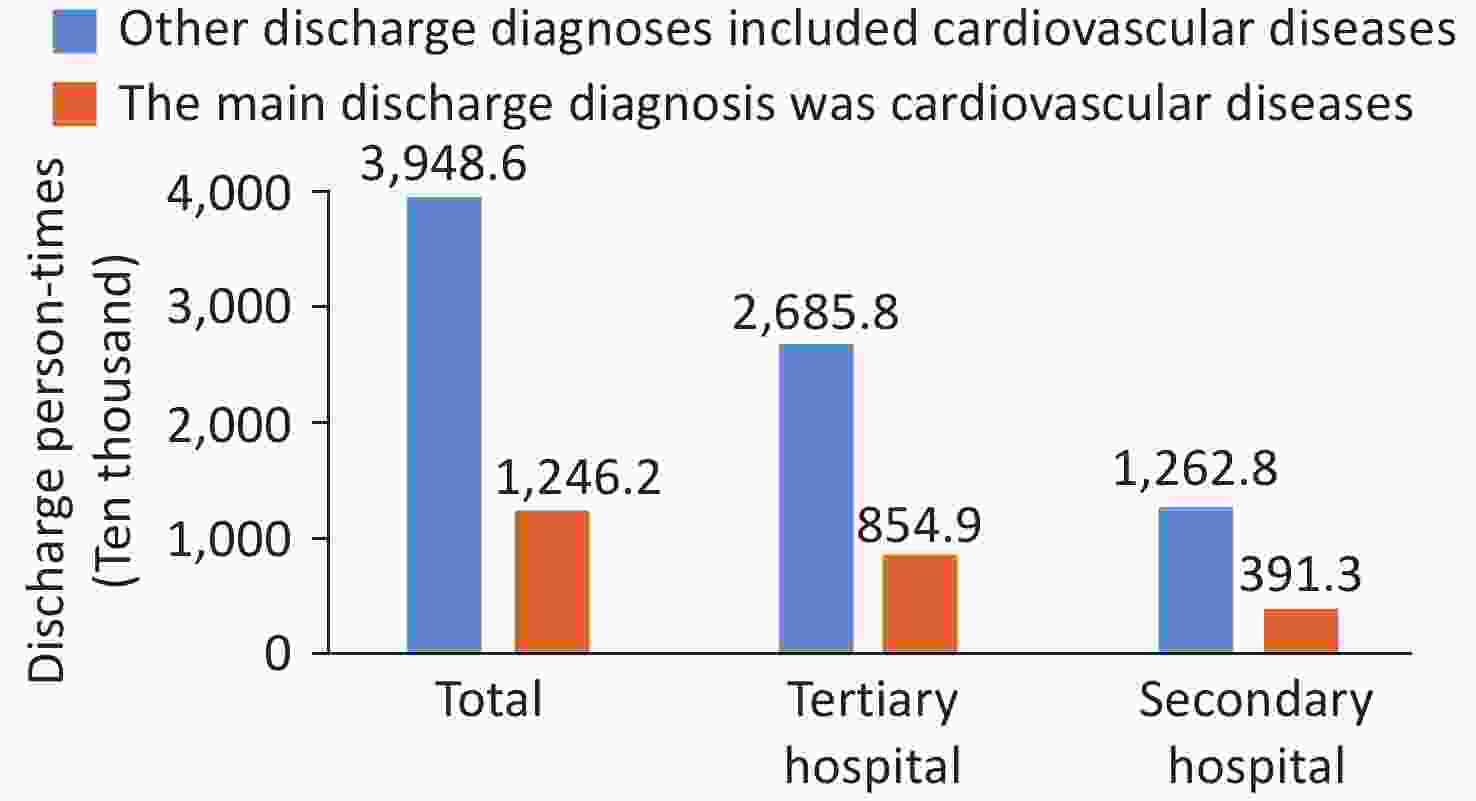


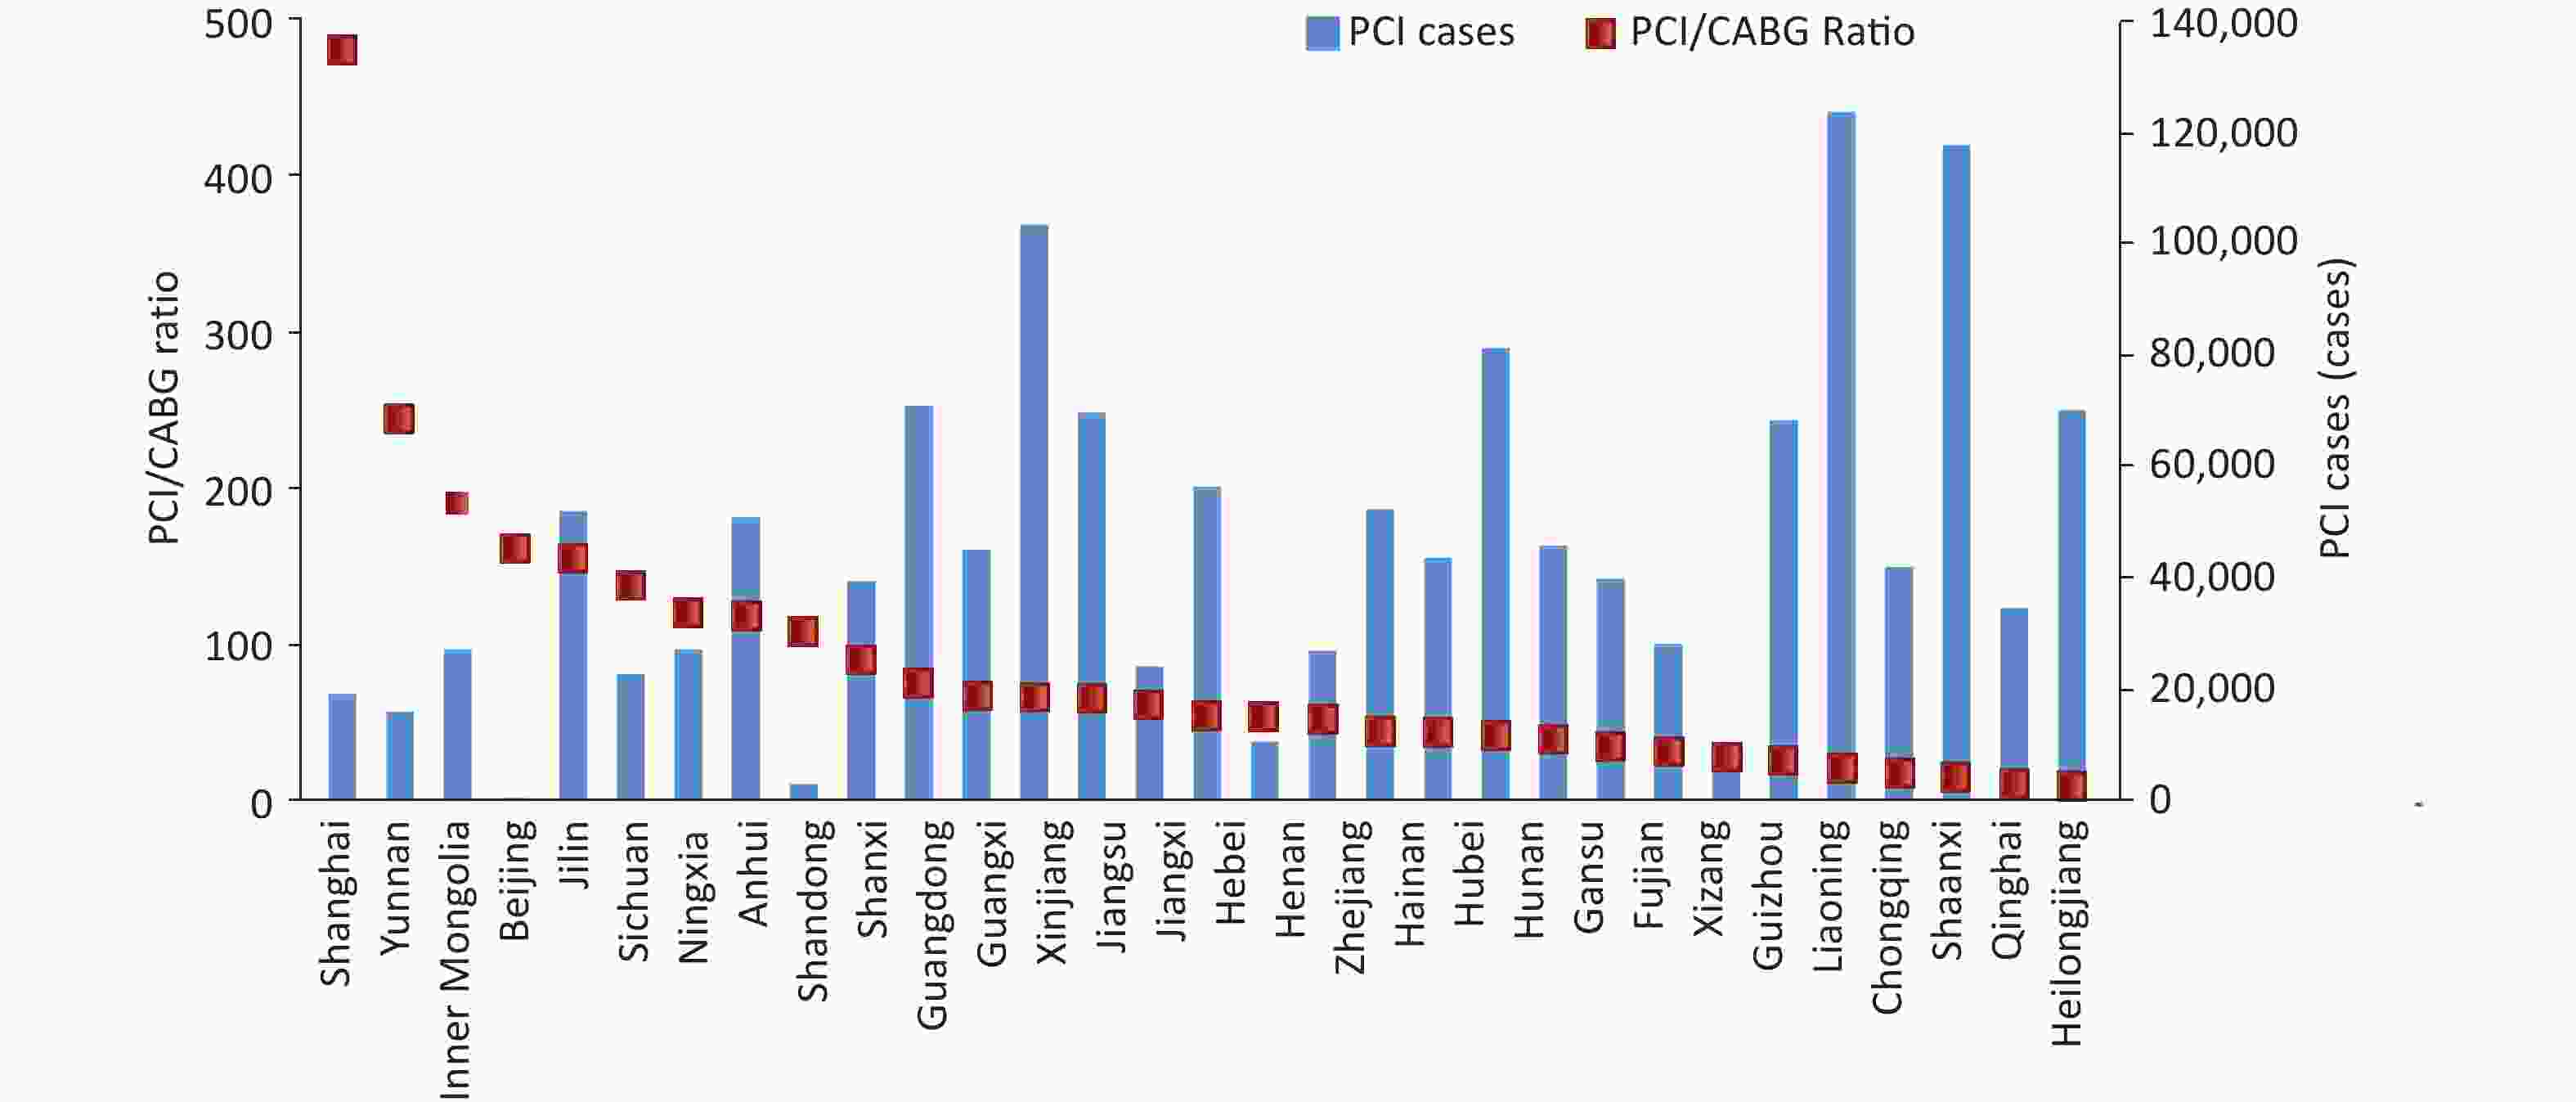

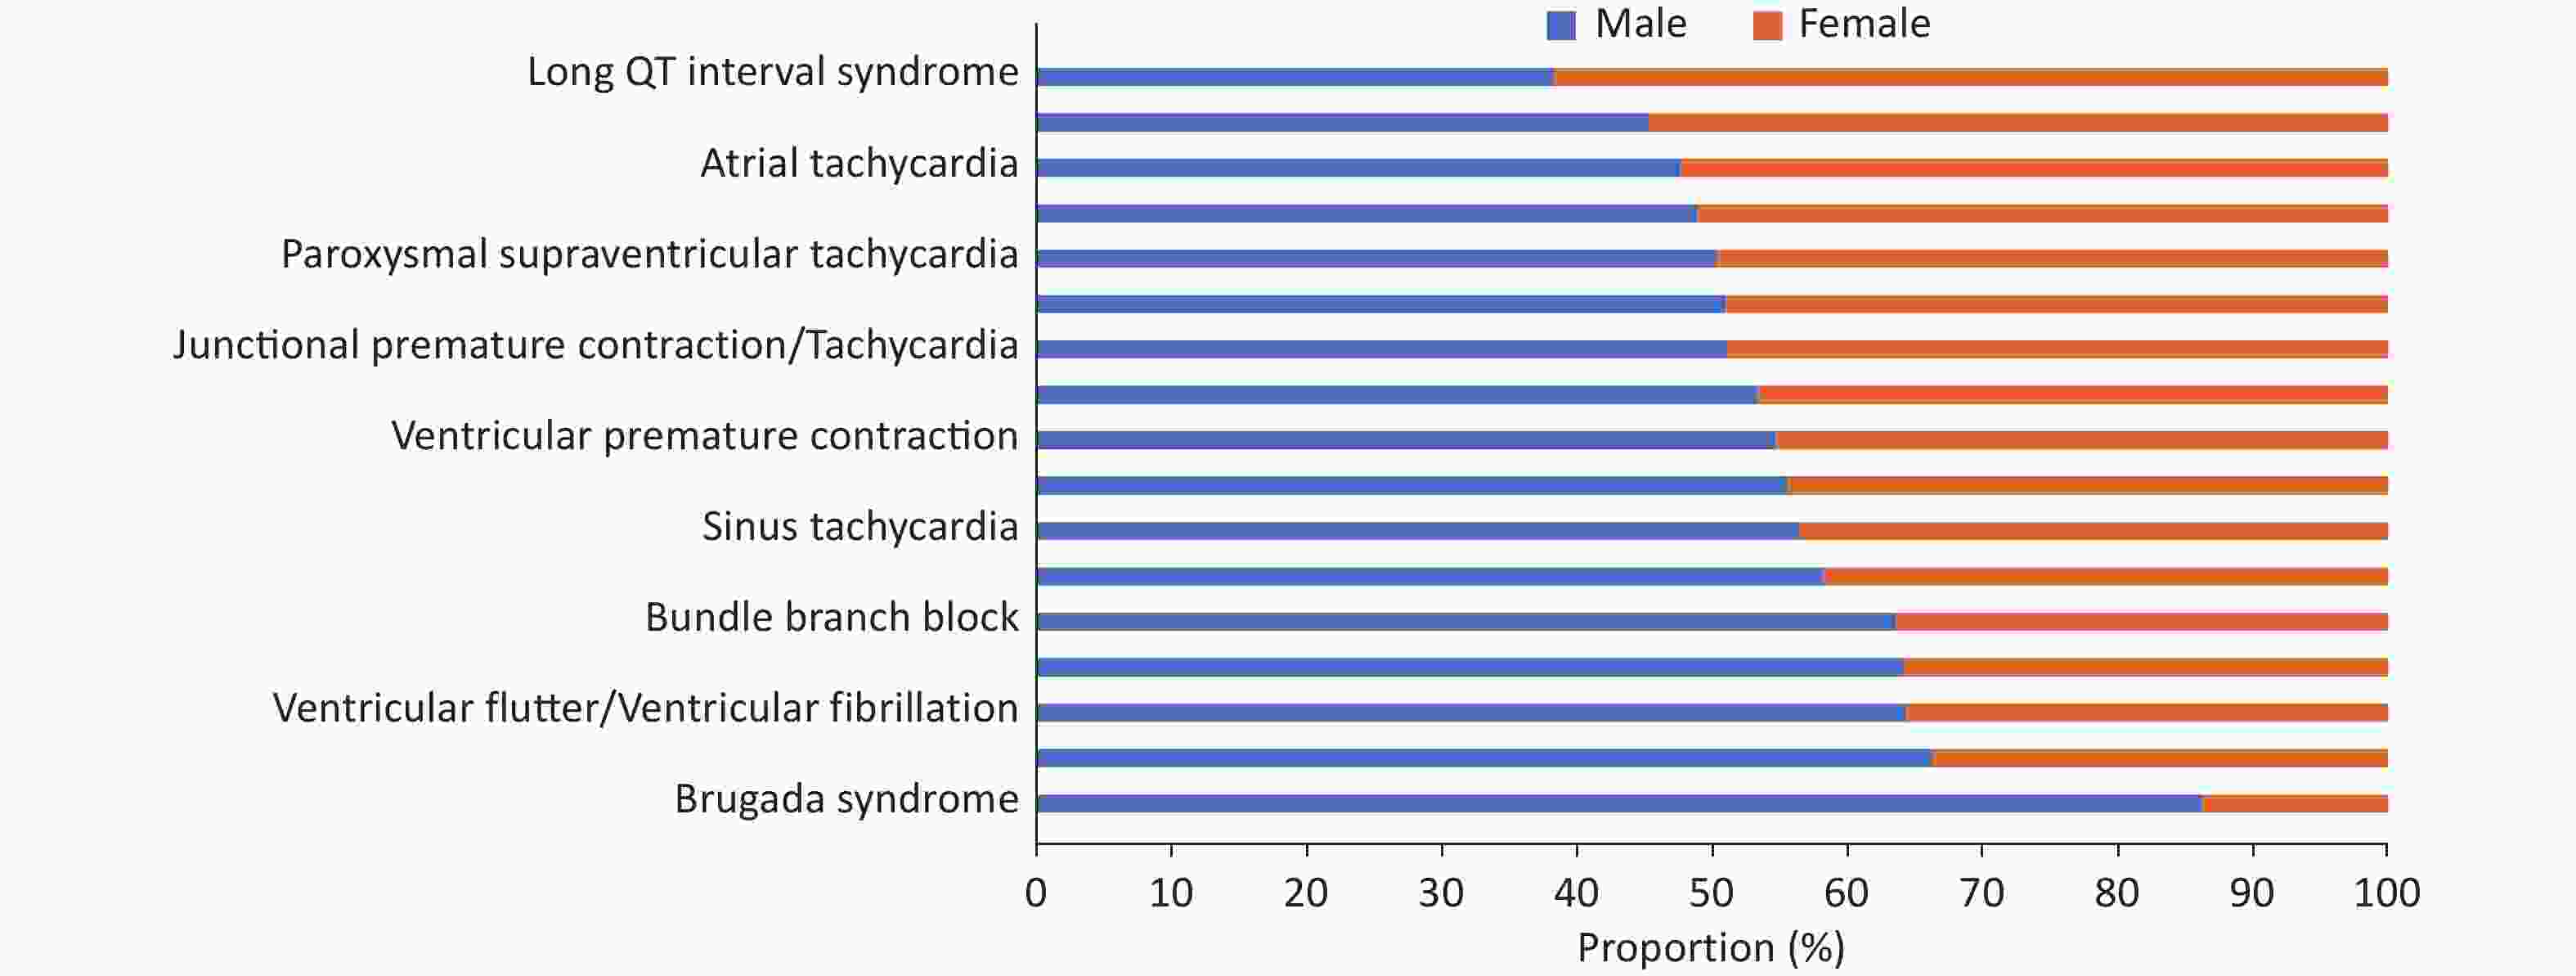
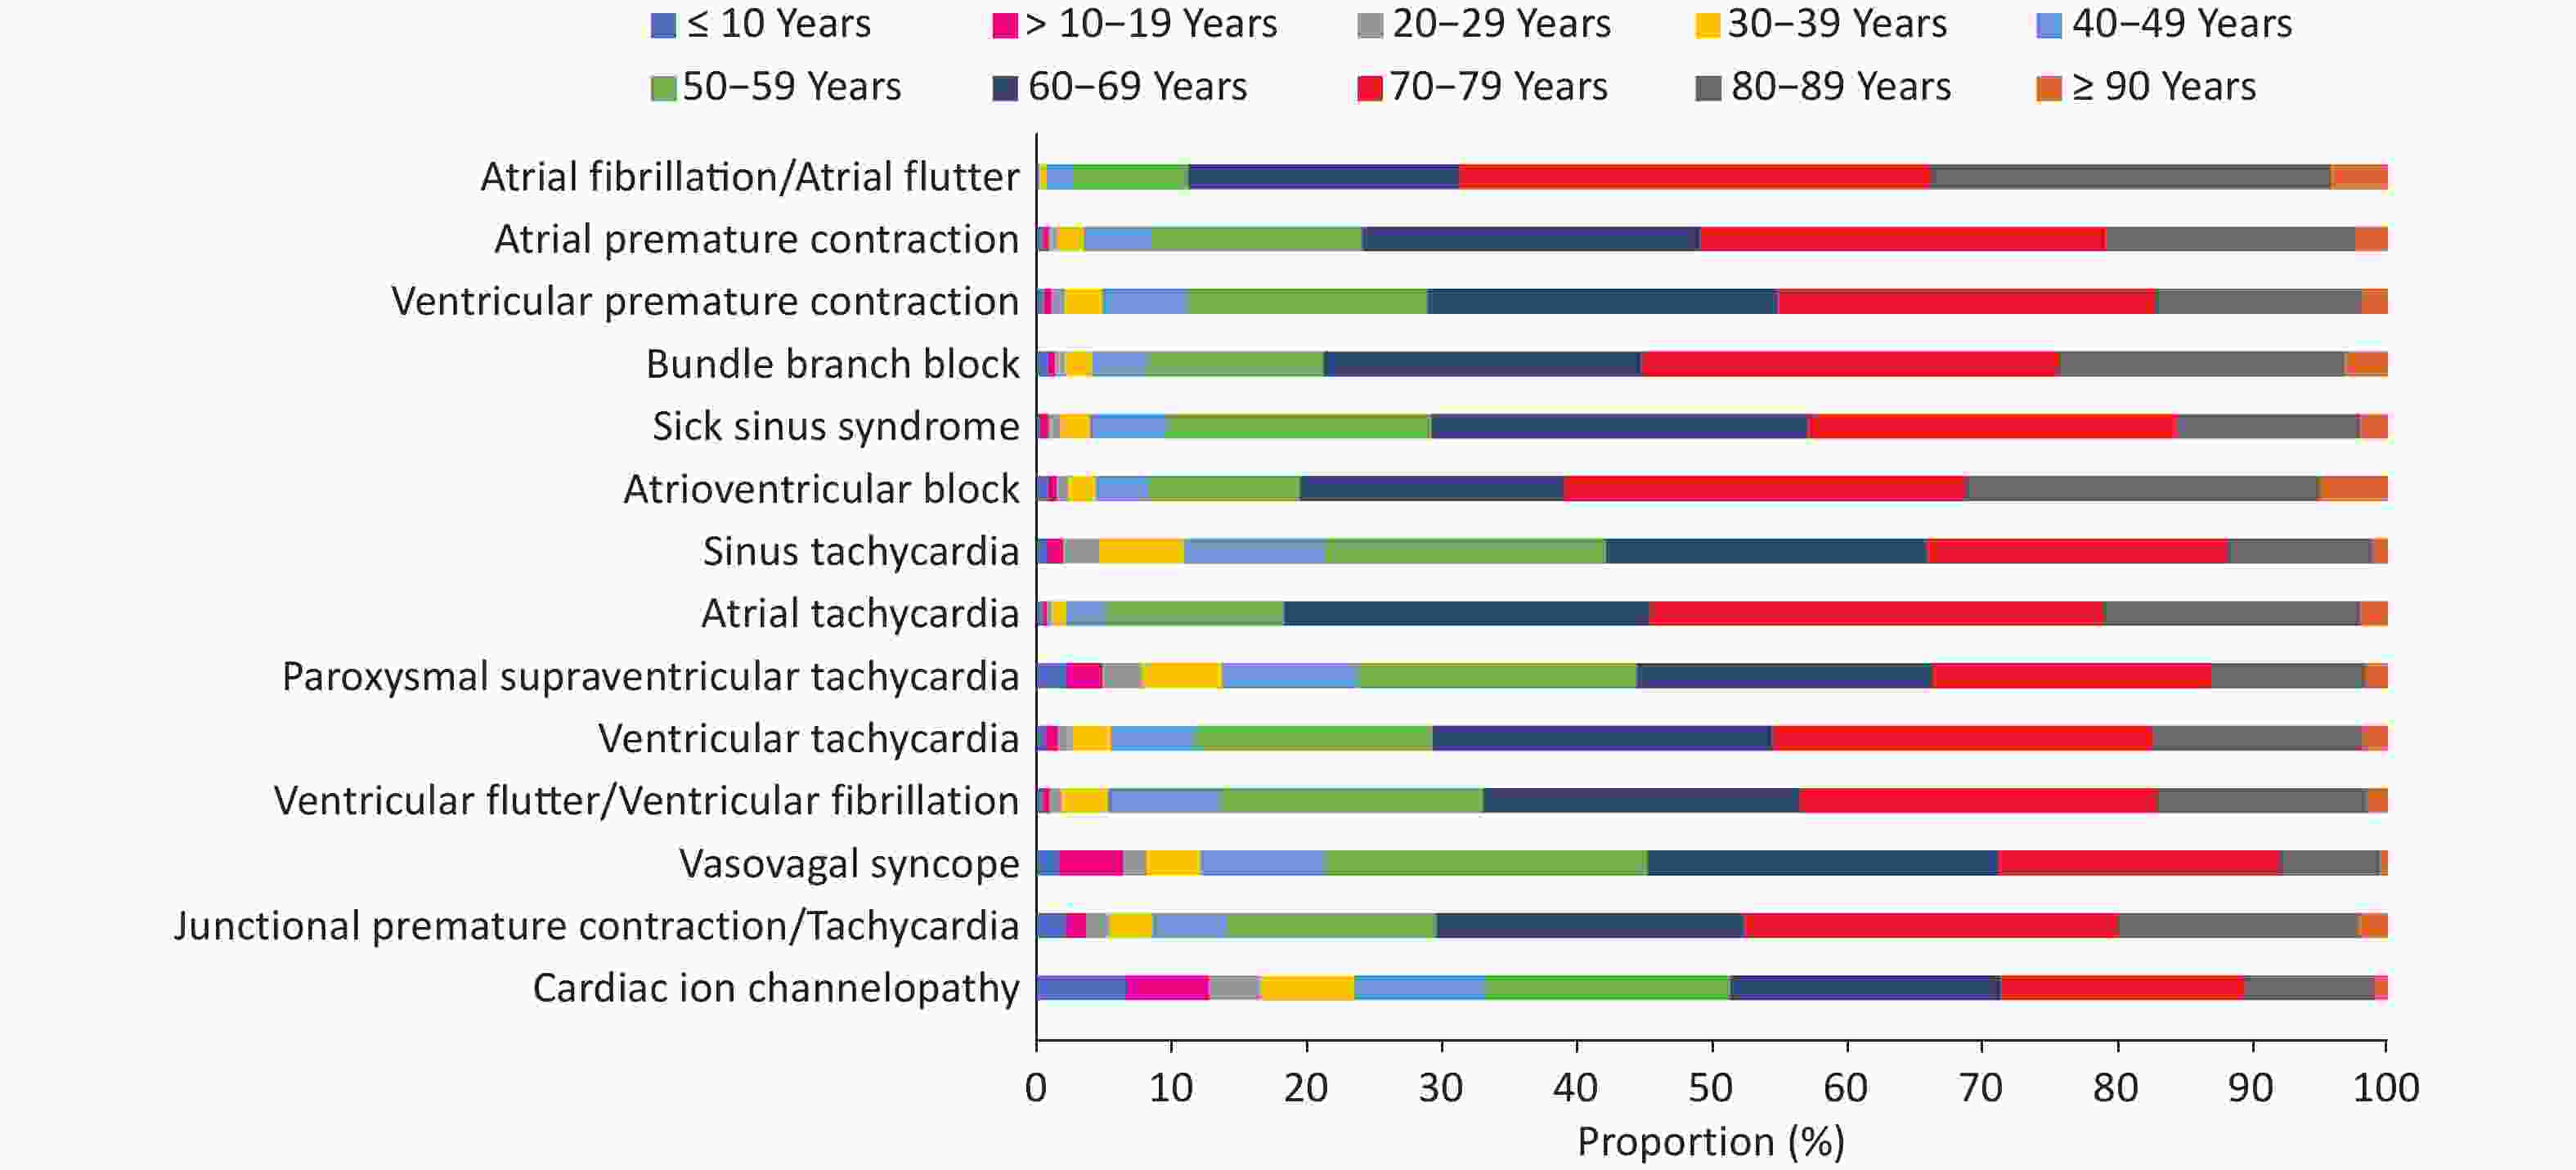
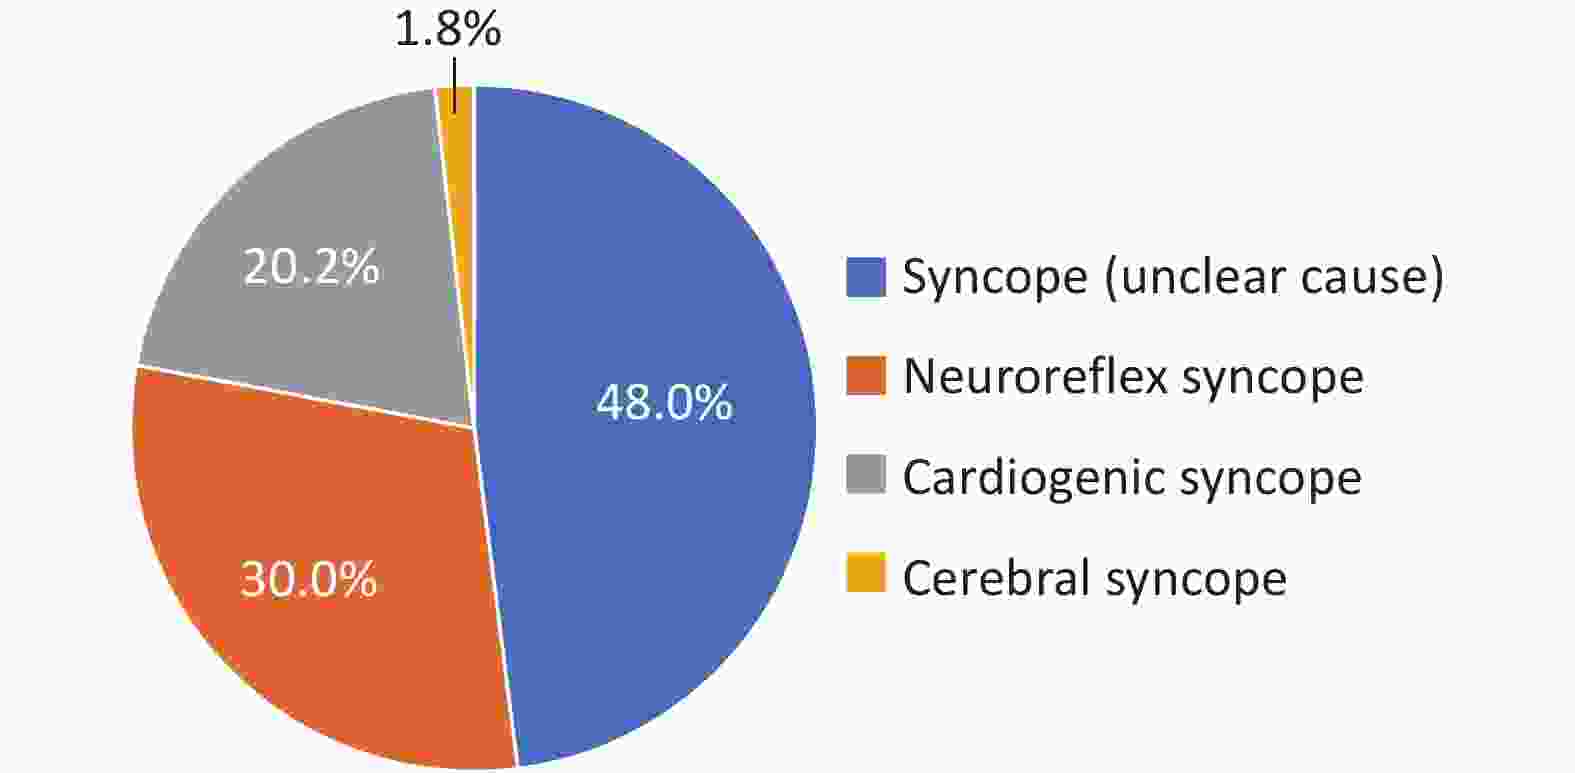


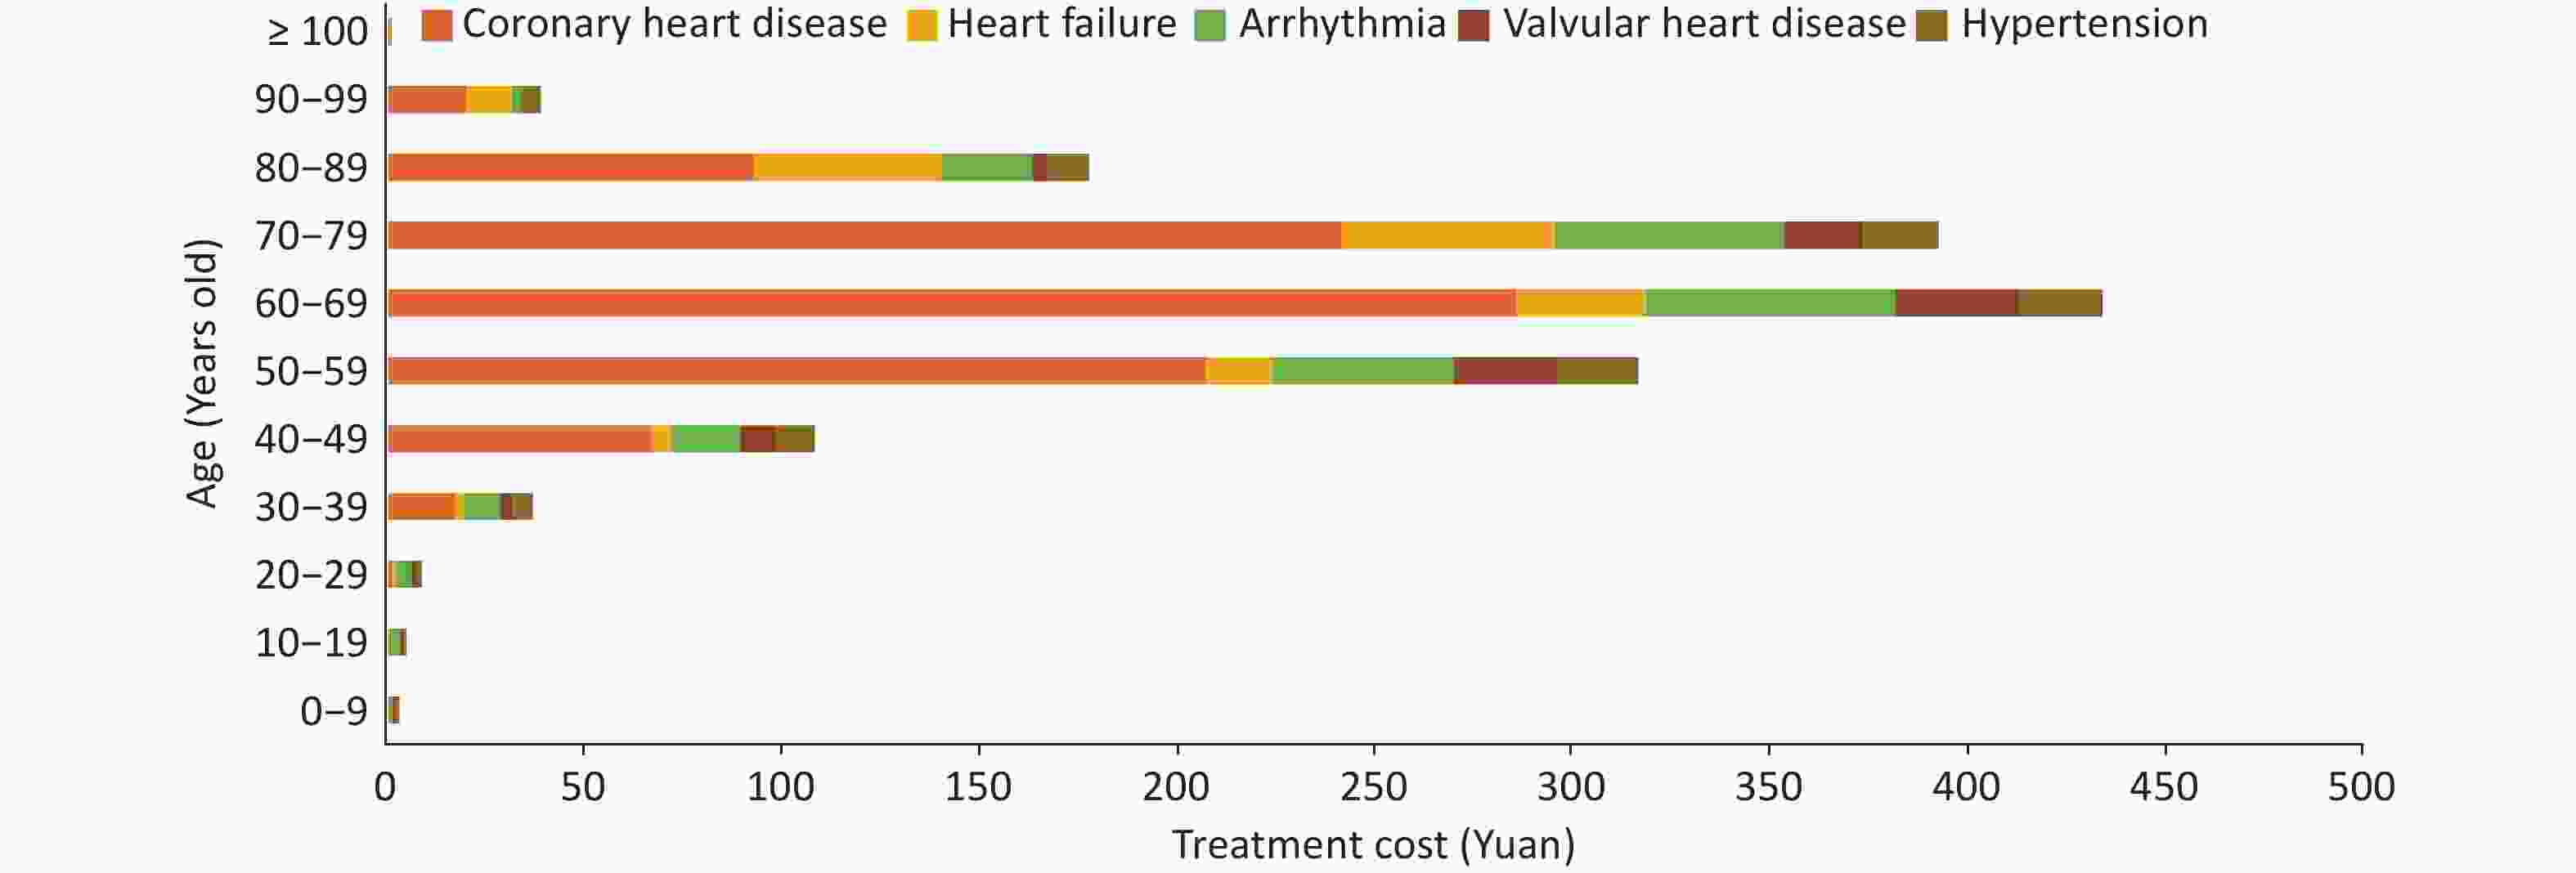


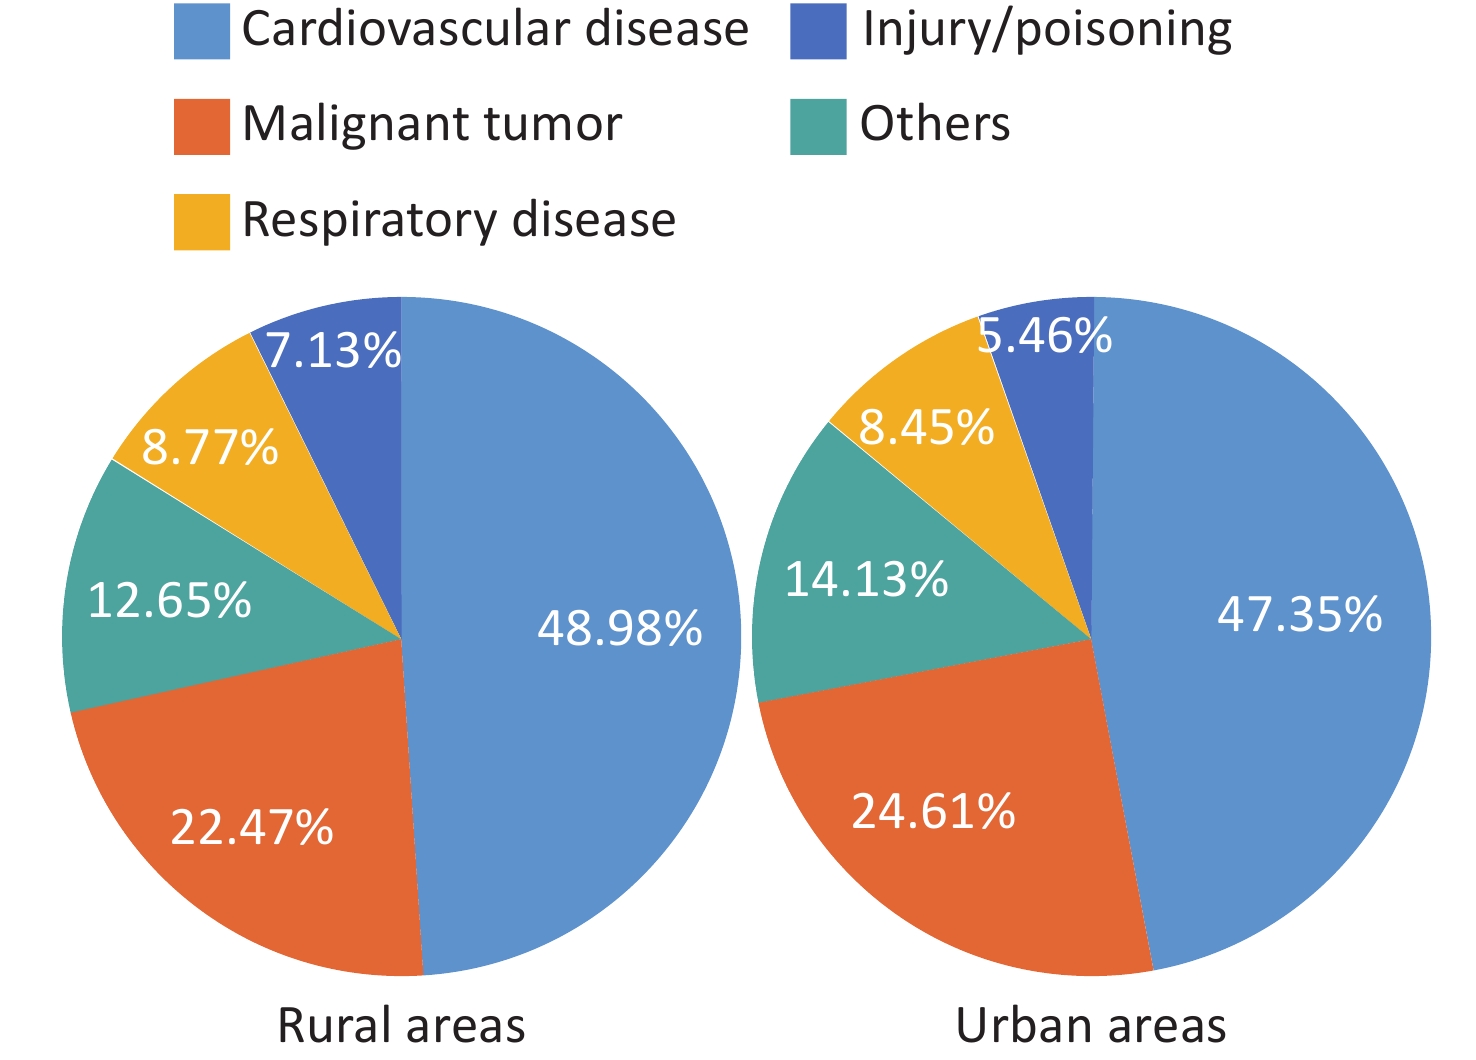

 Quick Links