

 下载:
下载:

-
Biological aging is a complex physiological process characterized by a decline in tissue function and the loss of cellular capabilities, which increase an individual's risk of various diseases[1]. While genetic factors and lifestyle are key influences on biological aging, environmental factors also play a significant role. Given the rapid aging of the global population, elucidating the factors that influence biological aging is crucial for promoting healthy aging.
Among the environmental risk factors, coke oven emissions (COEs) represent an important but relatively understudied contributor. COEs are generated during coal pyrolysis and are primarily composed of volatile organic compounds (VOCs) and particulate matter, with polycyclic aromatic hydrocarbons (PAHs) as the predominant components. Mounting evidence suggests that COEs accelerate biological aging. Telomere length and mitochondrial DNA copy number are widely recognized biomarkers of biological aging, and previous studies have demonstrated that COE exposure shortens relative telomere length (RTL) and reduces mitochondrial DNA copy number (mtDNA-CN)[2]. Furthermore, Blechter et al. reported that PAHs produced by indoor solid fuel combustion can accelerate epigenetic aging[3]. However, as most existing studies are cross-sectional, longitudinal epidemiological evidence linking COEs exposure to biological aging remains limited.
In this study, we applied the Klemera–Doubal method (KDM), a validated algorithm for estimating biological age that has been shown to predict disease, disability, and mortality. It can be applied to different populations and diverse combinations of biomarkers, providing it with cross-population applicability, and the changes in KDM-Biological Age (KDM-BA) can more sensitively reflect an individual’s aging trajectory[4,5]. This study employed a prospective cohort design and analyzed longitudinal data collected between 2015 and 2019 to investigate the association between COE exposure and biological aging, thereby providing new epidemiological evidence on their link.
-
The study population comprised 565 occupational workers from a coking plant in central China in 2015, and a follow-up was conducted in 2019. The inclusion criteria were age 18–60 years and at least one year of work experience. The exclusion criteria included a family history of hypertension, use of antihypertensive medications, loss to follow-up, or incomplete survey data. A total of 505 participants were ultimately included; detailed inclusion and exclusion criteria are shown in Supplementary Figure S1.
According to the recommendations of the World Health Organization, smoking was defined as smoking more than one cigarette per day for at least six consecutive months, and alcohol consumption was defined as drinking more than twice per week during the six months prior to the survey.
The study protocol was approved by the Medical Ethics Committee of the School of Medicine, Shenzhen University (approval number M20220528). Written informed consent was obtained from all participants.
-
Baseline data and biological samples were collected during two survey phases in 2015 and 2019. Blood pressure, complete blood count, and serum biochemical parameters were measured. A fully automated five-part differential hematology analyzer was used to assess the various blood components in the EDTA-anticoagulated samples, whereas creatinine (Cr), total cholesterol (TC), and triglycerides (TG) in the separated serum were measured using a fully automated biochemical analyzer. Blood pressure was measured in a quiet and comfortable environment using a clinically validated upper-arm electronic sphygmomanometer. Prior to measurement, participants were required to rest in a seated position for at least 5 minutes. During measurement, participants maintained a seated posture with their right arm exposed and positioned at the same level as the heart. Two consecutive readings were taken at 1–2 minute intervals, and the average of the two measurements was recorded. Blood pressure was expressed in millimeters of mercury (mmHg).
-
Workplace COE exposure monitoring was conducted in accordance with Chinese national standards HJ690-2014 (Determination of Benzene Soluble Matter in Stationary Source Emissions by Soxhlet Extraction-Gravimetric Method) and GBZ 159-2004 (Specifications for Air Sampling of Hazardous Substances in the Workplace). A fixed-point sampling approach was used for area sampling at each workshop and workstation. Detailed descriptions of the sampling and analytical methods are provided in our previous study[6]. COE exposure among participants was assessed based on occupational exposure concentrations at their workstations and divided into three equally spaced groups: the high-exposure group (Q3), 0.17 (0.12, 0.20) mg/m3; the medium-exposure group (Q2), 0.09 (0.07, 0.10) mg/m3; and the low-exposure group (Q1), 0.00 (0.00, 0.01) mg/m3.
-
KDM-BA acceleration was computed as the difference between KDM-BA and chronological age. The model integrated six routinely measured clinical biomarkers: systolic blood pressure (SBP), plasma TG, TC, red blood cell (RBC) count, platelet count (PLT), and serum Cr. The distributions of these indicators across the different groups are presented in Supplementary Table S1. The computational methods for these biomarkers have been described in our previous articles[5,7]. The formula for calculating the KDM-BA (Equation 1) is as follows:
$$ KDM - BA = \frac {\sum_{j=1}^{m} \left( x_j - q_j \right) \dfrac{k_j}{s_j^2} + \dfrac{CA}{s_B^2 A} } {\sum_{j=1}^{m} \left( \dfrac{k_j}{s_j} \right)^2 + \dfrac{1}{s_B^2 A}}$$ (1) where m represents the total number of selected clinical blood biomarkers, $ x_{j} $ denotes the value of biomarker j for a given individual, and CA represents the chronological age of that individual. For each biomarker j, regression analysis was performed with chronological age to calculate the parameters $ k_{j} $, $ q_{j} $, and $ s_{j} $, which represent the regression coefficient, regression intercept, and root-mean-square error, respectively. The $ S_{B A} $ is a scaling factor equal to the square root of the age variance explained by the biomarker set in the reference sample.
-
Questionnaire responses and laboratory data were double-entered in a blinded manner using EpiData version 3.0 (Pascal; Odense, Denmark). Demographic characteristics are presented as frequencies and percentages. Continuous variables with a normal distribution are expressed as mean ± standard deviation (SD), while non-normally distributed continuous variables are summarized using median and interquartile range. Categorical variables across the exposure groups were assessed using chi-square tests, whereas continuous variables were compared using a one-way analysis of variance (ANOVA). Generalized linear models (GLMs) were used to analyze the dose-response relationship between COE exposure and KDM-BA acceleration. Longitudinal associations between KDM-BA acceleration and COE exposure were evaluated using generalized estimating equations (GEEs) adjusted for sex, work duration, smoking status, alcohol consumption, body mass index (BMI), and education level. All statistical analyses and data visualizations were performed using R version 4.4.3 (The R Foundation; Vienna, Austria). Biological age was calculated using the “BioAge” package. The GLMs were implemented using the “stats” package, and GEEs were fitted using the “geepack” package. Restricted cubic splines (RCS) were plotted using the “plotRCS” package, with 3 knots set at the 10%, 50%, and 90% quantiles as reference points. All statistical tests were two-tailed, and statistical significance was set at P < 0.05.
-
Table 1 shows the baseline characteristics of the 505 participants. At baseline, COE-exposed workers had a biological age (0.67 ± 1.64) years older than their chronological age, increasing to (1.01 ± 1.67) years at follow-up. Between 2015 and 2019, the biological age of COE-exposed workers increased by (0.33 ± 1.42) years relative to chronological age. The median cumulative exposure concentration among COE-exposed workers was 0.09 mg/m3. Workers with a cumulative exposure dose to COEs below 0.01 mg/m3 were defined as the reference group (n = 178, representing 35% of the cohort). Comparisons across the exposure groups revealed statistically significant differences in sex, age, work duration, smoking status, BMI, and education level (P < 0.05). Both the medium-exposure group (Q2) and high-exposure group (Q3) exhibited significantly greater KDM-BA acceleration at baseline and follow-up than the low-exposure group (Q1) (P < 0.05).
Table 1. Basic characteristics of participants
Characteristic All (n = 505) Q1 (n = 178) Q2 (n = 157) Q3 (n = 170) P Gender N (%) Male 389 117 (65.7) 120 (76.4) 152 (89.4) < 0.001* Female 116 61 (34.3) 37 (23.6) 18 (10.6) Age (year) mean ± SD 39.11 ± 5.24 40.03 ± 4.84 38.54 ±5.13 38.68 ±5.61 0.014* Work duration (year) mean ± SD 15.10 ± 6.83 11.28 ± 5.48 16.98 ± 6.29 17.35 ± 6.89 < 0.001* Smoking status N (%) No 325 132 (74.2) 97 (61.8) 96 (56.5) 0.002* Yes 180 46 (25.8) 60 (38.2) 74 (43.5) Alcohol status N (%) No 238 96 (53.9) 71 (45.2) 71 (41.8) 0.064 Yes 277 82 (46.1) 86 (54.8) 99 (58.2) BMI (kg/m²) mean ± SD 24.54 ± 3.34 24.18 ± 3.13 24.28 ± 3.21 25.17 ± 3.58 0.01* Education levels N (%) Lower secondary or below 87 15 ( 8.4) 31 (19.7) 41 (24.1) < 0.001* High school 157 18 (10.1) 56 (35.7) 83 (48.8) Tertiary or above 261 145 (81.5) 70 (44.6) 46 (27.1) Exposure concentration median [IQR:P25,P75] 0.09 (0.01,0.12) 0.00 (0.00, 0.01) 0.09 (0.07, 0.10) 0.17 (0.12, 0.20) < 0.001* Baseline KDM-BA (year) mean ± SD 39.84 ± 5.57 40.14 ± 5.25 39.16 ± 5.59 40.14 ± 5.87 0.203 Follow-up KDM-BA (year) mean ± SD 43.98 ± 5.52 44.13 ± 5.39 43.39 ± 5.43 44.36 ± 5.71 0.260 Baseline KDM-BA acceleration (year) mean ± SD 0.67 ± 1.64 0.10 ± 1.52 0.63 ± 1.76 1.34 ± 1.39 < 0.001* Follow-up KDM-BA acceleration (year) mean ± SD 1.01 ± 1.67 0.32 ± 1.72 1.00 ± 1.54 1.71 ± 1.44 < 0.001* ∆KDM-BA acceleration (year) mean ± SD 0.33 ± 1.42 0.25 ± 1.45 0.40 ± 1.48 0.35 ± 1.34 0.631 Note. Intergroup comparisons of continuous variables (Age, Work duration, BMI, Exposure concentration, KDM-BA, KDM-BA acceleration) were conducted using ANOVA (analysis of variance), while categorical variables (Gender, Smoking status, Alcohol status, Education levels) were compared using the chi-square test; BMI,body mass index; Baseline KDM-BA, KDM biological age calculated from 2015 data; Follow-up KDM-BA, KDM biological age derived from 2019 follow-up data; Baseline KDM-BA acceleration, KDM biological age acceleration based on 2015 data; Follow-up KDM-BA acceleration, KDM biological age acceleration based on 2019 follow-up data; ∆KDM-BA acceleration, Change in KDM-BA acceleration during the follow-up period. *: Indicates a statistically significant difference. -
GLMs were used to analyze the association between COE exposure and KDM-BA acceleration in baseline and follow-up data. To ensure robustness, three models were constructed: Model 1 was unadjusted, including only COE exposure level; Model 2 was adjusted for sex, smoking, and drinking based on Model 1; and Model 3 further incorporated BMI, education level, and work experience on the basis of Model 2. As shown in Table 2, the medium-exposure group (Q2) showed a significantly higher KDM-BA acceleration at baseline than the reference group (Q1) in Models 1 and 2. The high-exposure group (Q3) exhibited significantly elevated KDM-BA acceleration across all three models (P < 0.05). In the follow-up data, both the medium- (Q2) and high-exposure (Q3) groups demonstrated significantly greater KDM-BA acceleration than the low-exposure group in all models (P < 0.05). During follow-up, the change in KDM-BA acceleration (∆KDM-BA) was positively but non-significantly associated with COE exposure (P > 0.05). In Model 3, compared with the low-exposure group (Q1), the increase in ∆KDM-BA acceleration was 0.14 (95% CI: -0.21–0.48) for the medium-exposure group (Q2) and 0.06 (95% CI: -0.30–0.43) for the high-exposure group (Q3).
Table 2. Generalized linear model results of COEs on KDM-BA acceleration
KDM-BA group Model1 Model2 Model3 β (95%CI) P β-Std β (95%CI) P β-Std β (95%CI) P β-Std Baseline KDM-BA acceleration Q1 ref ref ref Q2 0.53
(0.19–0.87)0.003* 0.32
(0.11–0.53)0.37
(0.05–0.68)0.023* 0.22
(0.03–0.42)0.34
(-0.00–0.67)0.054 0.21
(0–0.42)Q3 1.24
(0.91–1.58)< 0.001* 0.76
(0.55–0.96)0.87
(0.55–1.19)< 0.001* 0.53
(0.33–0.72)0.79
(0.43–1.16)< 0.001* 0.48
(0.26–0.71)Follow-up KDM-BA acceleration Q1 ref ref ref Q2 0.68
(0.33–1.02)< 0.001* 0.41
(0.2–0.61)0.55
(0.22–0.87)< 0.001* 0.33
(0.13–0.52)0.50
(0.15–0.86)0.005* 0.3
(0.09–0.51)Q3 1.39
(1.05–1.73)< 0.001* 0.83
(0.63–1.03)1.08
(0.75–1.41)< 0.001* 0.65
(0.45–0.85)0.94
(0.57–1.31)< 0.001* 0.56
(0.34–0.79)∆KDM-BA acceleration Q1 ref ref ref Q2 0.15
(-0.16–0.47)0.349 0.11
(-0.12–0.33)0.16
(-0.16–0.47)0.334 0.11
(-0.11–0.33)0.14
(-0.21–0.48)0.443 0.1
(-0.15–0.34)Q3 0.10
(-0.21–0.41)0.521 0.07
(-0.15–0.29)0.14
(-0.18–0.46)0.393 0.1
(-0.13–0.32)0.06
(-0.30–0.43)0.737 0.04
(-0.21– 0.3)Note. Baseline KDM-BA, KDM biological age calculated from 2015 data; Follow-up KDM-BA, KDM biological age derived from 2019 follow-up data; Baseline KDM-BA acceleration, KDM biological age acceleration based on 2015 data; Follow-up KDM-BA acceleration, KDM biological age acceleration based on 2019 follow-up data; ∆KDM-BA acceleration, Change in KDM-BA acceleration during the follow-up period. β-Std, standardized β value. The number of participants in each group was as follows, Q1 = 178, Q2 = 157, Q3 = 170. *: The difference was statistically significant. GEE models were used to analyze the longitudinal association between COE exposure and KDM-BA acceleration. The results showed that KDM-BA acceleration increased from baseline to follow-up (β = 0.36, 95% CI: 0.21–0.51). Compared with the low-exposure group (Q1), KDM-BA acceleration in the medium- (Q2) and high- (Q3) exposure groups increased by β = 0.40 (95% CI: 0.11–0.69) and β = 0.86 (95% CI: 0.55–1.18), respectively. The detailed results are presented in Supplementary Table S2.
-
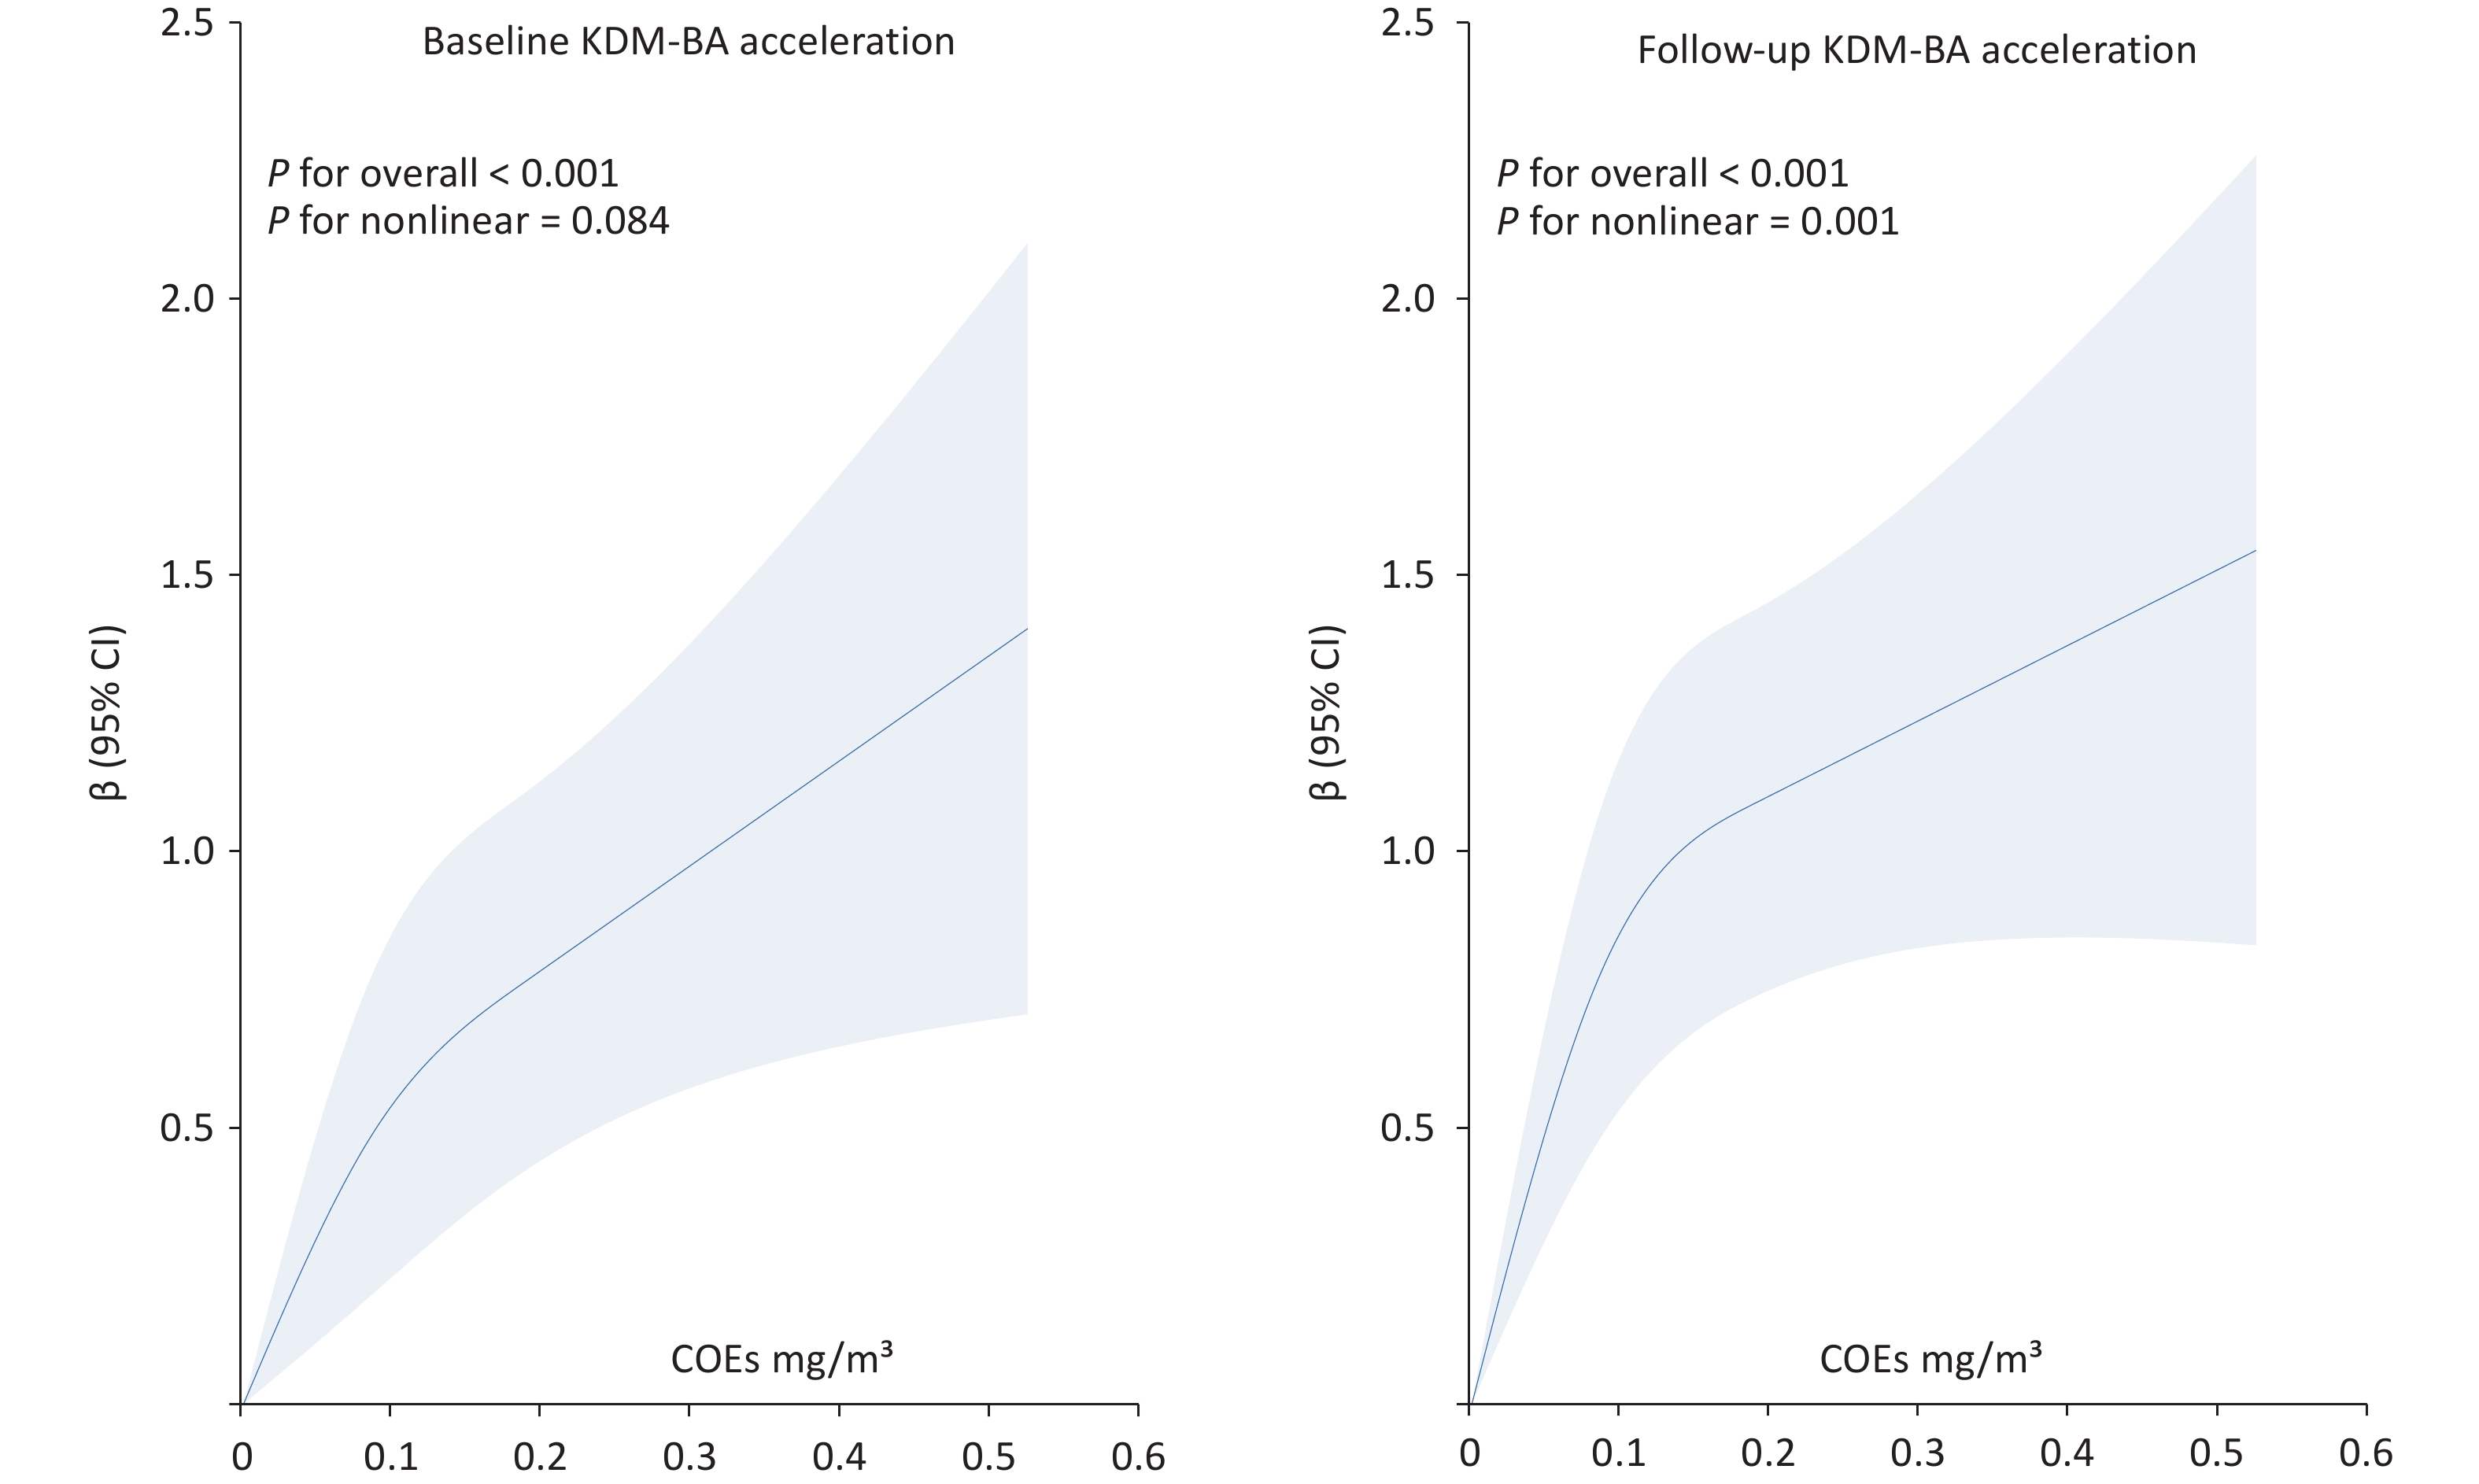
To further clarify the dose-response relationship between COE exposure and biological age acceleration, RCS analyses were applied to both baseline and follow-up data, as shown in Figure 1.
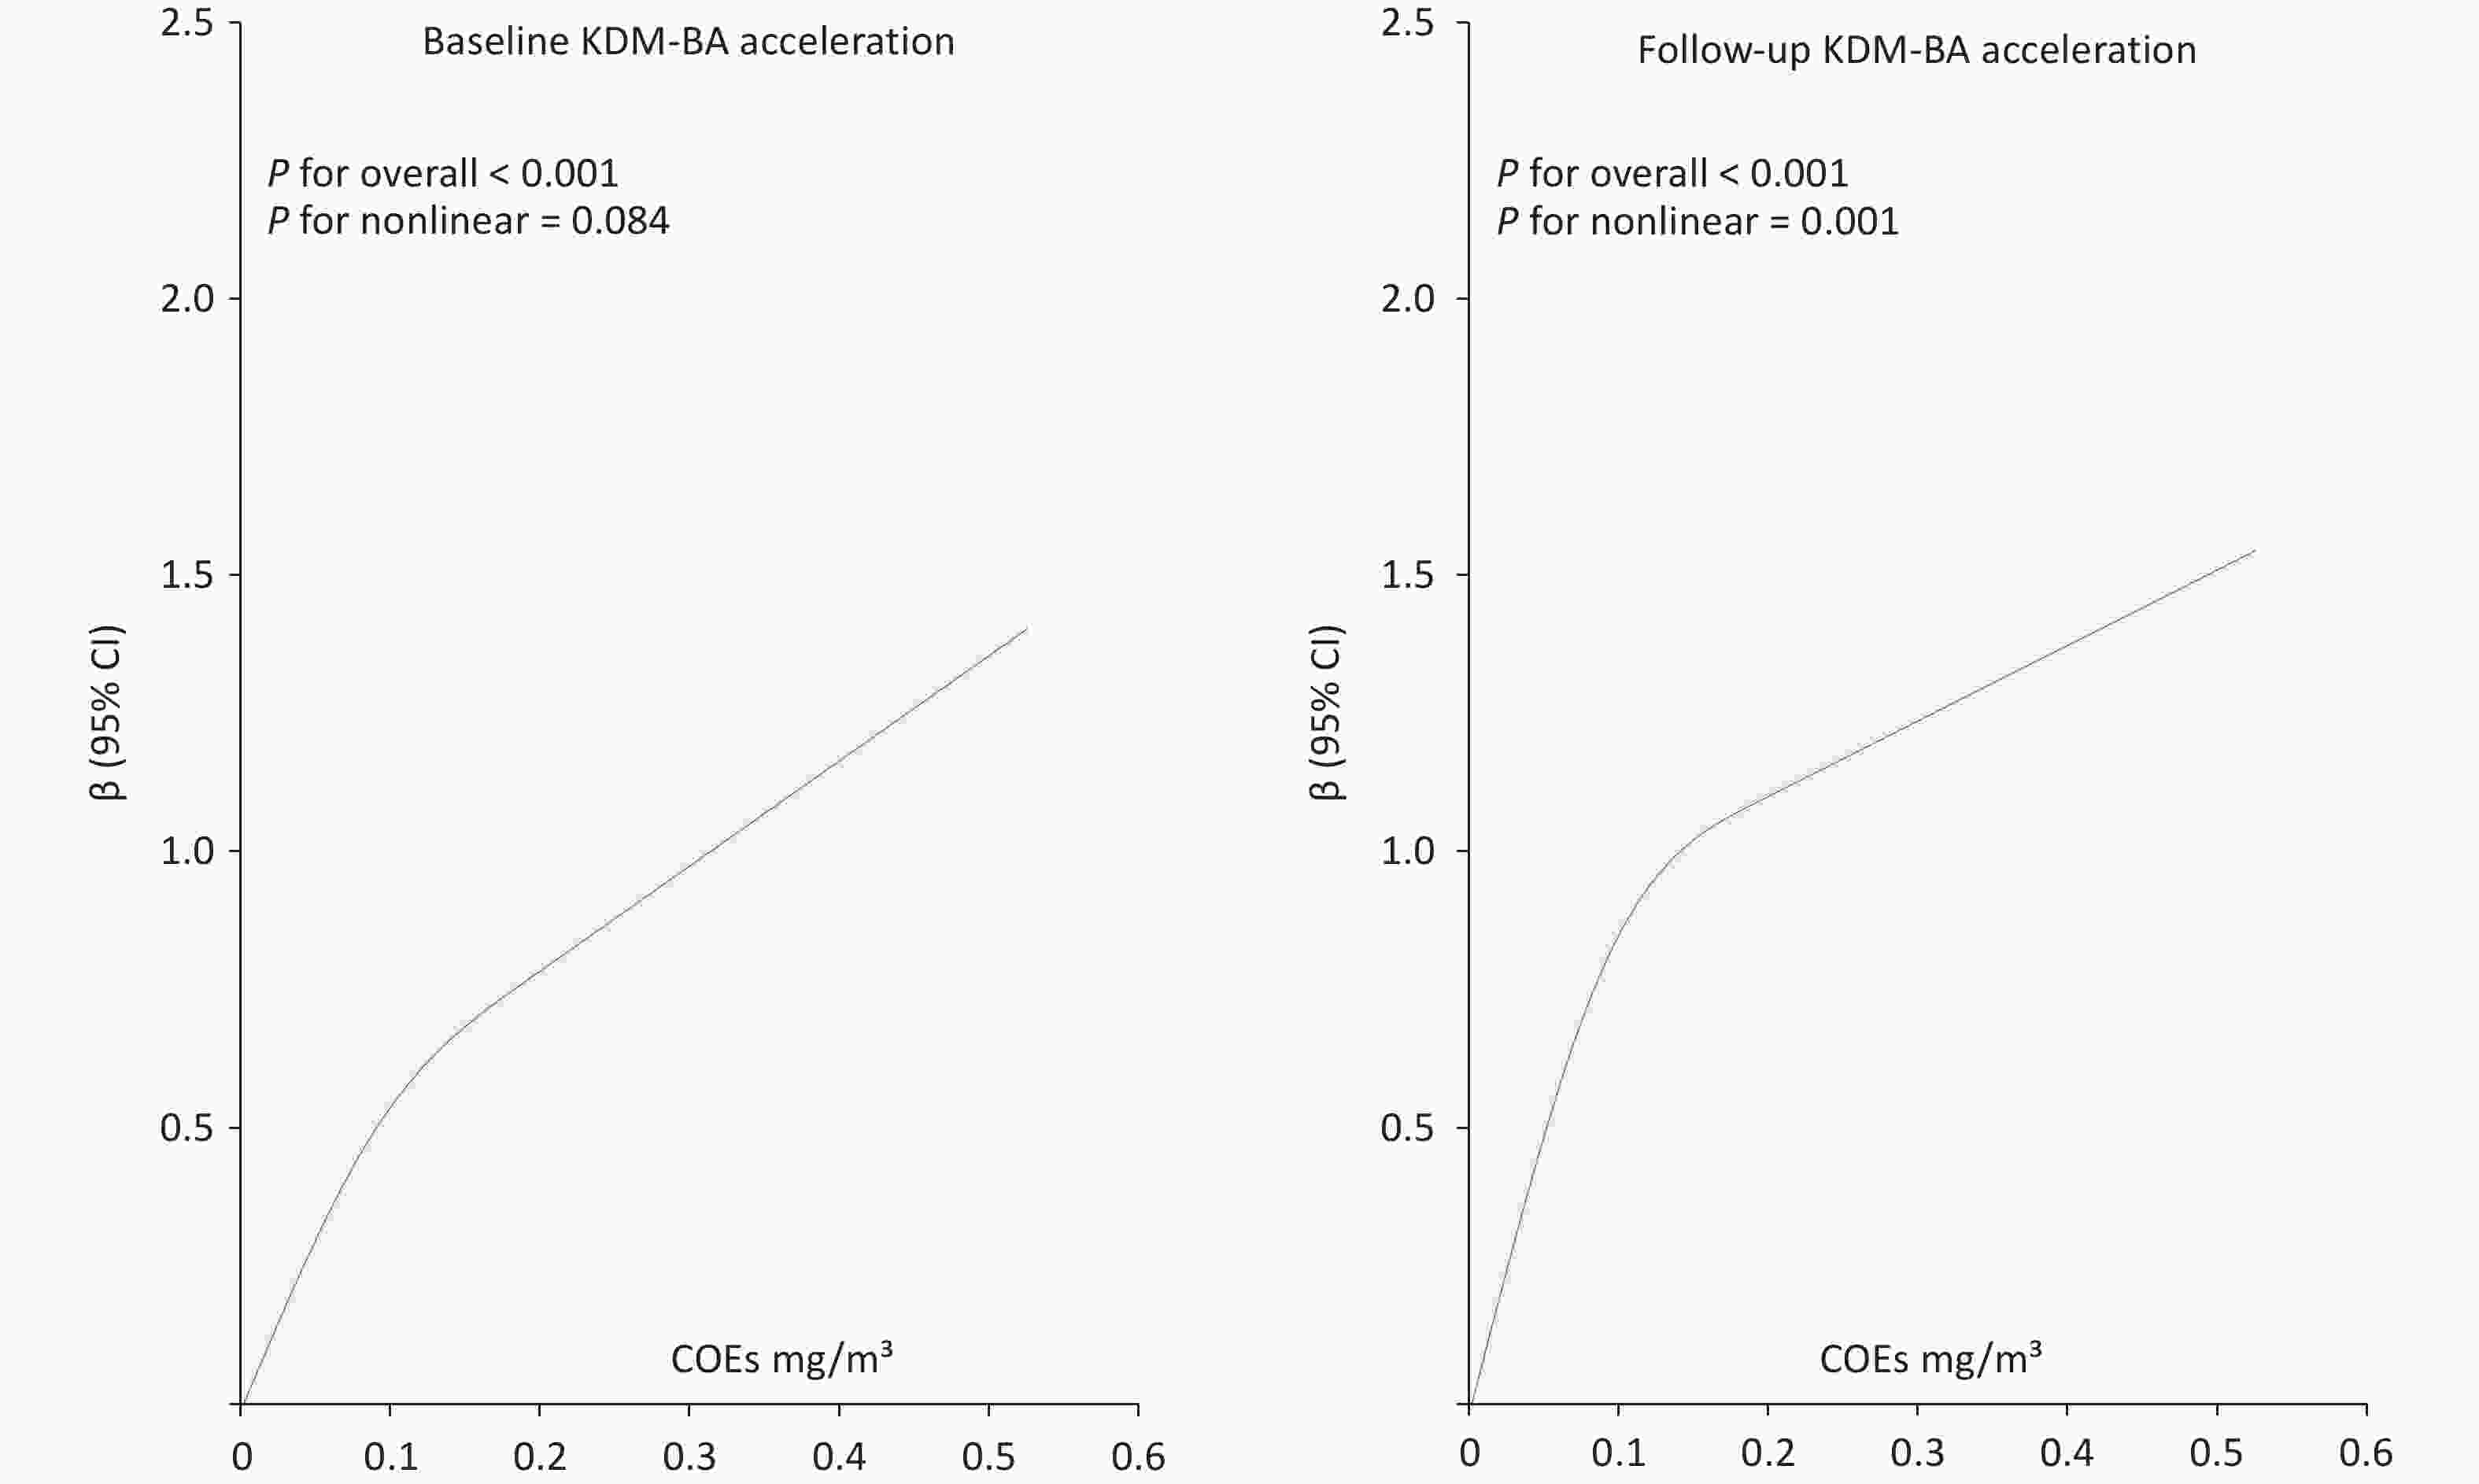
Figure 1. RCS plots of COE exposure and KDM-BA acceleration at baseline and follow-up. RCS, restricted cubic splines; COE, coke oven emission; KDM-BA, Klemera–Doubal method - Biological Age.
In both the baseline and follow-up data, KDM-BA acceleration showed an increasing trend with higher COE exposure levels, indicating a dose-response relationship between COE exposure and KDM-BA acceleration.
Aging is characterized by a gradual decline in physiological function, with diverse hallmarks and assessment metrics currently in use. In this study, biological age was calculated using the KDM method based on six clinical indicators: systolic blood pressure, TG, TC, RBC count, platelet count, and Cr[5,7]. This study used a prospective cohort design to investigate the association between COE exposure and accelerated biological aging.
Our results showed that the high-concentration COE exposure group exhibited significantly greater KDM-BA acceleration than the low-concentration group. The association between COE exposure and KDM-BA acceleration was consistently observed in both baseline and follow-up data, remaining generally robust after adjusting for multiple covariates. Overall, higher COE exposure was linked to greater biological aging. Restricted cubic spline analyses suggested that the exposure–response relationship may vary over time, indicating potential changes in the impact of long-term exposure. A previous study demonstrated that occupational chemical exposure can accelerate aging among workers[8]. The findings of Gu et al. also indicated that occupational exposure to COEs can accelerate aging, which is consistent with the results of our study.[9] At lower exposure levels, increases in COEs were accompanied by a steeper increase in KDM-BA acceleration, whereas at higher exposure levels, the slope flattened, suggesting a plateau effect. This trend may reflect the “healthy worker effect” or biological saturation. We conducted a sensitivity analysis excluding workers with less than five years or more than 20 years of work experience (Supplementary Table S3; Supplementary Figure S2). The analysis indicated that after excluding participants with very short or long work histories, the plateau effect observed in the RCS curve was attenuated, possibly due to biological saturation and adaptive responses resulting from long-term COEs exposure among occupational workers. Regarding the mechanisms by which COE exposure may accelerate aging, studies have shown that exposure to PAHs can induce an increase in reactive oxygen species (ROS). Elevated and imbalanced ROS levels can cause immune cell damage and immunotoxicity by disrupting proteins and DNA, promoting lipid peroxidation and altering signal transduction pathways. In addition, airborne PAHs, particularly 1-nitropyrene (1-NP) and 3-nitrofluoranthene, regulate pro-inflammatory responses via the PI3K/Akt signaling pathway[10].
However, this study had several limitations. The covariates included in this study were relatively limited. Potential confounding factors, such as diet, physical activity, and pre-existing health conditions, which may influence biological aging, were not considered. Although COE exposure levels were categorized based on worksite monitoring data, individual exposure heterogeneity may exist because of the unrecorded use of personal protective equipment and task-related mobility patterns among workers. The longitudinal analysis in this study included only two time points (2015 and 2019), which limited our ability to fully capture the true trajectory of biological aging and distinguish between short-term fluctuations and long-term sustained effects. Future studies with more frequent follow-up are required to accurately assess the dynamic relationship between exposure and accelerated aging.
Our findings indicate that occupational exposure to COEs is associated with accelerated KDM-BA. A dose–response relationship was observed between COE exposure and KDM-BA acceleration. This indicated that COE exposure may accelerate aging. From a public health perspective, strengthening occupational protection measures and health examinations, enhancing environmental surveillance in high-risk workplaces, and developing targeted interventions for workers with varying exposure histories are essential to promote healthy aging and improve occupational health outcomes.
doi: 10.3967/bes2025.170
Coke Oven Emissions and Biological Aging: Evidence from a Longitudinal Study among Workers
-
Ming Zhang and Wei Wang conceived, designed, and supervised the study. Dongsheng Hu and Pengpeng Wang secured funding and revised the manuscript. Xiaoyu Hao conducted the literature search, curated, analyzed, and interpreted the data, and drafted the manuscript. Zhiguang Gu, Bin Yang, Xiangkai Zhao, and Shaofei Yu critically reviewed and revised the manuscript. All authors approved the final version of the manuscript, and agreed to be accountable for all aspects of the work.
The authors have no relevant financial or non-financial interests to disclose.
This study observed the “Measures for the Ethical Review of Biomedical Research Involving Human Subjects” and “Measures for the Ethical Review of Life Sciences and Medical Research Involving Human Subjects” regulations. The study protocol was approved by the Medical Ethics Committee of the School of Medicine, Shenzhen University (approval number M20220528).
注释:1) Authors’ Contributions: 2) Competing Interests: 3) Ethics: -
Figure 1. RCS plots of COE exposure and KDM-BA acceleration at baseline and follow-up. RCS, restricted cubic splines; COE, coke oven emission; KDM-BA, Klemera–Doubal method - Biological Age.
Table 1. Basic characteristics of participants
Characteristic All (n = 505) Q1 (n = 178) Q2 (n = 157) Q3 (n = 170) P Gender N (%) Male 389 117 (65.7) 120 (76.4) 152 (89.4) < 0.001* Female 116 61 (34.3) 37 (23.6) 18 (10.6) Age (year) mean ± SD 39.11 ± 5.24 40.03 ± 4.84 38.54 ±5.13 38.68 ±5.61 0.014* Work duration (year) mean ± SD 15.10 ± 6.83 11.28 ± 5.48 16.98 ± 6.29 17.35 ± 6.89 < 0.001* Smoking status N (%) No 325 132 (74.2) 97 (61.8) 96 (56.5) 0.002* Yes 180 46 (25.8) 60 (38.2) 74 (43.5) Alcohol status N (%) No 238 96 (53.9) 71 (45.2) 71 (41.8) 0.064 Yes 277 82 (46.1) 86 (54.8) 99 (58.2) BMI (kg/m²) mean ± SD 24.54 ± 3.34 24.18 ± 3.13 24.28 ± 3.21 25.17 ± 3.58 0.01* Education levels N (%) Lower secondary or below 87 15 ( 8.4) 31 (19.7) 41 (24.1) < 0.001* High school 157 18 (10.1) 56 (35.7) 83 (48.8) Tertiary or above 261 145 (81.5) 70 (44.6) 46 (27.1) Exposure concentration median [IQR:P25,P75] 0.09 (0.01,0.12) 0.00 (0.00, 0.01) 0.09 (0.07, 0.10) 0.17 (0.12, 0.20) < 0.001* Baseline KDM-BA (year) mean ± SD 39.84 ± 5.57 40.14 ± 5.25 39.16 ± 5.59 40.14 ± 5.87 0.203 Follow-up KDM-BA (year) mean ± SD 43.98 ± 5.52 44.13 ± 5.39 43.39 ± 5.43 44.36 ± 5.71 0.260 Baseline KDM-BA acceleration (year) mean ± SD 0.67 ± 1.64 0.10 ± 1.52 0.63 ± 1.76 1.34 ± 1.39 < 0.001* Follow-up KDM-BA acceleration (year) mean ± SD 1.01 ± 1.67 0.32 ± 1.72 1.00 ± 1.54 1.71 ± 1.44 < 0.001* ∆KDM-BA acceleration (year) mean ± SD 0.33 ± 1.42 0.25 ± 1.45 0.40 ± 1.48 0.35 ± 1.34 0.631 Note. Intergroup comparisons of continuous variables (Age, Work duration, BMI, Exposure concentration, KDM-BA, KDM-BA acceleration) were conducted using ANOVA (analysis of variance), while categorical variables (Gender, Smoking status, Alcohol status, Education levels) were compared using the chi-square test; BMI,body mass index; Baseline KDM-BA, KDM biological age calculated from 2015 data; Follow-up KDM-BA, KDM biological age derived from 2019 follow-up data; Baseline KDM-BA acceleration, KDM biological age acceleration based on 2015 data; Follow-up KDM-BA acceleration, KDM biological age acceleration based on 2019 follow-up data; ∆KDM-BA acceleration, Change in KDM-BA acceleration during the follow-up period. *: Indicates a statistically significant difference.  下载: 导出CSV
Table 2. Generalized linear model results of COEs on KDM-BA acceleration
KDM-BA group Model1 Model2 Model3 β (95%CI) P β-Std β (95%CI) P β-Std β (95%CI) P β-Std Baseline KDM-BA acceleration Q1 ref ref ref Q2 0.53
(0.19–0.87)0.003* 0.32
(0.11–0.53)0.37
(0.05–0.68)0.023* 0.22
(0.03–0.42)0.34
(-0.00–0.67)0.054 0.21
(0–0.42)Q3 1.24
(0.91–1.58)< 0.001* 0.76
(0.55–0.96)0.87
(0.55–1.19)< 0.001* 0.53
(0.33–0.72)0.79
(0.43–1.16)< 0.001* 0.48
(0.26–0.71)Follow-up KDM-BA acceleration Q1 ref ref ref Q2 0.68
(0.33–1.02)< 0.001* 0.41
(0.2–0.61)0.55
(0.22–0.87)< 0.001* 0.33
(0.13–0.52)0.50
(0.15–0.86)0.005* 0.3
(0.09–0.51)Q3 1.39
(1.05–1.73)< 0.001* 0.83
(0.63–1.03)1.08
(0.75–1.41)< 0.001* 0.65
(0.45–0.85)0.94
(0.57–1.31)< 0.001* 0.56
(0.34–0.79)∆KDM-BA acceleration Q1 ref ref ref Q2 0.15
(-0.16–0.47)0.349 0.11
(-0.12–0.33)0.16
(-0.16–0.47)0.334 0.11
(-0.11–0.33)0.14
(-0.21–0.48)0.443 0.1
(-0.15–0.34)Q3 0.10
(-0.21–0.41)0.521 0.07
(-0.15–0.29)0.14
(-0.18–0.46)0.393 0.1
(-0.13–0.32)0.06
(-0.30–0.43)0.737 0.04
(-0.21– 0.3)Note. Baseline KDM-BA, KDM biological age calculated from 2015 data; Follow-up KDM-BA, KDM biological age derived from 2019 follow-up data; Baseline KDM-BA acceleration, KDM biological age acceleration based on 2015 data; Follow-up KDM-BA acceleration, KDM biological age acceleration based on 2019 follow-up data; ∆KDM-BA acceleration, Change in KDM-BA acceleration during the follow-up period. β-Std, standardized β value. The number of participants in each group was as follows, Q1 = 178, Q2 = 157, Q3 = 170. *: The difference was statistically significant.
下载: 导出CSV
-
[1] Guo J, Huang XQ, Dou L, et al. Aging and aging-related diseases: from molecular mechanisms to interventions and treatments. Signal Transduct Target Ther, 2022; 7, 391. doi: 10.1038/s41392-022-01251-0 [2] Gu ZG, Niu ZM, Yan ZF, et al. Chain-mediating effect of interaction between telomeres and mitochondria under oxidative stress in coke oven workers. Environ Pollut, 2023; 331, 121855. doi: 10.1016/j.envpol.2023.121855 [3] Blechter B, Cardenas A, Shi JM, et al. Household air pollution and epigenetic aging in Xuanwei, China. Environ Int, 2023; 178, 108041. doi: 10.1016/j.envint.2023.108041 [4] Liu ZY. Development and validation of 2 composite aging measures using routine clinical biomarkers in the Chinese population: analyses from 2 prospective cohort studies. J Gerontol A Biol Sci Med Sci, 2021; 76, 1627−32. doi: 10.1093/gerona/glaa238 [5] Li MH, Gao CY, Qin L, et al. Construction of biological age model based on multiple routine clinicalbiomarkers for the Chinese population. J Zhengzhou Univ (Med Sci), 2025; 60, 452−5. (In Chinese) [6] Duan XR, Yang YL, Zhang DP, et al. Genetic polymorphisms, mRNA expression levels of telomere-binding proteins, and associates with telomere damage in PAHs-Exposure workers. Chemosphere, 2019; 231, 442−9. doi: 10.1016/j.chemosphere.2019.05.134 [7] Gao CY, Li MH, Gu ZG, et al. Progress in biological age research. J Zhengzhou Univ (Med Sci), 2025; 60, 445−51. (In Chinese) [8] Wu WC, Guo Y, Zhao XK, et al. Correlation analysis on occupational acid fog exposure and accelerated biological aging in workers. J Jilin Univ (Med Ed), 2024; 50, 1741−50. (In Chinese) [9] Gu ZG, Zhang LM, Zhao XK, et al. Accelerated biological aging among chemical plant workers. Environ Res, 2025; 285, 122709. doi: 10.1016/j.envres.2025.122709 [10] Peng B, Dong QL, Li FZ, et al. A systematic review of polycyclic aromatic hydrocarbon derivatives: occurrences, levels, biotransformation, exposure biomarkers, and toxicity. Environ Sci Technol, 2023; 57, 15314−35. doi: 10.1021/acs.est.3c03170 -

 点击查看大图
图(1) / 表ll (2)
计量
- 文章访问数: 24
- HTML全文浏览量: 4
- PDF下载量: 2
- 被引次数: 0

 Quick Links