

 下载:
下载:


-
Inflammatory bowel disease (IBD) is a persistent and recurrent intestinal disorder that tends to relapse over time. It is typically categorized into two subtypes: ulcerative colitis (UC) and Crohn’s disease (CD)[1]. The prevalence of IBD continues to increase globally, imposing a significant burden on public health systems; according to the Global Burden of Disease Study, a total of 3,830,000 individuals suffered from IBD in 2021[2]. Patients with IBD can present with multiple life-threatening complications, including intestinal bleeding, obstruction, perforation, and cancer and extraintestinal manifestations[3]. Although the etiology of IBD remains to be fully elucidated, its pathophysiology is associated with genetic, immune, and environmental factors[4]. According to previous epidemiological studies, decreased air quality may contribute to IBD progression, and some harmful air contaminants may be associated with gastrointestinal side effects[5-7]. The underlying mechanisms behind these pathologies are complex and may include direct deleterious effects on epithelial cells, immune reaction modifications, and gut microbiota regulation[8].
As an essential component of the air, particulate matter 2.5 (PM2.5) is a complex mixture of many constituents, including organic carbon, black carbon (BC), sulfate, nitrate, ammonium, and metal elements[9], and is associated with various disorders, including respiratory, endocrine, cardiovascular, and cerebrovascular diseases[10]. PM2.5 absorbance is a measurement of how much light the PM in PM2.5 can absorb. It is particularly relevant for components such as BC within PM2.5, which is known for its light-absorbing characteristics and contribution to climate change and health effects[11]. Therefore, PM2.5 absorbance is considered as an indicator and proxy of BC, reflecting the carbon fraction concentration in PM2.5, which could enter the bloodstream and even be disseminated to distant organs, including the intestinal tract[12]. At present, the potential pathogenicity of PM2.5 in IBD remains controversial. According to a population-based cohort study, long-term exposure to PM2.5 was associated with a 20.4% higher risk of developing IBD[13]. In an ecologic analysis study conducted in the US, the emissions of six air contaminants, including PM2.5, were significantly correlated with an increased risk of IBD-related hospitalizations[14]. However, a European nested case-control study across six countries found no evidence showing that participants who suffered from IBD were exposed to higher PM2.5 levels, with an absence of consistent association[6]. Given the current inherent limitations of observational studies, including confounding factors, the causal relationship between PM2.5 and IBD development remains unclear[15]. Furthermore, although PM2.5 absorbance is an essential indicator to assess the elemental carbon of PM2.5, has rarely been considered in the previous studies. Therefore, further high-quality studies are needed to investigate the relationship between IBD and PM2.5 and PM2.5 absorbance.
Considering that there are limited studies to build a causal relationship between PM2.5, PM2.5 absorbance, and IBD development, we hypothesized a possible causal link between these two air pollutants and IBD. Mendelian randomization (MR) is an instrumental variable (IV) approach that uses single-nucleotide polymorphisms (SNPs) as IVs to deduce the causal relationship between exposures and outcomes. The methodology of the present study is based on Mendel’s second law of genetics, which entails classifying research subjects based on the presence of particular genetic mutations and then contrasting the incidence of outcomes among these groups. SNPs adhere to the principle of random distribution during meiosis, overcoming the disadvantages of traditional observational studies, by minimizing bias due to reverse causality or confounding factors, including environmental exposures and behaviors, given that genetic variations predate the emergence of the disease[16-18]. Herein, we employed a two-sample MR design, which used outcome- and exposure-related IVs from two population datasets and could enhance the statistical power to investigate the causal relationship between IBD and PM2.5 and PM2.5 absorbance. The results of this study may provide essential insights into the causal relationship between PM2.5, PM2.5 absorbance, and IBD, ultimately offering a theoretical basis and further research directions for the prevention of this disease.
-
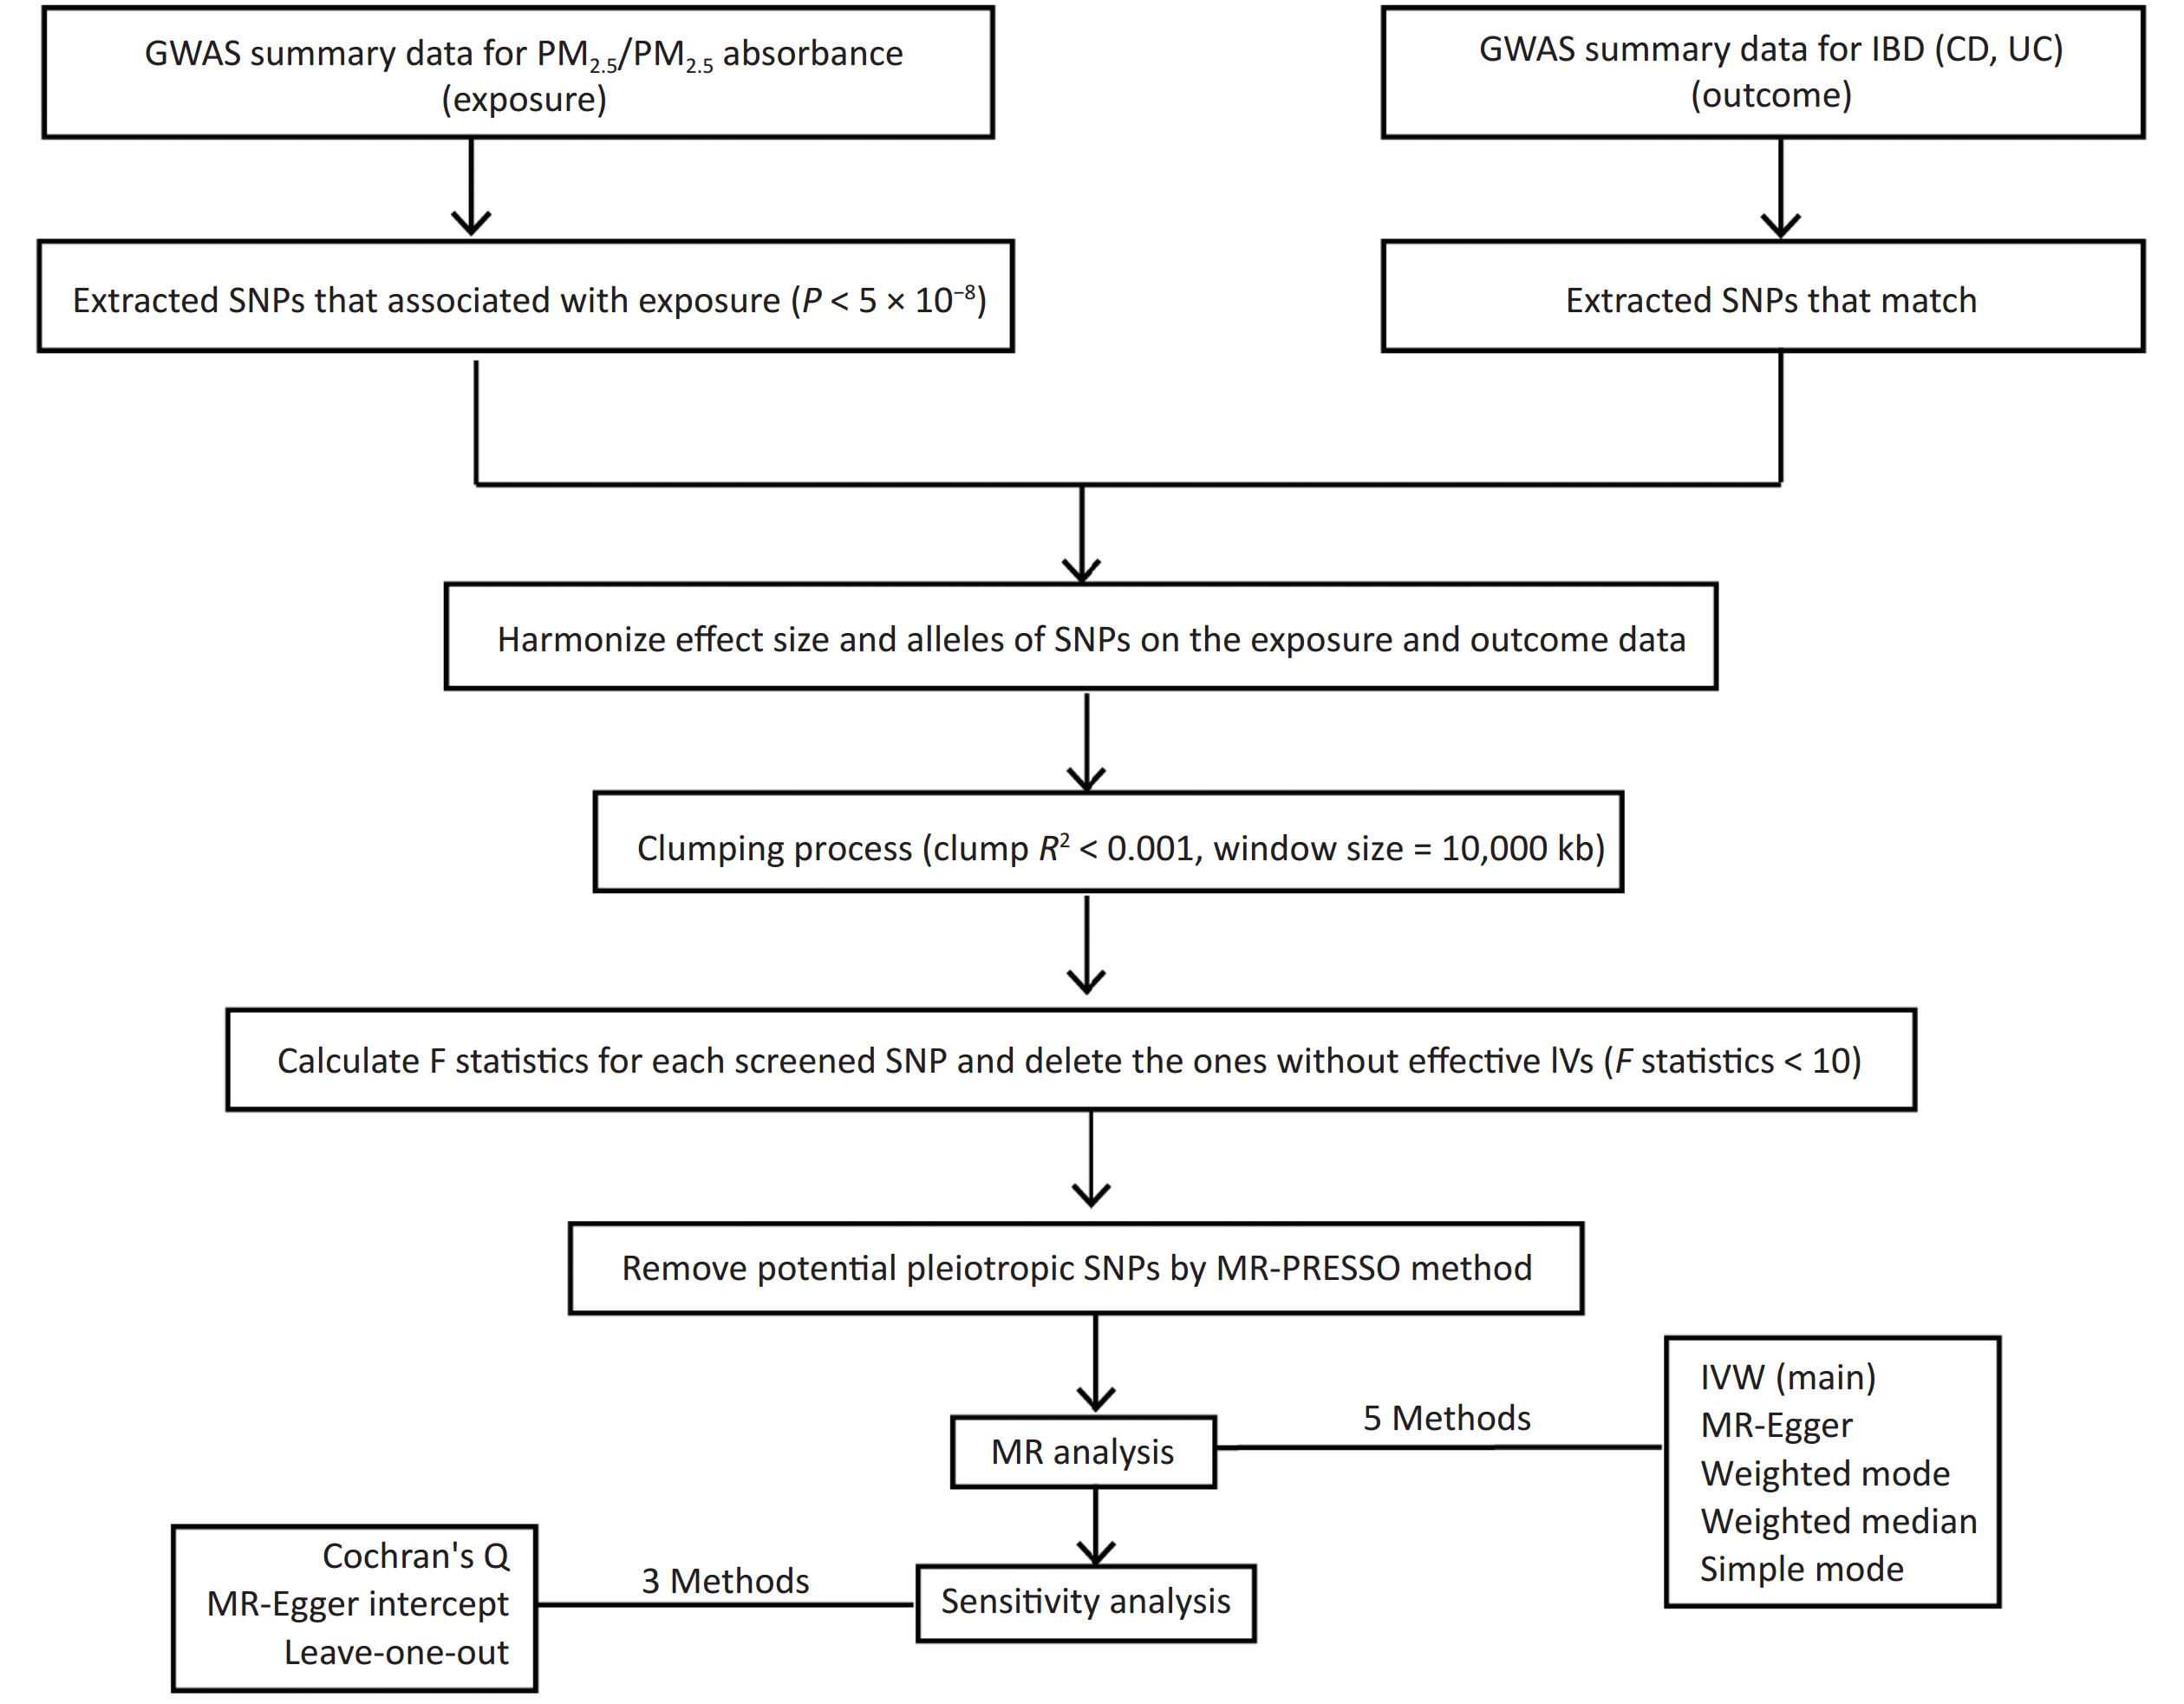
Figure 1 shows a flowchart of our study design, encompassing the process of identifying IVs, performing MR studies through five distinct approaches, and conducting sensitivity analyses. In order to comprehensively grasp our research framework, it is crucial to elucidate the foundation of MR, which comprises three essential assumptions. The first assumption requires that the genetic variants utilized as IVs should be closely related to exposure factors, and the correlation coefficient is primarily < 5 × 10⁻⁸. The second assumption is that the proposed genetic variants should not be linked to any confounders. The third assumption is that the selected IVs should affect the risk of the outcome only through the risk factors that we are concerned with[16]. These assumptions ensure that the findings of MR would not be influenced by extraneous confounding factors, including population and environmental characteristics and socioeconomic conditions. Moreover, the possibility of reverse causality is eliminated since genetic variation accounts for the emergence of exposure prior to the outcome, thereby mitigating the shortcomings inherent in conventional epidemiological methodologies. We conducted two-sample MR analysis using publicly available genetic datasets in two genome-wide association studies (GWAS) to identify the causal links between PM2.5 and UC and CD.
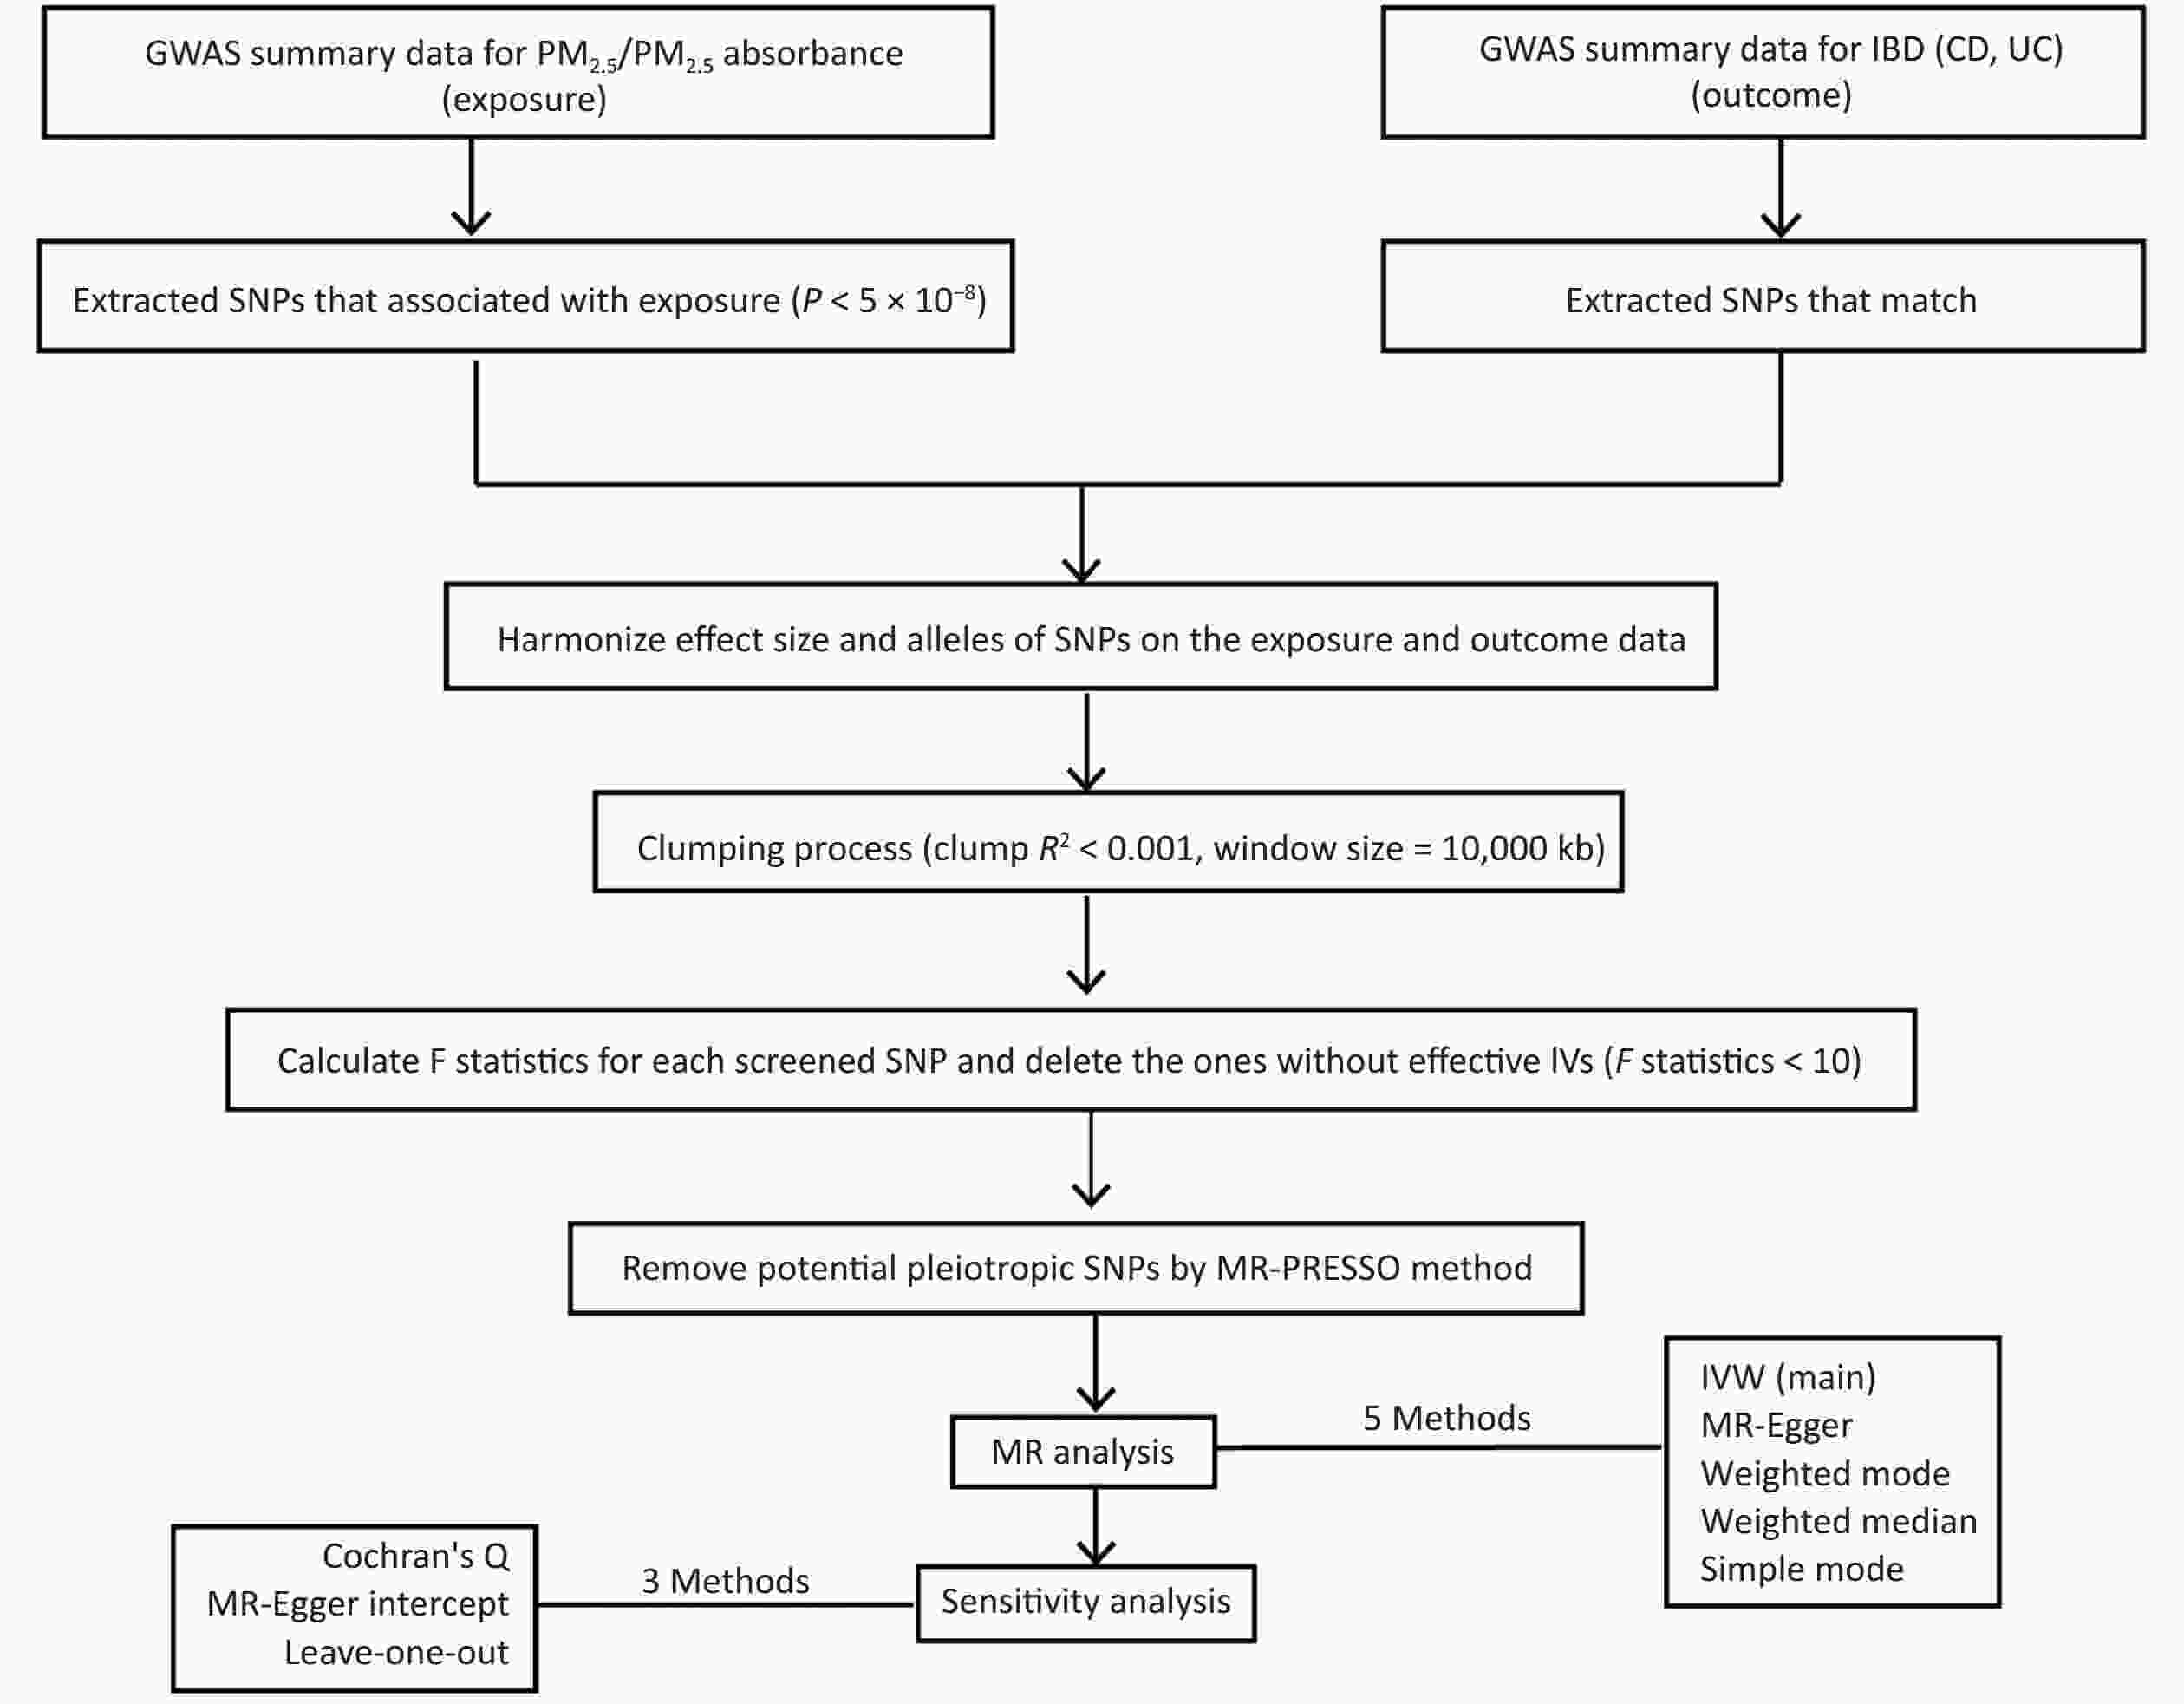
Figure 1. Study design and workflow of the current study.
-
The UK Biobank is a large-scale, prospective cohort study encompassing genetic and phenotypic data from approximately 500,000 residents in the UK. This expansive, open-access resource offers a wealth of detailed health and lifestyle information for each participant, including biological data and biomarkers, which has achieved data depth and breadth. Moreover, follow-up information is provided by linking health and medical records for further tracing research[19,20]. We used the UK Biobank GWAS, which contained 423,796 European participants, to obtain our summary genetic dataset on PM2.5 (GWAS ID: ukb-b-10817) and PM2.5 absorbance (GWAS ID: ukb-b-11312). The study, which was based on a cohort study evaluating the effects of air pollution in Europe, utilized the land use regression model to predict PM2.5 concentrations in participants’ homes[21]. The mean (± standard deviation) PM2.5 level in the GWAS was 9.99 (± 1.06) µg/m3[22]. We searched for genetic variants of UC and CD in the UK Biobank GWAS to reduce potential deviation in population stratification. The CD dataset (GWAS ID: ukb-a-552), including 732 cases of European descent and 336,467 controls, and the UC dataset (GWAS ID: ukb-b-19386), including 1987 cases and 461,023 controls, were defined on the basis of clinical diagnosis. Ethical review and approval are not applicable for our study because all GWAS data on human participants used in this study are publicly available in the IEU OpenGWAS Project (https://gwas.mrcieu.ac.uk/). These datasets can also be downloaded from the GWAS catalog (https://www.ebi.ac.uk/gwas/).
-
Strict quality control measures were implemented to meticulously select relevant SNPs. First, we grouped the datasets according to the criterion of P < 5 × 10⁻⁸ to filter SNPs that are closely related to exposure factors. Second, independent genetic variants were selected by conducting a clumping process, which involved setting a distance window of 10,000 kilobases and a linkage disequilibrium (LD) coefficient threshold of r2 < 0.001. This step was important to avoid any LD between SNPs and to ensure the complete independence of the selected genetic variants[23]. Third, we retained palindromic SNPs on the basis of the following threshold: minor allele frequency < 0.3[24]. Notably, if the allele frequency contained in the details of an SNP is close to 0.5, we could hardly pinpoint the minor allele because of sampling variance around the allele frequency. Thus, we excluded such SNPs at the outset of MR analyses to improve the accuracy of our study. Fourth, we estimated the proportion of variance interpreted (R2) and F-statistics for each SNP to predict the power of the selected IVs. Genetic instruments (F-statistics < 10) were regarded as weak instruments, which should be ruled out from MR analysis[25]. Finally, we used the Mendelian Randomization Pleiotropy RESidual Sum and Outlier (MR‐PRESSO) test to determine potential horizontal pleiotropy and to remove aberrant IVs (outliers) in order to exclude the influence of pleiotropy and estimate the corrected results[26].
-
The inverse variance weighting (IVW) test was used to assess the causal relationship between PM2.5, PM2.5 absorbance, and IBD. This test is known for its ability to greatly determine causation[27]. We also complemented our evidence using MR-Egger, weighted mode, weighted median, and simple mode to enhance the precision and stability of our results[28]. Aside from using the MR‐PRESSO test, we also performed an MR-Egger regression test as a further measure to determine whether any pleiotropy was present among the selected SNPs, thereby increasing the overall credibility and integrity of our findings. If there was no significant difference (P < 0.05) between the MR-Egger intercept and 0, then IVs were considered to not affect IBD risk through other confounding factors[29]. For the quality of the IVW test and MR-Egger model, Cochran’s Q test was conducted to calculate heterogeneity between screened SNPs. If the P-value from Cochran’s Q test was less than 0.05, then there is heterogeneity among the study results[30]. We also applied leave-one-out analysis to exclude random deviations from selecting IVs and to identify whether the causal link would be affected by a particular SNP[31].
All statistical analyses were conducted using R software (version 4.1.3) by utilizing the “TwoSampleMR”[23] package and “MR-PRESSO”[26]. Statistical significance was established at P < 0.05.
-
We used P < 5 × 10⁻⁸ as a threshold for selecting SNPs and conducted the clumping LD process (r2 < 0.001). Eight IVs associated with PM2.5 and five IVs associated with PM2.5 absorbance were obtained. Notably, we adjusted the criterion to P < 1 × 10⁻⁷ in the PM2.5 absorbance and UC group to detect more relevant SNPs and enhance the statistical power[32,33]. Ultimately, seven IVs of CD and five IVs of UC were selected in the MR analyses of PM2.5 to IBD. In the MR analyses of PM2.5 absorbance to IBD, four IVs of CD and three IVs of UC were screened. The F-statistic was greater than 10 (ranging from 30 to 69) for all IVs, suggesting the absence of weak IV deviation. No outlier was removed through MR-PRESSO considering the nonsignificant result of the MR-PRESSO global test (P > 0.05). More detailed information about the selected IVs is presented in Supplementary Table S1.
Table S1. Detailed information of each single nucleotide polymorphism selected in our study
SNP Effect F-statistic R2 Exposure Exposure Outcome Outcome allele beta se pval eaf beta se pval eaf rs114708313 T 30.076 7.420E−05 PM2.5 0.025 0.004 4.200E−08 0.066 Crohn’s disease 2.531E−04 2.440E−04 2.997E−01 0.067 rs1372504 A 30.674 7.077E−05 PM2.5 0.012 0.002 3.100E−08 0.374 Crohn’s disease −1.056E−04 1.172E−04 3.679E−01 0.373 rs1537371 A 33.149 7.651E−05 PM2.5 0.012 0.002 8.500E−09 0.500 Crohn’s disease −1.802E−05 1.135E−04 8.738E−01 0.496 rs6749467 A 32.228 7.642E−05 PM2.5 −0.012 0.002 1.400E−08 0.466 Crohn’s disease −8.829E−05 1.152E−04 4.434E−01 0.467 rs72642437 T 35.119 9.894E−05 PM2.5 0.113 0.019 3.100E−09 0.004 Crohn’s disease 4.525E−04 1.224E−03 7.116E−01 0.003 rs77205736 T 31.399 7.273E−05 PM2.5 0.014 0.002 2.100E−08 0.274 Crohn’s disease −5.372E−05 1.272E−04 6.729E−01 0.274 rs77255816 T 30.041 6.933E−05 PM2.5 0.031 0.006 4.200E−08 0.037 Crohn’s disease 3.314E−04 3.031E−04 2.742E−01 0.036 rs12203592 T 69.918 1.573E−04 PM2.5 0.022 0.003 6.200E−17 0.213 ulcerative colitis 2.908E−04 1.617E−04 7.200E−02 0.220 rs1372504 A 30.674 7.077E−05 PM2.5 0.012 0.002 3.100E−08 0.374 ulcerative colitis −5.507E−05 1.404E−04 6.900E−01 0.374 rs1537371 A 33.149 7.651E−05 PM2.5 0.012 0.002 8.500E−09 0.500 ulcerative colitis 9.277E−05 1.358E−04 4.900E−01 0.501 rs6749467 A 32.228 7.642E−05 PM2.5 −0.012 0.002 1.400E−08 0.466 ulcerative colitis −2.473E−04 1.380E−04 7.300E−02 0.465 rs77205736 T 31.399 7.273E−05 PM2.5 0.014 0.002 2.100E−08 0.274 ulcerative colitis 1.130E−04 1.524E−04 4.600E−01 0.275 rs4915350 C 33.933 7.819E−05 PM2.5 absorbance 0.046 0.008 5.700E−09 0.019 Crohn’s disease −7.632E−05 4.327E−04 8.600E−01 0.018 rs59727727 C 30.823 6.941E−05 PM2.5 absorbance 0.018 0.003 2.800E−08 0.122 Crohn’s disease 3.910E−06 1.777E−04 9.824E−01 0.115 rs77205736 T 29.911 6.813E−05 PM2.5 absorbance 0.013 0.002 4.500E−08 0.274 Crohn’s disease −5.372E−05 1.272E−04 6.729E−01 0.274 rs79475047 C 36.427 8.255E−05 PM2.5 absorbance 0.040 0.007 1.600E−09 0.027 Crohn’s disease −6.937E−06 3.516E−04 9.843E−01 0.027 rs12203592 T 41.539 9.189E−05 PM2.5 absorbance 0.017 0.003 1.200E−10 0.213 ulcerative colitis 2.908E−04 1.617E−04 7.200E−02 0.220 rs77205736 T 29.911 6.813E−05 PM2.5 absorbance 0.013 0.002 4.500E−08 0.274 ulcerative colitis 1.130E−04 1.524E−04 4.600E−01 0.275 rs884436 T 29.070 6.660E−05 PM2.5 absorbance 0.012 0.002 7.000E−08 0.485 ulcerative colitis 6.223E−05 1.366E−04 6.500E−01 0.486 Note. PM2.5, particulate matter air pollution; eaf, effect allele frequency; se, standard error; pval, P-value. -
The IVW MR analysis, which was regarded as the primary method to estimate the causal relationship in our study, genetically revealed a significant association between PM2.5 and UC (odds ratio [OR] = 1.010; 95% confidence interval [CI] = 1.001–1.019, P = 0.020). Such associations were statistically consistent, although nonsignificant in the MR-Egger, weighted mode, weighted median, and simple mode. However, we did not observe a significant association between PM2.5 exposure and Crohn´s Disease in MR analysis (OR = 1.002; 95% CI = 0.995–1.009, P = 0.516) (Table 1, Supplementary Table S2, Figure 2, and Figure 3). No heterogeneity was observed in the sensitivity analysis (Cochran’s Q: P = 0.732 and P = 0.611) (Supplementary Table S3), and no evidence of horizontal pleiotropy was detected in the MR-Egger regression analyses (Egger intercept: P = 0.312 and P = 0.591) (Supplementary Table S4). The results of leave-one-out analysis, wherein each SNP was deleted individually, were consistent with those of the IVW method. The sensitivity analyses showed that the positive associations found by MR are consistent (Supplementary Table S5 and Supplementary Figure S1).
Table 1. MR analysis result of causal effects
Exposure/Outcome Method nSNP beta se pval OR 95% CI PM2.5 Crohn’s disease IVW 7 0.002 0.004 0.517 1.002 0.995−1.009 MR Egger 7 0.012 0.009 0.253 1.012 0.994−1.029 Weighted median 7 0.003 0.005 0.496 1.003 0.993−1.013 Simple mode 7 0.008 0.007 0.343 1.008 0.993−1.022 Weighted mode 7 0.008 0.007 0.341 1.008 0.993−1.022 Ulcerative colitis IVW 5 0.010 0.005 0.027 1.010 1.001−1.019 MR Egger 5 0.021 0.019 0.352 1.021 0.983−1.060 Weighted median 5 0.010 0.006 0.070 1.010 0.999−1.021 Simple mode 5 0.010 0.008 0.274 1.010 0.994−1.025 Weighted mode 5 0.012 0.007 0.182 1.012 0.997−1.025 PM2.5 absorbance Crohn’s disease IVW 4 −0.001 0.005 0.769 0.998 0.989−1.008 MR Egger 4 0.001 0.010 0.968 1.000 0.980−1.021 Weighted median 4 −0.001 0.005 0.866 0.999 0.989−1.009 Simple mode 4 > −0.001 0.007 0.975 1.000 0.986−1.013 Weighted mode 4 > −0.001 0.007 0.973 1.000 0.986−1.013 Ulcerative colitis IVW 3 0.012 0.004 0.002 1.012 1.004−1.019 MR Egger 3 0.046 0.042 0.469 1.047 0.965−1.137 Weighted median 3 0.010 0.007 0.174 1.010 0.995−1.024 Simple mode 3 0.007 0.009 0.530 1.007 0.989−1.026 Weighted mode 3 0.007 0.009 0.525 1.007 0.989−1.026 Note. PM2.5, particulate matter 2.5; se, standard error; pval, P-value; IVW, inverse variance weighting. 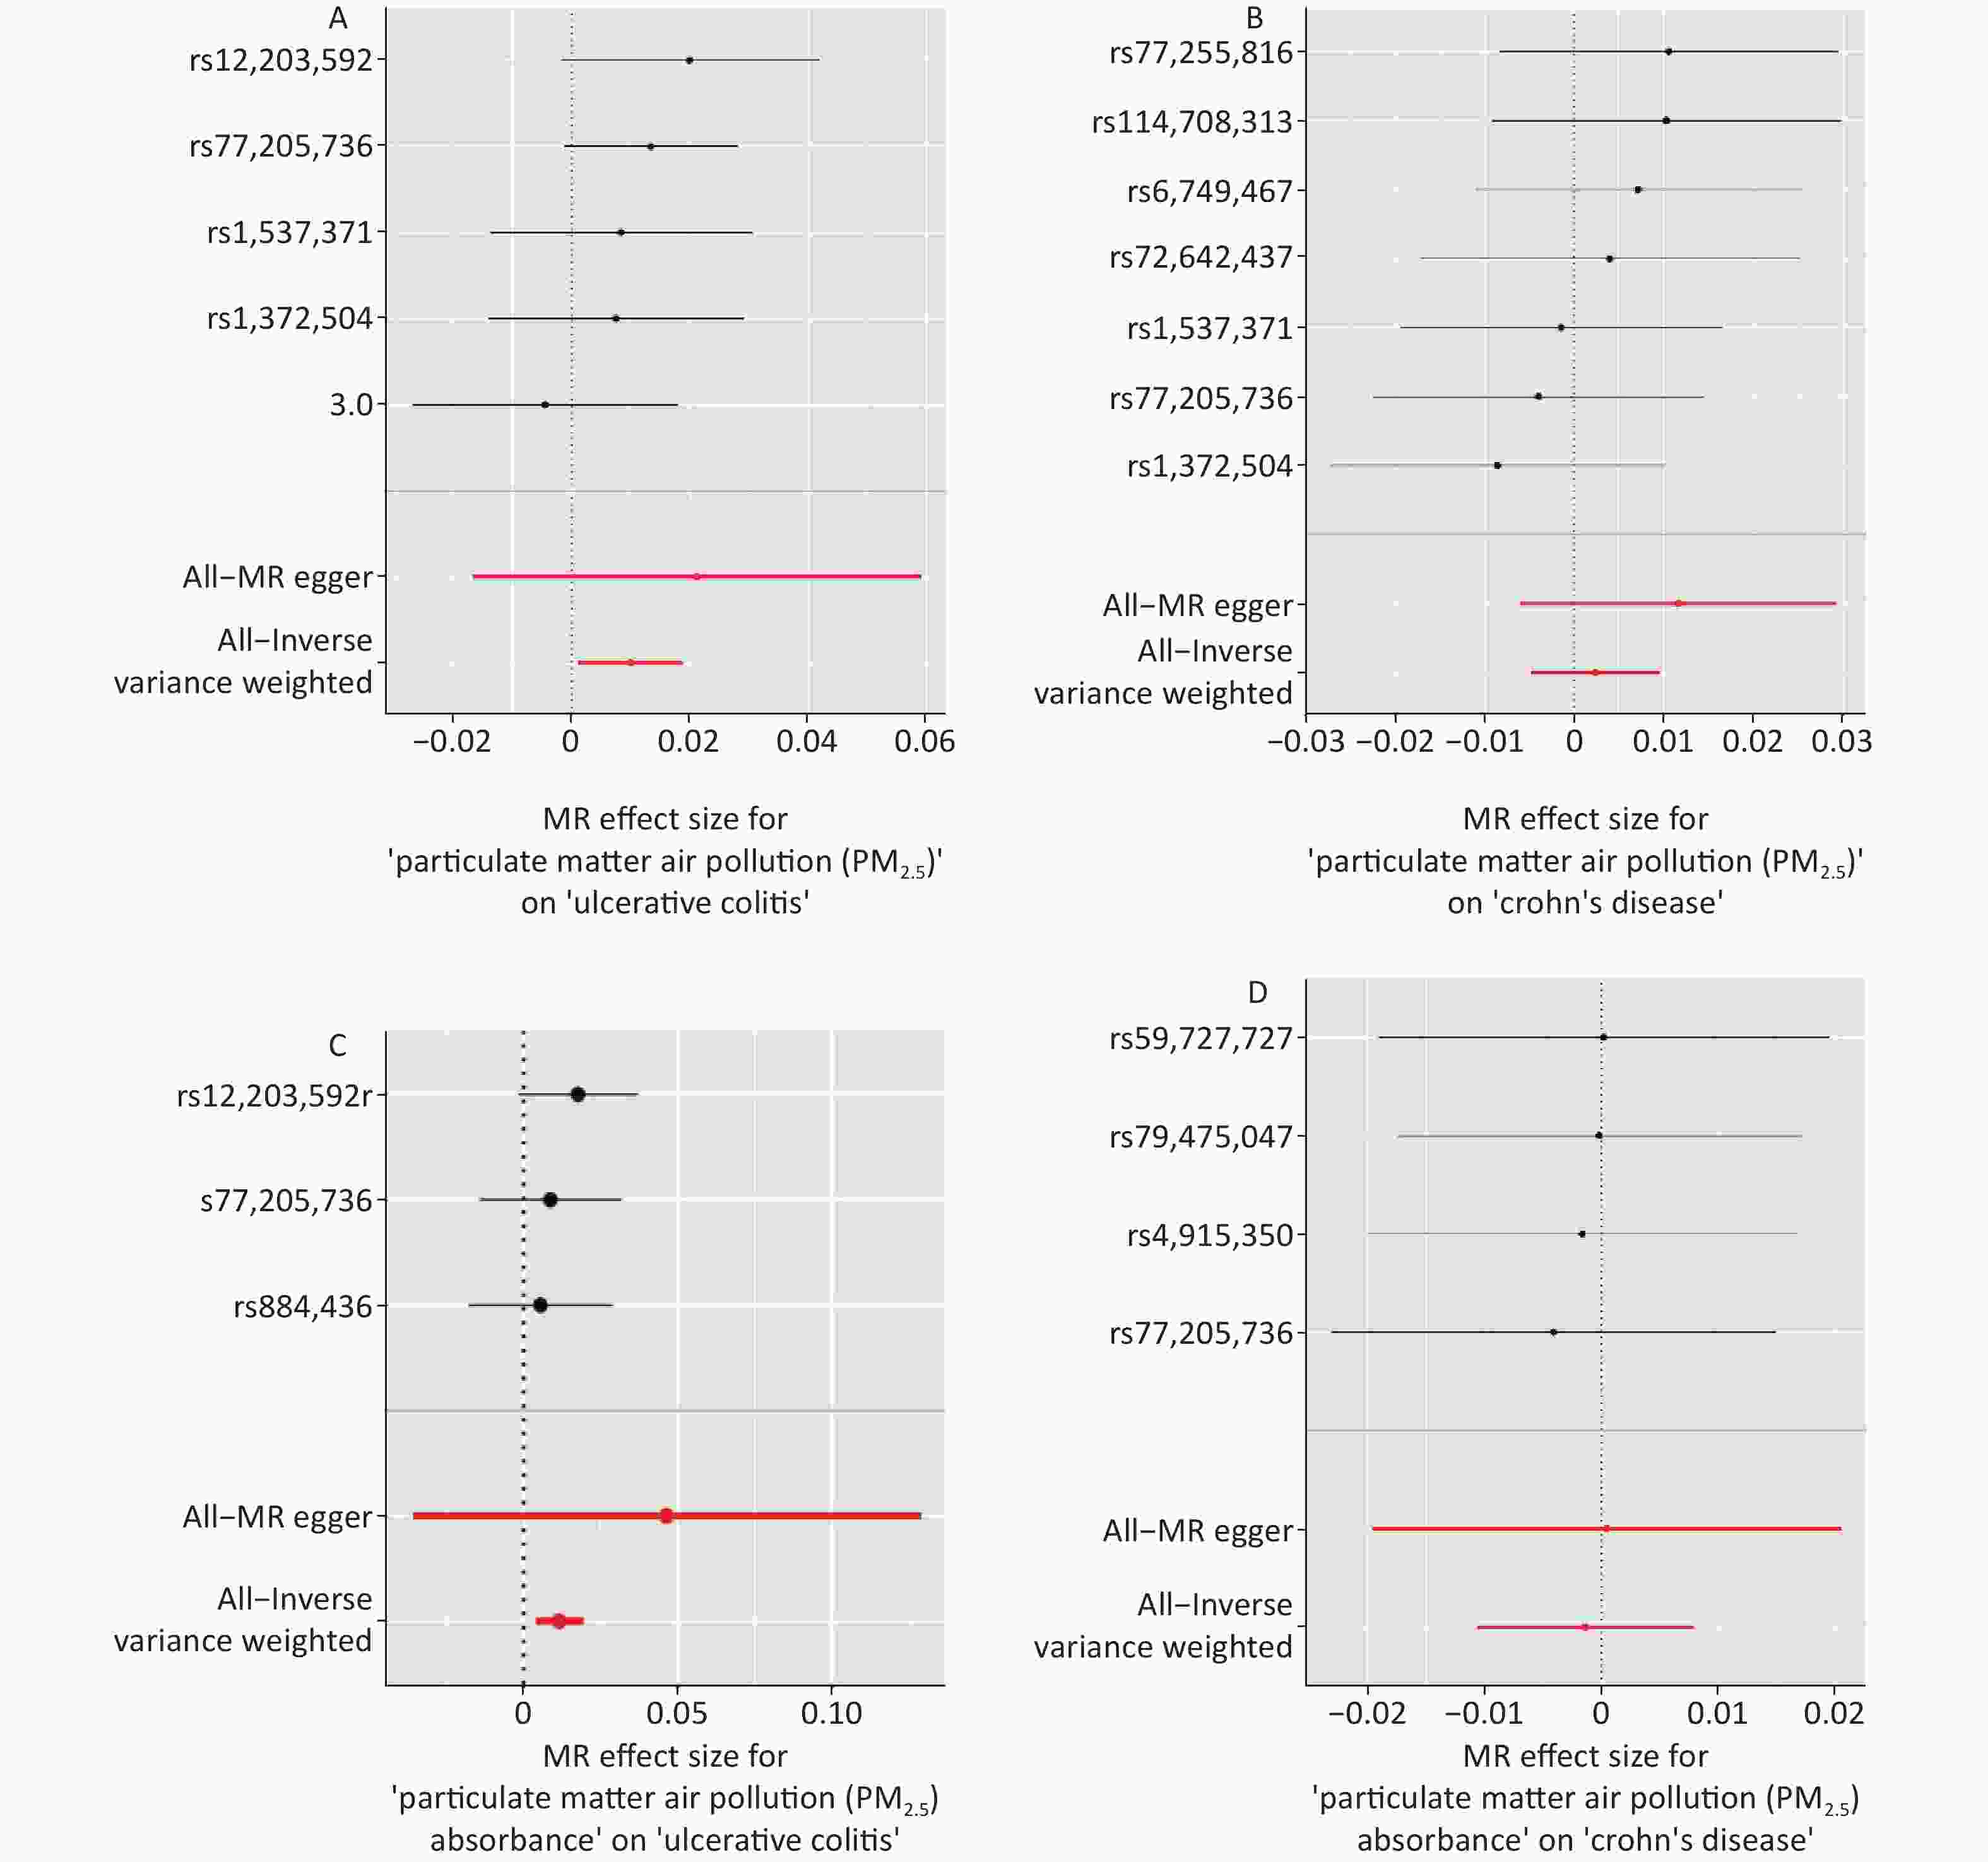
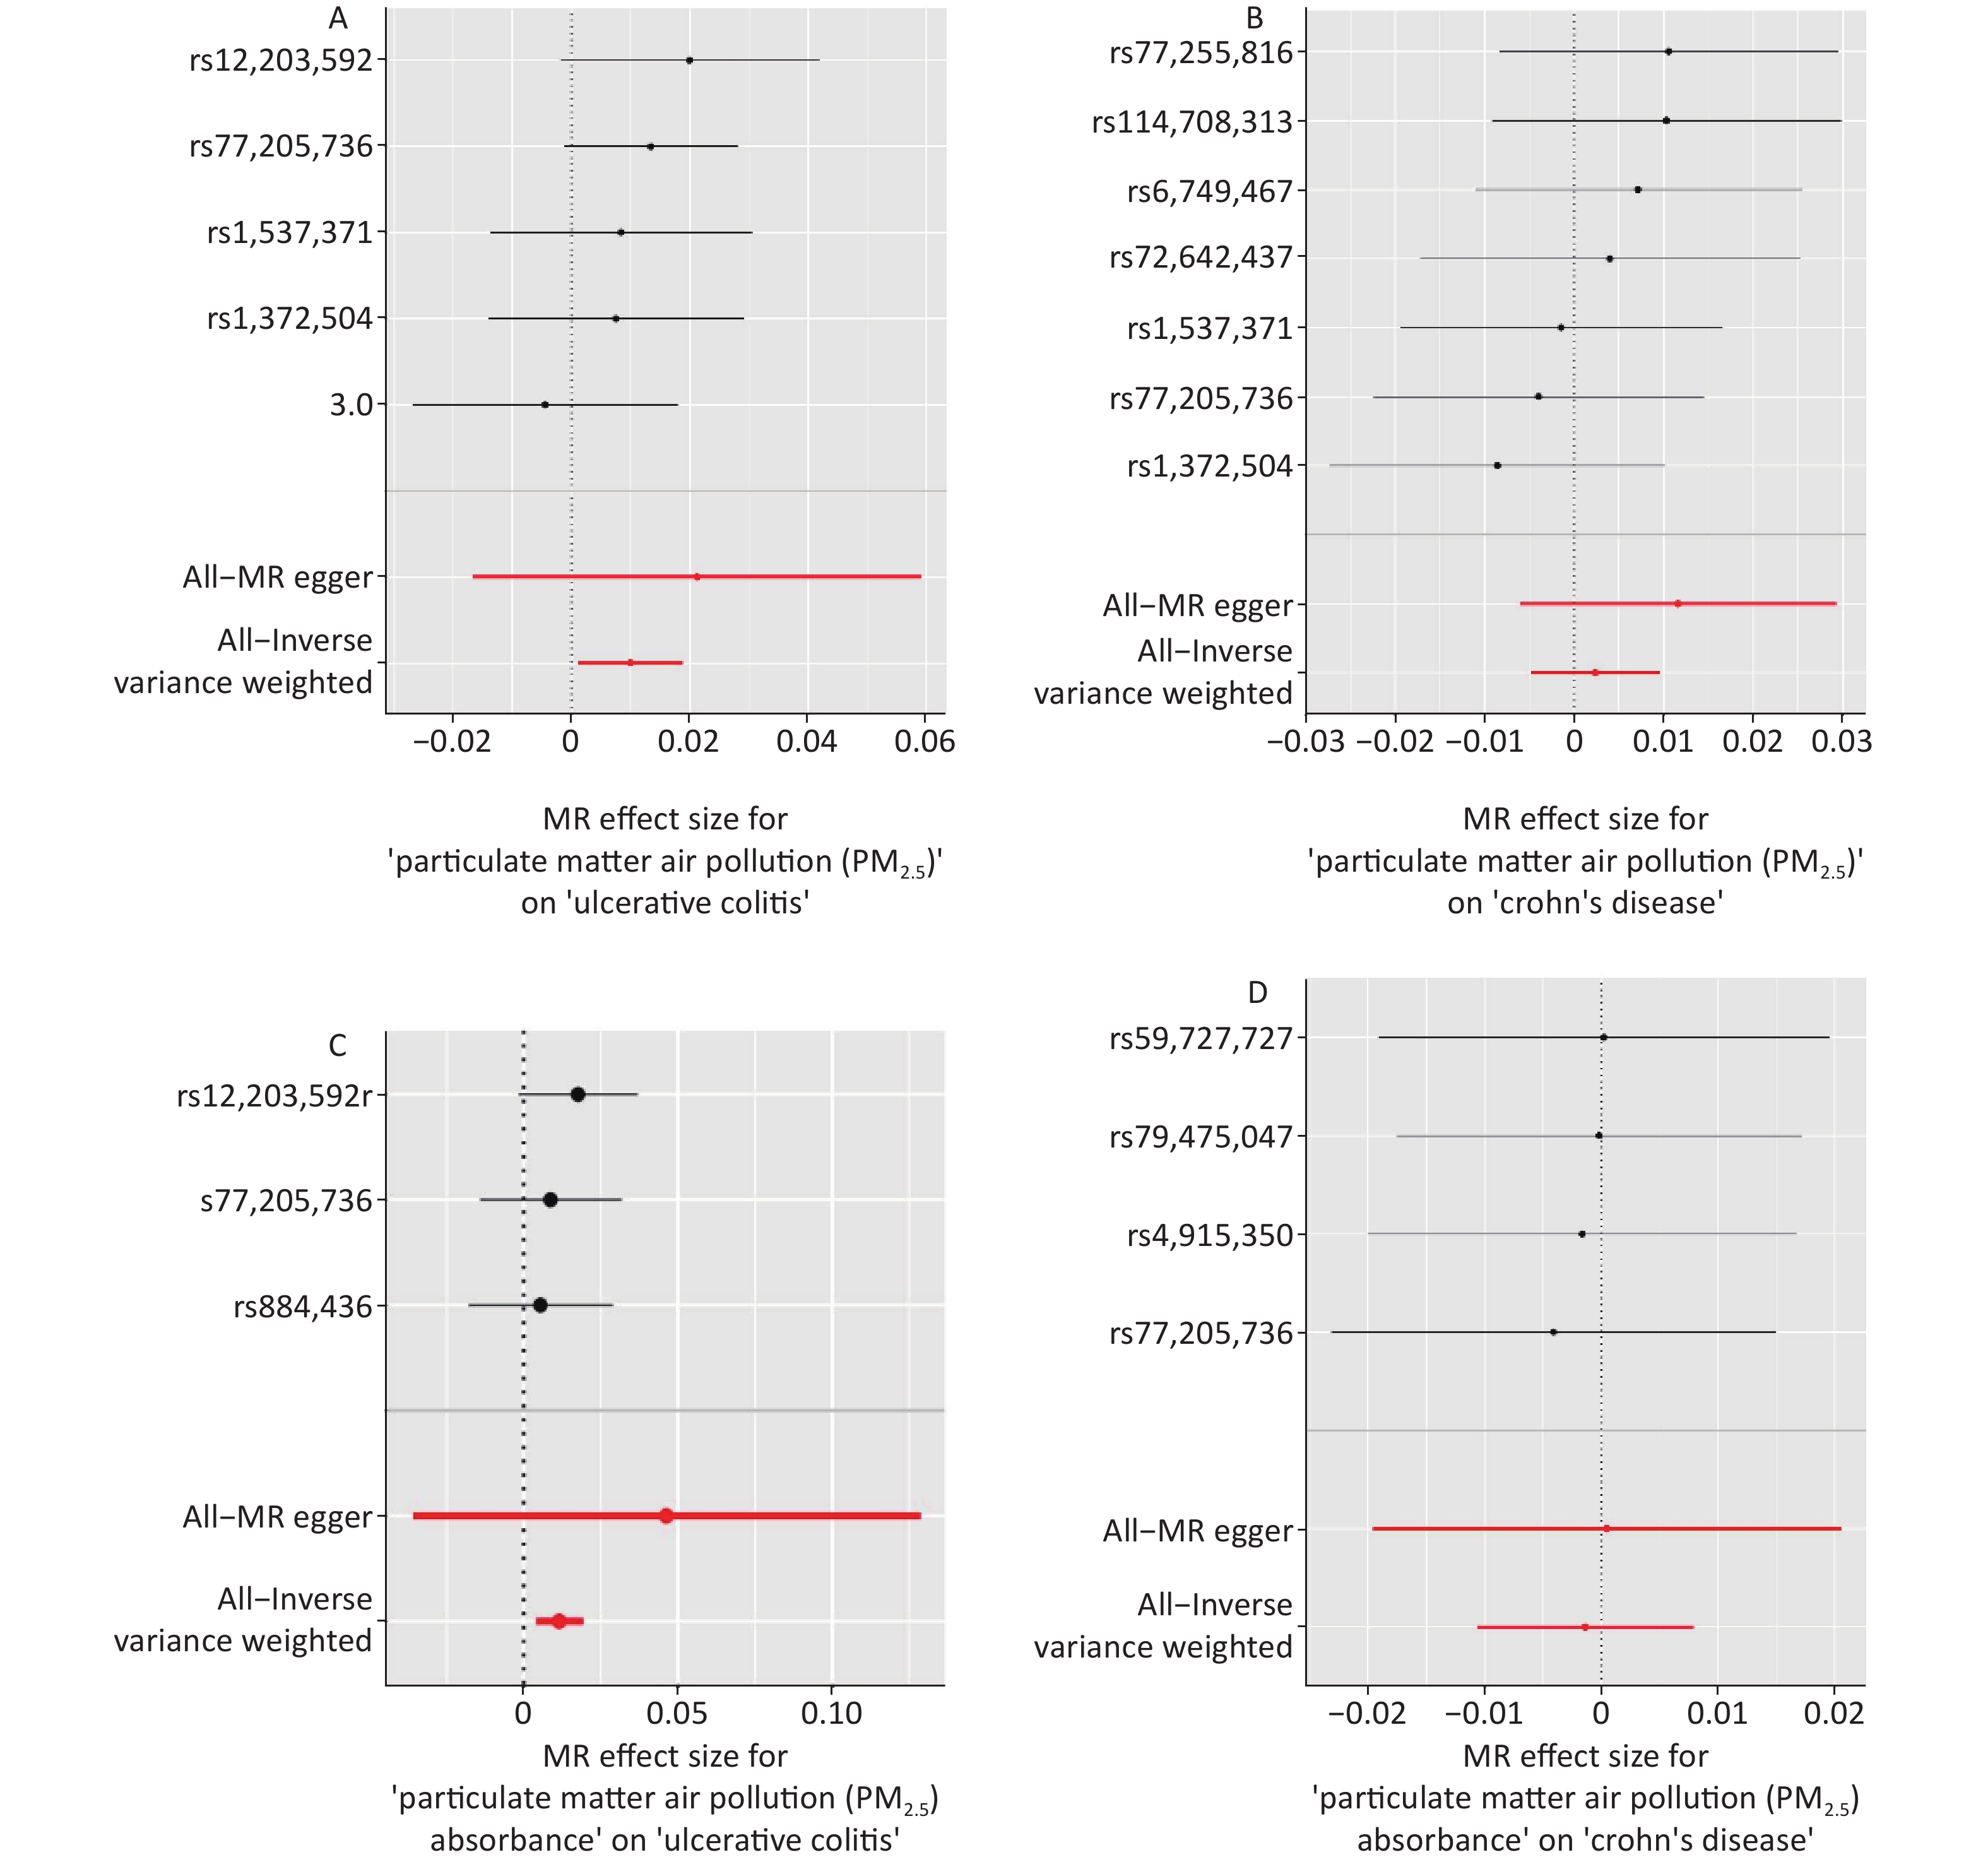
Figure 3. Forest plots were used to visualize the causal effect between PM2.5 and UC (Panel A), PM2.5 and CD (Panel B), PM2.5 absorbance and UC (Panel C), PM2.5 absorbance and CD (Panel D). The y-axis shows the analyses for the effect of each SNP on UC and CD, The red points indicate the IVW and MR–Egger estimates using all SNPs. MR, Mendelian randomization; PM2.5, particulate matter 2.5; SNP, single nucleotide polymorphism; UC, ulcerative colitis; CD, Crohn’s disease.
-
We also found a significant genetic correlation between PM2.5 absorbance and UC (OR = 1.012; 95% CI = 1.004–1.019, P = 0.002) in the IVW test of PM2.5 absorbance to UC. The ORs of the five models performed in the MR analyses are all consistently positive (Table 1, Supplementary Table S2, Figure 2, and Figure 3). Simultaneously, we found no evidence that the genetic level of PM2.5 absorbance was significantly associated with CD (OR = 0.998; 95% CI = 0.989–1.008, P = 0.769) (Table 1, Supplementary Table S2, Figure 2, and Figure 3). No heterogeneity was detected in Cochran’s Q tests (P = 0.732 and P = 0.611) (Supplementary Table S4). We also eliminated the probability that the MR-Egger regression test had P-values less than 0.05 with the exclusion of potential pleiotropy (P = 0.396 and P = 0.556) (Supplementary Table S3). Leave-one-out plots predicted that no single IV could independently drive the results of MR. All evidentiary materials ensured the reliability of the results (Supplementary Table S5 and Supplementary Figure S1). We eliminated the possibility that the MR-Egger intercept had P < 0.05 with the exclusion of possible horizontal pleiotropy.
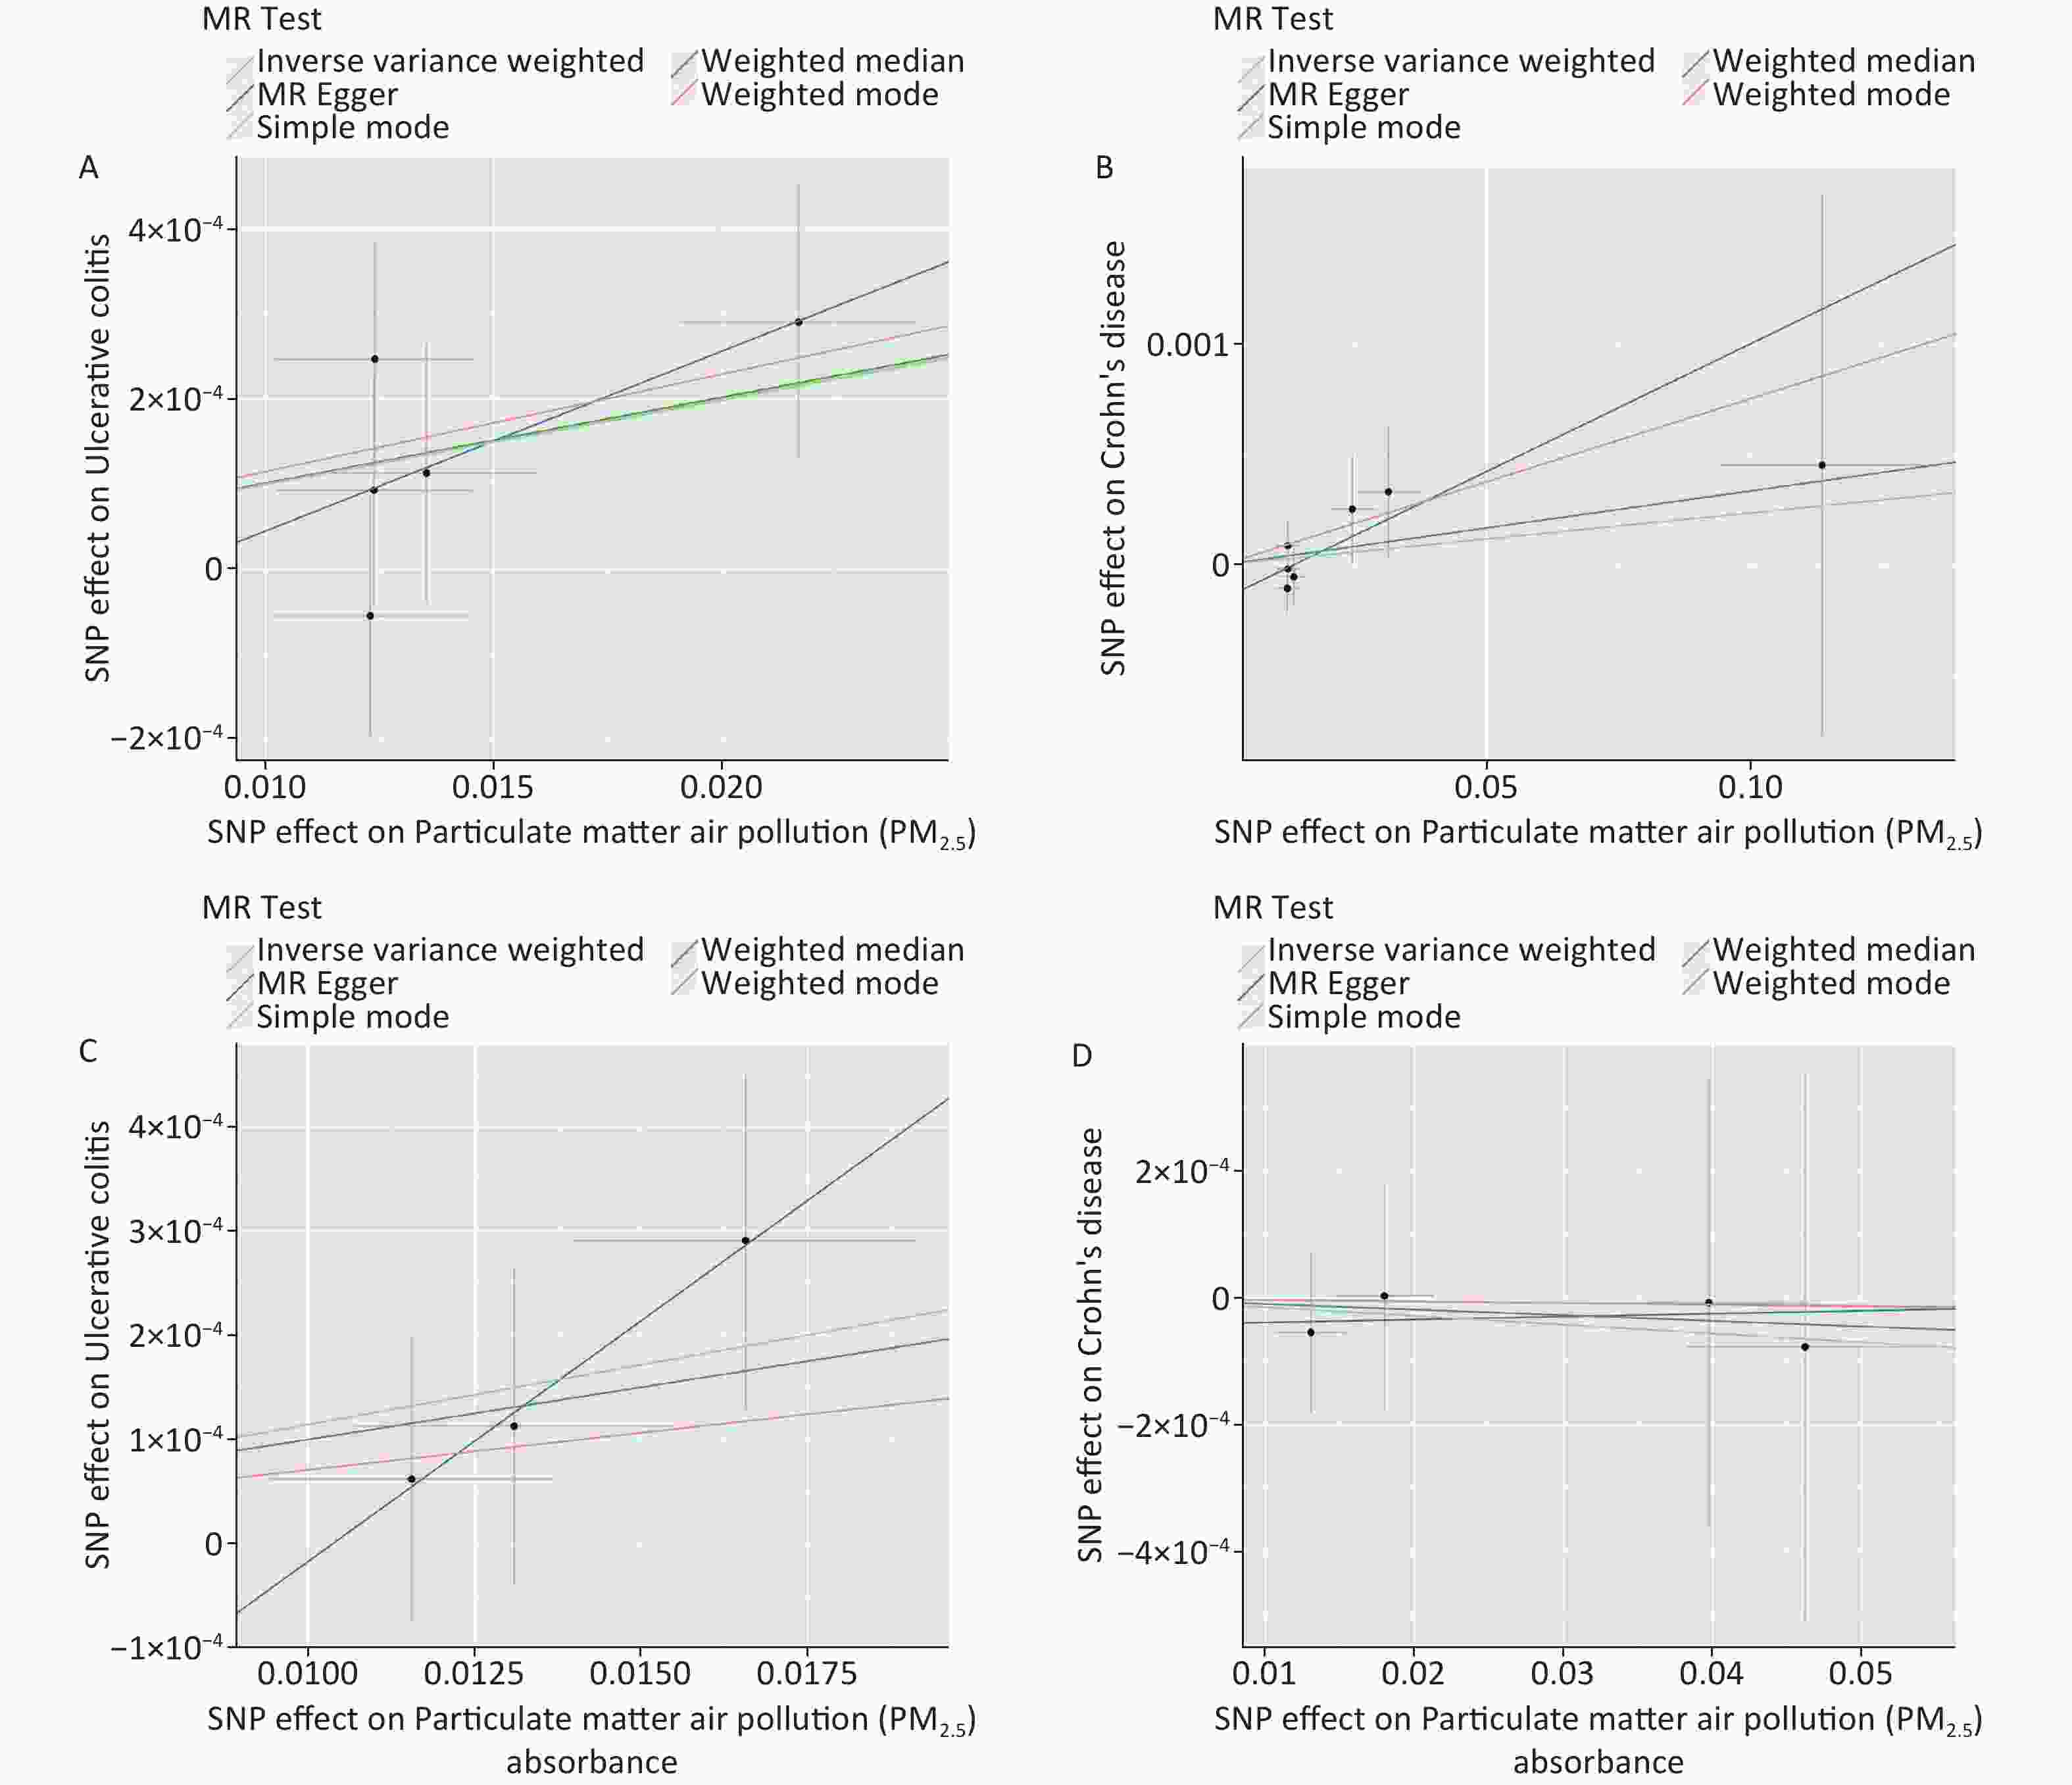
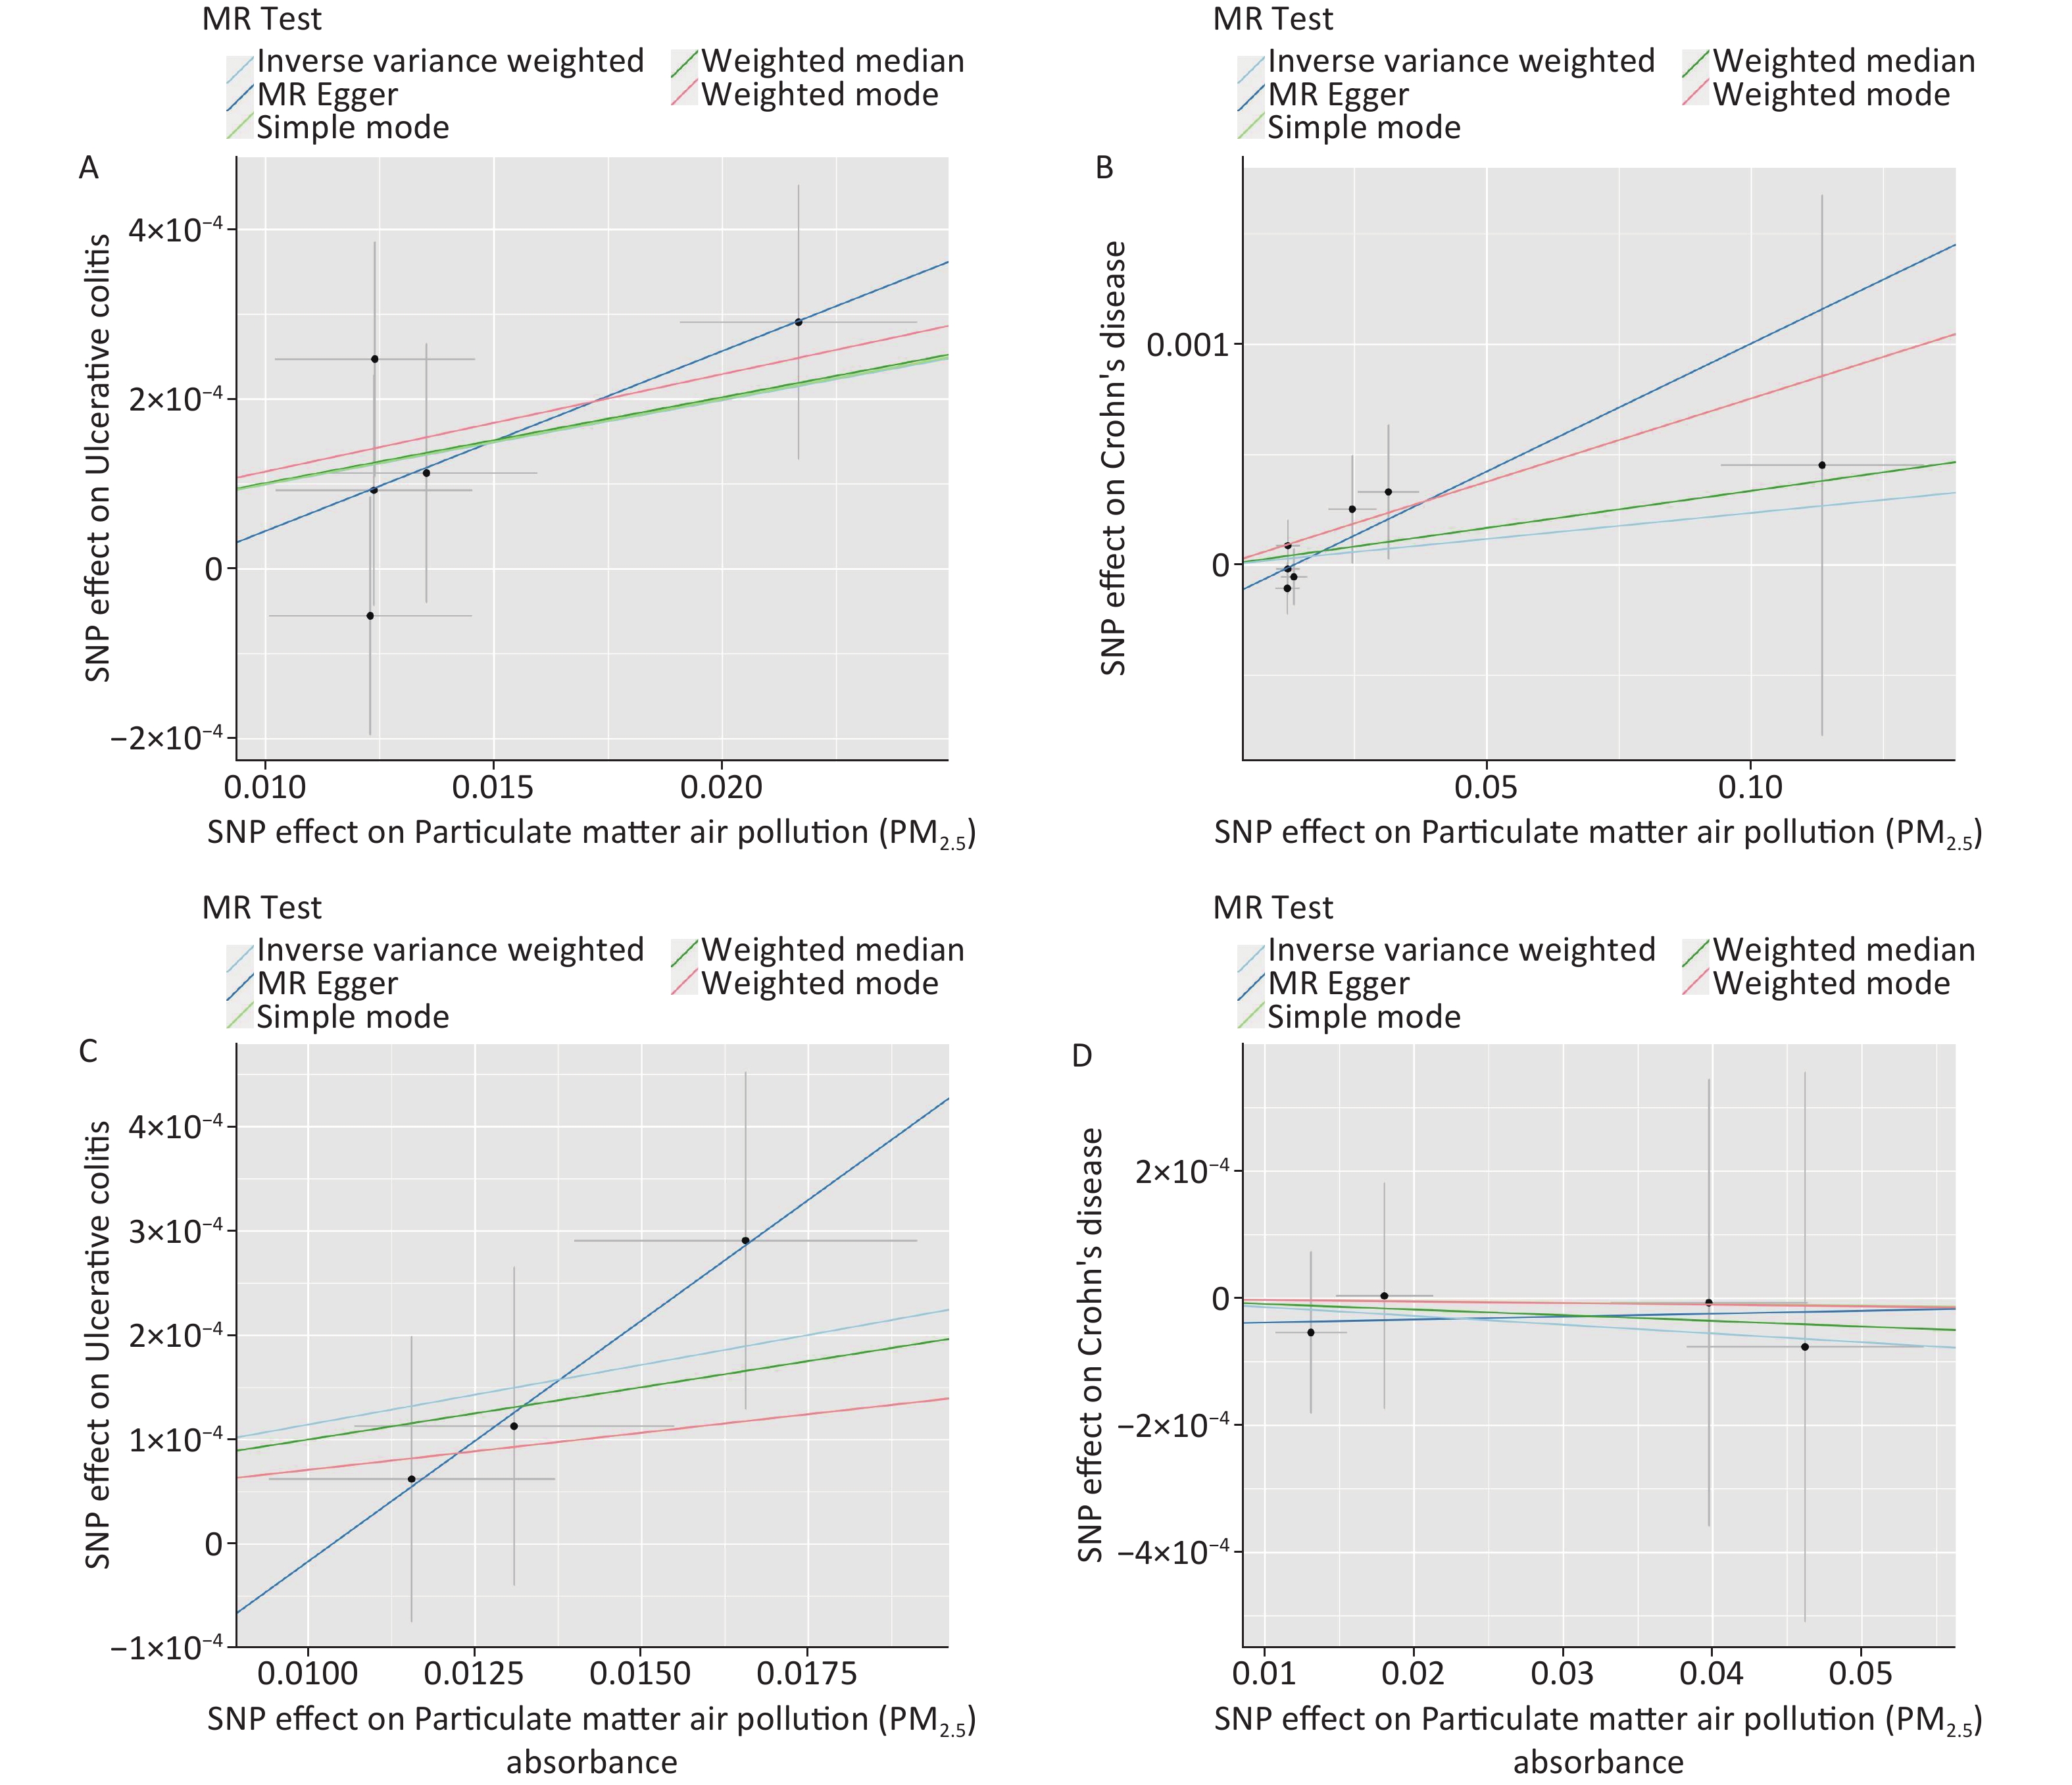
Figure 2. Scatter plots were used to visualize the causal effect between PM2.5 and UC (Panel A), PM2.5 and CD (Panel B), PM2.5 absorbance and UC (Panel C), PM2.5 absorbance and CD (Panel D). The x-axis shows the SNP effect and SE on PM2.5 and its absorbance. The y-axis shows the SNP effect and SE on UC and CD. The regression lines for the inverse-variance weighted (IVW) method, the MR–Egger regression method, the weighted median, the weighted mode, and the simple mode are shown. The slope of each straight line indicates the magnitude of the causal association. PM2.5, particulate matter 2.5; SNP, single nucleotide polymorphism; SE, standard error; UC, ulcerative colitis; CD, Crohn’s disease.
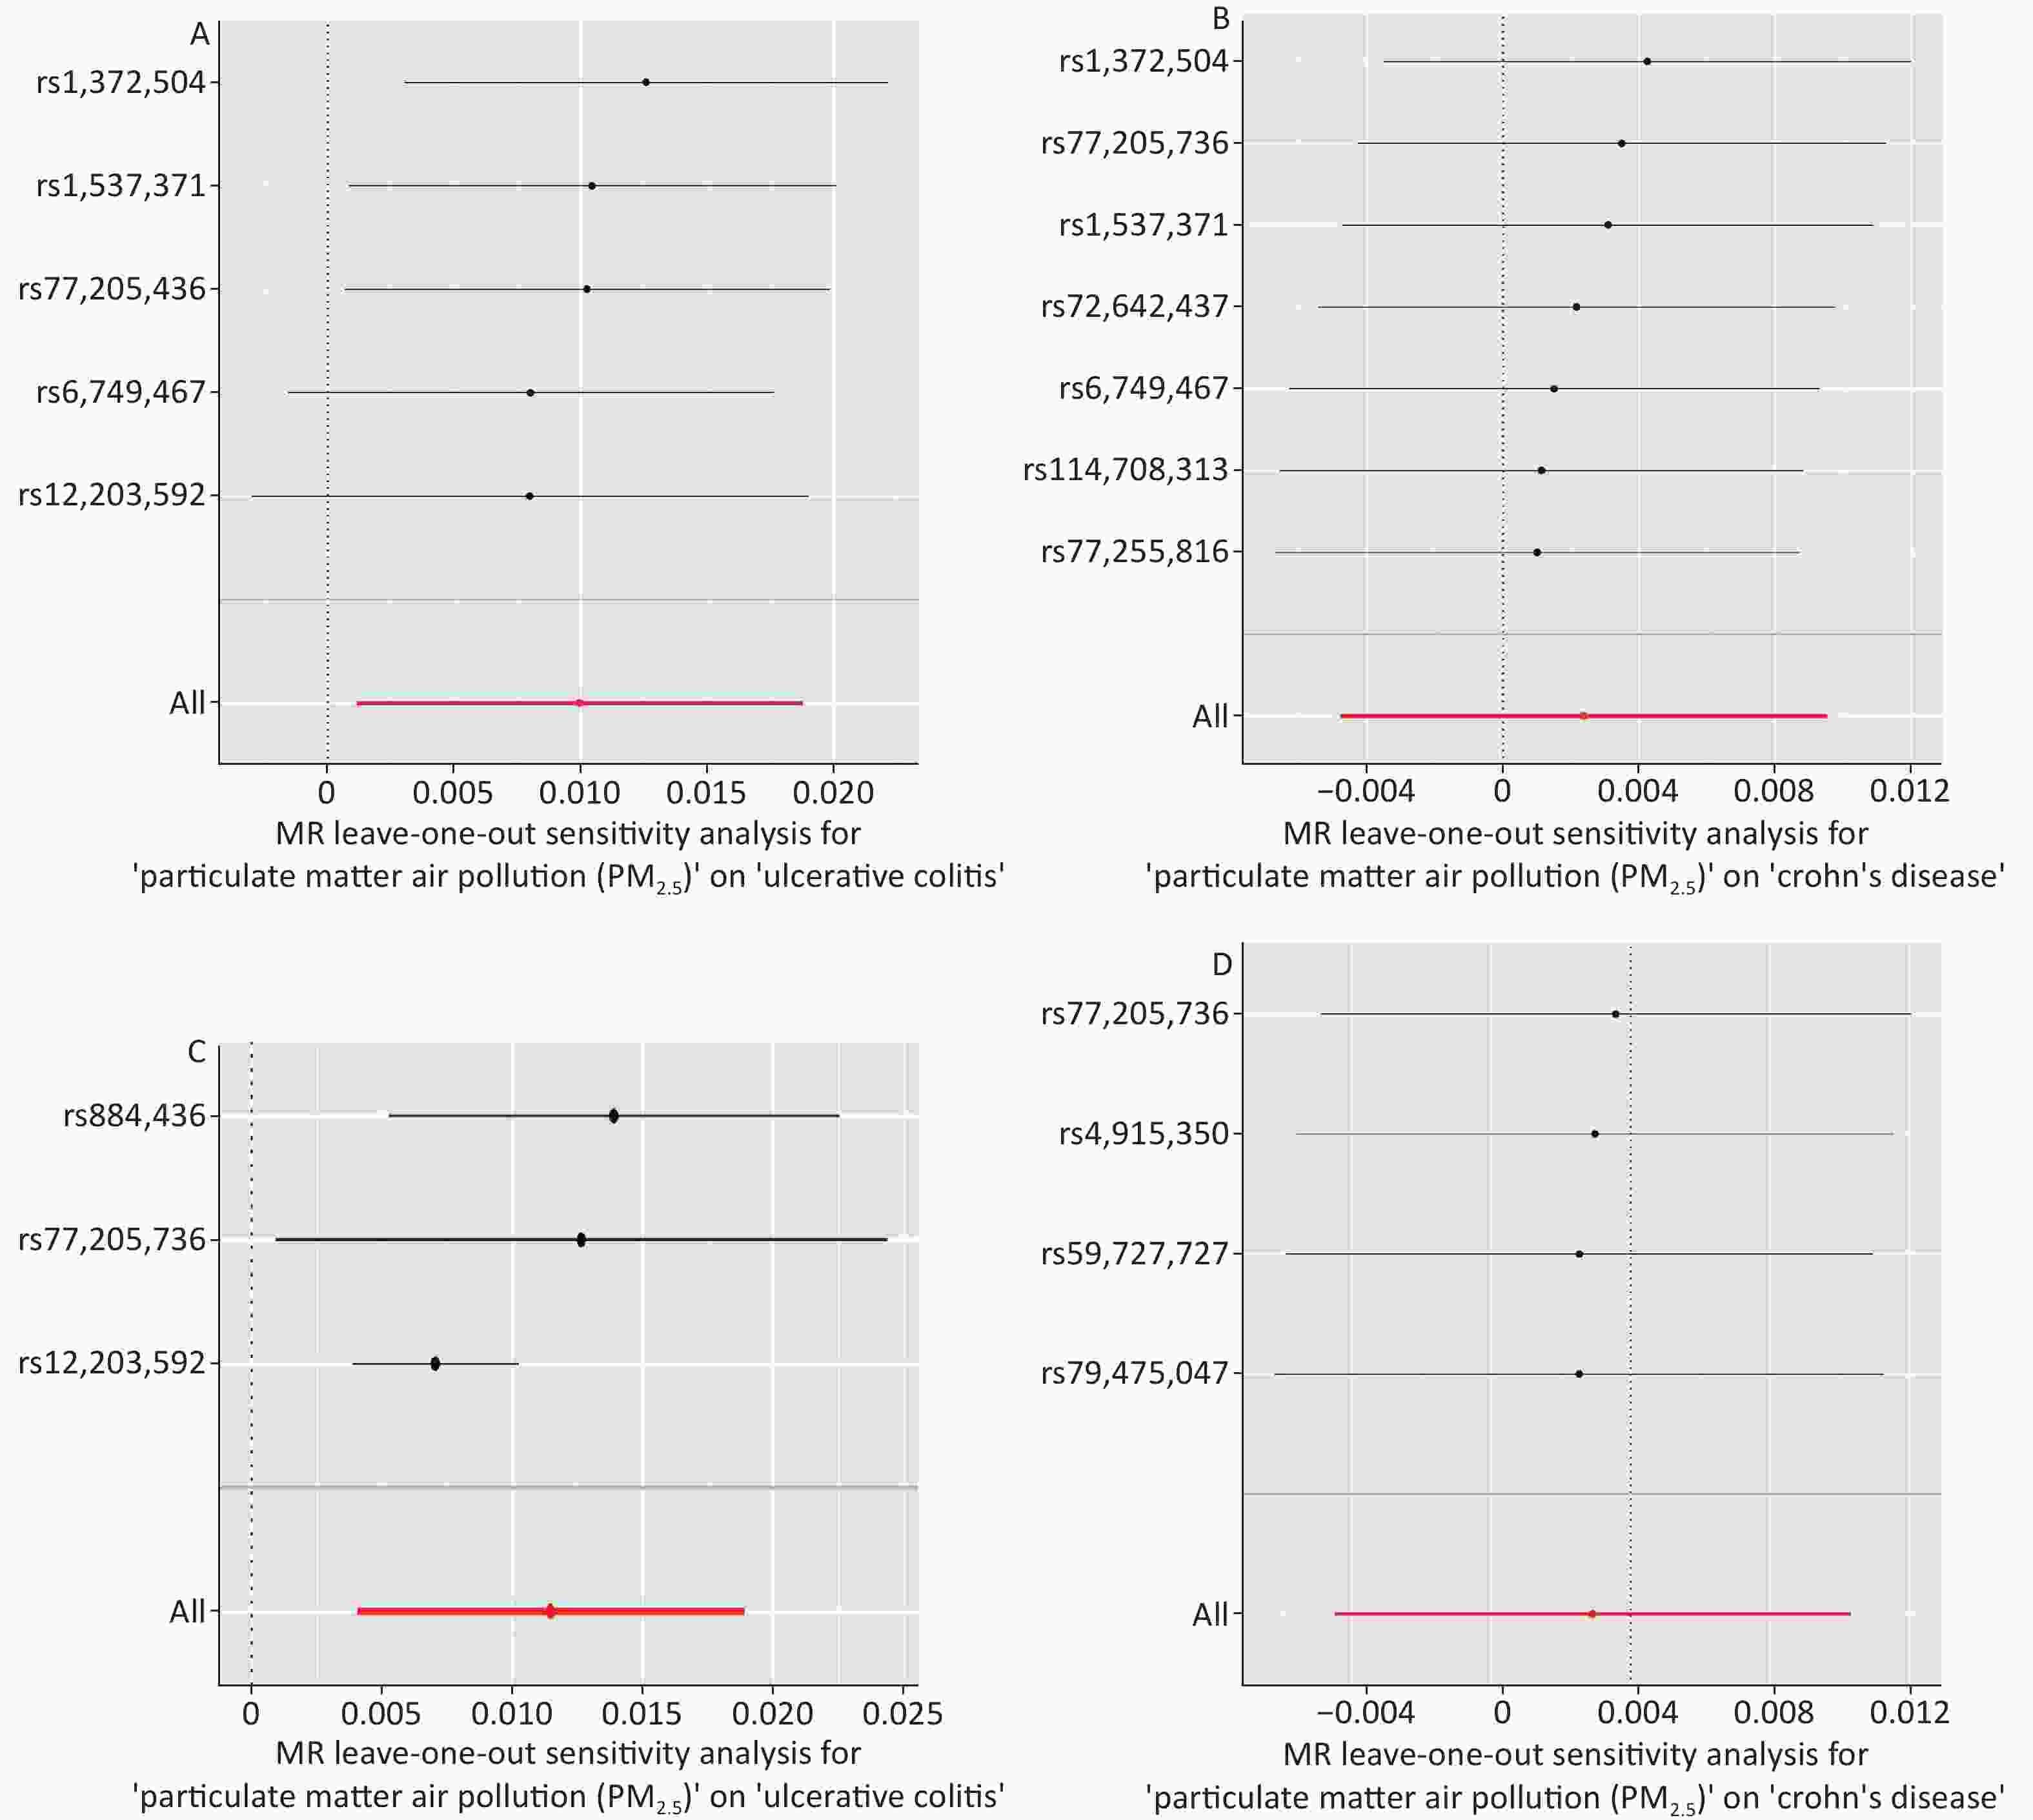
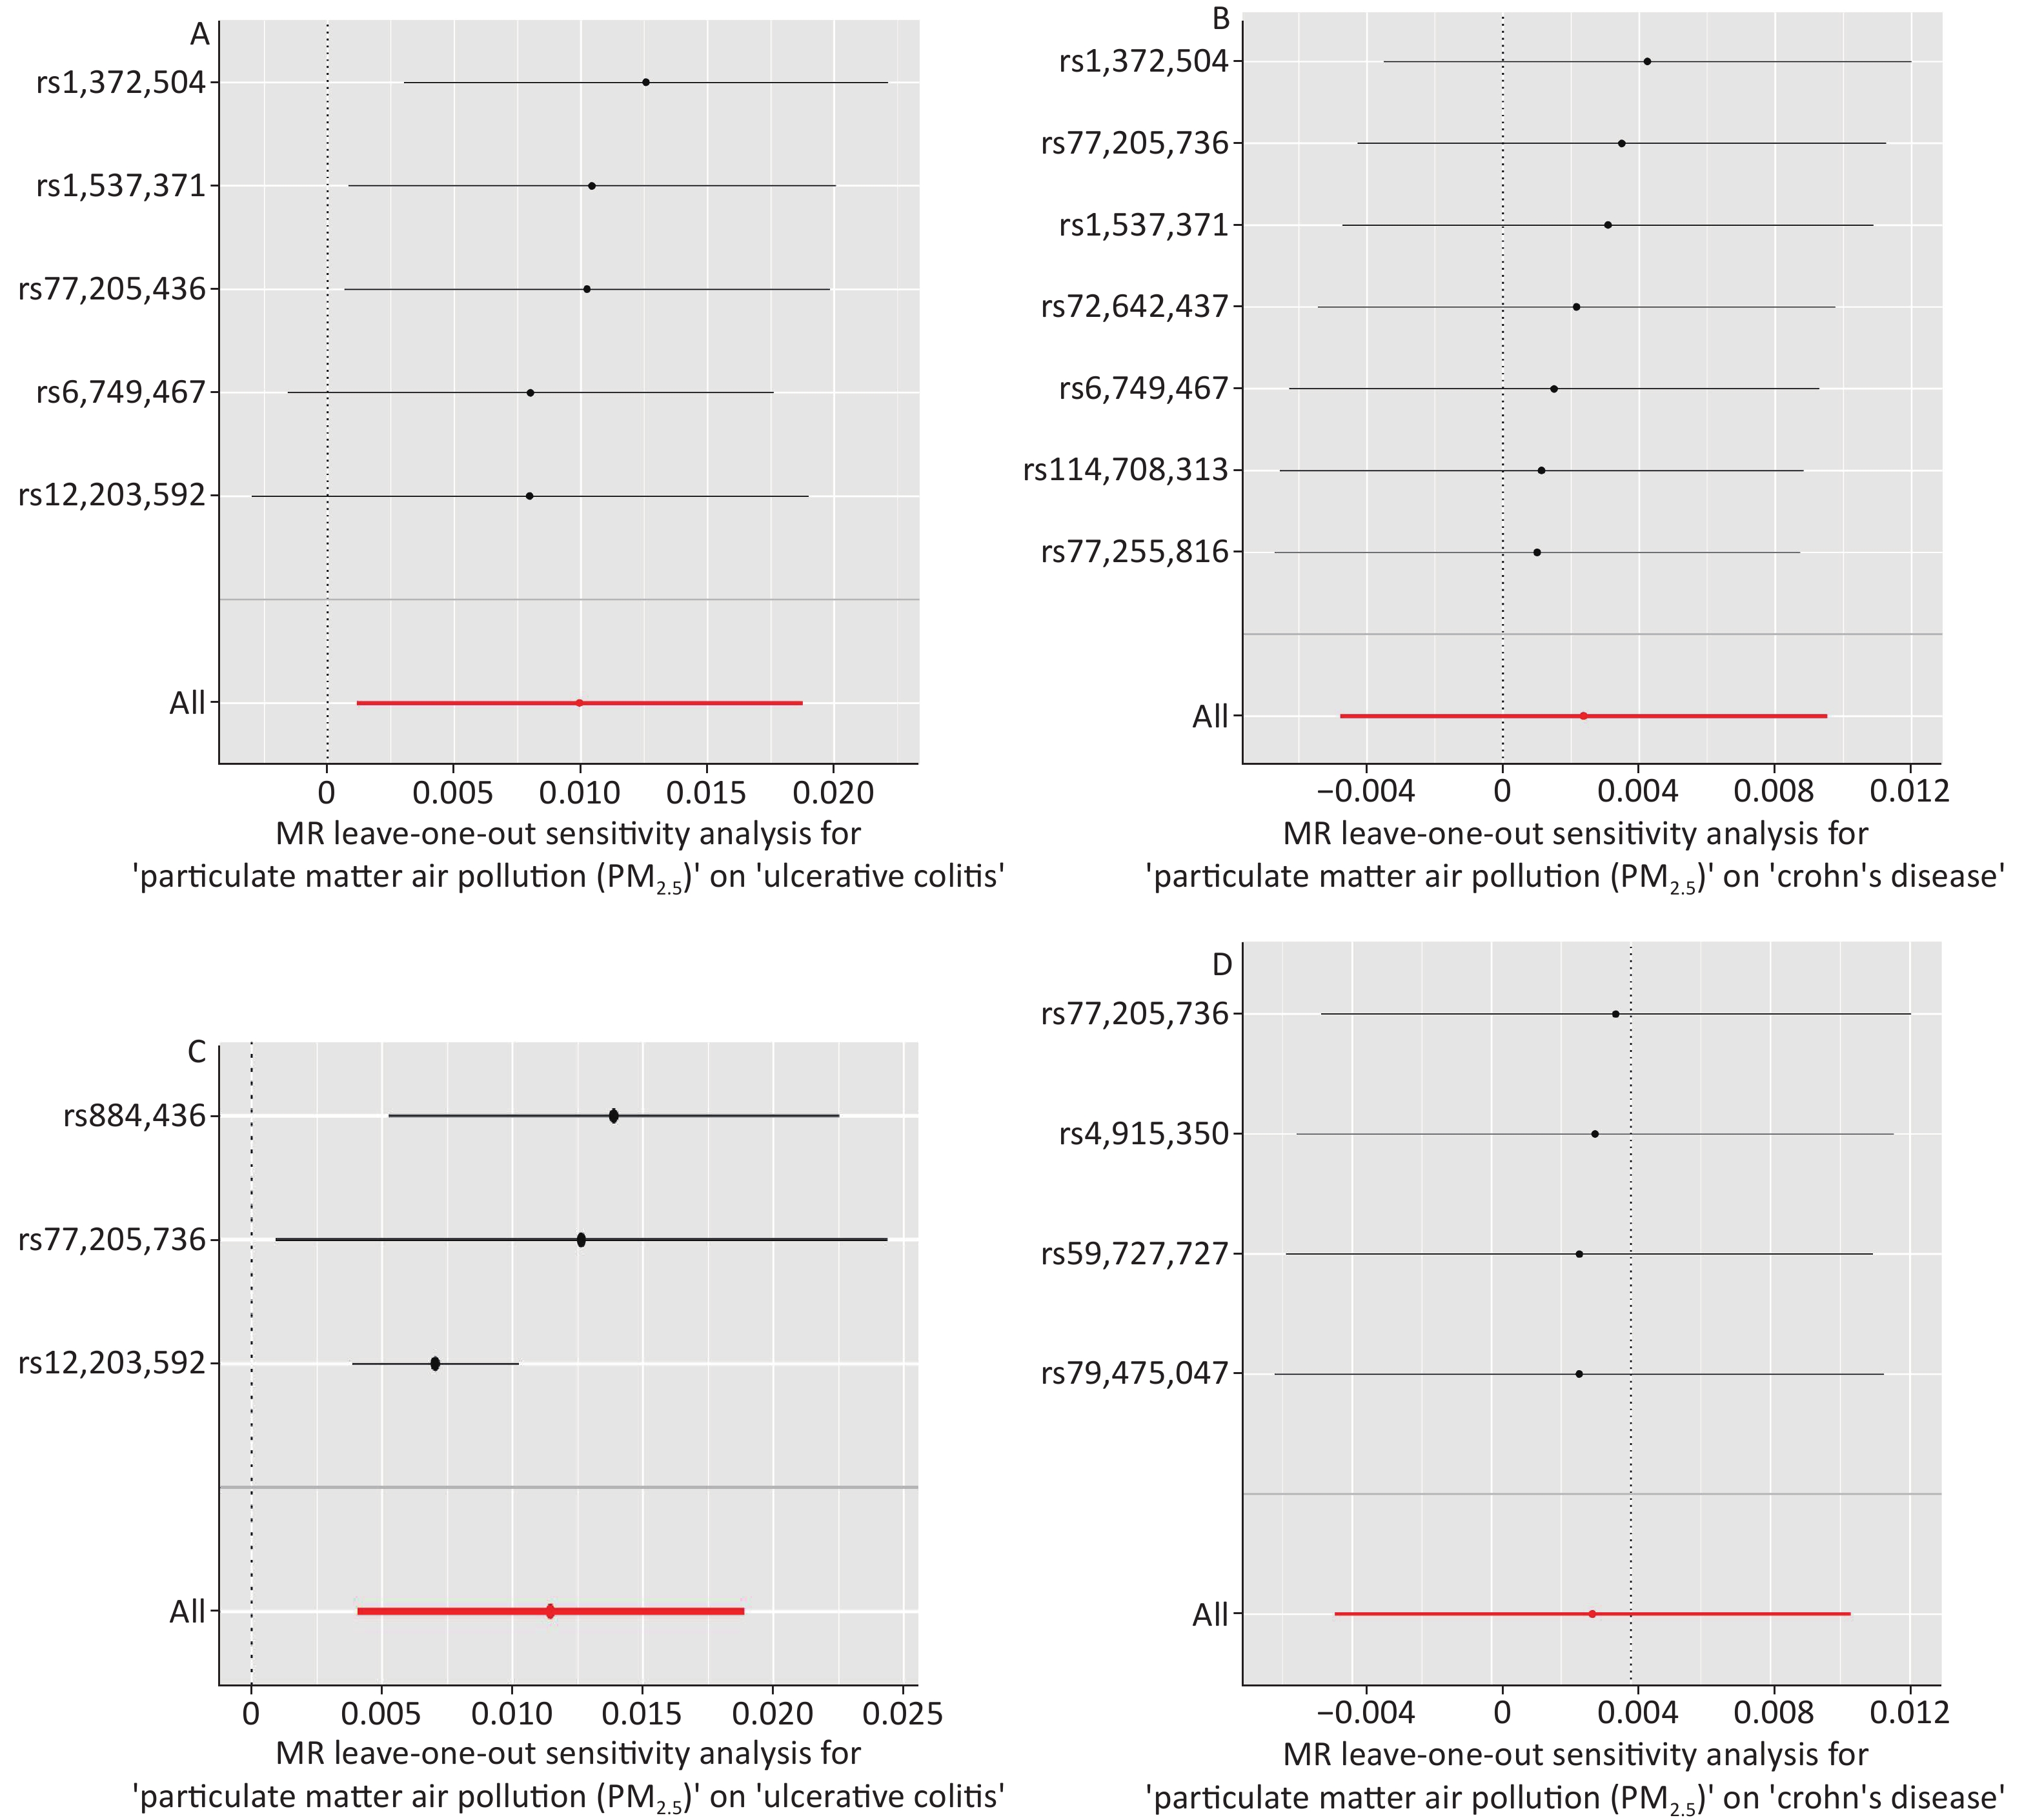
Figure S1. Forest plots of the “leave-one-out” sensitivity analyses to demonstrate the impact of individual SNPs on the results. The x-axis shows MR “leave-one-out” sensitivity analyses for PM2.5 on UC (Panel A), PM2.5 on CD (Panel B), PM2.5 absorbance on UC (Panel C), PM2.5 absorbance on CD (Panel D). The y-axis shows the analyses for the effect of “leave-one-out” of SNPs on UC and CD. The red points indicate the IVW estimates using all SNPs. MR, Mendelian randomization; PM2.5, particulate matter 2.5; SNP, single nucleotide polymorphism; UC, ulcerative colitis; CD, Crohn’s disease.
-
The relationship between PM2.5 and IBD has been debated. For example, some studies indicated that PM2.5 exposure or inhalation was associated with an increased risk of IBD development and IBD-related hospitalizations[13,14]. It was also found that a 1-log increase in the density of total criteria pollutant emission was associated with a 40% increase in the rate of UC and CD hospitalizations[14]. In a Chinese study using the distributed lag nonlinear model, every 10 mg/m3 increase in PM2.5 was correlated with a higher chance of developing IBD (relative risk = 1.037, 95% CI = 1.005–1.070)[34]. Similar observations were reported from other regions[35]. Other studies did not find an association between PM2.5 and IBD[6]. However, these conclusions may not be reliable because of the inherent drawbacks of observational study designs.
In order to address these issues, the present study used MR analysis to investigate genuine causal connections. The findings offer conclusive evidence indicating a causative link between PM2.5, PM2.5 absorbance, and an elevated risk of UC. The results of the present study provide new evidence for this epidemiological association and the clinical practice of disease prevention.
There are several possible biological mechanisms by which PM2.5 and PM2.5 absorbance increase the risk of UC development. One is the direct effects of PM2.5 on intestinal epithelial cells. We speculated that PM2.5 would exhibit a similar cytotoxic effect in intestinal epithelial cells since airborne pollutants could induce airway epithelial cell injuries and cause airway cellular apoptosis[5]. Furthermore, two previous studies using animal models also suggested that PM2.5 administration might trigger systemic inflammatory response and oxidative stress[36,37]. In this process, oxygen radicals, inflammatory factors, and cytokines would be released in serum and tissue, further inducing chronic organic injury and increasing the risk of autoimmune conditions (e.g., neuroinflammation, type 1 diabetes, asthma, and systemic inflammatory cardiovascular diseases)[38-42]. Given that IBD is a chronic condition involving immune-mediated and autoimmune disorders[43], future studies need to determine whether PM2.5 may have an immunomodulatory effect on the intestinal mucosa. Another possible mechanism that might mediate the effects of PM2.5 on the gut is its direct effects on intestinal microecology. PM2.5 exposure can decrease the abundance and diversity of intestinal microbiota, thus leading to intestinal flora dysfunction[44-46]. Moreover, it was presumed that PM2.5 absorbance can lead to oxidative stress, thereby leading to IBD onset. A large cohort study showed that PM2.5 absorbance was possibly related to increased levels of gamma-glutamyl transferase (GGT)[47], which is an indicator of liver damage related to oxidative stress, and a hospital-based survey proved that patients with IBD had abnormally increased GGT levels[48]. Notably, apart from IBD and other respiratory diseases, air pollution can lead to other disorders in our body. With regard to other gastrointestinal diseases, air pollutants can trigger the onset of and exacerbate gastrointestinal inflammation[45], colorectal cancer[49], and liver cancer[8]. Some studies have investigated the potential pathophysiological mechanisms behind the effects of air pollutants. For example, the inhalation of airborne particles can modify gut microbiota, specifically affecting Firmicutes, Acidobacteria, and Proteobacteria, and provoke acute and chronic inflammatory reactions within the intestinal tract[50]. Furthermore, PM can initiate oxidative-stress-induced cell death in the gastrointestinal epithelium, compromise the integrity of tight junction proteins, and play a role in exacerbating gastrointestinal inflammatory disorders in vitro and in vivo[51]. PM even has the potential to precipitate systemic metabolic alterations by interfering with glycerophospholipid metabolism and linoleic acid pathways[50]. From this point of view, air pollution may cause neurotoxicity, including autism spectrum disorder, Alzheimer’s disease, and Parkinson’s disease[52]. Moreover, positive relationships were found between the incidence of chronic kidney disease and PM2.5[53]. According to a combined cross-sectional and retrospective cohort study performed on 8,689 children in China, exposure to outdoor air pollutants, including carbon monoxide, ozone, and PM2.5, in early life was associated with childhood parasitic infections[54].
There are also some hypotheses that explain the link between genetic variants and our environmental exposures of interest. The interaction between genetic variations and environmental exposures, known as gene-environment interactions, has been reported to play a critical role in complex human traits and diseases. Specifically, the risk genotype intensifies the adverse impact of environmental risk factors; conversely, exposure to such risk factors can amplify the influence of the risk genotype. Furthermore, environmental exposure and genetic predisposition independently contribute to disease risk and synergistically increase the risk when combined[55,56]. Epigenetic theory can also explain the relationship between air pollutants and genetic variants. According to multiple experimental studies, PM2.5 exposure is significantly associated with the methylation of various genes, including those related to aging[57], and the circadian rhythm[58]. Thus, extensive research is needed to obtain a clearer understanding of the physiological mechanisms.
Regarding the relationship between PM2.5 and CD, only a limited number of epidemiological studies have been screened, and their findings are inconsistent. Specifically, a Chinese study indicated that every 10 mg/m3 increase in PM2.5 was correlated with a higher chance of IBD development and that the effects on CD are more pronounced than those on UC[34]. However, a European study using multivariable Cox proportional hazards models reported that long-term exposure to airborne pollutants, including PM2.5, was not correlated with the risk of CD development[59]. Our study avoided the confounding factors of traditional epidemiological research, addressing the disputes of previous studies. However, more extensive studies are needed to provide more evidence regarding the associations of PM2.5 and PM2.5 absorbance with the risk of IBD.
Our MR study has the following key advantages. First, to the best of our knowledge, the present study is the first to analyze the causal relationships between PM2.5, PM2.5 absorbance, and IBD using two-sample MR. This resolves the issues of previous epidemiologic studies, compensates for the deficiencies of traditional observational studies, and provides new demonstrations for evaluating the health hazards of environmental pollution. Second, our study profits from large-scale PM2.5, PM2.5 absorbance GWAS (n = 423,796 individuals from Europe), and IBD GWAS (CD: n = 337,199 individuals from Europe; UC: n = 463,010 individuals from Europe) datasets, improving the reliability of analyses. Additionally, the potential deviation induced by population stratification has been diminished as the participants are of European descent. Moreover, we used multiple independent SNPs as instruments to eliminate the effect of LD on possible links. Eventually, we performed various methods for MR analyses and conducted comprehensive pleiotropy analyses and heterogeneity tests to assess the MR results. The absence of horizontal heterogeneity and pleiotropy indicated that the impact of nonheritable environmental confounders was minimized and ensured that the stability and credibility of our results are superior to other those of other traditional epidemiological methods.
In the present study, we applied MR analyses to evaluate the potential causal relationships between PM2.5, PM2.5 absorbance, and IBD risk. In individuals of European ancestry, we demonstrated that PM2.5 was associated with a 1.0% higher risk of UC and that PM2.5 absorbance was linked with a 1.2% higher risk of UC from a genetic perspective. Notably, considering that the impact of genetic variants occurs at birth, MR estimates the long-standing influence of risk factors on outcomes across life, rather than at a single temporal juncture. Thus, unlike traditional observational research, which captures exposures at specific time points, the primary focus of MR is to evaluate the causal hypothesis rather than the precise quantification of the effect size (point estimates and intervals)[60]. Additionally, no significant association was observed between PM2.5 exposure, PM2.5 absorbance, and CD. Our research pioneers the application of MR to establish associations between PM2.5, PM2.5 absorbance, and IBD at the genetic level, offering new perspectives for the prevention and management of gastrointestinal diseases. The results may have implications for formulating public health responses and disease prevention strategies (e.g., enforcing more stringent emission regulations, advocating for eco-friendly transportation, enhancing public knowledge of air quality, etc.). Consequently, these measures may help with controlling the incidence of UC.
Despite the advantages, this study also has some limitations. First, the GWAS datasets included in the MR analyses were based on European ancestry. Thus, further studies on individuals from other countries are needed to improve the generalizability of our results. Second, because of the limited information provided by the original analyses and datasets, we could hardly pinpoint the localization of European participants nor obtain demographic information (e.g., age, gender, and socioeconomic status) about them. The composition of PM2.5 pollutants, particularly concerning the nature of airborne PM, could exhibit considerable diversity across Europe. Meanwhile, demographic factors may influence participants’ susceptibility to diseases. As a result, they might lead to the potential imprecision of our MR results. Third, given the relatively low incidence of IBD, all sample data used in the present study come from European participants, and there might be some inevitable overlap. Considering the limited details available from the database, we were unable to identify and eliminate these overlaps, which might affect the reliability of our results. Finally, it may be very difficult for us to eliminate confounding factors completely and absolutely using summary statistical data for our MR analysis. Hence, we could only draw a preliminary conclusion regarding the causal associations between PM2.5, PM2.5 absorbance, and IBD. Further research will focus on conducting more comprehensive studies to collect high-quality evidence concerning the idiographic pathophysiological mechanisms through which air pollution affects IBD risk. This includes expanding the study’s scope to encompass a broader range of air pollutants, identifying possible biomarkers that could shed light on how air contaminants contribute to IBD onset, exploring genetic susceptibilities that may modify the impact of airborne PM, and longitudinal studies to track air pollution over time and their direct correlation with IBD incidence.
-
Table S2. Single mendelian randomization analyses
Exposure Outcome SNP beta se p Particulate matter air pollution (PM2.5) Crohn’s disease rs114708313 0.010 0.010 2.997E−01 Particulate matter air pollution (PM2.5) Crohn’s disease rs1372504 −0.009 0.010 3.679E−01 Particulate matter air pollution (PM2.5) Crohn’s disease rs1537371 −0.001 0.009 8.738E−01 Particulate matter air pollution (PM2.5) Crohn’s disease rs6749467 0.007 0.009 4.434E−01 Particulate matter air pollution (PM2.5) Crohn’s disease rs72642437 0.004 0.011 7.116E−01 Particulate matter air pollution (PM2.5) Crohn’s disease rs77205736 −0.004 0.009 6.729E−01 Particulate matter air pollution (PM2.5) Crohn’s disease rs77255816 0.011 0.010 2.742E−01 Particulate matter air pollution (PM2.5) Crohn’s disease All − Inverse variance weighted 0.002 0.004 5.168E−01 Particulate matter air pollution (PM2.5) Crohn’s disease All − MR Egger 0.012 0.009 2.531E−01 Particulate matter air pollution (PM2.5) ulcerative colitis rs12203592 0.013 0.007 7.207E−02 Particulate matter air pollution (PM2.5) ulcerative colitis rs1372504 −0.004 0.011 6.949E−01 Particulate matter air pollution (PM2.5) ulcerative colitis rs1537371 0.007 0.011 4.945E−01 Particulate matter air pollution (PM2.5) ulcerative colitis rs6749467 0.020 0.011 7.326E−02 Particulate matter air pollution (PM2.5) ulcerative colitis rs77205736 0.008 0.011 4.585E−01 Particulate matter air pollution (PM2.5) ulcerative colitis All − Inverse variance weighted 0.010 0.004 2.648E−02 Particulate matter air pollution (PM2.5) ulcerative colitis All − MR Egger 0.021 0.019 3.521E−01 Particulate matter air pollution (PM2.5) absorbance Crohn’s disease rs4915350 −0.002 0.009 8.600E−01 Particulate matter air pollution (PM2.5) absorbance Crohn’s disease rs59727727 0.000 0.010 9.824E−01 Particulate matter air pollution (PM2.5) absorbance Crohn’s disease rs77205736 −0.004 0.010 6.729E−01 Particulate matter air pollution (PM2.5) absorbance Crohn’s disease rs79475047 0.000 0.009 9.843E−01 Particulate matter air pollution (PM2.5) absorbance Crohn’s disease All − Inverse variance weighted −0.001 0.005 7.692E−01 Particulate matter air pollution (PM2.5) absorbance Crohn’s disease All − MR Egger 0.000 0.010 9.683E−01 Particulate matter air pollution (PM2.5) absorbance ulcerative colitis rs12203592 0.018 0.010 7.207E−02 Particulate matter air pollution (PM2.5) absorbance ulcerative colitis rs77205736 0.009 0.012 4.585E−01 Particulate matter air pollution (PM2.5) absorbance ulcerative colitis rs884436 0.005 0.012 6.487E−01 Particulate matter air pollution (PM2.5) absorbance ulcerative colitis All − MR Egger 0.046 0.042 4.693E−01 Particulate matter air pollution (PM2.5) absorbance ulcerative colitis All − Inverse variance weighted 0.012 0.004 2.425E−03 Note. SNP, single nucleotide polymorphism; b, beta; se, standard error; pval, P-value. Table S3. MR−Egger regression analyses on detecting directional pleiotropy
Exposure Outcome egger_intercept se pval Particulate matter air pollution (PM2.5) Crohn’s disease −1.600E−04 1.400E−04 0.312 Particulate matter air pollution (PM2.5) ulcerative colitis −1.700E−04 2.800E−04 0.591 Particulate matter air pollution (PM2.5) absorbance Crohn’s disease −6.300E−02 4.500E−02 0.396 Particulate matter air pollution (PM2.5) absorbance ulcerative colitis −4.784E−04 5.700E−04 0.556 Note. se, standard error; pval, P-value. Table S4. Heterogeneity test of mendelian randomization
Exposure Outcome Method Q Q_df Q_pval Particulate matter air pollution (PM2.5) Crohn’s disease MR Egger 2.324 5.000 8.028E−01 Particulate matter air pollution (PM2.5) Crohn’s disease Inverse variance weighted 3.589 6.000 7.321E−01 Particulate matter air pollution (PM2.5) ulcerative colitis MR Egger 2.329 3.000 5.070E−01 Particulate matter air pollution (PM2.5) ulcerative colitis Inverse variance weighted 2.689 4.000 6.111E−01 Particulate matter air pollution (PM2.5) absorbance Crohn’s disease MR Egger 0.083 2.000 9.594E−01 Particulate matter air pollution (PM2.5) absorbance Crohn’s disease Inverse variance weighted 0.124 3.000 9.888E−01 Particulate matter air pollution (PM2.5) absorbance ulcerative colitis MR Egger 0.011 1.000 9.170E−01 Particulate matter air pollution (PM2.5) absorbance ulcerative colitis Inverse variance weighted 0.713 2.000 7.001E−01 Notes. df, degrees of freedom; pval, P-value. Table S5. Leave-one-out analysis of mendelian randomization
Exposure Outcome SNP b se p Particulate matter air pollution (PM2.5) Crohn’s disease rs114708313 0.001 0.004 0.774 Particulate matter air pollution (PM2.5) Crohn’s disease rs1372504 0.004 0.004 0.283 Particulate matter air pollution (PM2.5) Crohn’s disease rs1537371 0.003 0.004 0.438 Particulate matter air pollution (PM2.5) Crohn’s disease rs6749467 0.001 0.004 0.705 Particulate matter air pollution (PM2.5) Crohn’s disease rs72642437 0.002 0.004 0.578 Particulate matter air pollution (PM2.5) Crohn’s disease rs77205736 0.003 0.004 0.378 Particulate matter air pollution (PM2.5) Crohn’s disease rs77255816 0.001 0.004 0.799 Particulate matter air pollution (PM2.5) ulcerative colitis All 0.002 0.004 0.517 Particulate matter air pollution (PM2.5) ulcerative colitis rs12203592 0.008 0.006 0.154 Particulate matter air pollution (PM2.5) ulcerative colitis rs1372504 0.013 0.005 0.010 Particulate matter air pollution (PM2.5) ulcerative colitis rs1537371 0.010 0.005 0.034 Particulate matter air pollution (PM2.5) ulcerative colitis rs6749467 0.008 0.005 0.102 Particulate matter air pollution (PM2.5) ulcerative colitis rs77205736 0.010 0.005 0.036 Particulate matter air pollution (PM2.5) ulcerative colitis All 0.010 0.004 0.026 Particulate matter air pollution (PM2.5) absorbance Crohn’s disease rs4915350 −0.001 0.005 0.813 Particulate matter air pollution (PM2.5) absorbance Crohn’s disease rs59727727 −0.002 0.005 0.729 Particulate matter air pollution (PM2.5) absorbance Crohn’s disease rs77205736 −0.001 0.005 0.919 Particulate matter air pollution (PM2.5) absorbance Crohn’s disease rs79475047 −0.002 0.006 0.738 Particulate matter air pollution (PM2.5) absorbance Crohn’s disease All −0.001 0.005 0.769 Particulate matter air pollution (PM2.5) absorbance ulcerative colitis rs12203592 0.007 0.008 0.397 Particulate matter air pollution (PM2.5) absorbance ulcerative colitis rs77205736 0.013 0.008 0.094 Particulate matter air pollution (PM2.5) absorbance ulcerative colitis rs884436 0.014 0.008 0.064 Particulate matter air pollution (PM2.5) absorbance ulcerative colitis All 0.012 0.004 0.002 Note. SNP, single nucleotide polymorphism; b, beta; se, standard error; pval, P-value.
doi: 10.3967/bes2024.142
Causal Associations between Particulate Matter 2.5 (PM2.5), PM2.5 Absorbance, and Inflammatory Bowel Disease Risk: Evidence from a Two-Sample Mendelian Randomization Study
-
Abstract:Conceptualization and Resources: Xu Zhang, Zhimeng Wu, Lu Zhang, Binglong Xin, Xiangrui Wang, Xinlan Lu and Yarui Li; Data Analysis: Xu Zhang, Zhimeng Wu, Lu Zhang, Binglong Xin, Xinlan Lu and Xiangrui Wang; Funding Acquisition: Shuixiang He and Yarui Li; Investigation and Methodology: Xu Zhang, Zhimeng Wu, Lu Zhang, Binglong Xin, Xiangrui Wang, Xinlan Lu and Yarui Li; Project Administration and Visualization: Xu Zhang, Zhimeng Wu, Lu Zhang, Xinlan Lu, Guifang Lu, Mudan Ren and Shuixiang He; Supervision and Validation: Xu Zhang, Zhimeng Wu, Lu Zhang, Binglong Xin, Xinlan Lu, Shuixiang He and Yarui Li; Writing – Original Draft Preparation & Editing: Xu Zhang, Zhimeng Wu, Lu Zhang, Xiangrui Wang, Guifang Lu, Mudan Ren, Shuixiang He and Yarui Li.
Objective Several epidemiological observational studies have related particulate matter (PM) exposure to Inflammatory bowel disease (IBD), but many confounding factors make it difficult to draw causal links from observational studies. The objective of this study was to explore the causal association between PM2.5 exposure, its absorbance, and IBD. Methods We assessed the association of PM2.5 and PM2.5 absorbance with the two primary forms of IBD (Crohn’s disease [CD] and ulcerative colitis [UC]) using Mendelian randomization (MR) to explore the causal relationship. We conducted two-sample MR analyses with aggregated data from the UK Biobank genome-wide association study. Single-nucleotide polymorphisms linked with PM2.5 concentrations or their absorbance were used as instrumental variables (IVs). We used inverse variance weighting (IVW) as the primary analytical approach and four other standard methods as supplementary analyses for quality control. Results The results of MR demonstrated that PM2.5 had an adverse influence on UC risk (odds ratio [OR] = 1.010; 95% confidence interval [CI] = 1.001–1.019, P = 0.020). Meanwhile, the results of IVW showed that PM2.5 absorbance was also causally associated with UC (OR = 1.012; 95% CI = 1.004–1.019, P = 0.002). We observed no causal relationship between PM2.5, PM2.5 absorbance, and CD. The results of sensitivity analysis indicated the absence of heterogeneity or pleiotropy, ensuring the reliability of MR results. Conclusion Based on two-sample MR analyses, there are potential positive causal relationships between PM2.5, PM2.5 absorbance, and UC.
The authors declare that there are no conflicts of interest.
Ethical review and approval are not applicable to our study because All GWAS data on human participants used in this study are publicly available.
&These authors contributed equally to this work.
注释:1) Authors’ Contributions: 2) Competing Interests: 3) Ethics: -
Figure 1. Study design and workflow of the current study.
PM2.5, particulate matter 2.5; SNP, single nucleotide polymorphism; UC, ulcerative colitis; CD, Crohn’s disease; MR, Mendelian randomization; IV, instrumental variable; IVW, inverse variance weighting.
Figure 3. Forest plots were used to visualize the causal effect between PM2.5 and UC (Panel A), PM2.5 and CD (Panel B), PM2.5 absorbance and UC (Panel C), PM2.5 absorbance and CD (Panel D). The y-axis shows the analyses for the effect of each SNP on UC and CD, The red points indicate the IVW and MR–Egger estimates using all SNPs. MR, Mendelian randomization; PM2.5, particulate matter 2.5; SNP, single nucleotide polymorphism; UC, ulcerative colitis; CD, Crohn’s disease.
Figure 2. Scatter plots were used to visualize the causal effect between PM2.5 and UC (Panel A), PM2.5 and CD (Panel B), PM2.5 absorbance and UC (Panel C), PM2.5 absorbance and CD (Panel D). The x-axis shows the SNP effect and SE on PM2.5 and its absorbance. The y-axis shows the SNP effect and SE on UC and CD. The regression lines for the inverse-variance weighted (IVW) method, the MR–Egger regression method, the weighted median, the weighted mode, and the simple mode are shown. The slope of each straight line indicates the magnitude of the causal association. PM2.5, particulate matter 2.5; SNP, single nucleotide polymorphism; SE, standard error; UC, ulcerative colitis; CD, Crohn’s disease.
S1. Forest plots of the “leave-one-out” sensitivity analyses to demonstrate the impact of individual SNPs on the results. The x-axis shows MR “leave-one-out” sensitivity analyses for PM2.5 on UC (Panel A), PM2.5 on CD (Panel B), PM2.5 absorbance on UC (Panel C), PM2.5 absorbance on CD (Panel D). The y-axis shows the analyses for the effect of “leave-one-out” of SNPs on UC and CD. The red points indicate the IVW estimates using all SNPs. MR, Mendelian randomization; PM2.5, particulate matter 2.5; SNP, single nucleotide polymorphism; UC, ulcerative colitis; CD, Crohn’s disease.
These authors contributed equally to this work.
S1. Detailed information of each single nucleotide polymorphism selected in our study
SNP Effect F-statistic R2 Exposure Exposure Outcome Outcome allele beta se pval eaf beta se pval eaf rs114708313 T 30.076 7.420E−05 PM2.5 0.025 0.004 4.200E−08 0.066 Crohn’s disease 2.531E−04 2.440E−04 2.997E−01 0.067 rs1372504 A 30.674 7.077E−05 PM2.5 0.012 0.002 3.100E−08 0.374 Crohn’s disease −1.056E−04 1.172E−04 3.679E−01 0.373 rs1537371 A 33.149 7.651E−05 PM2.5 0.012 0.002 8.500E−09 0.500 Crohn’s disease −1.802E−05 1.135E−04 8.738E−01 0.496 rs6749467 A 32.228 7.642E−05 PM2.5 −0.012 0.002 1.400E−08 0.466 Crohn’s disease −8.829E−05 1.152E−04 4.434E−01 0.467 rs72642437 T 35.119 9.894E−05 PM2.5 0.113 0.019 3.100E−09 0.004 Crohn’s disease 4.525E−04 1.224E−03 7.116E−01 0.003 rs77205736 T 31.399 7.273E−05 PM2.5 0.014 0.002 2.100E−08 0.274 Crohn’s disease −5.372E−05 1.272E−04 6.729E−01 0.274 rs77255816 T 30.041 6.933E−05 PM2.5 0.031 0.006 4.200E−08 0.037 Crohn’s disease 3.314E−04 3.031E−04 2.742E−01 0.036 rs12203592 T 69.918 1.573E−04 PM2.5 0.022 0.003 6.200E−17 0.213 ulcerative colitis 2.908E−04 1.617E−04 7.200E−02 0.220 rs1372504 A 30.674 7.077E−05 PM2.5 0.012 0.002 3.100E−08 0.374 ulcerative colitis −5.507E−05 1.404E−04 6.900E−01 0.374 rs1537371 A 33.149 7.651E−05 PM2.5 0.012 0.002 8.500E−09 0.500 ulcerative colitis 9.277E−05 1.358E−04 4.900E−01 0.501 rs6749467 A 32.228 7.642E−05 PM2.5 −0.012 0.002 1.400E−08 0.466 ulcerative colitis −2.473E−04 1.380E−04 7.300E−02 0.465 rs77205736 T 31.399 7.273E−05 PM2.5 0.014 0.002 2.100E−08 0.274 ulcerative colitis 1.130E−04 1.524E−04 4.600E−01 0.275 rs4915350 C 33.933 7.819E−05 PM2.5 absorbance 0.046 0.008 5.700E−09 0.019 Crohn’s disease −7.632E−05 4.327E−04 8.600E−01 0.018 rs59727727 C 30.823 6.941E−05 PM2.5 absorbance 0.018 0.003 2.800E−08 0.122 Crohn’s disease 3.910E−06 1.777E−04 9.824E−01 0.115 rs77205736 T 29.911 6.813E−05 PM2.5 absorbance 0.013 0.002 4.500E−08 0.274 Crohn’s disease −5.372E−05 1.272E−04 6.729E−01 0.274 rs79475047 C 36.427 8.255E−05 PM2.5 absorbance 0.040 0.007 1.600E−09 0.027 Crohn’s disease −6.937E−06 3.516E−04 9.843E−01 0.027 rs12203592 T 41.539 9.189E−05 PM2.5 absorbance 0.017 0.003 1.200E−10 0.213 ulcerative colitis 2.908E−04 1.617E−04 7.200E−02 0.220 rs77205736 T 29.911 6.813E−05 PM2.5 absorbance 0.013 0.002 4.500E−08 0.274 ulcerative colitis 1.130E−04 1.524E−04 4.600E−01 0.275 rs884436 T 29.070 6.660E−05 PM2.5 absorbance 0.012 0.002 7.000E−08 0.485 ulcerative colitis 6.223E−05 1.366E−04 6.500E−01 0.486 Note. PM2.5, particulate matter air pollution; eaf, effect allele frequency; se, standard error; pval, P-value.  下载: 导出CSV
Table 1. MR analysis result of causal effects
Exposure/Outcome Method nSNP beta se pval OR 95% CI PM2.5 Crohn’s disease IVW 7 0.002 0.004 0.517 1.002 0.995−1.009 MR Egger 7 0.012 0.009 0.253 1.012 0.994−1.029 Weighted median 7 0.003 0.005 0.496 1.003 0.993−1.013 Simple mode 7 0.008 0.007 0.343 1.008 0.993−1.022 Weighted mode 7 0.008 0.007 0.341 1.008 0.993−1.022 Ulcerative colitis IVW 5 0.010 0.005 0.027 1.010 1.001−1.019 MR Egger 5 0.021 0.019 0.352 1.021 0.983−1.060 Weighted median 5 0.010 0.006 0.070 1.010 0.999−1.021 Simple mode 5 0.010 0.008 0.274 1.010 0.994−1.025 Weighted mode 5 0.012 0.007 0.182 1.012 0.997−1.025 PM2.5 absorbance Crohn’s disease IVW 4 −0.001 0.005 0.769 0.998 0.989−1.008 MR Egger 4 0.001 0.010 0.968 1.000 0.980−1.021 Weighted median 4 −0.001 0.005 0.866 0.999 0.989−1.009 Simple mode 4 > −0.001 0.007 0.975 1.000 0.986−1.013 Weighted mode 4 > −0.001 0.007 0.973 1.000 0.986−1.013 Ulcerative colitis IVW 3 0.012 0.004 0.002 1.012 1.004−1.019 MR Egger 3 0.046 0.042 0.469 1.047 0.965−1.137 Weighted median 3 0.010 0.007 0.174 1.010 0.995−1.024 Simple mode 3 0.007 0.009 0.530 1.007 0.989−1.026 Weighted mode 3 0.007 0.009 0.525 1.007 0.989−1.026 Note. PM2.5, particulate matter 2.5; se, standard error; pval, P-value; IVW, inverse variance weighting.
下载: 导出CSV
S2. Single mendelian randomization analyses
Exposure Outcome SNP beta se p Particulate matter air pollution (PM2.5) Crohn’s disease rs114708313 0.010 0.010 2.997E−01 Particulate matter air pollution (PM2.5) Crohn’s disease rs1372504 −0.009 0.010 3.679E−01 Particulate matter air pollution (PM2.5) Crohn’s disease rs1537371 −0.001 0.009 8.738E−01 Particulate matter air pollution (PM2.5) Crohn’s disease rs6749467 0.007 0.009 4.434E−01 Particulate matter air pollution (PM2.5) Crohn’s disease rs72642437 0.004 0.011 7.116E−01 Particulate matter air pollution (PM2.5) Crohn’s disease rs77205736 −0.004 0.009 6.729E−01 Particulate matter air pollution (PM2.5) Crohn’s disease rs77255816 0.011 0.010 2.742E−01 Particulate matter air pollution (PM2.5) Crohn’s disease All − Inverse variance weighted 0.002 0.004 5.168E−01 Particulate matter air pollution (PM2.5) Crohn’s disease All − MR Egger 0.012 0.009 2.531E−01 Particulate matter air pollution (PM2.5) ulcerative colitis rs12203592 0.013 0.007 7.207E−02 Particulate matter air pollution (PM2.5) ulcerative colitis rs1372504 −0.004 0.011 6.949E−01 Particulate matter air pollution (PM2.5) ulcerative colitis rs1537371 0.007 0.011 4.945E−01 Particulate matter air pollution (PM2.5) ulcerative colitis rs6749467 0.020 0.011 7.326E−02 Particulate matter air pollution (PM2.5) ulcerative colitis rs77205736 0.008 0.011 4.585E−01 Particulate matter air pollution (PM2.5) ulcerative colitis All − Inverse variance weighted 0.010 0.004 2.648E−02 Particulate matter air pollution (PM2.5) ulcerative colitis All − MR Egger 0.021 0.019 3.521E−01 Particulate matter air pollution (PM2.5) absorbance Crohn’s disease rs4915350 −0.002 0.009 8.600E−01 Particulate matter air pollution (PM2.5) absorbance Crohn’s disease rs59727727 0.000 0.010 9.824E−01 Particulate matter air pollution (PM2.5) absorbance Crohn’s disease rs77205736 −0.004 0.010 6.729E−01 Particulate matter air pollution (PM2.5) absorbance Crohn’s disease rs79475047 0.000 0.009 9.843E−01 Particulate matter air pollution (PM2.5) absorbance Crohn’s disease All − Inverse variance weighted −0.001 0.005 7.692E−01 Particulate matter air pollution (PM2.5) absorbance Crohn’s disease All − MR Egger 0.000 0.010 9.683E−01 Particulate matter air pollution (PM2.5) absorbance ulcerative colitis rs12203592 0.018 0.010 7.207E−02 Particulate matter air pollution (PM2.5) absorbance ulcerative colitis rs77205736 0.009 0.012 4.585E−01 Particulate matter air pollution (PM2.5) absorbance ulcerative colitis rs884436 0.005 0.012 6.487E−01 Particulate matter air pollution (PM2.5) absorbance ulcerative colitis All − MR Egger 0.046 0.042 4.693E−01 Particulate matter air pollution (PM2.5) absorbance ulcerative colitis All − Inverse variance weighted 0.012 0.004 2.425E−03 Note. SNP, single nucleotide polymorphism; b, beta; se, standard error; pval, P-value.
下载: 导出CSV
S3. MR−Egger regression analyses on detecting directional pleiotropy
Exposure Outcome egger_intercept se pval Particulate matter air pollution (PM2.5) Crohn’s disease −1.600E−04 1.400E−04 0.312 Particulate matter air pollution (PM2.5) ulcerative colitis −1.700E−04 2.800E−04 0.591 Particulate matter air pollution (PM2.5) absorbance Crohn’s disease −6.300E−02 4.500E−02 0.396 Particulate matter air pollution (PM2.5) absorbance ulcerative colitis −4.784E−04 5.700E−04 0.556 Note. se, standard error; pval, P-value.
下载: 导出CSV
S4. Heterogeneity test of mendelian randomization
Exposure Outcome Method Q Q_df Q_pval Particulate matter air pollution (PM2.5) Crohn’s disease MR Egger 2.324 5.000 8.028E−01 Particulate matter air pollution (PM2.5) Crohn’s disease Inverse variance weighted 3.589 6.000 7.321E−01 Particulate matter air pollution (PM2.5) ulcerative colitis MR Egger 2.329 3.000 5.070E−01 Particulate matter air pollution (PM2.5) ulcerative colitis Inverse variance weighted 2.689 4.000 6.111E−01 Particulate matter air pollution (PM2.5) absorbance Crohn’s disease MR Egger 0.083 2.000 9.594E−01 Particulate matter air pollution (PM2.5) absorbance Crohn’s disease Inverse variance weighted 0.124 3.000 9.888E−01 Particulate matter air pollution (PM2.5) absorbance ulcerative colitis MR Egger 0.011 1.000 9.170E−01 Particulate matter air pollution (PM2.5) absorbance ulcerative colitis Inverse variance weighted 0.713 2.000 7.001E−01 Notes. df, degrees of freedom; pval, P-value.
下载: 导出CSV
S5. Leave-one-out analysis of mendelian randomization
Exposure Outcome SNP b se p Particulate matter air pollution (PM2.5) Crohn’s disease rs114708313 0.001 0.004 0.774 Particulate matter air pollution (PM2.5) Crohn’s disease rs1372504 0.004 0.004 0.283 Particulate matter air pollution (PM2.5) Crohn’s disease rs1537371 0.003 0.004 0.438 Particulate matter air pollution (PM2.5) Crohn’s disease rs6749467 0.001 0.004 0.705 Particulate matter air pollution (PM2.5) Crohn’s disease rs72642437 0.002 0.004 0.578 Particulate matter air pollution (PM2.5) Crohn’s disease rs77205736 0.003 0.004 0.378 Particulate matter air pollution (PM2.5) Crohn’s disease rs77255816 0.001 0.004 0.799 Particulate matter air pollution (PM2.5) ulcerative colitis All 0.002 0.004 0.517 Particulate matter air pollution (PM2.5) ulcerative colitis rs12203592 0.008 0.006 0.154 Particulate matter air pollution (PM2.5) ulcerative colitis rs1372504 0.013 0.005 0.010 Particulate matter air pollution (PM2.5) ulcerative colitis rs1537371 0.010 0.005 0.034 Particulate matter air pollution (PM2.5) ulcerative colitis rs6749467 0.008 0.005 0.102 Particulate matter air pollution (PM2.5) ulcerative colitis rs77205736 0.010 0.005 0.036 Particulate matter air pollution (PM2.5) ulcerative colitis All 0.010 0.004 0.026 Particulate matter air pollution (PM2.5) absorbance Crohn’s disease rs4915350 −0.001 0.005 0.813 Particulate matter air pollution (PM2.5) absorbance Crohn’s disease rs59727727 −0.002 0.005 0.729 Particulate matter air pollution (PM2.5) absorbance Crohn’s disease rs77205736 −0.001 0.005 0.919 Particulate matter air pollution (PM2.5) absorbance Crohn’s disease rs79475047 −0.002 0.006 0.738 Particulate matter air pollution (PM2.5) absorbance Crohn’s disease All −0.001 0.005 0.769 Particulate matter air pollution (PM2.5) absorbance ulcerative colitis rs12203592 0.007 0.008 0.397 Particulate matter air pollution (PM2.5) absorbance ulcerative colitis rs77205736 0.013 0.008 0.094 Particulate matter air pollution (PM2.5) absorbance ulcerative colitis rs884436 0.014 0.008 0.064 Particulate matter air pollution (PM2.5) absorbance ulcerative colitis All 0.012 0.004 0.002 Note. SNP, single nucleotide polymorphism; b, beta; se, standard error; pval, P-value.
下载: 导出CSV
-
[1] Silverberg MS, Satsangi J, Ahmad T, et al. Toward an integrated clinical, molecular and serological classification of inflammatory bowel disease: report of a Working Party of the 2005 Montreal World Congress of Gastroenterology. Can J Gastroenterol, 2005; 19 Suppl A, 5A-36A. [2] Ferrari AJ, Santomauro DF, Aali A, et al. Global incidence, prevalence, years lived with disability (YLDs), disability-adjusted life-years (DALYs), and healthy life expectancy (HALE) for 371 diseases and injuries in 204 countries and territories and 811 subnational locations, 1990-2021: a systematic analysis for the Global Burden of Disease Study 2021. Lancet, 2024; 403, 2133−61. doi: 10.1016/S0140-6736(24)00757-8 [3] Rakowsky S, Papamichael K, Cheifetz AS. Choosing the right biologic for complications of inflammatory bowel disease. Expert Rev Gastroenterol Hepatol, 2022; 16, 235−49. doi: 10.1080/17474124.2022.2036122 [4] Nishida A, Inoue R, Inatomi O, et al. Gut microbiota in the pathogenesis of inflammatory bowel disease. Clin J Gastroenterol, 2018; 11, 1−10. doi: 10.1007/s12328-017-0813-5 [5] Beamish LA, Osornio-Vargas AR, Wine E. Air pollution: an environmental factor contributing to intestinal disease. J Crohns Colitis, 2011; 5, 279−86. doi: 10.1016/j.crohns.2011.02.017 [6] Opstelten JL, Beelen RMJ, Leenders M, et al. Exposure to ambient air pollution and the risk of inflammatory bowel disease: a European nested case-control study. Dig Dis Sci, 2016; 61, 2963−71. doi: 10.1007/s10620-016-4249-4 [7] Ananthakrishnan AN, Bernstein CN, Iliopoulos D, et al. Environmental triggers in IBD: a review of progress and evidence. Nat Rev Gastroenterol Hepatol, 2018; 15, 39−49. doi: 10.1038/nrgastro.2017.136 [8] Pritchett N, Spangler EC, Gray GM, et al. Exposure to outdoor particulate matter air pollution and risk of gastrointestinal cancers in adults: a systematic review and meta-analysis of epidemiologic evidence. Environ Health Perspect, 2022; 130, 036001. doi: 10.1289/EHP9620 [9] Wang M, Wang QY, Ho SSH, et al. Chemical characteristics and sources of nitrogen-containing organic compounds at a regional site in the North China Plain during the transition period of autumn and winter. Sci Total Environ, 2022; 812, 151451. doi: 10.1016/j.scitotenv.2021.151451 [10] Li YZ, Xu L, Shan ZY, et al. Association between air pollution and type 2 diabetes: an updated review of the literature. Ther Adv Endocrinol Metab, 2019; 10, 2042018819897046. [11] Eeftens M, Phuleria HC, Meier R, et al. Spatial and temporal variability of ultrafine particles, NO2, PM2.5, PM2.5 absorbance, PM10 and PMcoarse in Swiss study areas. Atmos Environ, 2015; 111, 60−70. doi: 10.1016/j.atmosenv.2015.03.031 [12] Rasking L, Koshy P, Bongaerts E, et al. Ambient black carbon reaches the kidneys. Environ Int, 2023; 177, 107997. doi: 10.1016/j.envint.2023.107997 [13] Adami G, Pontalti M, Cattani G, et al. Association between long-term exposure to air pollution and immune-mediated diseases: a population-based cohort study. RMD Open, 2022; 8, e002055. doi: 10.1136/rmdopen-2021-002055 [14] Ananthakrishnan AN, McGinley EL, Binion DG, et al. Ambient air pollution correlates with hospitalizations for inflammatory bowel disease: an ecologic analysis. Inflamm Bowel Dis, 2011; 17, 1138−45. doi: 10.1002/ibd.21455 [15] Hu SJ, Xing HY, Wang XC, et al. Causal relationships between total physical activity and ankylosing spondylitis: a Mendelian randomization study. Front Immunol, 2022; 13, 887326. doi: 10.3389/fimmu.2022.887326 [16] Bowden J, Holmes MV. Meta-analysis and Mendelian randomization: a review. Res Synth Methods, 2019; 10, 486−96. doi: 10.1002/jrsm.1346 [17] Cao MY, Liu D, Zhang XY, et al. Association of C-reactive protein with cardiovascular outcomes: a Mendelian randomization study in the Japanese population. Biomed Environ Sci, 2022; 35, 126−32. [18] Li YJ, Kan X. Mendelian randomization analysis to analyze the effect of emergency caesarean section on different allergic diseases and related blood markers. Biomed Environ Sci, 2023; 36, 1084−9. [19] Bycroft C, Freeman C, Petkova D, et al. The UK Biobank resource with deep phenotyping and genomic data. Nature, 2018; 562, 203−9. doi: 10.1038/s41586-018-0579-z [20] Collins R. What makes UK Biobank special? Lancet, 2012; 379, 1173-4. [21] Eeftens M, Beelen R, de Hoogh K, et al. Development of land use regression models for PM2.5, PM2.5 absorbance, PM10 and PMcoarse in 20 European study areas; Results of the ESCAPE project. Environ Sci Technol, 2012; 46, 11195−205. doi: 10.1021/es301948k [22] Yang Y, Ma XL, Pang WY, et al. Causal associations of PM2.5 and GDM: a two-sample Mendelian randomization study. Toxics, 2023; 11, 171. doi: 10.3390/toxics11020171 [23] Shen JX, Lu Y, Meng W, et al. Exploring causality between bone mineral density and frailty: a bidirectional Mendelian randomization study. PLoS One, 2024; 19, e0296867. doi: 10.1371/journal.pone.0296867 [24] Li CC, Niu MY, Guo Z, et al. A mild causal relationship between tea consumption and obesity in general population: a two-sample Mendelian randomization study. Front Genet, 2022; 13, 795049. doi: 10.3389/fgene.2022.795049 [25] Pierce BL, Ahsan H, VanderWeele TJ. Power and instrument strength requirements for Mendelian randomization studies using multiple genetic variants. Int J Epidemiol, 2011; 40, 740−52. doi: 10.1093/ije/dyq151 [26] Sun Y, Li Y, Yu TC, et al. Causal associations of anthropometric measurements with osteoarthritis: a Mendelian randomization study. PLoS One, 2023; 18, e0279198. doi: 10.1371/journal.pone.0279198 [27] Hartwig FP, Davey Smith G, Bowden J. Robust inference in summary data Mendelian randomization via the zero modal pleiotropy assumption. Int J Epidemiol, 2017; 46, 1985−98. doi: 10.1093/ije/dyx102 [28] Fu SJ, Zhang L, Ma FZ, et al. Effects of selenium on chronic kidney disease: a Mendelian randomization study. Nutrients, 2022; 14, 4458. doi: 10.3390/nu14214458 [29] Burgess S, Thompson SG. Interpreting findings from Mendelian randomization using the MR-Egger method. Eur J Epidemiol, 2017; 32, 377−89. doi: 10.1007/s10654-017-0255-x [30] Bowden J, Del Greco MF, Minelli C, et al. Improving the accuracy of two-sample summary-data Mendelian randomization: moving beyond the NOME assumption. Int J Epidemiol, 2019; 48, 728−42. doi: 10.1093/ije/dyy258 [31] Wang Z, Chen M, Wei YZ, et al. The causal relationship between sleep traits and the risk of schizophrenia: a two-sample bidirectional Mendelian randomization study. BMC Psychiatry, 2022; 22, 399. doi: 10.1186/s12888-022-03946-8 [32] Burgess S, Butterworth A, Thompson SG. Mendelian randomization analysis with multiple genetic variants using summarized data. Genet Epidemiol, 2013; 37, 658−65. doi: 10.1002/gepi.21758 [33] Zou XL, Wang S, Wang LY, et al. Childhood obesity and risk of stroke: a Mendelian randomisation analysis. Front Genet, 2021; 12, 727475. doi: 10.3389/fgene.2021.727475 [34] Ding SW, Sun S, Ding R, et al. Association between exposure to air pollutants and the risk of inflammatory bowel diseases visits. Environ Sci Pollut Res Int, 2022; 29, 17645−54. doi: 10.1007/s11356-021-17009-0 [35] Michaux M, Chan JM, Bergmann L, et al. Spatial cluster mapping and environmental modeling in pediatric inflammatory bowel disease. World J Gastroenterol, 2023; 29, 3688−702. doi: 10.3748/wjg.v29.i23.3688 [36] Chan YL, Wang BM, Chen H, et al. Pulmonary inflammation induced by low-dose particulate matter exposure in mice. Am J Physiol Lung Cell Mol Physiol, 2019; 317, L424−30. doi: 10.1152/ajplung.00232.2019 [37] Xu MX, Ge CX, Qin YT, et al. Prolonged PM2.5 exposure elevates risk of oxidative stress-driven nonalcoholic fatty liver disease by triggering increase of dyslipidemia. Free Radic Biol Med, 2019; 130, 542−56. doi: 10.1016/j.freeradbiomed.2018.11.016 [38] Hong ZC, Zeng PJ, Zhuang GS, et al. Toxicological effects of artificial fine particulate matter in rats through induction of oxidative stress and inflammation. Tohoku J Exp Med, 2021; 255, 19−25. doi: 10.1620/tjem.255.19 [39] Wang Y, Xiong LL, Tang M. Toxicity of inhaled particulate matter on the central nervous system: neuroinflammation, neuropsychological effects and neurodegenerative disease. J Appl Toxicol, 2017; 37, 644−67. doi: 10.1002/jat.3451 [40] Liu KM, Hua SC, Song L. PM2.5 exposure and asthma development: the key role of oxidative stress. Oxid Med Cell Longev, 2022; 2022, 3618806. [41] Tian T, Wang ZL, Zhang JH. Pathomechanisms of oxidative stress in inflammatory bowel disease and potential antioxidant therapies. Oxid Med Cell Longev, 2017; 2017, 4535194. doi: 10.1155/2017/4535194 [42] Morgan MJ, Liu ZG. Crosstalk of reactive oxygen species and NF-κB signaling. Cell Res, 2011; 21, 103−15. doi: 10.1038/cr.2010.178 [43] Saez A, Herrero-Fernandez B, Gomez-Bris R, et al. Pathophysiology of inflammatory bowel disease: innate immune system. Int J Mol Sci, 2023; 24, 1526. doi: 10.3390/ijms24021526 [44] Salim SY, Kaplan GG, Madsen KL. Air pollution effects on the gut microbiota. Gut Microbes, 2014; 5, 215−9. doi: 10.4161/gmic.27251 [45] Kish L, Hotte N, Kaplan GG, et al. Environmental particulate matter induces murine intestinal inflammatory responses and alters the gut microbiome. PLoS One, 2013; 8, e62220. doi: 10.1371/journal.pone.0062220 [46] Salim SY, Jovel J, Wine E, et al. Exposure to ingested airborne pollutant particulate matter increases mucosal exposure to bacteria and induces early onset of inflammation in neonatal IL-10–deficient mice. Inflamm Bowel Dis, 2014; 20, 1129−38. doi: 10.1097/MIB.0000000000000066 [47] Wirsching J, Nagel G, Tsai MY, et al. Exposure to ambient air pollution and elevated blood levels of gamma-glutamyl transferase in a large Austrian cohort. Sci Total Environ, 2023; 883, 163658. doi: 10.1016/j.scitotenv.2023.163658 [48] Cappello M, Randazzo C, Bravatà I, et al. Liver function test abnormalities in patients with inflammatory bowel diseases: a hospital-based survey. Clin Med Insights Gastroenterol, 2014; 7, 25−31. [49] Li XB, Cui J, Yang HB, et al. Colonic injuries induced by inhalational exposure to particulate-matter air pollution. Adv Sci (Weinh), 2019; 6, 1900180. doi: 10.1002/advs.201900180 [50] Zhang YN, Li MY, Pu ZY, et al. Multi-omics data reveals the disturbance of glycerophospholipid metabolism and linoleic acid metabolism caused by disordered gut microbiota in PM2.5 gastrointestinal exposed rats. Ecotoxicol Environ Saf, 2023; 262, 115182. doi: 10.1016/j.ecoenv.2023.115182 [51] Mutlu EA, Engen PA, Soberanes S, et al. Particulate matter air pollution causes oxidant-mediated increase in gut permeability in mice. Part Fibre Toxicol, 2011; 8, 19. doi: 10.1186/1743-8977-8-19 [52] Costa LG, Cole TB, Dao K, et al. Effects of air pollution on the nervous system and its possible role in neurodevelopmental and neurodegenerative disorders. Pharmacol Ther, 2020; 210, 107523. doi: 10.1016/j.pharmthera.2020.107523 [53] Gao X, Koutrakis P, Coull B, et al. Short-term exposure to PM2.5 components and renal health: findings from the Veterans Affairs Normative Aging Study. J Hazard Mater, 2021; 420, 126557. doi: 10.1016/j.jhazmat.2021.126557 [54] Lu C, Wang L, Jiang Y, et al. Preconceptional, pregnant, and postnatal exposure to outdoor air pollution and indoor environmental factors: effects on childhood parasitic infections. Sci Total Environ, 2024; 912, 169234. doi: 10.1016/j.scitotenv.2023.169234 [55] Herrera-Luis E, Benke K, Volk H, et al. Gene-environment interactions in human health. Nat Rev Genet, 2024. [56] Virolainen SJ, VonHandorf A, Viel KCMF, et al. Gene-environment interactions and their impact on human health. Genes Immun, 2023; 24, 1−11. [57] Wang YT, Li HC, Huang J, et al. Short-term PM2.5 exposure and DNA methylation changes of circadian rhythm genes: evidence from two experimental studies. Environ Sci Technol, 2024; 58, 9991−10000. doi: 10.1021/acs.est.4c00108 [58] Gao X, Huang J, Cardenas A, et al. Short-term exposure of PM2.5 and epigenetic aging: a quasi-experimental study. Environ Sci Technol, 2022; 56, 14690−700. doi: 10.1021/acs.est.2c05534 [59] Li FR, Wu KY, Fan WD, et al. Long-term exposure to air pollution and risk of incident inflammatory bowel disease among middle and old aged adults. Ecotoxicol Environ Saf, 2022; 242, 113835. doi: 10.1016/j.ecoenv.2022.113835 [60] Burgess S, Davey Smith G, Davies NM, et al. Guidelines for performing Mendelian randomization investigations: update for summer 2023. Wellcome Open Res, 2019; 4, 186. doi: 10.12688/wellcomeopenres.15555.1 -
 24137+Supplementary Materials.pdf

-

 点击查看大图
计量
- 文章访问数: 3183
- HTML全文浏览量: 1481
- PDF下载量: 136
- 被引次数: 0

 Quick Links