

 下载:
下载:


-
Hepatic steatosis exceeding 5%, when occurring in the context of metabolic dysregulation and unrelated to significant alcohol use or other liver diseases, defines metabolic dysfunction-associated steatotic liver disease (MASLD)[1]. This condition is fundamentally connected to insulin resistance and systemic metabolic dysfunction. With the global rise in obesity and metabolic disorders, the prevalence of MASLD has surged dramatically. Recent epidemiological studies report a global prevalence of 25%–30%, which rises to 70%–90% in obese populations and patients with type 2 diabetes mellitus (T2DM), establishing MASLD as the leading cause of chronic liver disease[2]. The nomenclature for fatty liver disease has recently evolved to better reflect its underlying metabolic pathogenesis. The term "MASLD" was established through a 2023 international multisociety Delphi consensus to supersede both "non-alcoholic fatty liver disease (NAFLD)" and the concurrently proposed "metabolic dysfunction-associated fatty liver disease (MAFH)"[3]. This change to "steatotic liver disease" aims to harmonize global terminology and reduce stigma, while the diagnostic criteria for MASLD maintain a central focus on the presence of cardiometabolic risk factors, ensuring continuity with the core conceptual framework of its predecessors. The disease spectrum of metabolic dysfunction-associated steatotic liver disease (MASLD) progresses from simple hepatic steatosis to metabolic dysfunction-associated steatohepatitis (MASH), characterized by lobular inflammation and hepatocyte ballooning, which may further advance to fibrosis, cirrhosis, and hepatocellular carcinoma. Notably, 20%–30% of MASH cases develop progressive fibrosis, which can advance to cirrhosis and its complications, including hepatic decompensation and hepatocellular carcinoma[4]. Current management strategies prioritize lifestyle modifications. Pharmacological agents such as pioglitazone, vitamin E, and glucagon-like peptide-1 (GLP-1) receptor agonists may be considered for patients with concurrent metabolic abnormalities. Recently, resmetirom has been approved by the U.S. Food and Drug Administration (FDA) for the treatment of NASH with moderate to advanced liver fibrosis, marking a significant advancement in the pharmacotherapeutic landscape[5].
The risk factors for MASLD are complex and diverse, including central obesity, insulin resistance, type 2 diabetes, hypertension, dyslipidemia, genetic factors (such as PNPLA3 gene polymorphism), and gut microbiota dysbiosis[6,7]. Critically, the driving force behind MASLD progression is chronic inflammation, which is intrinsically linked to its associated metabolic comorbidities. Systemic inflammation serves as a key pathophysiological bridge, with conditions such as obesity, prediabetes, type 2 diabetes, and metabolic syndrome all contributing to a pro-inflammatory state that promotes hepatocellular injury and disease advancement[8-11].The disease spectrum of metabolic dysfunction-associated MASLD progresses from isolated hepatic steatosis to steatohepatitis with characteristic lobular inflammation and hepatocyte ballooning, 20%–30% of steatohepatitis cases develop progressive fibrosis, potentially advancing to cirrhosis and its complications including hepatic decompensation and hepatocellular carcinoma[12]. In this pathological process, the key histological features of the transition from steatosis to MASH include hepatocyte ballooning, lobular inflammation, and varying degrees of fibrosis, with hepatic stellate cell activation and extracellular matrix deposition being central to fibrogenesis[13].
Accurately assessing disease severity and prognosis is crucial for management. While imaging modalities (e.g., ultrasound, magnetic resonance imaging-proton density fat fraction [MRI-PDFF]) and serum biomarkers (e.g., Fibrosis-4 index [FIB-4], NAFLD Fibrosis Score [NFS]) are widely used for screening, liver histopathology remains the gold standard for definitive diagnosis and staging[14-18]. However, these methods have limitations in distinguishing early-stage MASH and evaluating disease activity. In this context, the SAF (Steatosis, Activity, Fibrosis) scoring system has emerged as a standardized histopathological assessment method recommended by European Association for the Study of the Liver (EASL). This system provides semi-quantitative evaluation of three key pathological features:steatosis (S0–S3), activity (A0–A3, combining ballooning degeneration and lobular inflammation), and fibrosis (F0–F4). The "Activity" (A) component of the SAF score is particularly salient, as it provides a direct histological quantification of the inflammatory burden within the liver. Given that inflammation is a common pathogenic feature across the spectrum of metabolic disorders linked to MASLD[19,20], the SAF score offers a robust framework for investigating the relationship between metabolic risk factors and histologic disease severity. Studies have confirmed that activity grade (A ≥ 3) and significant fibrosis (F ≥ 3) are independent risk factors for predicting liver-related adverse outcomes, this makes the SAF scoring system particularly valuable for clinical trial endpoint assessment and individualized treatment decision-making[21].
This prospective study analyzed consecutive biopsy-proven MASLD patients (2018–2022) to advance risk stratification through three key innovations: the first comprehensive integration of SAF-scored histopathology with routinely available metabolic and imaging biomarkers (including CAP and LSM) in a large clinical cohort; the development and validation of a clinically practical 4-factor risk model (incorporating BMI, UA, CAP and LSM) specifically designed to identify patients with high-risk histologic lesions (A ≥ 3 or F ≥ 3); and novel mechanistic insights linking core metabolic drivers to distinct histologic outcomes through the SAF scoring framework, thereby addressing critical gaps in non-invasive risk assessment for MASLD management.
-
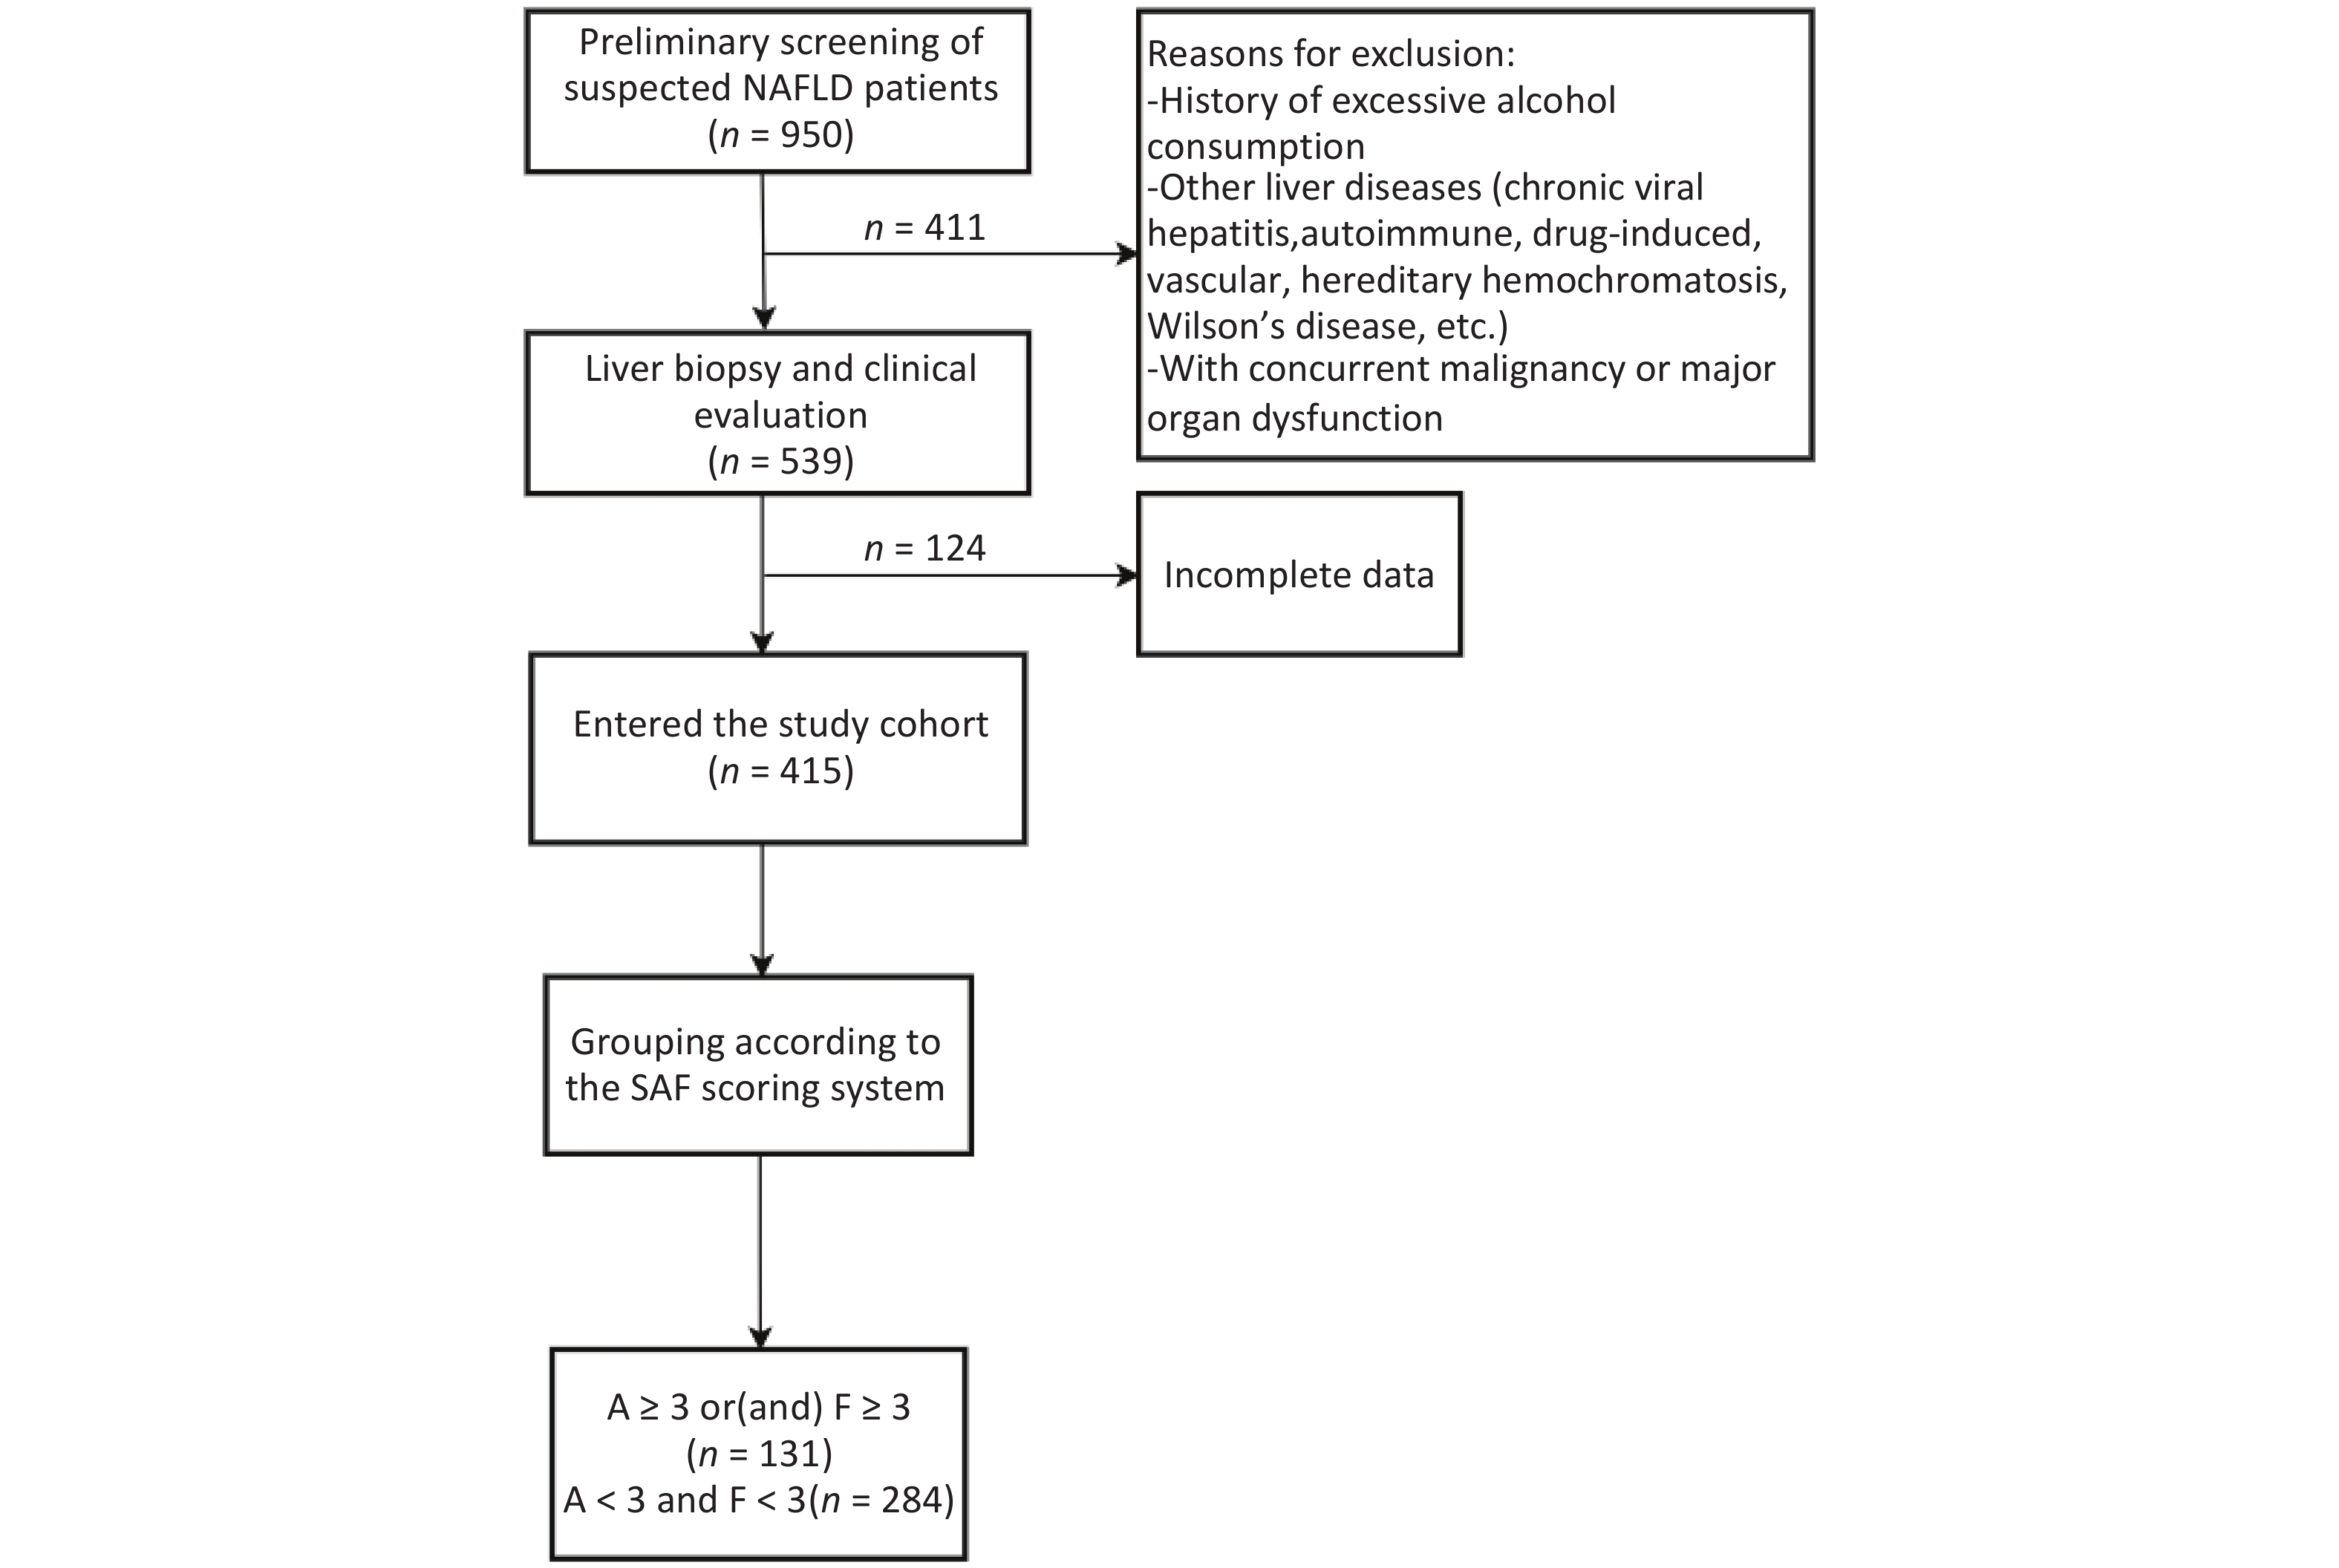
This retrospective cohort study consecutively enrolled MASLD patients diagnosed via ultrasound-guided percutaneous liver biopsy at the Second Department of Hepatology, Ditan Hospital, Capital Medical University between January 2018 and December 2022. From an initial screening of 539 cases, 415 patients meeting stringent data quality control criteria were included for statistical analysis. Clinical data were extracted from the hospital’s electronic medical record system. The study protocol was approved by the Ethics Committee of Beijing Ditan Hospital, Capital Medical University (Approval No. Jing Di Lun Ke Zi [2018] 052-01). Written informed consent was obtained from all participants prior to liver biopsy.
-
(1) histologically confirmed MASLD diagnosis by pathologists;
(2) complete demographic data and clinical laboratory parameters;
(3) completion of a standardized epidemiological questionnaire;
(4) metabolic indicators (e.g., fasting glucose, lipid profile) and imaging assessments (e.g., CAP, LSM) performed within ± 7 days of liver biopsy.
-
(1) alcohol-related liver injury: defined as daily ethanol consumption exceeding 30 g/day for males or 20 g/day for females (WHO criteria);
(2) concurrent liver diseases: including but not limited to chronic viral hepatitis, autoimmune liver disease, drug-induced liver injury, hepatic vascular disorders, and genetic metabolic liver diseases;
(3) comorbidities: malignancies or severe dysfunction of major organs (e.g., heart, kidney, or respiratory failure).
-
Data were obtained via a structured electronic medical record (EMR) system, including:
(1) Demographic characteristics: gender, age, height, weight (BMI calculated as weight/height2).
Lifestyle indicators: sedentary behavior (meeting ≥2 criteria: occupational sedentariness [e.g., office work], leisure screen time > 3 h/day, daily steps < 5,000)[22], high-fat diet (> 35% of total daily calories from fat)[23].
(2) Comorbidities:
hypertension: systolic blood pressure (SBP) ≥ 140 mmHg and/or diastolic blood pressure (DBP) ≥ 90 mmHg on three consecutive standardized measurements, or prior diagnosis;
diabetes mellitus: fasting plasma glucose (FPG) ≥ 7.0 mmol/L or prior diagnosis;
hyperlipidemia: total cholesterol ≥ 240 mg/dL (6.2 mmol/L), LDL-C ≥ 160 mg/dL (4.1 mmol/L), HDL-C < 40 mg/dL (1.0 mmol/L), or triglycerides ≥ 200 mg/dL (2.3 mmol/L).
(3) Family medical history: hypertension, diabetes mellitus, or hepatocellular carcinoma.
-
(1) Routine blood tests (BC-5390 CRP fully automated hematology analyzer): white blood cell (WBC), absolute neutrophil count (ANC), hemoglobin (Hb), platelet (PLT)
(2) Liver function biomarkers (Hitachi 7100 automated analyzer, Hitachi, Japan):aspartate aminotransferase (AST), alanine aminotransferase (ALT), gamma-glutamyl transferase (GGT), alkaline phosphatase (ALP), cholinesterase (CHE), total bilirubin (TBIL), direct bilirubin (DBIL), total bile acids (TBA), albumin (ALB).
(3) Metabolic profiles:lipid metabolism (Mindray BS-2000 automated biochemistry analyzer, Mindray, China): triglycerides (TG), total cholesterol (TC), lipoprotein(a) (Lp(a)), high-density lipoprotein cholesterol (HDL-C), low-density lipoprotein cholesterol (LDL-C), apolipoprotein A-I (ApoA-I), apolipoprotein B (ApoB).
Glucose metabolism (Mindray BS-2000 automated biochemistry analyzer, Mindray, China): fasting plasma glucose (FPG), glycated hemoglobin (HbA1c), glycated albumin (GA), fasting insulin (F-INS), C-peptide.
Renal function:uric acid (UA), urea (UREA), creatinine (CREA), homocysteine (HCY).
(4) Liver fibrosis biomarkers (LOOP HF-4 diagnostic system, LOOP Medical, China): laminin (LN), hyaluronic acid (HA), procollagen type III (PC-III), collagen type IV (C-IV).
(5) Alpha-fetoprotein (AFP) (microparticle chemiluminescence immunoassay, Abbott Laboratories, USA).
-
Participants fasted for ≥ 3 hours before examination, with avoidance of strenuous exercise and medications potentially affecting results. The procedure was performed in a standardized supine position, right arm fully abducted to maximize intercostal space accessibility. The probe was vertically positioned over hepatic segment VIII (between the mid-axillary and anterior axillary lines). Real-time B-mode ultrasound imaging (3.5 MHz transducer frequency) guided the exclusion of intrahepatic vessels > 3 mm in diameter and gallbladder structures, ensuring hepatic parenchymal thickness ≥ 6 cm at the measurement site. After stable skin contact (indicated by green pressure status), 10 consecutive valid measurements were acquired. Validity criteria included: 1. shear wave propagation time window fully covering the hepatic capsule; 2. single-measurement success rate ≥ 60%; 3. detection depth between 25–65 mm. The median value of 10 valid measurements was recorded as the liver stiffness measurement (LSM) in kilopascals (kPa).
-
Following informed consent, all participants underwent standardized ultrasound-guided liver biopsy with specimens required to be ≥ 1.0 cm in length (optimal range 1.5–2.5 cm). The biopsy samples were processed with serial sectioning and stained with hematoxylin-eosin, reticulin fiber, and/or Masson trichrome for comprehensive histopathological assessment using the SAF (Steatosis-Activity-Fibrosis) scoring system. This validated scoring method evaluates: (1) Steatosis (S0-S3) based on percentage of affected hepatocytes (S0: < 5%; S1: 5%–33%; S2: 33%–66%; S3: ≥ 66%); (2) Activity grade (A0-A3) incorporating both lobular inflammation and hepatocyte ballooning degeneration (A0: absent; A1: mild focal changes; A2: moderate distinct changes; A3: severe marked changes); and (3) Fibrosis stage (F0-F4) according to architectural distortion (F0: no fibrosis; F1: portal fibrosis only; F2: periportal fibrosis; F3: bridging fibrosis; F4: cirrhosis). The standardized SAF scoring system thus provides a multidimensional histological assessment of MASLD severity through quantitative evaluation of these three key pathological features.
-
Significant inflammation and/or fibrosis group: activity grade (A) ≥ 3 and/or fibrosis stage (F) ≥ 3 (n = 131).
No significant inflammation and fibrosis group: concurrently met criteria of A < 3 and F < 3 (n = 284) (Figure 1).
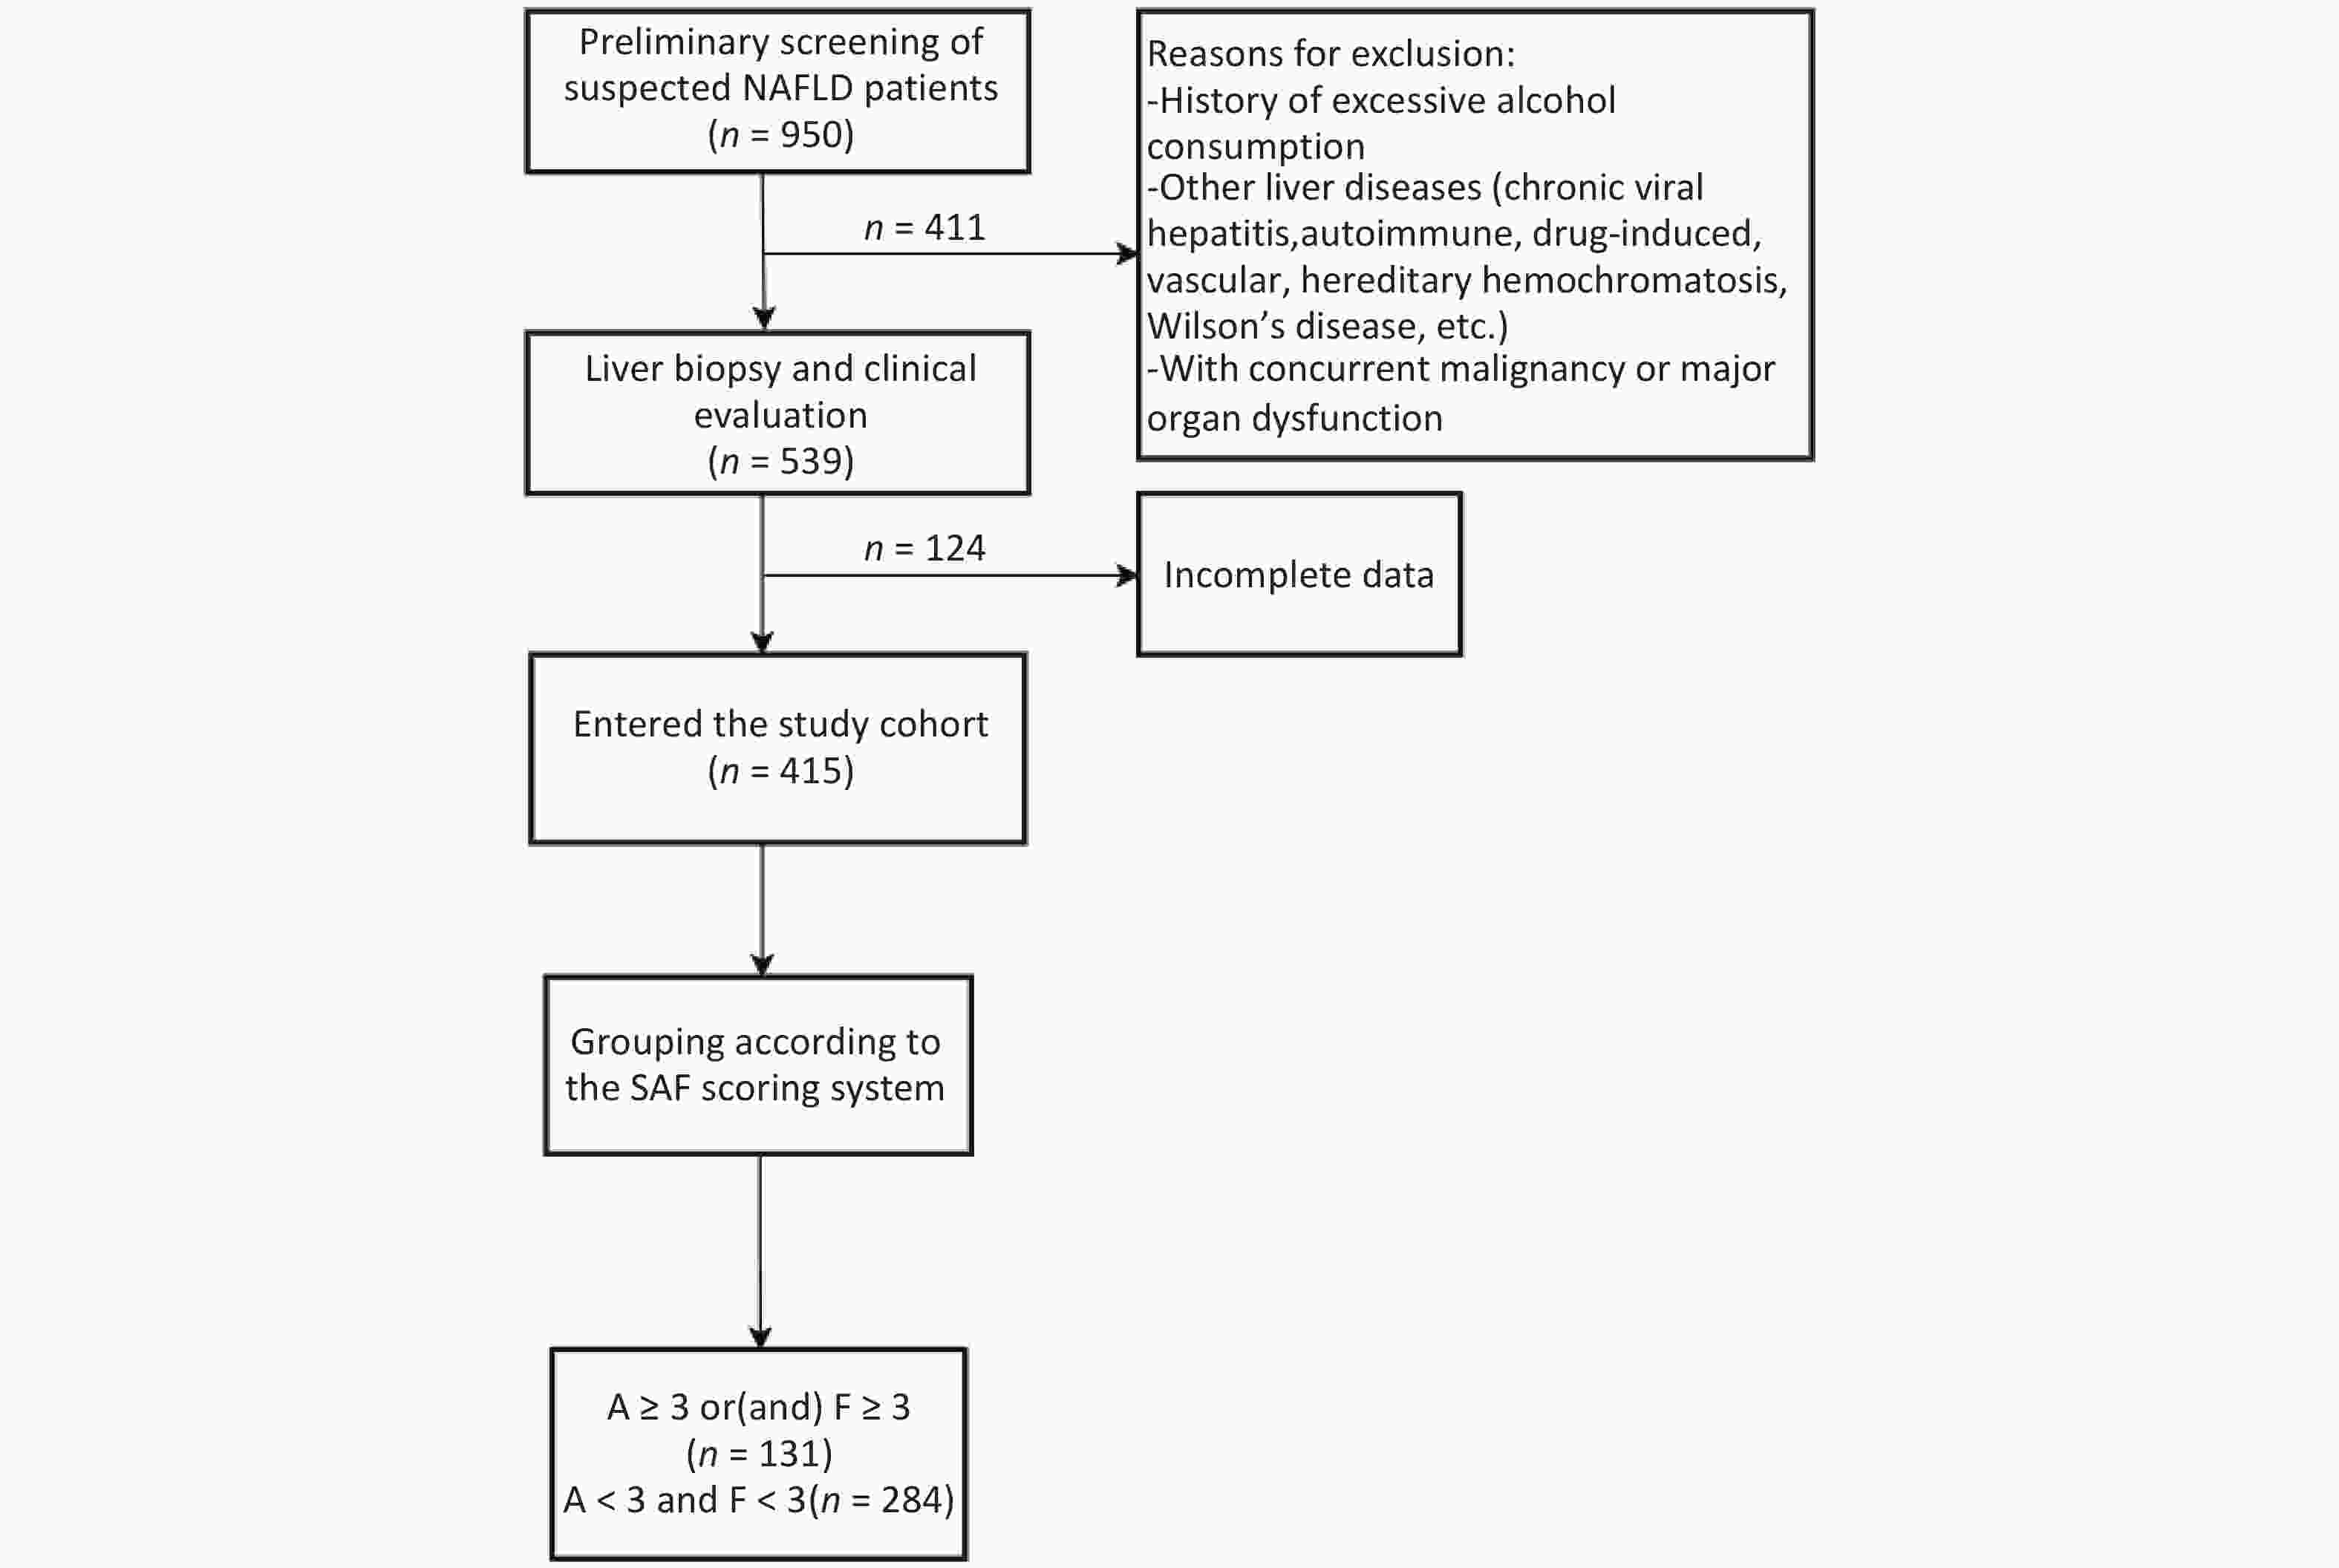
Figure 1. Flowchart of patient enrollment
The SAF scoring system’s Activity (A) component comprehensively reflects core pathological features (lobular inflammation and hepatocyte ballooning), while Fibrosis (F) serves as the critical driver of cirrhosis progression and the most significant prognostic predictor. Defining A ≥ 3 (moderate-to-severe activity) or F ≥ 3 (bridging fibrosis) as “significant lesions” carries well-established clinical prognostic value. International consensus studies confirm that both A ≥ 3 and F ≥ 3 are independent risk factors for predicting liver-related and all-cause mortality in MASLD patients[24]. Specifically, F ≥ 3 marks the accelerated fibrotic progression phase, significantly increasing risks of cirrhosis, hepatic decompensation, and hepatocellular carcinoma[25]. Similarly, A ≥ 3-level inflammatory injury represents the core driver of fibrotic advancement.Therefore, classifying patients meeting either or both high-risk criteria as the “significant lesion group” facilitates identification of high-risk individuals requiring urgent clinical intervention. This dichotomous approach aims to support risk stratification and clinical decision-making, without replacing the comprehensive pathological information provided by the complete SAF staging system.
-
Statistical analysis was conducted using IBM SPSS (version 23). Categorical data were presented as percentages and analyzed by χ2 test. Normally distributed continuous variables were expressed as mean ± SD and compared using t-tests, while non-normal data were shown as median (IQR) with Mann-Whitney U tests. Multiple group comparisons employed ANOVA or Kruskal-Wallis tests based on distribution. Significant variables (P < 0.05) from univariate analysis (Spearman’s correlation for continuous variables, χ2 for categorical) were entered into binary logistic regression to determine MASLD severity predictors, with the model identifying independent risk factors for disease progression. To evaluate the generalizability and potential overfitting of the developed binary logistic regression model, we performed internal validation using the Bootstrap method.
-
As presented in Table 1 and Figure, patients with significant inflammation/fibrosis exhibited significantly higher median BMI (29.4 kg/m2 [IQR: 27.7–30.4] vs 27.9 kg/m2 [24.9–29.7]; P < 0.001) and greater prevalence of high-fat diet (87.02% vs 72.18%; P = 0.001) compared to the non-significant lesion group. No statistically significant differences were observed in baseline characteristics including gender distribution, age, or prevalence of diabetes and hypertension (P > 0.05).
Table 1. Baseline characteristics of MASLD patients stratified by SAF score and histopathological phenotypes
project total (n = 415) A ≥ 3 or (and) F ≥ 3 (n = 131) A < 3 and F < 3(n = 284) P gender (male,%) 250 (60.24) 75 (57.25) 175 (61.62) 0.398 age (years) / 37 (27,53) 40 (30,51) 0.163 BMI (kg/m2) / 29.4 (27.7,30.4) 27.9 (24.9,29.7) 0.000 high-fat diet (%) 319 (76.87) 114 (87.02) 205 (72.18) 0.001 sedentary lifestyle (%) 398 (95.90) 127 (96.95) 271 (95.42) 0.467 diabetes (%) 73 (17.59) 24 (18.32) 49 (17.25) 0.791 hypertension (%) 66 (15.90) 24 (18.32) 42 (14.79) 0.361 hyperlipidemia (%) 215 (51.81) 75 (57.25) 140 (49.30) 0.132 family history of diabetes (%) 82 (19.76) 27 (20.61) 55 (19.37) 0.767 family history of hypertension (%) 85 (20.48) 33 (25.19) 52 (18.31) 0.106 family history of liver cancer (%) 14 (3.37) 3 (2.29) 11 (3.87) 0.406 Note. All tests were two-sided, with the significance level set at α = 0.05. 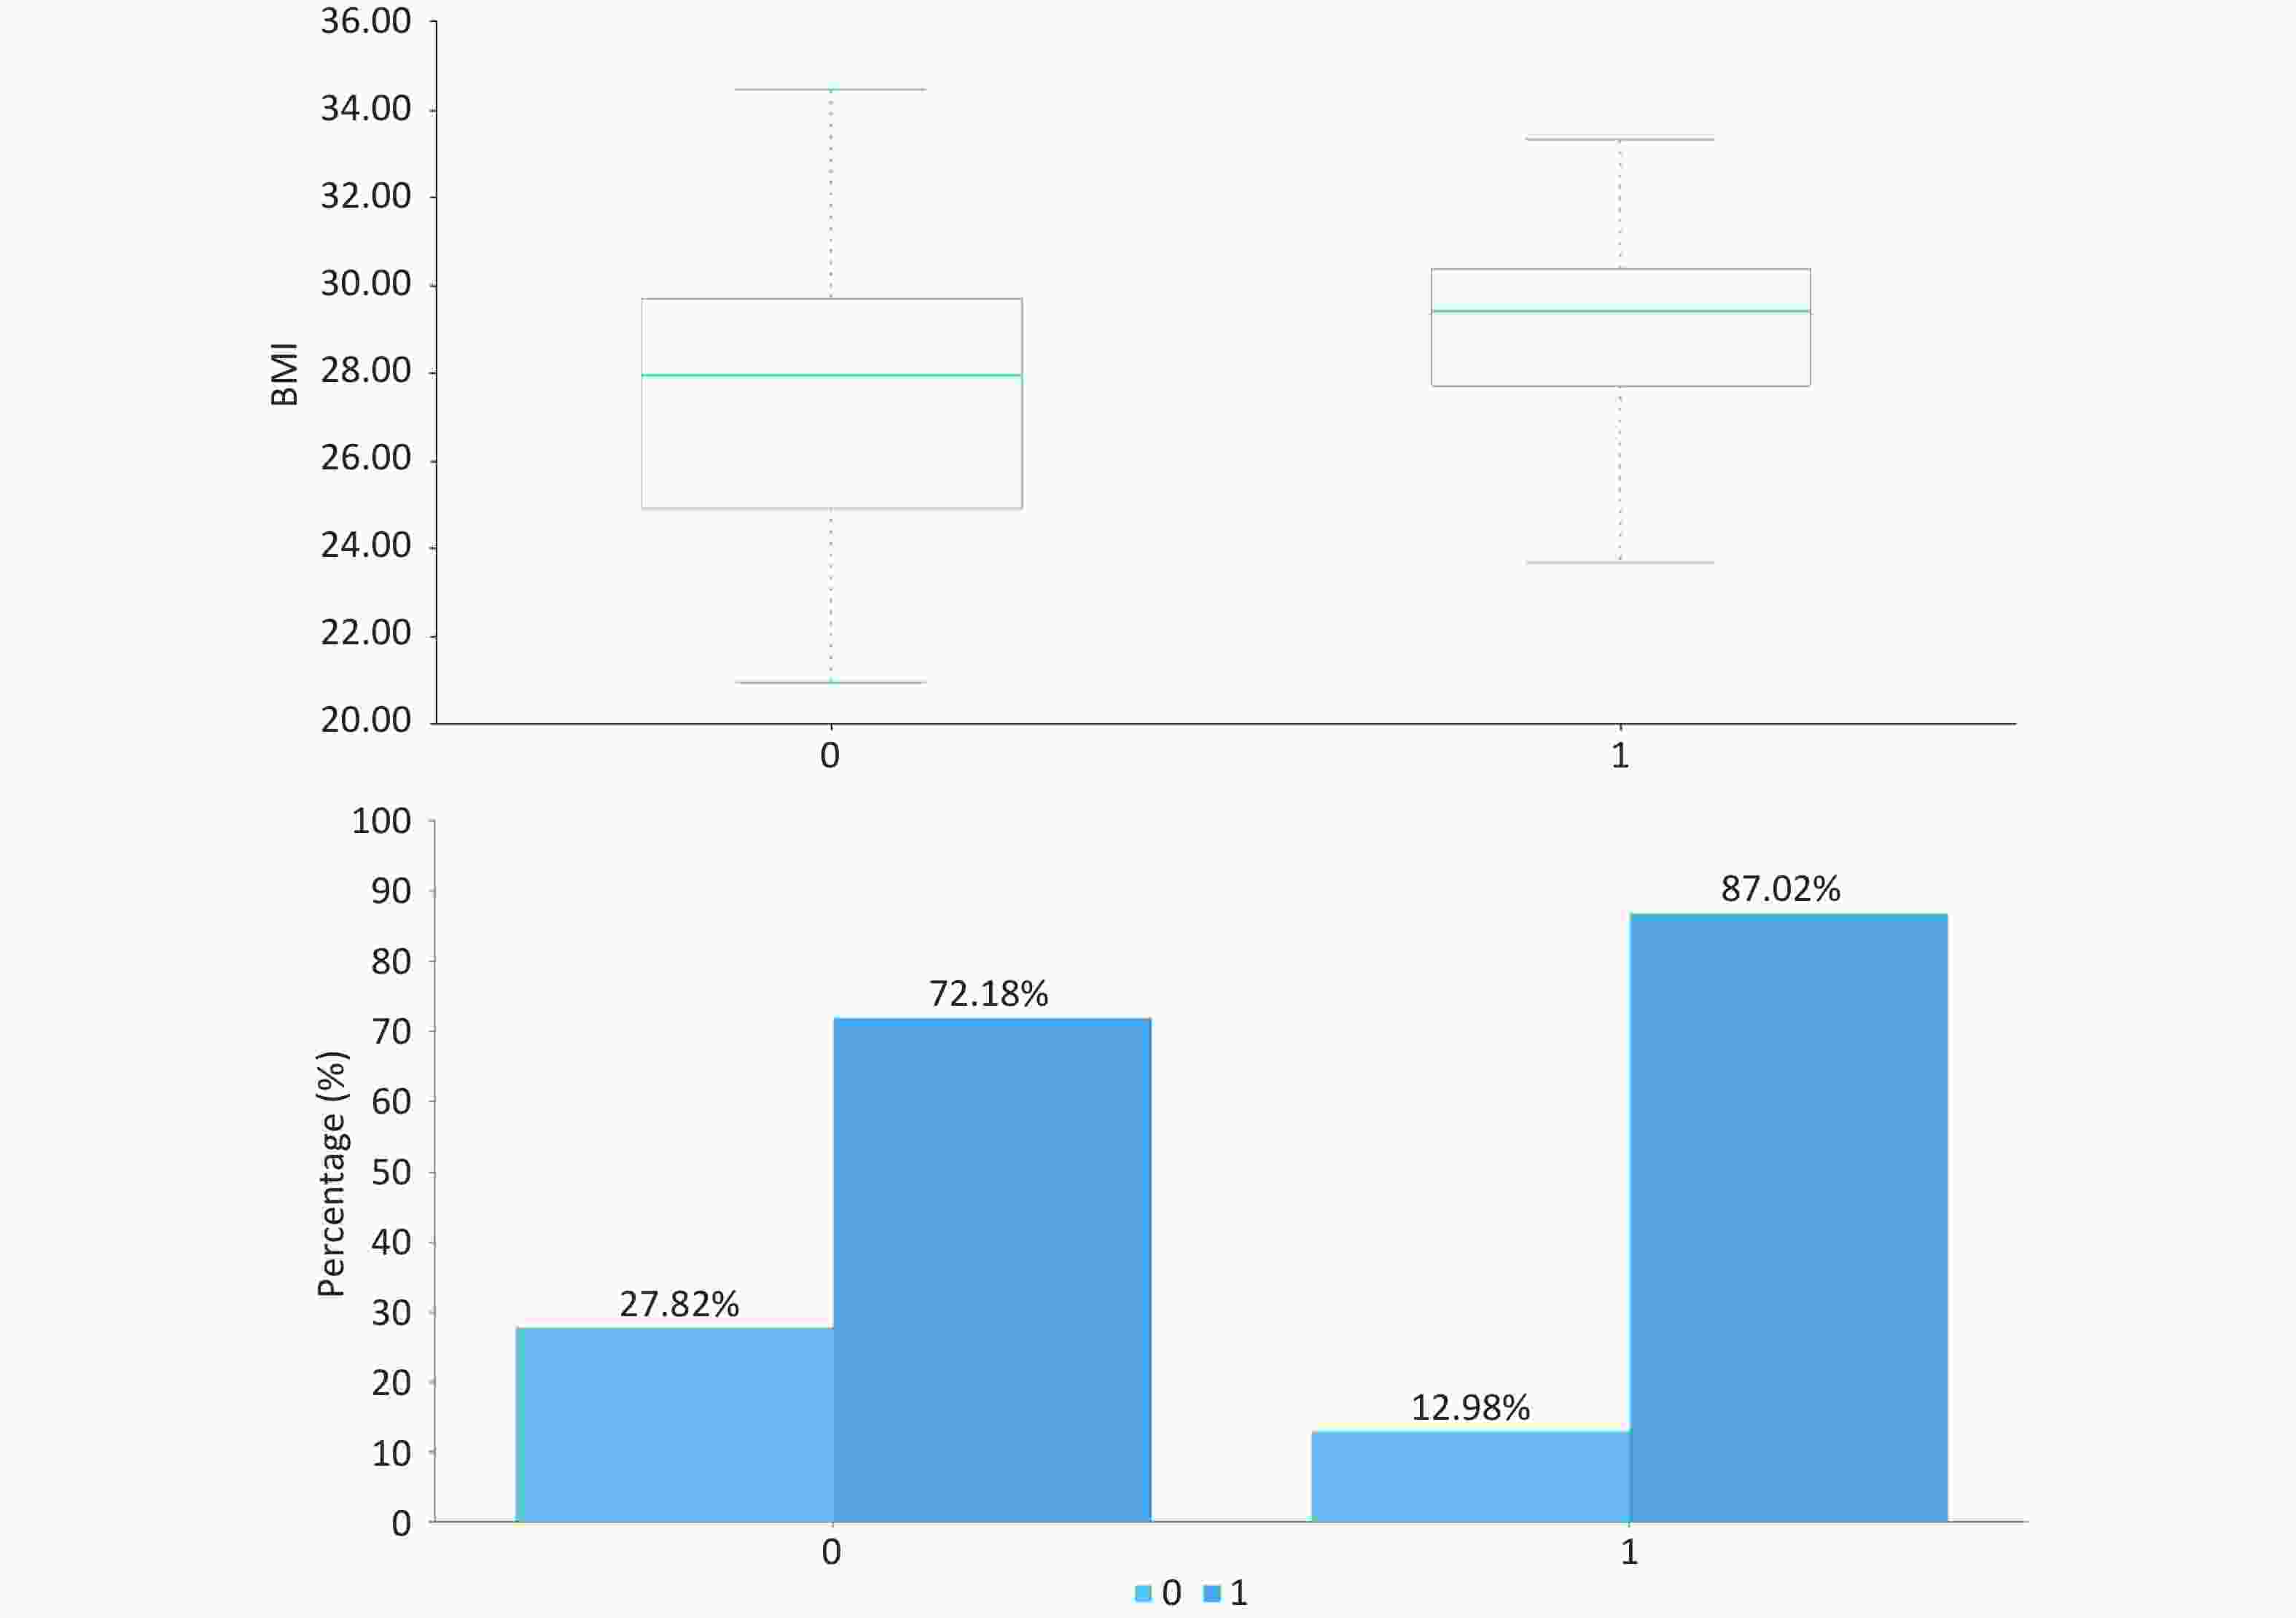
Figure 2. Comparison between the two groups in BMI and high-fat diet. “0” represents the group where A < 3 and F < 3, and “1” represents the group where A ≥ 3 or (and) F ≥ 3.
-
As demonstrated in Table 2, patients with significant inflammation/fibrosis (A ≥ 3 or F ≥ 3) exhibited markedly elevated levels of hepatic injury markers (AST 58 vs 39 U/L, P < 0.001; ALT 114 vs 75 U/L, P < 0.001), fibrosis indices (LSM 9.8 vs 6.8 kPa, P < 0.001; HA 75.7 vs 72.2 ng/mL, P = 0.028), metabolic parameters (total bile acids 5.8 vs 4.4 μmol/L, P = 0.007; uric acid 389 vs 358 μmol/L, P = 0.018), and hepatic steatosis (CAP 284 vs 258 dB/m, P < 0.001) compared to those without significant lesions (A < 3 and F < 3). Notably, inflammatory markers (WBC, ANC), lipid profiles, glucose metabolism parameters, and other fibrosis biomarkers showed no statistically significant differences between groups (P > 0.05).
Table 2. Laboratory and imaging results by MASLD severity and histopathology
project A ≥ 3 or(and) F ≥ 3 (n = 131) A < 3 and F < 3(n = 284) P WBC(*109/L) 6.2 (4.9,7.4) 6.1(5.1,7.0) 0.970 ANC(*109/L) 3.4 (2.7,4.2) 3.5(2.8,4.3) 0.353 Hb(g/L) 146 (135,158) 151 (136,163) 0.085 PLT(*109/L) 213 ± 65 212 ± 62 0.855 AST(U/L) 58 (40,97) 39 (27,66) 0.000 ALT(U/L) 114 (67,161) 75 (38,127) 0.000 GGT(U/L) 75 (49,122) 65 (34,116) 0.052 ALP(U/L) 77 (65,97) 80 (65,100) 0.697 CHE(U/L) 9,601 (8,190,11,016) 9,476.5 (8,250,10,933) 0.764 TBIL (umol/L) 12 (9.5,17) 12.9 (10,17) 0.369 DBIL (umol/L) 4 (3.1,5.4) 4.3 (3.0,5.8) 0.383 TBA (umol/L) 5.8 (3.1,9.4) 4.4 (2.7,7.0) 0.007 ALB(g/L) 46 (43,48) 46 (43.3,48.9) 0.697 TG (mmol/L) 1.7 (1.2,2.5) 1.7 (1.3,2.6) 0.447 TC (mmol/L) 4.8 (4.1,5.6) 4.7 (4.3,5.6) 0.919 Lp(a)(mg/dl) 6.7 (3.7,21.5) 7.6 (3.8,15.4) 0.936 HDL (mmol/L) 1.03 (0.9,1.2) 1.04 (0.9,1.2) 0.943 LDL (mmol/L) 2.95 (2.1,3.4) 2.79 (2.3,3.4) 0.828 ApoA-I(g/L) 1.33 (1.2,1.5) 1.31 (1.1,1.5) 0.370 ApoB(g/L) 0.91 (0.7,1.1) 0.89 (0.7,1.1) 0.762 FPG (mmol/L) 5.82 (5.5,6.8) 5.79 (5.3,6.5) 0.093 HbA1c (%) 5.5 (4.8,6.5) 5.4 (4.9,6.1) 0.236 GA (%) 12.9 (11.3,15.2) 12.7 (11.3,15.3) 0.542 F-INS (mU/L) 13.8 (7.8,18.6) 14 (6.7,18.3) 0.421 C-peptide(ng/mL) 3.8 (3.1,4.9) 3.6 (2.9,4.8) 0.337 UA (umol/L) 389 (308,469) 358 (291,435) 0.018 UREA (umol/L) 4.5 (3.7,5.5) 4.7 (4.1,5.5) 0.076 CREA (umol/L) 64 (53,73) 64 (54,75) 0.249 HCY (umol/L) 12.1 (8.9,16.9) 12 (8.9,15.9) 0.672 LN (ng/L) 85.1 (69.7,112.4) 84.0 (65.5,112.0) 0.401 HA (ng/mL) 75.7 (66.5,92.2) 72.2 (60.5,88.2) 0.028 PC-III (ng/L) 18.4 (12.5,38.1) 16.8 (12.0,32.2) 0.108 C-IV (ng/L) 68.3 (56.4,81.6) 67.3 (56.0,82.4) 0.493 AFP (ng/ml) 3.2 (2.4,5.8) 3.2 (2.2,5.1) 0.268 CAP (dB/m) 284 (255,312) 258 (211,287) 0.000 LSM (kPa) 9.8 (6.8,15.9) 6.8 (5.6,8.7) 0.000 Note. All continuous variables underwent Shapiro-Wilk normality testing (only PLT met assumptions for normal distribution and equal variance). Data are presented as median (IQR) with non-parametric tests for non-normal variables, and mean ± SD with t-test for PLT. A two-tailed α level of 0.05 was applied for all analyses. WBC: white blood cell; ANC: absolute neutrophil; Hb: hemoglobin; PLT: platelet; AST: aspartate aminotransferase ; ALT: alanine aminotransferase; GGT: gamma-glutamyl transferase; ALP: alkaline phosphatase; CHE: cholinesterase; TBIL: total bilirubin; DBIL: direct bilirubin; TBA: total bile acids; ALB: albumin; TG: triglycerides; TC: total cholesterol; Lp(a): Lipoprotein(a); HDL-C: high-density lipoprotein cholesterol; LDL-C: low-density lipoprotein cholesterol; ApoA-I: apolipoprotein A-I; ApoB: apolipoprotein B; FPG: fasting plasma glucose; HbA1c: glycated hemoglobin; GA: glycated albumin; F-INS: fasting insulin; UA: uric acid; UREA: urea; CREA: creatinine; HCY: homocysteine; LN: laminin; HA: hyaluronic acid; PC-III: procollagen type III; C-IV: collagen type IV; AFP: alpha-fetoprotein; CAP: controlled attenuation parameter; LSM: liver stiffness measurement -
To identify risk factors for liver fibrosis progression, we performed binary logistic regression analysis incorporating high-fat diet, BMI, ALT, AST, total bile acids, hyaluronic acid (HA), uric acid, liver stiffness measurement (LSM), and controlled attenuation parameter (CAP) as independent variables, with significant inflammation/fibrosis (A ≥ 3 and/or F ≥ 3, coded as 1) as the dependent variable. The final model (n = 415) retained four significant predictors: BMI, uric acid, LSM, and CAP (χ2 = 74.548, P < 0.001; AIC = 453.004, BIC = 473.145), demonstrating good predictive accuracy (75.18%) and fit (Hosmer-Lemeshow χ2 = 7.704, P = 0.463). The regression equation ln(p/1-p) = -8.825 + 0.168 × BMI + 0.003 × uric acid + 0.099 × LSM + 0.005 × CAP revealed that each unit increase in BMI (OR = 1.182, 95% CI: 1.112–1.257), uric acid (OR = 1.003, 95% CI: 1.001–1.005), CAP (OR = 1.005, 95% CI: 1.002–1.008), and LSM (OR = 1.104, 95% CI: 1.068–1.141) independently predicted increased fibrosis risk, highlighting the combined impact of metabolic factors (BMI, uric acid) and hepatic parameters (steatosis, stiffness) on MASLD progression.
Table 3. Binary logistic regression analysis of risk factors associated with MASLD severity
Variable β Wald χ2 P OR OR (95% CI) BMI 0.168 11.673 0.001 1.182 1.074 ~ 1.302 UA 0.003 5.47 0.019 1.003 1.000 ~ 1.005 CAP 0.005 4.551 0.033 1.005 1.000 ~ 1.010 LSM 0.099 20.553 0 1.104 1.058 ~ 1.153 Intercept −8.825 37.673 Note. BMI: body mass index; UA: uric acid; CAP: controlled attenuation parameter; LSM: liver stiffness measurement; OR: odds ratio; CI: confidence interval 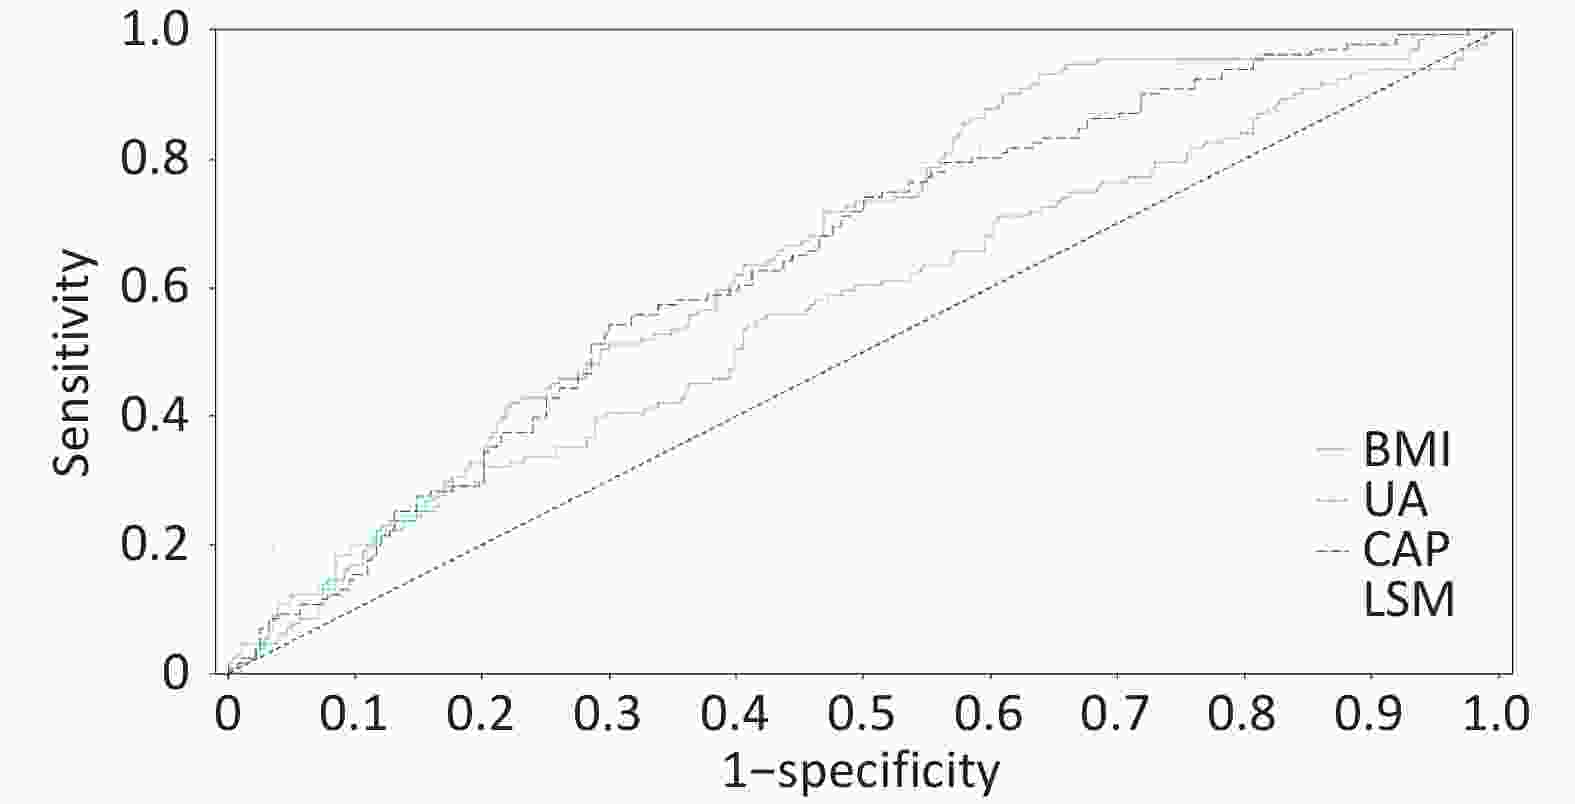
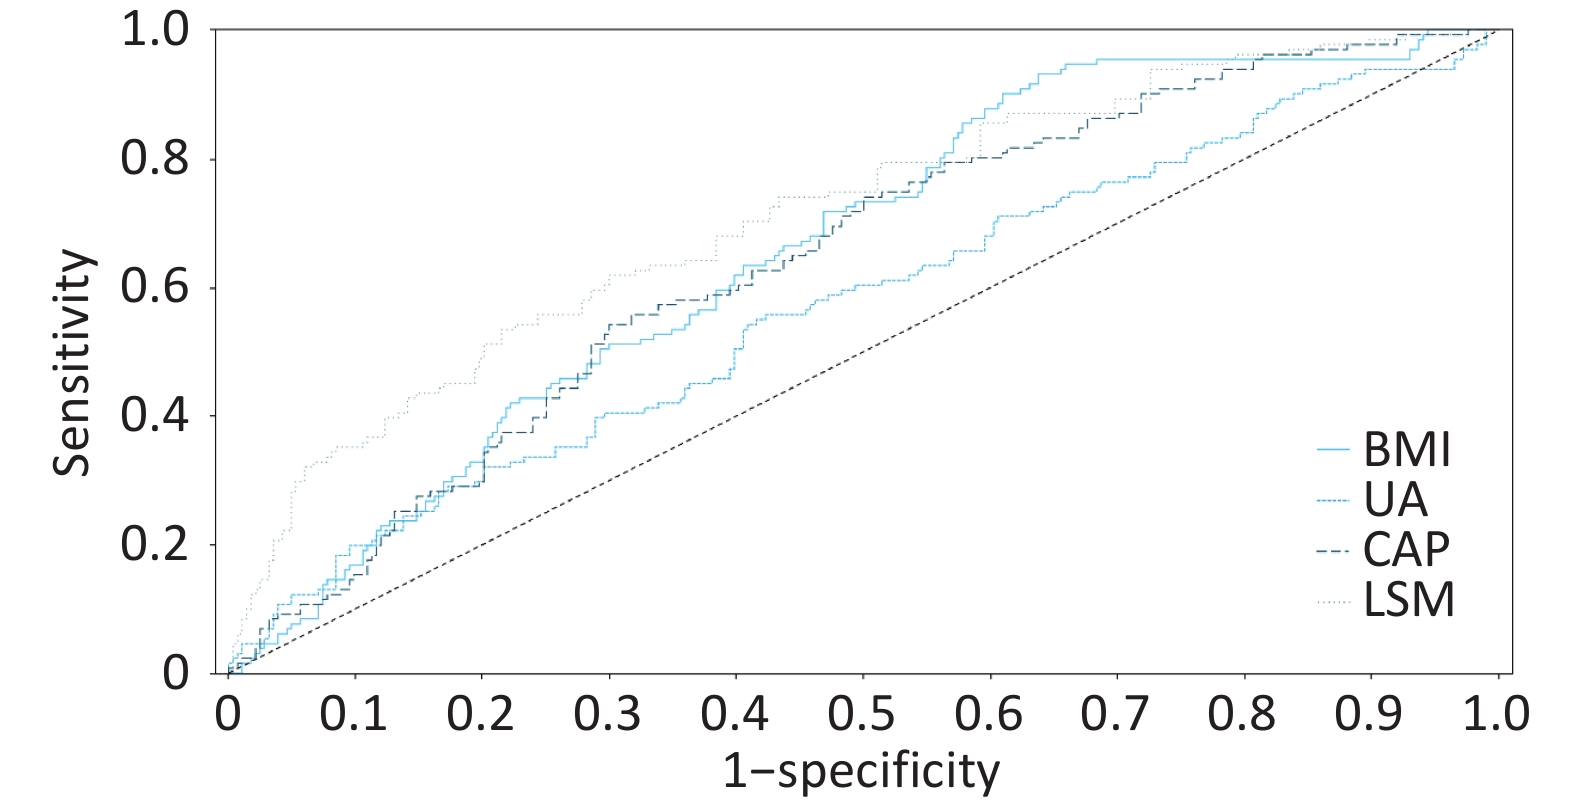
Figure 3. ROC curve of the four-factor model for predicting significant lesions in MASLD. Receiver operating characteristic curve of the four-factor prediction model (BMI, uric acid, CAP, LSM) for significant histologic lesions (A ≥ 3 or F ≥ 3) in MASLD patients. Area under the curve (AUC) = 0.7518 (95% confidence interval: 0.702–0.802). The dashed line represents the reference line (AUC = 0.5).
-
In our cohort, elevated BMI emerged as the strongest independent predictor of significant histologic lesions (OR = 1.182), consistent with its established role in promoting hepatic steatosis and inflammation through adipose-derived lipotoxicity and cytokine release[26,27].This process activates the JNK pathway, inducing endoplasmic reticulum stress and promoting cytotoxic lipid metabolites like ceramide[28]. Critically, adipose-derived proinflammatory cytokines (e.g., TNF-α, IL-6) upregulate hepatocyte ICAM-1 via the TLR4/NF-κB pathway, facilitating leukocyte infiltration and Kupffer cell-derived TGF-β1 release, which triggers hepatic stellate cell (HSC) transdifferentiation into myofibroblasts[27]. A longitudinal study using the aspartate aminotransferase-to-platelet ratio index (APRI) confirmed that obesity independently correlates with progression from low to intermediate/high-risk fibrosis stages[29]. Emerging evidence highlights that metabolically healthy obese (MHO) individuals, despite their preserved metabolic profile, demonstrate significantly elevated hepatic fat content compared to non-obese counterparts (P < 0.01). Importantly, epidemiological studies reveal a hierarchical MASLD prevalence pattern: MHO (38.7%) > MUHO (32.1%) > MHNO (12.4%) > MUHNO (9.8%)[30,31] , with adjusted OR = 2.31 (95% CI: 1.72–3.11) for MHO versus MHNO. These robust clinical observations substantiate the fundamental premise of the adipose-liver axis theory, which posits that obesity-driven adipocyte dysfunction independently contributes to hepatic steatosis through endocrine signaling pathways, irrespective of conventional metabolic parameters. Similarly, hyperuricemia (serum uric acid, OR = 1.003) likely contributes to hepatocellular injury via oxidative stress and NLRP3 inflammasome activation, a mechanism supported by interventional studies showing that uric acid-lowering therapy can reduce hepatic steatosis. Our findings underscore the intertwined roles of adiposity and uric acid metabolism in driving MASLD severity. UA modulates metabolic phenotype-MASLD associations, amplifying MASLD risk in MHO, metabolically unhealthy normal weight (MUNW), and MUHO subgroups among hyperuricemic individuals[32]. Mechanistically, urate crystals phagocytosed by hepatocytes activate the NLRP3 inflammasome, driving caspase-1-mediated IL-1β maturation and CXCL1-dependent neutrophil recruitment. UA also suppresses AMPKα Thr172 phosphorylation, impairing fatty acid oxidation while increasing intrahepatic urate accumulation via URAT1 transporters, establishing a "UA-oxidative stress" vicious cycle via ROS/JNK/AP-1 signaling[33]. A nutr metab cardiovasc dis study identified UA as an independent predictor of MASLD risk and all-cause mortality[34,35]. Both preclinical and clinical studies have demonstrated the therapeutic potential of allopurinol for MASLD. Animal experiments using db/db mice showed that allopurinol intervention significantly reduced hepatic inflammation scores (P < 0.05)[36]. This finding was corroborated by human clinical trials where MASLD patients receiving allopurinol treatment (100 mg/day for 3 months) exhibited significant improvements in hepatic steatosis, as evidenced by a marked reduction in CAP scores from 342 (267–400) dB/m at baseline to 304.5 (233–400) dB/m post-treatment (P = 0.009)[37]. These consistent results across species suggest that uric acid-lowering therapy may represent a promising approach for MASLD management by targeting both inflammatory pathways and hepatic fat accumulation.
Based on current evidence, a stepwise clinical management strategy should be implemented. For patients with BMI ≥ 25 kg/m2, the primary goal is achieving ≥ 7% weight reduction through a low-calorie diet (500 kcal daily deficit) and resistance exercise (150 minutes weekly), with consideration of GLP-1 receptor agonist adjunct therapy when necessary[38]. For patients with concurrent hyperuricemia (UA ≥ 420 μmol/L), high-purine dietary restriction is recommended along with first-line allopurinol treatment (100 mg/day), switching to febuxostat in cases of renal insufficiency, with a treatment target of UA < 360 μmol/L. For those with comorbid T2DM, SGLT2 inhibitors with additional uric acid-lowering effects may be preferentially selected[39].
The CAP demonstrates predictive value (OR = 1.005) for hepatic steatosis through its sensitivity to lipotoxic injury[40]. Our study observed a median CAP of 284 dB/m in the significant pathology group, significantly higher than the non-significant group (258 dB/m), aligning with findings from the European multicenter LITMUS consortium (Liver Investigation: Testing Marker Utility in Steatohepatitis)[41]. LSM, with robust predictive validity (OR = 1.104), showed a median value of 9.8 kPa in the significant pathology group, consistent with the high-risk threshold proposed by EASL guidelines[42]. Notably, LSM-VCTE (vibration-controlled transient elastography) exhibited superior diagnostic performance for advanced fibrosis (AUROC = 0.85) compared to FIB-4 (AUROC = 0.76) and NFS (AUROC = 0.73)[43]. However, limitations of combined CAP/LSM application require vigilance: LSM values may be falsely elevated in patients with severe inflammation or cholestasis, while CAP demonstrates limited discriminative capacity for moderate steatosis (S1-S2).
The current study found no significant differences in glucose and lipid metabolic parameters between the two groups, a phenomenon that may reflect two critical issues: early-stage MASLD patients often maintain glycemic stability through hyperinsulinemia until β-cell dysfunction leads to overt metabolic abnormalities; and lean MASLD patients (BMI < 23 kg/m2) characteristically exhibit reduced insulin sensitivity while paradoxically demonstrating “normalized” lipid profiles[44]. These findings suggest that reliance solely on conventional metabolic indicators may fail to identify high-risk populations. This study found no significant differences in conventional glucose and lipid profiles between the two groups, despite their marked histological differences. This seemingly paradoxical finding may reveal early metabolic compensation mechanisms and population heterogeneity in MASLD progression. Firstly, in the early stages of the disease, pancreatic β-cells can maintain normal glucose levels through compensatory hyperinsulinemia until decompensation occurs, leading to elevated HbA1c or FPG[45]. Secondly, this phenomenon highlights the existence of a distinct phenotype, “lean MASLD”. These patients, despite having a normal BMI, are driven by characteristic visceral adiposity and severe insulin resistance, while their conventional lipid profiles may appear “falsely normalized”[46]. Our findings underscore that the possibility of significant MASLD pathology cannot be ruled out solely based on normal routine metabolic parameters. High vigilance should be maintained for patients with mildly elevated serum aminotransferases but "normal" metabolic indices, especially lean individuals. While this study systematically collected metabolic, imaging, and biochemical indices, several important confounding factors were not accounted for, including genetic background (e.g., PNPLA3, TM6SF2, MBOAT7 polymorphisms), insulin resistance indices (e.g., HOMA-IR), dietary quality, physical activity intensity, and minimal alcohol consumption[47-50]. These factors have been confirmed to be closely associated with the onset and progression of MASLD. For instance, carriers of the PNPLA3 rs738409 G allele not only have an increased risk of hepatic steatosis but also exhibit accelerated fibrosis progression[51]. Furthermore, HOMA-IR remains an independent predictor of fibrosis progression even in lean MASLD patients[52]. We acknowledge that these unmeasured variables may lead to residual confounding, potentially affecting the accuracy of risk factor estimations. Future research should integrate genomics, lifestyle questionnaires, and continuous glucose monitoring data to construct a more comprehensive risk assessment framework.
The BMI-UA-CAP-LSM four-factor model established in this study provides a novel tool for non-invasive risk stratification. Its clinical utility lies in screening high-risk populations requiring liver biopsy evaluation when meeting ≥ 2 criteria: BMI ≥ 28 kg/m2, UA ≥ 420 μmol/L (male) or ≥ 360 μmol/L (female), CAP ≥ 280 dB/m, LSM ≥ 8.0 kPa. The four-factor prediction model (BMI-UA-CAP-LSM) demonstrated moderate discriminative ability (AUC 75.18%) in the training cohort. To assess overfitting risk, we performed internal validation via bootstrapping (1,000 resamples), yielding a corrected AUC of 73.45%, indicating good model robustness. However, we fully acknowledge that external validation in an independent, multicenter prospective cohort is essential before widespread application. Concurrently, we recognize that CAP and LSM measurements depend on Fibro Scan, which may not be universally available in primary care settings. To enhance the model's generalizability, we conducted an exploratory analysis: constructing an alternative model using widely available serological markers. Incorporating FIB-4, AST to Platelet Ratio Index (APRI), and significant serum markers from this study, the new model achieved an AUC of 70.12%. Although its discriminative performance is slightly lower than the original model, this serology-based model is more accessible in resource-limited settings, providing a valuable alternative for screening strategies across different healthcare tiers[53,54]. A key future direction will be the simultaneous validation of this four-factor model and the serological model in prospective cohorts, with the aim of recommending appropriate tools for specific clinical scenarios.
-
Using the SAF pathological scoring system, this study confirmed that BMI, hyperuricemia, CAP, and LSM are independent risk factors for MASLD progression to significant inflammation/fibrosis. However, several important limitations should be noted. This study employed the SAF scoring system to dichotomize patients into either the “significant lesion group” (A ≥ 3 or F ≥ 3) or “non-significant lesion group” (A < 3 and F < 3). While this stratification strategy provides clinical utility, it inherently compromises granularity in fibrosis staging - particularly by grouping F2 patients (who still carry progression risk) into the non-significant category. Future investigations exploring continuous SAF scoring or multi-category classification models may yield more nuanced risk stratification. While oxidative stress is a recognized contributor to MASLD pathogenesis, the present study did not include serum oxidative stress biomarkers (e.g., malondialdehyde, superoxide dismutase) due to their limited routine clinical availability and standardization in our retrospective cohort. Future prospective studies should integrate such markers to elucidate their role alongside inflammatory and metabolic factors. As a single-center retrospective study, we only included patients who underwent liver biopsy between 2018–2022. These patients were typically referred due to persistently abnormal liver function tests or clinical suspicion of significant fibrosis, potentially leading to overrepresentation of more severe cases and introducing selection bias. Consequently, our study sample may not fully represent the general MASLD population in the community. All cases were sourced from a single tertiary referral center, which may limit the generalizability of our findings. Additionally, some variables relied on electronic medical records, which may contain incomplete information, non-standardized documentation or measurement errors, potentially introducing information bias. Furthermore, the study failed to incorporate key genetic susceptibility factors, precise insulin resistance indices, and comprehensive lifestyle data, which may result in residual confounding and affect accurate estimation of independent risk factors.
Future studies should validate this model in multicenter, prospective, multi-ethnic cohorts and integrate novel biomarkers such as genetic and microbiome data to improve prediction accuracy and personalized prevention capabilities.
doi: 10.3967/bes2026.009
Histopathological Assessment Using SAF scoring: Investigating Risk Factor Correlations with Disease Severity in MASLD Patients
-
Abstract:
Objective To investigate risk factors associated with significant histologic lesions in metabolic dysfunction-associated steatotic liver disease (MASLD) using the SAF (Steatosis, Activity, Fibrosis) scoring system and to develop a risk prediction model. Methods In this retrospective cohort of 415 biopsy-proven MASLD patients (2018–2022), participants were stratified into significant lesion (SAF activity grade ≥ 3 and/or fibrosis stage ≥ 3, n = 131) and non-significant lesion (activity < 3 and fibrosis < 3, n = 284) groups. Demographic, laboratory, and imaging parameters including platelet count (PLT), aspartate aminotransferase (AST), alanine aminotransferase (ALT), gamma-glutamyl transferase (GGT), alkaline phosphatase (ALP), total bilirubin (TBIL), direct bilirubin (DBIL), total bile acids (TBA), triglycerides (TG), total cholesterol (TC), fasting plasma glucose (FPG), uric acid (UA), laminin (LN), hyaluronic acid (HA), procollagen type III (PC-III), collagen type IV (C-IV), controlled attenuation parameter (CAP), and liver stiffness measurement (LSM) were analyzed. Results Patients with significant lesions had higher body mass index (BMI), proportion of high-fat diet, AST, ALT, TBA, UA, CAP, and LSM (all P < 0.05). Multivariate logistic regression identified BMI (OR = 1.182), UA (OR = 1.003), CAP (OR = 1.005), and LSM (OR = 1.104) as independent predictors of significant histologic lesions, with a model area under the curve of 75.18%. Conclusion BMI, hyperuricemia, hepatic steatosis (CAP), and fibrosis (LSM) are independent risk factors for advanced MASLD. A combined non-invasive assessment may enhance risk stratification in clinical practice. -
Key words:
- MASLD /
- SAF score /
- liver fibrosis /
- BMI /
- uric acid /
- CAP /
- LSM /
- risk prediction
The authors declare that there are no conflicts of interest.
&These authors contributed equally to this work.
注释:1) Authors’ Contributions: 2) Competing Interests: -
Figure 2. Comparison between the two groups in BMI and high-fat diet. “0” represents the group where A < 3 and F < 3, and “1” represents the group where A ≥ 3 or (and) F ≥ 3.
Figure 3. ROC curve of the four-factor model for predicting significant lesions in MASLD. Receiver operating characteristic curve of the four-factor prediction model (BMI, uric acid, CAP, LSM) for significant histologic lesions (A ≥ 3 or F ≥ 3) in MASLD patients. Area under the curve (AUC) = 0.7518 (95% confidence interval: 0.702–0.802). The dashed line represents the reference line (AUC = 0.5).
Table 1. Baseline characteristics of MASLD patients stratified by SAF score and histopathological phenotypes
project total (n = 415) A ≥ 3 or (and) F ≥ 3 (n = 131) A < 3 and F < 3(n = 284) P gender (male,%) 250 (60.24) 75 (57.25) 175 (61.62) 0.398 age (years) / 37 (27,53) 40 (30,51) 0.163 BMI (kg/m2) / 29.4 (27.7,30.4) 27.9 (24.9,29.7) 0.000 high-fat diet (%) 319 (76.87) 114 (87.02) 205 (72.18) 0.001 sedentary lifestyle (%) 398 (95.90) 127 (96.95) 271 (95.42) 0.467 diabetes (%) 73 (17.59) 24 (18.32) 49 (17.25) 0.791 hypertension (%) 66 (15.90) 24 (18.32) 42 (14.79) 0.361 hyperlipidemia (%) 215 (51.81) 75 (57.25) 140 (49.30) 0.132 family history of diabetes (%) 82 (19.76) 27 (20.61) 55 (19.37) 0.767 family history of hypertension (%) 85 (20.48) 33 (25.19) 52 (18.31) 0.106 family history of liver cancer (%) 14 (3.37) 3 (2.29) 11 (3.87) 0.406 Note. All tests were two-sided, with the significance level set at α = 0.05.  下载: 导出CSV
Table 2. Laboratory and imaging results by MASLD severity and histopathology
project A ≥ 3 or(and) F ≥ 3 (n = 131) A < 3 and F < 3(n = 284) P WBC(*109/L) 6.2 (4.9,7.4) 6.1(5.1,7.0) 0.970 ANC(*109/L) 3.4 (2.7,4.2) 3.5(2.8,4.3) 0.353 Hb(g/L) 146 (135,158) 151 (136,163) 0.085 PLT(*109/L) 213 ± 65 212 ± 62 0.855 AST(U/L) 58 (40,97) 39 (27,66) 0.000 ALT(U/L) 114 (67,161) 75 (38,127) 0.000 GGT(U/L) 75 (49,122) 65 (34,116) 0.052 ALP(U/L) 77 (65,97) 80 (65,100) 0.697 CHE(U/L) 9,601 (8,190,11,016) 9,476.5 (8,250,10,933) 0.764 TBIL (umol/L) 12 (9.5,17) 12.9 (10,17) 0.369 DBIL (umol/L) 4 (3.1,5.4) 4.3 (3.0,5.8) 0.383 TBA (umol/L) 5.8 (3.1,9.4) 4.4 (2.7,7.0) 0.007 ALB(g/L) 46 (43,48) 46 (43.3,48.9) 0.697 TG (mmol/L) 1.7 (1.2,2.5) 1.7 (1.3,2.6) 0.447 TC (mmol/L) 4.8 (4.1,5.6) 4.7 (4.3,5.6) 0.919 Lp(a)(mg/dl) 6.7 (3.7,21.5) 7.6 (3.8,15.4) 0.936 HDL (mmol/L) 1.03 (0.9,1.2) 1.04 (0.9,1.2) 0.943 LDL (mmol/L) 2.95 (2.1,3.4) 2.79 (2.3,3.4) 0.828 ApoA-I(g/L) 1.33 (1.2,1.5) 1.31 (1.1,1.5) 0.370 ApoB(g/L) 0.91 (0.7,1.1) 0.89 (0.7,1.1) 0.762 FPG (mmol/L) 5.82 (5.5,6.8) 5.79 (5.3,6.5) 0.093 HbA1c (%) 5.5 (4.8,6.5) 5.4 (4.9,6.1) 0.236 GA (%) 12.9 (11.3,15.2) 12.7 (11.3,15.3) 0.542 F-INS (mU/L) 13.8 (7.8,18.6) 14 (6.7,18.3) 0.421 C-peptide(ng/mL) 3.8 (3.1,4.9) 3.6 (2.9,4.8) 0.337 UA (umol/L) 389 (308,469) 358 (291,435) 0.018 UREA (umol/L) 4.5 (3.7,5.5) 4.7 (4.1,5.5) 0.076 CREA (umol/L) 64 (53,73) 64 (54,75) 0.249 HCY (umol/L) 12.1 (8.9,16.9) 12 (8.9,15.9) 0.672 LN (ng/L) 85.1 (69.7,112.4) 84.0 (65.5,112.0) 0.401 HA (ng/mL) 75.7 (66.5,92.2) 72.2 (60.5,88.2) 0.028 PC-III (ng/L) 18.4 (12.5,38.1) 16.8 (12.0,32.2) 0.108 C-IV (ng/L) 68.3 (56.4,81.6) 67.3 (56.0,82.4) 0.493 AFP (ng/ml) 3.2 (2.4,5.8) 3.2 (2.2,5.1) 0.268 CAP (dB/m) 284 (255,312) 258 (211,287) 0.000 LSM (kPa) 9.8 (6.8,15.9) 6.8 (5.6,8.7) 0.000 Note. All continuous variables underwent Shapiro-Wilk normality testing (only PLT met assumptions for normal distribution and equal variance). Data are presented as median (IQR) with non-parametric tests for non-normal variables, and mean ± SD with t-test for PLT. A two-tailed α level of 0.05 was applied for all analyses. WBC: white blood cell; ANC: absolute neutrophil; Hb: hemoglobin; PLT: platelet; AST: aspartate aminotransferase ; ALT: alanine aminotransferase; GGT: gamma-glutamyl transferase; ALP: alkaline phosphatase; CHE: cholinesterase; TBIL: total bilirubin; DBIL: direct bilirubin; TBA: total bile acids; ALB: albumin; TG: triglycerides; TC: total cholesterol; Lp(a): Lipoprotein(a); HDL-C: high-density lipoprotein cholesterol; LDL-C: low-density lipoprotein cholesterol; ApoA-I: apolipoprotein A-I; ApoB: apolipoprotein B; FPG: fasting plasma glucose; HbA1c: glycated hemoglobin; GA: glycated albumin; F-INS: fasting insulin; UA: uric acid; UREA: urea; CREA: creatinine; HCY: homocysteine; LN: laminin; HA: hyaluronic acid; PC-III: procollagen type III; C-IV: collagen type IV; AFP: alpha-fetoprotein; CAP: controlled attenuation parameter; LSM: liver stiffness measurement
下载: 导出CSV
Table 3. Binary logistic regression analysis of risk factors associated with MASLD severity
Variable β Wald χ2 P OR OR (95% CI) BMI 0.168 11.673 0.001 1.182 1.074 ~ 1.302 UA 0.003 5.47 0.019 1.003 1.000 ~ 1.005 CAP 0.005 4.551 0.033 1.005 1.000 ~ 1.010 LSM 0.099 20.553 0 1.104 1.058 ~ 1.153 Intercept −8.825 37.673 Note. BMI: body mass index; UA: uric acid; CAP: controlled attenuation parameter; LSM: liver stiffness measurement; OR: odds ratio; CI: confidence interval
下载: 导出CSV
-
[1] Chalasani N, Younossi Z, Lavine JE, et al. The diagnosis and management of non-alcoholic fatty liver disease: practice Guideline by the American Association for the Study of Liver Diseases, American College of Gastroenterology, and the American Gastroenterological Association. Hepatology, 2012; 55, 2005−23. doi: 10.1002/hep.25762 [2] Miao L, Targher G, Byrne CD, et al. Current status and future trends of the global burden of MASLD. Trends Endocrinol Metab, 2024; 35, 697−707. doi: 10.1016/j.tem.2024.02.007 [3] Rinella ME, Lazarus JV, Ratziu V, et al. A multisociety Delphi consensus statement on new fatty liver disease nomenclature. Hepatology, 2023; 78, 1966−86. doi: 10.1097/HEP.0000000000000520 [4] Nasr P, Ignatova S, Kechagias S, et al. Natural history of nonalcoholic fatty liver disease: a prospective follow-up study with serial biopsies. Hepatol Commun, 2018; 2, 199−210. doi: 10.1002/hep4.1134 [5] Harrison SA, Bedossa P, Guy CD, et al. A phase 3, Randomized, controlled trial of resmetirom in NASH with liver fibrosis. N Engl J Med, 2024; 390, 497−509. doi: 10.1056/NEJMoa2309000 [6] Lee H, Lee YH, Kim SU, et al. Metabolic dysfunction-associated fatty liver disease and incident cardiovascular disease risk: a nationwide cohort study. Clin Gastroenterol Hepatol, 2021; 19, 2138-47. e10. [7] European Association for the Study of the Liver (EASL), European Association for the Study of Diabetes (EASD), European Association for the Study of Obesity (EASO). EASL-EASD-EASO Clinical Practice Guidelines on the management of metabolic dysfunction-associated steatotic liver disease (MASLD). J Hepatol, 2024; 81, 492−542. [8] Balci SB, Atak BM, Duman T, et al. A novel marker for prediabetic conditions: Uric acid-to-HDL cholesterol ratio. Bratisl Med J, 2024; 125, 145−8. doi: 10.4149/bll_2023_130 [9] Aktas G. Exploring the link: hemogram-derived markers in type 2 diabetes mellitus and its complications. World J Diabetes, 2025; 16, 105233. doi: 10.4239/wjd.v16.i7.105233 [10] Kosekli MA, Aktas G. The systemic immune inflammation index is a reliable and novel risk factor for metabolic dysfunction-associated fatty liver disease. Curr Med Res Opin, 2025; 41, 247−51. doi: 10.1080/03007995.2025.2463952 [11] Basaran E, Aktas G. Waist-to-height ratio as a novel marker of metabolic syndrome in patients with type 2 diabetes mellitus. Explor Endocr Metab Dis, 2025; 2, 101421. doi: 10.37349/eemd.2025.101421 [12] Bessone F, Razori MV, Roma MG. Molecular pathways of nonalcoholic fatty liver disease development and progression. Cell Mol Life Sci, 2019; 76, 99−128. doi: 10.1007/s00018-018-2947-0 [13] Galli A, Svegliati-Baroni G, Ceni E, et al. Oxidative stress stimulates proliferation and invasiveness of hepatic stellate cells via a MMP2-mediated mechanism. Hepatology, 2005; 41, 1074−84. [14] Stift J, Semmler G, Wöran K, et al. Comparison of the diagnostic quality of aspiration and core-biopsy needles for transjugular liver biopsy. Dig Liver Dis, 2020; 52, 1473−9. doi: 10.1016/j.dld.2020.08.028 [15] Neuberger J, Patel J, Caldwell H, et al. Guidelines on the use of liver biopsy in clinical practice from the British Society of Gastroenterology, the Royal College of Radiologists and the Royal College of Pathology. Gut, 2020; 69, 1382−403. doi: 10.1136/gutjnl-2020-321299 [16] Kjaergaard M, Lindvig KP, Thorhauge KH, et al. Using the ELF test, FIB-4 and NAFLD fibrosis score to screen the population for liver disease. J Hepatol, 2023; 79, 277−86. doi: 10.1016/j.jhep.2023.04.002 [17] Barr RG, Wilson SR, Rubens D, et al. Update to the society of radiologists in ultrasound liver elastography consensus statement. Radiology, 2020; 296, 263−74. doi: 10.1148/radiol.2020192437 [18] Hydes T, Brown E, Hamid A, et al. Current and emerging biomarkers and imaging modalities for nonalcoholic fatty liver disease: clinical and research applications. Clin Ther, 2021; 43, 1505−22. doi: 10.1016/j.clinthera.2021.07.012 [19] Aktas G. Exploring the link: hemogram-derived markers in type 2 diabetes mellitus and its complications. World J Diabetes, 2025; 16, 105233. [20] Balci SB, Atak BM, Duman T, et al. A novel marker for prediabetic conditions: Uric acid-to-HDL cholesterol ratio. Bratisl Med J, 2024; 125, 145-8. [21] Nascimbeni F, Bedossa P, Fedchuk L, et al. Clinical validation of the FLIP algorithm and the SAF score in patients with non-alcoholic fatty liver disease. J Hepatol, 2020; 72, 828−38. doi: 10.1016/j.jhep.2019.12.008 [22] Tremblay MS, Aubert S, Barnes JD, et al. Sedentary Behavior Research Network (SBRN) - Terminology Consensus Project process and outcome. Int J Behav Nutr Phys Act, 2017; 14, 75. doi: 10.1186/s12966-017-0525-8 [23] San-Cristobal R, Navas-Carretero S, Martínez-González MÁ, et al. Contribution of macronutrients to obesity: implications for precision nutrition. Nat Rev Endocrinol, 2020; 16, 305−20. doi: 10.1038/s41574-020-0346-8 [24] Nascimbeni F, Bedossa P, Fedchuk L, et al. Clinical validation of the FLIP algorithm and the SAF score in patients with non-alcoholic fatty liver disease. J Hepatol, 2020; 72, 828-38. [25] Taylor RS, Taylor RJ, Bayliss S, et al. Association between fibrosis stage and outcomes of patients with nonalcoholic fatty liver disease: a systematic review and meta-analysis. Gastroenterology, 2020; 158, 1611-25. e12. [26] Zhang X, Coker OO, Chu ES, et al. Dietary cholesterol drives fatty liver-associated liver cancer by modulating gut microbiota and metabolites. Gut, 2021; 70, 761−74. doi: 10.1136/gutjnl-2019-319664 [27] Browning JD, Horton JD. Molecular mediators of hepatic steatosis and liver injury. J Clin Invest, 2004; 114, 147−52. doi: 10.1172/JCI200422422 [28] Lee KC, Wu PS, Lin HC. Pathogenesis and treatment of non-alcoholic steatohepatitis and its fibrosis. Clin Mol Hepatol, 2023; 29, 77−98. doi: 10.3350/cmh.2022.0237 [29] Kim Y, Chang Y, Cho YK, et al. Obesity and weight gain are associated with progression of fibrosis in patients with nonalcoholic fatty liver disease. Clin Gastroenterol Hepatol, 2019; 17, 543-50. e2. [30] Chen TP, Lin WY, Chiang CH, et al. Metabolically healthy obesity and risk of non-alcoholic fatty liver disease severity independent of visceral fat. J Gastroenterol Hepatol, 2021; 36, 2903−10. doi: 10.1111/jgh.15544 [31] Lonardo A, Mantovani A, Lugari S, et al. Epidemiology and pathophysiology of the association between NAFLD and metabolically healthy or metabolically unhealthy obesity. Ann Hepatol, 2020; 19, 359−66. doi: 10.1016/j.aohep.2020.03.001 [32] Zheng J, Li XR, Zhang Y, et al. Hyperuricemia as an effect modifier of the association between metabolic phenotypes and nonalcoholic fatty liver disease in Chinese population. J Transl Med, 2023; 21, 39. doi: 10.1186/s12967-022-03850-5 [33] Xie D, Zhao HR, Lu JM, et al. High uric acid induces liver fat accumulation via ROS/JNK/AP-1 signaling. Am J Physiol Endocrinol Metab, 2021; 320, E1032−43. doi: 10.1152/ajpendo.00518.2020 [34] Chen WY, Deng Y, Li MQ, et al. Serum uric acid and mortality in metabolic dysfunction-associated steatotic liver disease: subgroup differences. Nutr Metab Cardiovasc Dis, 2024; 34, 2771−8. doi: 10.1016/j.numecd.2024.09.015 [35] Lanaspa MA, Sanchez-Lozada LG, Choi YJ, et al. Uric acid induces hepatic steatosis by generation of mitochondrial oxidative stress. J Biol Chem, 2012; 287, 40732−44. doi: 10.1074/jbc.M112.399899 [36] Xu ZX, Tang CX, Song X, et al. High uric acid exacerbates nonalcoholic steatohepatitis through NLRP3 inflammasome and gasdermin D-mediated pyroptosis. J Biol Chem, 2025; 301, 110249. doi: 10.1016/j.jbc.2025.110249 [37] Al-Shargi A, El Kholy AA, Adel A, et al. Allopurinol versus febuxostat: a new approach for the management of hepatic steatosis in metabolic dysfunction-associated steatotic liver disease. Biomedicines, 2023; 11, 3074. doi: 10.3390/biomedicines11113074 [38] Hallsworth K, Adams LA. Lifestyle modification in NAFLD/NASH: facts and figures. JHEP Rep, 2019; 1, 468−79. doi: 10.1016/j.jhepr.2019.10.008 [39] Fan J, Wang DX. Serum uric acid and nonalcoholic fatty liver disease. Front Endocrinol, 2024; 15, 1455132. doi: 10.3389/fendo.2024.1455132 [40] Piazzolla VA, Mangia A. Noninvasive diagnosis of NAFLD and NASH. Cells, 2020; 9, 1005. doi: 10.3390/cells9041005 [41] Vali Y, Lee J, Boursier J, et al. Biomarkers for staging fibrosis and non-alcoholic steatohepatitis in non-alcoholic fatty liver disease (the LITMUS project): a comparative diagnostic accuracy study. Lancet Gastroenterol Hepatol, 2023; 8, 714−25. doi: 10.1016/S2468-1253(23)00017-1 [42] European Association for the Study of the Liver (EASL), European Association for the Study of Diabetes (EASD), European Association for the Study of Obesity (EASO). EASL-EASD-EASO Clinical Practice Guidelines on the management of metabolic dysfunction-associated steatotic liver disease (MASLD). J Hepatol, 2024; 81, 492-542. [43] Mózes FE, Lee JA, Selvaraj EA, et al. Diagnostic accuracy of non-invasive tests for advanced fibrosis in patients with NAFLD: an individual patient data meta-analysis. Gut, 2022; 71, 1006−19. doi: 10.1136/gutjnl-2021-324243 [44] Steinberg GR, Valvano CM, De Nardo W, et al. Integrative metabolism in MASLD and MASH: pathophysiology and emerging mechanisms. J Hepatol, 2025; 83, 584−95. doi: 10.1016/j.jhep.2025.02.033 [45] Bril F, Cusi K. Management of nonalcoholic fatty liver disease in patients with type 2 diabetes: a call to action. Diabetes Care, 2017; 40, 419−30. doi: 10.2337/dc16-1787 [46] Younes R, Bugianesi E. NASH in lean individuals. Semin Liver Dis, 2019; 39, 86−95. doi: 10.1055/s-0038-1677517 [47] Mascaró CM, Bouzas C, Montemayor S, et al. Effect of a six-month lifestyle intervention on the physical activity and fitness status of adults with NAFLD and metabolic syndrome. Nutrients, 2022; 14, 1813. doi: 10.3390/nu14091813 [48] Zhang YT, Xie MX, Wen J, et al. Hepatic TM6SF2 activates antitumour immunity to suppress metabolic dysfunction-associated steatotic liver disease-related hepatocellular carcinoma and boosts immunotherapy. Gut, 2025; 74, 639−51. doi: 10.1136/gutjnl-2024-333154 [49] Caddeo A, Spagnuolo R, Maurotti S. MBOAT7 in liver and extrahepatic diseases. Liver Int, 2023; 43, 2351−64. doi: 10.1111/liv.15706 [50] Zhu YX, Xu XM, Fan ZW, et al. Different minimal alcohol consumption in male and female individuals with metabolic dysfunction-associated fatty liver disease. Liver Int, 2024; 44, 865−75. doi: 10.1111/liv.15849 [51] Li G, Tang LJ, Zhu PW, et al. PNPLA3 rs738409 C>G variant influences the association between visceral fat and significant fibrosis in biopsy-proven nonalcoholic fatty liver disease. J Clin Transl Hepatol, 2022; 10, 439−48. doi: 10.14218/JCTH.2021.00286 [52] Fouad Y, Pan ZY, Nafady S, et al. HOMA-IR, an independent predictor of advanced liver fibrosis in metabolic-dysfunction associated fatty liver disease: a cross-sectional study in Egyptian patients. Sci Rep, 2025; 15, 31098. doi: 10.1038/s41598-025-15425-7 [53] Mózes FE, Lee JA, Selvaraj EA, et al. Diagnostic accuracy of non-invasive tests for advanced fibrosis in patients with NAFLD: an individual patient data meta-analysis. Gut, 2022; 71, 1006-19. [54] Lee J, Vali Y, Boursier J, et al. Prognostic accuracy of FIB-4, NAFLD fibrosis score and APRI for NAFLD-related events: a systematic review. Liver Int, 2021; 41, 261−70. -

 点击查看大图
计量
- 文章访问数: 29
- HTML全文浏览量: 11
- PDF下载量: 0
- 被引次数: 0

 Quick Links