HTML
-
Developmental dyslexia (DD), the most common neurodevelopmental disorder in school-age children, is defined as a specific and persistent reduction in the capacity to decode written language despite conventional instruction, adequate intelligence, and sociocultural opportunities[1]. Approximately 5%-10% of children suffer from DD in Western countries, and 4%-8% in China[2].
The Stroop Color and Word Test (SCWT) is a neuropsychological test to assess the interference effect. It contains three tasks: reading words, naming colors, and naming incongruently colored words (color-word naming). The first two tasks require subjects to name words and colors, both of which measure the automaticity of readers' extraction of correct speech sounds from their mental lexicon. The incongruent task (e.g., the word 'red' written in blue text) measures the interference effect: participants are instructed to perform a less automated task (i.e., naming text color) while restraining the interference arising from a more automated task (i.e., reading the word)[3-5]. Thus far, literature has identified a tendency for more errors and longer response times in dyslexic children[6-7], younger teenagers[8], older teenagers[9], and adults[10] in comparison to control groups in Stroop-style tests.
Olk was the first to track eye movements during the SCWT, and showed that eye movements could provide information on subjects' allocation of attention and reflect the impact and resolution of conflict during the SCWT[11]. Eye movements can indeed be used to record information not available through assessment of response time and accuracy alone. Eye-movement patterns show how participants deal with cognitive conflict during the SCWT and how they allocate their attention. They also provide information on the mechanisms driving participants' control of processes during the SCWT.
Unfortunately, the eye-movement patterns of DD children performing the SCWT remain unknown; few researchers have used eye-movement trackers to study how DD children process the SCWT. However, in Western countries, a huge amount of data have shown that the eye movements of people with dyslexia are abnormal during reading[12-15]. DD children exhibit longer fixation durations, shorter saccades, and thus more fixations in reading than normally developing readers of the same chronological age[16-19]. In China, some studies have shown that Chinese DD children exhibit longer fixation duration, more fixations and saccades, and shorter saccade amplitude than a control group during reading and picture searching[20-21]. Our series of studies has shown that Chinese DD children exhibit shorter saccade amplitude and mean saccade distance during reading and non-reading tasks such as picture perception, visual searching, and rapid-automatized-naming (RAN) tests[2, 21-22, 37]. Therefore, we hypothesize that the eye-movement patterns of shorter saccade amplitude and mean saccadic distance may be relatively stable oculomotor patterns of Chinese DD children performing any type of visual processing tasks, including the SCWT. To verify this hypothesis, the present study tested the eye-movement patterns of DD children as they performed the SCWT, and further revealed the relationship between their abnormal eye-movement patterns and the interference effect.
-
Written informed consent was obtained from the parents of all subjects. The research protocol and content were in accordance with the ethical standards of the Medical Ethics Committee, Sun Yat-sen University, and obtained the committee's approval.
-
A total of 673 students from 2nd to 5th grade (mean age 9.75 ± 1.17 years; age range 6.47-13.53 years) from a Nanhai primary school were screened for DD. Three tests were used to diagnose DD children, including learning disabilities screening, Chinese reading ability, and non-verbal intelligence quotient (IQ). We used the Pupil Rating Scale Revised: Screening for Learning Disabilities (PRS) to screen DD children[23]. Non-verbal IQ was measured by Raven's Standard Progressive Matrices[24]. Reading achievement was measured by the Character Recognition Test Battery and Assessment Scale for Primary School Children (CRTB), a standardized written vocabulary test widely used in mainland China with high reliability (0.98) and validity (0.98)[25]. A total of 69 Chinese children were recruited for the study; 32 were DD children (experimental group: 9 girls, 23 boys; mean age 9.44 ± 1.20 years; age range 7.72-13.53 years), and the other 37 were non-dyslexic children (control group: 14 girls, 23 boys; mean age 8.99 ± 0.93 years; age range 7.55-11.47 years).
DD children met the following recruitment criteria: (1) overall PRS score < 65; (2) non-verbal IQ ≥ 80; (3) CRTB score less than two standard deviations below the mean for their respective grade (< mean - 2SD).
Non-dyslexic children met the following recruitment criteria: (1) overall PRS score ≥ 65; (2) non-verbal IQ ≥ 80; (3) CRTB score greater than or equal to two standard deviations below the mean for their respective grade (≥ mean - 2SD). The non-dyslexic children were matched well with the DD children in chronological age, grade, and sex.
All subjects were reported by their parents to have no history of abnormal learning experience, suspected brain damage, uncorrected sensory impairment, or serious emotional or behavioral problems. All subjects had normal visual acuity or corrected visual acuity (≥ 1.0).
-
Eye movements were recorded by an Eyelink Ⅱ High-Speed Eye Tracker from SR Research Ltd. (Canada). The EyeLink Ⅱ has a high resolution (noise-limited at < 0.01° RMS; spatial resolution < 0.005°; 500 Hz) and few gaze-range errors (< 0.5°). Participants were seated on a modified office chair that prevented any rotational movement, at a distance approximately 70 cm from the computer screen. Stimuli were displayed on a 21-inch cathode ray tube monitor with an average photo illumination of 200.00 lx. A brief 9-point calibration was performed prior to the experiment and repeated, if necessary, between blocks. Each trial was preceded by a brief drift-correction procedure.
To ensure that the children need not to wear the helmet for too long and to enhance subject compliance, we selected a 5 × 5 target pane, meaning that each task consisted of five rows of five items.
-
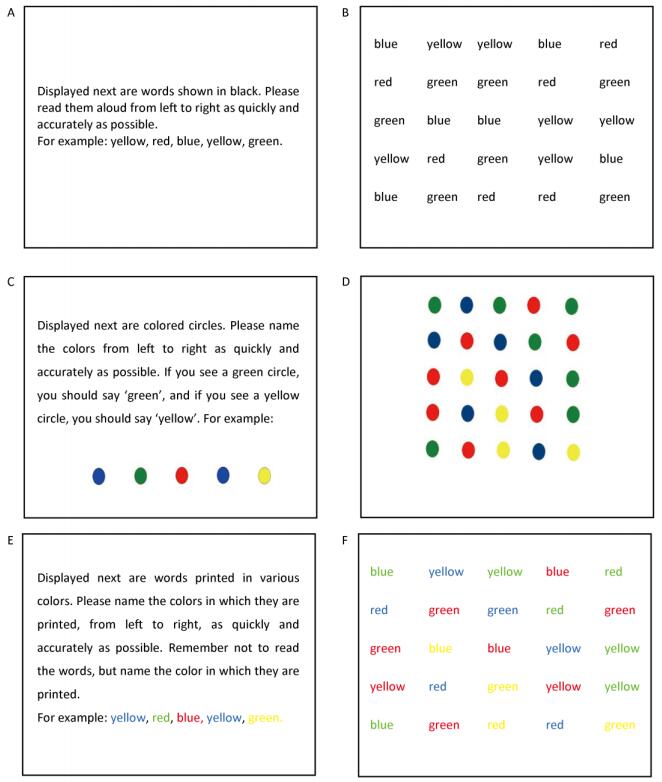
The SCWT comprised three different tasks presented on a computer. Task A, 'word reading', was to read words written in black text. For example, yellow, red, blue, yellow, green would be read aloud as 'huang, hong, lan, huang, lv'. Task B, 'color naming, ' was to name the colors of various circles. For example,
-
We adopted a 2 × 3 factorial design with groups (DD/control groups) as between-subjects factors and tasks (A/B/C) as within-subjects factors. During the three tasks, participants read the lines aloud from left to right as quickly and accurately as possible, with a time limit of 80 s per task. Following are the standard test instructions participants were given (all words were shown in Chinese on screen):
A: Displayed next are words shown in black. Please read them aloud from left to right as quickly and accurately as possible. For example: yellow, red, blue, yellow, green.
B: Displayed next are colored circles. Please name the colors from left to right as quickly and accurately as possible. If you see a green circle, you should say 'green', and if you see a yellow circle, you should say 'yellow'. For example:

C: Displayed next are words printed in various colors. Please name the colors in which they are printed, from left to right, as quickly and accurately as possible. Remember not to read the words, but name the color in which they are printed. For example: yellow, red, blue, yellow, green.
-
Accuracy[26]: Percentage of correct responses given in each task, recorded on paper by professional testers during the trials.
Response time[27]: Time (in seconds) that the subject spent from start to finish in each task, automatically recorded by the eye tracker.
Interference effect (IE)[9, 28]: IE = response time (task C) − response time (task B). This was believed to be most appropriate for evaluating IE.
-
Average fixation duration (AFD): Average duration of all fixations in a trial (in milliseconds).
Number of fixations (NF): Total number of fixations in a trial.
Mean saccade distance (MSD): Average distance between contiguous fixations in a trial (in degrees of visual angle).
Number of saccades (NS): Total number of saccades in a trial.
Average saccade amplitude (ASA): Average size of all saccades in a trial (in degrees of visual angle).
Frequency of fixations (FF): Number of fixations per millisecond during a trial.
Frequency of saccades (FS): Number of saccades per millisecond during a trial.
-
All data are expressed as mean ± standard deviation (x̅ ± s). The results of the eye-movement experiments were extracted from the eye tracker's eye-movement analysis software. SPSS 22.0 was used to analyze data. We compared the demographic characteristics and IE of the two groups using the independent samples t-test. For accuracy, response time, and eye-movement parameters, we used the general linear model repeated measures to test the main effects between groups (DD/control groups) and among tasks (A/B/C), and the interaction effect between groups and tasks. P-values less than 0.05 were considered statistically significant.
Ethical Approval
Subjects
Equipment
Materials
Design and Procedures
Behavioral Parameters
Eye-movement Parameters
Statistical Analysis
-
Table 1 shows that compared to the control group, DD children had lower IQ, PRS, and CRTB scores, and higher scores in the parent questionnaire regarding Chinese reading and writing abilities.
Characteristics of Subjects DD (N = 32) Con. (N = 37) t/χ2 P n (%) Mean (SD) n (%) Mean (SD) Age 9.44 (1.20) 9.03 (1.00) 1.73 0.088 Sex (male) 23 (71.88%) 23 (62.16%) 0.73 0.39 Grade 2nd 8 (25.00%) 12 (32.43%) 3rd 16 (50.00%) 17 (45.95%) 0.73 0.867 4th 4 (12.50%) 3 (8.11%) 5th 4 (12.50%) 5 (13.51%) Non-verbal IQ 112.13 (17.21) 126.44 (9.96) -4.08 < 0.001** Overall PRS score 54.50 (18.05) 99.03 (16.90) -7.61 < 0.001** CRTB score 2180.99 (273.27) 2872.35 (298.57) -9.48 < 0.001** Parent questionnaire 144.78 (37.53) 81.54 (25.15) 7.55 < 0.001** IE (s) 22.99 (14.22) 16.76 (6.36) 2.29 0.027 Note. *P < 0.05, **P < 0.01. DD: developmental dyslexia; Con.: control group; PRS: the Pupil Rating Scale Revised: Screening for Learning Disabilities; CRTB: the Character Recognition Test Battery and Assessment Scale for Primary School Children; IE: interference effect. χ2 tests were used for categorical variables and t-tests for continuous variables. Characteristic parameters were expressed as the size of sample and percentage [n (%)], or the mean and standard deviation (x̅ ± s); Significant results are marked in bold. Table 1. Characteristics of DD Children and Control Children (N = 69)
-
Interference Effect (IE) Compared to the control group (16.76 ± 6.36), Chinese DD children (22.98 ± 14.22) had significantly stronger IE (t = 2.29, P = 0.027).
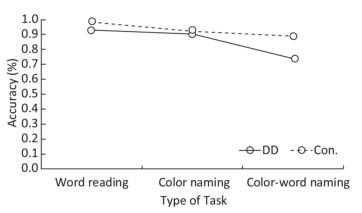
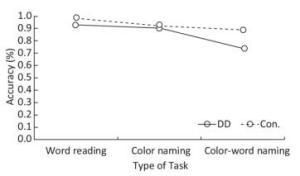
Accuracy There were significant differences in accuracy among the three tasks (F = 21.859, P < 0.001). Significant differences existed between task A and task B (F = 7.606, P = 0.007), task B and task C (F = 27.200, P < 0.001), and task A and task C (F = 44.363, P < 0.001). Accuracy scores were highest in task A, medium in task B, and lowest in task C (task A > task B > task C). Chinese DD children scored lower in accuracy than the control group (F = 8.488, P = 0.005). In addition, there was significant interaction between groups and tasks (F = 5.844, P = 0.005), and in task C, the DD group had significantly lower accuracy than the control group (F = 12.516, P = 0.001); no significant differences were found between groups in tasks A (F = 3.349, P = 0.072) or B (F = 0.201, P = 0.655) (Figure 1).
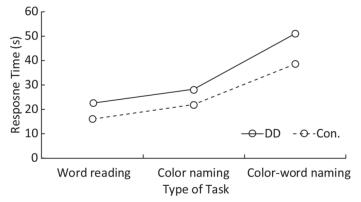
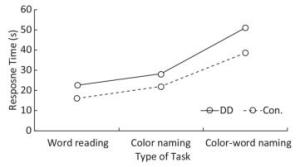
Response Time There were significant differences in response time among the three tasks (F = 125.897, P < 0.001); response time was longest in task C, medium in task B, and shortest in task A (task A < task B < task C). Significant differences existed between task A and task B (F = 44.826, P < 0.001), task B and task C (F = 235.227, P < 0.001), and task A and task C (F = 240.599, P < 0.001). DD children had longer response times than the control group (F = 25.306, P < 0.001). In addition, the interaction between groups and tasks was marginally significant (F = 3.040, P = 0.055). The differences between DD and the control group were significant in task A (F = 11.678, P = 0.001), task B (F = 16.863, P < 0.001), and task C (F = 16.731, P < 0.001); the difference was largest in task C (Figure 2).
-
AFD There were significant differences in average fixation duration among the three tasks (F = 61.291, P < 0.001); AFD was longest in task C, medium in task B, and shortest in task A (task A < task B < task C). Significant differences existed between task A and task B (F = 31.320, P < 0.001), task B and task C (F = 49.234, P < 0.001), and task A and task C (F = 124.212, P < 0.001). There was no significant main effect of groups in AFD (F = 3.035, P = 0.086), and no significant interaction between groups and tasks (F = 0.693, P = 0.504).
ASA There were significant differences in average saccade amplitude among the three tasks (F = 32.610, P < 0.001); ASA was longest in task A, medium in task B, and shortest in task C (task A > task B > task C). Significant differences existed between task A and task B (F = 11.719, P < 0.001), task B and task C (F = 19.554, P < 0.001), and task A and task C (F = 48.485, P < 0.001). However, there was no significant main effect of groups in ASA (F = 1.608, P = 0.209), and no significant interaction between groups and tasks (F = 0.755, P = 0.474).
NF There were significant differences in number of fixations among the three tasks (F = 55.765, P < 0.001); NF was highest in task C, medium in task B, and lowest in task A (task A < task B < task C). Significant differences existed between task A and task B (F = 11.247, P = 0.001), task B and task C (F = 98.450, P < 0.001), and task A and task C (F = 106.866, P < 0.001). Significant main effect of groups was found in NF; DD children had higher NF than the control group (F = 5.272, P = 0.025). No significant interaction was found between groups and tasks (F = 0.268, P = 0.766).
NS There were significant differences in number of saccades among the three tasks (F = 58.648, P < 0.001); NS was highest in task C, medium in task B, and lowest in task A (task A < task B < task C). Significant differences existed between task A and task B (F = 13.245, P = 0.001), task B and task C (F = 114.944, P < 0.001), and task A and task C (F = 101.151, P < 0.001). Significant main effect of groups was found in NS; DD children had higher NS than the control group (F = 7.914, P = 0.006). No significant interaction was found between groups and tasks (F = 0.883, P = 0.419).
MSD There were significant differences in mean saccade distance among the three tasks (F = 43.091, P < 0.001); MSD was longest in task A, medium in task B, and shortest in task C (task A > task B > task C). Significant differences existed between task A and task B (F = 12.054, P = 0.001), task B and task C (F = 20.327, P < 0.001), and task A and task C (F = 65.137, P < 0.001). Significant main effect of groups was found in MSD; DD children had shorter MSD than the control group (F = 4.03, P = 0.049). No significant interaction was found between groups and tasks (F = 0.223, P = 0.801).
FF There were significant differences in frequency of fixations among the three tasks (F = 58.531, P < 0.001); FF was highest in task A, medium in task B, and lowest in task C (task A > task B > task C). Significant differences existed between task A and task B (F = 25.627, P < 0.001), task B and task C (F = 21.226, P < 0.001), and task A and task C (F = 117.364, P < 0.001). Significant main effect of groups was found in FF (F = 6.069, P = 0.016); DD children had lower FF than the control group. No significant interaction was found between groups and tasks (F = 0.579, P = 0.563).
FS There were significant differences in frequency of saccades among the three tasks (F = 58.865, P < 0.001); FS was highest in task A, medium in task B, and lowest in task C (task A > task B > task C). Significant differences existed between task A and task B (F = 13.815, P < 0.001), task B and task C (F = 57.217, P < 0.001), and task A and task C (F = 89.331, P < 0.001). There was no significant main effect of groups in FS (F = 2.275, P = 0.136), and no significant interaction between groups and tasks (F = 0.493, P = 0.613).
Behavioral and eye-movement parameters are expressed as mean and standard deviation (x̅ ± s) in Table 2.
Behavioral and Eye-movement Parameters (unit) Word Reading (task A) Color Naming (task B) Color-word Naming (task C) DD Con. DD Con. DD Con. Accuracy*#$ 0.93 ± 0.18 0.98 ± 0.03 0.91 ± 0.10 0.92 ± 0.09 0.74 ± 0.22 0.89 ± 0.11 Response time (s)*#$ 22.73 ± 10.64 16.13 ± 4.66 28.13 ± 7.63 22.00 ± 4.59 51.11 ± 15.67 38.76 ± 8.93 AFD (ms)# 289.78 ± 47.35 258.45 ± 41.28 317.31 ± 68.40 300.40 ± 65.61 373.30 ± 85.13 347.36 ± 85.12 ASA (°)# 4.69 ± 1.73 5.03 ± 0.96 4.16 ± 1.63 4.38 ± 0.95 3.56 ± 1.19 4.03 ± 1.04 NF*# 60.16 ± 26.41 50.27 ± 14.68 68.34 ± 22.89 59.30 ± 17.00 108.84 ± 45.22 94.27 ± 5.98 NS*# 72.00 ± 36.51 57.57 ± 21.96 83.63 ± 24.68 69.30 ± 19.79 135.31 ± 55.37 109.65 ± 37.71 MSD (°)*# 4.81 ± 1.01 5.27 ± 1.20 4.47 ± 1.01 4.89 ± 0.83 4.00 ± 0.81 4.34 ± 0.78 FF*# 2.76 ± 0.59 3.13 ± 0.47 2.51 ± 0.73 2.73 ± 0.68 2.14 ± 0.59 2.45 ± 0.47 FS# 3.22 ± 0.71 3.54 ± 0.69 3.02 ± 0.70 3.19 ± 0.86 2.62 ± 0.55 2.85 ± 0.81 Note. *Main effect of groups was significant; #main effect of tasks was significant; $interaction between groups and tasks was significant. DD: developmental dyslexia; Con.: controls; IQ: intelligence quotient; AFD: average fixation duration; ASA: average saccade amplitude; NF: number of fixations; NS: number of saccades; MSD: mean saccade distance; FF: frequency of fixations; FS: frequency of saccades. We used the general linear model repeated measure to test the main effects between groups (DD children/control group) and among tasks (A/B/C), and the interaction effects between groups and tasks. Behavioral and eye-movement parameters are expressed as the mean and standard deviation (x̅ ± s). Significant results are marked by symbols. Table 2. Comparison of Behavioral and Eye-movement Parameters between Chinese DD Children and Non-dyslexic Children Performing the SCWT
Sample Characteristics
Behavioral Parameters
Eye-movement Parameters
-
The SCWT is a typical tool for assessing interference effect, which is defined as the ability to restrain automatic responses that compete with the desired response[3-4]. In the SCWT, the color-word naming task in the incongruent condition (e.g., the word 'red' shown in blue text) measures interference effect[3-5]. The difference in reaction time between the color-word naming and the color naming tasks is regarded as an indicator of ability to inhibit cognitive interference[29]. The present study showed that Chinese DD children had lower accuracy, longer response times, and stronger IE than the control group when performing the SCWT, especially in the color-word naming task. These results indicate that interference in the DD group was greater than in the control group, and ability to inhibit irrelevant responses, as reflected in the SCWT, was indeed more impaired in the DD group. Consistent with our findings, a large number of studies indicate that compared to control groups, DD subjects exhibit more errors and longer response times in Stroop-style tests[6-7]. Literature indicates that reading ability is negatively associated with Stroop interference[8], and that reading and Stroop interference share common processes related to executive functions, such as inhibition and selected attention[8-9]. An fMRI study revealed that Stroop interference elicited activation in the bilateral middle frontal gyrus (BA9)[30]. BA9 is regarded as a center for fluent Chinese reading[31-32]; Chinese DD children have abnormal function or structure (e.g., volumetric gray matter) in this area[33-34].
Fixations and saccades are two main types of eye movements. Fixation is the duration during which the two eyes remain still. People obtain visual information during fixation. Saccades are rapid movements of the eyes from one fixation to the next. In information processing, people scan the visual field and select fixation locations through saccades, and obtain new information through the fixations[35-36]. The present study showed that compared to the control group, Chinese DD children exhibited shorter mean saccade distance and higher numbers of saccades and fixations when performing the SCWT. We inferred that these abnormal eye-movement patterns reflected relatively stable oculomotor patterns of DD children performing automatic reading, and were not related to impaired interference effect, as no significant interaction effect between groups and tasks was found. The source of abnormal eye movements such as these in DD children is still hotly debated, in particular the potential visual origins. We speculate that Chinese DD children have a visual attention span ('VA span') disorder, which results in shorter saccades and higher numbers of fixations and saccades when performing the SCWT. Our series of studies showed that Chinese DD children reduced saccade distance during reading and non-reading tasks such as picture perception, visual search, and RAN tests[2, 21-22, 37]. We thus believe that shorter saccade distance might be a stable, impaired eye-movement pattern of Chinese DD children in performing all types of visual tasks. Mean saccade distance measures the distance between contiguous fixations, and is regarded as an important parameter of VA span[35-36]. VA span is defined as the number of words a reader at least partially processes during a fixation[35, 38]. Increasing evidence shows that VA span is significantly reduced in DD children compared to controls, and this accounts for a substantial amount of variance in reading speed and accuracy[39-40]. At the oculomotor level, VA span disorder results in shorter saccades and higher numbers of fixations[35, 40-41]. Neuropsychological evidence has shown brain incapacity in DD children performing all types of tasks requiring processing of brief or sequential stimuli[42]. Recently, Peyrin et al.[43] found that dyslexic VA span disorder was related to underactivation of the parietal lobe.
The present study also found that all behavioral and eye-movement parameters had significant main effects on tasks. For behavioral parameters, task A had the highest accuracy and shortest response time, and task C had the lowest accuracy and longest response time. For eye-movement parameters, task A had the shortest AFD and MSD, longest ASA, lowest NF and NS, and highest FF and FS; task C had the longest AFD and MSD, shortest ASA, highest NF and NS, and lowest FF and FS. Task B received medium scores for all behavioral and eye-movement parameters. The data showed that task C was the most difficult to process, task B was moderate, and task A was easiest, supporting the hypothesis of the Stroop effect. The word reading task (task A) had a higher degree of automaticity than the color naming task (task B). In task C, participants were required to repress and prevent the automatic process of reading the word from interfering with the controlled process of naming the color, slowing down processing speed and causing more errors[3-4].
There are some limitations in the present study. First, our sample size was small, which influenced the stability of the results. Second, there were significant differences in non-verbal IQ between two groups, which might influence eye movements. To our knowledge, little work has been conducted to elucidate the relationship between eye movements and IQ. Haishi et al. found a negative correlation between saccadic reaction time and IQ[44]. However, Brock et al. found that non-verbal IQ did not influence gazing patterns[45], and Lasker et al. also have stated that there is no evidence of correlation between IQ and eye-movement latencies[46]. Therefore, it remains unclear whether non-verbal IQ influences the eye movements of children. Finally, this research was a case-control study, which cannot explore the source of the abnormal eye movements in DD children, nor the causal relationship between abnormal eye movements and dyslexia.
-
Chinese DD children are subject to a stronger interference effect. When performing the SCWT, Chinese DD children exhibit abnormal eye-movement patterns, namely shorter mean saccade distance, lower frequency of fixations, and more fixations and saccades. These abnormal eye movements may be relatively stable oculomotor patterns of DD children when performing visual processing, and not influenced by impaired interference effect. We concluded that Chinese DD children have VA span disorder, which results in shorter saccades and higher numbers of fixations and saccades when performing the SCWT. Further study should be conducted to explore the causal relationship between abnormal eye movements and VA span disorder in DD children.
-
WU Yu Jia contributed to data analysis, results interpretation, and manuscript drafting. YANG Wen Han, WANG Qing Xiong, YANG De Sheng, and HU Xiao Yun contributed to results interpretation and manuscript revision. JING Jin contributed to study design, data analysis planning, results interpretation, and manuscript revision. LI Xiu Hong was the principal investigator of this study and contributed to hypothesis generation, study design, data analysis planning, results interpretation, and major revision of the manuscript. All authors approved the final manuscript as submitted and agree to be accountable for all aspects of the work.
-
We thank QIU Yu Xiang, HUANG Ying Fang, and TAN Ren Xiang of the Government of Jiujiang Town, Nanhai, Foshan, for their assistance during data acquisition. We thank the pupils and staff of the Central Elementary School of Jiujiang Town for their participation in the test.
-
There are no conflicts of interest.




 Quick Links
 DownLoad:
