


-
Vitamin D (VD) is a micronutrient for human health, which is predominantly derived from 7-dehydrocholesterol in the skin under sunlight exposure and is also absorbed from food as a secondary source. Through two steps of hydroxylation, VD is converted to 25-hydroxyvitamin D (25OHD) and then 1,25-dihydroxyvitamin D [1,25(OH)2D]. The circulating concentration of 25OHD is generally used as a biomarker of VD status, and 1,25(OH)2D is the functional metabolite working in the manner of a hormone in the osseous and extra-osseous metabolisms[1]. Previous studies suggested that VD deficiency was associated with abdominal obesity and/or dyslipidemia[2], and many studies supported the opinion that VD supplementation was beneficial for ameliorating lipid profiles[3]. However, confounders in various populations led to inconsistency for each of the lipid parameters, namely triglyceride (TG), total cholesterol (TC), low-density lipoprotein cholesterol (LDLC), and high-density lipoprotein cholesterol (HDLC), as suggested by human studies and meta-analyses[3, 4]. Researchers have to conduct a close examination of those potential confounders and pay special attention to the functioning of the VD receptor (VDR), which is the most important mediator of the VD function[5].
VDR gene variants have the potential to influence biological outcomes[5, 6]. It has been reported that VDR has an effect on skeletal muscles independent of VD, and the decreased expression of VDR protein is related to various disease states and aging[7]. In the VDR knockout animal model, a decreased size and muscle fiber strength were observed, and VDR expression is also required in myoblasts[8, 9]. Aside from skeletal health status, it was also reported that the single nucleotide polymorphisms (SNPs) of VDR were associated with risks to non-skeletal health[6], such as myocardial infarction, cancer, and death[10]. Moreover, these kinds of associations aroused concerns about dyslipidemia since expressions of some lipid metabolism-related genes are regulated by calcitriol-stimulation[11], and some may even have VD-responsive elements (VDREs) to bind the 1,25(OH)2D-activated VDR[12]. Thus, both the VD status and the VDR function have the potential to affect the expressions of lipid metabolic genes, ultimately affecting the physiological activities of cells[1]. Moreover, by involving biological (in terms of reproductive function, sexual hormones, expressions of heterosome-located genes, etc.) and lifestyle (e.g., smoking, drinking, physical activity, etc.) factors[13], sexual dimorphism should be taken into careful consideration when conducting medical research[14].
Located on chromosome 12, the VDR gene spans at least 75 kb in length. From the 5’–3’ direction of its sense (forward) strand, Cdx2 (rs11568820, C > T), Fok1 [rs2228570, A > B (degenerate base standing for C, G, and T, i.e., not A)], Apa1 (rs7975232, C > A), and Taq1 (rs731236, A > G) are the generally the relevant SNPs in various ethnicity groups[15-17]. These SNPs may affect mRNA expression, amino acid sequence, and protein activity. Particularly, VDR SNPs have been reported to have effects on 25OHD levels in circulation[18, 19]. For example, Santos et al.[20] studied a group of Brazilian girls aged 7–18 years and found that the VDR wild-types of Bsm1, Apa1, and Taq1 were associated with lower 25OHD levels. Therefore, it is necessary to further explore the relationship between VDR SNPs and specific lipid parameters, as well as VD status in both females and males. In the present study, we focused on the VDR SNPs of Apa1, Cdx2, Fok1, and Taq1 in this regard, which have been studied in genotype-phenotype associations, in order to avoid weak evidence or unknown biological significance for less studied or new SNPs regarding their associations with lipids.
-
The sample size (N) was estimated with the formula N ≥ (Z1-α/2/δ)2 × p × (1 – p), wherein Z was 1.96 for the two-sided 95% confidential intervals (CIs), P was the dyslipidemia prevalence of 34.64% in Shenzhen adults as known in 2012 but unpublished at the design stage of our study[21], δ was 2.2%, representing tolerable error, and the calculated N was 1,798.
After signing written consent forms to be subjects in the study, adult volunteers visiting a health examination center in Shenzhen City in Guangdong Province, China, were recruited between July 2013 and January 2014. A questionnaire survey administered via face-to-face interview was conducted to collect the basic health information of each participant. The inclusion criteria were: 1) Han Chinese aged ≥ 20 years old; 2) living in Shenzhen for > 2 years; 3) free of liver diseases, renal diseases, and any cancers in the past six months; and 4) not pregnant (for women). The excluded subjects were those who 1) had severe organic diseases, 2) had acute infection symptoms, allergic diseases, and malignant tumors, 3) had a family history of genetic diseases including familial dyslipidemia, 4) had taken VD supplements in the past six months, 5) had taken medicines to control lipid levels within the past 12 hours, or 6) had taken diuretics, engaged in strenuous exercise, or had overeaten within the 24 hours before the test.
From ulnar veins of the subjects, who had fasted overnight, blood samples were collected with vacuum tubes, and within two hours post-collection, supernatant and blood cells were separated by centrifugation of 3,000 ×g at 4 °C for 10 min. The body mass index (BMI) was calculated as body weight (kg)/ height (m)2. The above protocol for the cross-sectional study was approved by the Ethics Committee of the Shenzhen Center for Chronic Disease Control and was in accordance with the Declaration of Helsinki. The study was registered at ClinicalTrials.gov (registration ID number NCT04707612).
-
Parameters of lipids, glucose, hemogram, etc., were assayed right on the day, and the rest of the samples were aliquoted with EP tubes and stored at -80 °C for later use. The systolic blood pressure (SBP) and diastolic blood pressure (DBP) of the subjects were measured by a standard mercury sphygmomanometer. Glycated hemoglobin (HbA1c) was detected with a Japan Arkray Instruments analyzer (ion chromatography method). The serum levels of TG, TC, LDLC, HDLC, and fasting plasma glucose (FPG) were tested by the Beckman-LX20 automatic biochemical analyzer. The plasma 25OHD concentration was detected with a commercial ELISA kit (Cat. #: AC-57F1, IDS Ltd., UK). According to the Chinese guidelines for dyslipidemia management[22], TG ≥ 2.3 mmol/L, TC ≥ 6.2 mmol/L, LDLC ≥ 4.1 mmol/L, HDLC < 1.0 mmol/L, or previously diagnosed dyslipidemia, were the criteria used to define the dyslipidemia group (DL), and those subjects who did not match the DL criteria were assigned to the non-dyslipidemia group (ND).
In the logistic analyses, from the viewpoint of preventive medicine, as well as to avoid the small subject numbers for the genotypes of low minor allele frequency (MAF)[23], the available marginally-elevated cut-off values for TG (≥ 1.7 mmol/L), TC (≥ 5.2 mmol/L), and LDLC (≥ 3.4 mmol/L), as well as the only available cut-off value for HDLC (< 1.0 mmol/L), were used to define the abnormal subgroups for the corresponding lipid parameters.
-
The protocols for DNA preparation and SNP genotyping described in our previous studies[23, 24] were also adopted in the present study. Briefly, an asymmetric amplification with molecular beacon-based real-time quantitative PCR (MB-qPCR) followed by a melting step was performed to determine the variation of the SNP loci. Before its application to the large sample size analysis, the method was verified with the gold standard of Sanger sequencing (ThermoFisher, Shanghai, China). The information of primers and molecular beacons for the genotyping experiment with qPCR (Roche 480II, Singapore) is presented in Supplementary Table S1, available in www.besjournal.com.
NCBI rs ID SNP name Allelesa Positionb Oligo name Oligo sequence, 5’–3’ directionc Length of
amplicon, bprs11568820 Cdx2 C > T promoter region, Probe cctgaTTACTGTGACCTAGTTTACTCAGG 179 chr12:47908762 Forward primer CAATGAAAGCAAACCAAGGGGTCTTC Backward primer AGGAAGGAAAAGAGGATAGAGAAAAT rs2228570 Fok1 A > Bd exon 2, chr12:47879112 Probe ccgcGGGATGGAGGCAATGGCGG 178 Forward primer CACTGACTCTGGCTCTGACCGT Backward primer GCAGCCTTCACAGGTCATA rs7975232 Apa1 C > A intron 8, chr12:47845054 Probee ctTGGGCCCCTCACTGCTCAAg 185 rs731236 Taq1 A > G exon 9, chr12:47844974 Probee cgcGGATGGCCTCAATCAGCGCG Forward primer GGCGGCAGCGGATGTACG Backward primer GCCGTTGAGTGTCTGTGT Note. aThe usages of these alleles are consistent to those used in the NCBI dbSNP database. bLocation of the allelic bases on the VDR and chromosome 12. cIn the probe sequence, the lowercase letters at the 5’ or 3’ end are adaptor bases, and the highlighted letters are one of the alleles in the SNP locus. dB, degenerate base standing for C, G, and T, i.e. not A. eApa1 and Taq1 were detected with their respective probe on the same qPCR amplicon. Table S1. The information of molecular beacon probes and primers for genotyping the four single nucleotide polymorphisms (SNPs) of vitamin D receptor gene (VDR)
The nucleotide bases used in our study were consistent with those in dbSNP of NCBI, i.e., C > T for rs11568820 (Cdx2), A > B (not A) for rs2228570 (Fok1), C > A for rs7975232 (Apa1), and A > G for rs731236 (Taq1). If the complementary bases [G > A for Cdx2, T > V (standing for A, C, and G) for Fok1, G > T for Apa1, and T > C for Taq1], or the letter standing for the DNA-digestibility with the corresponding restriction enzyme (f > F for Fok1, a > A for Apa1, and T > t for Taq1), were used in the references, the original usages were provided as bracketed annotations in our article.
-
The statistical analyses were performed using SPSS for Windows version 25 (IBM Corp., Armonk, NY, USA). Clinical data were presented as medians and interquartile ranges (25% to 75%) and compared with rank-sum tests (Wilcoxon rank test or Kruskal-Wallis rank test). The genotypes of the four SNPs were tested with Hardy-Weinberg equilibrium (HWE) analyses for sampling representation. For genotypic comparisons, differences in allele and genotype frequencies were evaluated using the chi-square (χ2) test. The homozygous genotypes of CC for Cdx2, AA for Fok1, CC for Apa1, and AA for Taq1 were used as reference genotypes, respectively. For both genders, the additive, dominant, recessive, homozygous, and allelic models for each of the SNPs were entered into the logistic regression analyses for odds ratios (ORs) and 95% CIs with adjustment for age, BMI, FPG, HbA1c, 25OHD, SBP, and DBP. In order to analyze the interaction between VD nutritional levels and VDR SNPs, the interaction factor calculated by 25OHD concentrations and VDR SNPs were entered into the logistic regression with adjustment for those confounders mentioned above. A simple linear regression was used to assess the association between circulating 25OHD and lipid profiles. A P-value of less than 0.05 was considered to be statistically significant.
-
A total of 1,987 adults were included in the analysis, aged from 20 to 81 years old. Among them, there were 1,124 females aged 39 (31–49) (median and interquartile range) years old and 863 males aged 36 (30–44) years old. The clinical profiles of the participants were divided into DL and ND for each gender, as summarized in Table 1. It was indicated that several metabolic or metabolism-related parameters were statistically different between DL and ND adults (P < 0.05), such as age, BMI, FPG, HbA1c, SBP, DBP, TG, TC, LDLC, HDLC, etc. In particular, 25OHD concentrations were statistically different between DL and ND groups in men but not in women.
Variables Female Male DL (n = 236) ND (n = 888) P-value DL (n = 299) ND (n = 564) P-value Age, y 50 (38.3–57) 36 (30–46) < 0.001 39 (33–47) 33 (29–42) < 0.001 BMI, kg/m2 23.1 (21.1–24.9) 21.6 (20.0–23.2) < 0.001 25.3 (24.0–27.0) 23.9 (22.0–25.6) < 0.001 25OHD, nmol/L 59.3 (49.6–71.3) 58.4 (49.2–68.3) 0.245 60.8 (50.8–71.1) 63.4 (54.3–73.6) 0.005 Sun exposure time, min/w 23.0 (10.0–39.0) 20.0 (10.0–39.0) 0.680 24.0 (10.0–41.0) 24.0 (13.0–50.0) 0.135 FPG, mmol/L 5.6 (5.3–6.0) 5.3 (5.0–5.6) < 0.001 5.5 (5.2–5.9) 5.3 (5.0–5.6) < 0.001 HbA1c, % 5.8 (5.5–6.1) 5.5 (5.4–5.7) < 0.001 5.7 (5.5–6.0) 5.6 (5.4–5.8) < 0.001 SBP, mmHg 118 (108–133.8) 111.5 (104–121) < 0.001 126 (118–136) 121.5 (112–131) < 0.001 DBP, mmHg 71 (64–79) 67 (61–73) < 0.001 77 (71–85) 73 (67–80) < 0.001 TG, mmol/L 1.7 (1.0–2.8) 0.8 (0.6–1.1) < 0.001 2.7 (2.1–3.6) 1.2 (0.9–1.6) < 0.001 TC, mmol/L 6.4 (5.4–6.9) 4.9 (4.4–5.4) < 0.001 5.7 (4.7–6.4) 5.0 (4.4–5.5) < 0.001 LDLC, mmol/L 3.7 (3.0–3.9) 2.7 (2.4–3.1) < 0.001 3.2 (2.7–3.7) 2.8 (2.5–3.1) < 0.001 HDLC, mmol/L 1.6 (1.4–1.8) 1.4 (1.3–1.6) < 0.001 1.5 (1.3–1.6) 1.3 (1.2–1.5) < 0.001 Note. BMI: body mass index; DBP: diastolic blood pressure; DL: dyslipidemia; FPG: fasting plasma glucose; HbA1c: glycated hemoglobin; HDLC: high-density lipoprotein cholesterol; LDLC: low-density lipoprotein cholesterol; ND: non-dyslipidemia; SBP: systolic blood pressure; TC: total cholesterol; TG: triglyceride. Table 1. Clinical profiles of study subjects (medians and interquartile ranges)
-
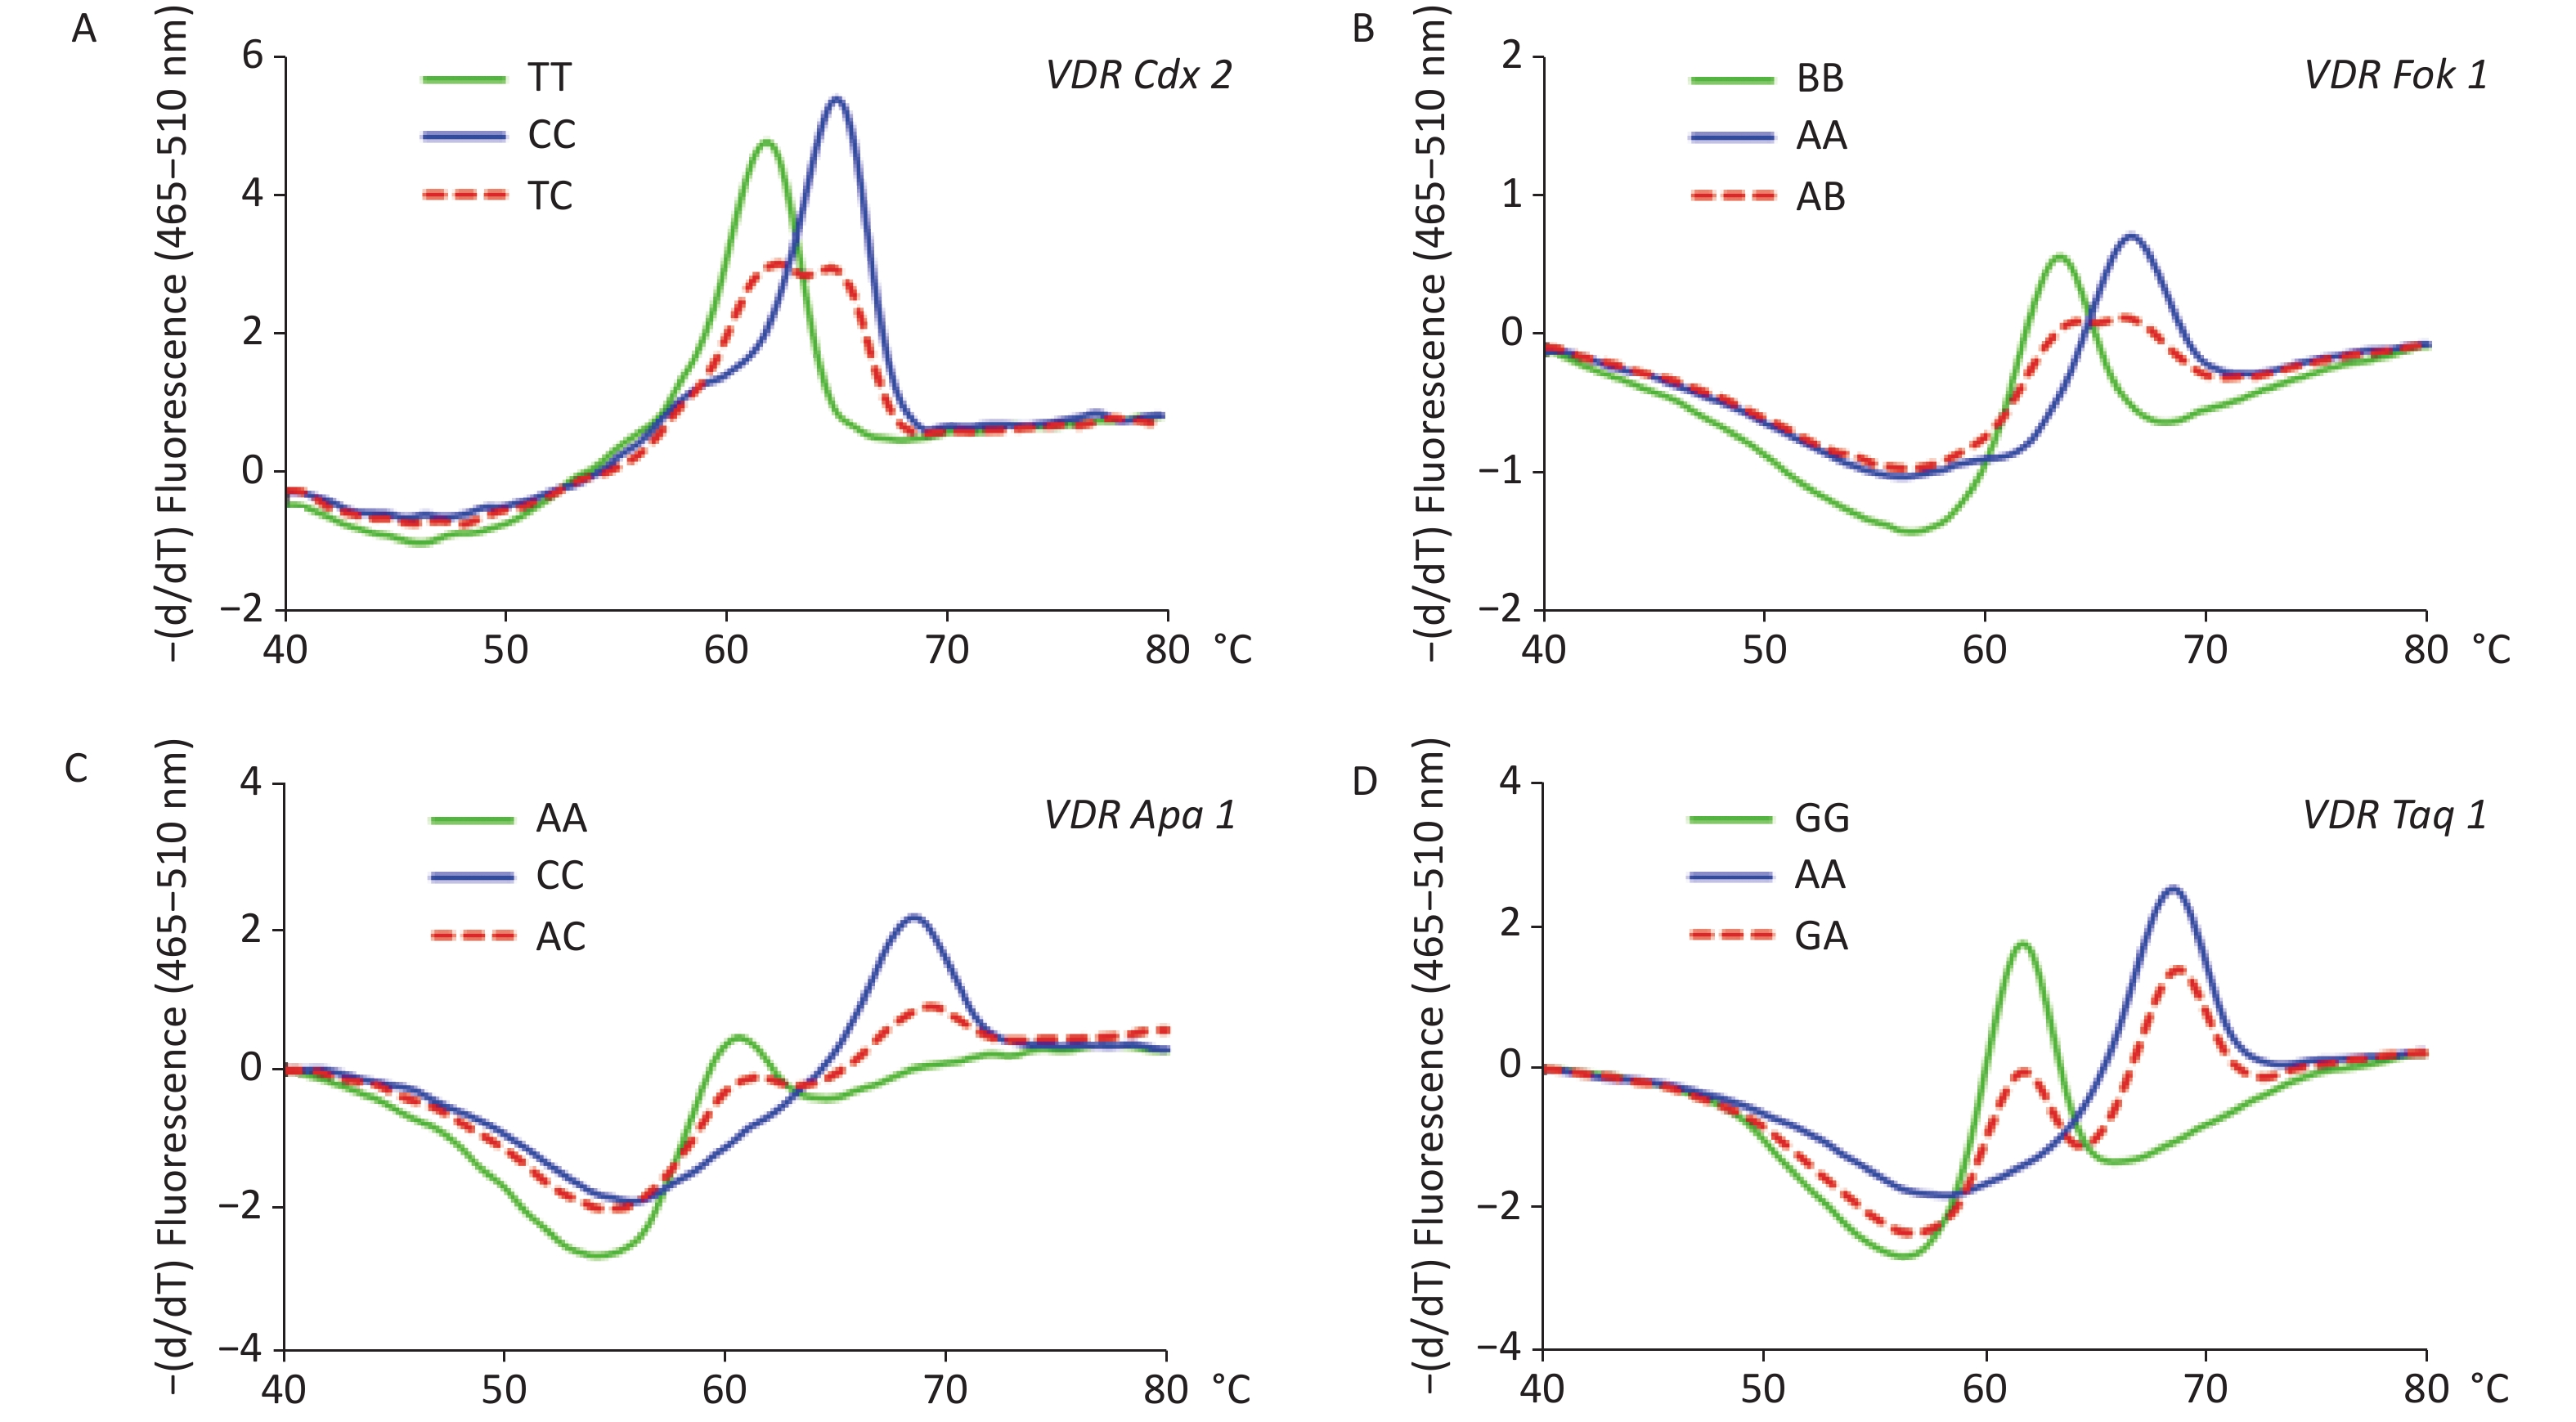
The results of the genotyping experiment on the SNPs with MB-qPCR are shown in Supplementary Figure S1, available in www.besjournal.com. The HWE test showed that the population sampled from the Health Examination Center was representative of the population at large (Supplementary Table S2, available in www.besjournal.com). The genotypic and allelic frequencies of VDR SNPs between DL and ND groups are summarized in Supplementary Table S3, available in www.besjournal.com. In the female participants, both genotypic and allelic frequencies of Fok1 showed differences between DL and ND groups (P < 0.05); while in the male participants, these differences were not observed. The genotypic and allelic frequencies of the other three SNPs, namely Cdx2, Apa1, and Taq1, did not display significant differences between the DL and ND groups for either gender (P ≥ 0.05), and neither did their different genetic models (Supplementary Tables S4–S6, available in www.besjournal.com).
Gene Additive model Dominant model Recessive model Homozygous model Allelic model models GG AG AA GG + AG AA GG AG + AA GG AA G A DL n 2 45 488 47 488 2 533 2 488 49 1,021 % 0.4 8.4 91.2 8.8 91.2 0.4 99.6 0.4 99.6 4.6 95.4 ND n 7 141 1,304 148 1,304 7 1,445 7 1,304 155 2,749 % 0.5 9.6 89.9 10.2 89.8 0.5 99.5 0.5 99.5 5.3 94.7 Total n 9 186 1,792 195 1,792 9 1,978 9 1,792 204 3,770 % 0.5 9.4 90.2 9.8 90.2 0.5 99.5 0.5 99.5 5.1 94.9 χ2 0.89 0.88 0.00 0.11 0.92 P value 0.64 0.35 1.00 0.74 0.34 Table S6. Genetic model comparison of Taq1 (rs731236) in vitamin D receptor gene between dyslipidemia (DL) and non-dyslipidemia (ND) adults
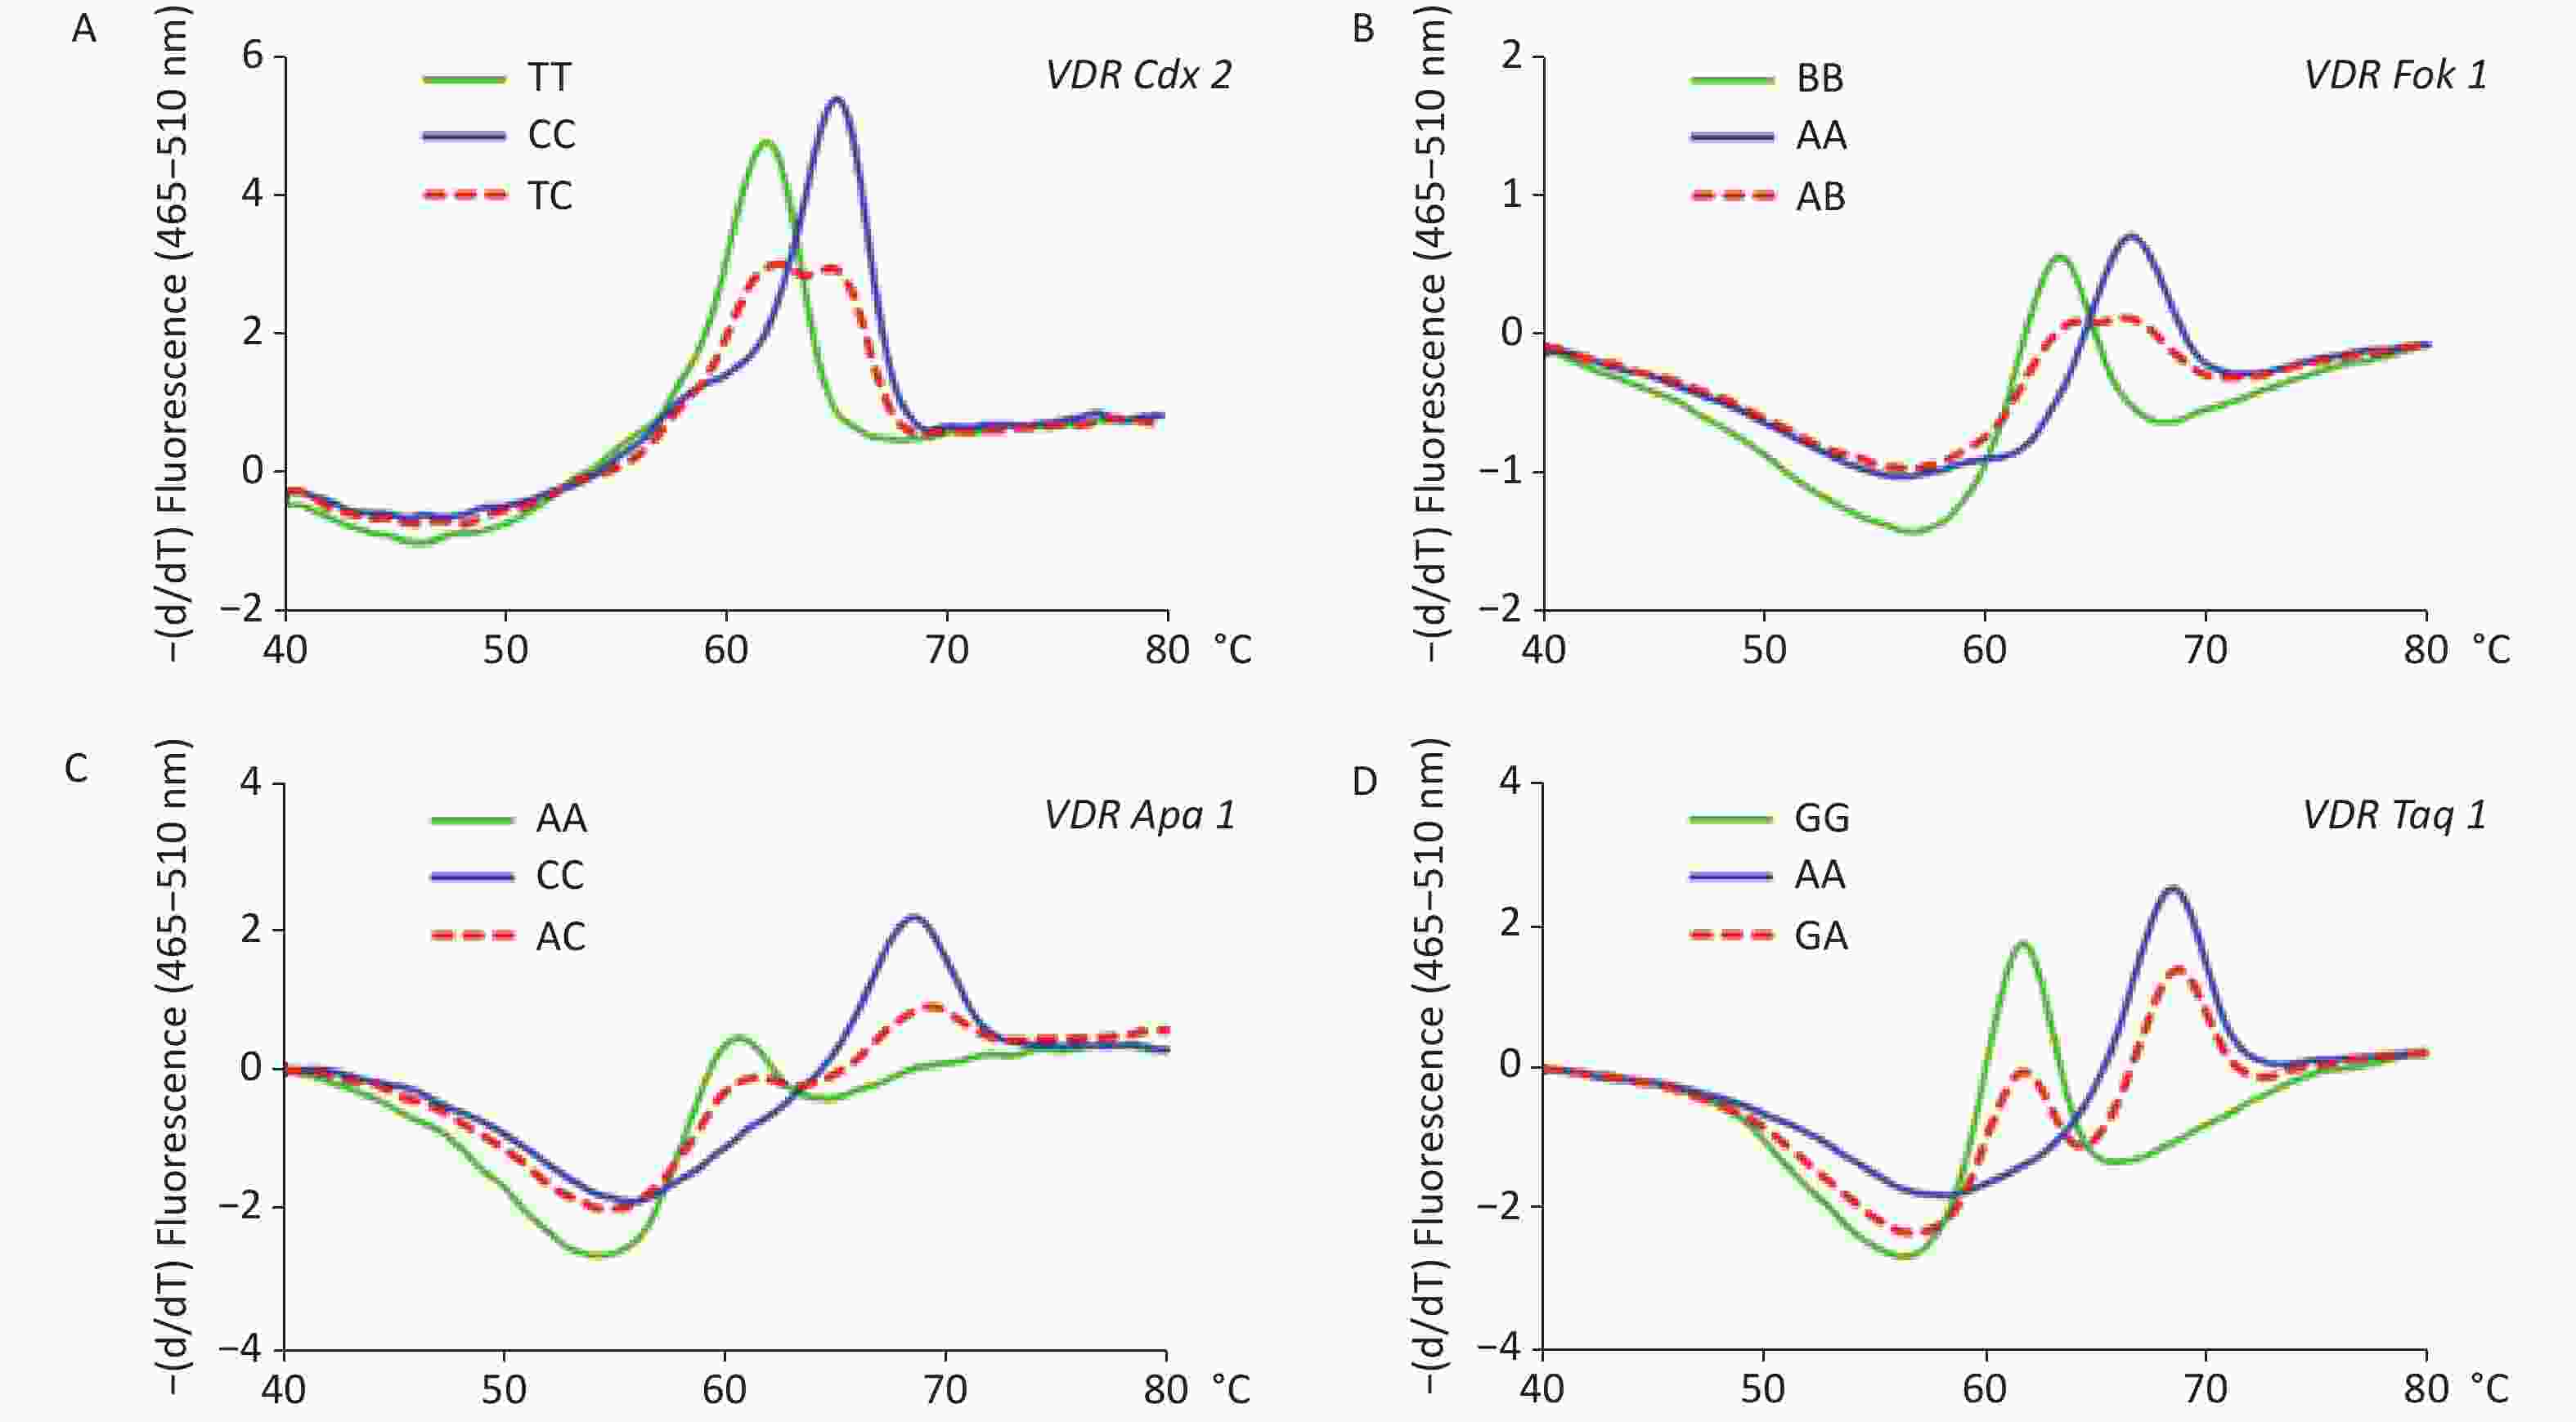
Figure S1. Melting curve analyses on the polymorphisms of vitamin D receptor gene (VDR). Panel A: Melting curve of VDR Cdx2 (rs11568820, A). Panel B: Melting curve of Fok1 (rs2228570, B). Panel C: Melting curve of VDR Apa1 (rs7975232, C). Panel D: Melting curve of VDR Taq1 (rs731236, D).
Genotype n Genotype frequency, % χ2 P value* Cdx2 TT CT CC DL 1,142 20.0 47.0 34.0 2.06 0.15 ND 845 19.0 51.0 30.0 0.80 0.37 total 1,987 19.0 49.0 32.0 0.26 0.61 Fok1 BB AB AA DL 1,142 28.0 52.0 20.0 2.38 0.12 ND 845 28.0 50.0 22.0 0.06 0.81 total 1,987 28.0 51.0 21.0 1.75 0.19 Apa1 AA AC CC DL 1,142 10.0 39.0 51.0 4.85 0.03 ND 845 9.0 42.0 49.0 0.09 0.76 total 1,987 9.0 40.0 50.0 2.14 0.14 Taq1 GG AG AA DL 1,142 0.5 8.0 90.0 2.73 0.10 ND 845 0.5 11.0 91.0 0.60 0.44 total 1,987 1.0 9.0 90.0 3.01 0.08 Note. Abbreviations: B, degenerate base standing for C, G, and T; DL, dyslipidemia; ND, non-dyslipidemia. *Hardy-Weinberg equilibrium analyses test for the genotypes of the four SNPs. Table S2. Hardy-Weinberg equilibrium tests on the vitamin D receptor gene polymorphisms, Cdx2 (rs11568820), Fok1 (rs2228570), Apa1 (rs7975232), and Taq1 (rs731236)
Genotype Female Male DL, %
n = 236ND, %
n = 888χ2 P value DL, %
n = 299ND, %
n = 564χ2 P value Cdx2 TT 17.8 19.4 0.955 0.620 20.4 19.1 0.390 0.823 CT 50.0 51.6 43.8 45.9 CC 32.2 29.1 35.8 34.9 T 42.8 45.2 0.841 0.359 42.3 42.1 0.006 0.937 C 57.2 54.8 57.7 57.9 Fok1 AA 15.3 23.3 11.658 0.003 16.7 21.6 3.871 0.144 AB 48.7 50.2 53.2 52.8 BB 36.0 26.5 30.1 25.5 A 39.6 48.4 11.618 0.001 43.3 48.0 3.528 0.060 B 60.4 51.6 56.7 52.0 Apa1 AA 9.3 9.9 0.120 0.942 8.7 9.0 0.304 0.859 AC 41.1 40.1 41.5 39.5 CC 49.6 50.0 49.8 51.4 A 29.9 30.0 0.001 0.972 29.4 28.8 0.073 0.787 C 70.1 70.0 70.6 71.2 Taq1 AA 91.5 88.9 1.496 0.476 91.0 91.3 0.256 0.921 AG 8.1 10.7 8.7 8.2 GG 0.4 0.5 0.3 0.5 A 95.6 94.2 1.305 0.253 95.3 95.4 0.005 0.946 G 4.4 5.8 4.7 4.6 Note. Abbreviations: B, degenerate base standing for C, G, and T. Table S3. Comparisons of the genotypic and allelic frequencies of vitamin D receptor gene polymorphisms, Cdx2 (rs11568820), Fok1 (rs2228570), Apa1 (rs7975232), and Taq1 (rs731236) between dyslipidemia (DL) and non-dyslipidemia (ND) adults
Gene Additive model Dominant model Recessive model Homozygous model Allelic model models TT CT CC TT + CT CC TT CT + CC TT CC T C DL n 103 249 183 352 183 103 432 103 183 455 615 % 19.3 46.5 34.2 65.8 34.2 19.3 80.7 36.0 64.0 42.5 57.5 ND n 280 717 455 997 455 280 1,172 280 455 1,277 1,627 % 19.3 49.4 31.3 68.7 31.3 19.3 80.7 38.1 61.9 44.0 56.0 Total n 383 966 638 1,349 638 383 1,604 383 638 1,732 2,242 % 19.3 48.6 32.1 67.9 32.1 19.3 80.7 37.5 62.5 43.6 56.4 χ2 1.54 1.48 0.00 0.38 0.67 P value 0.46 0.22 0.99 0.54 0.41 Table S4. Genetic model comparison of Cdx2 (rs11568820) in vitamin D receptor gene between dyslipidemia (DL) and non-dyslipidemia (ND) adults
-
Logistic regression analyses were performed with adjustment for age and BMI since the adjustment for 25OHD did not change the overall correlations (see Supplementary Tables S7–S8). For female participants (see Table 2), between the subgroups of LDLC (≥ 3.4 vs. < 3.4 mmol/L), VDR Fok1 presented significance (P < 0.05) in its additive (BB vs. AB vs. AA, P = 0.03, OR = 1.28, 95% CI: 1.03–1.59), recessive (BB vs. AB + AA, P = 0.03, OR = 1.44, 95% CI: 1.04–2.00), homozygous (BB vs. AA, P = 0.02, OR = 2.89, 95% CI: 1.18–7.05), and allelic (B vs. A, P = 0.04, OR = 1.26, 95% CI: 1.01–1.59) models, but between the subgroups of TC (≥ 5.2 vs. < 5.2 mmol/L) and HDLC (< 1.0 vs. ≥ 1.0 mmol/L), no significance (P ≥ 0.05) was found in all models of the four SNPs.
Gene models TG ≥ 1.7 vs. < 1.7 mmol/L TC ≥ 5.2 vs. < 5.2 mmol/L LDLC ≥ 3.4 vs. < 3.4 mmol/L HDLC < 1.0 vs. ≥ 1.0 mmol/L P OR (95% CI) P OR (95% CI) P OR (95% CI) P OR (95% CI) Apa1 (rs7975232) Add.: AA vs. AC vs. CC 0.45 1.11
(0.84–1.48)0.47 0.93
(0.75–1.14)0.39 1.11
(0.87–1.42)0.93 1.03
(0.52–2.02)Dom.: AA + AC vs. CC 0.59 1.11
(0.77–1.59)0.34 0.88
(0.67–1.15)0.59 1.09
(0.79–1.50)0.84 1.10
(0.45–2.69)Rec.: AA vs. AC + CC 0.76 1.10
(0.61–1.98)0.86 0.96
(0.62–1.48)0.35 1.27
(0.77–2.09)0.95 0.96
(0.22–4.22)Hom.: AA vs. CC 0.20 0.25
(0.03–2.05)0.56 1.31
(0.53–3.22)0.17 2.01
(0.74–5.50)0.84 1.29
(0.12–13.92)Alle.: A vs. C 0.44 1.12
(0.84–1.51)0.36 0.90
(0.73–1.12)0.61 1.07
(0.83–1.38)0.87 1.06
(0.52–2.19)Cdx2 (rs11568820) Add.: TT vs. CT vs. CC 0.13 0.82
(0.64–1.06)0.77 0.97
(0.81–1.17)0.76 1.04
(0.83–1.29)0.35 0.74
(0.40–1.38)Dom.: TT + CT vs. CC 0.09 0.72
(0.50–1.05)0.30 0.86
(0.65–1.14)0.70 1.07
(0.77–1.49)0.74 0.85
(0.34–2.14)Rec.: TT vs. CT + CC 0.57 0.88
(0.56–1.37)0.48 1.12
(0.82–1.55)0.99 1.00
(0.68–1.48)0.20 0.38
(0.09–1.65)Hom.: TT vs. CC 0.33 0.61
(0.23–1.64)0.23 1.49
(0.77–2.88)0.58 1.26
(0.56–2.84)0.34 0.33
(0.04–3.16)Alle.: T vs. C 0.10 0.80
(0.62–1.04)0.81 0.98
(0.81–1.18)0.70 0.96
(0.76–1.20)0.27 0.70
(0.37–1.33)Fok1 (rs2228570) Add.: BB vs. AB vs. AA 0.54 1.08
(0.84–1.39)0.36 1.09
(0.91–1.30)0.03 1.28
(1.03–1.59)0.63 1.16
(0.64–2.13)Dom.: BB + AB vs. AA 0.49 1.17
(0.75–1.81)0.67 1.07
(0.78–1.46)0.20 1.29
(0.88–1.90)0.59 0.77
(0.29–2.01)Rec.: BB vs. AB + AA 0.69 1.08
(0.74–1.59)0.28 1.17
(0.88–1.54)0.03 1.44
(1.04–2.00)0.19 1.80
(0.75–4.30)Hom.: BB vs. AA 0.27 0.60
(0.24–1.48)0.76 1.11
(0.58–2.11)0.02 2.89
(1.18–7.05)0.95 1.06
(0.16–7.25)Alle.: B vs. A 0.30 1.15
(0.89–1.49)0.20 1.13
(0.94–1.36)0.04 1.27
(1.01–1.59)0.46 1.27
(0.67–2.40)Taq1 (rs731236) Add.: GG vs. AG vs. AA 0.10 0.57
(0.29–1.11)0.36 0.81
(0.53–1.24)0.81 0.94
(0.57–1.55)0.86 0.87
(0.20–3.83)Dom.: GG + AG vs. AA 0.13 0.59
(0.30–1.17)0.38 0.82
(0.53–1.28)0.88 0.96
(0.57–1.62)0.94 0.95
(0.20–4.48)Rec.: GG vs. AG + AA 1.00 0.00
(0.00–NA)0.47 0.43
(0.05–4.10)0.93 1.11
(0.12–10.47)1.00 0.00
(0.00–NA)Hom.: GG vs. AA NA NA
(NA–NA)NA NA
(NA–NA)NA NA
(NA–NA)NA NA
(NA–NA)Alle.: G vs. A 0.11 0.58
(0.30–1.14)0.31 0.80
(0.52–1.23)0.72 0.91
(0.55–1.51)0.88 0.89
(0.19–4.07)Note. Abbreviations: Add.: additive model; Alle.: allelic model; B: degenerate base standing for C, G, and T; CI: confidence interval; Dom.: dominant model; HDLC: high-density lipoprotein cholesterol; Hom.: homozygous model; LDLC: low-density lipoprotein cholesterol; NA: not available; OR: odds ratio; Rec.: recessive model; SNPs: single nucleotide polymorphisms; TC: total cholesterol; TG: triglyceride; VDR: vitamin D receptor gene. Table 2. Logistic regression analyses of lipids with SNPs of VDR in adult females with adjustment for age and body mass index
Gene models TG ≥ 1.7 vs. < 1.7 mmol/L TC ≥ 5.2 vs. < 5.2 mmol/L LDLC ≥ 3.4 vs. < 3.4 mmol/L HDLC < 1.0 vs. ≥ 1.0 mmol/L P OR (95% CI) P OR (95% CI) P OR (95% CI) P OR (95% CI) Apa1 (rs7975232) Add.: AA vs. AC vs. CC 0.47 1.11
(0.84–1.47)0.48 0.93
(0.76–1.14)0.38 1.12
(0.87–1.43)0.93 1.03
(0.52–2.04)Dom.: AA + AC vs. CC 0.59 1.10
(0.77–1.59)0.35 0.88
(0.67–1.15)0.59 1.09
(0.79–1.50)0.87 1.08
(0.44–2.64)Rec.: AA vs. AC + CC 0.84 1.06
(0.59–1.92)0.88 0.97
(0.63–1.49)0.33 1.29
(0.78–2.12)0.99 1.01
(0.23–4.45)Hom.: AA vs. CC 0.16 0.21
(0.03–1.86)0.52 1.35
(0.54–3.34)0.16 2.09
(0.75–5.81)0.71 1.63
(0.13–20.27)Alle.: A vs. C 0.45 1.12
(0.83–1.51)0.38 0.91
(0.73–1.13)0.54 1.08
(0.84–1.40)0.79 1.11
(0.53–2.33)Cdx2 (rs11568820) Add.: TT vs. CT vs. CC 0.15 0.83
(0.64–1.07)0.77 0.97
(0.81–1.17)0.79 1.03
(0.83–1.29)0.38 0.76
(0.40–1.42)Dom.: TT + CT vs. CC 0.10 0.73
(0.50–1.06)0.30 0.86
(0.65–1.14)0.70 1.07
(0.76–1.49)0.79 0.88
(0.35–2.23)Rec.: TT vs. CT + CC 0.65 0.90
(0.57–1.41)0.49 1.12
(0.81–1.55)0.97 0.99
(0.67–1.46)0.20 0.38
(0.09–1.68)Hom.: TT vs. CC 0.42 0.66
(0.23–1.85)0.27 1.45
(0.75–2.82)0.51 1.32
(0.58–3.02)0.27 0.28
(0.03–2.71)Alle.: T vs. C 0.11 0.81
(0.62–1.05)0.98 1.00
(0.83–1.21)0.79 0.97
(0.77–1.22)0.45 0.77
(0.40–1.50)Fok1 (rs2228570) Add.: BB vs. AB vs. AA 0.57 1.08
(0.84–1.39)0.35 1.09
(0.91–1.31)0.03 1.28
(1.03–1.59)0.68 1.13
(0.62–2.07)Dom.: BB + AB vs. AA 0.51 1.16
(0.75–1.80)0.64 1.08
(0.79–1.47)0.18 1.31
(0.89–1.92)0.57 0.76
(0.29–1.99)Rec.: BB vs. AB + AA 0.70 1.08
(0.73–1.59)0.29 1.16
(0.88–1.54)0.03 1.45
(1.04–2.00)0.22 1.72
(0.72–4.14)Hom.: BB vs. AA 0.22 0.55
(0.21–1.44)0.68 1.15
(0.60–2.20)0.02 2.86
(1.16–7.08)0.98 1.03
(0.14–7.63)Alle.: B vs. A 0.30 1.15
(0.88–1.49)0.27 1.11
(0.92–1.34)0.05 1.26
(1.00–1.58)0.37 1.36
(0.70–2.65)Taq1 (rs731236) Add.: GG vs. AG vs. AA 0.08 0.55
(0.28–1.08)0.35 0.82
(0.54–1.25)0.85 0.95
(0.58–1.58)0.87 0.89
(0.20–3.87)Dom.: GG + AG vs. AA 0.11 0.57
(0.28–1.13)0.41 0.83
(0.53–1.29)0.94 0.98
(0.58–1.66)0.98 0.98
(0.21–4.64)Rec.: GG vs. AG + AA 1.00 0.00
(0.00–NA)0.45 0.42
(0.04–3.99)0.96 1.06
(0.11–10.06)1.00 0.00
(0.00–NA)Hom.: GG vs. AA NA NA
(NA–NA)NA NA
(NA–NA)NA NA
(NA–NA)NA NA
(NA–NA)Alle.: G vs. A 0.12 0.59
(0.30–1.15)0.27 0.79
(0.51–1.21)0.75 0.92
(0.56–1.53)0.86 0.87
(0.19–4.09)Note. Abbreviations: Add., additive model; Alle., allelic model; B, degenerate base standing for C, G, and T; CI, confidential interval; Dom., dominant model; HDLC, high-density lipoprotein cholesterol; Hom., homozygous model; LDLC, low-density lipoprotein cholesterol; NA, not available; OR, odds ratio; Rec., recessive model; SNPs, single nucleotide polymorphisms; TC, total cholesterol; TG, triglyceride; VDR, vitamin D receptor gene. Table S7. Logistic regression analyses of lipids with SNPs of VDR in adult females with adjustment for age, body mass index, dietary 25-hydroxyvitamin D, and the sunshine time per week
Gene models TG
≥ 1.7 vs. < 1.7 mmol/LTC
≥ 5.2 vs. < 5.2 mmol/LLDLC
≥ 3.4 vs. < 3.4 mmol/LHDLC
< 1.0 vs. ≥ 1.0 mmol/LP OR (95% CI) P OR (95% CI) P OR (95% CI) P OR (95% CI) Apa1 (rs7975232) Add.: AA vs. AC vs. CC 0.55 1.08
(0.85–1.37)0.95 0.99
(0.79–1.24)0.92 0.99
(0.75–1.30)0.11 1.72
(0.88–3.35)Dom.: AA + AC vs. CC 0.49 1.12
(0.82–1.51)0.46 0.90
(0.68–1.19)0.74 0.94
(0.67–1.34)0.13 2.11
(0.81–5.51)Rec.: AA vs. AC + CC 0.77 1.08
(0.64–1.83)0.23 1.35
(0.83–2.20)0.82 1.07
(0.58–1.97)0.51 1.54
(0.43–5.53)Hom.: AA vs. CC 0.74 1.18
(0.45–3.11)0.25 1.72
(0.69–4.29)0.56 1.36
(0.49–3.82)0.31 3.00
(0.37–24.68)Alle.: A vs. C 0.47 1.10
(0.86–1.41)0.66 1.05
(0.84–1.33)0.83 0.97
(0.73–1.29)0.35 1.39
(0.70–2.77)Cdx2 (rs11568820) Add.: TT vs. CT vs. CC 0.65 0.96
(0.78–1.17)0.09 0.85
(0.71–1.03)0.46 0.92
(0.73–1.16)0.12 1.62
(0.89–2.95)Dom.: TT + CT vs. CC 0.88 0.98
(0.72–1.33)0.14 0.81
(0.61–1.07)0.64 0.92
(0.65–1.30)0.57 1.32
(0.50–3.50)Rec.: TT vs. CT + CC 0.57 0.90
(0.62–1.30)0.20 0.80
(0.57–1.13)0.40 0.83
(0.54–1.28)0.04 2.68
(1.06–6.75)Hom.: TT vs. CC 0.06 2.25
(0.97–5.23)0.82 0.92
(0.42–1.99)0.74 1.17
(0.47–2.95)0.19 4.84
(0.46–51.14)Alle.: T vs C 0.62 0.95
(0.76–1.18)0.14 0.86
(0.70–1.05)0.45 0.91
(0.71–1.17)0.30 1.42
(0.73–2.73)Fok1 (rs2228570) Add.: BB vs. AB vs. AA 0.50 0.93
(0.75–1.15)0.08 0.84
(0.69–1.02)0.77 1.04
(0.81–1.33)0.02 2.26
(1.12–4.56)Dom.: BB + AB vs. AA 0.75 0.94
(0.65–1.36)0.30 0.84
(0.59–1.17)0.63 1.11
(0.72–1.72)0.23 2.48
(0.57–10.90)Rec.: BB vs. AB + AA 0.47 0.89
(0.64–1.23)0.08 0.76
(0.56–1.03)0.97 0.99
(0.68–1.45)0.03 2.75
(1.12–6.74)Hom.: BB vs. AA 0.89 1.06
(0.48–2.35)0.80 1.11
(0.52–2.35)0.82 1.11
(0.45–2.73)0.82 0.79
(0.10–6.34)Alle.: B vs. A 0.50 0.93
(0.75–1.15)0.19 0.87
(0.71–1.07)0.53 1.08
(0.84–1.39)0.09 1.85
(0.91–3.76)Taq1 (rs731236) Add.: GG vs AG vs. AA 0.67 1.12
(0.67–1.86)0.70 1.10
(0.68–1.76)0.30 0.72
(0.38–1.35)0.64 0.69
(0.15–3.19)Dom.: GG + AG vs. AA 0.69 1.12
(0.65–1.91)0.75 1.09
(0.66–1.79)0.42 0.76
(0.40–1.47)0.85 0.86
(0.19–3.97)Rec.: GG vs. AG + AA 0.83 1.27
(0.15–11.06)0.47 2.36
(0.23–24.37)1.00 0.00
(0.00–NA)1.00 0.00
(0.00–NA)Hom.: GG vs. AA NA NA
(NA–NA)NA NA
(NA–NA)NA NA
(NA–NA)NA NA
(NA–NA)Alle.: G vs. A 0.65 1.13
(0.67–1.89)0.68 1.11
(0.68–1.79)0.31 0.72
(0.38–1.37)0.71 0.75
(0.17–3.37)Note. Abbreviations: Add., additive model; Alle., allelic model; B, degenerate base standing for C, G, and T; CI, confidential interval; Dom., dominant model; HDLC, high-density lipoprotein cholesterol; Hom., homozygous model; LDLC, low-density lipoprotein cholesterol; NA, not available; OR, odds ratio; Rec., recessive model; SNPs, single nucleotide polymorphisms; TC, total cholesterol; TG, triglyceride; VDR, vitamin D receptor gene. Table S8. Logistic regression analyses of lipids with SNPs of VDR in adult males with adjustment for age, body mass index, dietary 25-hydroxyvitamin D, and the sunshine time per week
Table 3 displays the logistic regression analyses of the relationships between the lipids and the SNPs of VDR in the male participants. Between the subgroups of HDLC (< 1.0 vs. ≥ 1.0 mmol/L), the data presented significance (P < 0.05) in the recessive model of Cdx2 (TT vs. CT + CC, P = 0.04, OR = 2.70, 95% CI: 1.08–6.80) and the additive (BB vs. AB vs. AA, P = 0.02, OR = 2.25, 95% CI: 1.12–4.52) and recessive (BB vs. AB + AA, P = 0.02, OR = 2.73, 95% CI: 1.11–6.70) models of Fok1, while other models of the genotype showed no significance (P ≥ 0.05). Differences were not found for Apa1 and Taq1 between the subgroups defined by any of the lipid profiles (P ≥ 0.05).
Gene models TG ≥ 1.7 vs. < 1.7 mmol/L TC ≥ 5.2 vs. < 5.2 mmol/L LDLC ≥ 3.4 vs. < 3.4 mmol/L HDLC < 1.0 vs. ≥ 1.0 mmol/L P OR (95% CI) P OR (95% CI) P OR (95% CI) P OR (95% CI) Apa1 (rs7975232) Add.: AA vs. AC vs. CC 0.65 1.06
(0.83–1.34)0.89 0.98
(0.79–1.23)0.86 0.98
(0.74–1.29)0.12 1.71
(0.88–3.31)Dom.: AA + AC vs. CC 0.54 1.10
(0.81–1.49)0.43 0.89
(0.67–1.18)0.71 0.94
(0.66–1.33)0.13 2.10
(0.80–5.48)Rec.: AA vs. AC + CC 0.90 1.04
(0.62–1.74)0.27 1.32
(0.81–2.15)0.88 1.05
(0.57–1.92)0.50 1.55
(0.43–5.53)Hom.: AA vs. CC 0.85 1.09
(0.44–2.72)0.26 1.67
(0.68–4.09)0.55 1.36
(0.50–3.73)0.28 3.17
(0.40–25.19)Alle.: A vs. C 0.49 1.09
(0.85–1.40)0.66 1.05
(0.84–1.33)0.86 0.98
(0.73–1.30)0.34 1.40
(0.70–2.78)Cdx2 (rs11568820) Add.: TT vs. CT vs. CC 0.66 0.96
(0.78–1.17)0.09 0.85
(0.71–1.03)0.46 0.92
(0.73–1.16)0.10 1.65
(0.91–3.00)Dom.: TT + CT vs. CC 0.90 0.98
(0.72–1.33)0.14 0.81
(0.61–1.07)0.65 0.92
(0.65–1.31)0.54 1.36
(0.51–3.59)Rec.: TT vs. CT + CC 0.56 0.90
(0.62–1.29)0.20 0.80
(0.57–1.13)0.40 0.83
(0.54–1.28)0.04 2.70
(1.08–6.80)Hom.: TT vs. CC 0.12 1.87
(0.85–4.13)0.71 0.87
(0.40–1.86)0.90 1.06
(0.43–2.61)0.19 4.71
(0.46–48.16)Alle.: T vs. C 0.67 0.95
(0.77–1.18)0.15 0.86
(0.71–1.06)0.45 0.91
(0.71–1.17)0.28 1.43
(0.74–2.76)Fok1 (rs2228570) Add.: BB vs. AB vs. AA 0.48 0.93
(0.75–1.15)0.08 0.84
(0.68–1.02)0.80 1.03
(0.81–1.32)0.02 2.25
(1.12–4.52)Dom.: BB + AB vs. AA 0.80 0.96
(0.66–1.37)0.32 0.84
(0.60–1.18)0.60 1.12
(0.73–1.73)0.22 2.53
(0.58–11.06)Rec.: BB vs. AB + AA 0.43 0.88
(0.63–1.21)0.07 0.75
(0.56–1.02)0.91 0.98
(0.67–1.43)0.03 2.73
(1.11–6.70)Hom.: BB vs. AA 0.83 1.09
(0.51–2.34)0.82 1.09
(0.52–2.29)0.79 1.13
(0.46–2.74)0.78 0.75
(0.10–5.83)Alle.: B vs. A 0.45 0.92
(0.74–1.14)0.16 0.87
(0.71–1.06)0.58 1.07
(0.84–1.38)0.10 1.82
(0.90–3.70)Taq1 (rs731236) Add.: GG vs. AG vs. AA 0.64 1.13
(0.68–1.85)0.69 1.10
(0.69–1.76)0.32 0.73
(0.39–1.37)0.65 0.71
(0.15–3.24)Dom.: GG + AG vs. AA 0.69 1.12
(0.66–1.90)0.74 1.09
(0.66–1.79)0.44 0.77
(0.40–1.48)0.84 0.85
(0.19–3.94)Rec.: GG vs. AG + AA 0.79 1.34
(0.16–11.27)0.46 2.42
(0.24–24.75)1.00 0.00
(0.00–NA)1.00 0.00
(0.00–NA)Hom.: GG vs. AA NA NA
(NA–NA)NA NA
(NA–NA)NA NA
(NA–NA)NA NA
(NA–NA)Alle.: G vs. A 0.62 1.14
(0.68–1.90)0.66 1.11
(0.69–1.80)0.32 0.72
(0.38–1.37)0.70 0.74
(0.17–3.34)Note. Abbreviations: Add.: additive model; Alle.: allelic model; B: degenerate base standing for C, G, and T; CI: confidence interval; Dom.: dominant model; HDLC: high-density lipoprotein cholesterol; Hom.: homozygous model; LDLC: low-density lipoprotein cholesterol; NA: not available; OR, odds ratio; Rec.: recessive model; SNPs: single nucleotide polymorphisms; TC: total cholesterol; TG: triglyceride; VDR: vitamin D receptor gene. Table 3. Logistic regression analyses of lipids with SNPs of VDR in adult males with adjustment for age and body mass index
-
No differences were found in the comparison of 25OHD concentrations across genotype models of VDR gene polymorphisms in both genders (see Supplementary Table S9, available in www.besjournal.com). When the plasma 25OHD concentrations in subjects with abnormal and normal lipid profiles were compared, it was shown that women with low HDLC had higher 25OHD while men with high TG had lower 25OHD than the subjects with normal lipid parameters (P < 0.05, Supplementary Table S10, available in www.besjournal.com).
-
In men, lg TG (β = −0.003, P < 0.001), LDLC (β = −0.003, P = 0.006), and HDLC (β = −0.001, P = 0.025) were inversely associated with the 25OHD concentration while in women, none of the lipid profiles showed a significant correlation with the 25OHD concentration (P ≥ 0.05, Supplementary Table S11, available in www.besjournal.com).
Genotype Female Male comparison n Median IQR P value n Median IQR P value Apa1 (rs7975232) Add: AA vs. AC vs. CC CC 561 58.97 [49.68–69.18] 0.35 439 63.18 [53.75–72.59] 0.83 AC 453 58.75 [49.16–68.63] 347 62.33 [52.65–73.59] AA 110 57.04 [48.40–65.71] 77 60.91 [52.44–73.32] Dom: AC + AA vs. CC AC + AA 563 58.53 [49.01–68.18] 0.47 424 62.12 [52.66–73.49] 0.54 CC 561 58.97 [49.68–69.18] 439 63.18 [53.75–72.59] Rec: AA vs. AC + CC AA 110 57.04 [48.40–65.71] 0.16 77 60.91 [52.44–73.32] 0.83 AC + CC 1,014 58.86 [49.50–68.82] 786 62.63 [53.24–72.72] Hom: AA vs. CC AA 110 57.04 [48.40–65.71] 0.15 77 60.91 [52.44–73.32] 0.74 CC 561 58.97 [49.68–69.18] 439 63.18 [53.75–72.59] Alle: A vs. C A 673 58.30 [48.86–67.20] 0.23 501 62.04 [52.66–73.38] 0.57 C 1,575 58.90 [49.54–68.88] 1,225 62.85 [53.38–72.66] Cdx2 (rs11568820) Add.: TT vs. CT vs. CC CC 334 59.17 [50.94–68.68] 0.20 304 61.79 [53.30–72.53] 0.69 CT 576 59.08 [48.96–69.29] 390 63.11 [53.50–72.93] TT 214 56.48 [48.30–67.03] 169 61.65 [51.85–72.31] Dom.: CT + TT vs. CC CT + TT 790 58.35 [48.80–68.56] 0.41 559 62.76 [53.14–72.88] 0.72 CC 334 59.17 [50.94–68.68] 304 61.79 [53.30–72.53] Rec.: TT vs. CT + CC TT 214 56.48 [48.30–67.03] 0.08 169 61.65 [51.85–72.31] 0.56 CT + CC 910 59.15 [49.50–69.12] 694 62.83 [53.46–72.73] Hom.: TT vs. CC TT 214 56.48 [48.30–67.03] 0.08 169 61.65 [51.85–72.31] 0.81 CC 334 59.17 [50.94–68.68] 304 61.79 [53.30–72.53] Alle: T vs. C T 1,004 58.00 [48.65–68.27] 0.13 728 62.59 [52.78–72.82] 0.93 C 1,244 59.15 [49.95–68.88] 998 62.61 [53.36–72.66] Fok1 (rs2228570) Add.: BB vs. AB vs. AA AA 243 57.56 [48.62–69.02] 0.83 172 63.52 [54.12–73.35] 0.47 AB 561 58.75 [49.14–69.11] 457 62.44 [53.50–72.16] BB 320 59.04 [49.98–67.16] 234 61.49 [51.87–72.67] Dom.: BB + AB vs. AA BB + AB 881 58.87 [49.43–68.55] 0.54 691 62.30 [53.17–72.33] 0.40 AA 243 57.56 [48.62–69.02] 172 63.52 [54.12–73.35] Rec.: BB vs. AB + AA BB 320 59.04 [49.98–67.16] 0.87 234 61.49 [51.87–72.67] 0.27 AB + AA 804 58.37 [49.03–69.07] 629 62.80 [53.64–72.82] Hom.: BB vs. AA BB 320 59.04 [49.98–67.16] 0.62 234 61.49 [51.87–72.67] 0.24 AA 243 57.56 [48.62–69.02] 172 63.52 [54.12–73.35] Alle.: B vs. A B 1,201 58.92 [49.55–68.41] 0.65 925 62.16 [52.72–72.54] 0.24 A 1,047 58.32 [49.01–69.02] 801 62.99 [53.89–72.93] Taq1 (rs731236) Add.: GG vs AG vs. AA AA 1,005 58.53 [49.43–68.66] 0.92 787 62.37 [53.24–72.59] 0.50 AG 114 60.05 [48.85–67.77] 72 64.27 [52.80–75.16] GG 5 53.88 [37.14–74.36] 4 67.28 [66.31–71.96] Dom.: AG + GG vs. AA AG + GG 119 59.98 [48.95–67.63] 0.91 76 64.98 [53.28–74.37] 0.46 AA 1,005 58.53 [49.43–68.66] 787 62.37 [53.24–72.59] Rec.: GG vs AG + AA GG 5 53.88 [37.14–74.36] 0.68 4 67.28 [66.31–71.96] 0.30 AG + AA 1,119 58.73 [49.36–68.59] 859 62.56 [53.20–72.72] Hom.: GG vs. AA GG 5 53.88 [37.14–74.36] 0.68 4 67.28 [66.31–71.96] 0.29 AA 1,005 58.53 [49.43–68.66] 787 62.37 [53.24–72.59] Alle.: G vs. A G 124 59.97 [49.01–67.61] 0.84 80 65.45 [53.57–73.86] 0.34 A 2,124 58.64 [49.41–68.64] 1,646 62.49 [53.23–72.66] Note. Abbreviations: Add., additive model; Alle., allelic model; B, degenerate base standing for C, G, and T; Dom., dominant model; Hom., homozygous model; IQR, interquartile range; Rec., recessive model; VDR, vitamin D receptor gene. Table S9. Comparison of 25-hydroxyvitamin D concentration (nmol/L) across genotype models of VDR gene polymorphisms in adult males and females
-
According to the logistic regression results (see Tables 2 and 3) and the simple linear regression results (see Supplementary Table S11), VD and VDR SNPs had some parameters that were related to the results of dyslipidemia. Therefore, we further explored whether VD and VDR SNPs were synergistic or antagonistic to the results of dyslipidemia. The results (see Table 4) further showed that in men, the combined effect of VD, Fok1 BB (P = 0.02, OR = 1.03, 95% CI: 1.01–1.06), and Cdx2 TT (P = 0.02, OR = 1.03, 95% CI: 1.01–1.06) synergistically led to a decrease in HDLC levels while in women, there was no significant difference in the interaction between VD and Fok1 or Cdx2 (OR < 1 and P ≥ 0.05) on the lipid profiles.
Genotype Female Male LDLC, ≥ 3.4 vs. < 3.4 mmol/L HDLC, < 1.0 vs. ≥ 1.0 mmol/L P OR (95% CI) P OR (95% CI) Cdx2 CC − − 0.11 1.02 (1.00–1.05) CT − − 0.28 1.02 (0.99–1.05) TT − − 0.02 1.03 (1.01–1.06) Fok1 AA 0.08 0.99 (0.98–1.00) 0.46 1.01 (0.98–1.05) AB 0.13 0.99 (0.98–1.00) 0.17 1.02 (0.99–1.05) BB 0.58 1.00 (0.99–1.01) 0.02 1.03 (1.01–1.06) Note. Abbreviations: 25OHD: 25-hydroxyvitamin D; B: degenerate base standing for C, G, and T; CI: confidence interval; HDLC: high-density lipoprotein cholesterol; LDLC: low-density lipoprotein cholesterol; OR: odds ratio; SNPs: single nucleotide polymorphisms; TG: triglyceride; –: interaction analyses were not conducted due to negative findings in the logistic regression analyses for the genotypes. Table 4. Interactions between plasma 25OHD concentrations and SNPs of VDR, Cdx2 (rs11568820) and Fok1 (rs2228570) on the occurrence of dyslipidemia
-
Cellular and animal studies have demonstrated that both VD and VDR play important roles in adipocyte differentiation[25, 26]. VD activates VDR to inhibit the differentiation of pre-adipocytes into mature adipocytes in vitro at an early stage[27, 28], and gene expression data showed that the abundance of VDR mRNA was changed in the process of adipocyte differentiation[29-31]. In Vdr knockout mice, VD could not block the expression of peroxisome proliferator-activated receptor γ (PPARγ) and the corresponding adipocyte differentiation, which indicated that VDR was a key mediator of VD in adipocyte differentiation[27, 28]. The TC level of Vdr knockout mice was more than 20% higher than that of wild-type mice[32]. Therefore, the existence of VDR is very important for the healthy regulation of serum lipid profiles, and it is speculated that VDR has the function of lowering TC levels. Knockout of Vdr in macrophages will cause insulin resistance and promote the movement of cholesterol, accelerating atherosclerosis in mice[33]. The above all suggest that the perfect function of VDR has a positive effect on the normal lipid metabolism process.
As SNPs of a gene may impact gene expression, as well as the structure and function of the encoded protein and the consequent phenotypes, VDR polymorphisms have been found to modify the risk of metabolic diseases[34]. Among the SNPs of VDR, Fok1 is the most widely studied. Some studies have found that the AA (complementary to TT, i.e., ff) carriers of Fok1 had higher TC in Arab adults[35], lower HDLC and higher TG in Moroccans[36], and higher LDLC in Chinese individuals[37]. Moreover, Fok1 A allele carriers had a higher risk of having coronary heart disease, and patients with a BB (or FF, e.g., GG) genotype had a higher level of HDLC[38]. The genetic benefits of AA (ff) or risk of BB (FF) or their alleles were also reported for other lipid parameters, or even the same lipid parameters, in different studies. In adult male Poles, the AA (ff) genotype carriers had lower fasting insulin and higher HDLC[39]. Similarly, in the men in our study, the AA (ff) genotype carriers had higher HDLC. In the Han Chinese population, the risk of dyslipidemia was associated with the BB (e.g., CC) genotype in the elderly male T2D patients of Beijing[40] and with the B (e.g., C) allele in a community-based population in Nanjing[37]. Largely consistent with these findings, we found that the B allele was positively associated with LDLC in women and that the BB genotype was negatively associated with HDLC in men.
The other three VDR SNPs, Cdx2, Apa1, and Taq1, were also reported to be associated with lipid profiles. For example, regarding the Cdx2 polymorphism of VDR in a Lebanese student cohort, CC (GG) or CT (AG) carriers of both genders had higher LDLC than the TT (AA) carriers[41]. Higher TC and LDLC levels were also observed in the Apa1 A allele (T or A) (Russian)[42] and Apa1 CA (GT) (Chinese)[43] carriers than in the CC (GG) carriers. The VDR Taq1 AA (TT) genotype was associated with increased TG and HDLC levels compared to the genotypes of GG (CC) and GA (CT) in obese Greek subjects[44]. However, Taq1 GA and GG genotypes were associated with higher TC and LDLC levels in T2D patients (Arab)[45], and the GA genotype exhibited a higher TC concentration compared with the AA genotypes (Arab)[46]. However, Karonova and colleagues[42] noted that no difference was found regarding the association between Taq1 and any lipid parameter. These findings suggested that the associations between VDR SNPs and the individual lipid parameters differed among various races or health conditions.
In general, gender differences and sexual dimorphism also affect the genotype and phenotype association. Studies from Lebanon, Poland, and Brazil concluded that men with Fok1 B (F) had lower HDLC and higher TG levels[39, 41, 47] while female students with the A allele (f) had higher TC and LDLC[41]. By analyzing genotypic frequencies of the four VDR SNPs between the DL and ND groups in our study, we found that Fok1 showed significant differences between the two groups. Adjusting for age and BMI, we found that VDR Fok1 B (C, G, and T) alleles were related to the occurrence of high LDLC in the female group and low HDLC in the male group. Moreover, VDR Cdx2 T was related to low HDLC in the male group. Gender-specific differences between VDR SNPs and various cardiovascular risk factors and adiponectin[41] also suggest that VDR SNPs may be a predictor of cardiovascular diseases. Thus, based on our findings, Fok1 B in both sexes and Cdx2 T in men may serve as predictors for dyslipidemia and related diseases, including cardiovascular diseases.
Though it has been widely acknowledged that plasma or serum 25OHD levels are inversely correlated with TG, TC, and/or LDLC[14, 48-53], the relationship between VD and HDLC is complicated[3]. We previously found that oral supplementation of VD (50,000 IU/week for eight weeks) induced a decrease in HDLC in male adults[54]. In interpreting the discrepancy in gender, age, and physiological status that might be involved, we found that sunlight exposure also seemed to affect the association between 25OHD and HDLC. Specifically, at lower sunlight exposure (< 1 h/d), a positive relationship was observed, while at higher sunlight exposure (> 2 h/d), 25OHD was negatively associated with HDLC[55]. In our present study, the men in the DL group had a lower level of VD than the men in the ND group, and plasma 25OHD was inversely associated with lg TG, LDLC, and HDLC in men. There was no significant difference in the distribution of VD concentration among the various VDR SNPs genotypes, but we noticed that the women in the DL group were much older than the women in the other groups, which may affect the VD levels among the groups. Other possible reasons, such as the population selection, dietary VD, time spent outdoors for sun exposure, menopause, etc., may also have complicated the results.
In addition, VDR polymorphisms may affect the responses of metabolic parameters to VD supplementation. After VD supplementation, Apa1 CC (aa) as compared to Apa1 AA (AA) or Cdx2 TT (AA) as compared to Cdx2 CC (GG) was associated with a greater decrease in plasma LDLC[56]. A previous study conducted in New Zealand found that after VD supplementation in women with VD deficiency, the VDR SNP genotypes of Apa1 AA (AA) and Taq1 GG (tt) were predicted to show greater improvement in insulin resistance[57]. Thus, it was easy to understand that different genotypes of VDR may have an impact on VD levels and biochemical metabolic indicators[58-60]. For example, the Fok1 AA (TT, i.e., ff) genotype was associated with lower 25OHD levels and higher LDLC levels in the aforementioned Chinese population[37]. Nevertheless, we failed to find such differences in the plasma 25OHD concentration between the genotypes for each of the four SNPs in our examination center-based population. According to the logistic regression and simple linear regression results, some parameters of VD and VDR SNPs were related to results of dyslipidemia. Therefore, we further explored whether VD and VDR SNPs were synergistic or antagonistic to the results of dyslipidemia. The results showed that in men, the combined effect of VD and Fok1 BB or Cdx2 TT did not optimize HDLC parameters but synergistically decreased HDLC levels, which tend to be unhealthy. This suggests that, in men, in particular those who carry the Fok1 BB or Cdx2 TT genotypes, supplementation of VD may not help improve their low-HDLC dyslipidemia; however, further studies are needed to confirm this.
Aside from the inconsistent results of the epidemiological evidence due to complicated confounders existing in real life, the fundamental biological aspects of some SNPs of VDR have been interpreted. The Fok1 restriction enzyme site as GGATGN(9)^ at the 5'-end of VDR in exon 2 has two ATG triplets that can serve as the initial codon for the long or short isoforms of the VDR protein, respectively. The impaired nuclear uptake of 1,25(OH)2D in fibroblasts was related to the conversion of the A (complementary to T in the first ATG triplet of VDR) allele to B (e.g., C) for the Fok1 polymorphism[61], which initiated the translation from the downstream ATG for the smaller VDR protein (49.5 kD), three amino acid residues shorter than the longer form. Further analysis of the VDR molecular model found that the Fok1 B-allele changed the structure and stability of VDR and its binding energy with its ligand[37] but is more effective in activating the VD target genes[62]. However, the expression and migration efficiency of the two VDR isoforms have not yet been determined. The Cdx2 polymorphism is located in the promoter region of the VDR gene, and its minor allele T (or A on its complementary strand) resulted in a higher transcriptional activity of VDR[63]. But these mechanisms remain to be studied for the polymorphisms of Apa1 located in the 8th intron and Taq1 in the 9th exon, causing a nonsense variation.
-
This study is the first to propose that different genotypes of VDR SNPs affect serum lipid profiles with gender differences. This can be useful for improving preventive strategies for dyslipidemia and related diseases in populations with a specific gender and genetic makeup. However, attention should be paid to our findings considering at least the following aspects: 1) the participants were recruited from a health examination center where the dyslipidemia prevalence was lower than that indicated in an epidemiological study of the entire Shenzhen population (27% vs. 34.6%), and larger population and multi-center studies are needed to further confirm the relationship between VDR SNPs and different lipid parameters; 2) identification and quantification of confounding factors, especially sex, age, and lifestyle factors, need more comprehensive consideration in interpreting the relationship between dyslipidemia and VDR polymorphisms, as well as serum VD levels.
-
Cdx2, Fok1 polymorphisms of VDR were sex-differentially associated with lipid profiles in Han Chinese adults. In women, Fok1 B was positively correlated with LDLC, indicating that Fok1 B is a risk factor of high-LDLC-dyslipidemia, while in men, Cdx2 T and Fok1 B were negatively correlated with HDLC, suggesting that Cdx2 T and Fok1 B are risk factors of low-HDLC-dyslipidemia. In men, the VD status interacted with Cdx2 TT and Fok1 BB in association with low-HDLC levels.
-
None of the authors have any conflicts of interest to declare.
Gene
modelsAdditive model Dominant model Recessive model Homozygous model Allelic model AA AC CC AA + AC CC AA AC + CC AA CC A C DL n 48 221 266 269 266 48 487 48 266 317 753 % 9.0 41.3 49.7 50.3 49.7 9.0 91.0 15.3 84.7 29.6 70.4 ND n 139 579 734 718 734 139 1,313 139 734 857 2,047 % 9.5 39.9 50.6 49.4 50.6 9.6 90.4 15.9 84.1 29.5 70.5 Total n 187 800 1,000 987 1,000 187 1,800 187 1,000 1,174 2,800 % 9.4 40.3 50.3 49.7 50.3 9.4 90.6 15.8 84.2 29.5 70.5 χ2 0.40 0.11 0.17 0.10 0.01 P value 0.82 0.74 0.68 0.79 0.94 Table S5. Genetic model comparison of Apa1 (rs7975232) in vitamin D receptor gene between dyslipidemia (DL) and non-dyslipidemia (ND) adults
Genotype Female Male comparison n Median IQR P value n Median IQR P value TG ≥ 2.3 mmol/L 92 57.79 [49.43–65.74] 0.40 213 59.58 [49.47–69.60] < 0.01 < 2.3 mmol/L 1,032 58.80 [49.25–68.85] 650 63.43 [54.29–73.70] TC ≥ 6.2 mmol/L 151 59.19 [47.87–72.64] 0.68 111 59.18 [49.73–71.13] 0.09 < 6.2 mmol/L 973 58.56 [49.55–68.31] 752 62.92 [53.42–72.93] LDLC ≥ 4.1 mmol/L 29 56.70 [45.80–66.12] 0.52 17 55.45 [45.07–74.43] 0.20 < 4.1 mmol/L 1,095 58.78 [49.41–68.66] 846 62.65 [53.27–72.72] HDLC < 1.0 mmol/L 22 67.80 [59.52–78.05] < 0.01 20 69.35 [57.83–83.61] 0.11 ≥ 1.0 mmol/L 1,102 58.52 [49.13–68.44] 843 62.57 [53.19–72.59] Note. Abbreviations: HDLC, high-density lipoprotein cholesterol; IQR, interquartile range; LDLC, low-density lipoprotein cholesterol; TC, total cholesterol; TG, triglyceride. Table S10. Comparison of 25-hydroxyvitamin D concentration (nmol/L) in abnormal and normal lipid groups of adult males and females
Lipid profiles Female Male β P value β P value lg TG < 0.001 0.902 − 0.003 < 0.001 TC 0.001 0.647 − 0.003 0.088 LDLC − 0.001 0.584 − 0.003 0.006 HDLC < 0.001 0.461 − 0.001 0.025 Note. Abbreviations: HDLC, high-density lipoprotein cholesterol; LDLC, low-density lipoprotein cholesterol; TC, total cholesterol; TG, triglyceride. Table S11. Simple linear regressions between serum 25-hydroxyvitamin D and lipid profiles
HTML
Subjects and Sample Collection
Index Measurement
DNA Preparation and SNP Genotyping
Data Analysis
Clinical Profiles of the Participants
Genotypic Frequencies of VDR
Logistic Regression Analyses of the Relationship between VDR SNPs and Dyslipidemia
Comparison of 25OHD Concentration
Relationship between Circulating 25OHD and Lipid Profiles
Interaction between VD Nutritional Status and VDR SNPs on the Occurrence of Dyslipidemia
 21077Supplementary Materials.pdf
|

|

 Quick Links
 DownLoad: