


-
According to the World Health Statistics 2021, the disease burden has shifted to non-communicable diseases (NCDS) worldwide[1]. Among the four major NCDS, cardiovascular (CV) events’ prevalence has contributed most to the associated mortality. Since 2000, CV events have increased by a quarter, reaching approximately 17.9 million in 2019[1]. Moreover, CV events have become a major public health problem due to their burden on health and economic status on society. High blood pressure is one of the leading risk factors for CV events[2, 3]. Several studies suggest that dietary sodium intake is closely related to blood pressure levels, and excessive sodium intake increases the risk for hypertension[4-7]. Therefore, the risk of CV events might be affected by sodium intake by altering the blood pressure levels.
The relationship between sodium intake and risk of CV events is not yet confirmed. Many studies were conducted to assess the association between sodium intake and the risk of CV events [8-14]. However, their conclusions were inconsistent. Some studies reported that the relationship between sodium intake and CV events was J-shaped or U-shaped, i.e., with the lower and higher sodium intake increases the risk of CV events [9, 10, 14]. Besides, some studies demonstrated that the sodium intakes were positively related to the risk of CV events [8, 13]. In contrast, other studies suggested that the association between sodium intake and CV risk was not statistically significant [11, 12]. Therefore, further investigation is required to understand the relationship between sodium intake and CV events.
Accurate assessment of dietary sodium intake is one of the major methodological challenges in dietary sodium research. Self-reported measurement methods of dietary intake, such as using food frequency questionnaire (FFQ) or single 24-h dietary recall, limited by errors in self-report and inaccuracies in food composition databases. The TRUE Consortium recommend against using self-reported methods for assessing dietary intake due to the inaccuracy of this method [15]. In healthy people, about 93 percent of sodium intake is excreted in the urine [16]. Twenty-four hour urinary excretion is considered as the gold standard method for assessing sodium intake [17]. To clarify the relationship between sodium intake and CV risk, we used 24-hour sodium excretion as a replacement for dietary intake, and conducted a systematic review and dose-response meta-analysis of published studies evaluating the association between 24-hour sodium excretion and CV risk. Furthermore, we discussed the limitations of current studies and provided hints for further studies.
-
This meta-analysis was performed based on the Preferred Reporting Items for Systematic Reviews and Meta-Analysis (PRISMA) statement (Supplementary Table S1 available in www.besjournal.com) [18].
Section and topic Item Checklist item Location
where item
is reportedTITLE Title 1 Identify the report as a systematic review. 2 ABSTRACT Abstract 2 See the PRISMA 2020 for Abstracts checklist. 2 INTRODUCTION Rationale 3 Describe the rationale for the review in the context of existing knowledge. 2 Objectives 4 Provide an explicit statement of the objective(s) or question(s) the review addresses. 3 METHODS Eligibility criteria 5 Specify the inclusion and exclusion criteria for the review and how studies were grouped for the syntheses. 3 Information sources 6 Specify all databases, registers, websites, organisations, reference lists and other sources searched or consulted to identify studies. Specify the date when each source was last searched or consulted. 3 Search strategy 7 Present the full search strategies for all databases, registers and websites, including any filters and limits used. 3 Selection process 8 Specify the methods used to decide whether a study met the inclusion criteria of the review, including how many reviewers screened each record and each report retrieved, whether they worked independently, and if applicable, details of automation tools used in the process. 3 Data collection process 9 Specify the methods used to collect data from reports, including how many reviewers collected data from each report, whether they worked independently, any processes for obtaining or confirming data from study investigators, and if applicable, details of automation tools used in the process. 3 Data items 10a List and define all outcomes for which data were sought. Specify whether all results that were compatible with each outcome domain in each study were sought (e.g. for all measures, time points, analyses), and if not, the methods used to decide which results to collect. 3 10b List and define all other variables for which data were sought (e.g. participant and intervention characteristics, funding sources). Describe any assumptions made about any missing or unclear information. 3 Study risk of bias assessment 11 Specify the methods used to assess risk of bias in the included studies, including details of the tool(s) used, how many reviewers assessed each study and whether they worked independently, and if applicable, details of automation tools used in the process. 4 Effect measures 12 Specify for each outcome the effect measure(s) (e.g. risk ratio, mean difference) used in the synthesis or presentation of results. 4 Synthesis methods 13a Describe the processes used to decide which studies were eligible for each synthesis (e.g. tabulating the study intervention characteristics and comparing against the planned groups for each synthesis (item #5)). 13b Describe any methods required to prepare the data for presentation or synthesis, such as handling of missing summary statistics, or data conversions. 4 13c Describe any methods used to tabulate or visually display results of individual studies and syntheses. 4 13d Describe any methods used to synthesize results and provide a rationale for the choice(s). If meta-analysis was performed, describe the model(s), method(s) to identify the presence and extent of statistical heterogeneity, and software package(s) used. 4 13e Describe any methods used to explore possible causes of heterogeneity among study results (e.g. subgroup analysis, meta-regression). 4 13f Describe any sensitivity analyses conducted to assess robustness of the synthesized results. 4 Reporting bias assessment 14 Describe any methods used to assess risk of bias due to missing results in a synthesis (arising from reporting biases). 4 Certainty assessment 15 Describe any methods used to assess certainty (or confidence) in the body of evidence for an outcome. 4 RESULTS Study selection 16a Describe the results of the search and selection process, from the number of records identified in the search to the number of studies included in the review, ideally using a flow diagram. 5 16b Cite studies that might appear to meet the inclusion criteria, but which were excluded, and explain why they were excluded. Study characteristics 17 Cite each included study and present its characteristics. 7–8 Risk of bias in studies 18 Present assessments of risk of bias for each included study. 5 Results of individual studies 19 For all outcomes, present, for each study: (a) summary statistics for each group (where appropriate) and (b) an effect estimate and its precision (e.g. confidence/credible interval), ideally using structured tables or plots. 9, 11 Results of syntheses 20a For each synthesis, briefly summarise the characteristics and risk of bias among contributing studies. 5 20b Present results of all statistical syntheses conducted. If meta-analysis was done, present for each the summary estimate and its precision (e.g. confidence/credible interval) and measures of statistical heterogeneity. If comparing groups, describe the direction of the effect. 9 20c Present results of all investigations of possible causes of heterogeneity among study results. 9 20d Present results of all sensitivity analyses conducted to assess the robustness of the synthesized results. 11 Reporting biases 21 Present assessments of risk of bias due to missing results (arising from reporting biases) for each synthesis assessed. 12 Certainty of evidence 22 Present assessments of certainty (or confidence) in the body of evidence for each outcome assessed. 11 DISCUSSION Discussion 23a Provide a general interpretation of the results in the context of other evidence. 12 23b Discuss any limitations of the evidence included in the review. 13 23c Discuss any limitations of the review processes used. 13 23d Discuss implications of the results for practice, policy, and future research. 13 OTHER INFORMATION Registration and protocol 24a Provide registration information for the review, including register name and registration number, or state that the review was not registered. 24b Indicate where the review protocol can be accessed, or state that a protocol was not prepared. 24c Describe and explain any amendments to information provided at registration or in the protocol. Support 25 Describe sources of financial or non-financial support for the review, and the role of the funders or sponsors in the review. Competing interests 26 Declare any competing interests of review authors. Availability of data, code and other materials 27 Report which of the following are publicly available and where they can be found: template data collection forms; data extracted from included studies; data used for all analyses; analytic code; any other materials used in the review. Note. From: Page MJ, McKenzie JE, Bossuyt PM, et al. The PRISMA 2020 statement: an updated guideline for reporting systematic reviews. BMJ 2021;372:n71. doi: 10.1136/bmj.n71.For more information, visit: http://www.prisma-statement.org/ Table S1. PRISMA 2020 checklist
-
A systematic search was done on the scientific databases, including ISI Web of Science, Embase, PubMed, and the Cochrane Library, for extracting the relevant articles published from the inception to June 7, 2021. To explore the impact of 24-h urinary sodium excretion on CV events, we used a combination of keywords related to CV events and urinary sodium. Keywords associated with dietary sodium and potassium intake were also searched to avoid missing out on the studies that met our subject’s criteria. In addition, the reference list was manually searched for the included studies. Detailed strategies for searching are shown in Supplementary Materials (available in www.besjournal.com).
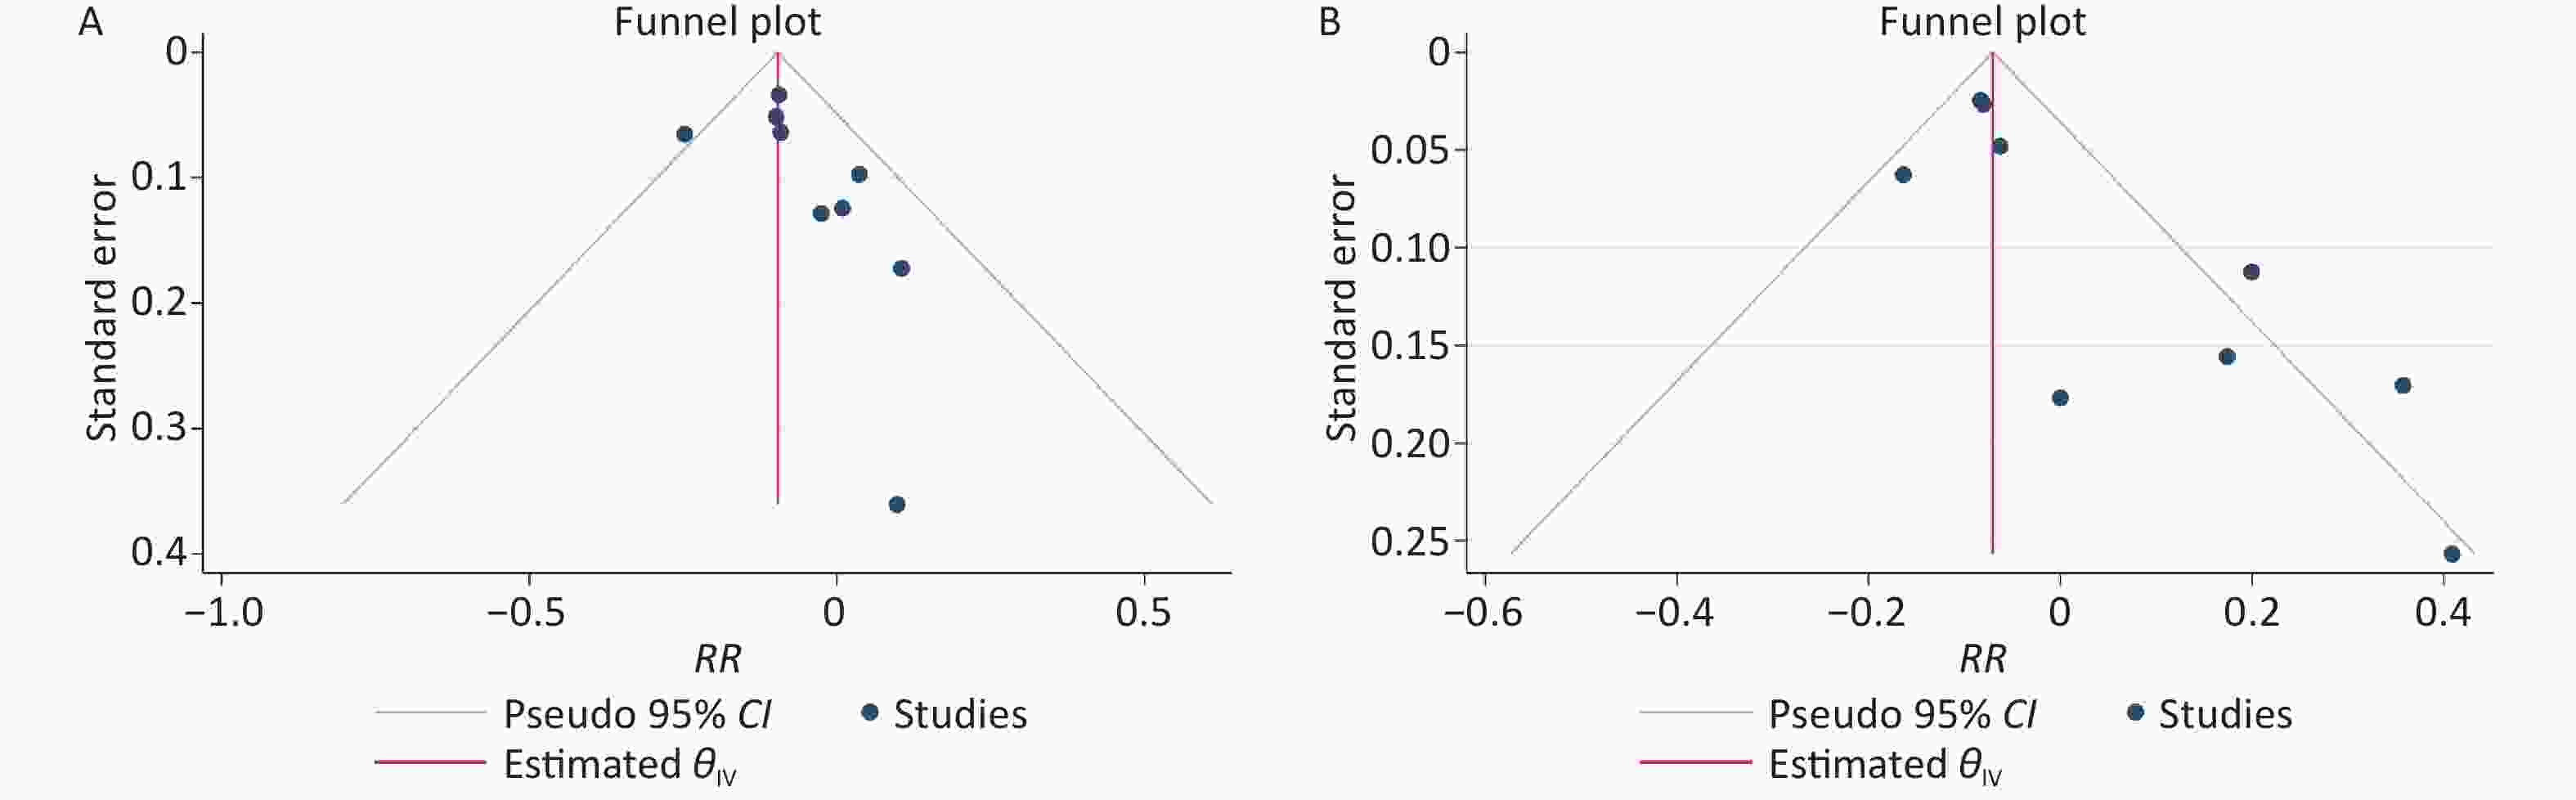
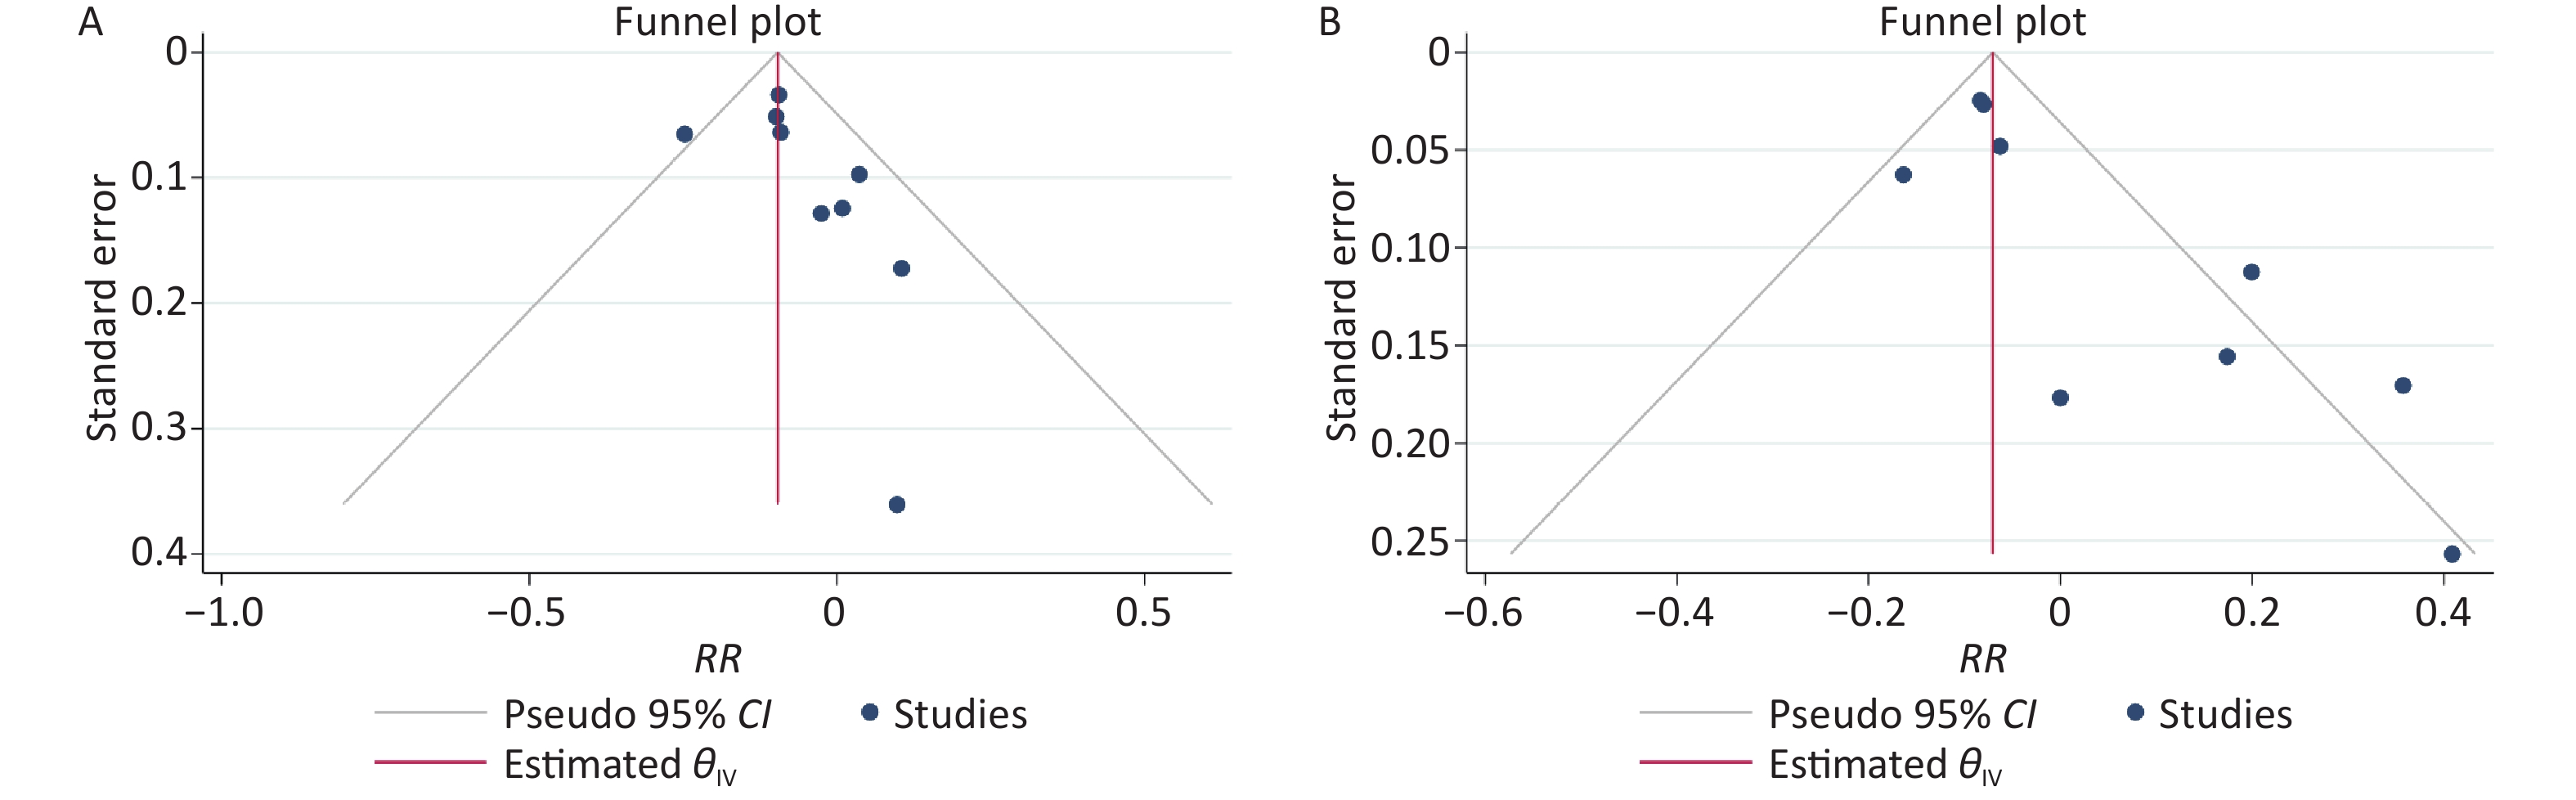
Figure S2. (A) Funnel plots for publication bias in the low-level groups. (B) Funnel plots for publication bias in the high-level groups
-
Two authors independently reviewed the studies, and any conflicts were resolved with the common consensus. First, the selection was conducted based on the title and abstract. Then the full texts of studies were reviewed for conforming our subject. Inclusion criteria: 1) full-texts in English; 2) cohort studies; 3) studies assessing the relationship of 24-h urinary sodium excretion with CV risk; 4) studies assessing 24-h urinary sodium excretion as exposure in at least three categories; 5) studies with the endpoints of either combined or single CV events (incidence and mortality); 6) studies providing adjusted effect estimates and 95% confidence intervals (CIs).
Exclusion criteria: 1) non-English articles; 2) cross-sectional studies; 3) animal studies; 4) studies including kidney diseases patients; 5) studies with un-adjusted effect estimates. In addition, if multiple studies were from the same population, we included the longest follow-up study.
-
The following dataset was retrieved independently by the two authors: the first author’s name, publication year, study region, study design, follow-up time, number of participants and cases, participant’s gender, age at baseline, method of measuring 24-h urinary sodium excretion, assessment of exposure, outcome definition, covariates adjustment in the multivariate model, the indicator of effect estimates and other relevant characteristics. If the included studies reported models with different covariates adjustment, the meta-analysis selected the model with the most adjusted covariates.
-
The Newcastle-Ottawa Quality Assessment Scale (NOS) was employed to estimate studies quality. The highest score was 9, and the lowest score was 0 for any study. Moreover, the studies that scored more than 7 were considered high quality.
-
The relative risks (RRs) with 95% CIs were used to calculate the effect size in studies, and then they were converted to natural logarithms to normalize their distribution. The hazard ratios (HRs) were considered equal to the RRs. If the reference category was not the lowest, we took the lowest category as the reference and then recalculated the effect estimates [19].
The association between 24-h urinary sodium excretion and the risk of CV events was evaluated via dividing sodium excretion into relatively low-level excretion and high-level excretion. Though the World Health Organization (WHO) recommended a sodium intake of < 2 g/d [20] and the Institute of Medicine (IOM) defined a tolerable upper sodium intake level of 2.3 g/d [21], few people reached the recommended level. Global mean sodium intake was 3.95 g/d in 2010 [22], and the mean sodium excretion ranged from 3 to 4.9 g/d in the studies that included in this meta-analysis. Therefore, the cut-off point of 4 g was used in our meta-analysis, low-level excretion was defined as < 4 g and high-level excretion ≥ 4 g in our study. In one study, dose groups with medians higher than the cut-off point were classified as high-level, otherwise low-level. If studies reported sodium excretion in moles, it was converted into grams (1 mol = 23 g). In one study, the fixed-effects model combined the RRs of different dose groups. The random-effects model summarizes the total RRs between the included studies [23]. Sensitivity analysis was employed by removing one study to assess the potential effect of a single study on the pooled RR. Some studies included heart failure as an outcome, sensitivity analysis was conducted by excluding these studies. The study by Ma et al. was excluded due to duplication with our included population cohort, sensitivity analysis was also conducted by including this study [24]. The heterogeneity between the included studies was computed adopting Cochran’s Q test and I2 statistic. Studies with values of I2 statistics less than 30% were considered to have no heterogeneity, whereas studies with more than 75% had notable heterogeneity or otherwise showed moderate heterogeneity [25]. To explain the observed heterogeneity, we performed subgroup analysis based on the follow-up duration, sample size, population information, method of urine collection, study quality, and adjusted confounders such as blood pressure or hypertension, potassium excretion. The funnel plot, Egger’s test [26], and Begg’s test [27] were used to estimate the publication bias.
Then the dose-response meta-analysis was performed to explore the possible dose-response association, using the method proposed by Greenland, Longnecker, and Orsini [28, 29]. The method requires the number of cases and non-cases, or person-years in categories of urinary sodium excretion and the reported mean for every category of exposures. If the mean for each category of exposures was not reported, it was replaced with the median; otherwise, the midpoint in the exposure category was used. For the open category (highest and lowest), 20% high or low was calculated from the nearest cut-off point. Next, the non-linear relationship of urinary sodium excretion and CV events risk was estimated using the restricted cubic splines model with three knots at fixed percentiles (5%, 50%, and 95%)[30]. In contrast, the generalized least-squares regression was used to fit the model [29]. Finally, we pooled the effect estimates using the two-stage approach's random-effects models. Whenever the second spline coefficient was equal to zero, the non-linear P-value for the dose-response meta-analysis was computed. The Stata 14.0 and Stata 16.0 software (StataCorp, College Station, Texas 77845 USA) were used for the statistical analysis.
-
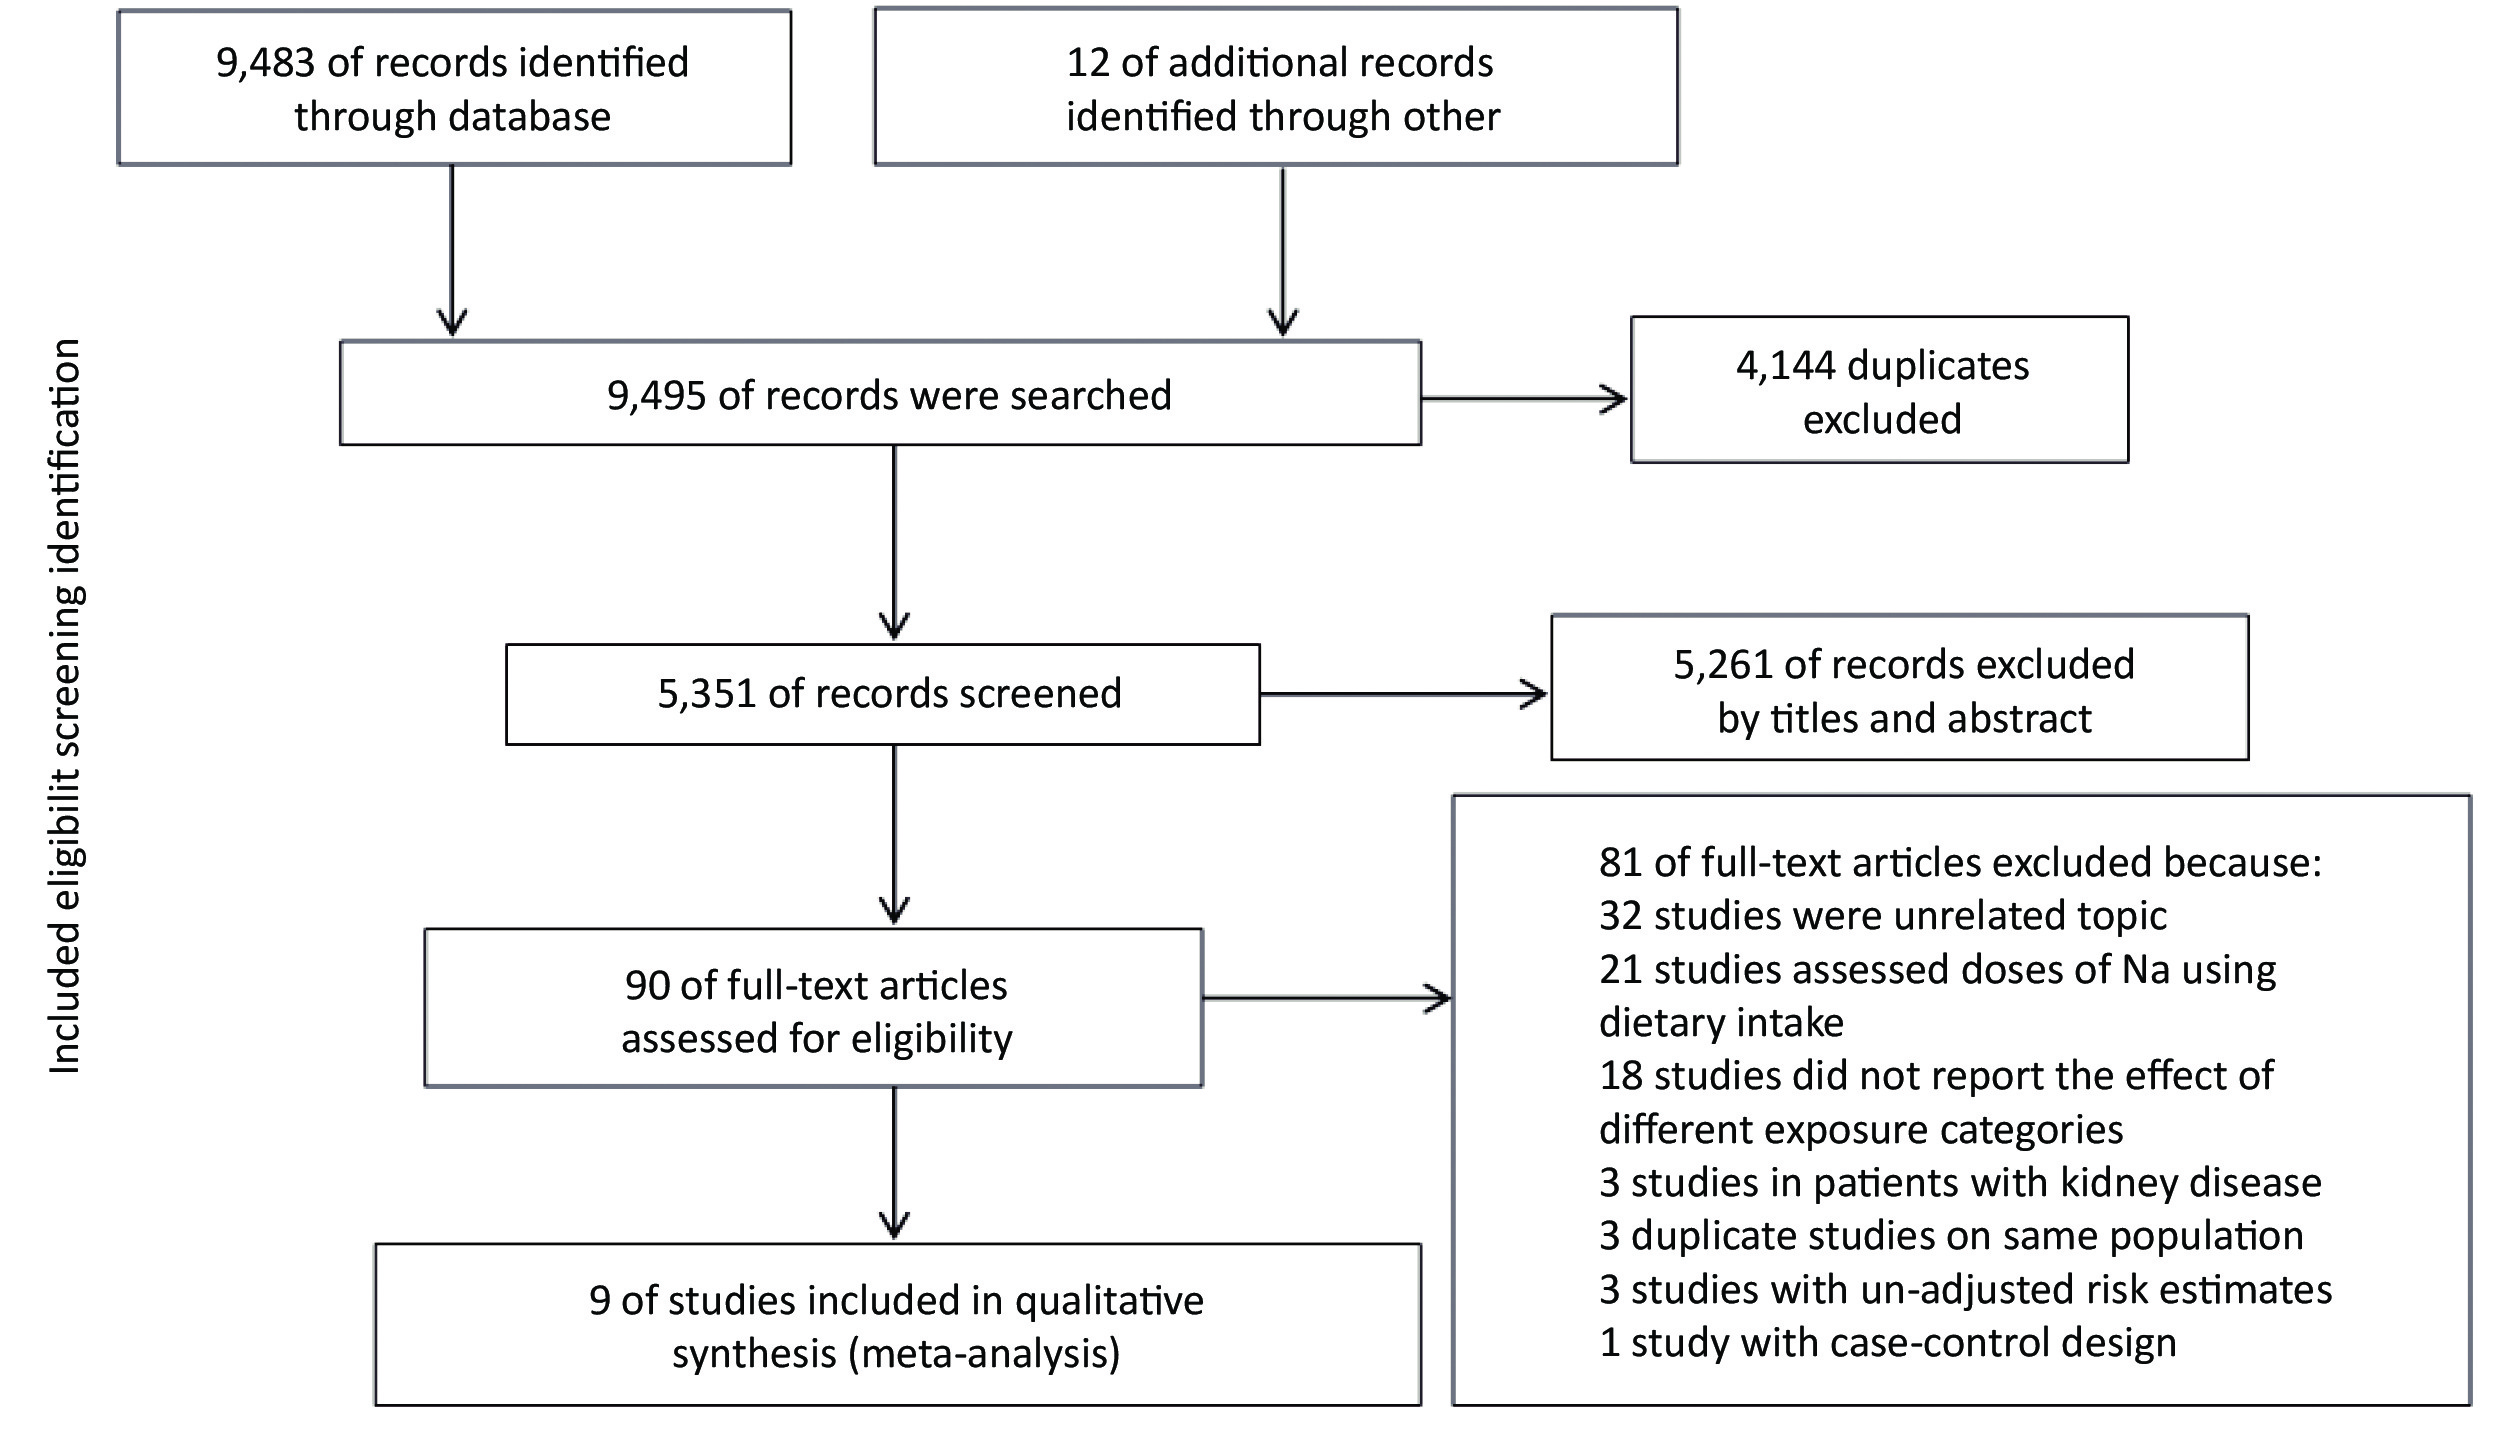
A total of 9,495 records were searched by the online databases and the references of the relevant studies. After excluding the duplicates and examining studies by titles and abstracts, 90 articles were included for assessing the full text. According to the inclusion and exclusion criteria, finally, 9 studies were eventually included. Selection details are described in Figure 1.
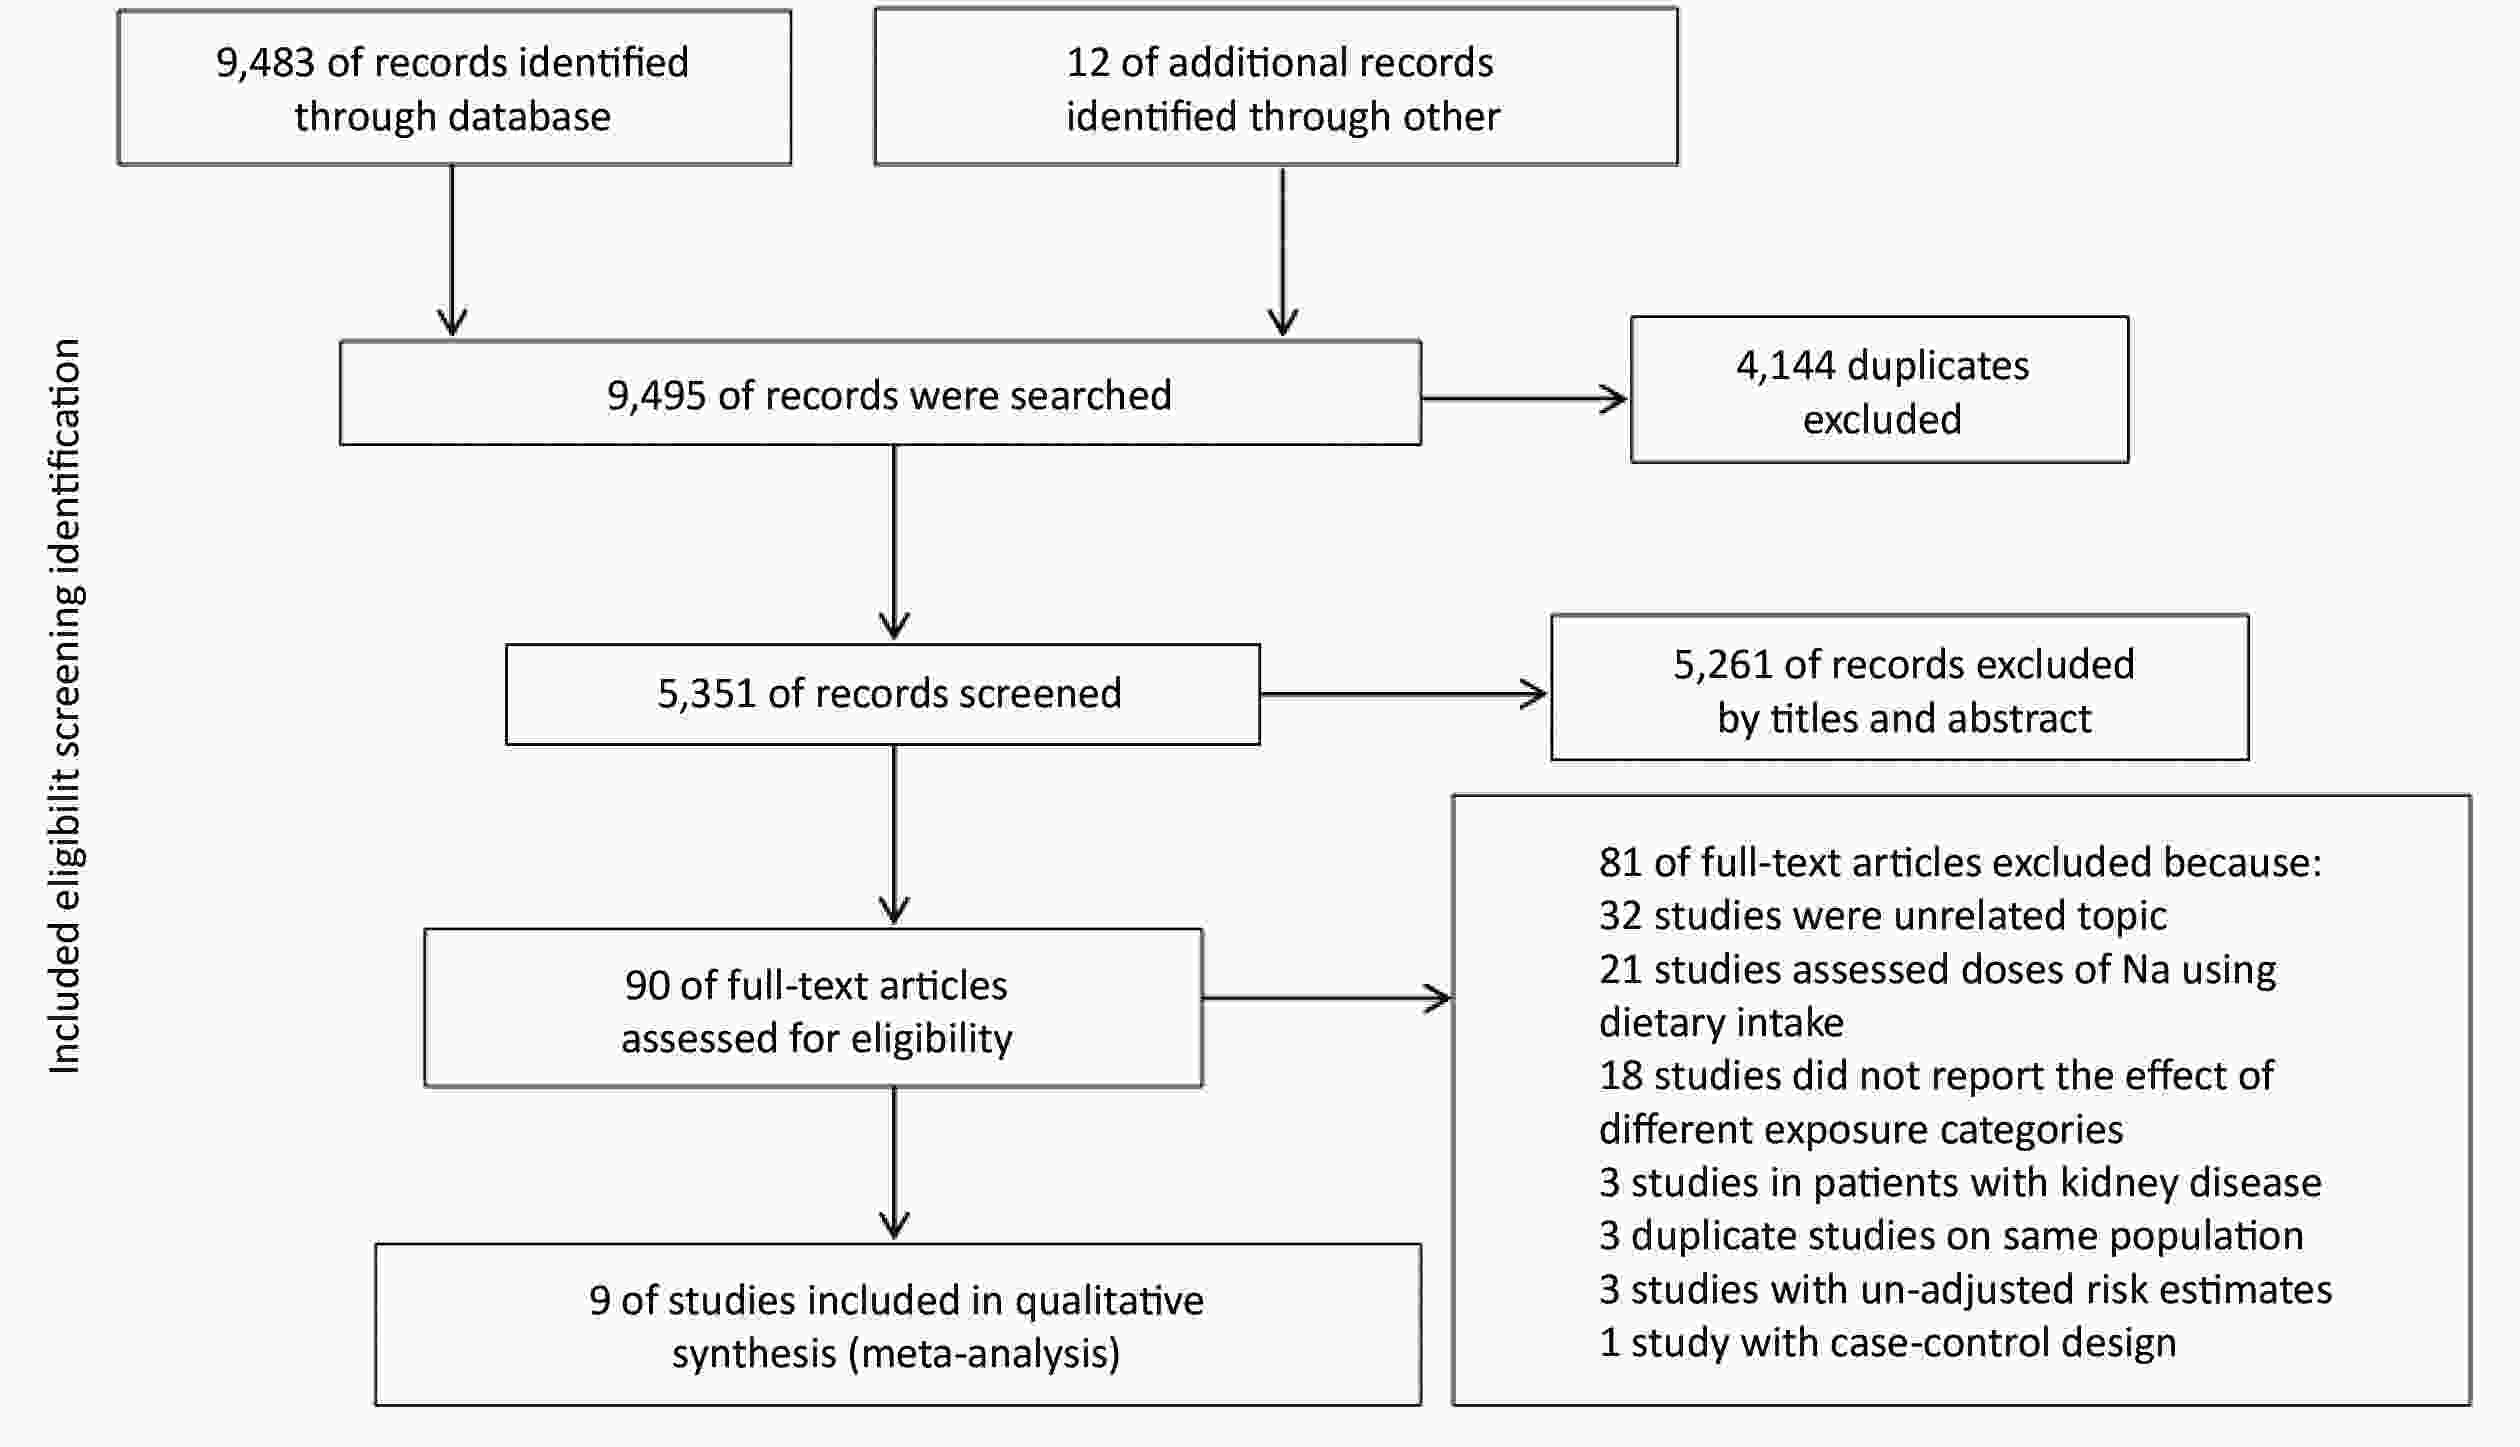
Figure 1. Flow chart of the literature search for studies.
-
The characteristics of the 9 included studies are shown in Table 1 [9, 10, 12, 14, 31-35]. Further information (the categories of urinary sodium excretion in original studies, the original effect size and transformed effect size, and covariates/factors adjusted in multivariate model) is shown in Supplementary Table S2 available in www.besjournal.com. The studies included in the meta-analysis were published between 2011 and 2021. A total of 645,006 participants with a median follow-up period of 4.7 to 19.1 years were recruited in our study. Two studies were carried out in the United States [10, 12], two in the United Kingdom [32, 35], one in the Netherlands [31], one in Finland [33], one in China [34], and two multi-centric studies with recruited subjects from several countries [9, 14]. For urinary sodium excretion assessment, 4 studies collected the 24-h urine samples [10, 12, 31, 33], 2 collected the morning fasting urine samples [9, 14], 2 collected the spot urine samples [32, 35], whereas the 1 collected the overnight urine [34]. The mean score of included studies for NOS was 8 (Supplementary Table S3 available in www.besjournal.com). Moreover, most studies results were greater than 7 [10, 31-35]. One in nine studies reported data on men and women, respectively [35]. The covariates adjusted in most multivariate models were the baseline age, body mass index (BMI), ethnicity/race, sex, alcohol intake, smoking, blood pressure or hypertension, and blood fat level. The outcome definition of studies included total CVD, CVD death, heart failure, coronary heart disease, all caused mortality, atrial fibrillation, and atrial flutter. The daily urinary sodium excretion ranged from 1.265 to 9.4 g. Besides, all studies reported HR. Three studies reported a J-shaped relationship between calculated sodium excretion and risk of CV events [9, 14, 33], 2 studies reported a U-shaped [32, 35], and 2 studies reported a linear association [10, 34]. On the contrary, 2 studies suggested no significant effect of sodium excretion upon CV events [12, 31].
Author, year Country Follow-up (years) Subjects/
events (n)Age (y) Gender Methods
of Na
measurementStudy population Outcome definition Martin J. O’Donnell, 2011[9] 40 countries 4.7 28,880/
4,72966.52 ±
7.22men/
womencollected morning fasting urine samples participants in ONTARGET and the TRANSCEND trials composite outcome (CV mortality, myocardial infarction, stroke, and hospitalization for CHF) Roman Pfister, 2013[32] the United Kingdom 12.9 19,857/
1,21058.0 ±
9.2men/
womencollected casual urine specimen general population heart failure Michel M. Joosten, 2013[31] the
Netherlands10.5 (IQR: 9.9−10.8) 7,543/
45228−75 men/
womencollected 24-h urine samples general population CHD was defined as incident cardiac morbidity and mortality (including myocardial infarction, acute and subacute ischemic heart disease, and coronary artery bypass grafting or percutaneous transluminal coronary angioplasty) Nancy R. Cook, 2014[10] the United States 5 2,312/
19331−50 men/
womencollected 24-h urine samples general population CVD or CVD death, including myocardial infarction, stroke, coronary artery bypass graft, percutaneous transluminal coronary angioplasty, or death from cardiovascular disease Pamela Singer, 2014[12] the United States 18.6 3,505/
39952.4 ±
9.9men/
womencollected 24-h urine samples participants were individuals in a union-sponsored, worksite hypertension program in New York City between 1978 and 1999 coronary artery disease, including MI, ischemic heart disease, heart failure, and hypertensive heart disease Martin O’Donnell, 2019[14] 628 urban
and rural communities
in low, middle,
and high
income countries8.2 103,200/
7,88435−70 men/
womencollected morning fasting midstream urine sample general population the primary composite outcome was all caused mortality or myocardial infarction or stroke or heart failure Matti A. Vuori, 2020[33] Finland 14 4,517/
42445.4 ±
11.4men/
womencollected 24-h urine samples general population CVD was defined as the onset of CHD, stroke, or heart failure Wuopio J,
2020[35]the United Kingdom 8.2 ± 1.0 215,535/
3,75140−69 men collected midstream spot urine samples general population atrial fibrillation or atrial flutter 257,545/
2,221women Yi-Jie Wang, 2021[34] China 19.1 (IQR: 7.4−21.4) 2,112/
27954 ±
12men/
womenrecorded the sleep time and calculated the 24-h urine amount from sleep time and morning voiding urine general population Incident CVD events, including CHD and stroke Note. 24 h UNaE: 24 h urinary sodium excretion; CV: cardiovascular; CHD: coronary heart disease; CVD: cardiovascular disease; CHF: congestive heart failure; ONTARGET: Ongoing Telmisartan Alone and in combination with Ramipril Global Endpoint Trial; TRANSCEND: Telmisartan Randomized Assessment Study in ACE Intolerant Subjects with Cardiovascular Disease. Table 1. Characteristics of the included studies in this Meta-Analysis
-
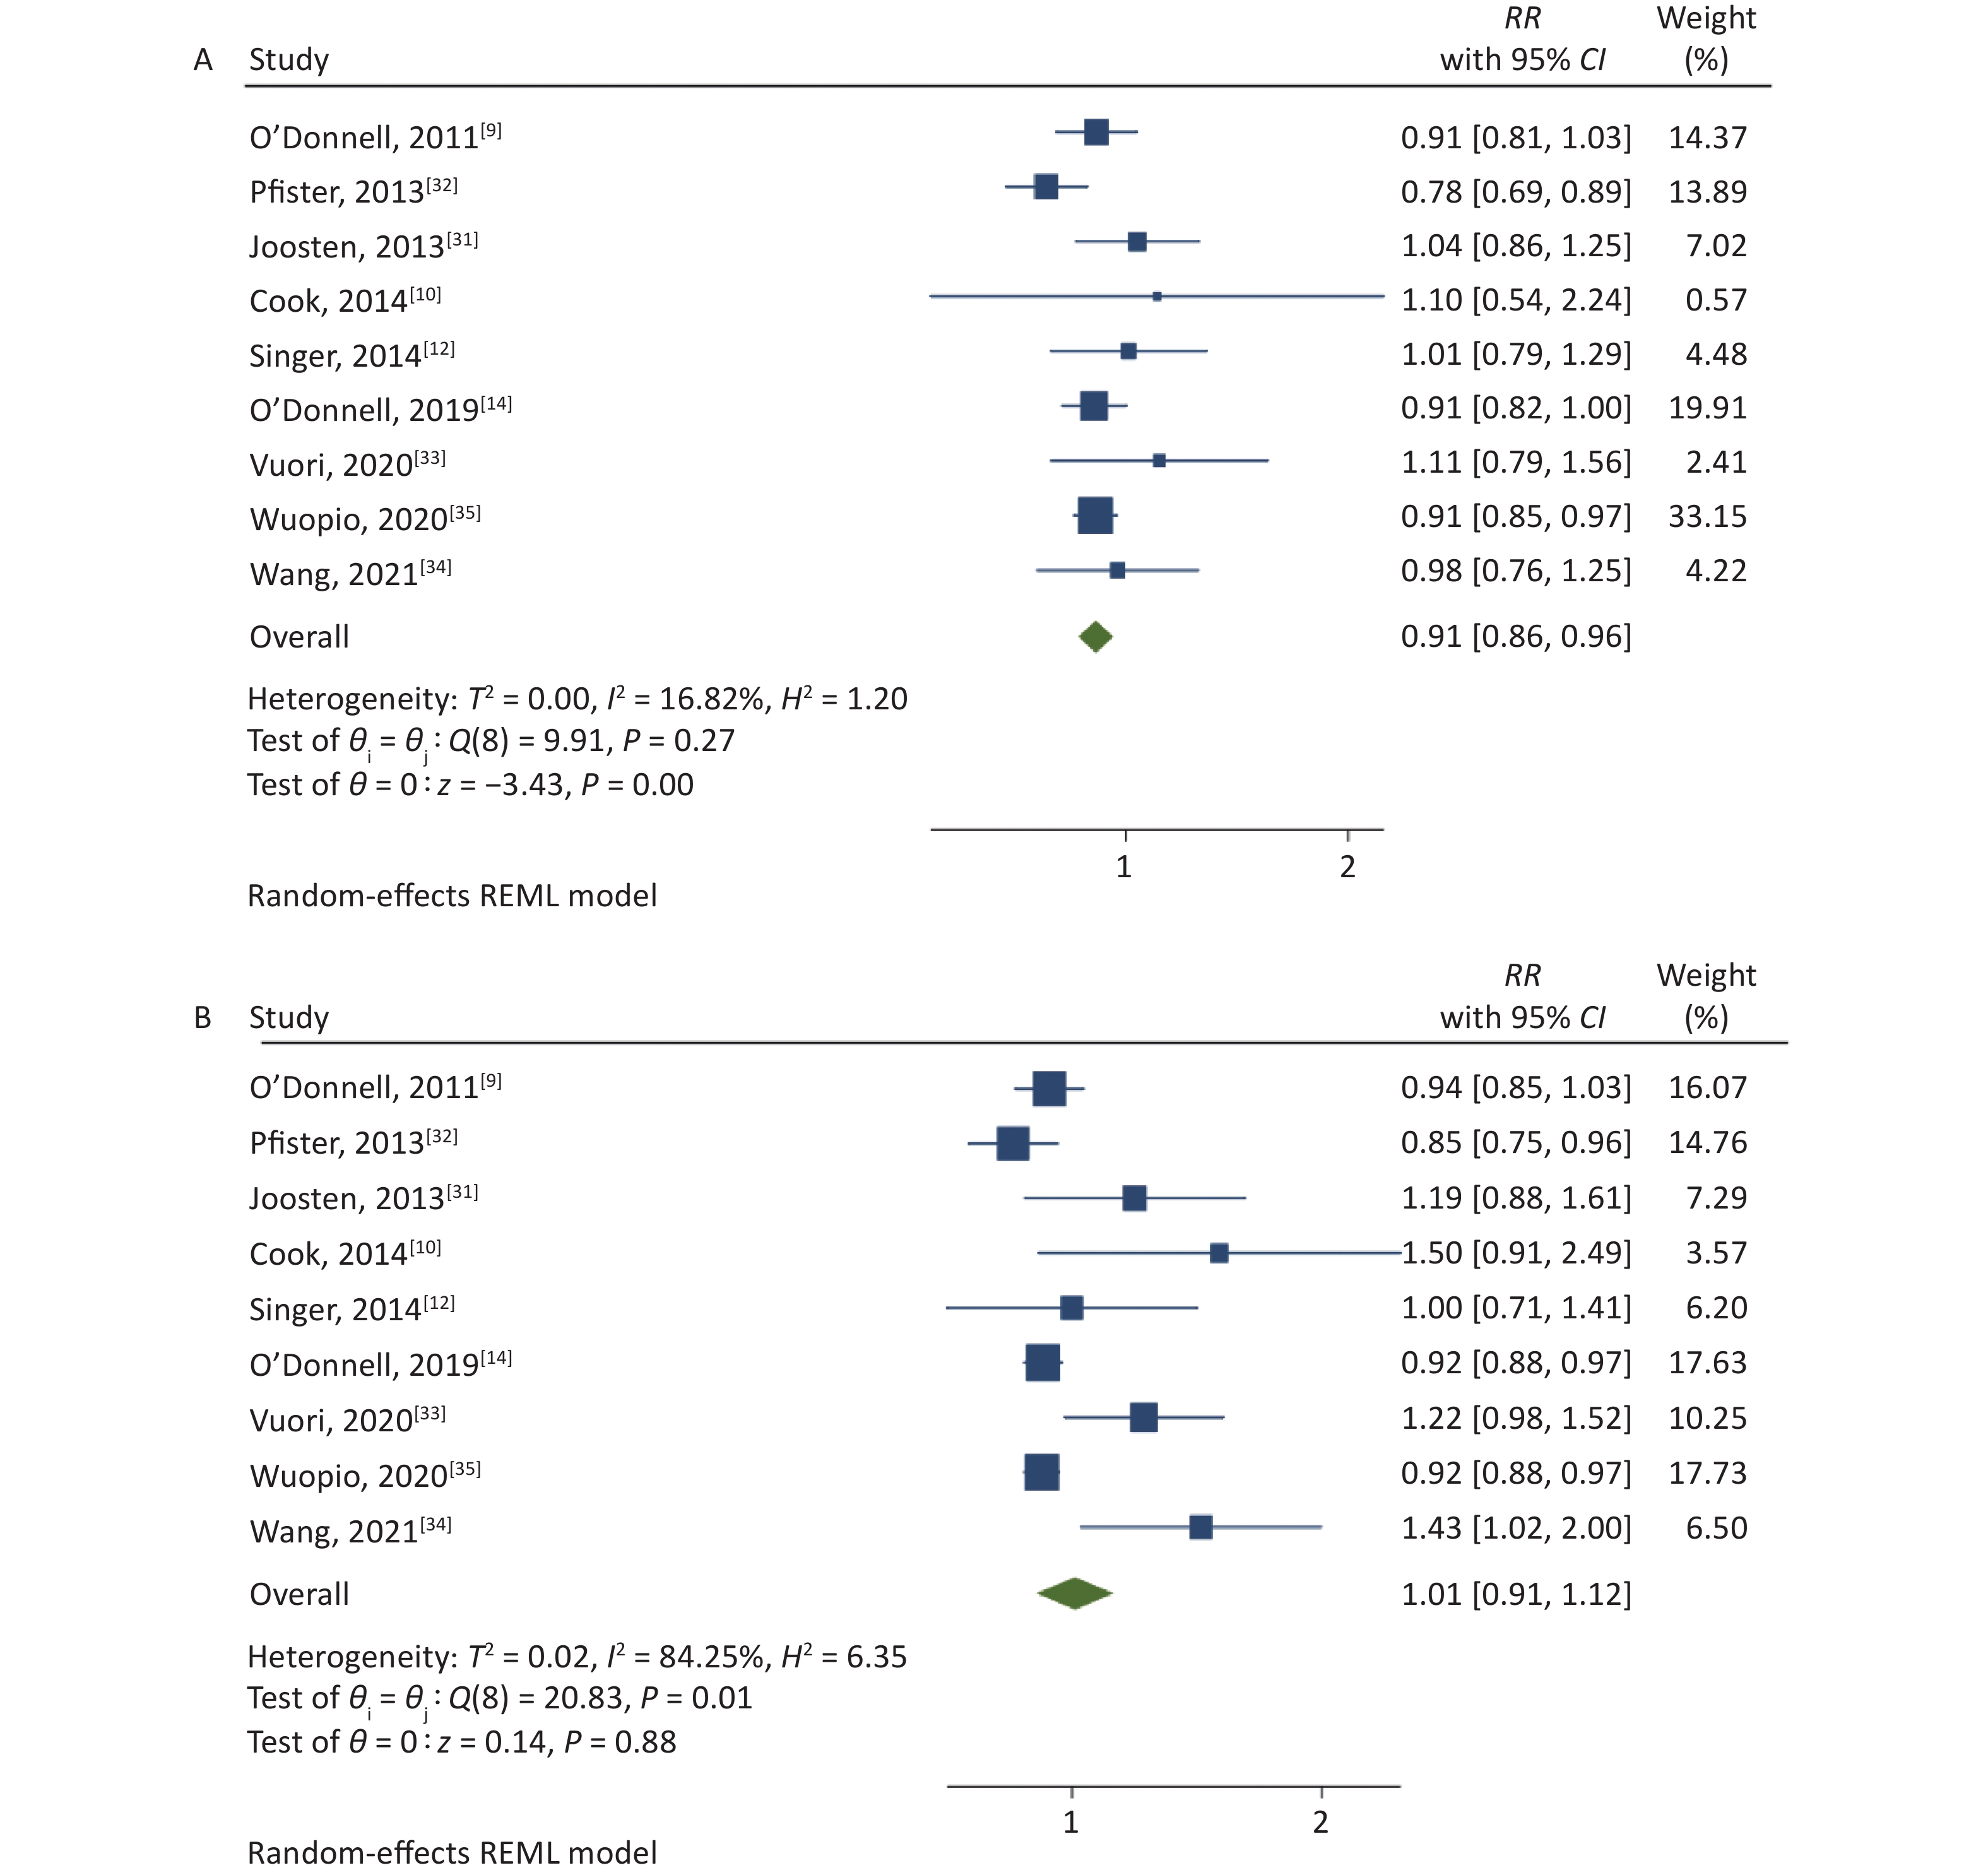
The association between the high and the low levels of sodium excretion with the risk of CV events are shown in Figure 2. The total RR was 0.91 (95% CI: 0.86, 0.96; I2 = 16.82%) and 1.01 (95% CI: 0.91, 1.12; I2 = 84.25%) for the association between low-level sodium excretion (vs. the lowest of 1.265 g) and the high-level sodium excretion (vs. the lowest of 1.265 g) with the risk of CV events, respectively. However, significant heterogeneity between the studies was found (P = 0.01) in the high-level group. Therefore, subgroup analyses were carried out based on the follow-up duration, sample size, population information, method of urine collection, study quality, and adjusted confounders such as blood pressure or hypertension, potassium excretion (Table 2). Further, the subgroup of sample size and method of urine collection could explain the part of the heterogeneity.
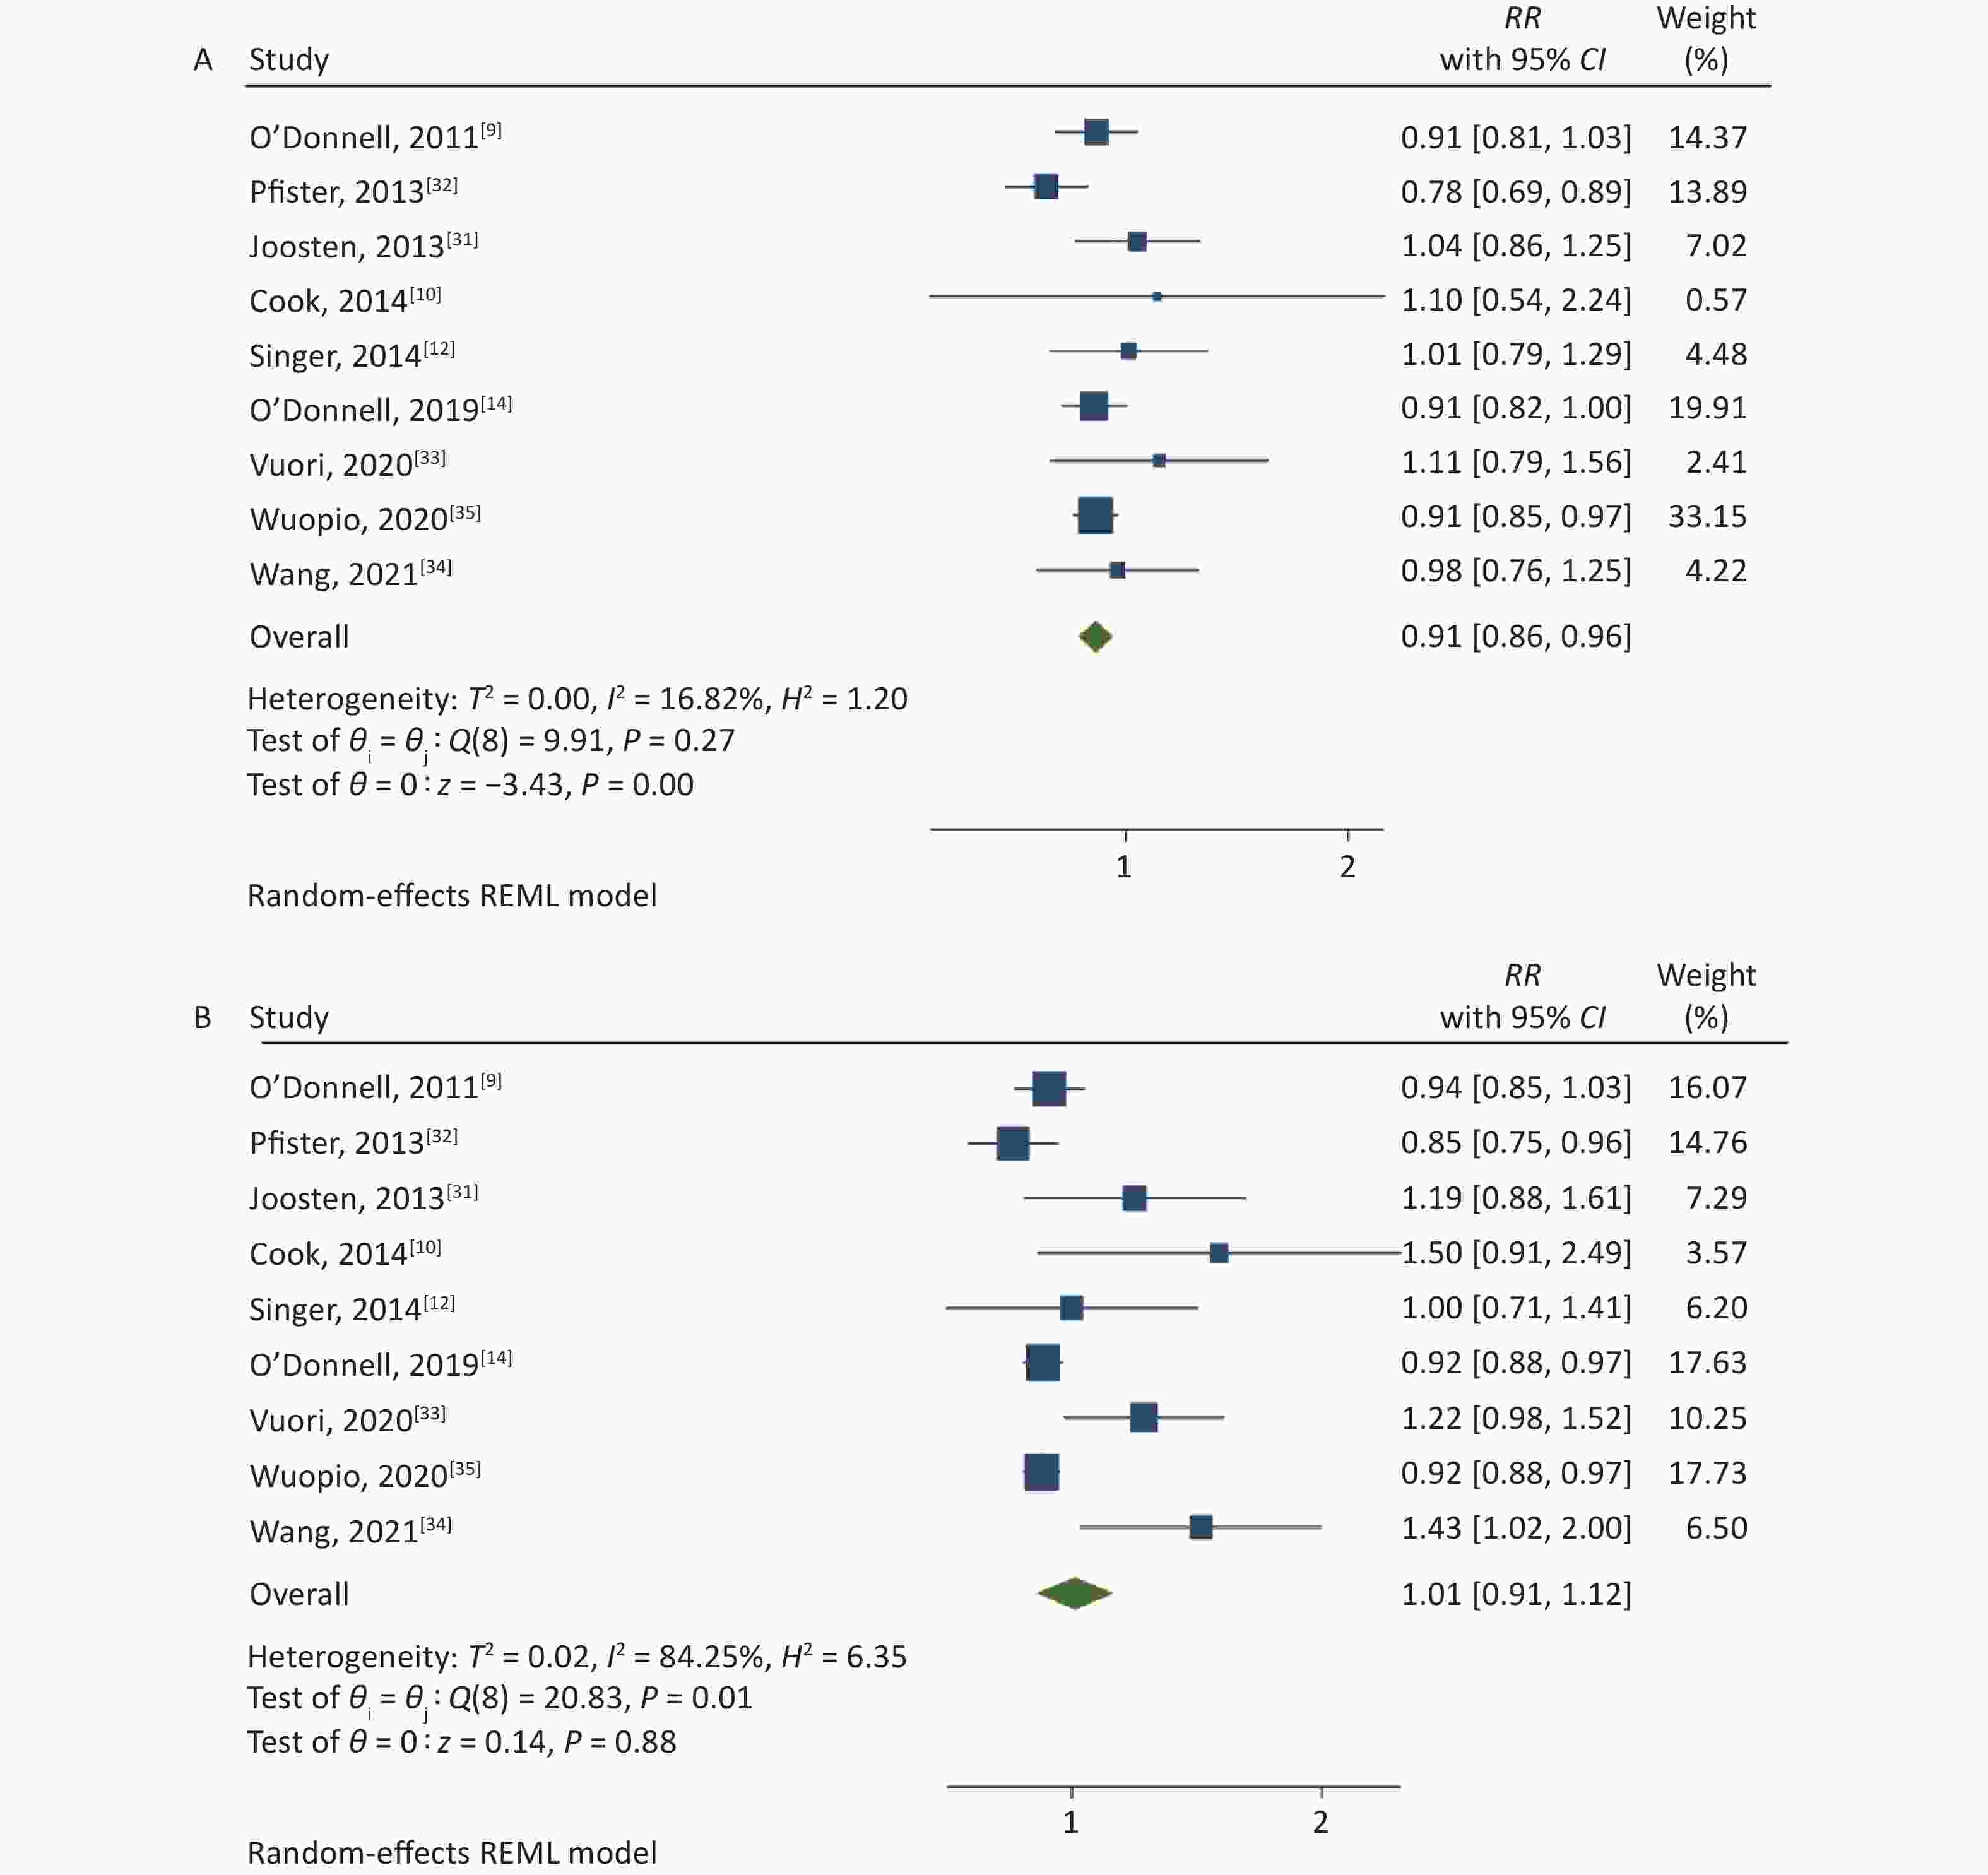
Figure 2. (A) Forest Plot of relative risks (RRs) and 95% Confidence Intervals (CIs) for the association between low-level sodium excretion (< 4 g/d) and the risk of CV events. (B) RRs and 95% CIs for the association between high-level sodium excretion (≥ 4 g/d) and the risk of CV events.
Subgroups No. of studies Low level High level Pooled RR (95% CI) P value I² (%) P value for
heterogeneityPooled RR (95% CI) P value I² (%) P value for
heterogeneityFollow-up duration < 10 years 4 0.910
(0.866, 0.958)0.0003 < 0.01 0.9611 0.926
(0.895, 0.957)< 0.0001 0.01 0.2904 > 10 years 5 0.947
(0.821, 1.093)0.4575 54.77 0.0481 1.093
(0.898, 1.329)0.3759 68.49 0.0037 Sample size < 10,000 5 1.027
(0.912, 1.156)0.6632 < 0.01 0.9789 1.228
(1.070, 1.410)0.0035 < 0.01 0.5886 > 10,000 4 0.886
(0.836, 0.940)0.0001 27.48 0.1930 0.918
(0.889, 0.948)< 0.0001 0.02 0.6090 Conducted in general population Yes 7 0.912
(0.843, 0.986)0.0207 42.63 0.1654 1.049
(0.902, 1.220)0.5358 91.08 0.0021 No 2 0.932
(0.834, 1.042)0.2162 < 0.01 0.4745 0.943
(0.861, 1.033)0.2062 < 0.01 0.7316 Method of urine collection Collected 24-h urine samples 4 1.042
(0.911, 1.192)0.5489 < 0.01 0.9721 1.190
(1.023, 1.385)0.0242 < 0.01 0.6025 Collected spot urine samples 5 0.892
(0.847, 0.939)< 0.0001 12.98 0.2670 0.922
(0.893, 0.952)< 0.0001 < 0.01 0.0744 Study quality ≤ 7 3 0.918
(0.852, 0.989)0.0241 0.01 0.7224 0.928
(0.887, 0.971)0.0012 < 0.01 0.8695 > 7 6 0.925
(0.826, 1.035)0.1743 55.12 0.1034 1.094
(0.909, 1.316)0.3439 84.39 0.0010 Adjusted blood pressure or hypertension Yes 4 0.883
(0.815, 0.958)0.0026 42.65 0.1638 0.921
(0.885, 0.959)0.0001 < 0.01 0.0365 No 5 0.967
(0.876, 1.068)0.5129 14.68 0.5758 1.084
(0.917, 1.281)0.3444 59.57 0.0211 Adjusted potassium excretion Yes 4 0.960
(0.873, 1.056)0.4035 < 0.01 0.6694 1.047
(0.879, 1.247)0.6076 40.92 0.1626 No 5 0.892
(0.829, 0.960)0.0023 36.53 0.1534 0.999
(0.855, 1.168)0.9923 92.71 0.0057 Table 2. Subgroup analysis of different levels of sodium excretion and the risk of CV events
-
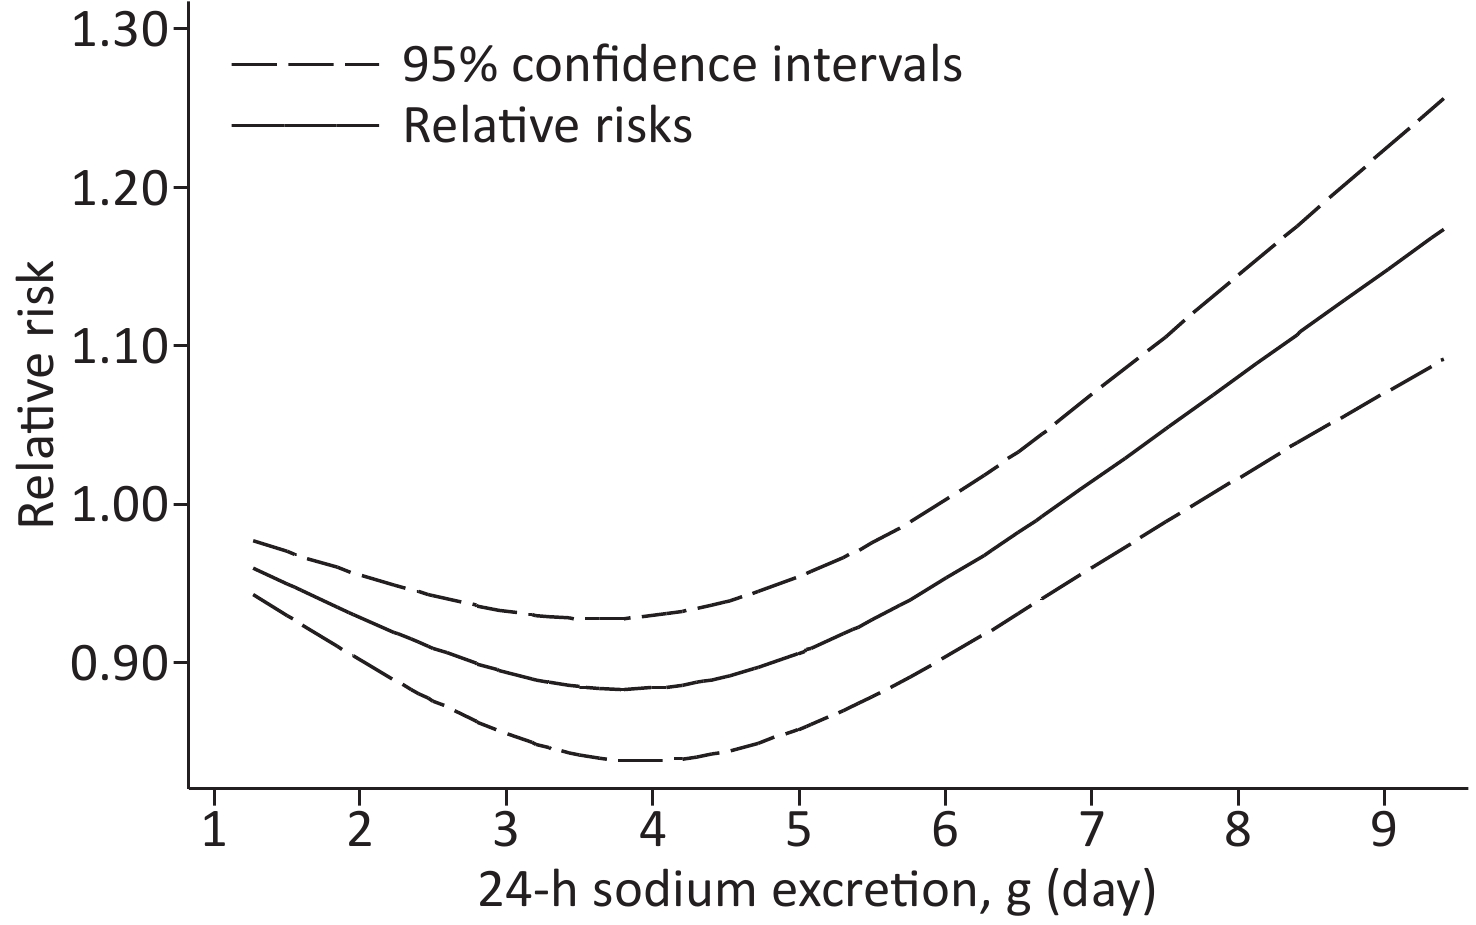
Based on the included studies, the dose-response meta-analysis was carried out. A significant non-linear relationship was found between sodium excretion and the risk of CV events (Pnon-linearity < 0.001) (Figure 3). In addition, the Wald test’s result showed that the two slopes in the non-linear model were significantly different (P < 0.001). We also excluded 5 studies using spot urine samples and performed a dose-response meta-analysis with the remaining 4 studies. The results showed that the sodium excretion and risk of CV events were associated linearly (P = 0.02) (Figure 4). The RR in the model showed that every 1 g increase in sodium excretion was associated with an increase in the risk of CV events up to 4% (RR: 1.04; 95% CI: 1.01, 1.07).
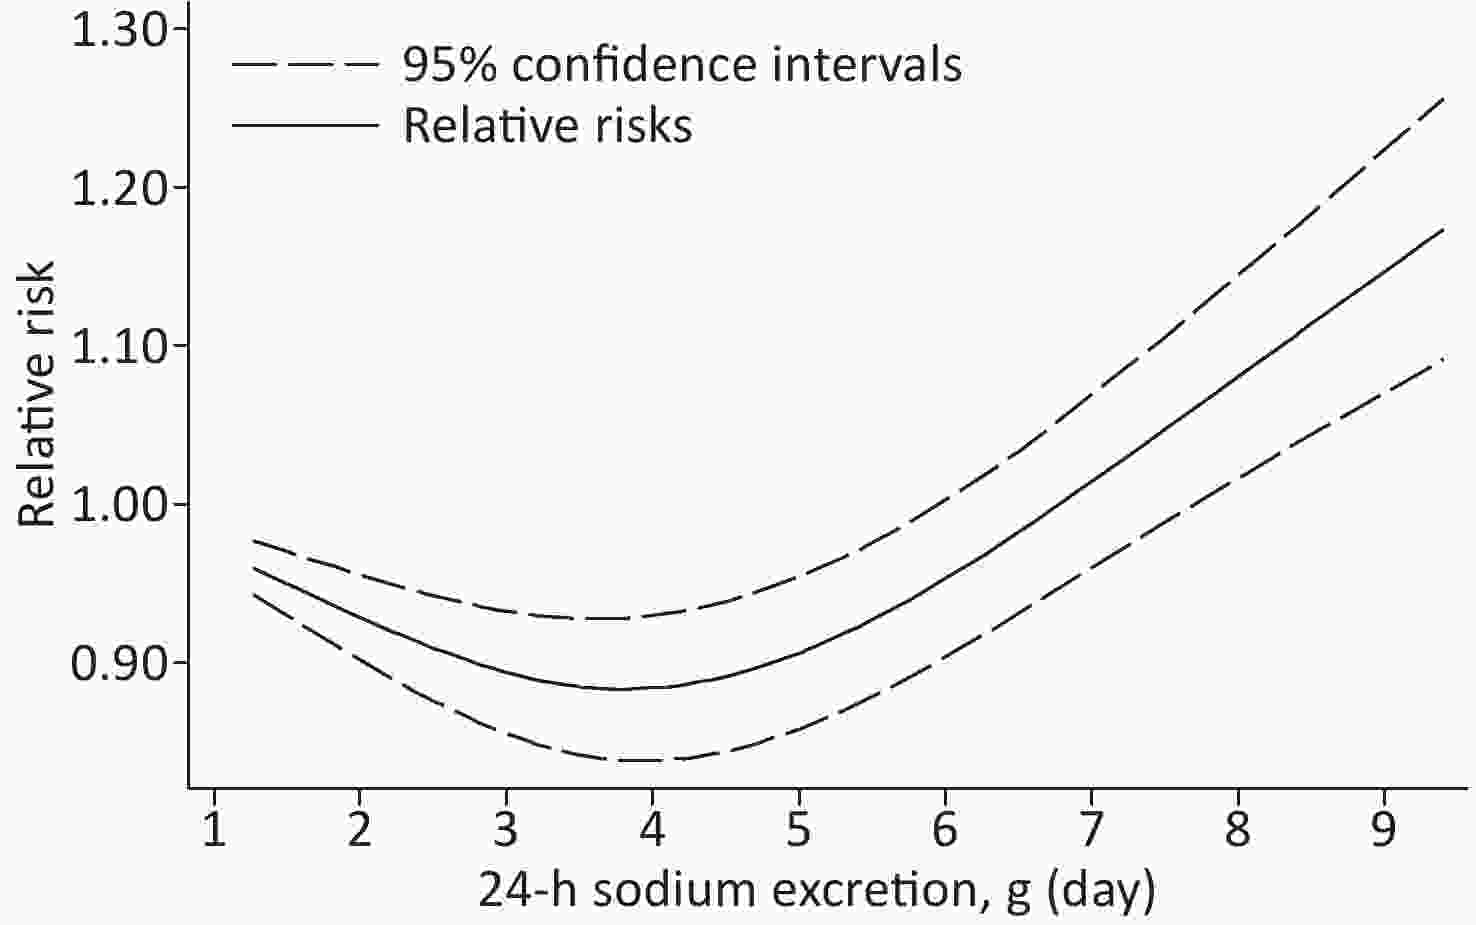
Figure 3. Non-linear dose-response association between 24-h Sodium excretion and the risk of CV events. Dashed lines indicated 95% confidence intervals. Reference standard was 1.265 g/24 h.
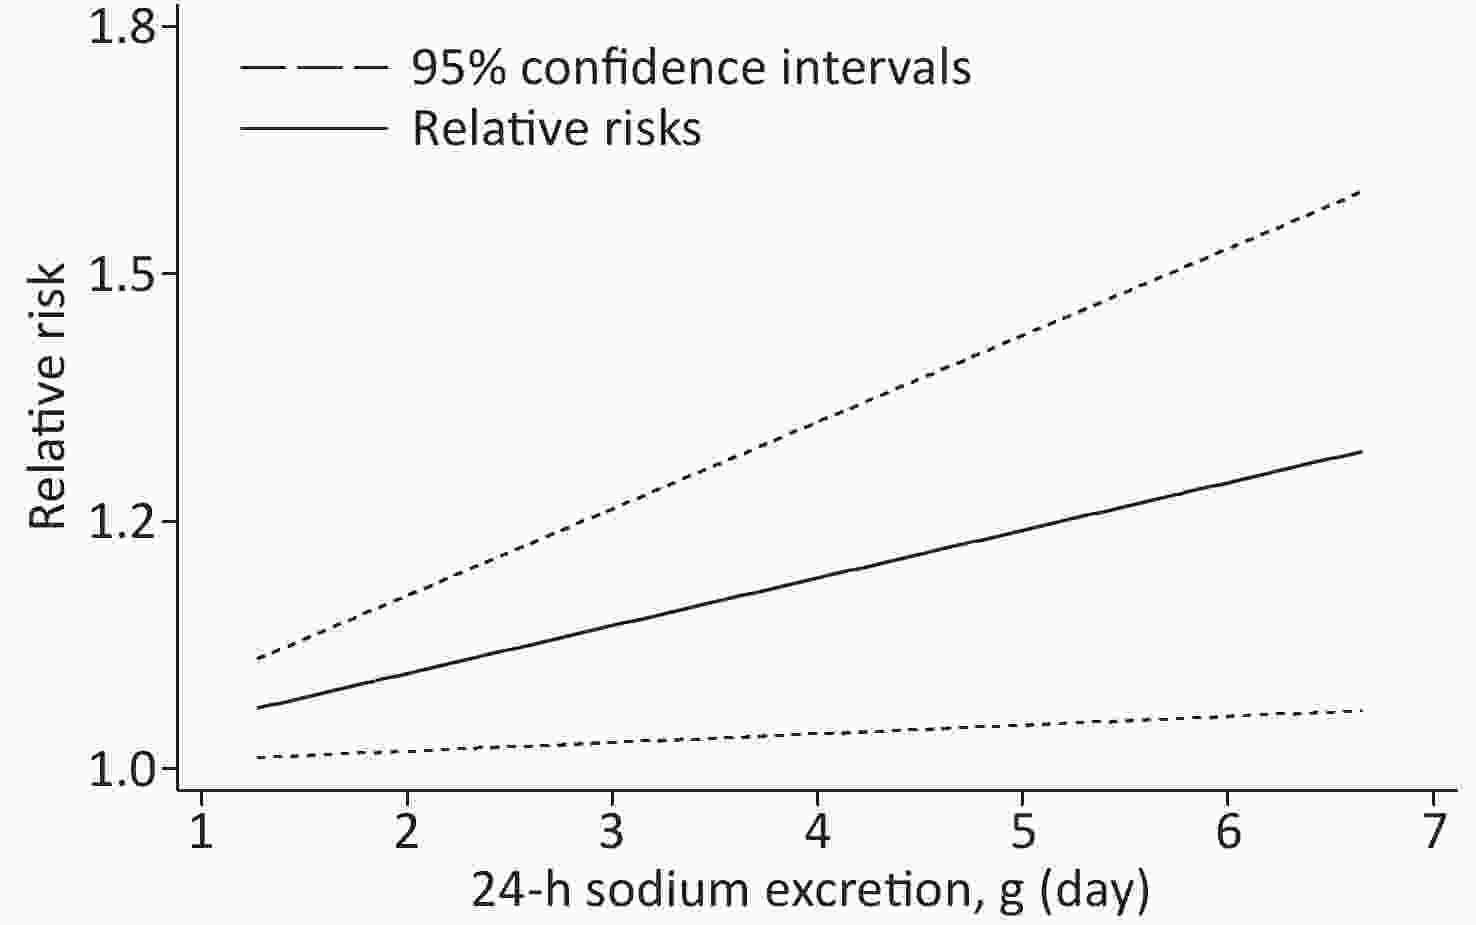
Figure 4. Linear dose-response association between 24-h Sodium excretion and the risk of CV events. Dashed lines indicated 95% confidence intervals.
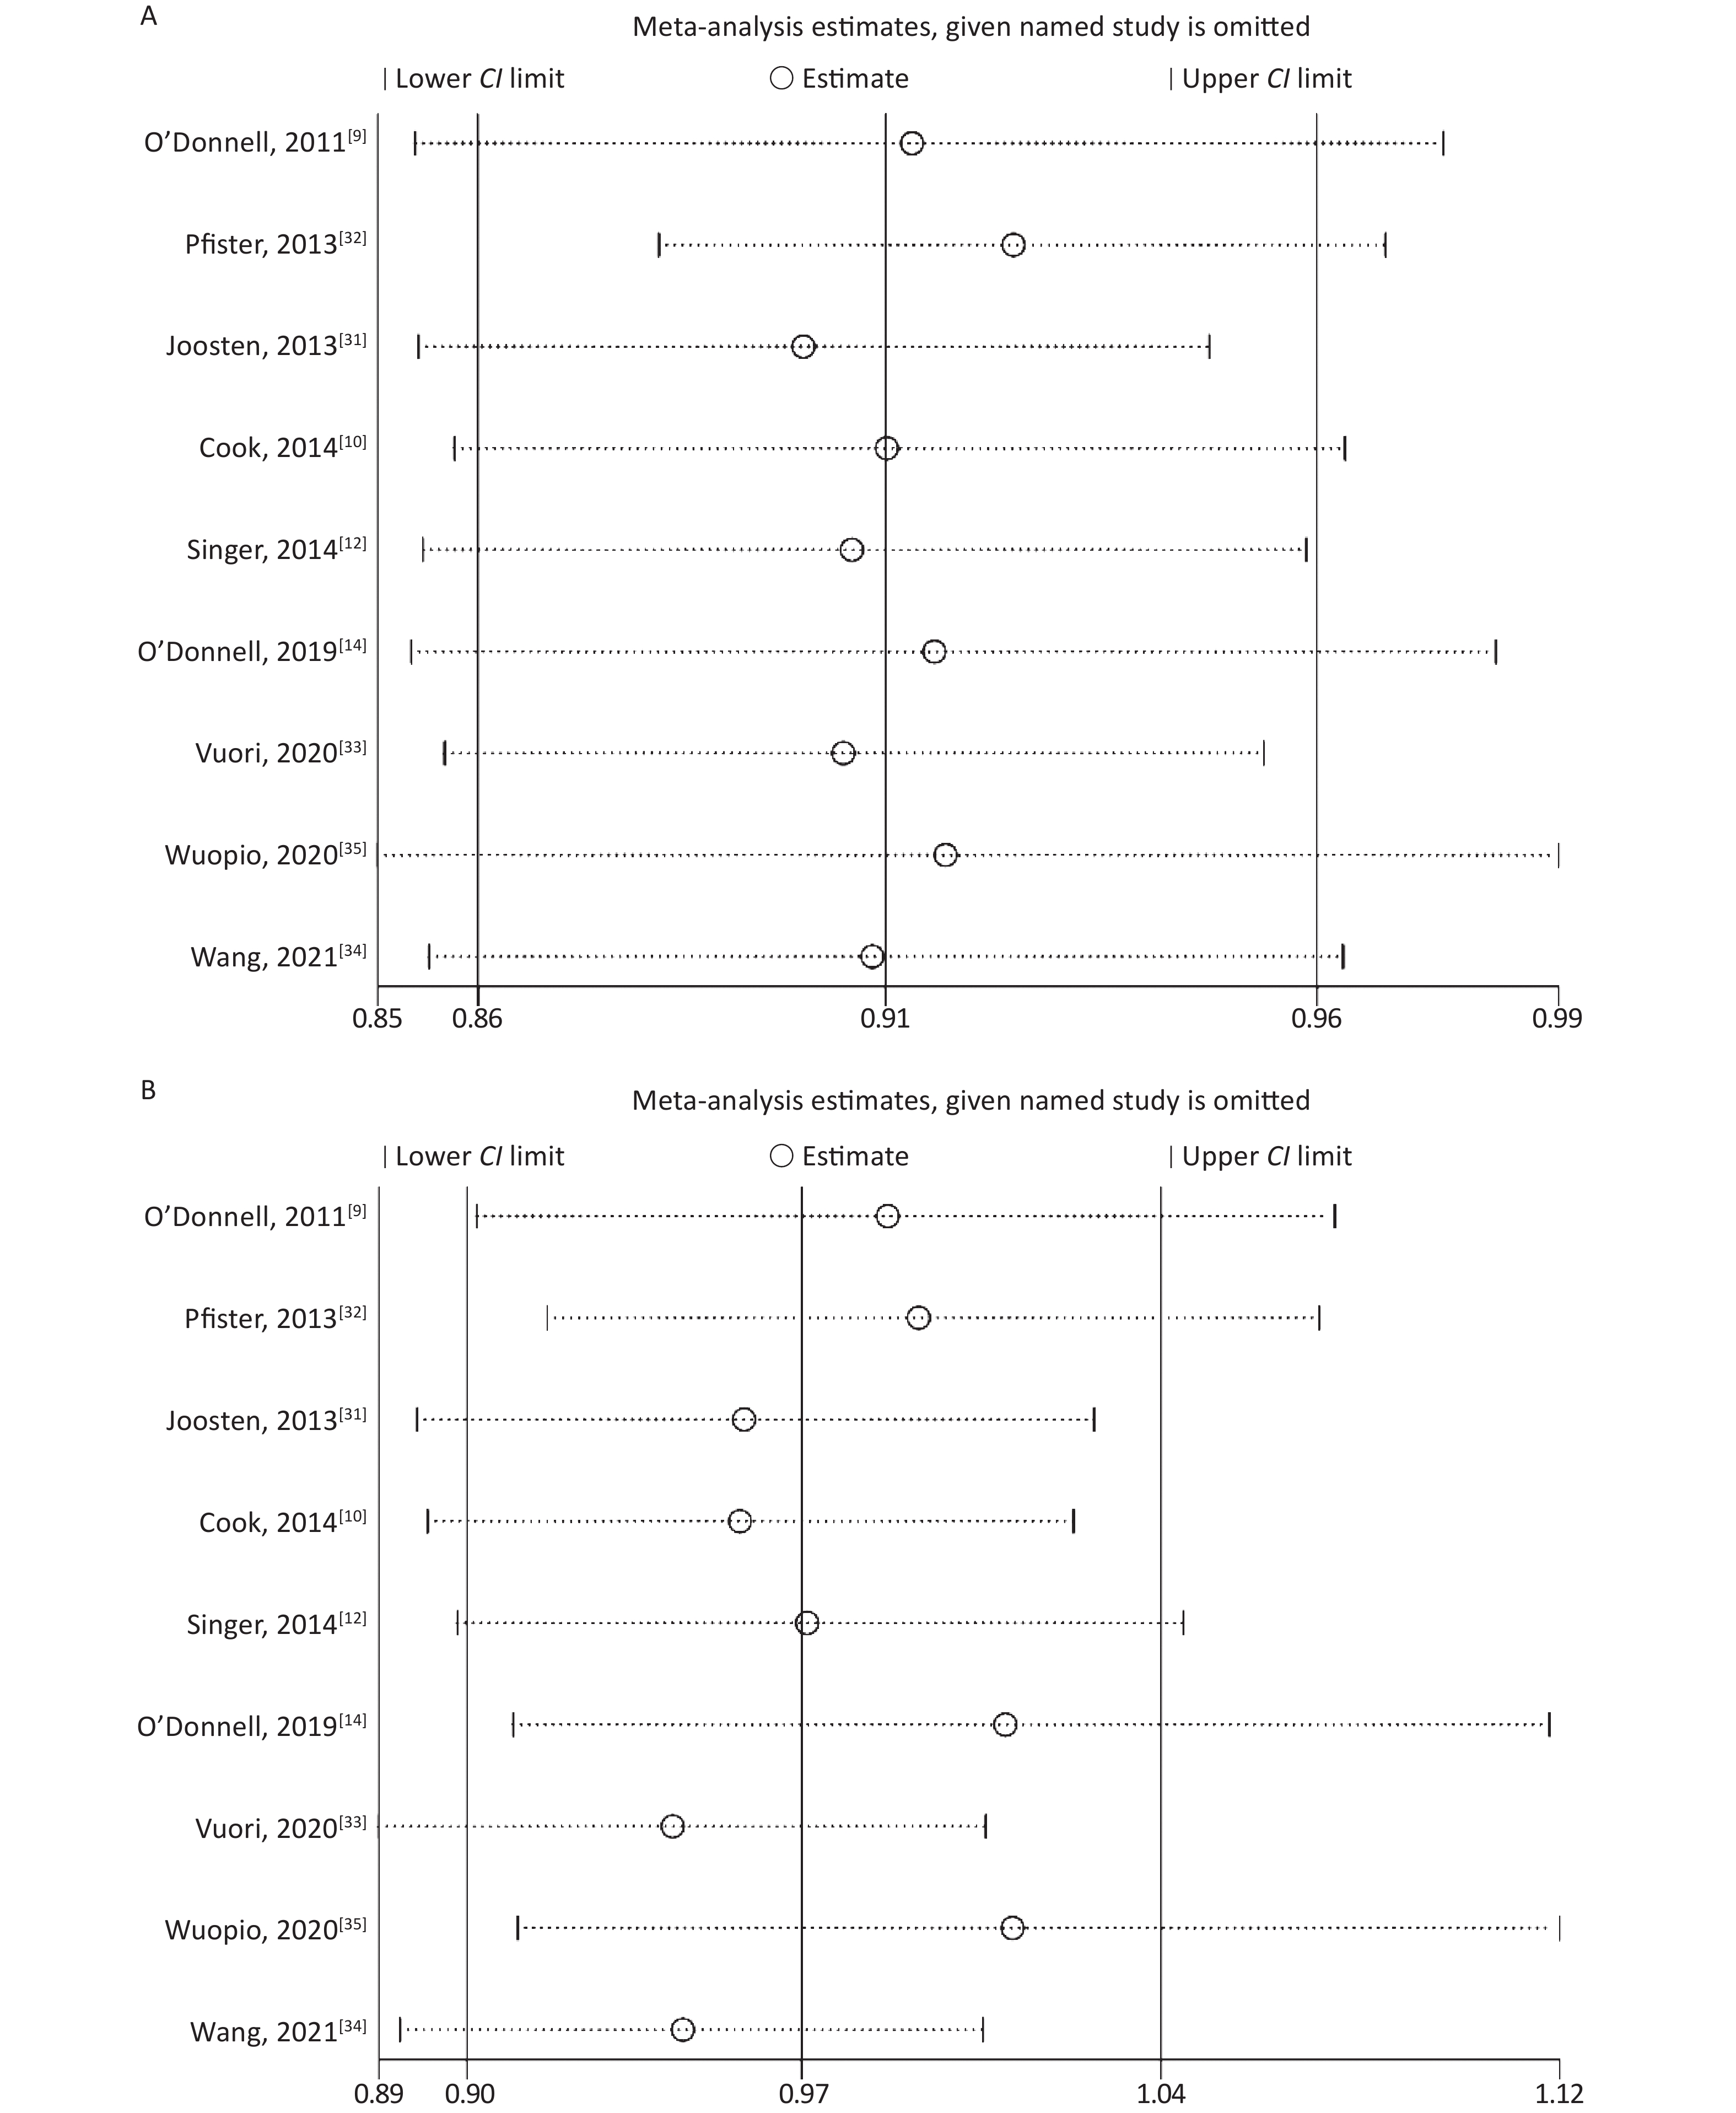
None of the studies significantly affected the combined RR for sensitivity analysis in the low-level and high-level groups (Supplementary Figure S1 available in www.besjournal.com). In studies without an outcome of heart failure [10, 31, 34, 35], the combined RR for sensitivity analysis was 0.94 (95% CI: 0.86, 1.02) in the low-level group and 1.17 (95% CI: 0.91, 1.50) in the high-level group. When included in the study by Ma et al.[24], the combined RR was 0.95 (95% CI: 0.88, 1.04) in the low-level group and 1.07 (95% CI: 0.94, 1.23) in the high-level group.
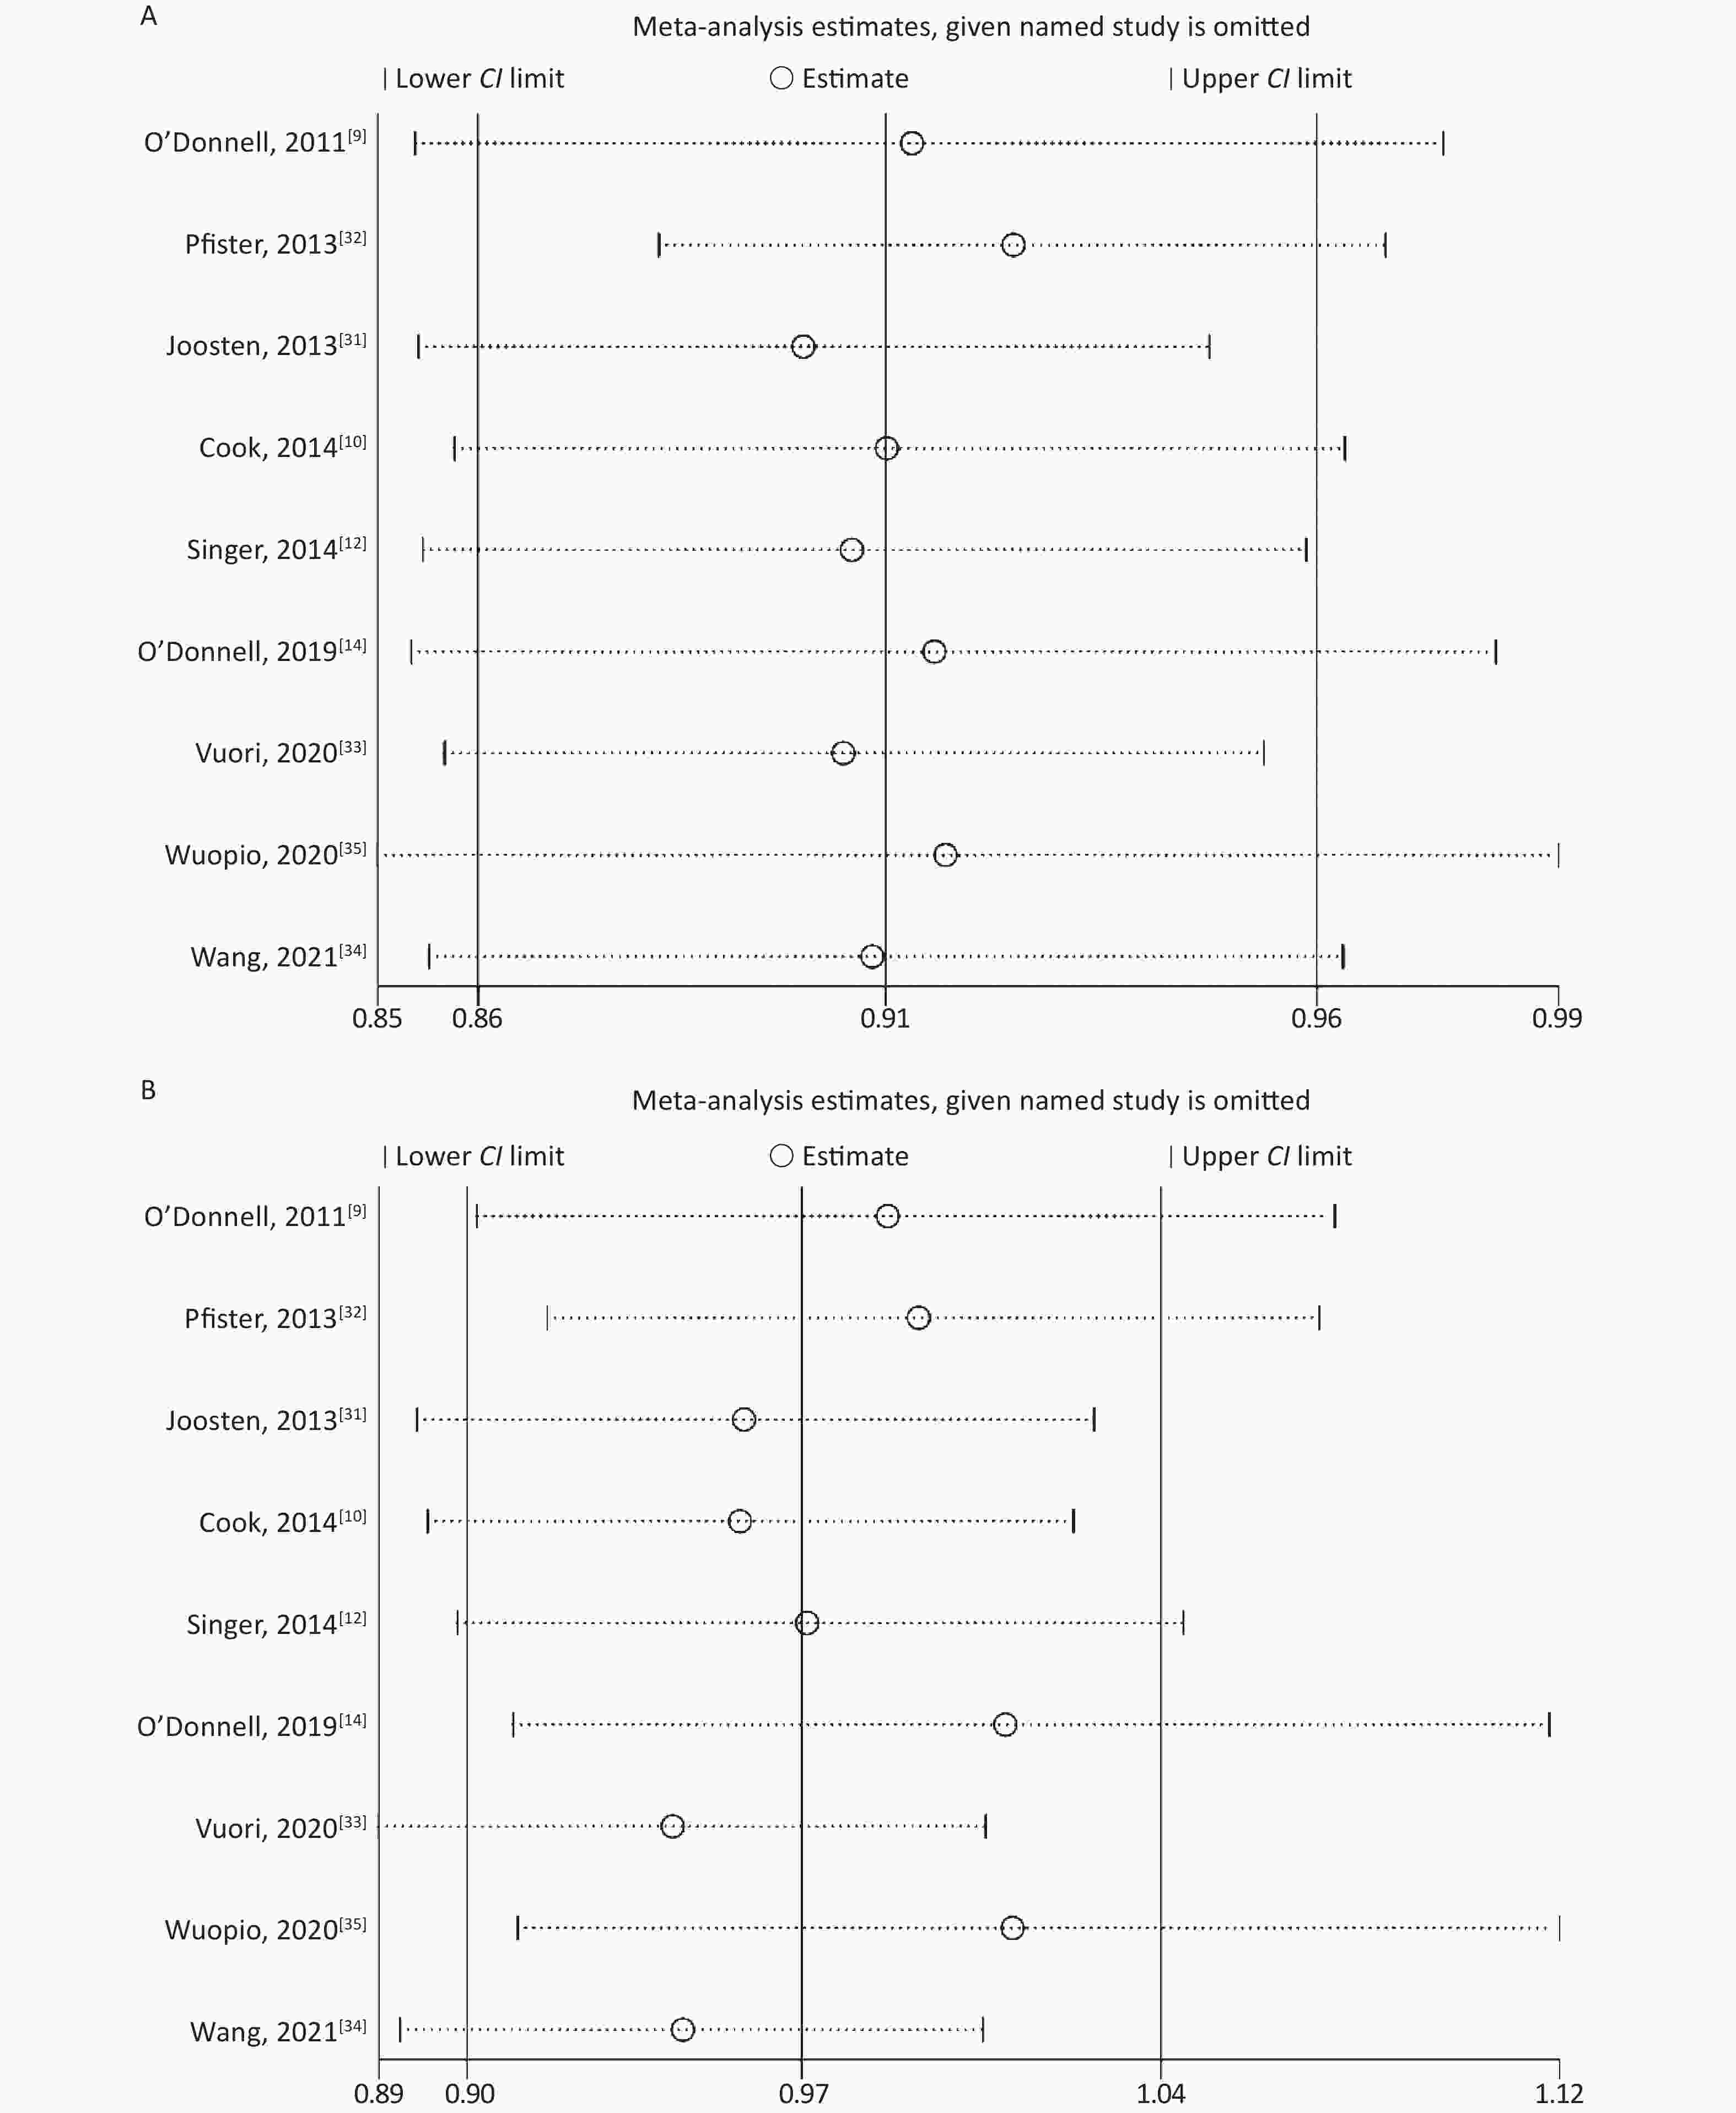
Figure S1. Plot for sensitivity analysis in the nine studies
-
The results of the funnel plots did not exclude any possible publication bias for the low-level and high-level groups (Supplementary Figure S2 available in www.besjournal.com). Neither the Egger’s nor Begg’s test detected any evidence of publication bias for the low-level group (P-value for Egger: 0.132; P-value for Begg: 0.252). The Egger’s test showed possible publication bias for the high-level group (P-value for Egger: 0.0006; P-value for Begg: 0.076).
-
This current study included 645,006 participants; 21,542 had CV events. In the low-level group, the relationship between sodium excretion and the risk of CV events was statistically significant (P < 0.001). However, the relationship between sodium excretion and the risk of CV events was not statistically significant in the high-level group (P = 0.885). A significant non-linear relationship was observed between sodium excretion and CV risk (Pnon-linearity < 0.001). Moreover, the result of the dose-response meta-analysis with the 4 studies collecting 24-h urine samples showed that the sodium excretion and CV events risk were associated linearly. It is indicated that increased sodium excretion might be a risk factor for the CV events.
This meta-analysis showed significant heterogeneity in the high-level sodium excretion (I2 = 84.25%). In the subgroup analysis of the method of urine collection, the pooled RR of studies with 24-h urine collection was 1.190 (1.023, 1.385), suggesting the statistically significant relationship of urinary sodium excretion with the risk of CV events. However, the result of studies using collected spot urine samples was converse. This might be due to the error in 24-hour sodium excretion computed by collecting spot urine samples. Then the sodium excretion calculated by spot urine samples was not accurate and thus might have affected the authenticity of the final results.
Our study observed a J-shaped relationship between sodium intake (measured by urinary sodium biomarker) and CV events. The non-linear dose-response connection was also found in another meta-analysis [36]. In addition, the proof of a U-shaped association shown in a previous meta-analysis indicated that both low sodium and high sodium intakes were connected to the higher risk of CV events [37]. The RR in our linear model showed that every 1 g increase in sodium intake was associated with an increase in the risk of CV events up to 4%. Likewise, a recent meta-analysis showed that the sodium intake and risk of CV events were associated linearly. And that meta-analysis showed that every 1 g increase in sodium intake was associated with an increase in CV events risk up to 6% [38]. The reasons for the different results may be: 1) the methods of sodium measurement were different (urinary sodium biomarker or self-reported dietary intake measurement); 2) different definitions of study outcomes; 3) the ranges of sodium dose and cut-off points were different in the included studies.
Sodium is an essential nutrient component in our diet for maintaining the proper blood volume and blood pressure. The increase in sodium concentration influences the role of the renin-angiotensin-aldosterone system and elevates the heart burden [39, 40]. In addition, blunt renal salt excretion enlarges the extracellular fluid volume and increases blood pressure, manifested as the salt sensitivity of blood pressure [41]. Moreover, a high-sodium diet is related to myocardial contractility and changes in the proteins associated with calcium homeostasis [42]. Therefore, dietary sodium intake might influence the risk of CV events.
According to the linear dose-response meta-analysis conducted with studies collecting 24-h urine samples, increased sodium excretion was a risk factor for the CV events. We recommend that sodium intake be adapted based on individual risk factors. The public should be educated about the dangers of excessive sodium intake. Moreover, no convincing explanation exists for the mechanism of lower sodium intake related to a higher risk of CV events. Therefore, a non-pharmacological measure of reducing sodium intake is a cost-effective option for preventing CV events. There are also some studies examined the association between 24-h urinary potassium excretion and CV events [9, 14, 43, 44]. The results of these studies were similar, that is, higher potassium excretion was associated with a lower risk of CV events. It is indicated that salt substitute with lower sodium and higher potassium may reduce the risk of CV events effectively.
In epidemiological studies without a urinary sodium biomarker, self-reported dietary intake measurement methods were considered significant bias [45]. The formulas for estimating the sodium intake from spot urine contain certain factors (e.g., sex, age, and creatinine concentration) strongly associated with CV events [46, 47]. Although 24-hour urinary excretion is considered the gold standard method for assessing sodium intake [17], a single measurement is not sufficient for providing a reliable estimation of long-term average sodium intake. We could not modify a single measurement's mean estimate of regression dilution bias [48]. Individuals at high risk of CV events might consciously consume less sodium, making the association between sodium intake and disease unreliable. Furthermore, non-adjustment of total energy intake can also produce errors because the total energy intake is highly correlated with sodium intake [49]. Moreover, almost all previous articles are observational studies, whereas randomized controlled trials (RCTs) are lacking, which are required to confirm the existing conclusions. To standardize the data reporting, we recommend (i) using multiple inconsecutive 24-hour urine collections; (ii) selecting subjects without high risk of CV events; (iii) adjusting sodium intake for the total energy intake.
This study had the following strengths. First, different meta-analysis approaches were employed to clarify the relationship between the 24-hour sodium excretion and CV events risk. Second, the total sample size of the meta-analysis was large (n = 645,006), and multiple confounding factors that might affect the results were adjusted in the included studies to make the results more reliable. Third, we plotted a dose-response relationship graph, with the lowest point of the curve providing a threshold dose for sodium excretion that increases the risk of CV events. Finally, in all studies, the dose-response analysis combined with different dose groups of sodium excretion included a wider range of sodium excretion than a single study, making the meta-analysis results more comprehensive and accurate.
However, the study had some limitations. First, multiple confounding factors adjusted in different included studies were not identical, which might have affected the authenticity of the results. Second, this meta-analysis assumed that the heterogeneity among the studies was significant due to the differences in study quality, sample size, follow-up duration, and division of sodium excretion dose groups. Third, several studies did not use the lowest dose group as the reference to calculate the effect estimates. Although we recalculated the effect estimates, it inevitably caused some errors in the recalculated 95% CIs. Finally, only four studies collected 24-hour urine samples to measure sodium excretion. The remaining five used samples of spot urine, which might have led to the inaccurate calculations of 24-hour sodium excretion.
-
To conclude, this meta-analysis showed a significant relationship between the 24-h sodium excretion and the risk of CV events. In studies collecting 24-h urine samples, a linear relationship was observed between sodium excretion and CV events. However, further relevant studies are needed to validate our conclusions further.
-
ZHAO Dan analyzed the data and wrote the manuscript. LI Hua Min and LI Chao Xiu designed the tables and figures. ZHOU Bo proposed the idea for the study and supervised the whole study.
HTML
Data Sources and Search Strategy
Study Selection
Data Extraction
Quality Assessment
Statistical Analysis
Literature Selection
Study Characteristics
Associations between Different Levels of Sodium Excretion and the Risk of CV Events
Dose-response Association between the Sodium Exposure and the Risk of CV Events
Publication Bias
 21500Supplementary Materials.pdf
|

|

 Quick Links
 DownLoad: