


-
Second-hand smoke (SHS), also known as passive smoking or environmental tobacco smoke, is composed of side stream smoke released from the combustion of tobacco products (such as cigarettes, cigars, or pipes) and mainstream smoke exhaled by smokers[1]. It contains more than 7,000 chemicals, of which hundreds are toxic and approximately 70 are reportedly linked with cancer[2,3]. In 2014, the Surgeon General reported that SHS is associated with various diseases in both adults and children[4], and many more recent studies have shown similar results, especially those relating to cancer[5,6], diseases of the respiratory system (DRS)[7,8], and diseases of the circulatory system (DCS)[9,10]. The World Health Organization Framework Convention on Tobacco Control (FCTC) article 8 proposed restrictive provisions on SHS exposure[11].
Studies have reported the health problems caused by SHS exposure in China. In 2010, the exposure rate reached 72.4%. Although the exposure rate decreased slightly in 2018 (44.9% in the household and 50.9% in the workplace)[12], it still attributed a significant disease burden. In 2010, the number of the disability adjusted life years (DALYs) caused by SHS exposure in China was 9,308 million person years, resulting in 381,547 reported deaths. In 2019, the DALYs increased to 9,683 million person years, resulting in 416,054 deaths[13]. Studies have shown that the development of the tobacco epidemic in China is different from that in Western countries. For active smoking, several studies have shown substantial differences in the level of risk between countries. Using lung cancer as an example, the relative risks (RRs
) ranged from 2.4 to 6.5 in China, which were much lower than in Western countries (range, 9.4 to 23.2)[14]. The risk values reported for many studies in Western countries are generally greater than 10[15-17]. The unique cooking style involved in preparing Chinese cuisine has an impact on the levels of indoor air pollution in Chinese households. Therefore, it is of significance to explore the risks associated with SHS exposure and different diseases among the Chinese population. A literature search identified 30 meta-analyses on the association between SHS exposure and diseases among the Chinese population, three of which were written in English and the other 27 in Chinese. In these meta-analyses, the number of included studies ranged from 6 to 51, covering the following 11 diseases: lung cancer (n = 9)[18-26], low birth weight (n = 5)[27-31], breast cancer (n = 3)[32-34], congenital heart disease (n = 3)[35-37], stroke (n = 2)[38,39], asthma in children (n = 2)[40,41], adverse pregnancy outcomes (n = 2)[42,43], COPD (n = 1)[44], birth defects (n = 1)[45], childhood autism (n = 1)[46], and gestational diabetes mellitus (n = 1)[47]. All of these studies were completed before 2017, with the exception of the latest study of lung cancer, which was published in 2020. Of the studies, 25 were not completed within the last five years and only one disease was analyzed in each paper. Therefore, there is a lack of comprehensive data and up-to-date evidence on the risk of various diseases associated with SHS exposure among the Chinese population.
The aim of this study was to systematically review the risk of all diseases related to SHS exposure in the Chinese population based on an exhaustive search of observational studies published up until June 31, 2021. Our findings provide a basis for future studies, and the data may be used for burden of disease estimations.
-
This study was reported in accordance with the Preferred Reporting Items for Systematic Reviews and Meta-Analyses (PRISMA) statement. Studies published up until June 30, 2021, were identified through a search of Chinese databases (including CNKI, Wanfang, and VIP) and English databases (including PubMed, EMBASE, and Cochrane Library), with the keywords: “tobacco” “smoking” “cigarette” “smoker” “smokers” “smoke” “nicotine” “China” “Chinese”. The complete search used for PubMed was:
((((((((tobacco[Title/Abstract]) OR (smoking[Title/Abstract])) OR (cigarette[Title/Abstract])) OR (smoker[Title/Abstract])) OR (smoke[Title/Abstract])) OR (smokers[Title/Abstract])) OR (nicotine[Title/Abstract])) AND (((case-control[Title/Abstract]) OR (case control[Title/Abstract])) OR (cohort[Title/Abstract]))) AND ((China[Title/Abstract]) OR (Chinese[Title/Abstract])).
Additional records were manually identified by searching the references of published articles, reviews, and previous meta-analyses. Based on the above search method, all articles on passive smoking and SHS exposure were included in this study.
-
Inclusion Criteria This was structured according to the PECOS format. 1) Participants (P): Studies were carried out among the Chinese population, and the participants were representative; 2) Exposure (E): SHS exposure; 3) Comparison (C): To actively compare with individuals unexposed to SHS; 4) Outcomes (O): Effect values for SHS exposure and corresponding outcome events [Odds Ratios (ORs), Relative Risks (RRs), or Hazard Ratios (HRs)]; 5) Types of study (S): Case-control and cohort studies without restriction to language or time period; 6) Studies with a score of 6 or above using the Newcastle Ottawa Scale (NOS) assessment[48].
Exclusion Criteria 1) Duplicate studies or abstracts without the full text being available; 2) Gene or cell research, and animal experiments; 3) Special groups, such as coal miners, pregnant women, and drug users. 4) The outcomes of the study were symptoms rather than diseases, such as elevated blood sugar.
-
Study screening and data extraction were carried out independently by two researchers, with verification by a third reviewer. The title, first author, year of publication, time of investigation, sampling method, location, definition of SHS, number of cases and controls, basic information about participants, and other relevant parameters were extracted. The risk of bias according to the PRISMA recommendations was assessed independently by the two researchers mentioned above.
-
We evaluated the quality of the included studies from two aspects. First, the mean value of the NOS scores for each group. Second, a description of whether each study clearly defined the definition and source of SHS exposure.
-
In this study, HRs were the effect values for three studies on the risk of death, and the RRs for the five cohort studies. Because of the limited number of the above two types of studies, the OR was used as the uniform effect value. In addition, two types of analysis strategies were used in this study. 1) For those diseases for which only one or two studies had been conducted, a simple statistical description was used. 2) For those diseases for which three or more studies had been conducted, meta-analysis was conducted using the Stata 15.1 software (Computer Resource Center, U.S.A).
Therefore, meta-analysis was performed for the studies on cancer (including lung cancer, breast cancer, bladder cancer, and liver cancer), DRS (including asthma in children), and DCS (including stroke). The heterogeneity of the effects across studies was evaluated using I2 and Q tests. The fixed effect model was used when I2 < 50% or P > 0.1. The random effect model was otherwise used. The time of investigation was divided into three periods (1983–1995, 1996–2009, and after 2010) based on the changes in the definition of SHS exposure. The participants were divided into four groups: Men, Women, Men and Women, and Children. The exposure sites were divided into Household, Workplace, and Non-specified Sites. Subgroup analysis was performed for the groups mentioned above. Funnel plots, with Egger's tests, were used to evaluate publication bias, and the “leave-one-out” method was used for sensitivity analysis.
-
A total of 53 studies were identified (Figure 1), with the sample size ranging from 126 to 73,363. Most studies were published in Chinese (n = 35) and a few were published in English (n = 18), with average NOS scores of 6.34 and 7.45, respectively. There were 48 case-control studies and 5 cohort studies, with average NOS scores of 6.52 and 8.60, respectively. The year in which each study began ranged from 1983 to 2019, with the majority being initiated from 1996 to 2009. In total, 31 of the studies were conducted on women, 4 studies were conducted on men, and 9 studies were conducted on children. The exposure sites were reported in only 16 studies (household or workplace). Among the 53 studies, two included four types of diseases each. Therefore, a total of 23 diseases (n = 59) were analyzed including: 15 types of cancer (n = 42)[49-86], 2 DRS (n = 7)[87-93], 2 DCS (n = 4)[55,94-95], and 4 other diseases (n = 6)[96-101] (Table 1). More details are shown in Supplementary Table S1, available in www.besjournal.com.
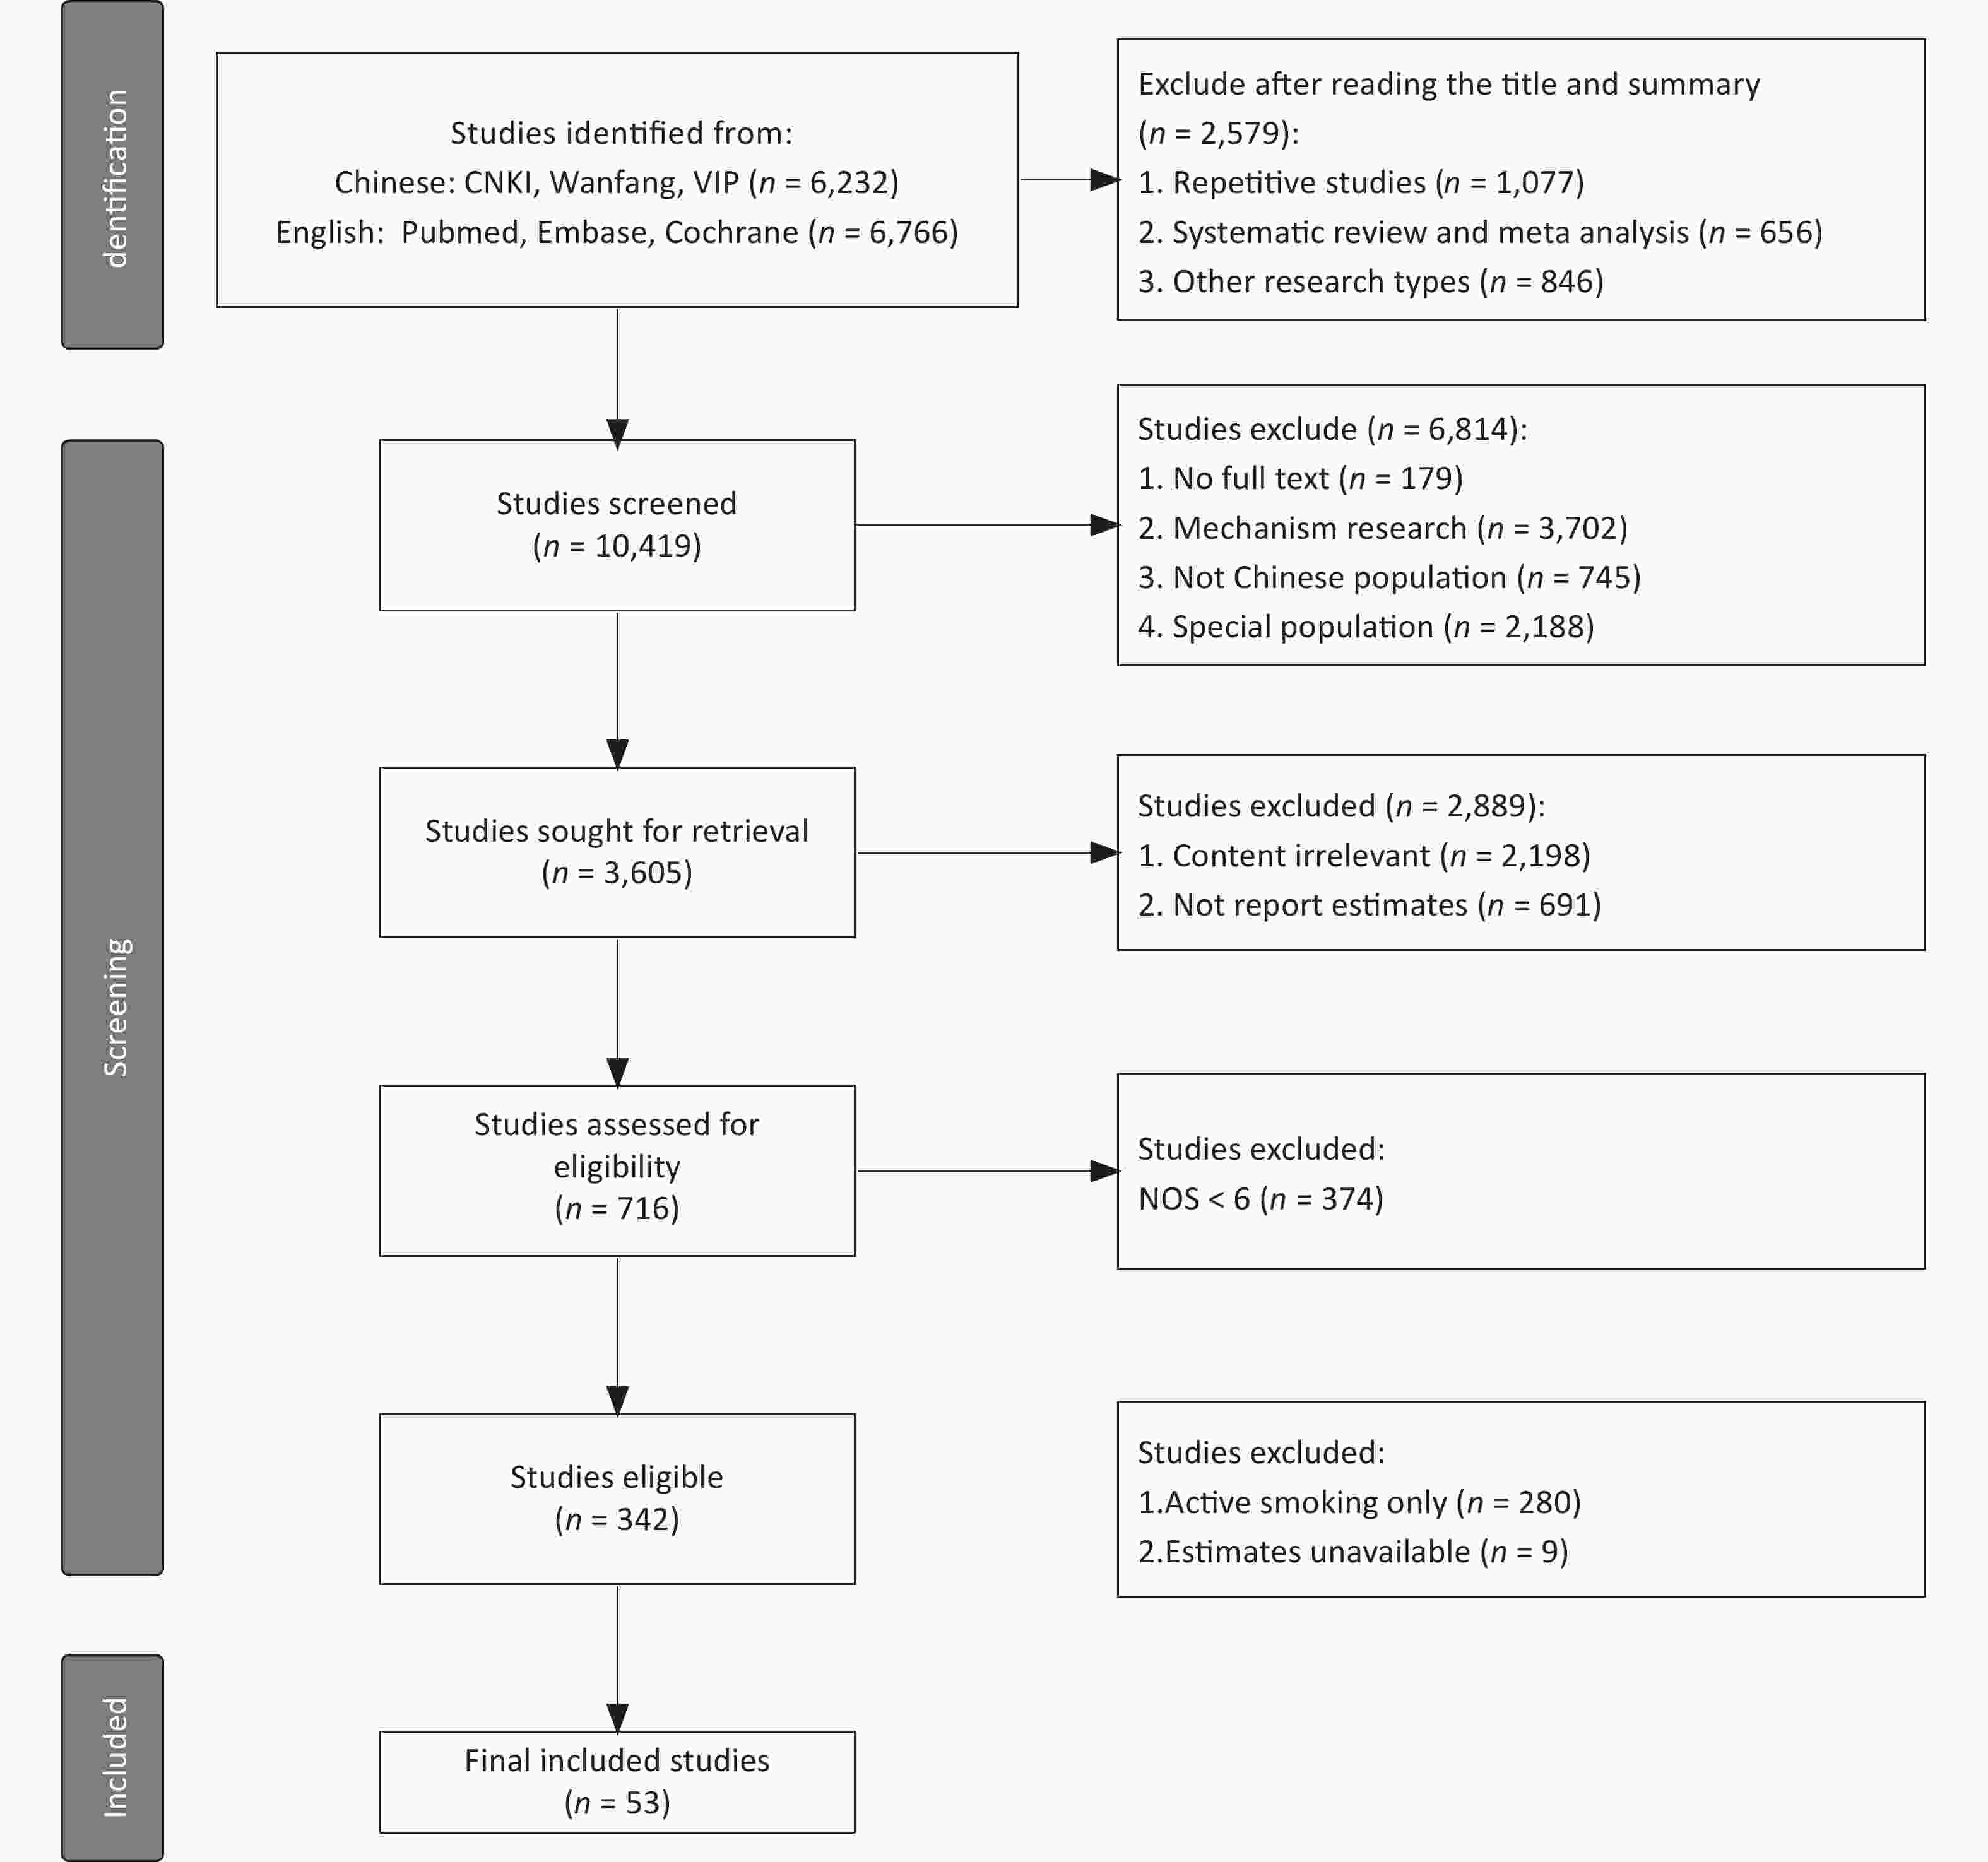
Figure 1. The study selection process.
Basic information Chinese English Total Number of participants NOS
(mean score)(n, %) (n, %) (n, %) Min Max Total 35 100.0 18 100.0 53 100.0 126 73,363 6.72 Language Chinese 35 100.0 − − 35 66.0 126 73,363 6.34 English − − 18 100.0 18 34.0 204 72,829 7.45 Study design Case-control 35 100.0 13 72.2 48 90.6 126 2,082 6.52 Cohort 0 0 5 27.8 5 9.4 15,486 73,363 8.60 Start year of
investigation1983–1995 8 22.9 1 5.6 9 17.0 126 1,776 6.56 1996–2009 17 48.6 16 88.9 33 62.3 210 73,363 6.91 2010–2021 9 25.7 1 5.6 10 18.9 218 1,284 6.30 None 1 2.9 0 0 1 1.9 552 552 6.00 Sex Women 15 39.5 16 61.5 31 48.4 244 73,363 7.19 Men 2 5.3 2 7.7 4 6.3 456 1,776 7.75 Both 13 34.2 7 26.9 20 31.3 210 23,415 7.05 Children 8 21.1 1 3.8 9 14.1 126 1,209 6.00 Exposure site Household 7 15.6 9 23.7 16 19.3 244 72,829 7.08 Workplace 9 20.0 7 18.4 16 19.3 244 72,829 7.08 Total 29 64.4 22 57.9 51 61.4 126 73,363 6.91 Cancer type Total 25 100.0 17 100.0 42 100.0 214 72,829 6.95 Lung Cancer[49-63] 9 36.0 6 35.3 15 35.7 244 72,829 6.73 Breast Cancer[64-71] 4 16.0 4 23.5 8 19.0 372 1,767 6.63 Bladder Cancer[72-74] 2 8.0 1 5.9 3 7.1 456 1,215 8.00 Liver Cancer[61,75,76] 2 8.0 1 5.9 3 7.1 794 23,415 7.00 Cervical Cancer[77,78] 2 8.0 0 0 2 4.8 312 413 6.00 Acute Lymphoblastic
Leukemia[79]1 4.0 0 0 1 2.4 613 613 6.00 Colon Cancer[80] 1 4.0 0 0 1 2.4 396 396 8.00 Colorectal Cancer[61] 0 0 1 5.9 1 2.4 23,415 23,415 9.00 Endometrial Cancer[81] 1 4.0 0 0 1 2.4 2,082 2,082 8.00 Esophageal Squamous
Cell Carcinoma[82]0 0 1 5.9 1 2.4 214 214 7.00 Intracranial Tumors[83] 1 4.0 0 0 1 2.4 537 537 6.00 Oral Cancer[84] 0 0 1 5.9 1 2.4 708 708 7.00 Papillary Thyroid Cancer[85] 1 4.0 0 0 1 2.4 369 369 6.00 Stomach Cancer[61] 0 0 1 5.9 1 2.4 23,415 23,415 9.00 Tongue Cancer[86] 1 4.0 0 0 1 2.4 876 876 7.00 Cancer[55] 0 0 1 5.90 1 2.4 72,829 72,829 9.00 DRS* Total 5 100.0 2 100.0 7 100.0 212 1,209 6.14 Asthma in Children[87-92] 5 100.0 1 50.0 6 85.7 212 1,209 6.00 Small Airway Obstruction[93] 0 0 1 50.0 1 14.3 648 648 7.00 DCS* Total 2 100.0 2 100.0 4 100.0 210 72,829 7.75 Stroke[55,94,95] 2 100.0 1 50.0 3 75.0 210 72,829 7.33 Cardiovascular Disease[55] 0 0 1 50.0 1 25.0 72,829 72,829 9.00 Other Diseases Total 3 100.0 3 100.0 6 100.0 126 28,177 7.17 Tuberculosis[96,97] 1 33.3 1 33.3 2 33.3 348 15,486 7.00 Legionnaires' Disease
(Children)[98]1 33.3 0 0 1 16.7 126 126 6.00 Otitis Media (Children)[99] 1 33.3 0 0 1 16.7 534 534 6.00 Type 2 Diabetes Mellitus[100] 0 0 1 33.3 1 16.7 28,177 28,177 9.00 All Causes of Mortality[101] 0 0 1 33.3 1 16.7 73,363 73,363 8.00 Note. For the basic information on sex, exposure site, and disease type, some studies contained more than one result, so the total number for each group could be more than that of the study design and the start year of investigation, respectively. *DRS: Diseases of the Respiratory System; DCS: Diseases of the Circulatory System; NOS: Newcastle Ottawa Scale. Table 1. Basic information regarding the selection of studies
-
Among the 59 disease-specific studies, the definition of SHS exposure was clarified in 47.17% (n = 25) of cases. Of the studies, 22.64% (n = 12) were based on the time and frequency of exposure to SHS (Definition 1), and 24.53% (n = 13) were based on the family members who smoke (Definition 2).
The sources of SHS, according to three types of characteristics, were reported by 49.6% (n = 27) of studies. The first classification was “location”, such as household and workplace (Type 1); the second classification was “stage of life”, such as adulthood or childhood (< 18 or > 18 years), pregnant or post-pregnancy, or menopausal (Type 2); the third classification was based on specific family members (such as husband, parents), partners, or colleagues (Type 3). Because there was more than one type of SHS source in some articles, 20.75%, 24.53%, and 30.19% of the studies were classified according to the above three characteristics, respectively (Table 2). More details are shown in Supplementary Table S2, available in www.besjournal.com.
Variables Definition of SHS (n, %) Characteristic of SHS (n, %) Undefined Definition 1 Definition 2 None Type 1 Type 2 Type 3 DCS 2 7.14 0 0 0 0 2 7.69 0 0 0 0 1 6.25 DRS 6 21.43 0 0 1 7.69 3 11.54 1 9.09 1 7.69 4 25.00 Cancers 17 60.71 10 83.33 11 84.62 15 57.69 10 90.91 12 92.31 11 68.75 Other diseases 3 10.71 2 16.67 1 7.69 6 23.08 0 0 0 0 0 0 Total 28 52.83 12 22.64 13 24.53 26 49.06 11 20.75 13 24.53 16 30.19 Note. Specific descriptions for the definitions and characteristics are provided in Supplementary Table S2. SHS, second-hand smoke; DRS, Diseases of the Respiratory System; DCS, Diseases of the Circulatory System. Table 2. Definition and characteristics of second-hand smoke exposure
-
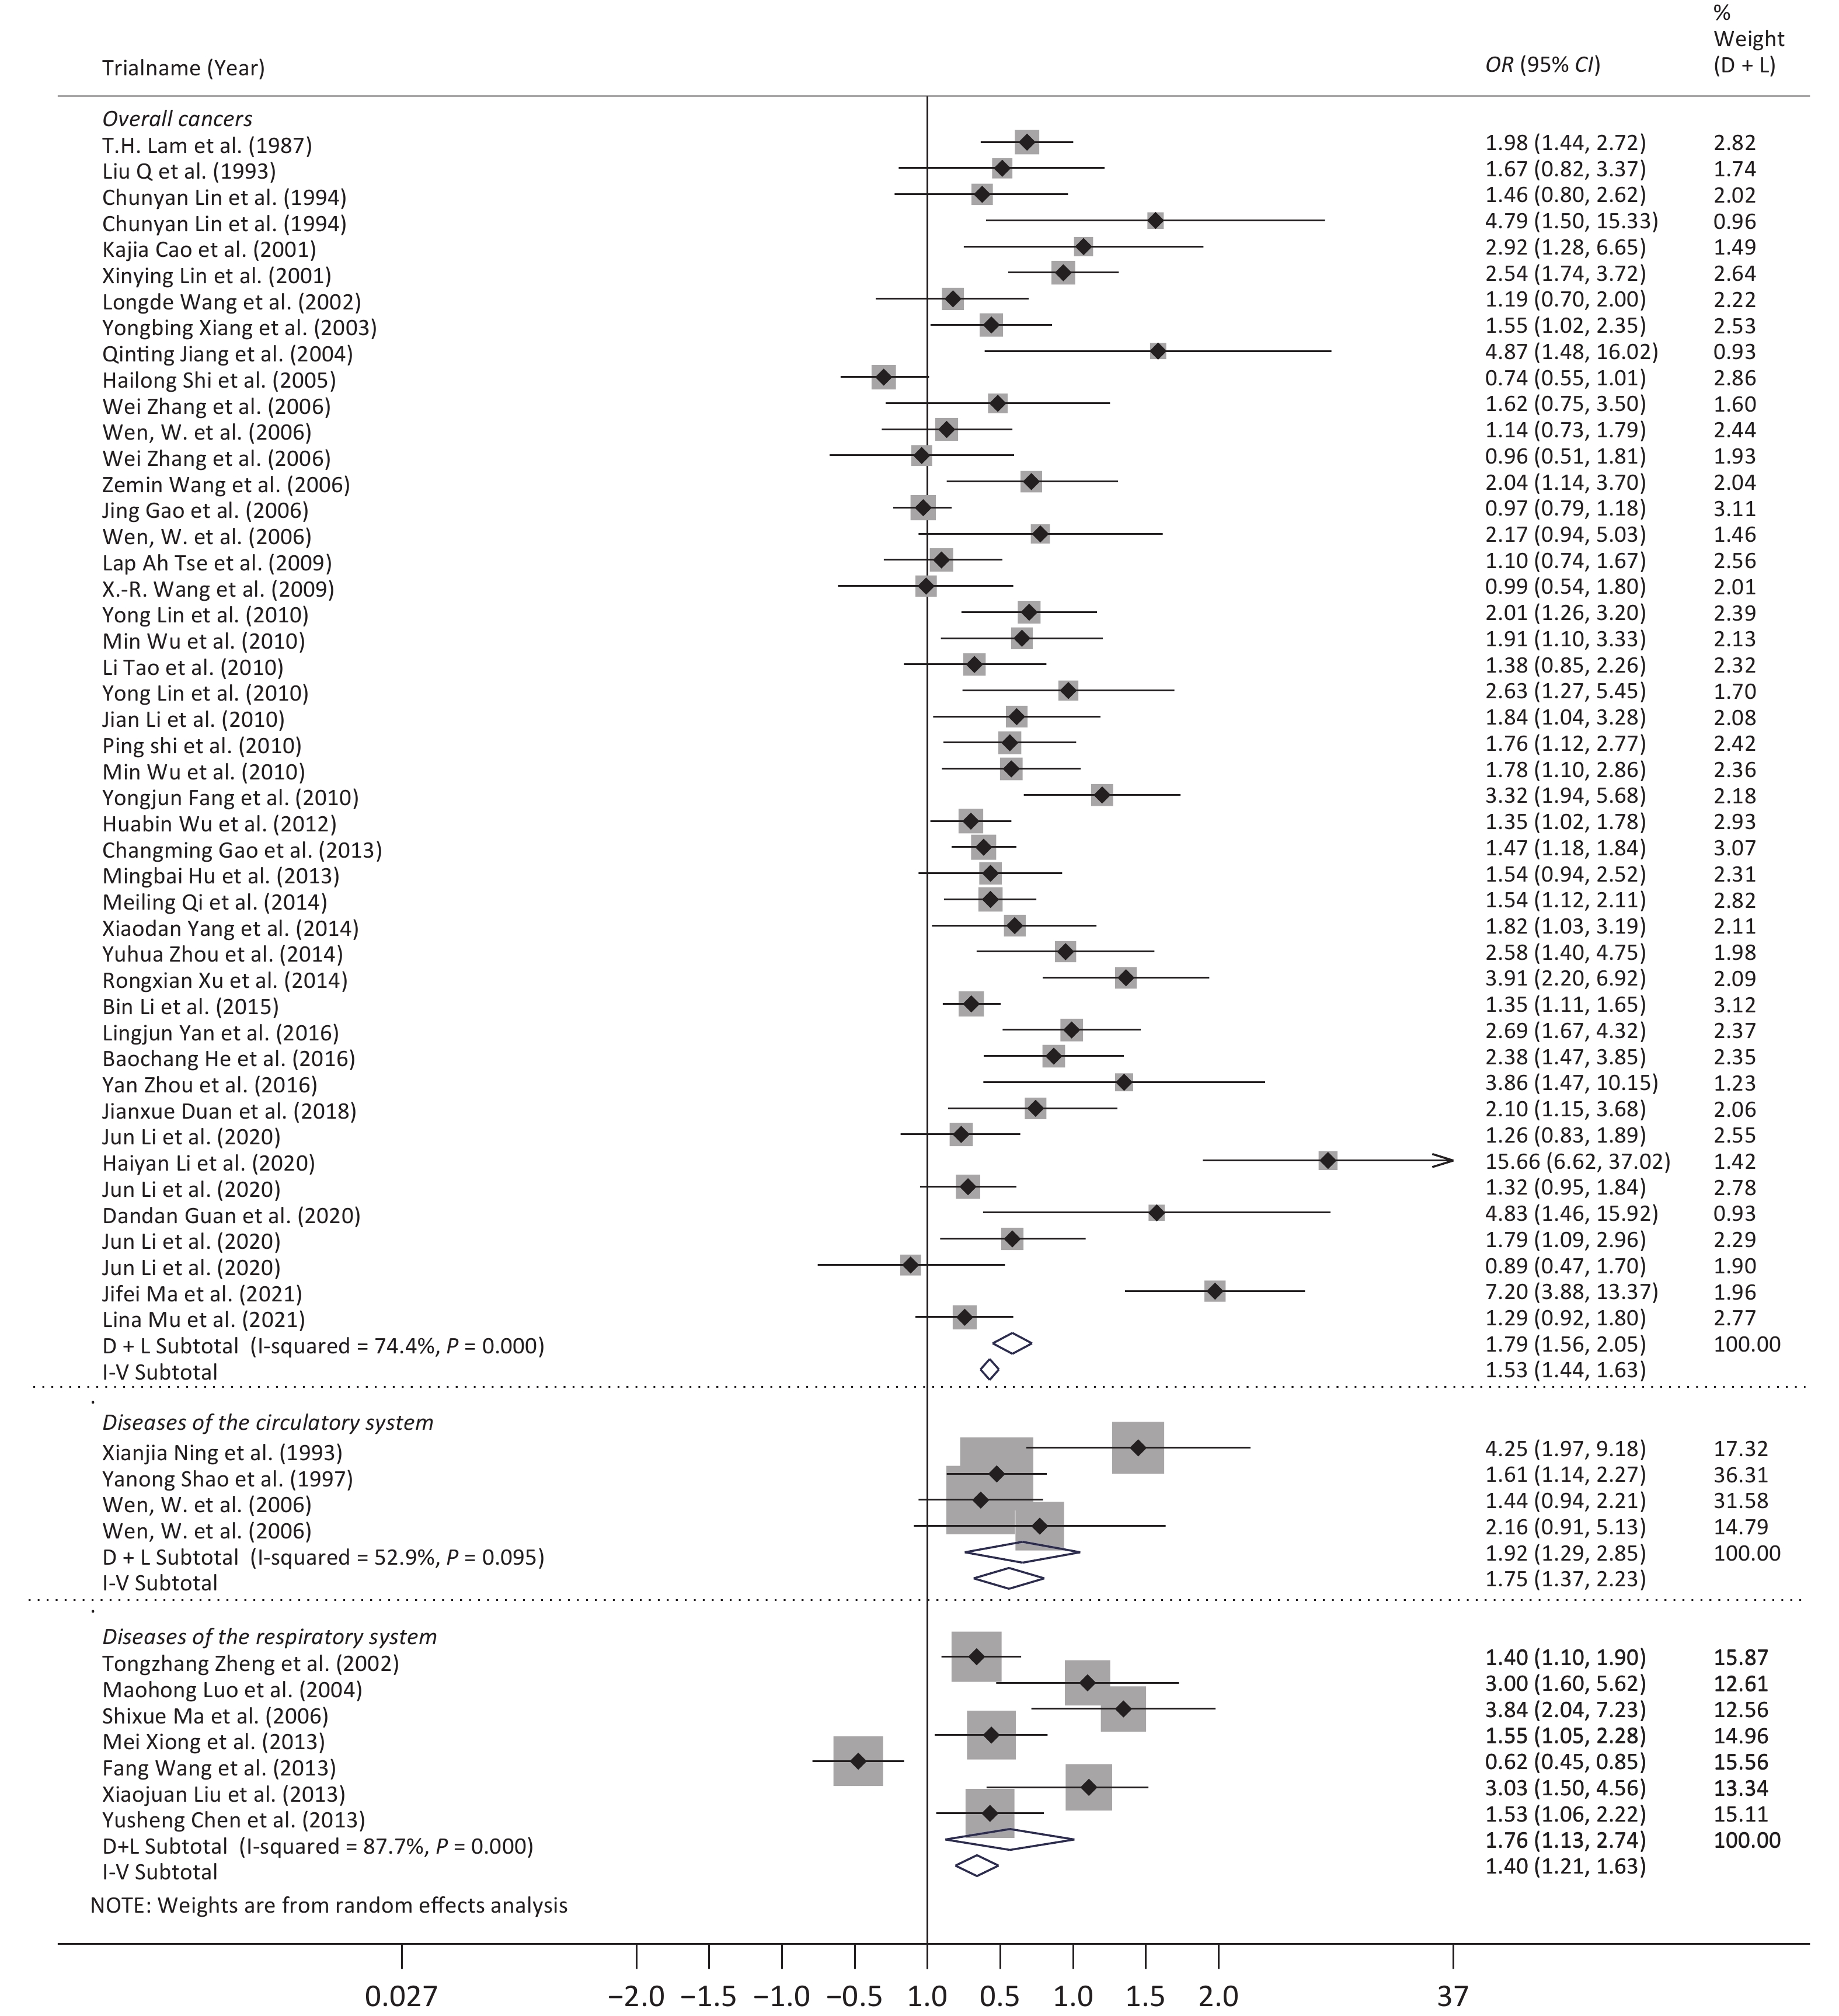
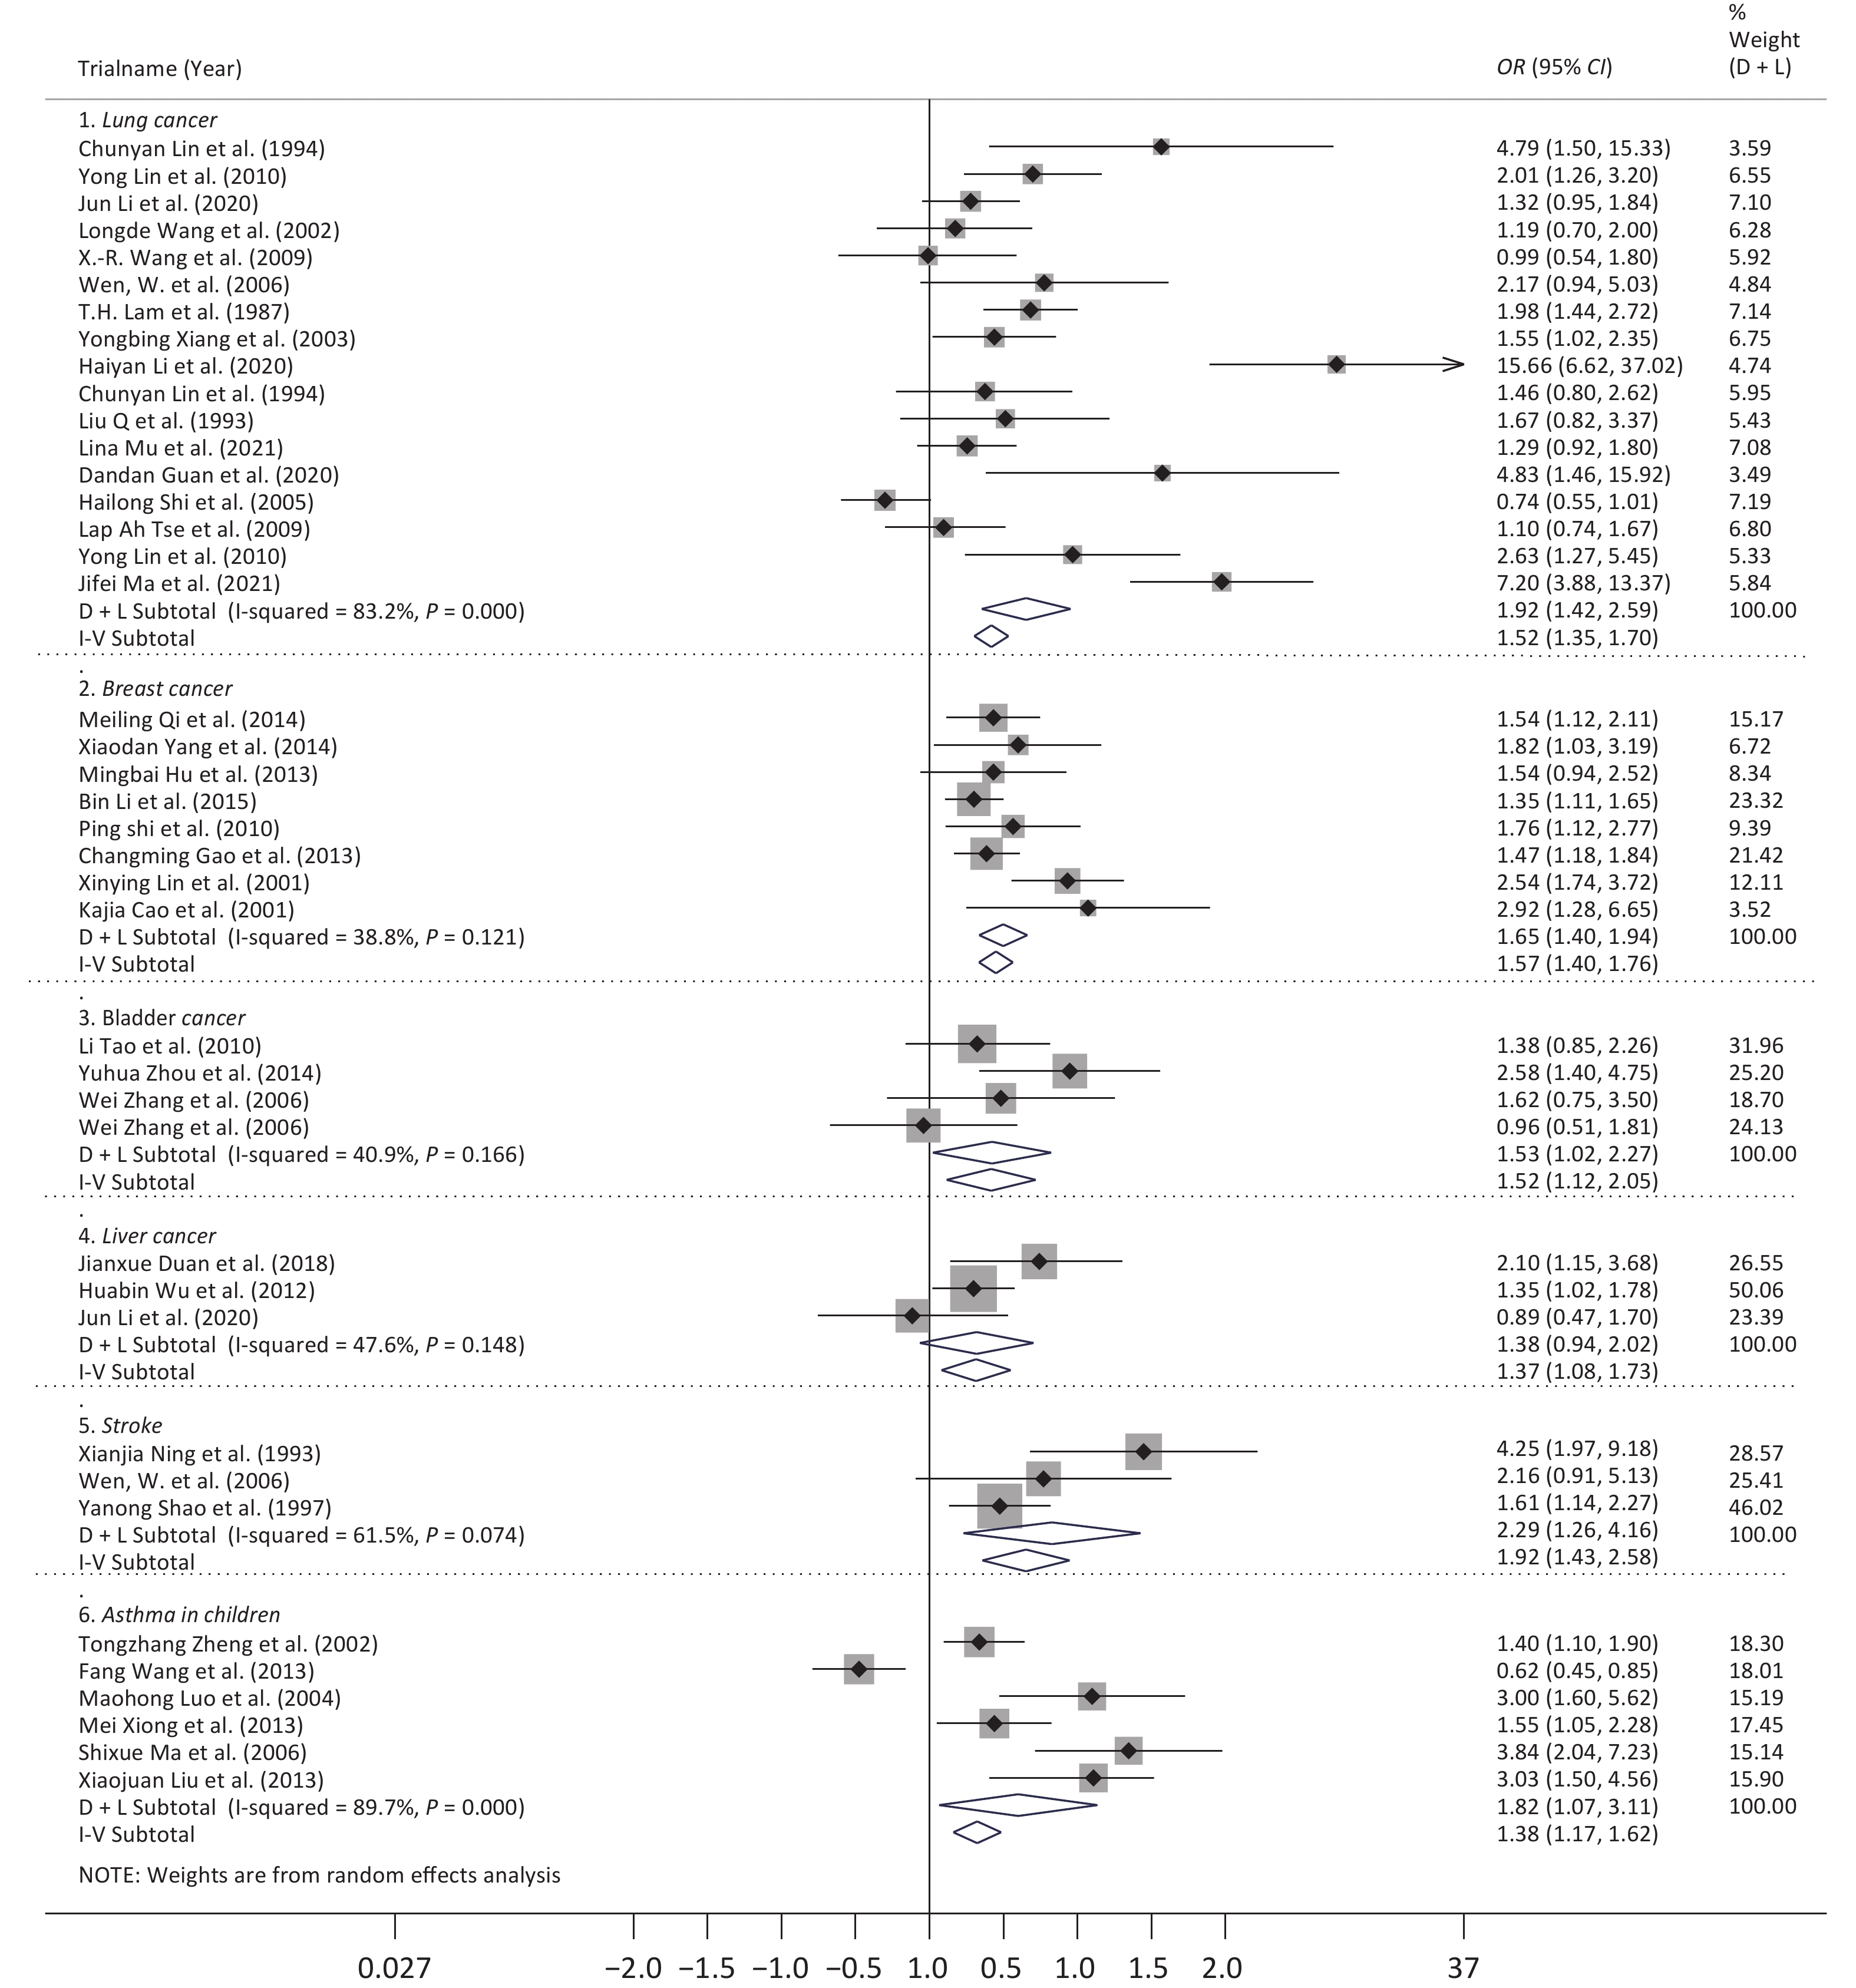
Following meta-analysis, we observed an OR of 1.79 (95% CI: 1.56–2.05) for all cancers, and ORs of 1.92 (95% CI: 1.42–2.59) for lung cancer, 1.57 (95% CI: 1.40–1.76) for breast cancer, 1.52 (95% CI: 1.12–2.05) for bladder cancer, and 1.37 (95% CI: 1.08–1.73) for liver cancer. The OR for DCS was 1.92 (95% CI: 1.29–2.85), and further 2.29 (95% CI: 1.26–4.16) for stroke. The OR for DRS was 1.76 (95% CI: 1.13–2.74), and further 1.82 (95% CI: 1.07–3.11) for asthma in children (Figures 2 and 3).
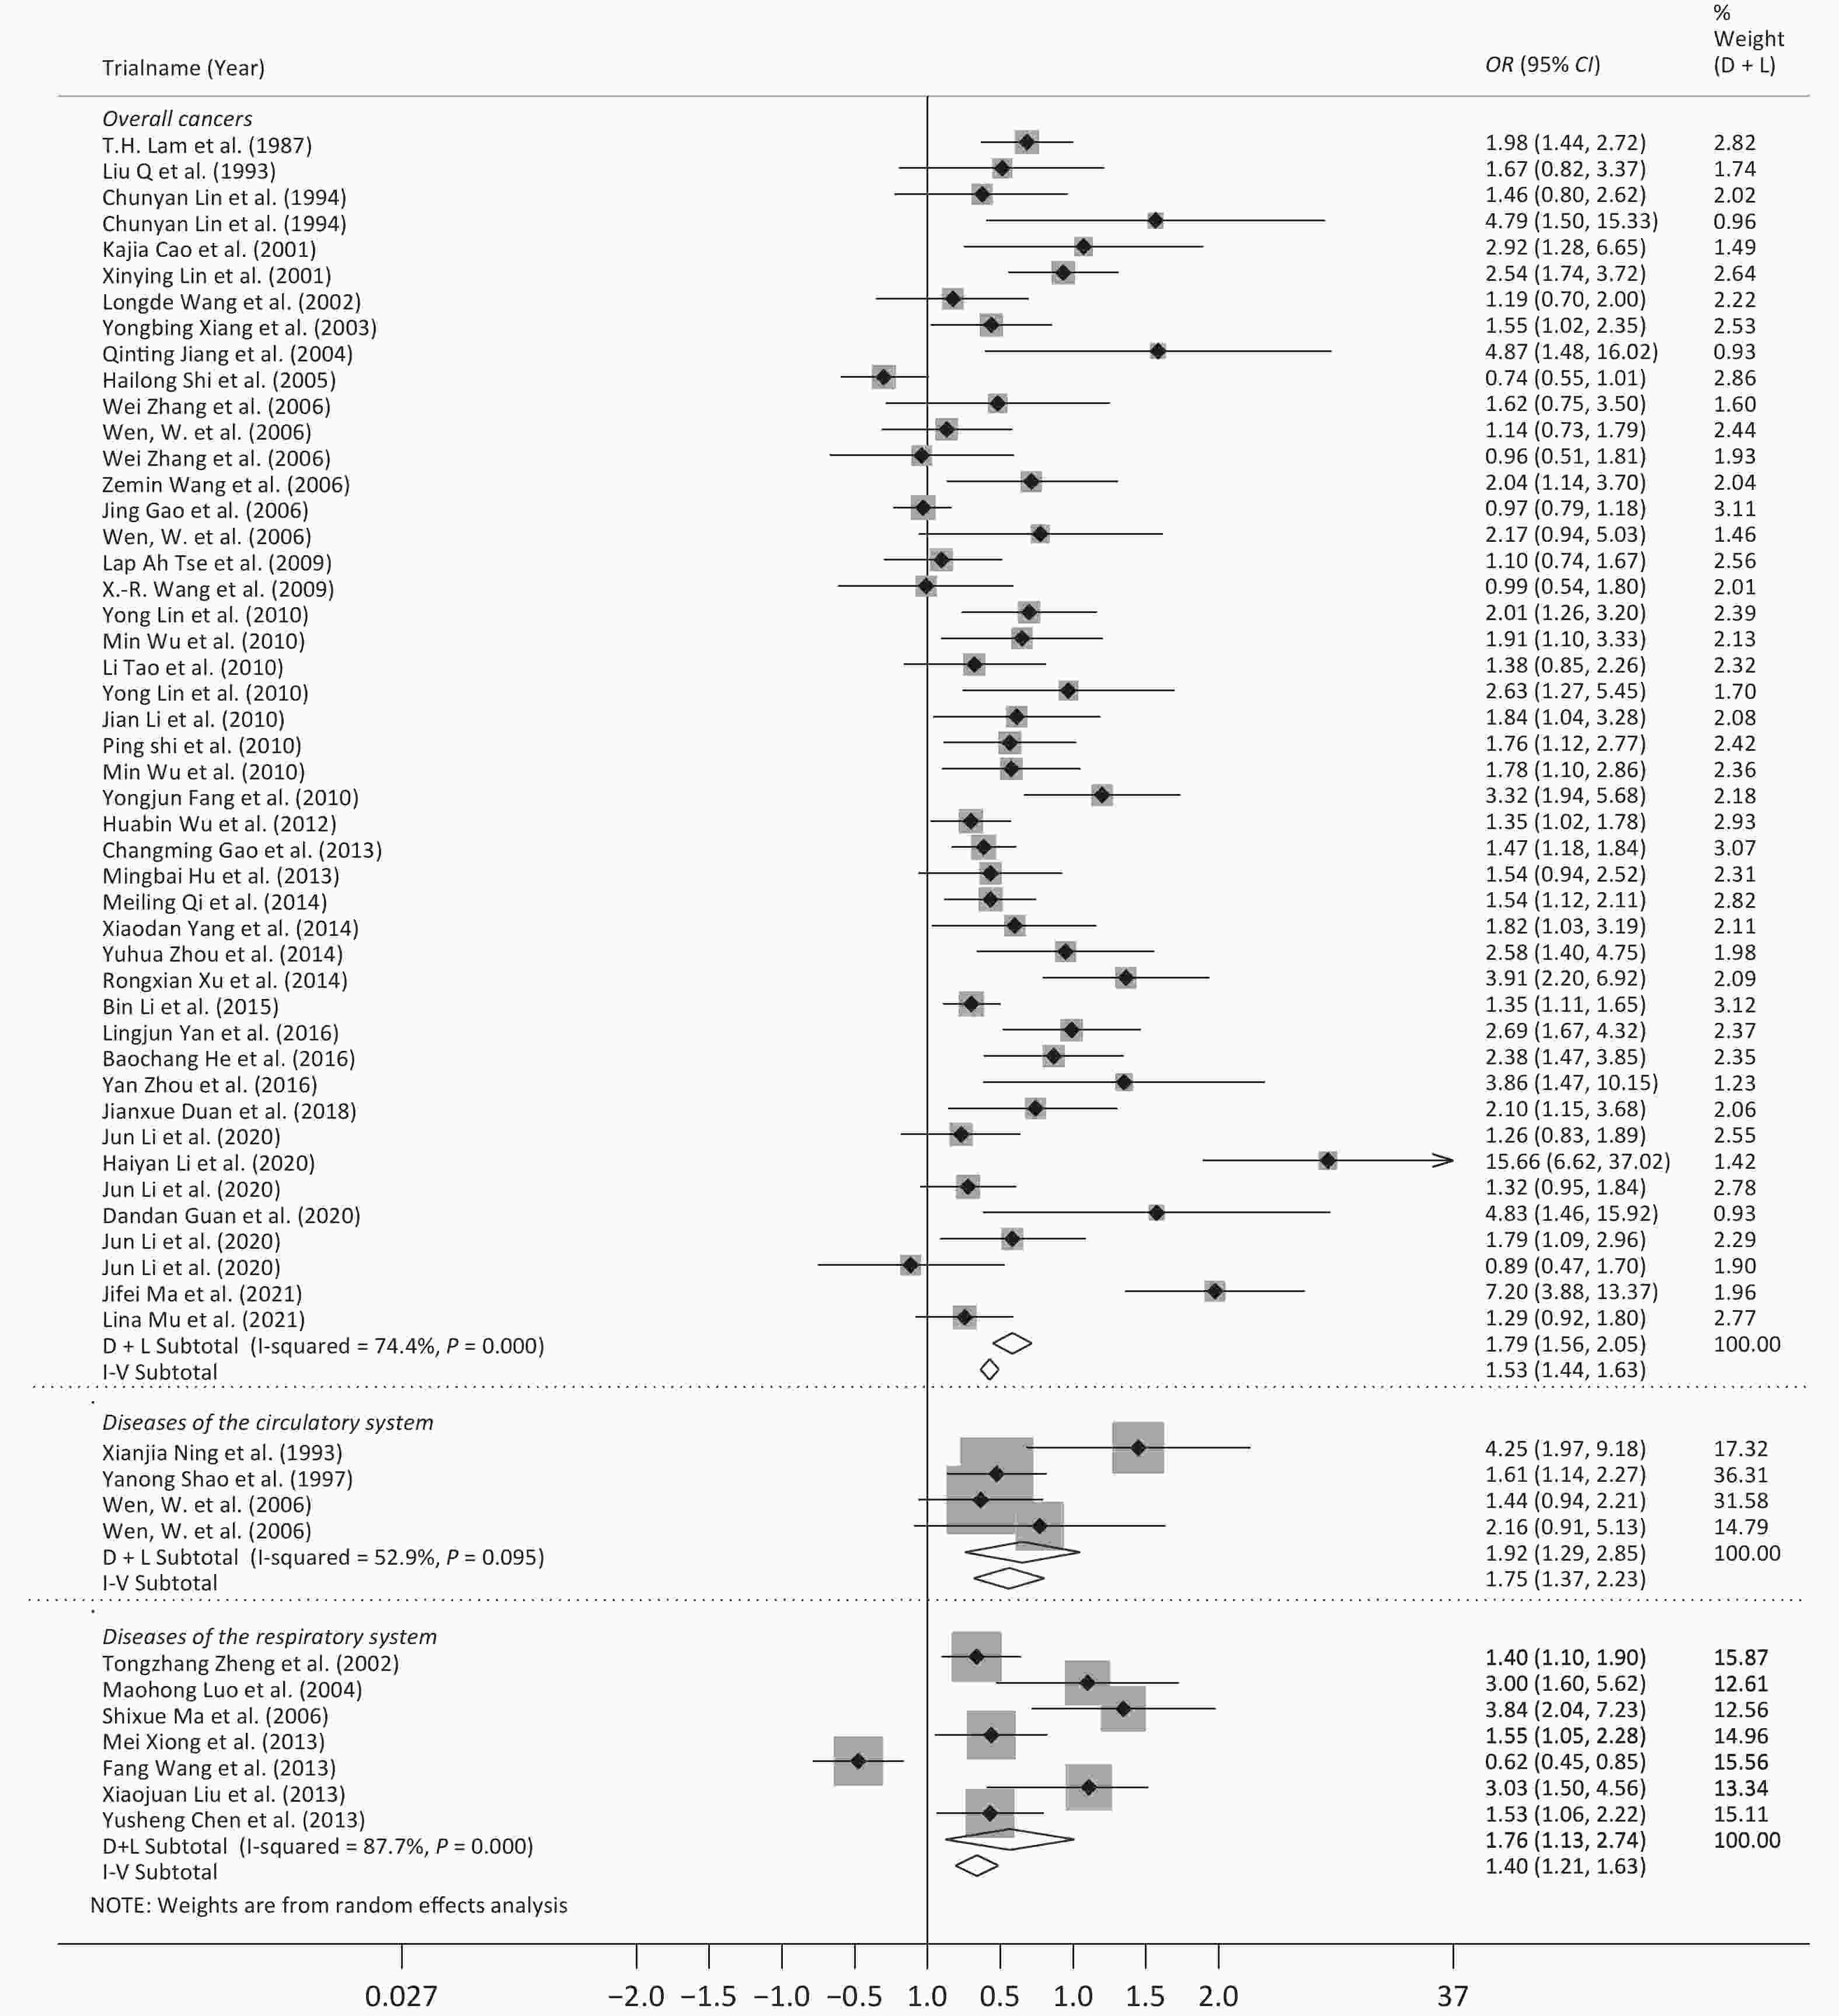
Figure 2. The odds ratios for second-hand smoke exposure.
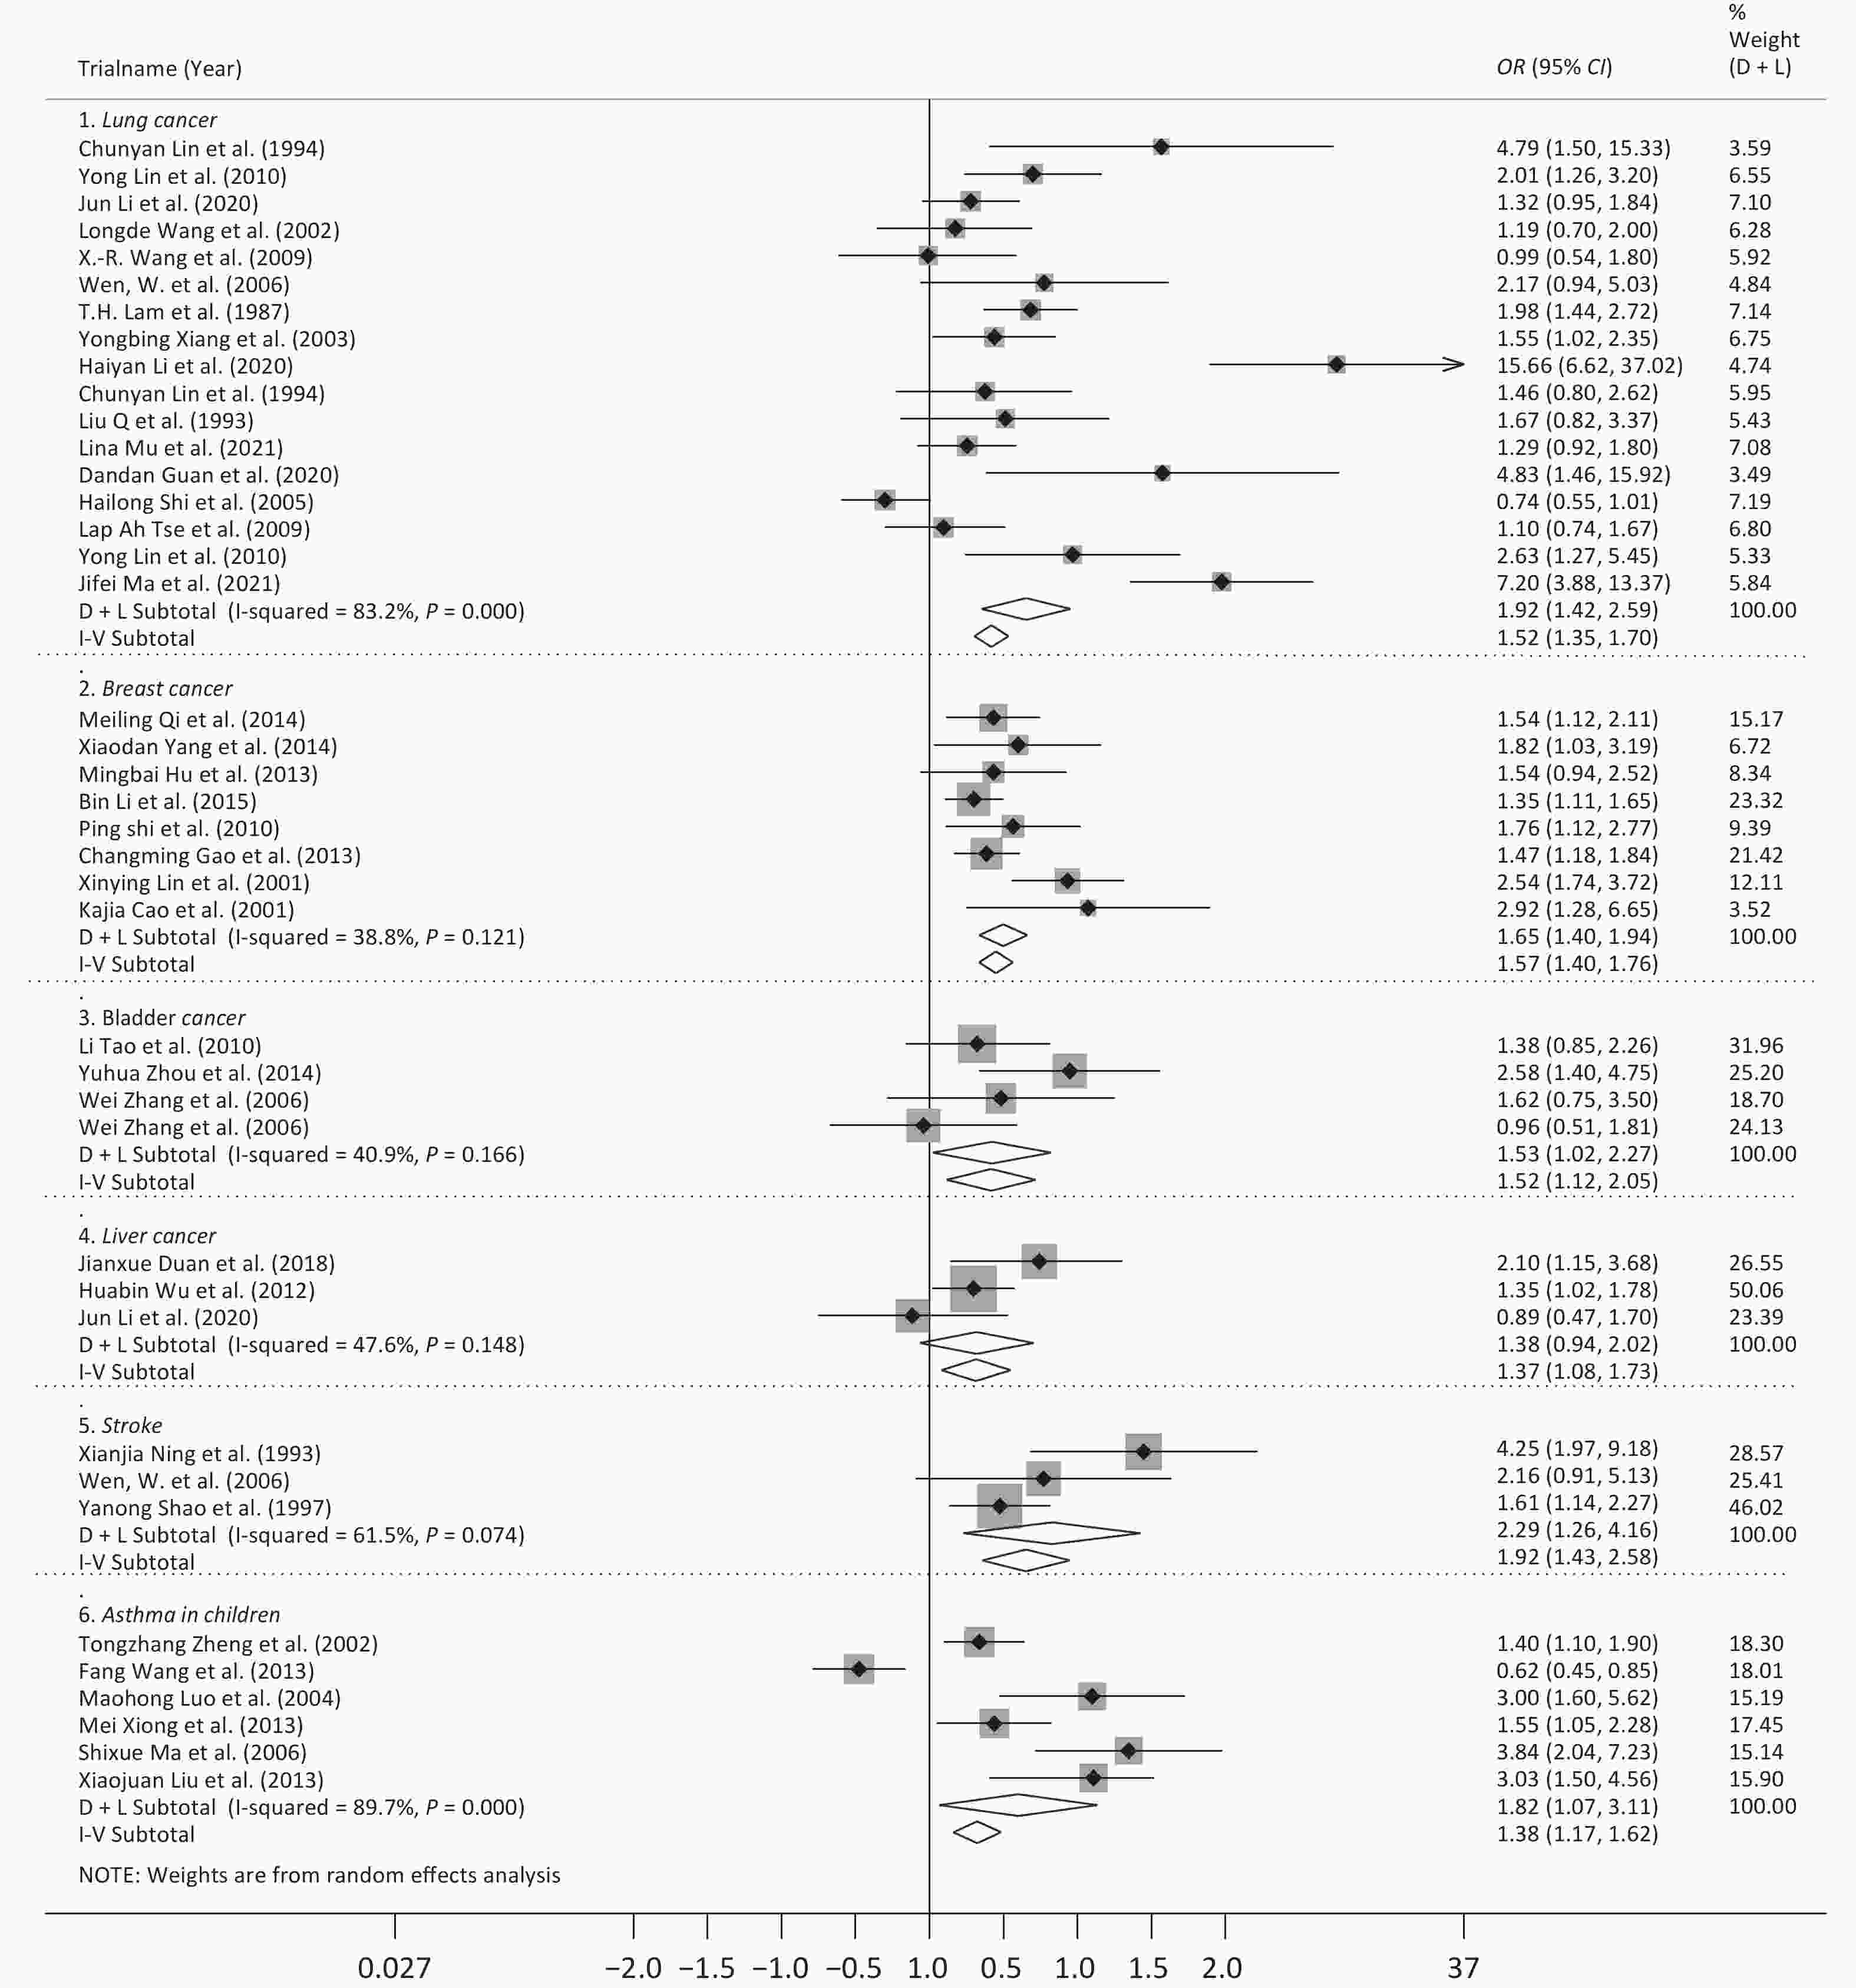
Figure 3. The disease-specific odds ratios for second-hand smoke exposure.
For the other 17 diseases for which meta-analysis was not performed, the ORs for colorectal cancer, endometrial cancer, cardiovascular disease, and tuberculosis were not statistically significant. Whereas the ORs for the other diseases ranged from 1.17 to 4.87, which did show a statistically significant difference. More details are provided in Table 3.
Diseases Subgroup Number of
observationsI2
(%)P-value Model POR/OR and 95% CI Egger's test POR/OR LL UL t P-value Cancers* 46 74.4 < 0.001 Random 1.79 1.56 2.05 2.74 0.000 Lung cancer* 17 83.2 < 0.001 Random 1.92 1.42 2.59 3.87 0.009 1983−1995* 4 0.3 0.390 Fixed 1.64 1.33 2.03 −3.17 0.125 1996−2009* 9 64.7 0.004 Random 1.34 1.03 1.74 3.02 0.072 2010−2019* 4 22.7 0.275 Fixed 7.85 5.11 12.07 −1.14 0.687 Women* 12 71.1 < 0.001 Random 1.65 1.22 2.24 2.41 0.076 Men* 2 0 0.843 Fixed 1.12 0.77 1.63 0.38 − Both* 5 92.5 < 0.001 Random 2.76 1.28 5.96 8.51 0.062 Household* 6 65.6 0.012 Random 1.59 1.08 2.35 0.03 0.991 Workplace* 6 72.1 0.003 Random 1.38 0.94 2.04 4.54 0.023 Total* 9 87.4 < 0.001 Random 2.20 1.33 3.62 4.60 0.061 Breast cancer* 8 38.8 0.121 Fixed 1.57 1.40 1.76 2.11 0.044 1983–1995* 2 0 0.763 Fixed 2.60 1.84 3.68 0.62 − 1996–2009* 6 0 0.853 Fixed 1.47 1.30 1.66 1.35 0.021 Household* 2 0 0.338 Fixed 1.38 1.15 1.65 3.42 − Workplace* 2 0 0.519 Fixed 1.16 0.89 1.51 −8.86 − Total* 8 38.8 0.121 Fixed 1.57 1.40 1.76 2.11 0.044 Bladder cancer* 4 40.9 0.166 Fixed 1.52 1.12 2.05 0.76 0.891 Liver cancer* 3 47.6 0.148 Fixed 1.37 1.08 1.73 0.02 0.997 Cervical cancer 2 1.84 1.04 3.28 3.91 2.21 6.92 Acute
Lymphoblastic
Leukemia1 3.32 1.94 5.68 Intracranial
Tumors2 1.78 1.10 2.86 1.91 1.10 3.33 Colon cancer 1 4.87 1.48 16.02 Colorectal cancer 1 1.26 0.83 1.89 Endometrial cancer 1 0.97 0.28 2.42 Stomach cancer 1 1.79 1.09 2.96 Esophageal
Squamous
Cell carcinoma1 2.04 1.14 3.70 Oral cancer 1 2.38 1.47 3.85 Papillary thyroid
Cancer1 3.86 1.47 10.15 Tongue cancer 1 2.69 1.67 4.32 Cancer 1 1.14 0.73 1.79 DCS* 4 52.9 0.095 Random 1.92 1.29 2.85 2.72 0.236 Stroke* 3 61.5 0.074 Random 2.29 1.26 4.16 2.59 0.410 Cardiovascular
Disease1 1.44 0.94 2.21 DRS* 7 87.7 < 0.001 Random 1.76 1.13 2.74 6.70 0.053 Asthma in Children* 6 89.7 < 0.001 Random 1.82 1.07 3.11 6.71 0.085 Small airway
Obstruction1 1.54 1.06 2.22 Other diseases 6 Tuberculosis 2 1.62 0.92 2.85 1.70 1.04 2.80 Legionnaires'
Disease (Children)1 2.10 1.22 3.63 Otitis media (Children) 1 2.24 1.52 3.16 Type 2 diabetes mellitus 1 1.17 1.00 1.37 All causes of mortality 1 1.08 1.00 1.17 Note. For the subgroups of sex and exposure site, some studies contained more than one result, so the number of results included in the subgroup analysis may be more than that of the disease-specific results. DRS: Diseases of the Respiratory System; DCS: Diseases of the Circulatory System. POR: pooled odds ratio; OR: odds ratio; LL: 95% lower limit; UL: 95% upper limit. *The results of meta-analysis. Table 3. The pooled odds ratios or odds ratios for SHS exposure
-
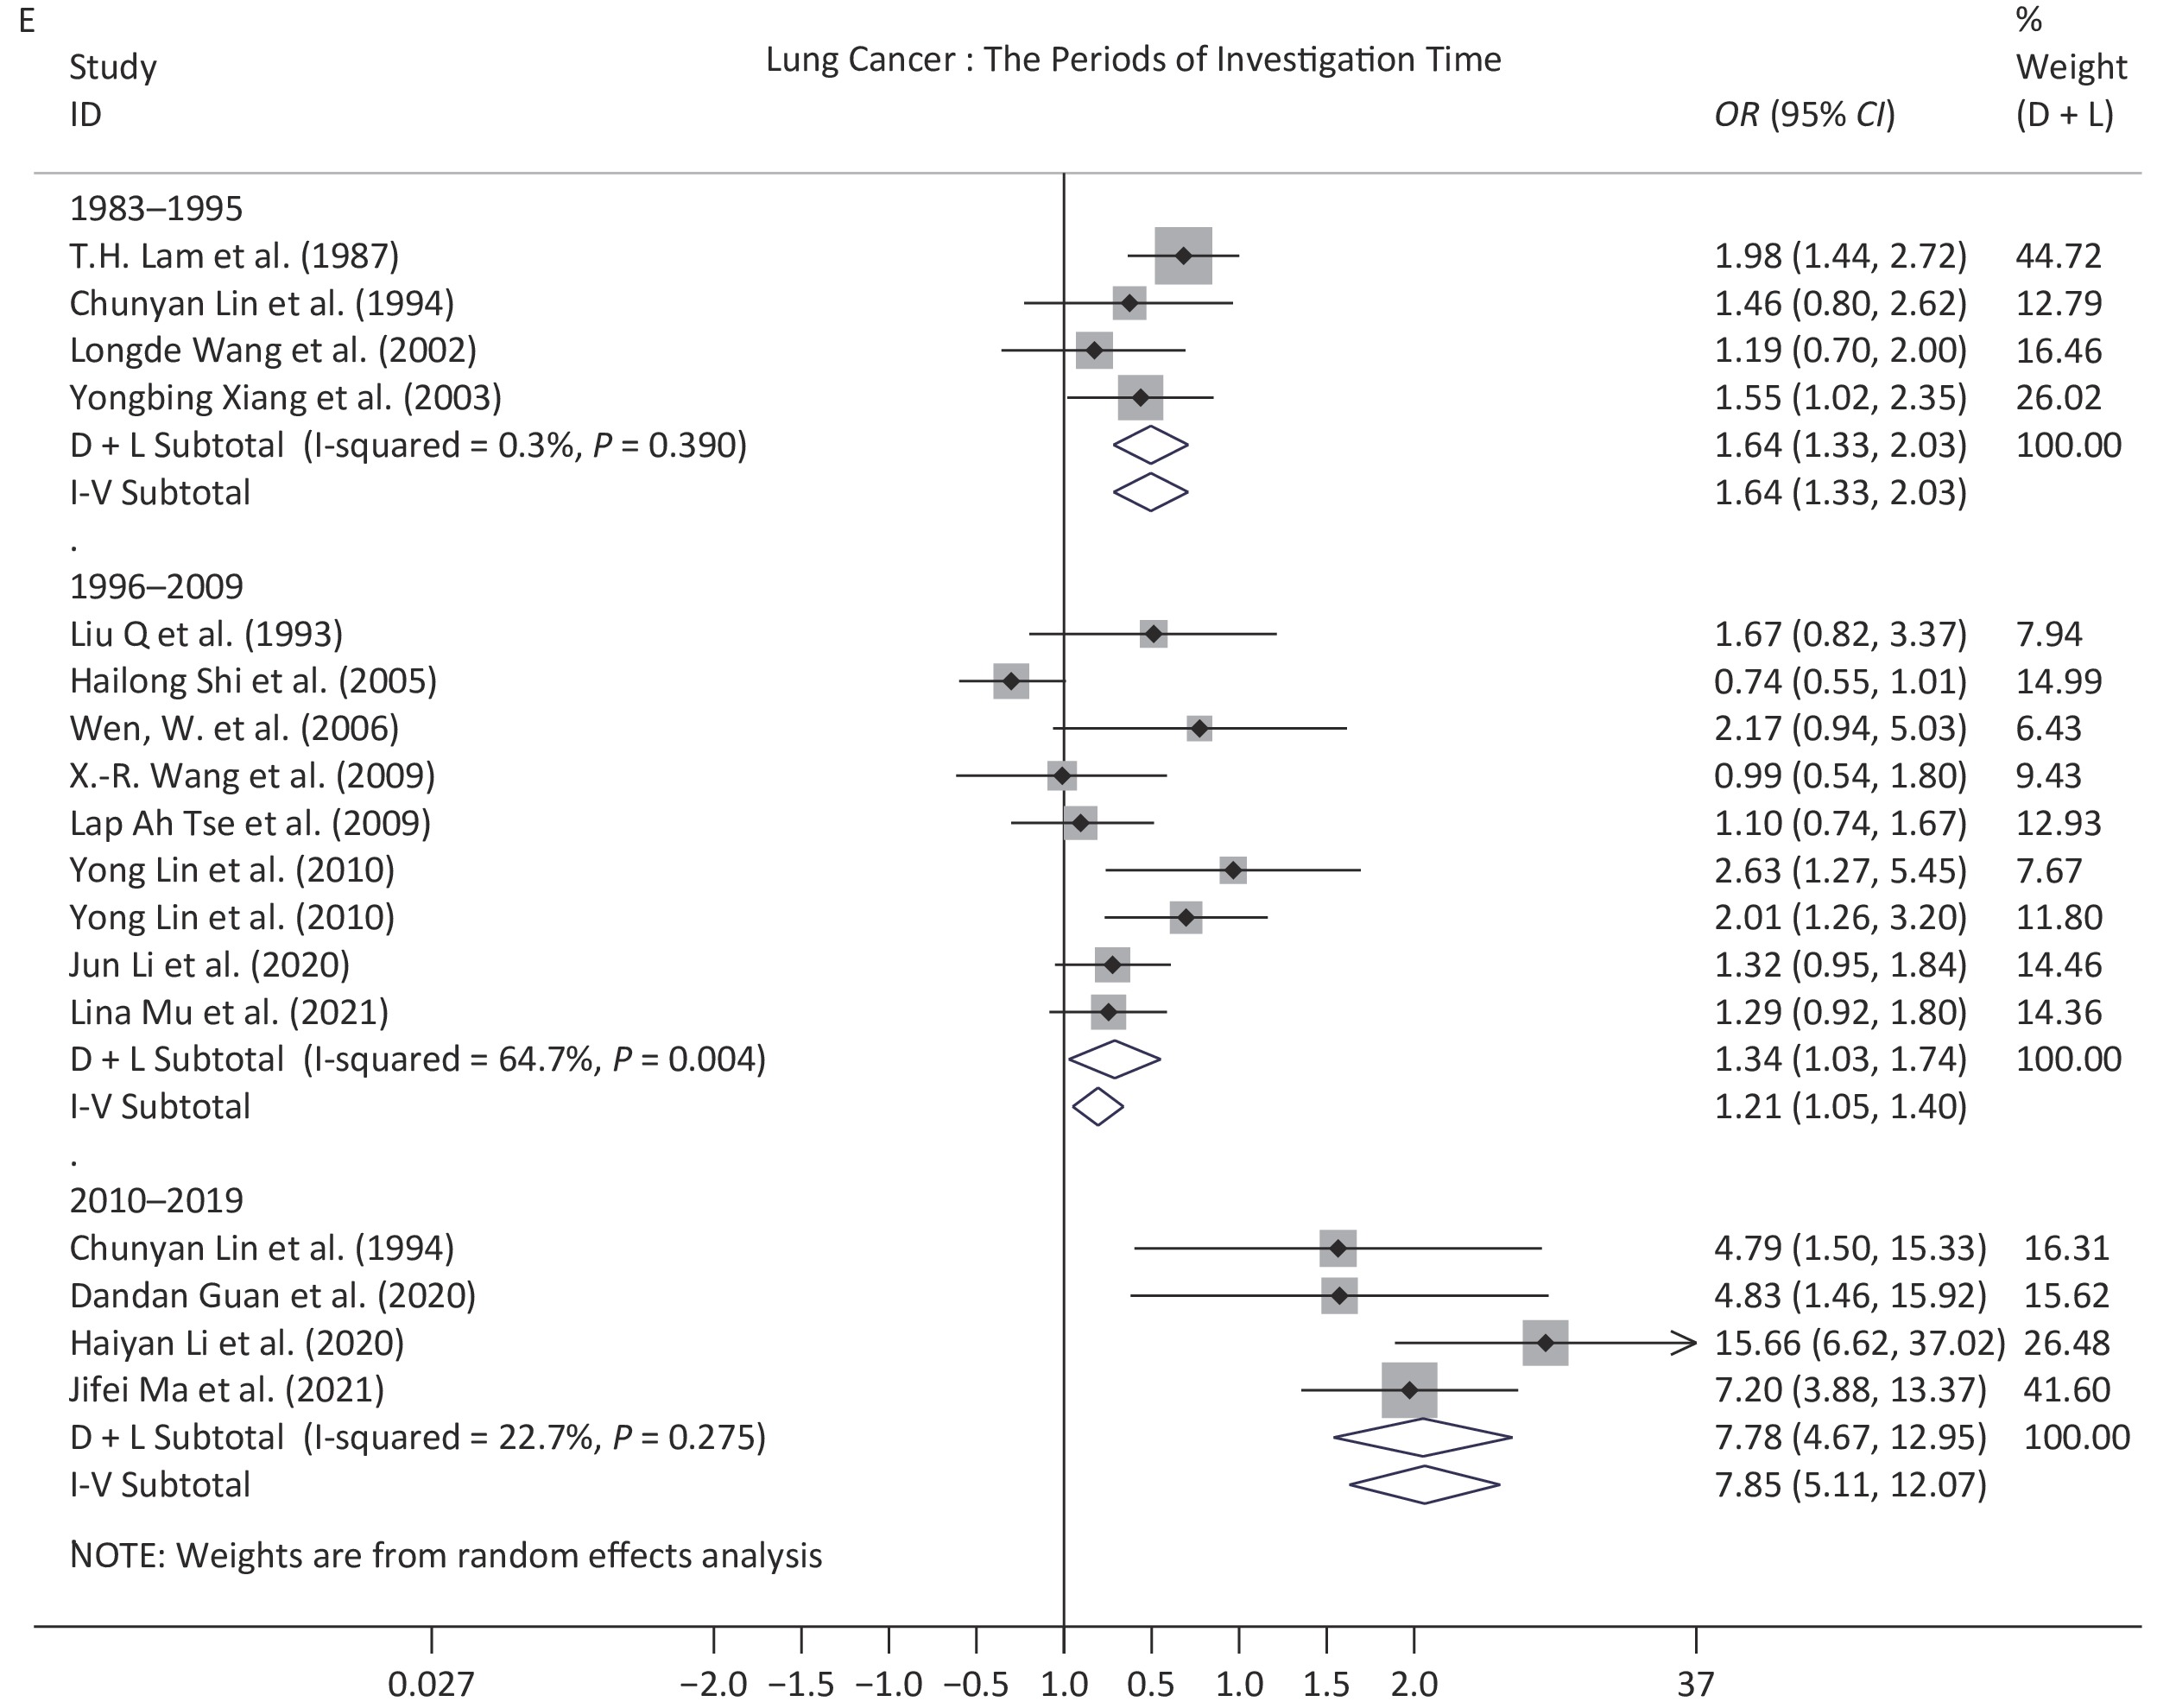
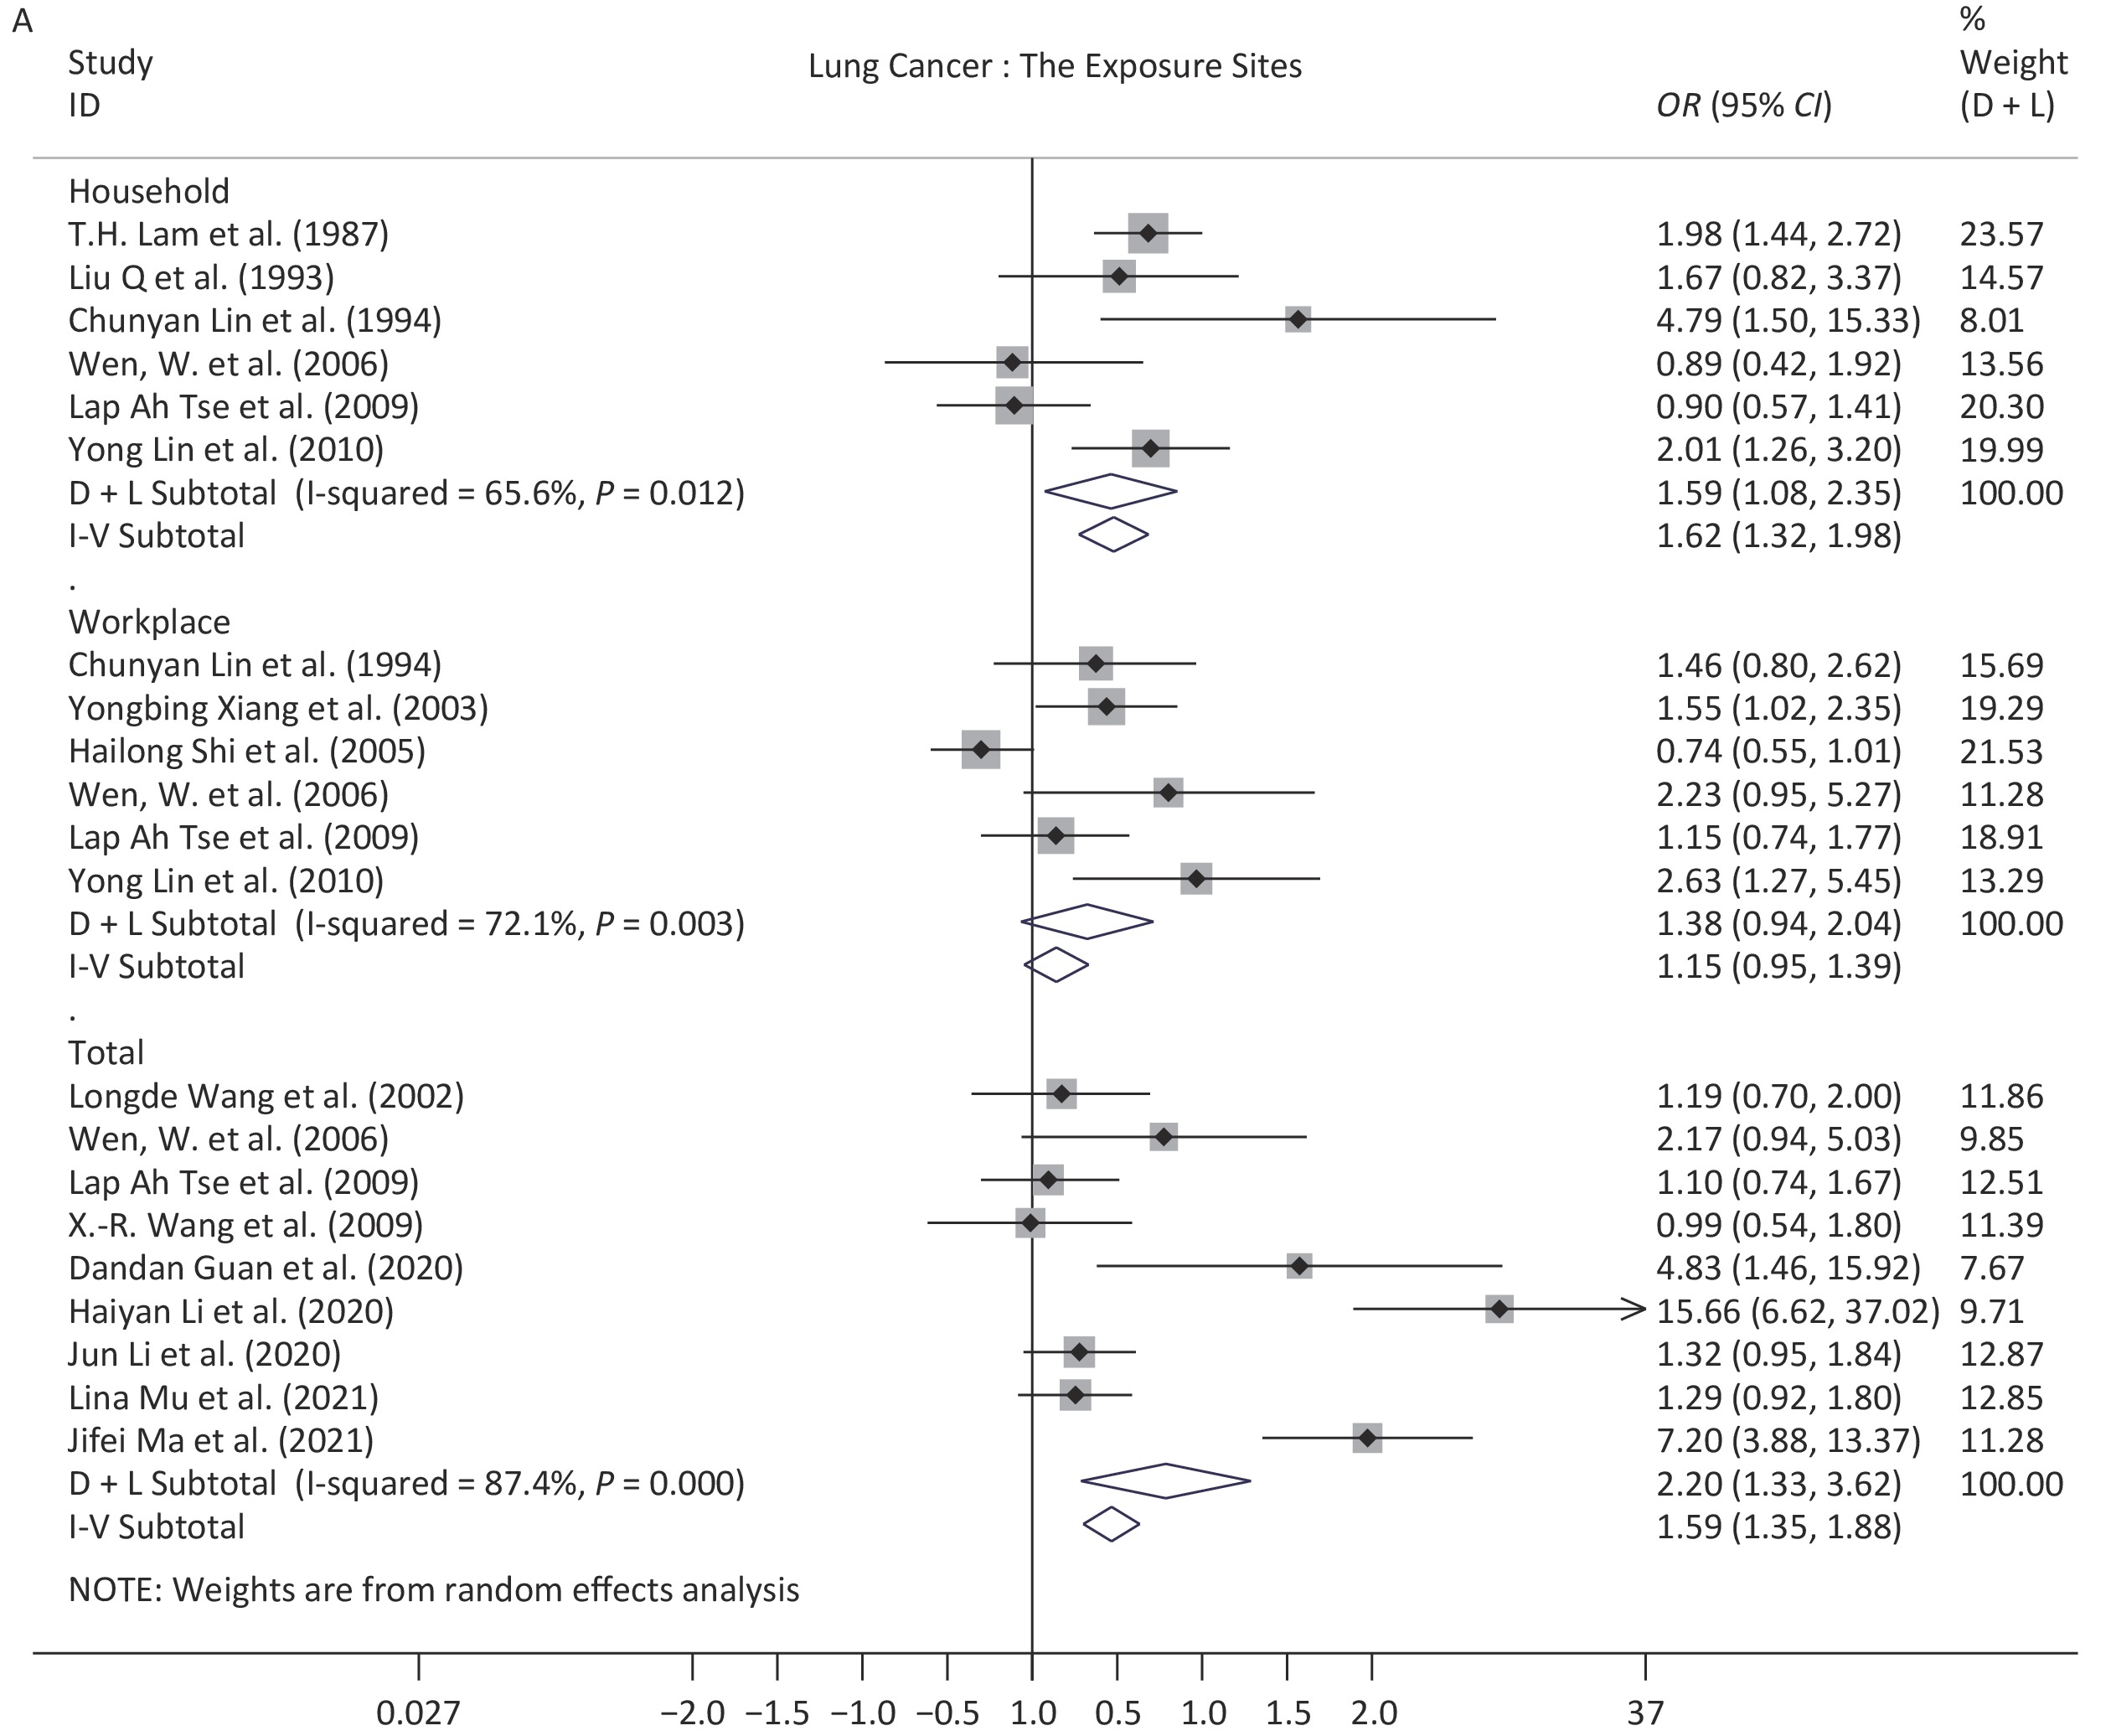
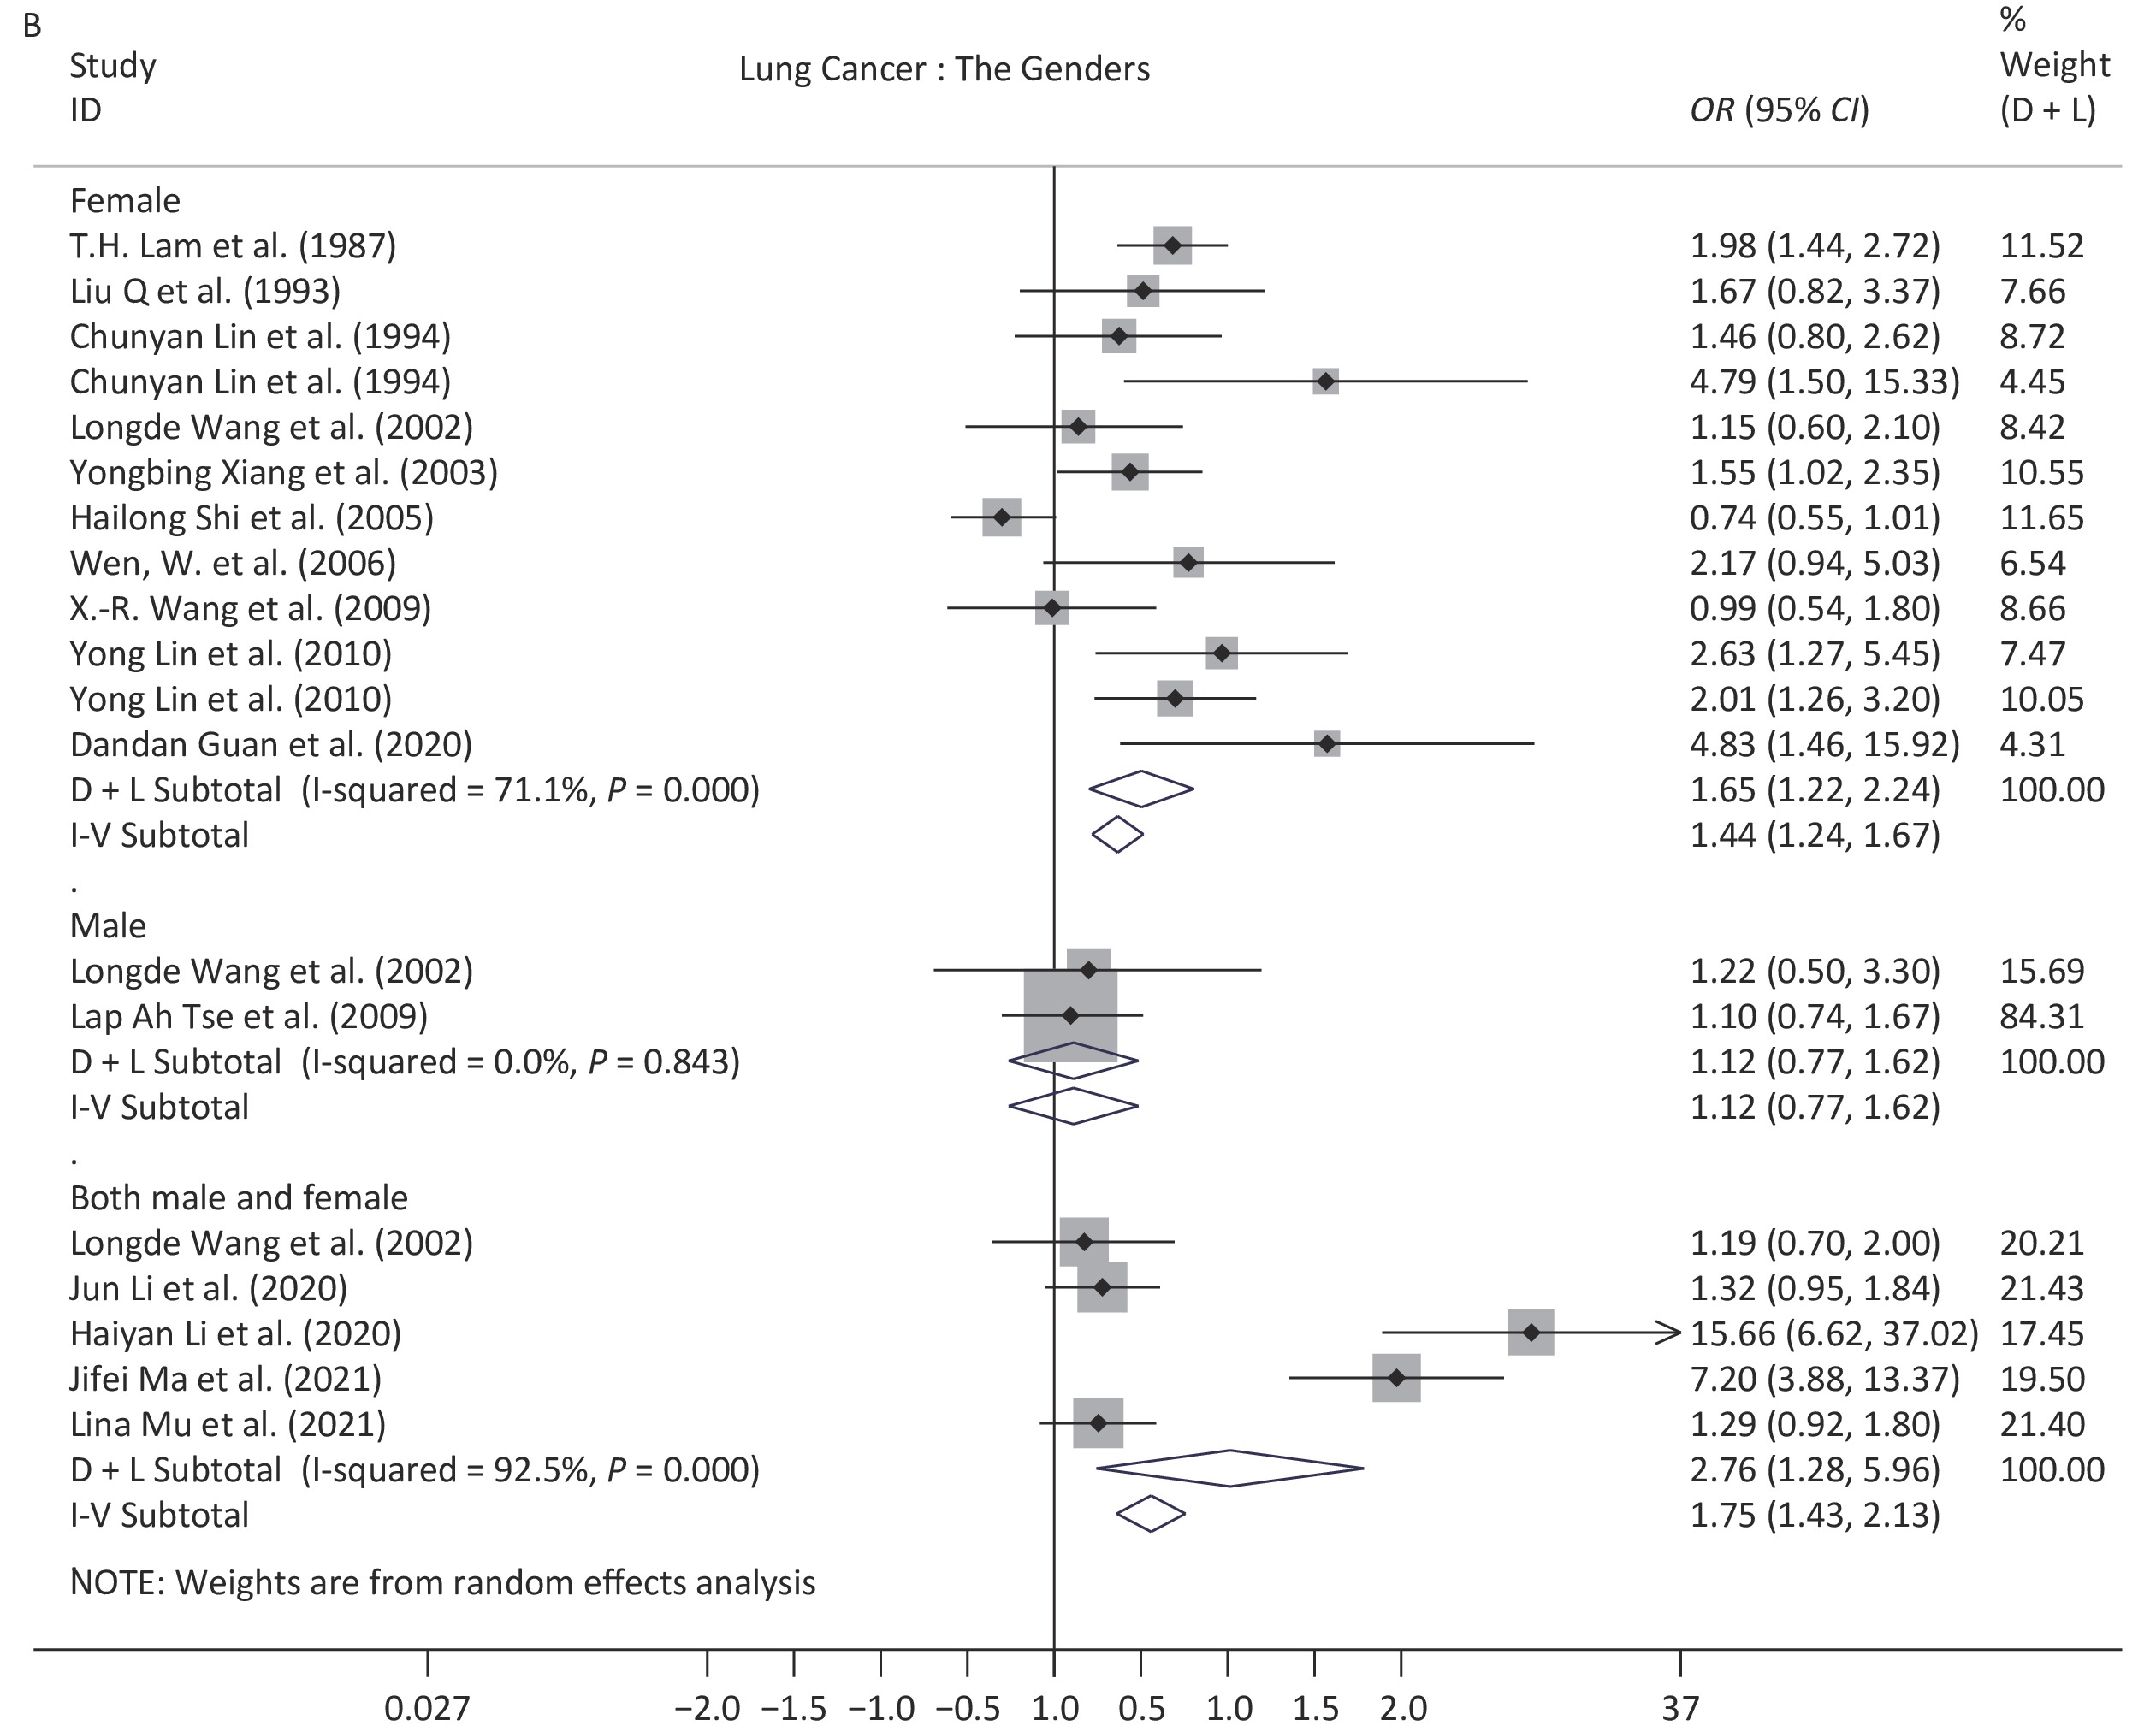
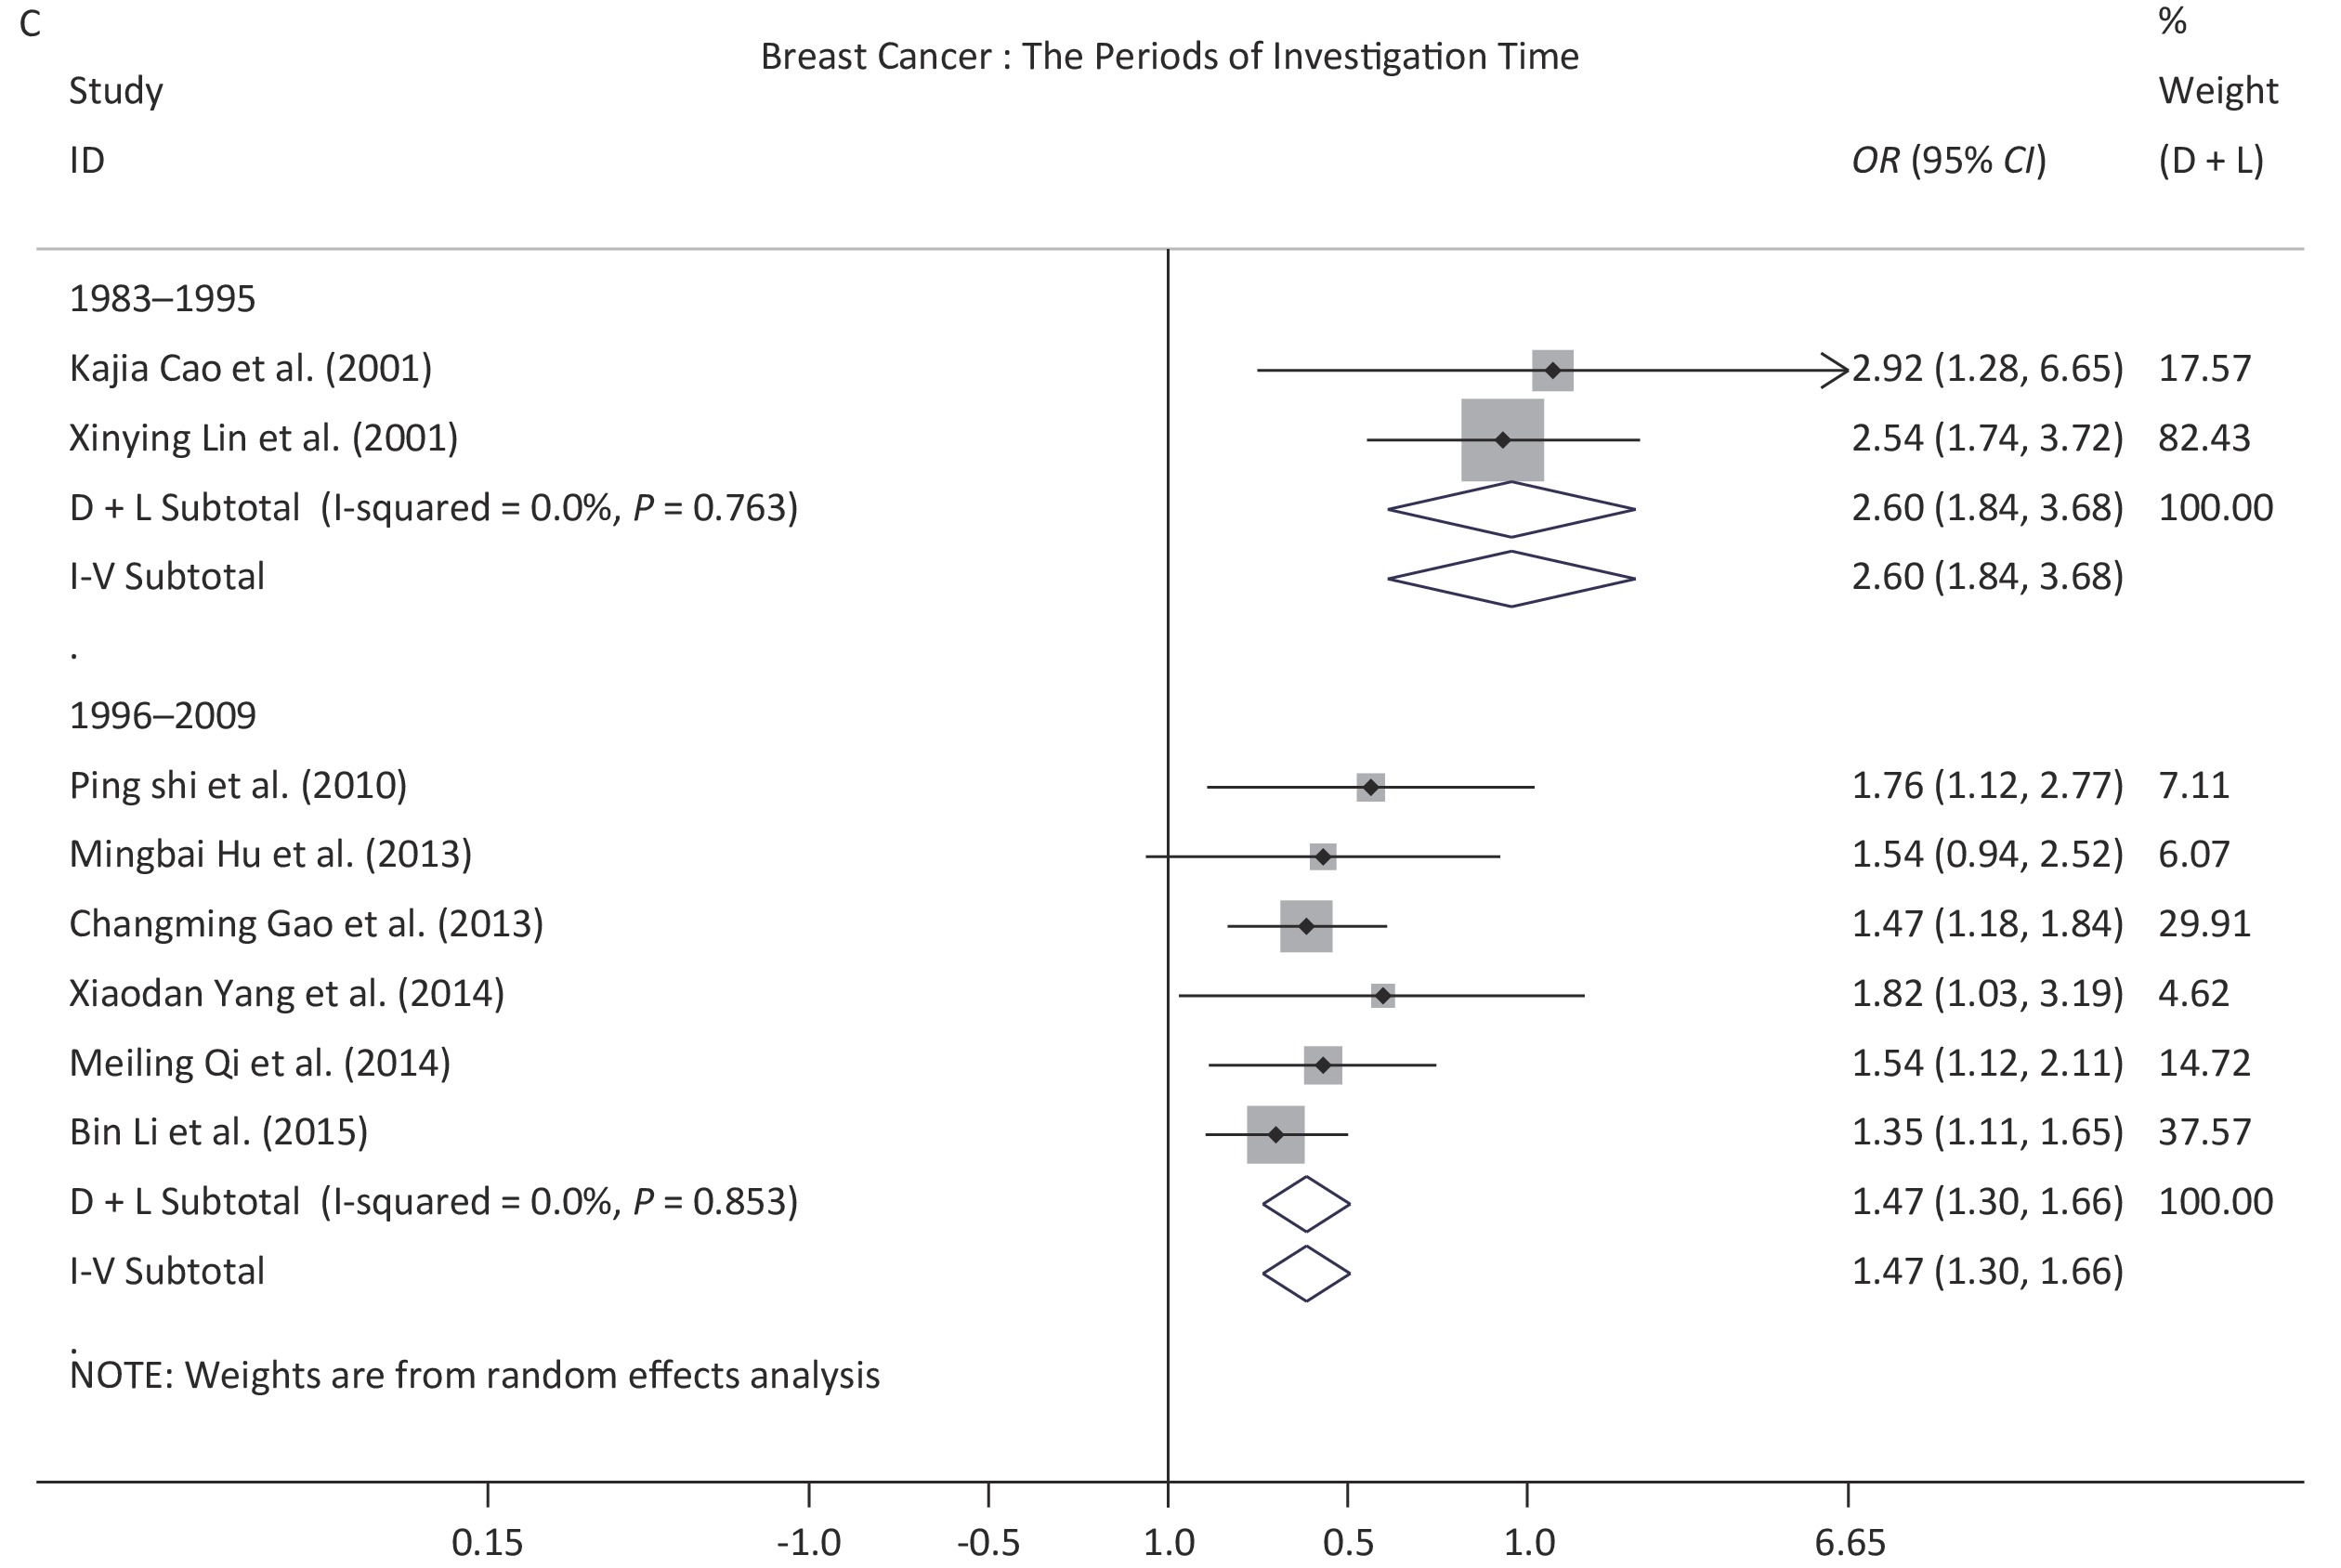
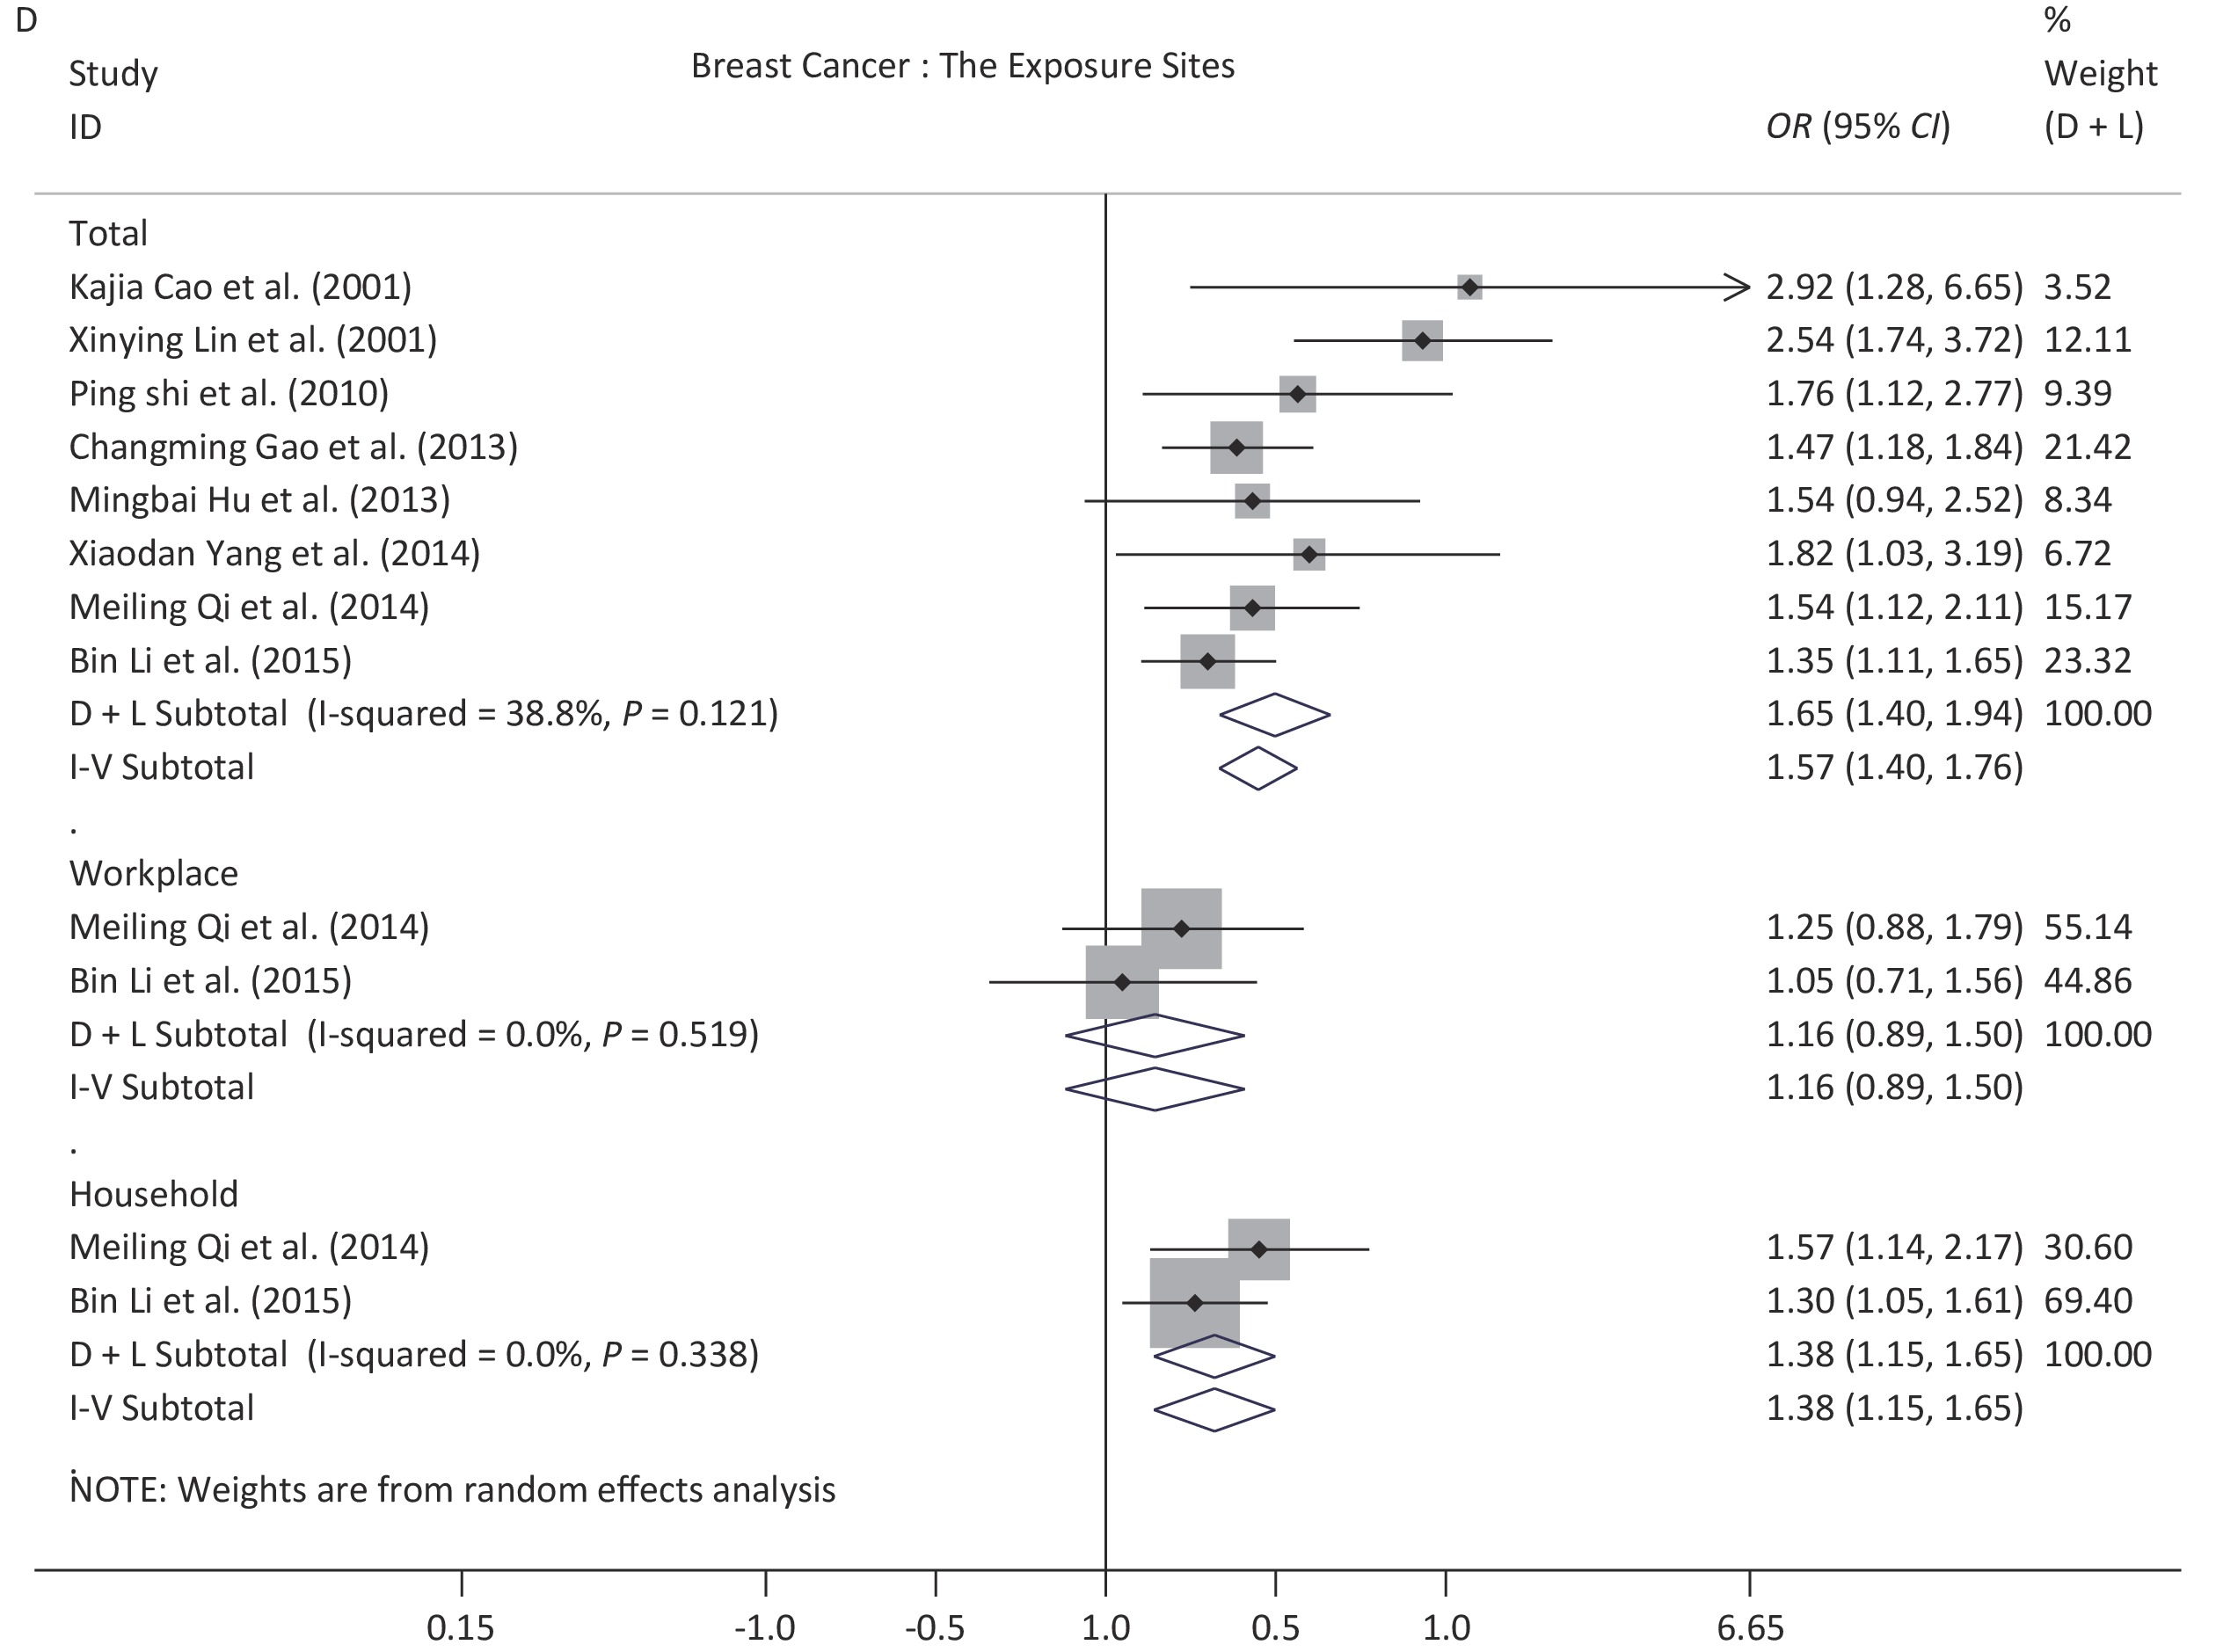
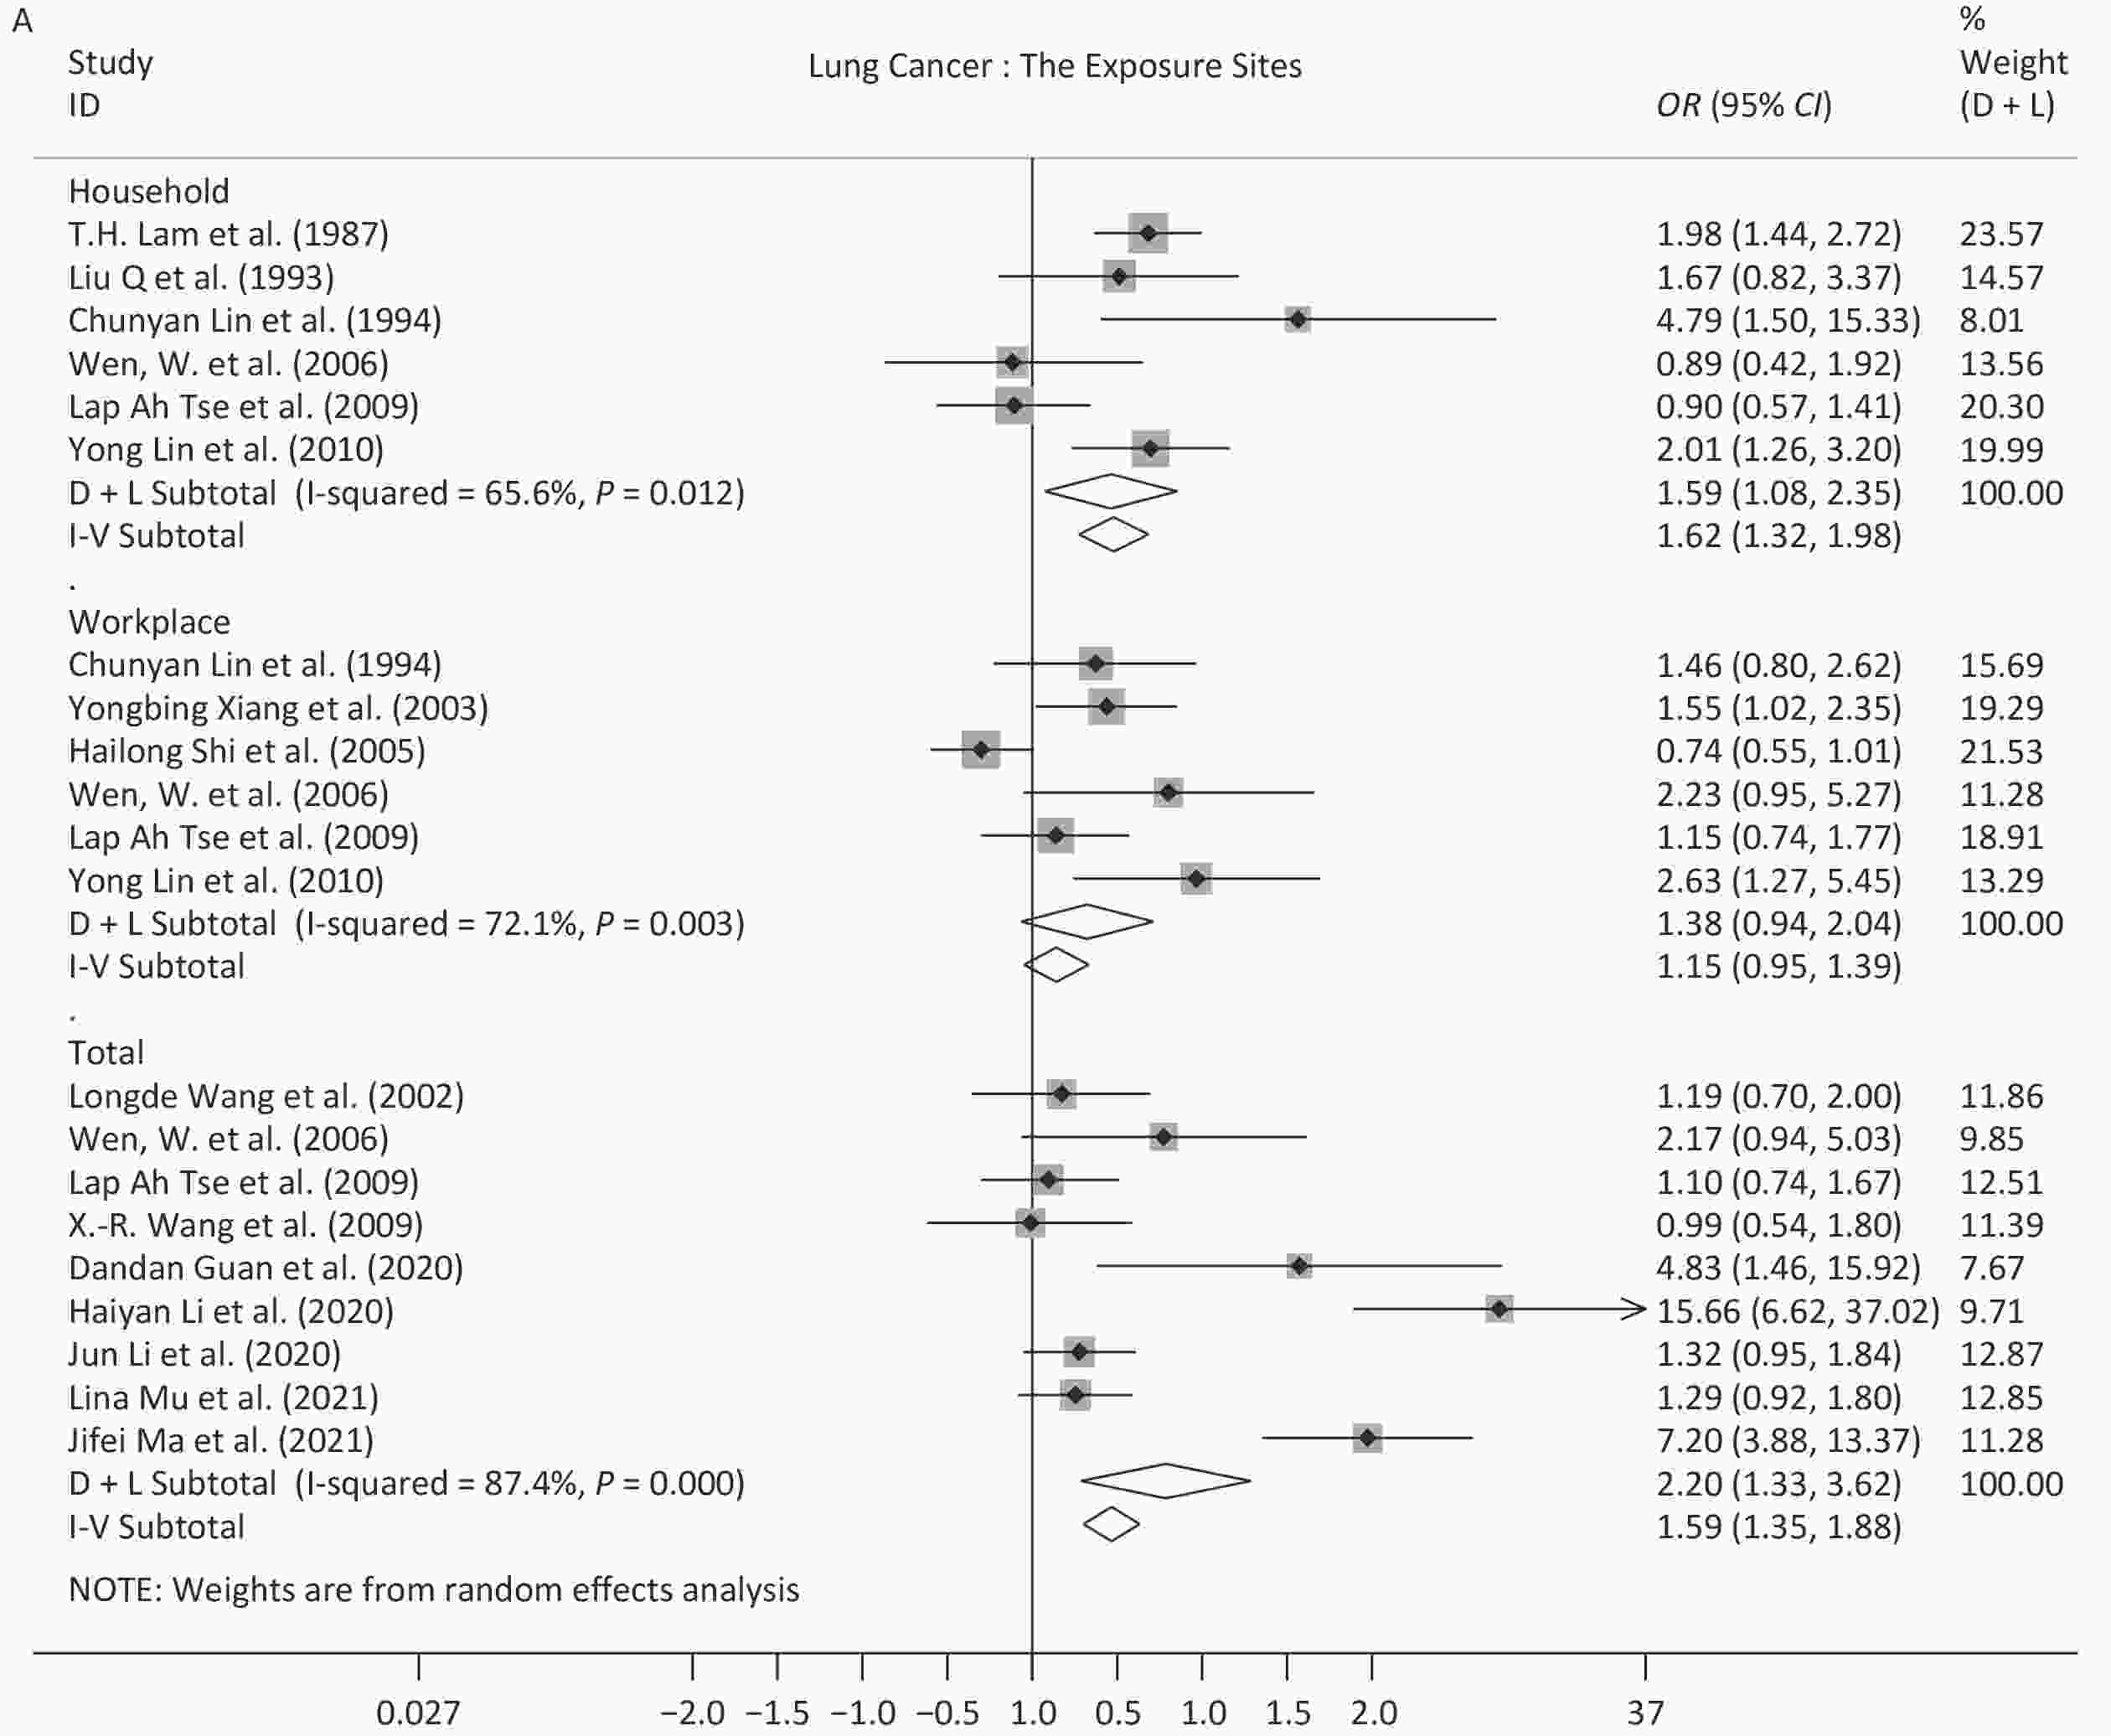
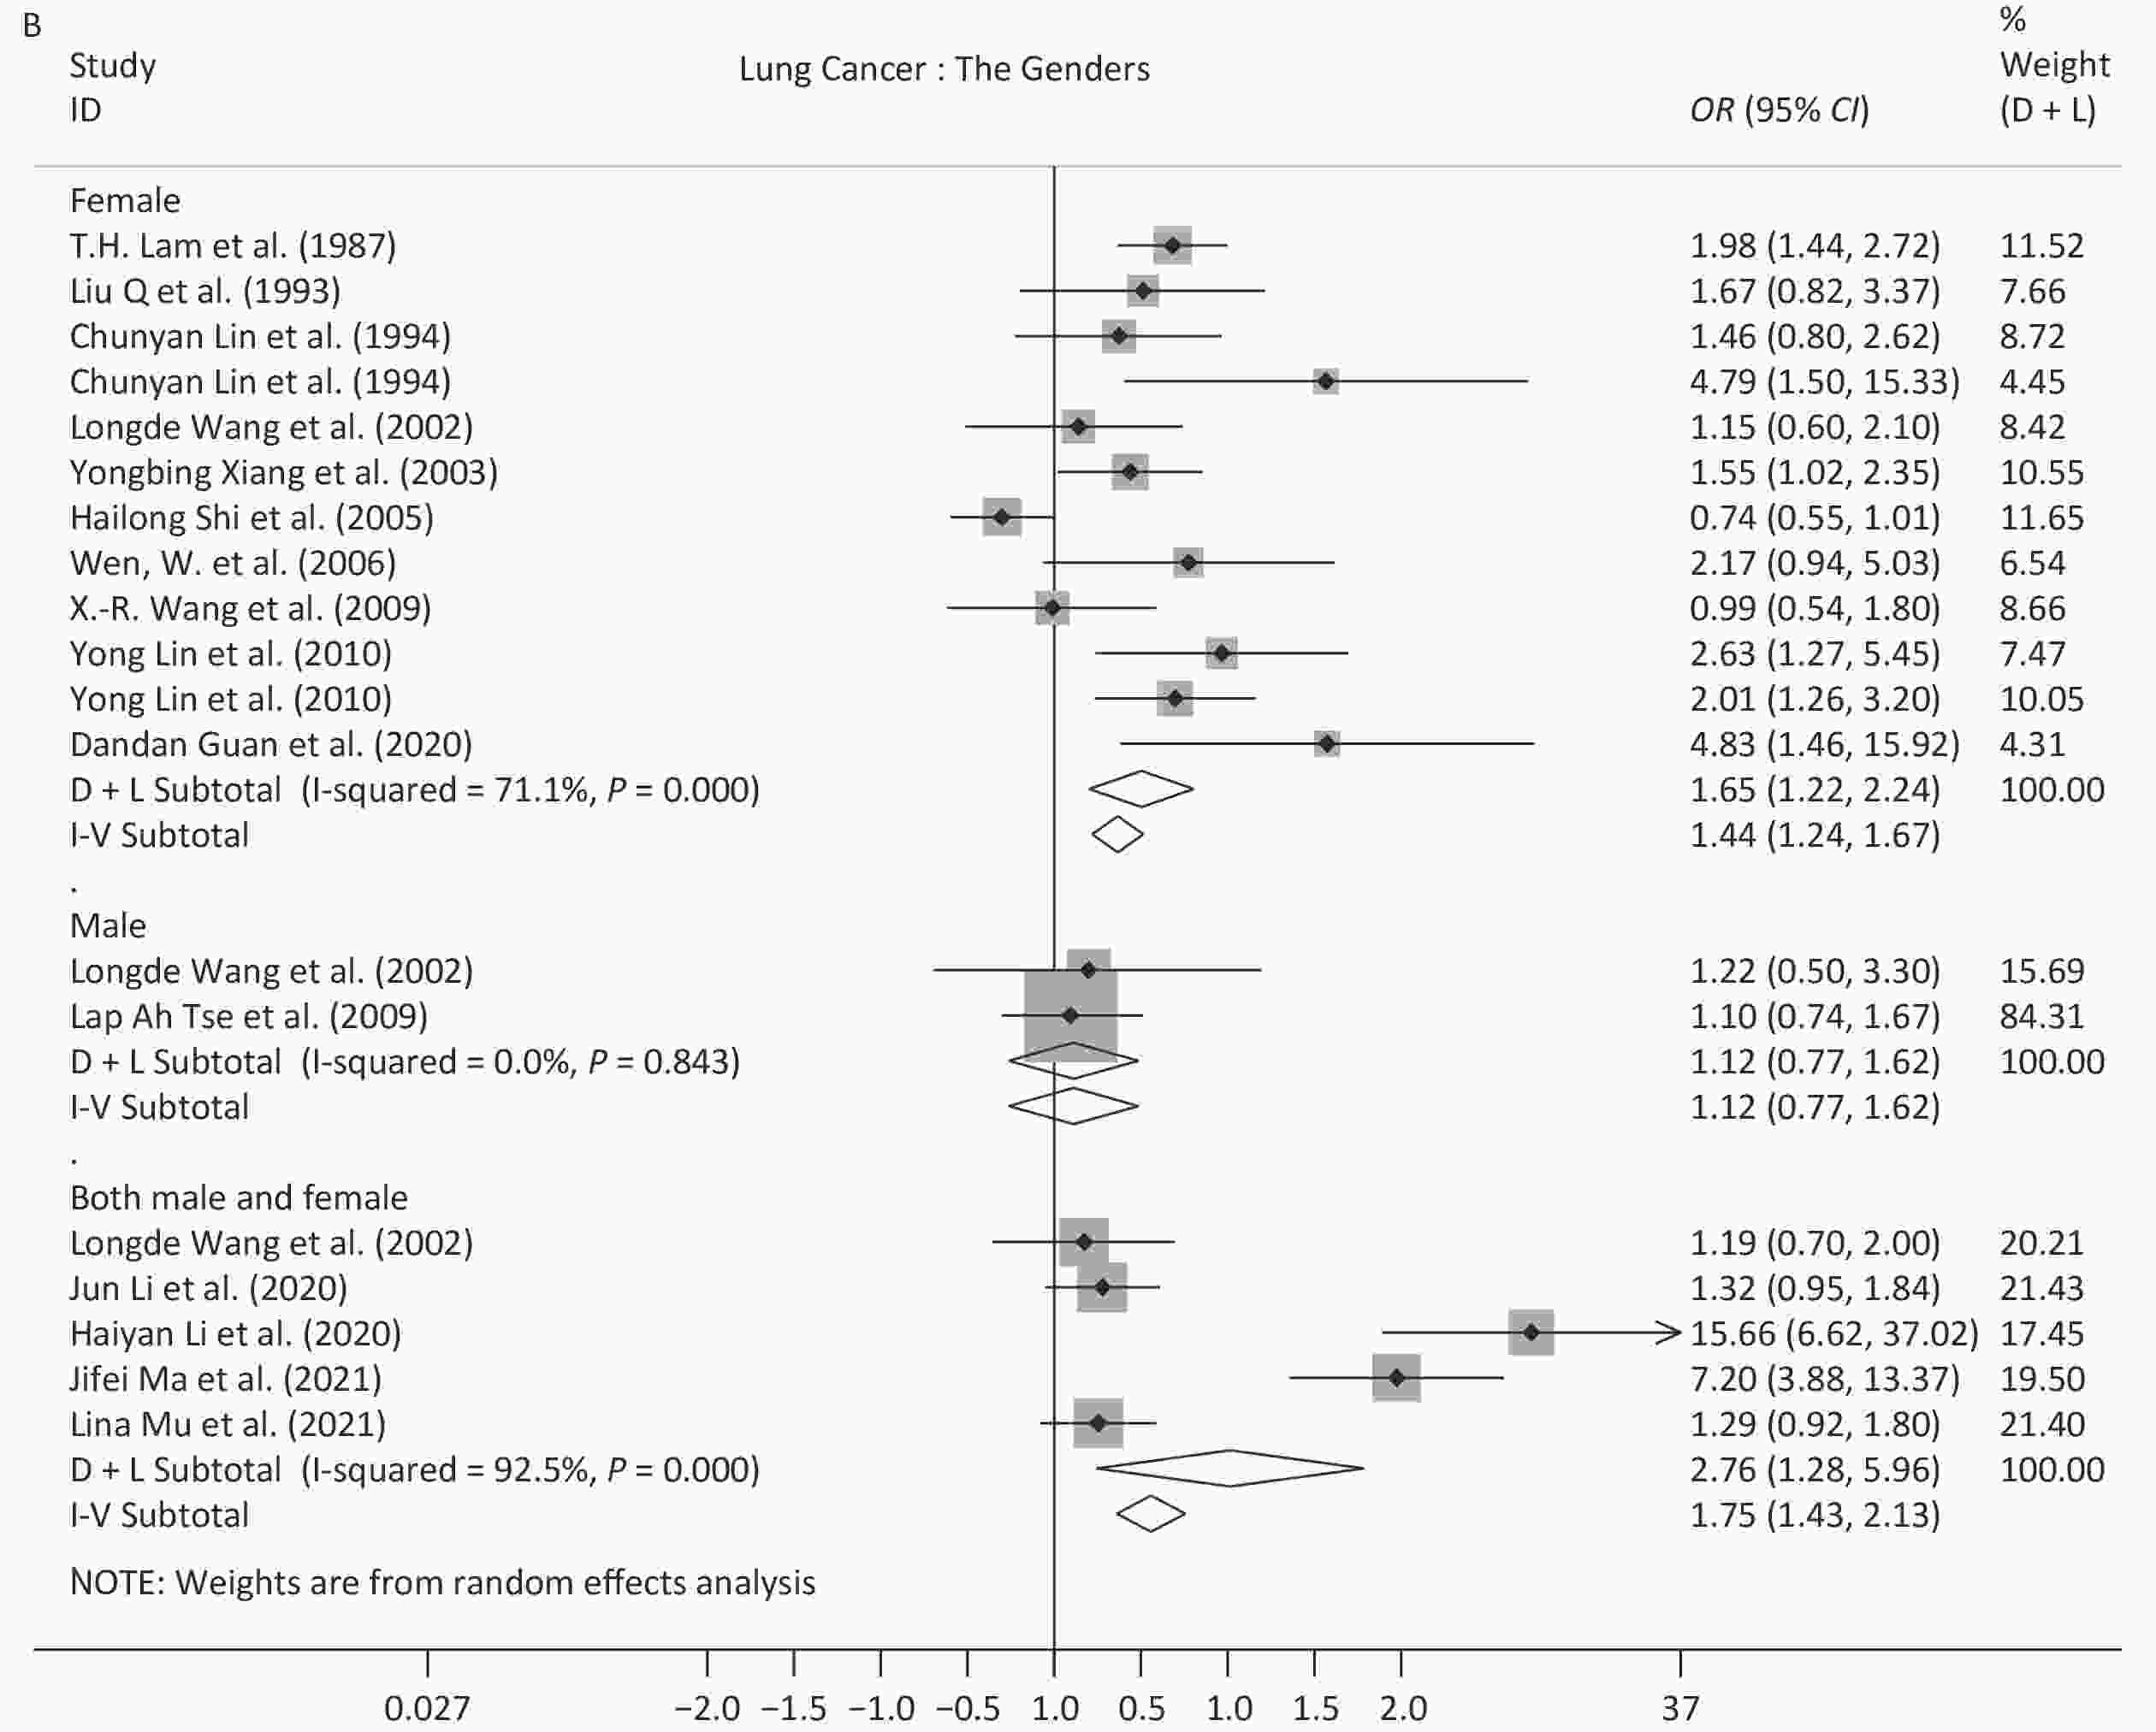
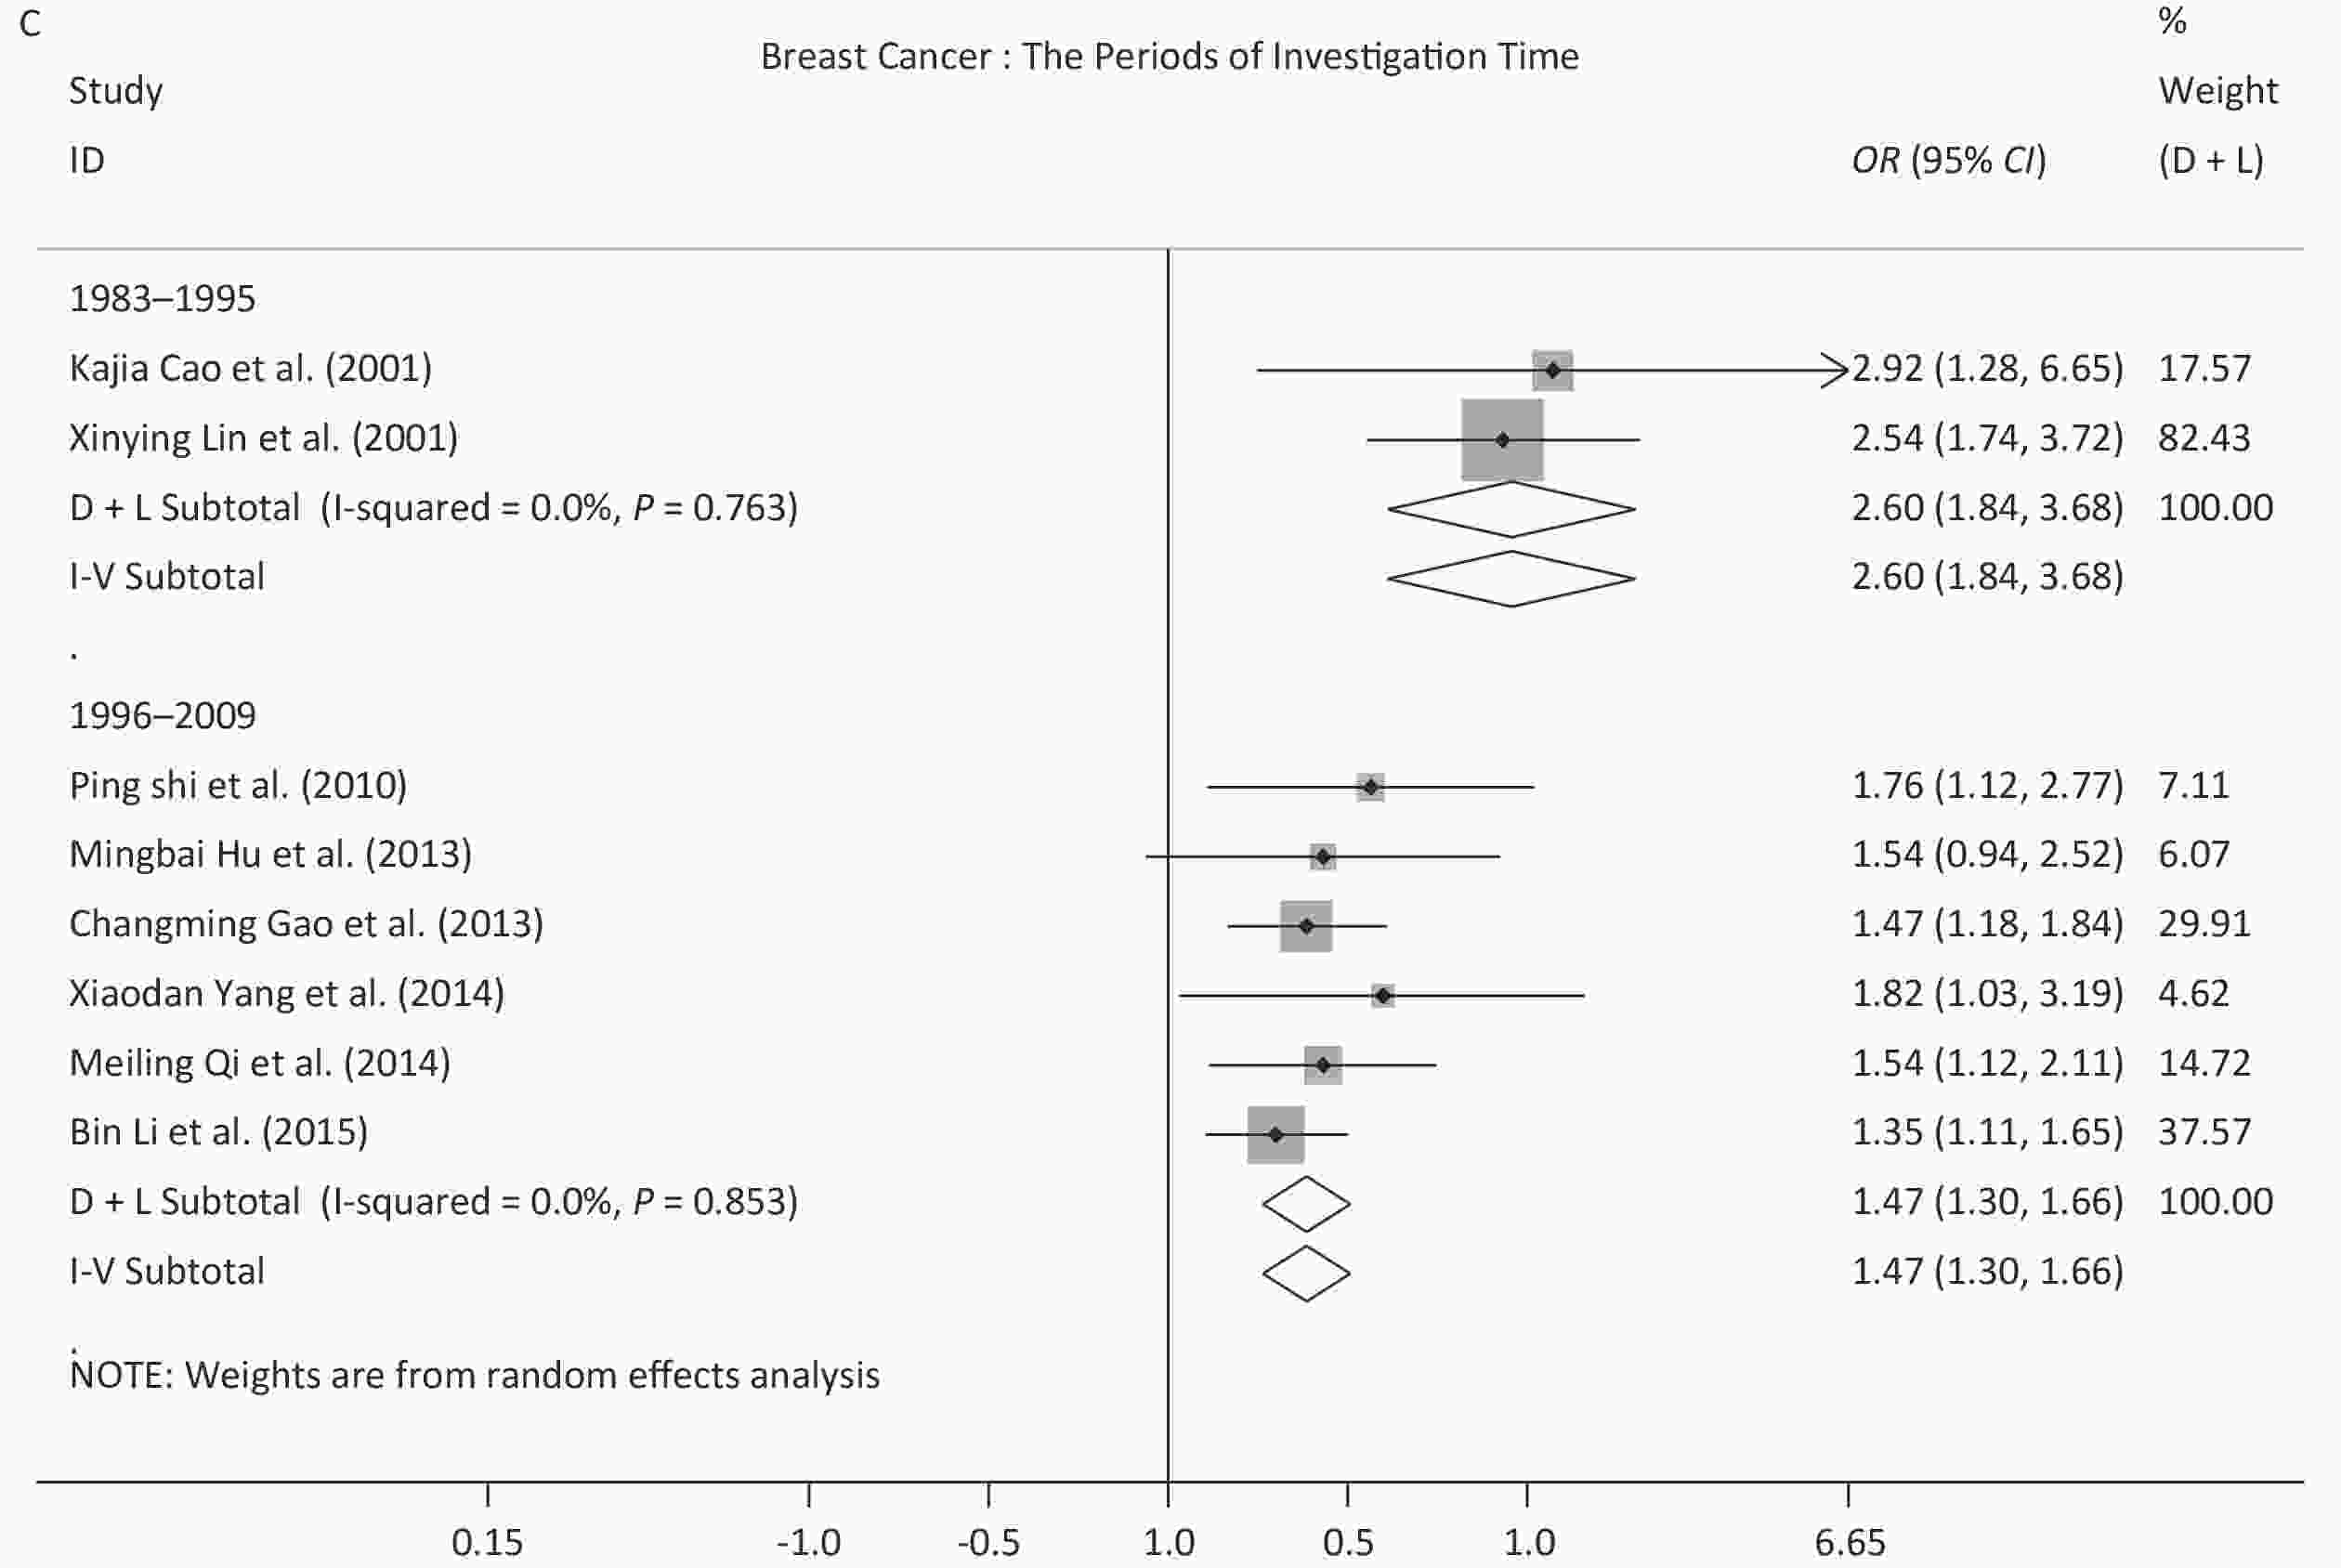
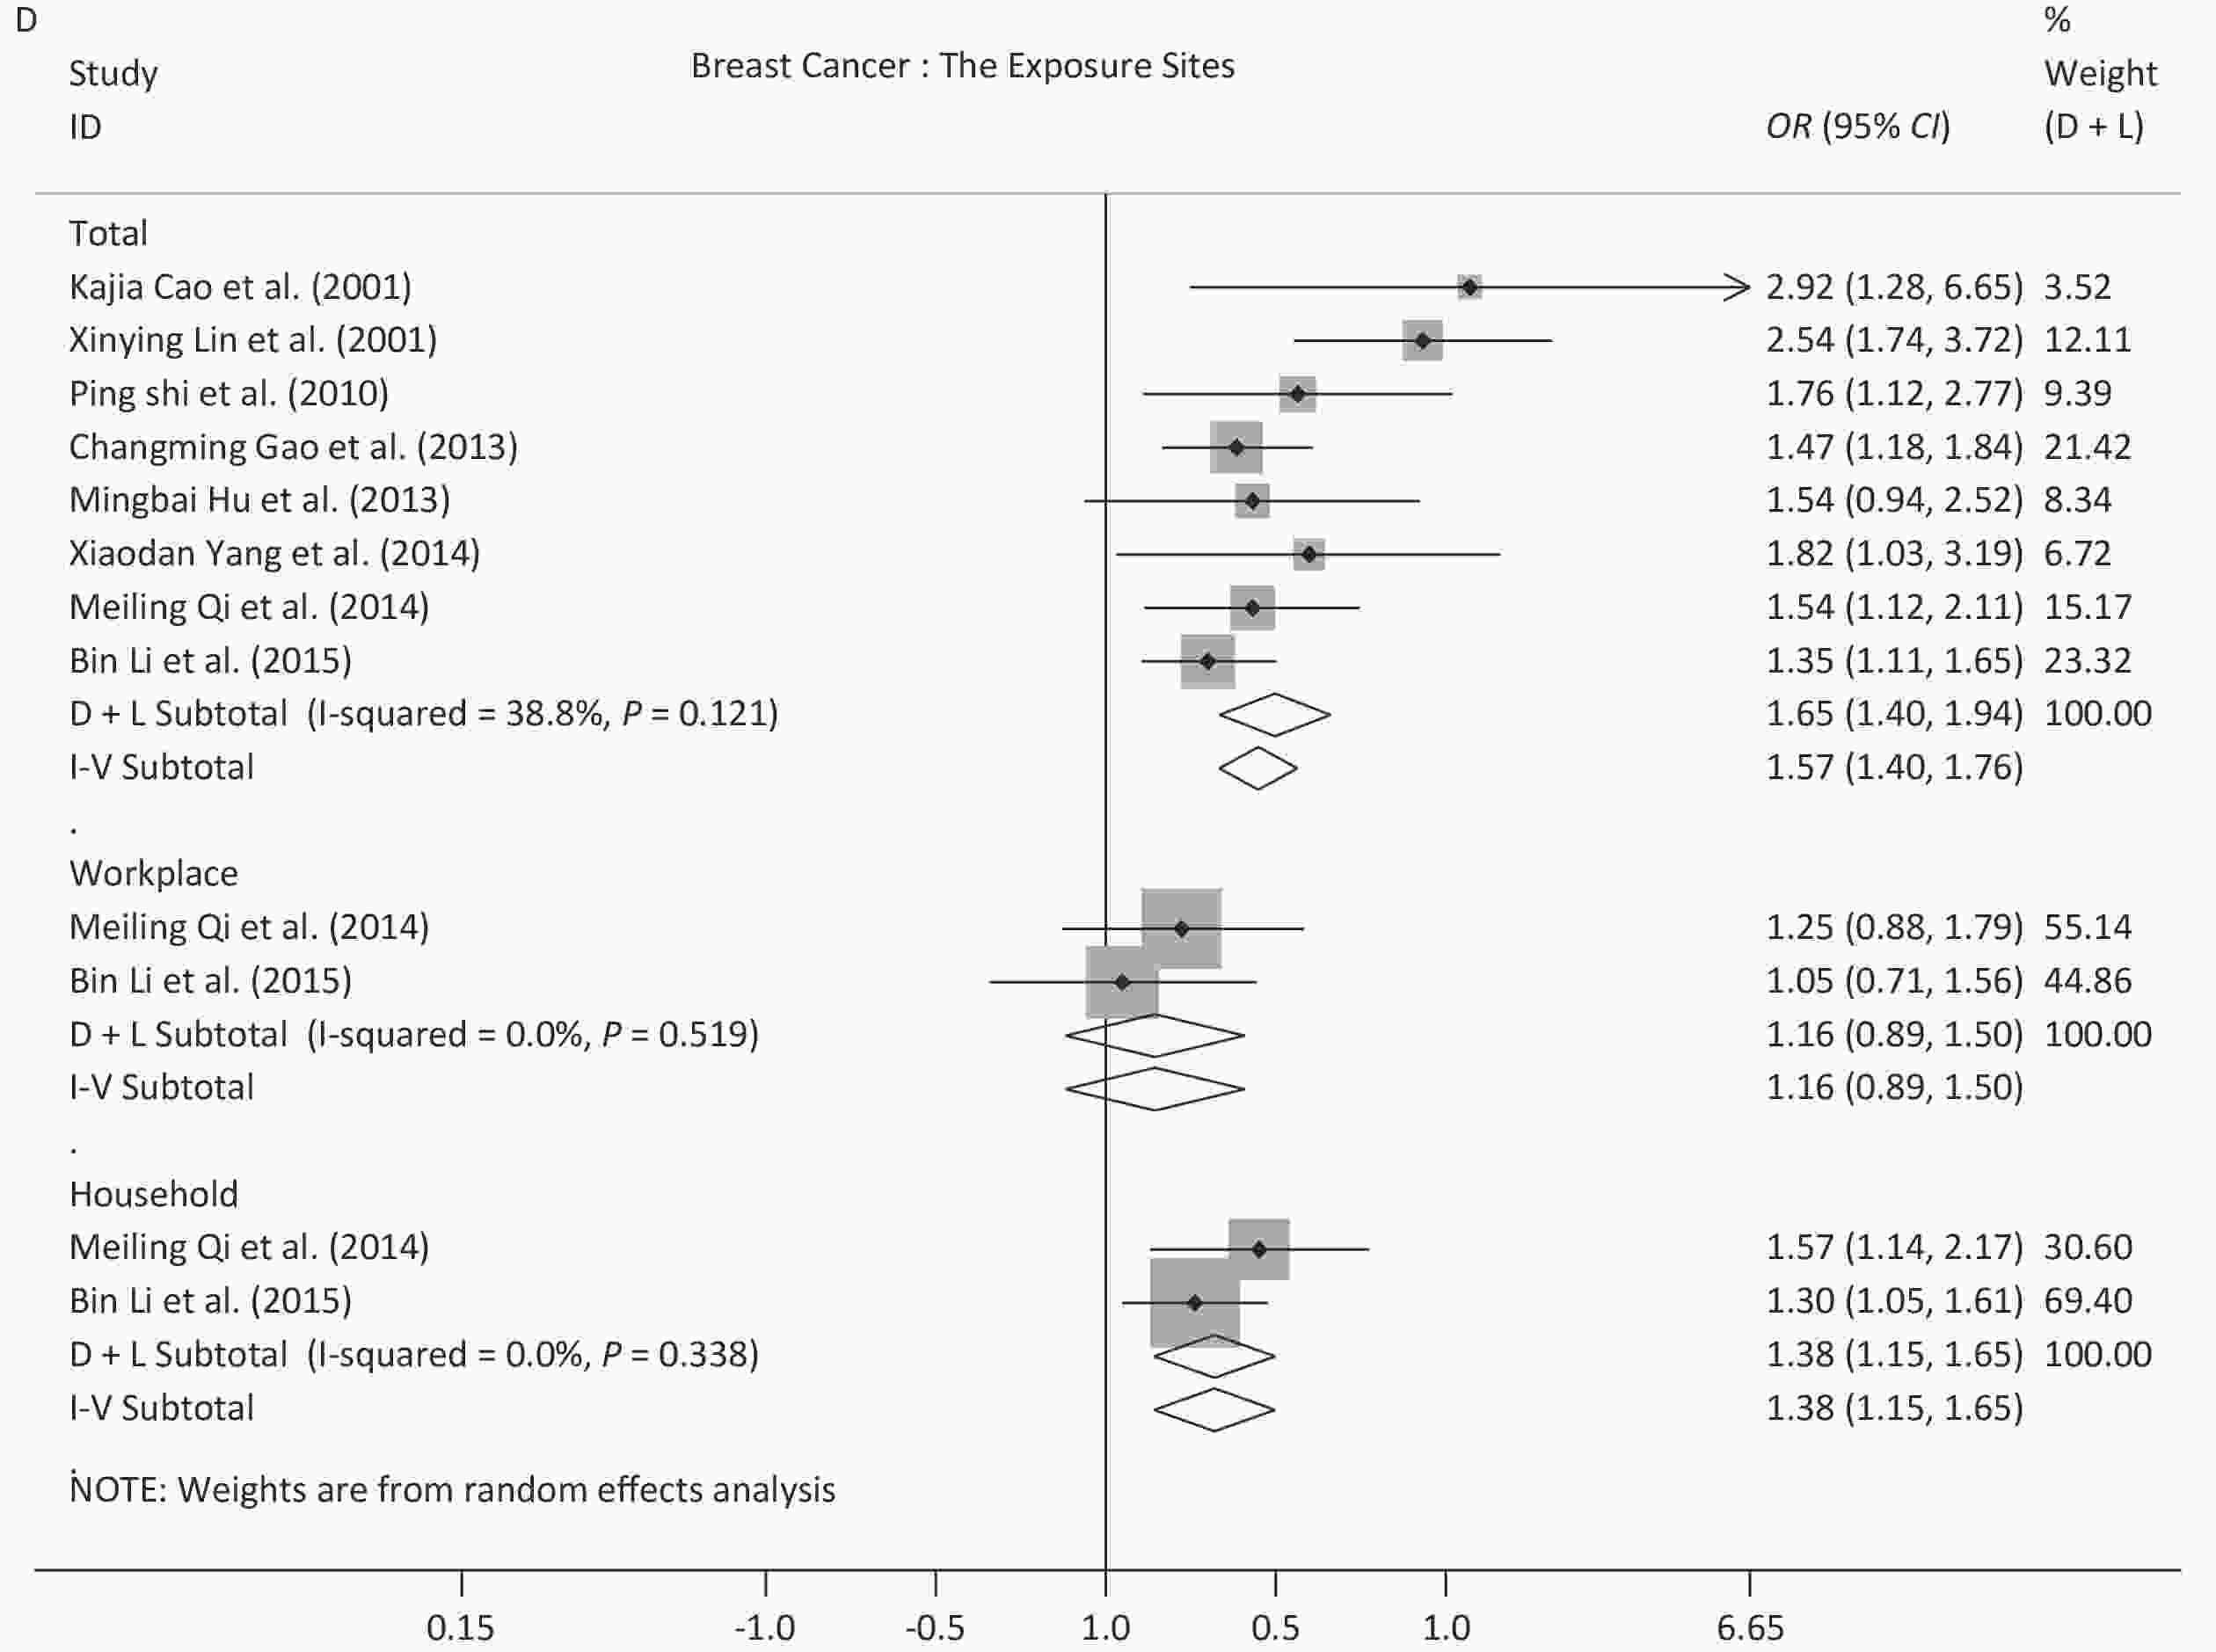
Because of the limited number of studies, subgroup analysis for different time periods, sexes, and exposure sites, were only performed for studies on lung cancer and breast cancer. Regarding the different time periods, the OR for lung cancer peaked in 2010–2019 (7.85, 95% CI: 5.11–12.07), and this value was significantly different from the values derived from the other two time periods, 1.64 (95% CI: 1.33–2.03) for 1983–1995 and 1.34 (95% CI: 1.03–1.74) for 1996–2009. For breast cancer, all of the studies were published before 2009, and the OR decreased from 2.60 (95% CI: 1.84–3.68) in 1983–1995 to 1.47 (95% CI: 1.30–1.66) in 1996–2009, which showed a significant difference. Regarding sex, exposure to SHS increased the risk of lung cancer in women (OR = 1.65, 95% CI: 1.22–2.24) and in both sexes (OR = 2.76, 95% CI: 1.28–5.96), but not in men (OR = 1.12, 95% CI: 0.77–1.63). Regarding exposure site, the ORs (1.38–2.20) showed a statistically significant difference for non-specified sites or households for the two diseases analyzed. While the ORs for the workplace were 1.38 (95% CI: 0.94–2.04) for lung cancer and 1.16 (95% CI: 0.89–1.51) for breast cancer. Further details are provided in Table 3 and the forest plots are shown in Supplementary Figure S1, available in www.besjournal.com.
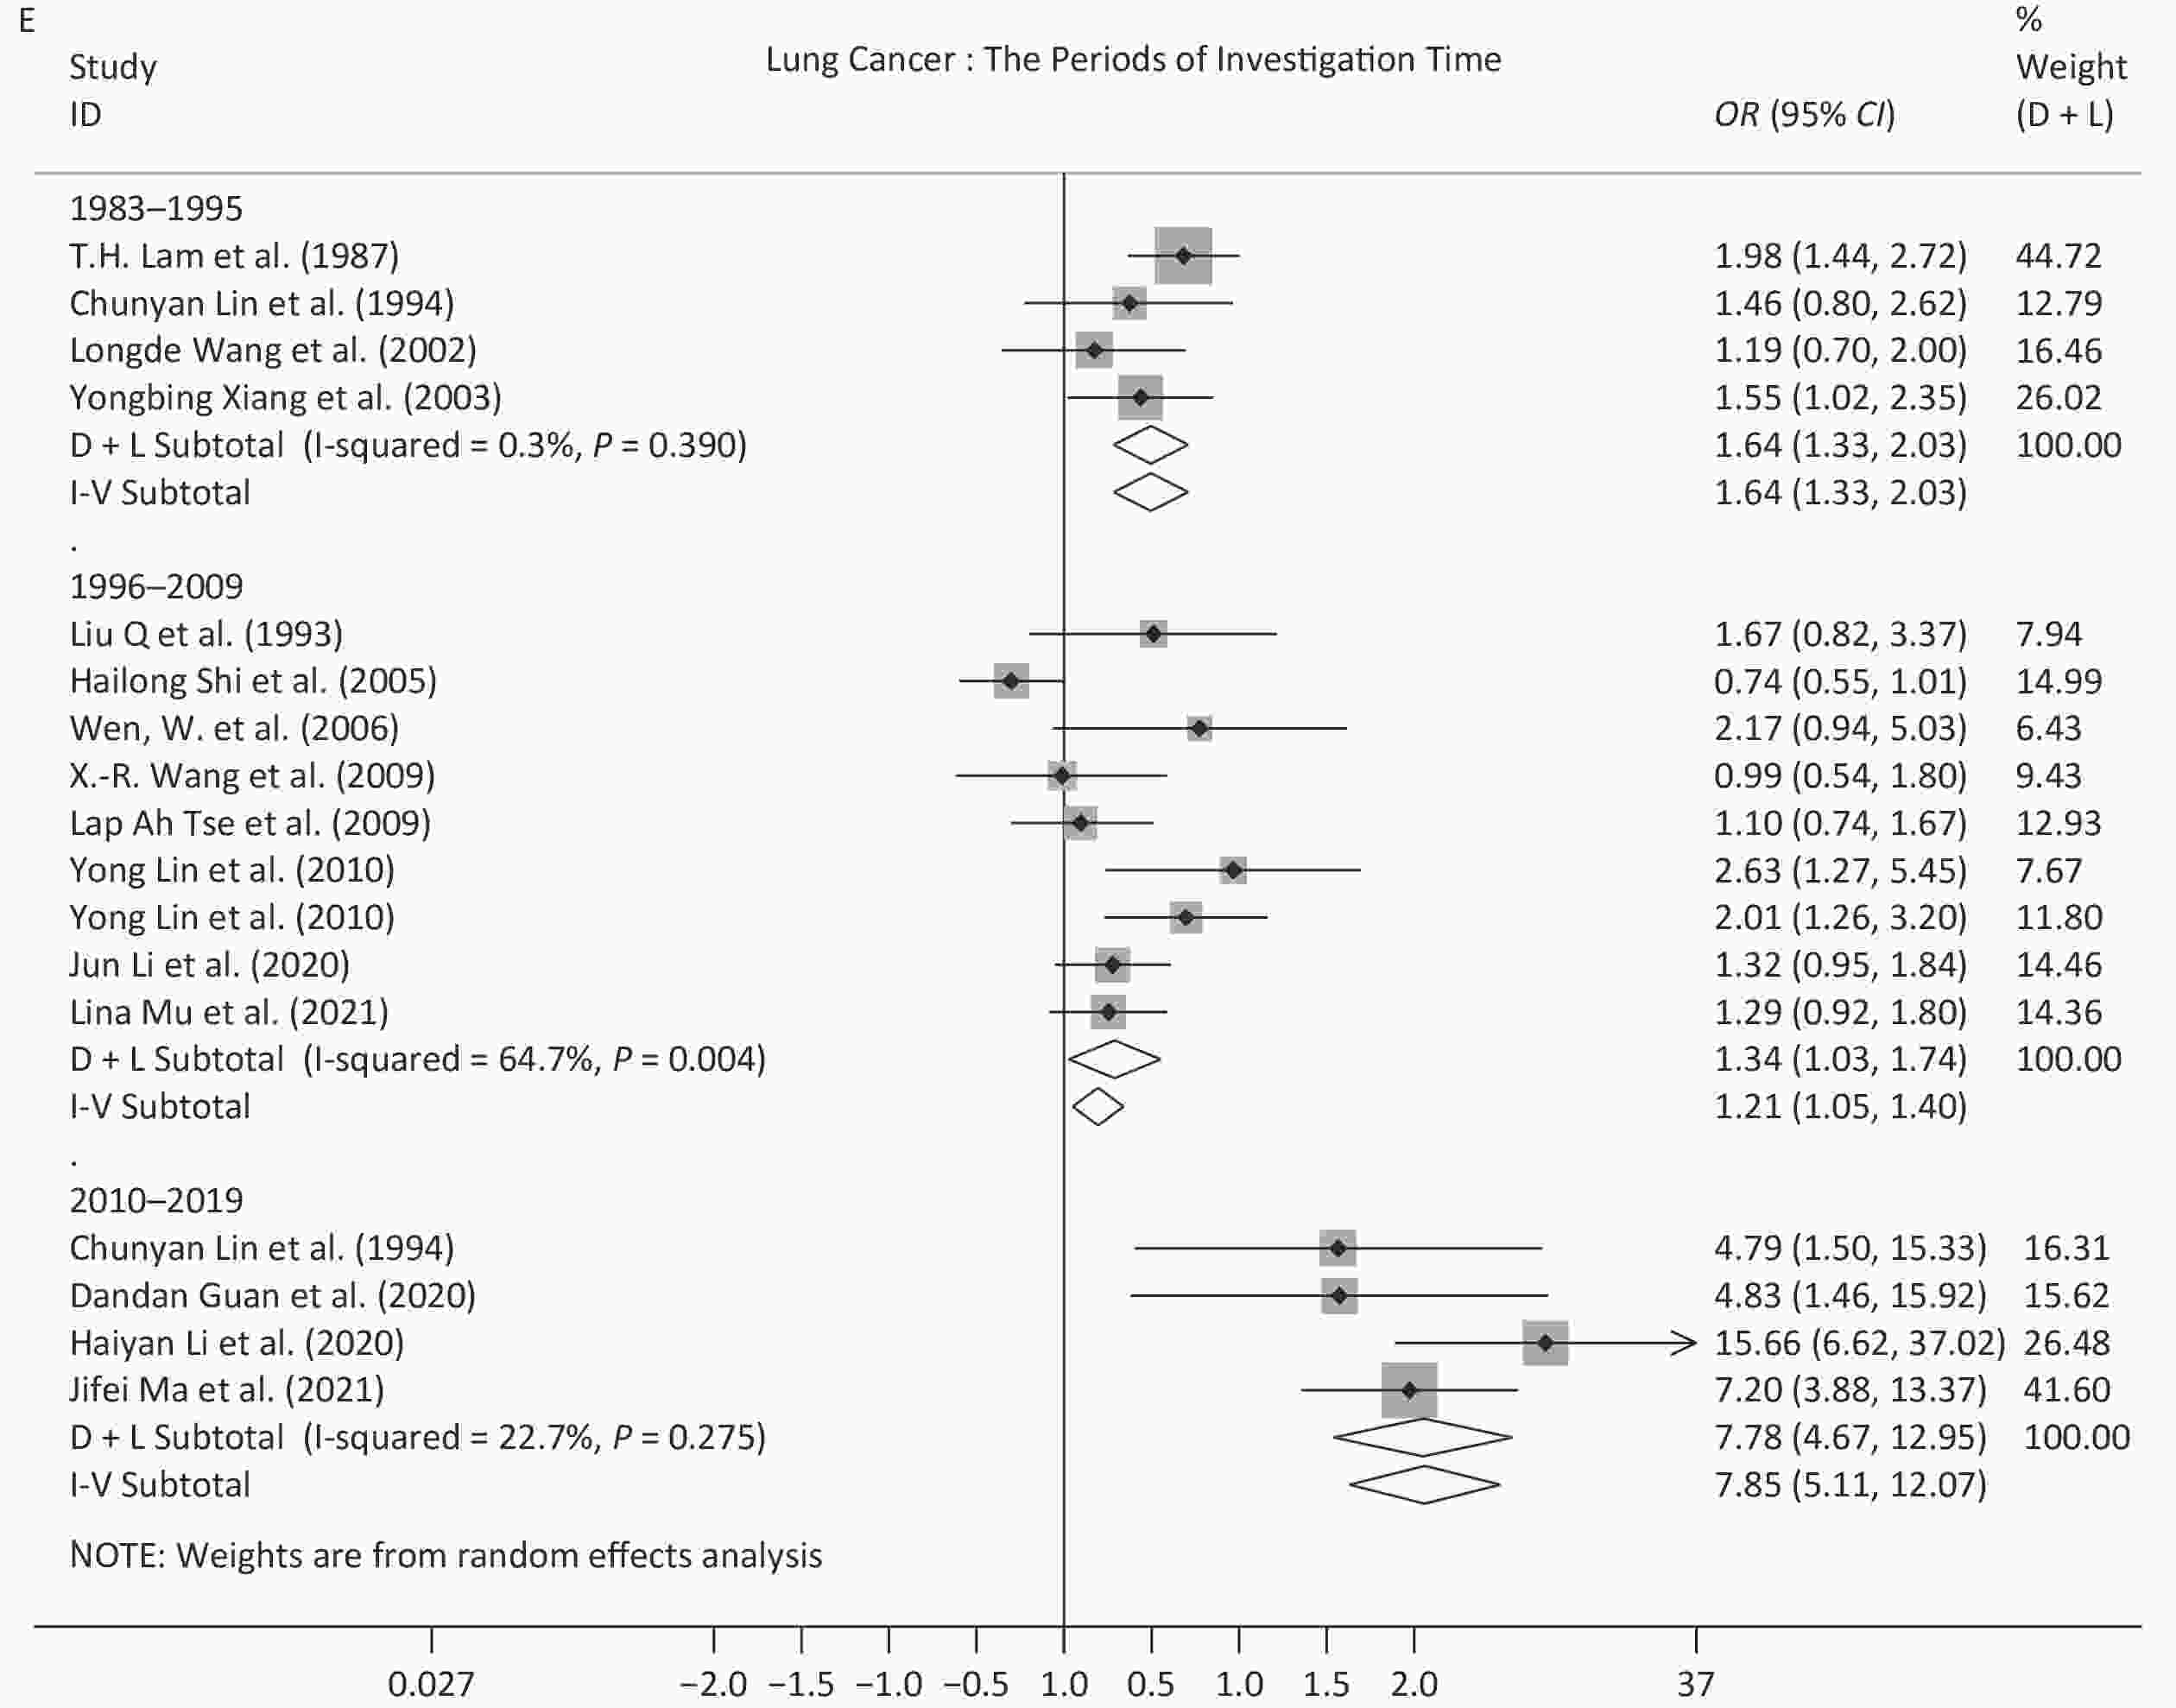
Figure S1. The subgroup odds ratios for second-hand smoke exposure.
-
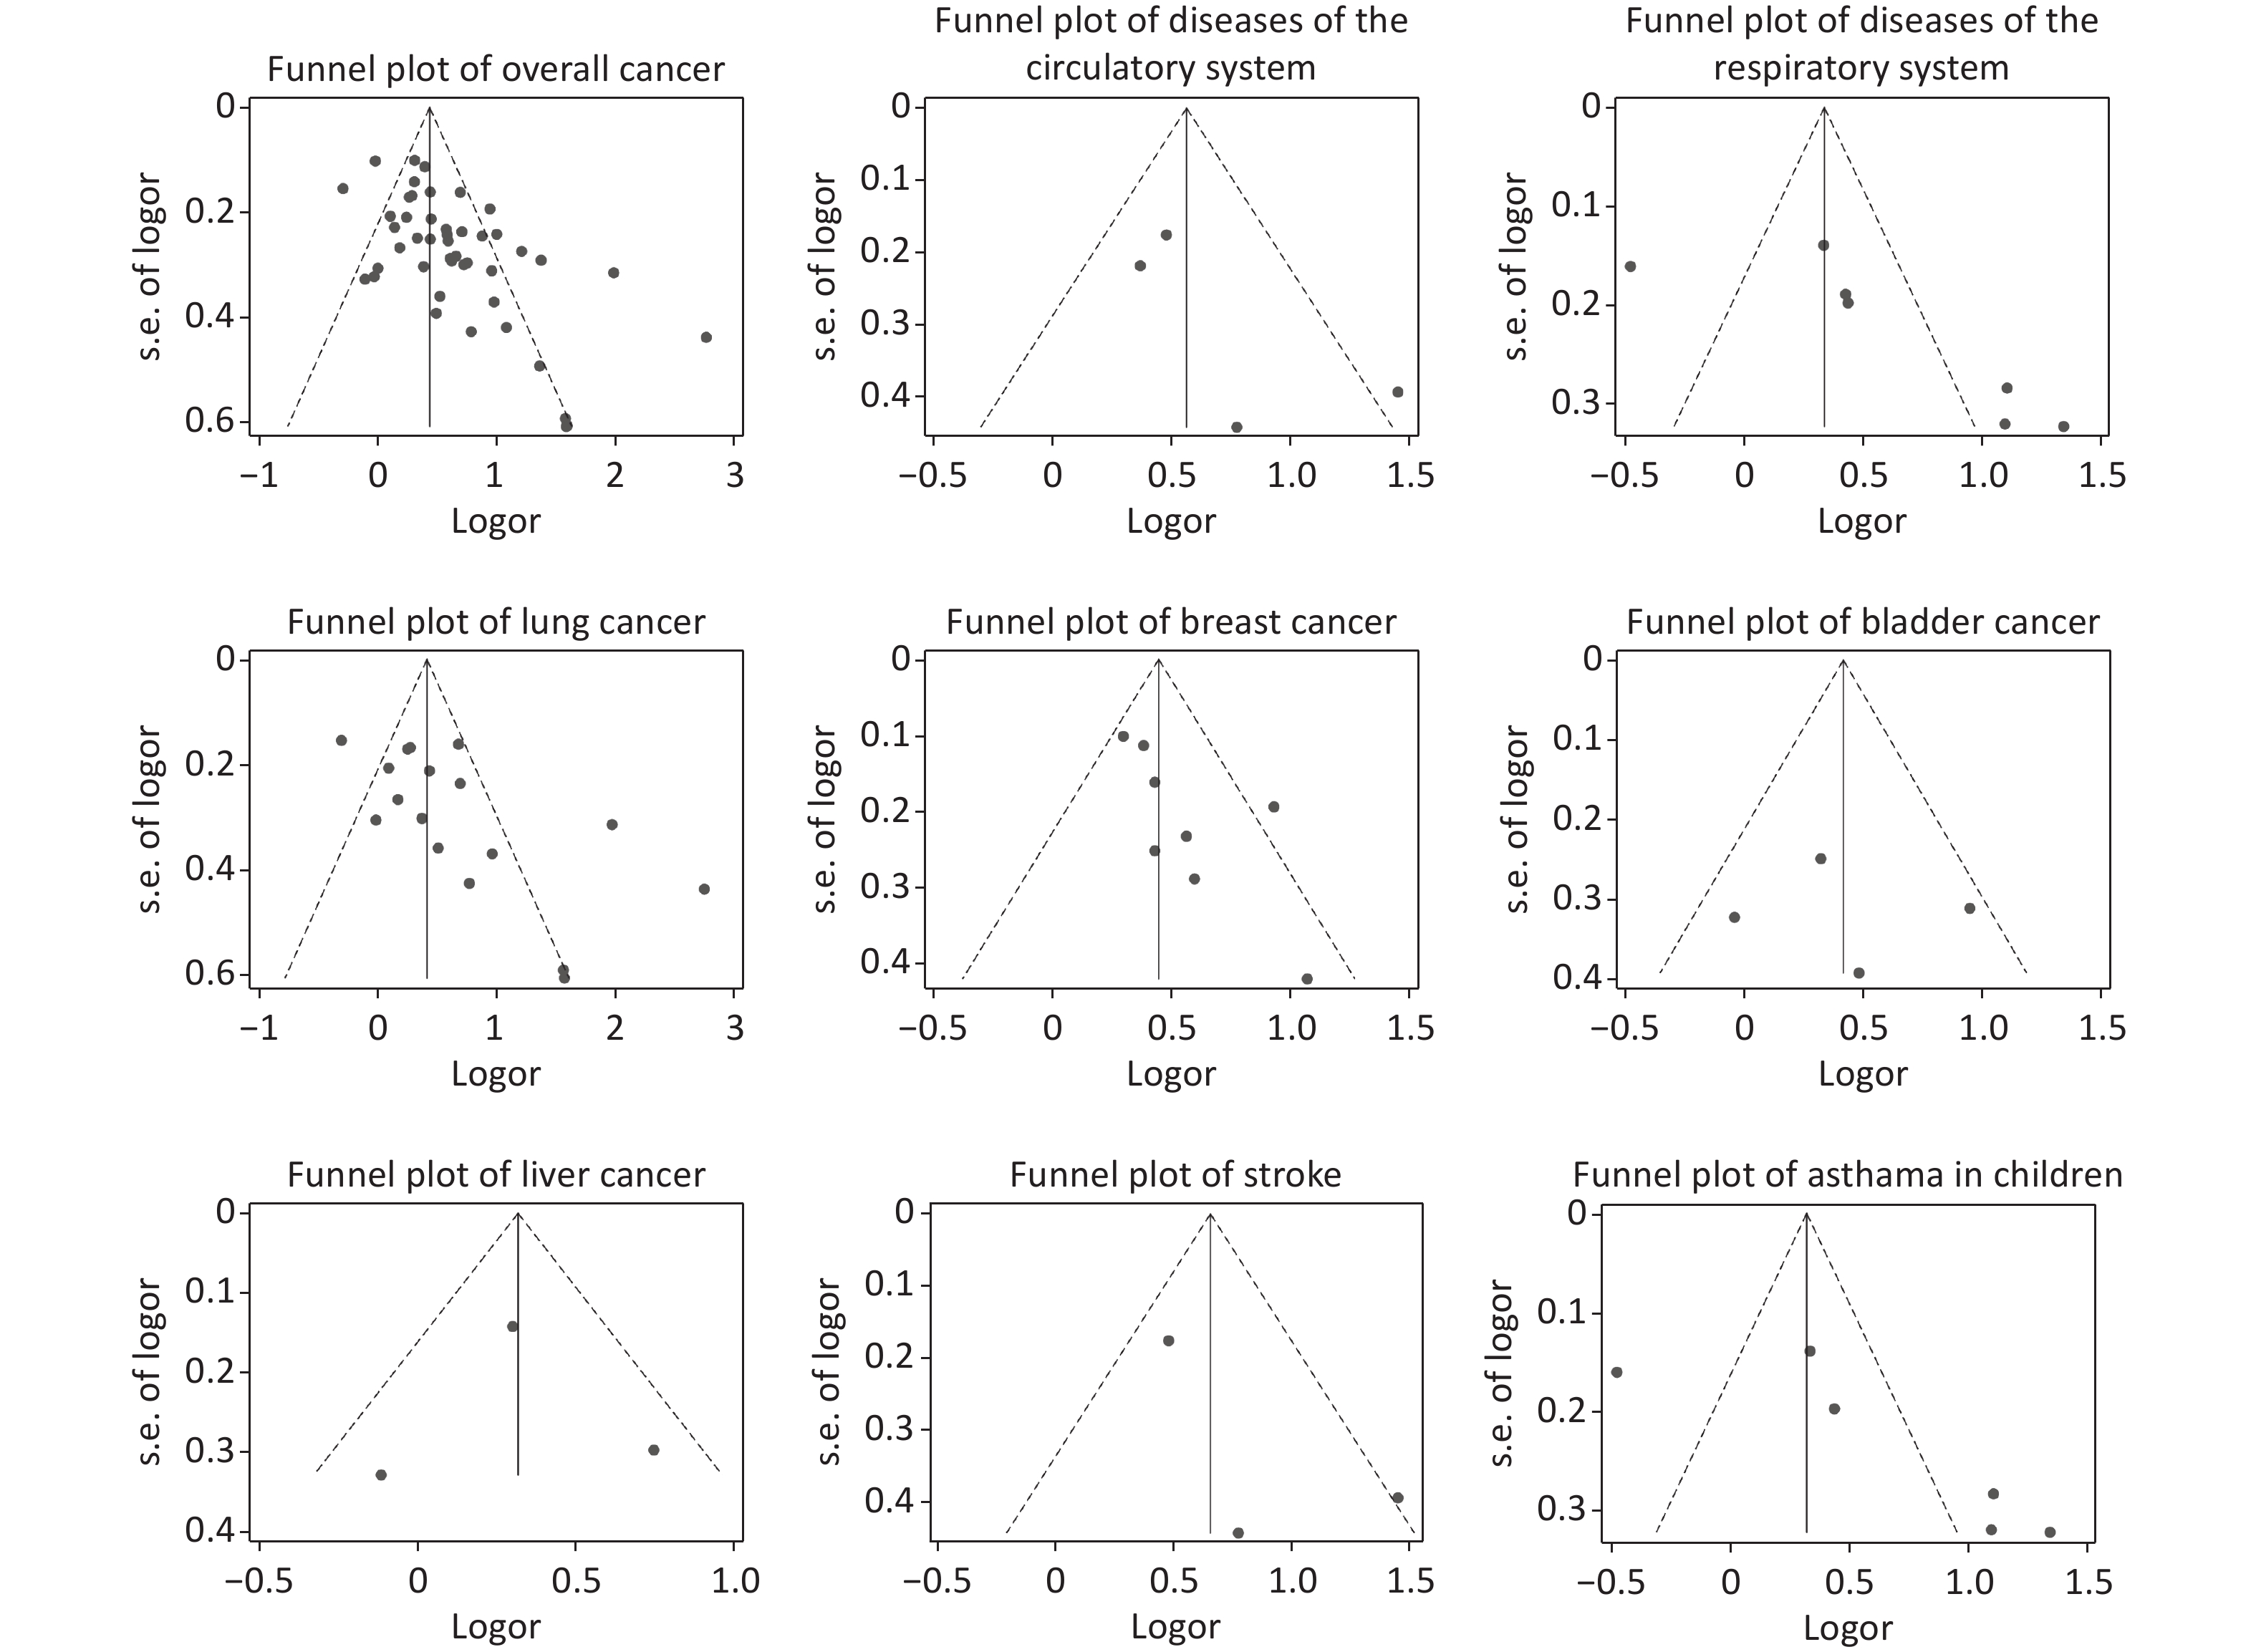
Publication bias was unlikely to be found in the studies of bladder cancer, liver cancer, DCS (including stroke), and DRS (including asthma in children), but may exist in the studies of all cancers (including lung cancer and breast cancer). The results of the Egger’s test are shown in Table 3 and the funnel plots are shown in Supplementary Material Figure 2.

Figure S2. The disease-specific funnel plots.
-
None of the studies were found to have a strong influence on the results for the six diseases analyzed (lung cancer, breast cancer, bladder cancer, liver cancer, stroke, and asthma in children) or the three overall disease types (overall cancers, DCS, and DRS) in the “leave-one-out” sensitivity analysis. The results are summarized in Supplementary Material Table 3.
-
Our findings suggested that exposure to SHS increases the risk of various systemic diseases, especially for all cancers (OR = 1.77, 95% CI: 1.54–2.05), DCS (OR = 1.92, 95% CI: 1.29–2.85), and DRS (OR = 1.76, 95% CI: 1.13–2.74). The ORs fluctuated over time for lung cancer and breast cancer.
-
Overall, although the studies included had NOS scores of 6 or more, the overall mean score was only 6.72, so the quality was low overall. The quality of Chinese studies was relatively poor, with a lower average NOS score of 6.34, compared with English studies (mean = 7.45). In addition, the quality of cohort studies (mean = 8.60) was generally higher than that of case-control studies (mean = 6.52). As for the definition and characteristics of SHS, in National Tobacco Surveys and the National Behavior Risk Factors Surveillance System of China, the prevalence of SHS exposure was taken as one of the key indicators for supervision, which means it is important to clarify the definition of SHS exposure. In 1984, it was defined as “more than 15 minutes per day”[102], while in 1996, it was changed to “at least one day per week for more than 15 minutes”[103]. In 2010, the limit of 15 minutes was removed[104]. However, only 47.17% of the included literature in our study was reported with a clear definition. This may be an area for further development in the future. If the definition of SHS exposure was more accurate, the OR may increase, which may be one explanation for the fluctuation in the OR for lung cancer after 2010.
-
“Cancer incidence and mortality in China, 2016”, a publication released by the National Cancer Center in 2022, showed that the cancer with the highest incidence in men was lung cancer, while it was breast cancer in women[105]. The current study focused on lung cancer and breast cancer, with a specific focus on changes in ORs according to sex, time period, and exposure site. Data on other diseases were limited by the available literature, thereby not allowing for in-depth subgroup analyses. Our study provides a basis for subsequent studies by comparing the results with those of previous domestic and international literature.
Lung Cancer We observed an OR of 1.92 (95% CI: 1.42–2.59) for lung cancer, which did not differ significantly from the six previously-published meta-analyses among the Chinese population (OR range, 1.13 to 2.11). In 2018, a review reported that the OR among the global population was 1.245 (95% CI: 1.026–1.511)[106], and the association among the Chinese population was slightly higher. The OR for Chinese women was 1.65 (95% CI: 1.22–2.24) in our study, which was supported by three previous studies (OR range, 1.50–1.58)[18-20], but two other data sets showed that there was no correlation among Chinese women[21,22]. This may be due to the increase in research on women after 2000. A study published in 2018 observed an OR of 1.33 (95% CI: 1.17–1.51) among women globally[107], and the results among Chinese women were slightly higher. The OR for Chinese men was not statistically significant in this study (OR = 1.12, 95% CI: 0.77–1.63), which was supported by a previous study (OR = 1.00, 95% CI: 0.68–1.48, for hospital-based studies)[23]. Since the other two previous results were significant [OR = 1.34, 95% CI: 1.08–1.65[19] and OR = 1.85, 95% CI: 1.10–3.10 (population-based studies)[23]], the association among Chinese men requires further study. It is noteworthy that the OR values have rapidly increased since 2010. The tobacco industry in the West has been promoting low-tar cigarettes as a healthier alternative to regular cigarettes since the 1950s. In China, the sale of cigarettes with a tar content of more than 15 mg per cigarette was banned by the State Tobacco Monopoly Administration in 2004. From this study, we see that the health risk associated with SHS did not reduce with low-tar cigarettes.
Breast Cancer We observed an OR of 1.57 (95% CI: 1.40–1.76) for breast cancer, which was similar to three previous meta-analyses (OR range, 1.62–1.94) of the Chinese population[32-34], but was more reliable because of lower heterogeneity. Globally, there were a few pooled ORs from meta-analyses, including 1.07 (95% CI: 1.02–1.13) for 11 prospective studies and 1.30 (95% CI: 1.10–1.54) for 20 retrospective studies in 2015[108], 1.235 (95% CI: 1.102–1.385) in 2018[106], and 1.07 in the results of the Global Burden of Disease (GBD) 2017[3]. Therefore, the risk in Chinese women may be slightly higher than the global level. The ORs decreased in 1996–2009, compared with those in 1983–1995, and this difference was statistically significant. However, we could not draw any conclusions regarding the secular trend of ORs in breast cancer because there were no studies published after 2010. Future studies on breast cancer are therefore needed.
Subgroup Analysis of the Exposure Sites in Lung and Breast Cancer Our results revealed that exposure in households or in non-specific places increased the risk of lung cancer and breast cancer, which was supported by five previous meta-analyses of the Chinese population[18-20,23,32]. However, the risk was not significant in the workplace, which may indicate that the smoke-free policy or law was well implemented in the workplace. It also suggests that smoke-free policies in public places or homes need to be reinforced. Another factor is that in most studies, SHS exposure was defined as exposure to family members only, workplace was not included in this definition (Supplementary Table S2, definition 2), but the impact of the workplace should not be ignored.
Other Diseases Currently, no meta-analyses have been conducted for bladder cancer or liver cancer among the Chinese population. Globally, a meta-analysis in 2009 showed no statistically significant association between bladder cancer and SHS exposure (OR = 0.99, 95% CI: 0.86–1.14)[109]. However, because only three studies were included, the reliability of these results is under question. In our study, the OR for the association between SHS and stroke was 2.29 (95% CI: 1.26–4.16), which is similar to previous meta-analyses results for the Chinese population in 2005 (OR = 3.22, 95% CI: 2.04–5.07)[38]. Globally, the pooled estimates were 1.64 (95% CI: 1.12–2.40) in 2012[110] and 1.35 (95% CI: 1.22–1.50) in 2015[111]. Because of the limited number of articles available, subgroup analysis based on sex could not be performed. From literature published in 2016, the OR for Chinese women was 2.11 (95% CI: 1.19–3.74)[39]. However, the NOS scores of the included studies were not specified in the literature, meaning that the quality of the included studies was unconfirmed. There is sufficient evidence to prove that parental smoking, especially by the direct care-giver, decreases pulmonary function[112] and increases asthma prevalence[113] in children. The results of our study (OR = 1.82, 95% CI: 1.07–3.11) were lower than those of a previous study (OR = 3.13, 95% CI: 2.23–4.03)[40], but did not show statistical significance. Furthermore, there was no significant difference between our data and the global data reported in 2013 (OR = 1.32, 95% CI: 1.23–1.42)[114] and 2020 (OR = 1.24, 95% CI: 1.20–1.28)[115].
-
The limitations of the current study include the limited number of eligible studies in the literature and the resulting bias. A large number of studies are currently being undertaken regarding the association between exposure to SHS and certain diseases. Cancer has become one of the major health problems that seriously threatens the health of the Chinese population. However, our study revealed that research into diseases affected by SHS has mainly focused on lung cancer and breast cancer. For other highly-prevalent cancers associated with SHS, such as gastric cancer, colon cancer, and liver cancer, only one to three studies were included in our analysis because of the low quality of the literature or the lack of relevant research. Only original results were included for such studies, and meta-analyses were not performed. The number of cohort studies was also low, with only five such studies out of the 53 extracted from the database. There was heterogeneity among the studies in the meta-analysis of diseases, with the exception of breast cancer, bladder cancer, and liver cancer, which may have led to bias. Publication bias exists in the results for lung cancer and breast cancer; therefore, a minimum sample size should be ensured in future studies. In addition, the definition of SHS exposure varied widely between the included studies, with some not even reporting a definition, which may also have conferred some bias.
-
SHS exposure is a known cause of various diseases. After meta-analysis, exposure to SHS was found to be positively associated with cancer (including lung cancer, breast cancer, and liver cancer), DCS (including stroke), and DRS (including asthma in children) among the Chinese population. Our findings did not show a significant difference from global findings. The same is not the case for active smoking. The definition and characteristics of SHS exposure need to be further clarified. The variations in risk during different time periods may reflect changes to this definition. Further studies are required to confirm the correlation between SHS exposure in the workplace and the risk of disease among men. There remains a lack of research on some other diseases caused by SHS. Our results provide a reference for public health professionals, researchers, and policymakers in the development of effective SHS exposure prevention strategies.
-
WANG Yu Tong: Identified the studies; checked and analyzed the data; wrote the initial draft of the manuscript. HU Kui Ru, ZHAO Jian, AI Fei Ling, SHI Yu Lin, WANG Xue Wei, AI Li Mei, YANG Wen Yi, WANG Jing Xin: Identified the studies; extracted and checked the data. WAN Xia: Conceived and designed the study; checked and verified the data; contributed to the revision and finalization of the paper; was responsible for submitting the article for publication.
-
The authors have no possible conflicts of interest.
Diseases Trialname Year Study design Participants (n) Date of Investigation Gender Exposure
sitesLanguage NOS Cancers Lung cancer Yong Lin et al. 2010 Case-control 416 2006.12−2010.1 Female Workplace, Household Chinese 6 Hailong Shi et al. 2005 Case-control 1,490 2000.6−2002.12 Female Workplace Chinese 6 Lina Mu et al. 2021 Case-control 861 2005.3−2007.9 Both Total Chinese 6 Longde Wang et al. 2002 Case-control 1,776 1994.1−1998.4 Both, Male,
FemaleTotal Chinese 7 X.-R. Wang et al. 2009 Case-control 363 2002.7.1−2004.6.30 Female Total English 7 T.H. Lam et al. 1987 Case-control 741 1983−1986 Female Household English 7 Lap Ah Tse et al. 2009 Case-control 668 2004−2006 Male Total,
Household,
WorkplaceEnglish 7 Liu Q et al. 1993 Case-control 632 1983.6−1984.6 Female Household English 6 Wen, W. et al. 2006 Cohort 72,829 1997.3−2000.5 Female Total,
Household,
WorkplaceEnglish 9 Yongbing Xiang et al. 2003 Case-control 828 1992.2−1993.12 Female Workplace Chinese 6 Chunyan Lin et al. 1994 Case-control 244 1985−1990 Female Household,
WorkplaceChinese 6 Dandan Guan et al. 2020 Case-control 1,284 2015.6−2018.12 Female Total Chinese 7 Jifei Ma et al. 2021 Case-control 750 2015.1−2016.6 Both Total Chinese 6 Haiyan Li et al. 2020 Case-control 296 2011.1−2019.6 Both Total Chinese 6 Jun Li et al. 2020 Cohort 23,415 2008−2011 Both Total English 9 Breast cancer Ping shi et al. 2010 Case-control 446 2005.1−2006.12 Female Total Chinese 6 Xiaodan Yang et al. 2014 Case-control 604 2009.7.1−2012.10.11 Female Total Chinese 6 Kajia Cao et al. 2001 Case-control 696 1992−1996 Female Total Chinese 6 Meiling Qi et al. 2014 Case-control 849 2008.10−2010.2 Female Total,
Household,
WorkplaceEnglish 7 Mingbai Hu et al. 2013 Case-control 407 2009.1−2011.2 Female Total English 6 Bin Li et al. 2015 Case-control 1,767 2007−2013 Female Total,
Household,
WorkplaceEnglish 7 Changming Gao et al. 2013 Case-control 1,351 2004.6−2007.12 Female Total English 9 Xinying Lin et al. 2001 Case-control 372 None Female Total Chinese 6 Cancers Bladder cancer Wei Zhang et al. 2006 Case-control 1,215 1996−1999 Male,
FemaleTotal,
ousehold,
WorkplaceChinese 9 Yuhua Zhou et al. 2014 Case-control 824 2005.9−2008.6 Both Household Chinese 7 Li Tao et al. 2010 Case-control 231 1996.7−1999.6 Both,
Male,
FemaleTotal English 8 Liver cancer Jianxue Duan et al. 2018 Case-control 794 2010.1.1−2016.12.31 Both Total Chinese 6 Huabin Wu et al. 2012 Case-control 1,254 2003.1.1−2010.10.31 Both Total Chinese 6 Jun Li et al. 2020 Cohort 23,415 2008−2011 Both Total English 9 Acute lymphoblastic leukemia Yongjun Fang et al. 2010 Case-control 613 2006.6.1− Children Total Chinese 6 Cancer Wen, W. et al. 2006 Cohort 72,829 1997.3−2000.5 Female Total,
ousehold,
WorkplaceEnglish 9 Cervical cancer Jian Li et al. 2010 Case-control 312 2007.9−2010.6 Female Total Chinese 6 Rongxian Xu et al. 2014 Case-control 413 2007.11−2008.12 Female Total Chinese 6 Colon cancer Qinting Jiang et al. 2004 Case-control 396 1990.5−2002.5
1989−1990Both Workplace Chinese 8 Colorectal cancer Jun Li et al. 2020 Cohort 23,415 2008−2011 Both Total English 9 Endometrial cancer Jing Gao et al. 2006 Case-control 2,082 1997.1−2002.12 Female Total,
Household,
WorkplaceChinese 8 Esophageal squamous cell carcinoma Zemin Wang et al. 2006 Case-control 214 2002−2003 Both Total English 7 Intracranial tumors Min Wu et al. 2010 Case-control 537 2007.1−2008.7 Both Household,
WorkplaceChinese 6 Oral cancer Baochang He et al. 2016 Case-control 708 2010.9−2015.1 Female Total English 7 Papillary thyroid ancer Yan Zhou et al. 2016 Case-control 369 2103.4−2014.6 Both Total Chinese 6 Stomach cancer Jun Li et al. 2020 Cohort 23,415 2008−2011 Both Total English 9 Tongue cancer Lingjun Yan et al. 2016 Case-control 876 2010.9−2015.1 Both Total Chinese 7 Asthma in Children Xiaojuan Liu et al. 2013 Case-control 218 2011.1−2012.12 Children Total Chinese 6 Fang Wang et al. 2013 Case-control 726 2010 Children Total Chinese 6 Mei Xiong et al. 2013 Case-control 552 None Children Total Chinese 6 DRS* Tongzhang Zheng et al. 2002 Case-control 1,209 1999.1−2001.3 Children Total English 6 Shixue Ma et al. 2006 Case-control 212 2002.1−2004.6 Children Total Chinese 6 Maohong Luo et al. 2004 Case-control 262 1998−1999 Children Total Chinese 6 Small airway obstruction Yusheng Chen et al. 2013 Case-control 648 2011.10.17−2011.11.1 Both Total English 7 Stroke Xianjia Ning et al. 1993 Case-control 256 1990.10−1990.12 Female Total Chinese 7 Yanong Shao et al. 1997 Case-control 210 1996.10−1997.3 Both Total Chinese 6 DCS* Wen, W. et al. 2006 Cohort 72,829 1997.3−2000.5 Female Total,
Household,
WorkplaceEnglish 9 Cardiovascular disease Wen, W. et al. 2006 Cohort 72,829 1997.3−2000.5 Female Total,
Household,
WorkplaceEnglish 9 Other diseases All cause mortality Kim, C. et al. 2016 Cohort 65,226 1996−2000/2009 Female Total English 8 Legionnaires' diseases (Children) Suping Wang et al. 1994 Case-control 126 1991.4.4−1992.4.3 Children Total Chinese 6 Otitis media (Children) Ke Li et al. 2018 Case-control 534 2013.1−2016.12 Children Total Chinese 6 Tuberculosis Birong Dong et al. 2001 Case-control 348 1996.3−1997.3 Both Total Chinese 6 Leung, Chi C. et al. 2010 Cohort 15,486 2000.1−2003.12 Female Total English 8 Type 2 diabetes mellitus Huang, C. et al. 2019 Cohort 28,177 2004−2008 Female Total English 9 Note. * DRS: Diseases of the Respiratory System; DCS: Diseases of the Circulatory System Table S1. Basic characteristics of the included studies
Definition of SHS Undefined Definiton 1 Exposure to SHS at home /workplace ≥ 15 min/d, 1 d/week. Exposure to SHS ≥ 15 min/d. Exposure to SHS: once (5 min), twice ( ≥ 5 min but ≤ 1min), more than twice (≥ 1 min). Lived or worked with smokers ≥ 1 h/d, ≥ 1 year. Exposure to SHS 1 time/wk, 1–2 d/week, 3–5 d/week, daily, or almost daily. Definition 2 Exposure to family members (especially husband) had ever smoked at home and/or the smoke of others in the workplace. Living with smoking husband in the same household for at least one year continuously. Living with 1 or more smokers in the same household. Exposure to parents. Types of
Characteristics of SHSNone Type 1 Location, such as household and workplace. Type 2 Adulthood and childhood (before age 18 or after age 18). Adulthood only. Before age 18 years or after age 18 years. Menopausal status. Childhood and adulthood. Pregnant with the child,and after the birth of the child. Table S2. The definition and types of characteristics of second-hand smoke exposure
Disease Trialname POR LL UL Cancers T.H. Lam et al. 1.52 1.42 1.62 Liu Q et al. 1.53 1.44 1.63 Chunyan Lin et al. 1.53 1.44 1.63 Chunyan Lin et al. 1.53 1.43 1.63 Xinying Lin et al. 1.51 1.42 1.61 Kajia Cao et al. 1.53 1.43 1.63 Longde Wang et al. 1.54 1.44 1.64 Yongbing Xiang et al. 1.53 1.44 1.63 Qinting Jiang et al. 1.53 1.43 1.63 Hailong Shi et al. 1.58 1.48 1.69 Zemin Wang et al. 1.53 1.43 1.63 Wen W. et al. 1.53 1.44 1.63 Jing Gao et al. 1.61 1.51 1.72 Wen W. et al. 1.54 1.45 1.64 Wei Zhang et al. 1.54 1.44 1.64 Wei Zhang et al. 1.53 1.44 1.63 Lap Ah Tse et al. 1.54 1.45 1.65 X.-R. Wang et al. 1.54 1.44 1.64 Jian Li et al. 1.53 1.43 1.63 Yong Lin et al. 1.53 1.43 1.63 Yong Lin et al. 1.52 1.43 1.62 Yongjun Fang et al. 1.52 1.42 1.61 Li Tao et al. 1.53 1.44 1.64 Min Wu et al. 1.53 1.43 1.63 Ping shi et al. 1.53 1.43 1.63 Min Wu et al. 1.53 1.43 1.63 Huabin Wu et al. 1.54 1.45 1.65 Mingbai Hu et al. 1.53 1.44 1.63 Changming Gao et al. 1.54 1.44 1.64 Rongxian Xu et al. 1.51 1.42 1.61 Xiaodan Yang et al. 1.53 1.43 1.63 Meiling Qi et al. 1.53 1.44 1.63 Yuhua Zhou et al. 1.52 1.43 1.62 Bin Li et al. 1.55 1.45 1.66 Yan Zhou et al. 1.53 1.43 1.63 Baochang He et al. 1.52 1.43 1.62 Lingjun Yan et al. 1.52 1.42 1.62 Jianxue Duan et al. 1.53 1.43 1.63 Jun Li et al. 1.53 1.43 1.63 Jun Li et al. 1.54 1.44 1.64 Jun Li et al. 1.54 1.45 1.64 Haiyan Li et al. 1.51 1.42 1.61 Dandan Guan et al. 1.53 1.43 1.63 Jun Li et al. 1.54 1.44 1.64 Lina Mu et al. 1.54 1.45 1.64 Jifei Ma et al. 1.51 1.41 1.61 Combined 1.53 1.44 1.63 DCS Xianjia Ning et al. 1.59 1.23 2.05 Yanong Shao et al. 1.90 1.35 2.68 Wen W. et al. 1.92 1.43 2.58 Wen W. et al. 1.72 1.33 2.21 Combined 1.75 1.37 2.23 DRS Tongzhang Zheng et al. 1.40 1.18 1.68 Maohong Luo et al. 1.34 1.15 1.56 Shixue Ma et al. 1.32 1.14 1.54 Fang Wang et al. 1.77 1.49 2.09 Xiaojuan Liu et al. 1.32 1.14 1.54 Mei Xiong et al. 1.38 1.18 1.62 Yusheng Chen et al. 1.38 1.17 1.62 Combined 1.40 1.21 1.63 Lung cancer T.H. Lam et al. 1.46 1.29 1.65 Liu Q et al. 1.51 1.35 1.70 Chunyan Lin et al. 1.50 1.34 1.69 Chunyan Lin et al. 1.52 1.35 1.71 Longde Wang et al. 1.54 1.37 1.73 Yongbing Xiang et al. 1.52 1.34 1.71 Hailong Shi et al. 1.71 1.51 1.94 Wen W. et al. 1.51 1.34 1.69 X.-R. Wang et al. 1.54 1.37 1.74 Lap Ah Tse et al. 1.56 1.38 1.56 1.38 1.76 Yong Lin et al. 1.50 1.33 1.68 Yong Lin et al. 1.49 1.32 1.68 Jun Li et al. 1.55 1.37 1.75 Haiyan Li et al. 1.45 1.30 1.63 Dandan Guan et al. 1.50 1.34 1.69 Lina Mu et al. 1.55 1.37 1.76 Jifei Ma et al. 1.44 1.28 1.61 Combined 1.52 1.35 1.70 Breast cancer Kajia Cao et al. 1.55 1.38 1.74 Xinying Lin et al. 1.49 1.32 1.68 Ping shi et al. 1.55 1.38 1.75 Mingbai Hu et al. 1.57 1.39 1.76 Changming Gao et al. 1.60 1.40 1.83 Meiling Qi et al. 1.57 1.39 1.78 Xiaodan Yang et al. 1.56 1.38 1.75 Bin Li et al. 1.69 1.47 1.94 Combined 1.57 1.40 1.76 Bladder cancer Wei Zhang et al. 1.73 1.23 2.44 Wei Zhang et al. 1.50 1.08 2.08 Li Tao et al. 1.61 1.10 2.35 Yuhua Zhou et al. 1.28 0.91 1.81 Combined 1.52 1.12 2.05 Liver cancer Huabin Wu et al. 1.43 0.93 2.20 Jianxue Duan et al. 1.26 0.98 1.63 Jun Li et al. 1.46 1.14 1.88 Combined 1.37 1.08 1.73 Stroke Xianjia Ning et al. 1.67 1.22 2.30 Yanong Shao et al. 3.15 1.77 5.60 Wen, W. et al. 1.89 1.38 2.58 Combined 1.92 1.43 2.58 Asthma in Children Tongzhang Zheng et al. 1.37 1.12 1.67 Maohong Luo et al. 1.31 1.11 1.54 Shixue Ma et al. 1.28 1.09 1.52 Mei Xiong et al. 1.35 1.13 1.61 Xiaojuan Liu et al. 1.28 1.08 1.52 Fang Wang et al. 1.83 1.52 2.21 Combined 1.38 1.17 1.62 Note. POR: pooled odds ratio; OR: odds ratio; LL: 95% lower limit; UL: 95% upper limit. Table S3. "Leave One Out" sensitivity test
HTML
Search Strategy and Selection Criteria
Inclusion and Exclusion Criteria
Study Selection and Data Extraction
Evaluation of Study Quality
Statistical Analyses
Basic Characteristics of the Included Studies
Definition and Source of SHS Exposure
Diseases Associated with SHS Exposure
Subgroup Analysis
Bias Test
Sensitivity Analysis
The Quality of the Included Studies
The Risks Associated with SHS
Limitations
 22141Supplementary Materials.pdf
|

|

 Quick Links
 DownLoad: