


-
High blood pressure (BP), also known as hypertension, is blood pressure that is consistently higher than normal. Two types of blood pressure measures exist: systolic and diastolic. Systolic blood pressure is the pressure in the arteries when the heart beats, whereas diastolic pressure is the pressure in the arteries when the heart rests. Normal systolic blood pressure is less than 120 mm of mercury (mmHg), and normal diastolic blood pressure is less than 80 mmHg; together, these are denoted as 120/80 mmHg [1]. Hypertension has been well recognized as a major risk factor for cardiovascular diseases [2]. Hypertension is also a leading risk factor for mortality and disability globally [3]. In China, the prevalence rate of hypertension among adults over 35 years of age is 32.5%, thus resulting in various adverse health outcomes and a heavy financial burden [4]. The prevalence of hypertension in Chinese adults has been increasing [5-7]. Previous studies have reported that high-density lipoprotein cholesterol, triglycerides, body mass index, drinking alcohol dependence, insomnia, educational level, diabetes, smoking, stress, viral infection, and age are risk factors for developing hypertension [8, 9]. Moreover, population BP has been reported to be affected by environmental factors and interactions with genetics [10], among which, the effects of air pollution on hypertension have been extensively studied [11-13]. Numerous studies have indicated that long-term fine particulate matter (PM2.5 or FPM) exposure increases the risk of hypertension [14-17]. Both human and animal experimental studies have indicated several pathways that may partially explain the association between PM2.5 exposure and increased BP. However, the detailed mechanism underlying this association remains unclear. Previous studies have shown that PM2.5 interacts with the vascular endothelium and causes oxidative stress and endothelial damage by circulating toxic components. Lower inhalation of particulate matter might cause the abnormal redox environment in the vessel wall and in turn decrease aortic vascular tone [18]. However, few studies have assessed whether blood pressure decreases under less polluted ambient environments. Since the 2000s, the Chinese population has been exposed to air severely polluted by PM2.5, mainly from coal combustion, biomass burning, and motor vehicle exhaust [19]. In 2013, the well-known Air Pollution Prevention and Control Action Plan (APPCAP) was released by the Chinese government as the first national strategy on air pollution control (The State Council, 2013), and has since markedly improved the air quality [20]. However, evidence for assessing whether BP can be decreased through improving ambient air quality remains lacking.
The association between ambient PM2.5 exposure and BP has been reported in various epidemiological studies [12, 13, 17, 21-22]. The results of those studies have tended to support that high exposure to ambient PM2.5 is significantly associated with elevated BP over the short term [23, 24]. However, epidemiological evidence of the long-term effects of ambient PM2.5 on BP is inconsistent. Some studies have found significant associations between long-term PM2.5 exposure and elevated BP [25-27]. For example, a cross-sectional study has reported that each 10 μg/m3 increase in the 2-year average PM2.5 concentration was associated with increases of 0.45 mmHg (95% CI: 0.40–0.50) and 0.07 mmHg (95% CI: 0.04–0.11) in SBP and DBP, respectively [26]. Chan et al. have found that long-term PM2.5 and nitrogen dioxide (NO2) exposure is associated with higher blood pressure in the Sister Study [28]. However, other studies have not found positive associations [29-33]. For example, Chung et al. have analyzed cross-sectional data from 27,752 Taipei City residents > 65 years of age and reported that 1-year average PM2.5 is not associated with BP [32], which may be due to the weak effect of PM2.5 exposure on the BP in a short period with low PM2.5 concentration. The concentrations of PM2.5 are higher in other cities in China than in Taipei City, and PM2.5 is the air pollutant with the highest concentrations in most cities in China. Several studies have indicated that both short-term and long-term exposure to some ambient air pollutants may increase blood pressure among adolescents, according to a systematic review and meta-analysis [13, 34]. Therefore, long-term follow-up studies are needed to provide further evidence regarding the relationship between PM2.5 exposure and changes in BP at the population level.
A significant decrease in PM2.5 concentration was reported nationwide after the introduction of a series of clean air policies in China from 2013 to 2017, particularly APPCAP issued by the China State Council [35]. The APPCAP focused on three key regions: the Beijing-Tianjin-Hebei area, the Yangtze River Delta, and the Pearl River Delta. Ten key actions and 35 concrete measures were advanced, pertaining to various aspects of air quality management, including upgrading industrial structures, adjusting energy structures, controlling point and non-point source pollution, and undertaking management mechanisms and safeguard measures (The State Council, 2013). Overall, APPCAP emphasized the control of multiple pollutants, including sulfur dioxide (SO2), nitrogen oxide (NOx), and primary particulate matter, as well as economic structural adjustment, clean energy, and comprehensive control of multiple pollution sources [36]. Some studies have reported health benefits of air pollution reduction [37, 38]. The population-weighted annual average PM2.5 concentration decreased from 61.8 (95% CI: 53.3–70.0) to 42.0 (95% CI: 35.7–48.6) μg/m3 over the 5-year period [39]. Rapid amelioration of PM2.5 pollution brought associated health benefits in China during 2013–2017 [40]. Here, we investigated an observational quasi-experimental scenario during that time period to assess whether improving air quality might be associated with a decrease in BP. We hypothesized that a decrease in the ambient PM2.5 concentration would be associated with a decrease in BP. We assessed the relationship between decreased PM2.5 and BP, on the basis of data from a national survey conducted before and after the implementation of clean air policies in 2011 and 2015. We believe that identifying the relationship between long-term PM2.5 exposure and BP would provide a policy-making reference for other countries to balance economic development with human health.
-
We obtained population health data from the China Health and Retirement Longitudinal Survey (CHARLS), which is publicly available at
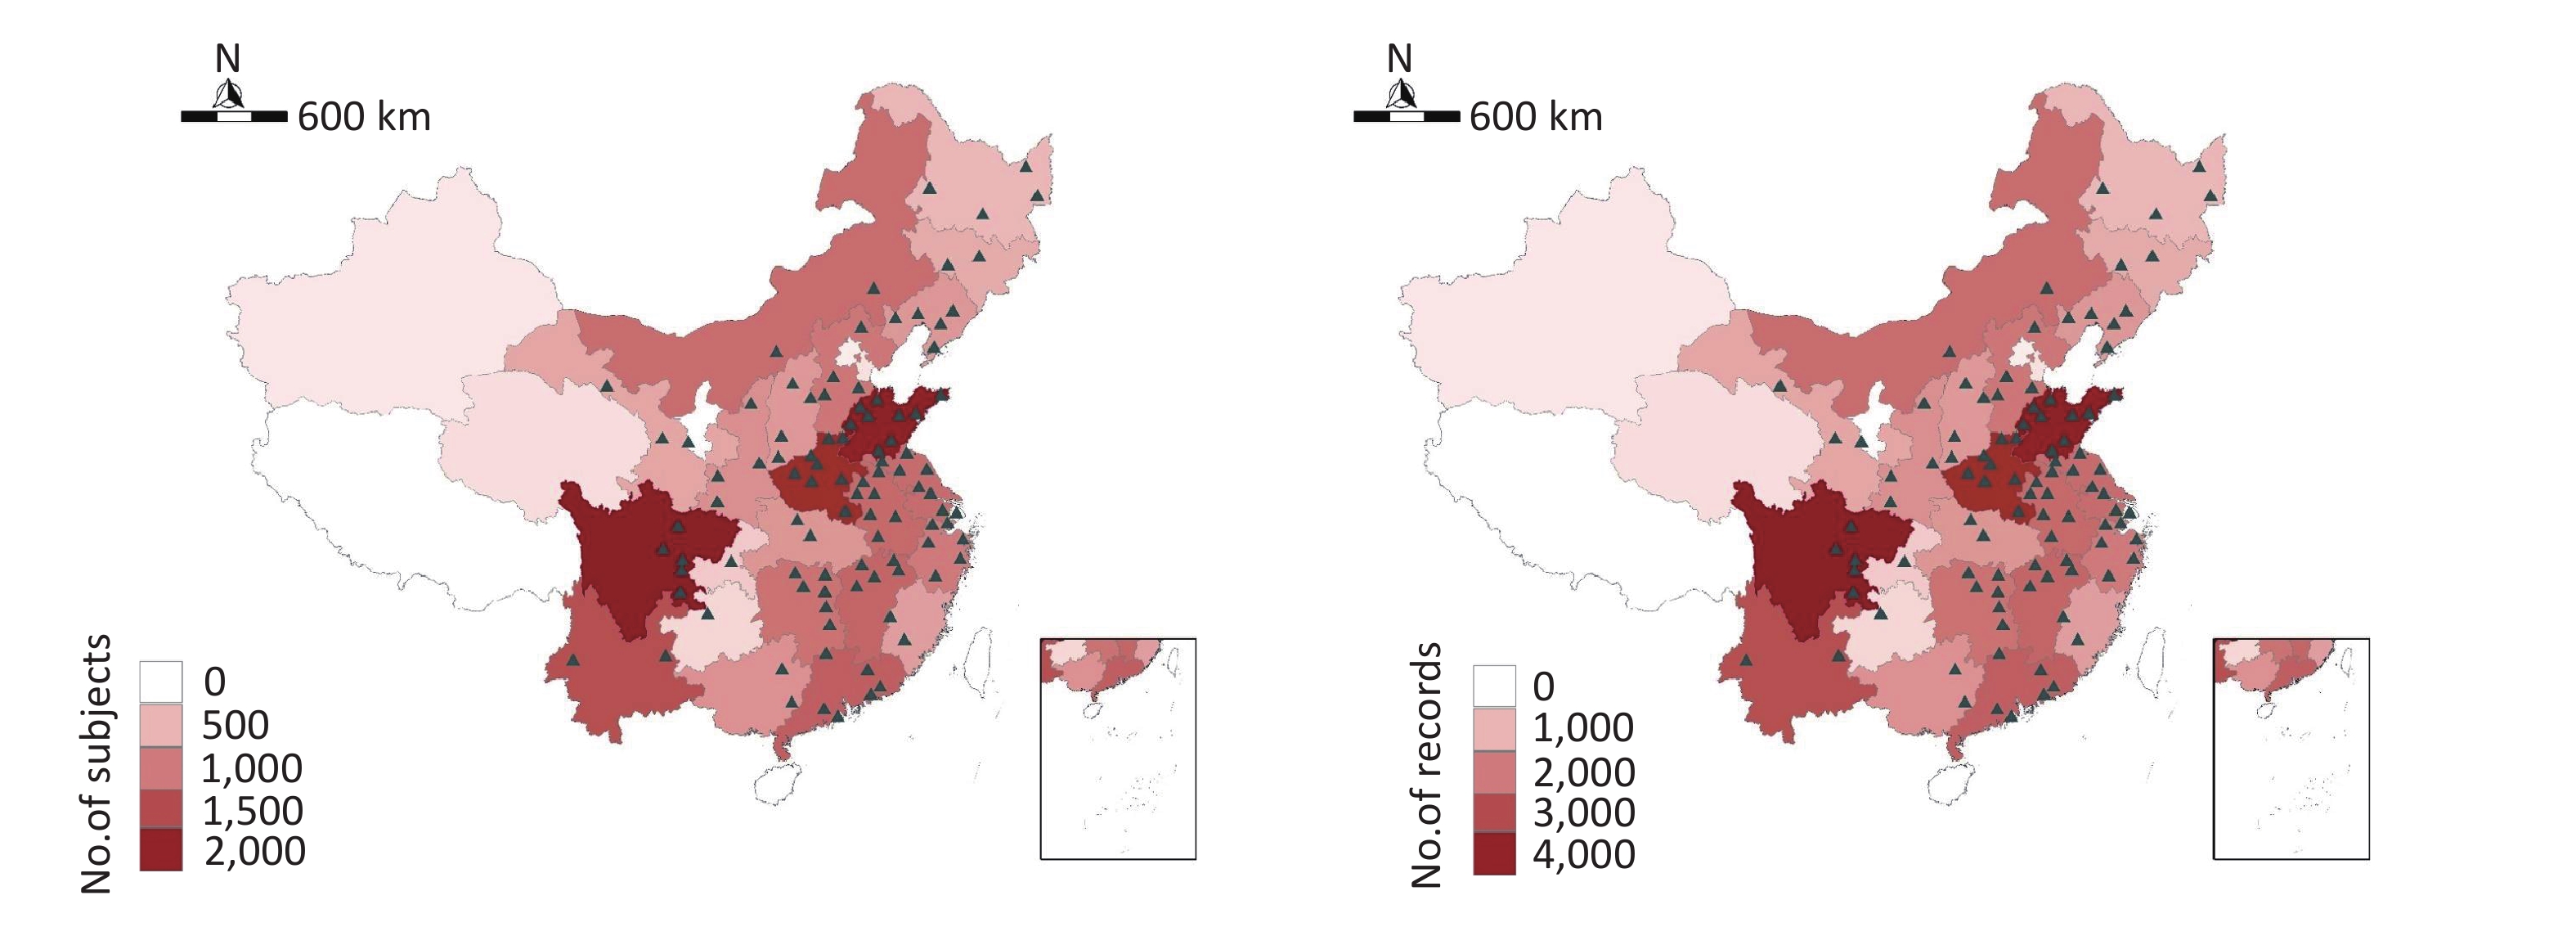
http://opendata.pku.edu.cn (accessed September 5, 2019). The details of this project have been documented previously [41]. Briefly, the national representativeness of the project was ensured by selection of a study population from 28 provinces (150 counties or districts) via multistage probability sampling in China (Supplementary Figure S1, available in www.besjournal.com). Face-to-face interviews were performed every 2 years with a standard questionnaire to collect basic information on socio-demographics (home address, age, gender, and educational level), energy-use characteristics pertaining to cooking and heating, health-related behaviors (smoking and alcohol consumption), and health status (self-reported general health and medicine usage). Standardized resting BP measurements were performed by trained nurses. Left upper-arm BP was measured three times in the sitting position at 45-s intervals, and the mean value was recorded. The data for the CHARLS waves in 2011, 2013, and 2015, covering the periods before and after the clean air actions in China, are currently available. The national baseline survey individual response rate was 80.5%. The 19.5% nonresponse rate comprised 8.8% due to refusal to respond, 8.2% due to the inability of interviewers to contact sample residents, and 2.0% due to other reasons [41]. The surveillance results had a very high response rate and quality, as has been widely recognized in academia [42, 43]. Variables including gender, age, region, residence, education, smoking and alcohol consumption history, marital status, disease history, cooking energy, indoor temperature, and use of anti-hypertension drugs (medication) were extracted from the questionnaires and used as covariates to control for confounders. Missing data in covariates included in our study were imputed through the multiple imputation method. In our study, the population was chosen according to the following criteria: complete information on BP and at least two valid records of BP. A total of 14,080 participants were included in the analysis to test our hypothesis.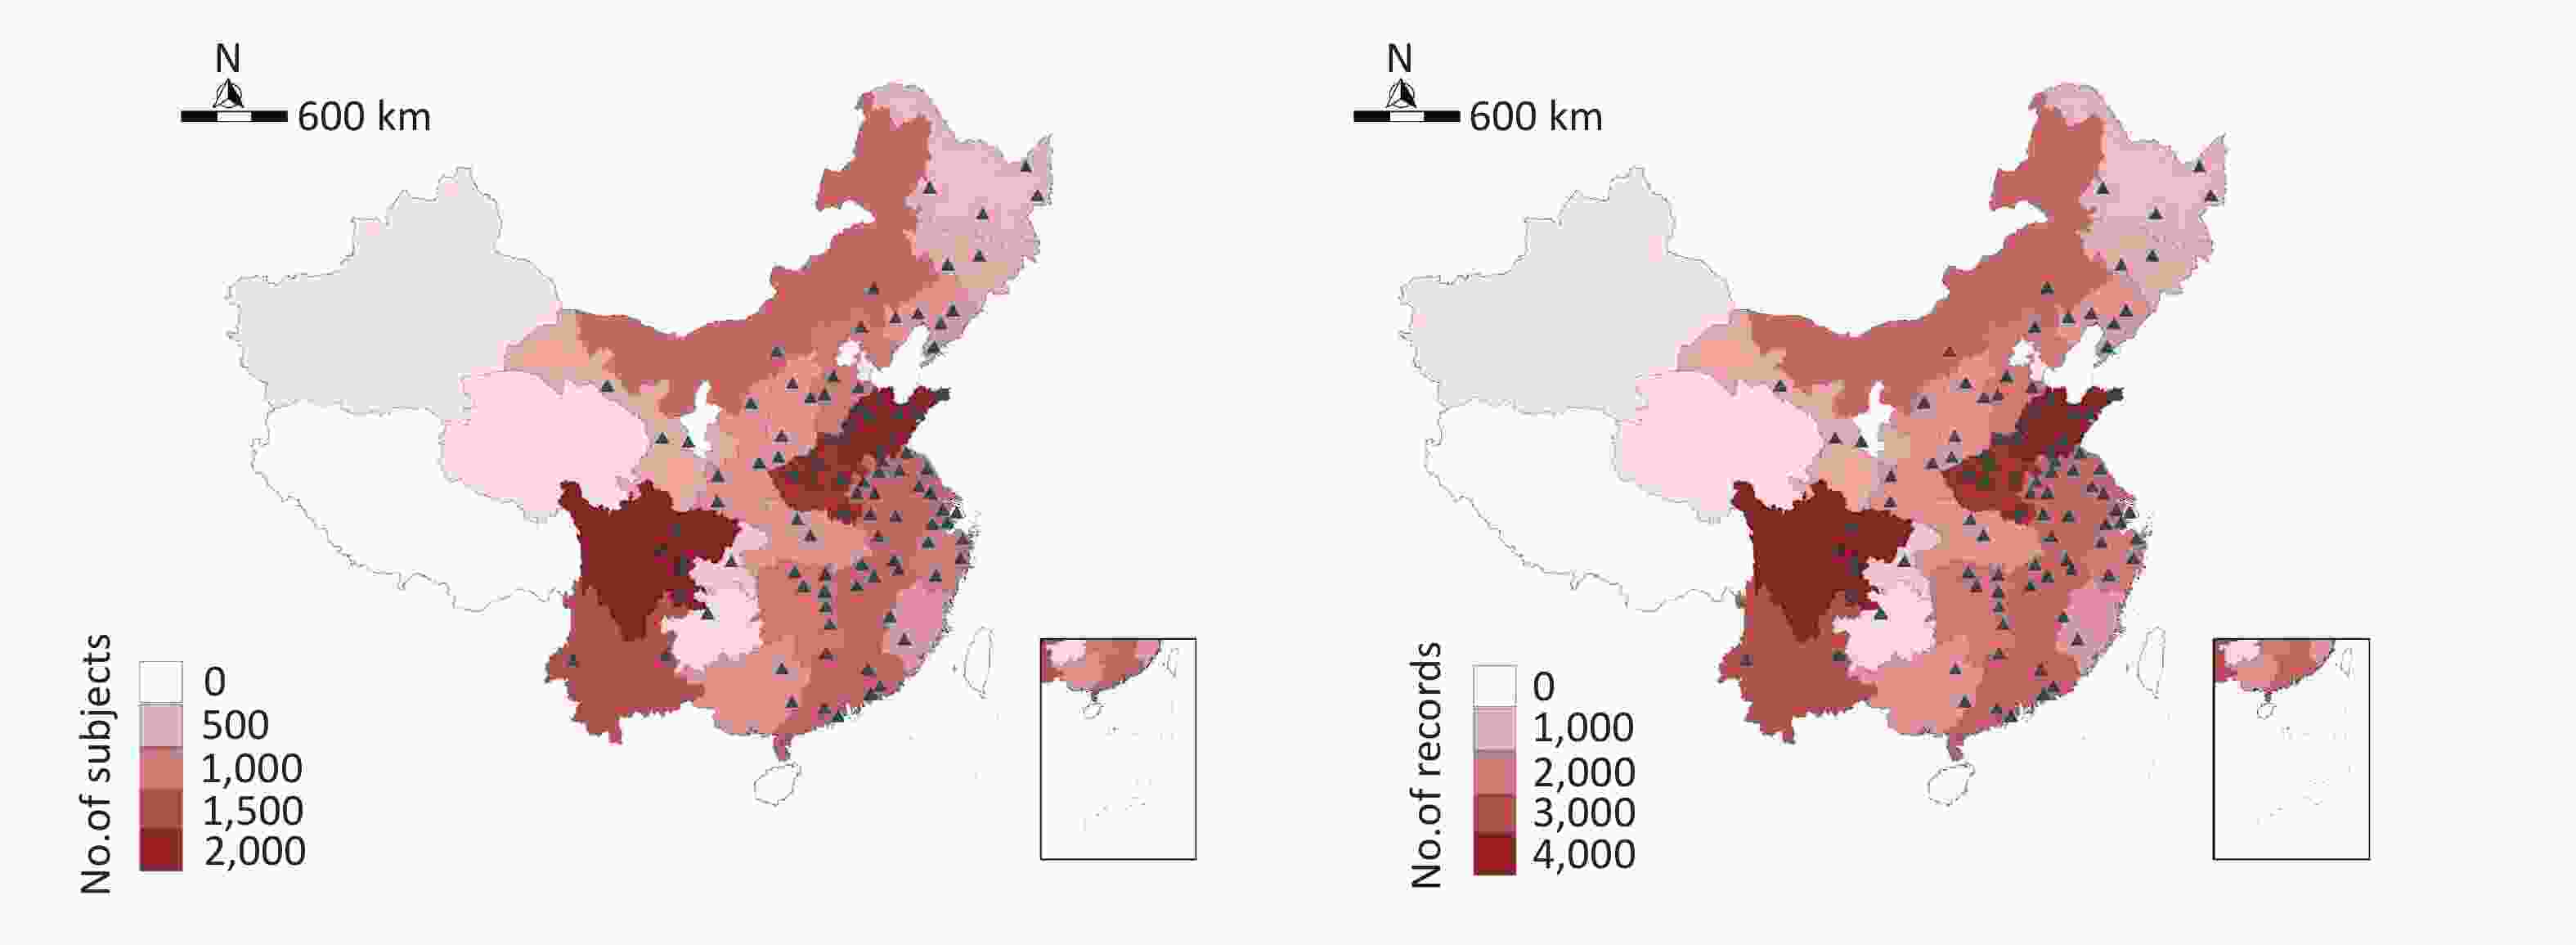
Figure S1. Locations of the study sites in the CHARLS project.
-
The distribution of PM2.5 was estimated through a hindcast approach based on a two-stage machine learning model. This approach integrated the data on historical emissions and satellite remote sensing measurements, thus yielding daily PM2.5 concentrations across a regular 0.1° × 0.1° grid over China from 2000 to 2016. The detailed description of the estimation method has been published previously, and the validation results indicated that the generated concentrations highly correlated with the ground observations on the monthly (R2 = 0.71) and annual (R2 = 0.77) scales [44]. The home addresses of CHARLS participants are available only at the city level for reasons of confidentiality. Therefore, the PM2.5 concentration data were first converted into city-level and monthly averages, and were then linked to the CHARLS respondents according to their spatiotemporal coordinates. The average PM2.5 concentrations 1 and 2 years before the face-to-face visiting day were calculated as the long-term exposure value and are denoted FPM1Y and FPM2Y, respectively.
-
We used the median, interquartile range (IQR), or mean ± standard deviation to describe the distributions. Linear mixed-effects regression models with random effects were used to investigate the associations between ambient PM2.5 concentrations and BP; these models have been widely used in panel studies [45]. The random terms were used to control for two clustering effects at the individual and community levels. We estimated the effects of a 10 μg/m3 decrease in ambient PM2.5 concentration on BP. To examine the robustness of the association between ambient PM2.5 and BP (SBP and DBP), we used the linear-mixed effect regression model by controlling for different groups of confounders, thus resulting in the following four formulas:
(I) Model I: BP = β × PM2.5 + β1 × CF1 + β2 × CF2+ γ1(S) + γ2(H). This model incorporated fixed terms with the β coefficients of PM2.5, β1 , β2 of potential confounders (CF1–2: city and medication), as well as a random intercept for each participant γ1(S) and each household γ2(H). We controlled for medication status and city location. The participants who were taking any anti-hypertensive medicines near the face-to-face visiting period were classified as those taking medicines.
(II) Model II: BP = β × PM2.5 + β1–4 × CF1–4 + γ1(S) + γ2(H). This model incorporated fixed terms with the β coefficients of PM2.5, β1–4 of potential confounders (CF1–4: city, medication, temperature, and age), as well as a random intercept for each participant γ1(S) and each household γ2(H). We further controlled for annual mean temperature, because some studies have reported an inverse association between temperature and BP [46]. We used natural cubic splines with three knots to account for seasonal temperature variations.
(III) Model III: BP = β × PM2.5 + β1–10 × CF1–10 + γ1(S) + γ2(H). This model incorporated fixed terms with the β coefficients of PM2.5, β1–10 of potential confounders (CF1–10: CF1–4, residence, gender, education, marriage, smoking, and alcohol consumption), as well as a random intercept for each participant γ1(S) and each household γ2(H). We further controlled for the following variables as potential confounders, according to previous studies [28, 30]: gender, education level (below elementary, middle, and above middle), marital status (married and living together or not), residence (urban or rural), smoking (current smoking or not), and alcohol consumption (frequent, rare, or never).
(IV) Model IV: BP = β × PM2.5 + β1–16 × CF1–16 + γ1(S) + γ2(H). This model incorporated fixed terms with β coefficients of PM2.5, β1–16 of potential confounders (CF1–16: CF1–10, temperature maintenance of household, heating fuel, living in a multi-story building or not, renting a house, tidiness of the household, and telephone usage), as well as a random intercept for each participant γ1(S) and each household γ2(H). We used the same covariates for SBP and DBP.
We conducted a stratification analysis to examine whether the association between ambient PM2.5 and BP was modified by the following factors: age, gender, education level, residence, marital status, smoking, alcohol consumption, and taking medicine. The statistical significance of the effect modification was tested by analysis of variance between model III and the modified model. The P-value was adjusted through the false discovery rate (FDR) method to enable inferences to be drawn from multiple tests. Compared with the Bonferroni multiple testing method, the FDR corrected the P-value less stringently through controlling the proportion of false/true positives to within a certain range. The above analysis was based on the assumption that BP and explanatory variables showed a linear correlation. To verify this assumption, we established a generalized additive mixed model with a random intercept to explore the exposure-response relationship between the ambient PM2.5 and BP by replacing the linear term of PM2.5 with a set of penalized spline functions:
$$ BP = g(PM_{2.5}) + \beta_{1-10} × CF_{1-10} + γ_{1}(S) + γ_{2}(H) $$ (1) where g is the smoothing spline term. We incorporated a spline term with five degrees of freedom into the regressions to describe the nonlinear effects of PM2.5. All statistical analyses were conducted in R (version 3.5.3; The R Foundation for Statistical Computing, Vienna, Austria). Two-sided statistical tests were used, and a P-value < 0.05 was considered significant.
-
The general characteristics of the 14,080 participants included in the data analysis are summarized in Table 1. Approximately 65% of the participants were from a rural area, and half were women. The proportions of participants with education below elementary level, and at the elementary and middle levels were similar across the three visits, and only about 10% of participants had education above middle level. More than 80% were married and living together. Most participants did not frequently smoke tobacco or drink alcohol. Most participants lived in their own houses (95%) and had bearable household temperature (85%). Overall, 39% lived in a multi-story building, 39% had a telephone facility, and 56% had clean or very clean tidiness. Less than 30% of the participants took anti-hypertensive drugs. For the mean (IQR) of SBP and DBP, changes in the CHARLS 2011, 2013, and 2015 were observed; for PM2.5, the concentration decreased significantly from 61.3 (27.6) to 52.8 (24.0) μg/m3 during 2011–2015.
Characteristic Visit 1 Visit 2 Visit 3 Overall Number of subjectsa 12,725 13,630 13,432 14,080 Age (years)b 59.8 (14.0) 61.4 (15.0) 63.2 (14.0) 61.5 (14.0) Residencec Rural 8,288 (65) 8,866 (65) 8,810 (66) 25,964 (65) Urban 4,437 (35) 4,764 (35) 4,622 (34) 13,823 (35) Genderc Female 6,839 (54) 7,333 (54) 7,239 (54) 21,411 (54) Male 5,885 (46) 6,297 (46) 6,192 (46) 18,374 (46) Unknown 1 (0) 0 (0) 1 (0) 2 (0) Educationc Below elementary 6,049 (48) 5,849 (43) 5,759 (43) 17,657 (44) Elementary & middle 5,357 (42) 5,163 (38) 5,118 (38) 15,638 (39) Above middle 1,314 (10) 1,278 (9) 1,215 (9) 3,807 (10) Unknown 5 (0) 1,340 (10) 1,340 (10) 2,685 (7) Married and lived together c No 2,142 (17) 2,394 (18) 2,567 (19) 7,103 (18) Yes 10,583 (83) 11,230 (82) 10,853 (81) 32,666 (82) Unknown 0 (0) 6 (0) 12 (0) 18 (0) Smokingc No 8,988 (71) 9,479 (70) 9,319 (69) 27,786 (70) Yes 3,730 (29) 4,132 (30) 4,105 (31) 11,967 (30) Unknown 7 (0) 19 (0) 8 (0) 34 (0) Drinking alcoholc Frequent 3,155 (25) 3,501 (26) 3,377 (25) 10,033 (25) Never 8,564 (67) 9,061 (66) 8,941 (67) 26,566 (67) Rare 990 (8) 1,020 (7) 1,087 (8) 3,097 (8) Unknown 16 (0) 48 (0) 27 (0) 91 (0) Heating fuelc Biomass 3,713 (29) 3,632 (27) 2,011 (15) 9,356 (24) Central 912 (7) 1,360 (10) 1,358 (10) 3,630 (9) Clean 2,226 (17) 2,762 (20) 977 (7) 5,965 (15) Coal 3,583 (28) 3,591 (26) 1,968 (15) 9,142 (23) Unknown 2,291 (18) 2,285 (17) 7,118 (53) 11,694 (29) Multi-story buildingc No 8,235 (65) 8,617 (63) 7,147 (53) 23,999 (60) Yes 4,442 (35) 4,958 (36) 6,197 (46) 15,597 (39) Unknown 48 (0) 55 (0) 88 (1) 191 (0) Have telephone c No 6,460 (51) 8,132 (60) 9,572 (71) 24,164 (61) Yes 6,219 (49) 5,451 (40) 3,838 (29) 15,508 (39) Unknown 46 (0) 47 (0) 22 (0) 115 (0) Tidiness degree of householdc Excellent 989 (8) 1,065 (8) 1,197 (9) 3,251 (8) Very clear 2,464 (19) 2,935 (22) 2,938 (22) 8,337 (21) Clear 5,012 (39) 4,439 (33) 4,415 (33) 13,866 (35) Fair 3,387 (27) 3,883 (28) 3,594 (27) 10,864 (27) Poor 810 (6) 972 (7) 833 (6) 2,615 (7) Unknown 63 (0) 336 (2) 455 (3) 854 (2) Temperature maintenance of householdc Very hot 257 (2) 72 (1) 74 (1) 403 (1) Hot 1,333 (10) 1,071 (8) 1,121 (8) 3,525 (9) Bearable 10,615 (83) 11,625 (85) 11,387 (85) 33,627 (85) Cold 397 (3) 487 (4) 376 (3) 1,260 (3) Very cold 59 (0) 23 (0) 12 (0) 94 (0) Unknown 64 (1) 352 (3) 462 (3) 878 (2) Renting a housec No 12,402 (97) 12,887 (95) 12,655 (94) 37,944 (95) Yes 250 (2) 378 (3) 367 (3) 995 (3) Unknown 73 (1) 365 (3) 410 (3) 848 (2) Medicationc No 9,661 (76) 9,685 (71) 9,014 (67) 28,360 (71) Yes 3,064 (24) 3,945 (29) 4,418 (33) 11,427 (29) PM2.5d,b 61.3 (27.6) 59.9 (32.5) 52.8 (24.0) 58.0 (30.4) Temperaturee,b 13.9 (5.0) 14.1 (5.8) 14.7 (4.4) 14.3 (5.0) SBPf,b 130.2 (27.7) 130.7 (27.7) 129.1 (27.3) 130.0 (27.3) DBPg,b 75.7 (16.0) 76.7 (16.0) 75.5 (15.3) 76.0 (16.0) Note. aUnit: people. bData are shown as mean (IQR). cData are shown as number (%). dAverage concentration of PM2.5 1 year before visit; unit: µg/m3. eAverage temperature 1 year before visit; unit: °C. fSystolic blood pressure; unit: mmHg. gDiastolic blood pressure; unit: mmHg. Table 1. Characteristics of the study participants
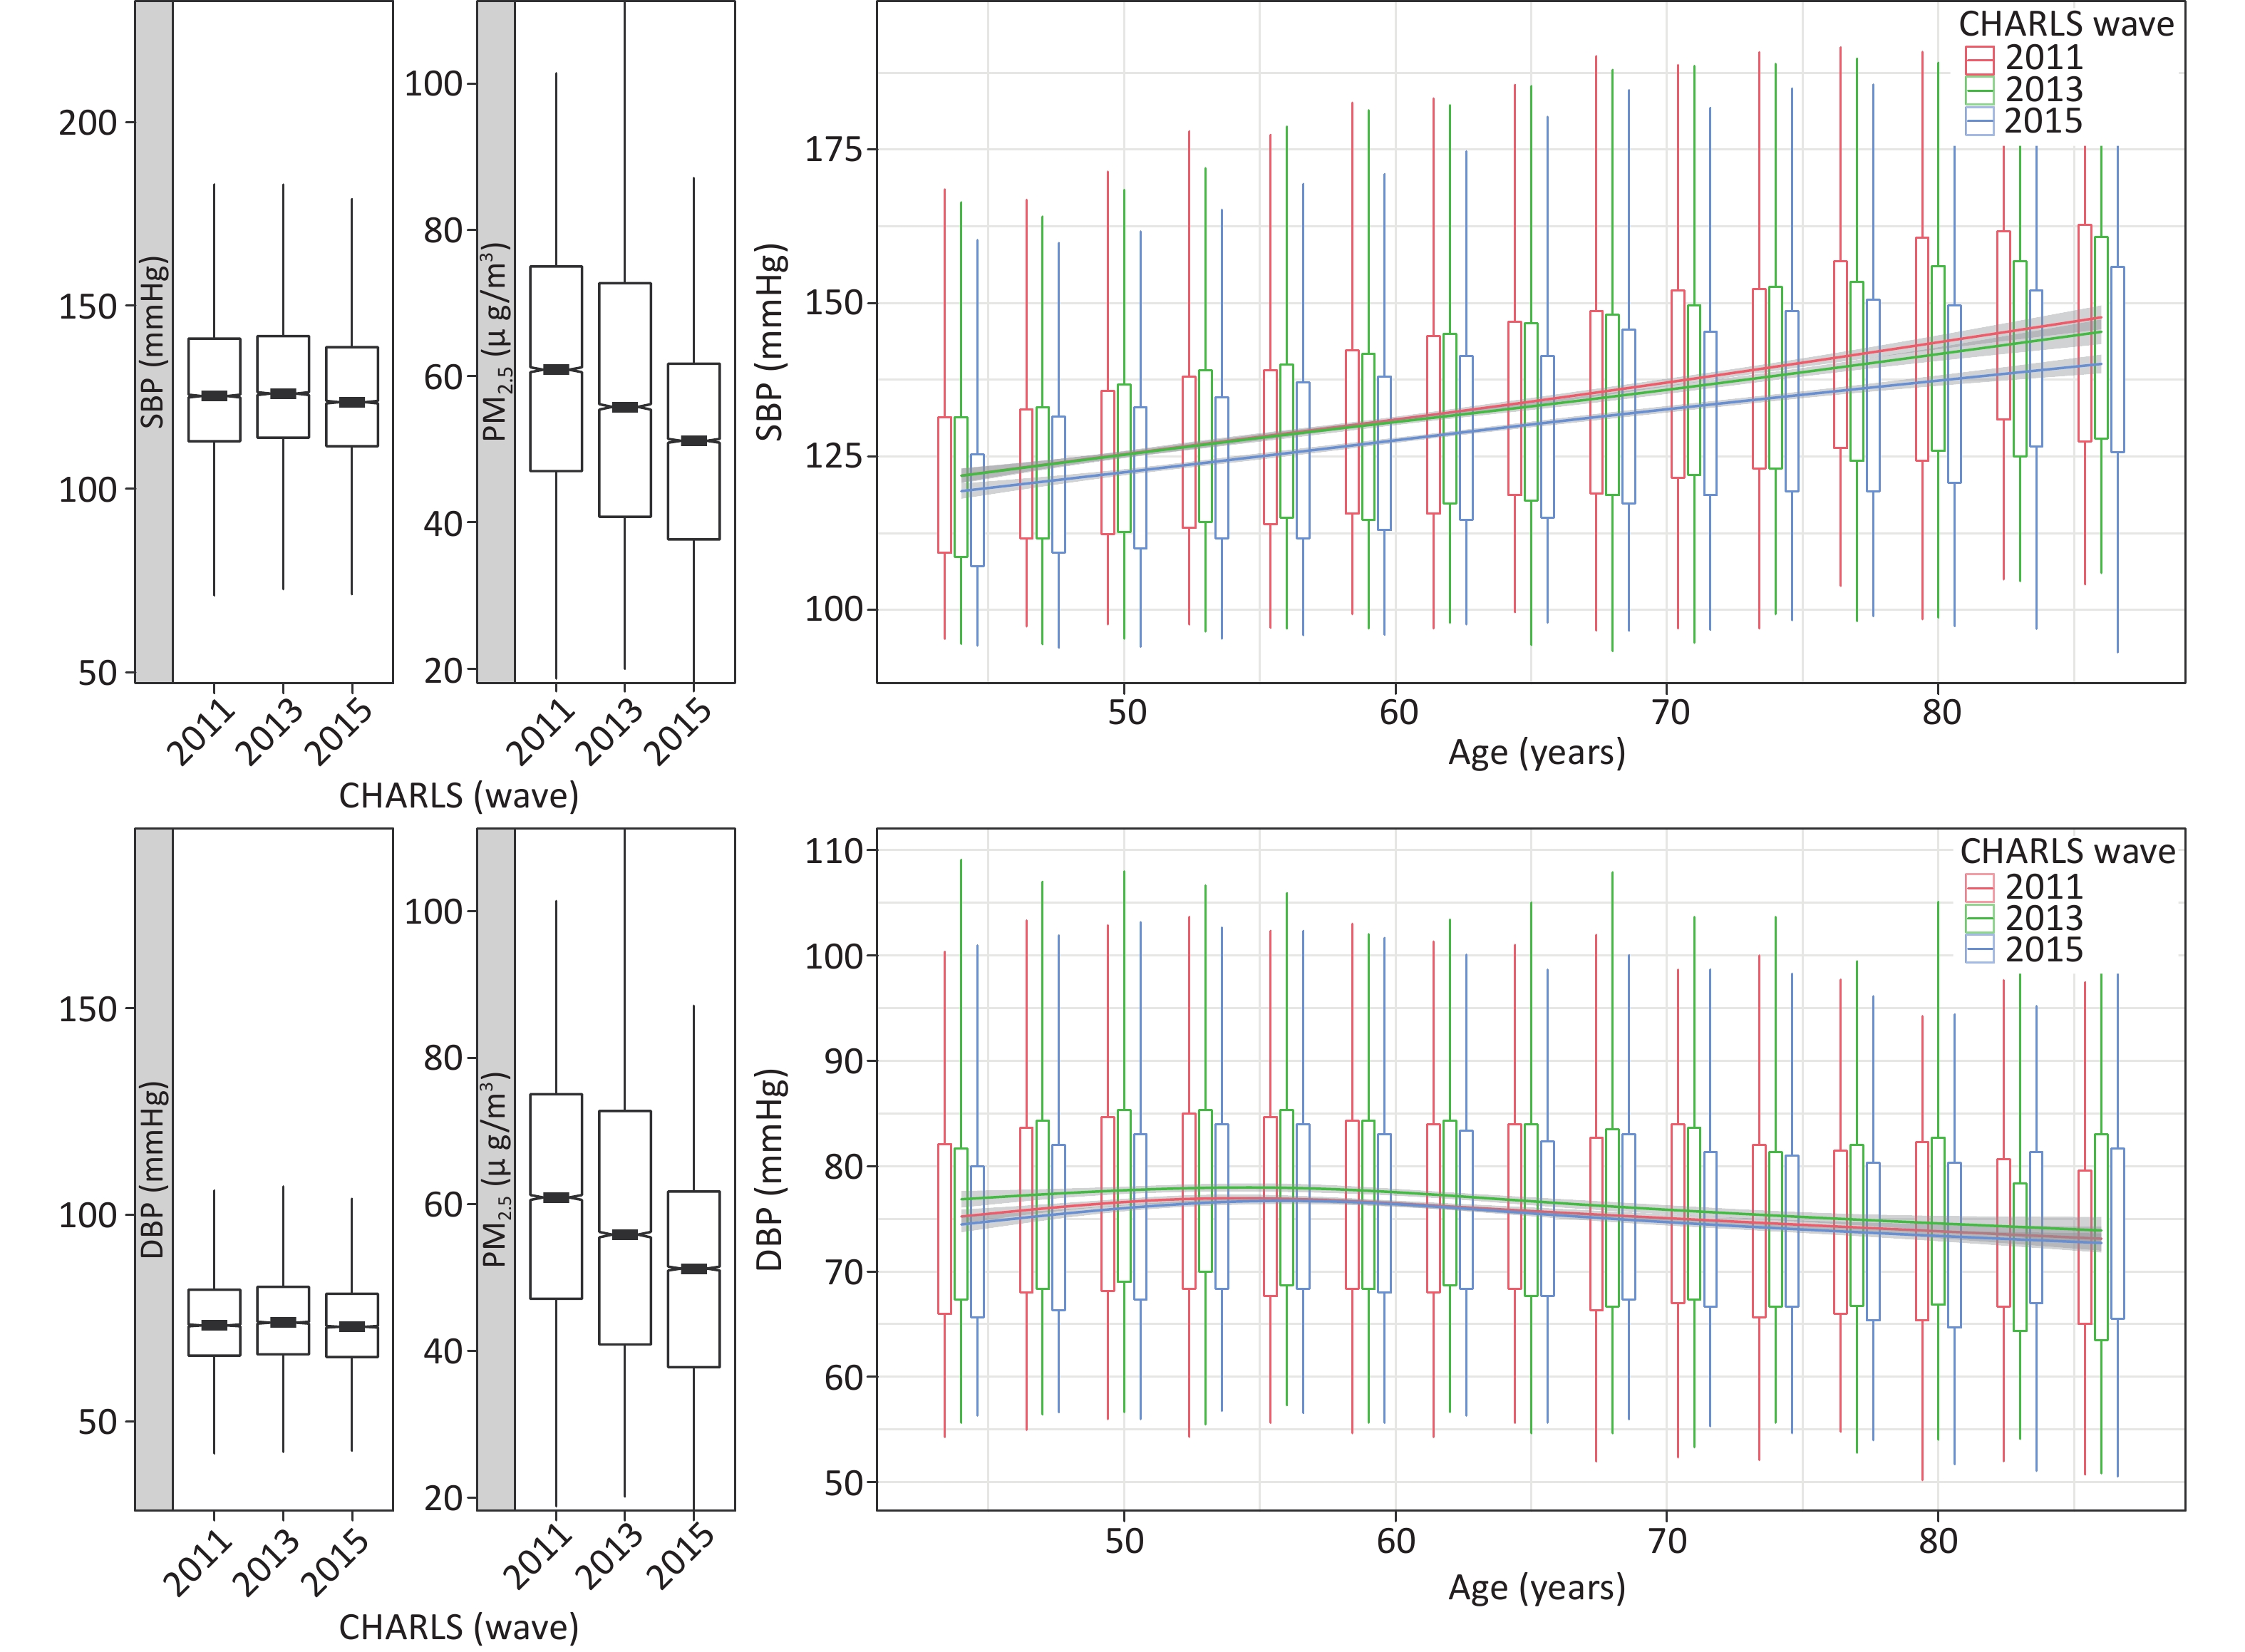
The distributions of these values are shown in (Figure 1). The levels of mean PM2.5 decreased significantly during the three visits. SBP and DBP increased at the beginning and then decreased, whereas the reverse trend was found for SBP. The overall mean (IQR) levels of PM2.5 during the previous year of the survey were 58.0 (30.4) µg/m3. The overall mean (IQR) levels of SBP and DBP were 130.0 (27.3) mmHg and 76.0 (16.0) mmHg, respectively. In addition, SBP generally increased with age, and DBP initially increased and then decreased with age (Figure 1). Although the curves in different years were similar, that derived from the CHARLS 2015 (i.e., the wave after the clean air actions) was lower for most age groups. Because the curves were derived from cross-sectional information without adjustment for confounders, they were used to display the data and do not show the variation in BP with age among Chinese adults.
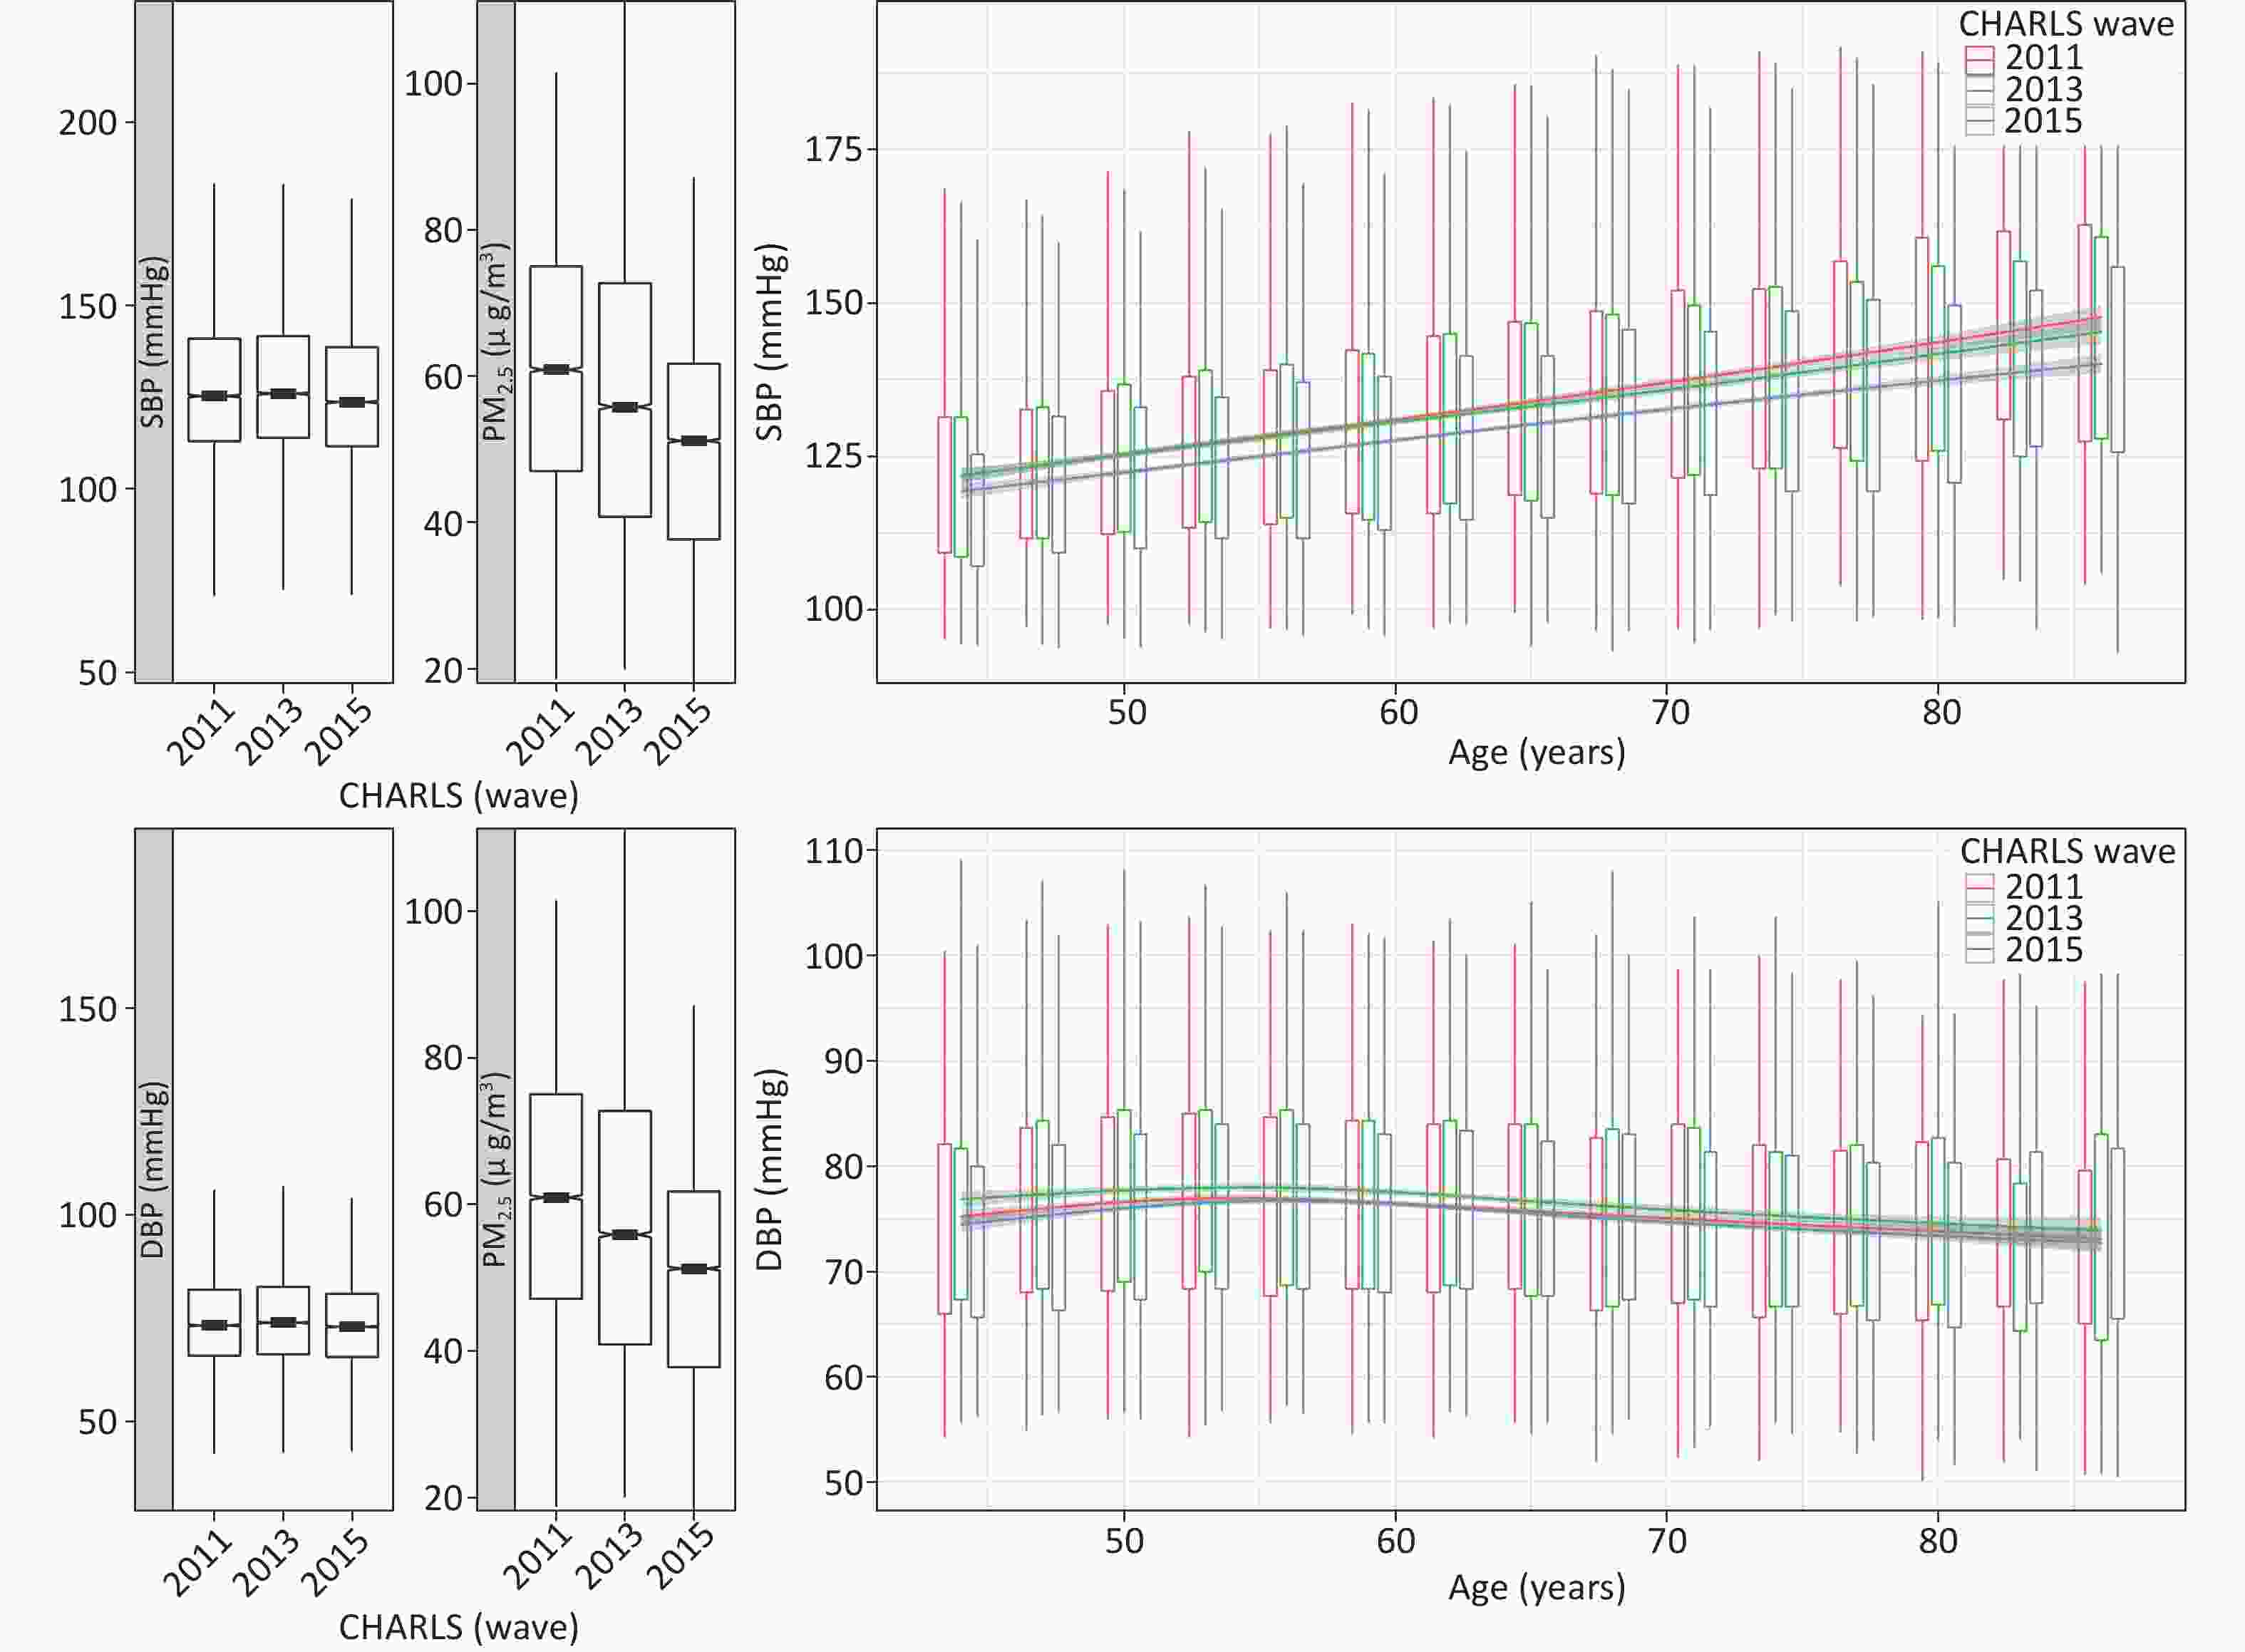
Figure 1. Trends in PM2.5 and BP during the three CHARLS waves. Left panel: distribution of SBP, DBP, and PM2.5 by CHARLS wave. Right panel: age-specific distribution of the waves; smoothed curves for BP and age were derived with the spline approach without covariates. CHARLS, China Health and Retirement Longitudinal Survey; BP, blood pressure; SBP, systolic blood pressure; DBP, diastolicblood pressure
-
We explored the associations between ambient PM2.5 concentrations and BP during two different exposure periods by using four linear mixed models. Each 10 μg/m3 decrease in FPM1Y was associated with decreases of 1.24 (95% CI: 0.84–1.64) mmHg SBP and 0.50 (95% CI: 0.25–0.75) mmHg DBP, according to model III. Similarly, decreases of 1.52 (95% CI: 0.93–2.11) mmHg in SBP and 0.83 (95% CI: 0.46–1.21) mmHg in DBP were observed for FPM2Y (Table 2). The detailed results of the other models are provided in Supplementary Table S1, available in www.besjournal.com. Each 10 μg/m3 decrease in FPM1Y was associated with decreases of 0.87 (95% CI: 0.58–1.16) mmHg SBP and 0.35 (95% CI: 0.17–0.54) mmHg DBP with model I; 1.27 (95% CI: 0.87–1.67) mmHg SBP and 0.51 (95% CI: 0.26–0.77) mmHg DBP with model II; and 1.18 (95% CI: 0.78–1.58) mmHg SBP and 0.51 (95% CI: 0.26–0.77) mmHg DBP with model IV. Overall, all four models indicated that FPM1Y and FPM2Y were positively associated with SBP and DBP.
PM Conc.a β (95% Confidence Interval)b Systolic blood pressure Diastolic blood pressure FPM1Y 1.24 (0.84, 1.64) 0.50 (0.25, 0.75) FPM2Y 1.52 (0.93, 2.11) 0.83 (0.46, 1.21) Note. aAverage fine particulate matter (FPM) concentration over the time period before the survey. FPM1Y: average PM2.5 concentration in the past year; FPM2Y: average PM2.5 concentration in the past 2 years. bBlood pressure changes were calculated on the basis of each 10 µg/m3 change in ambient PM2.5 concentration. Table 2. Associations between ambient PM2.5 concentration (Conc.) and blood pressure with model III
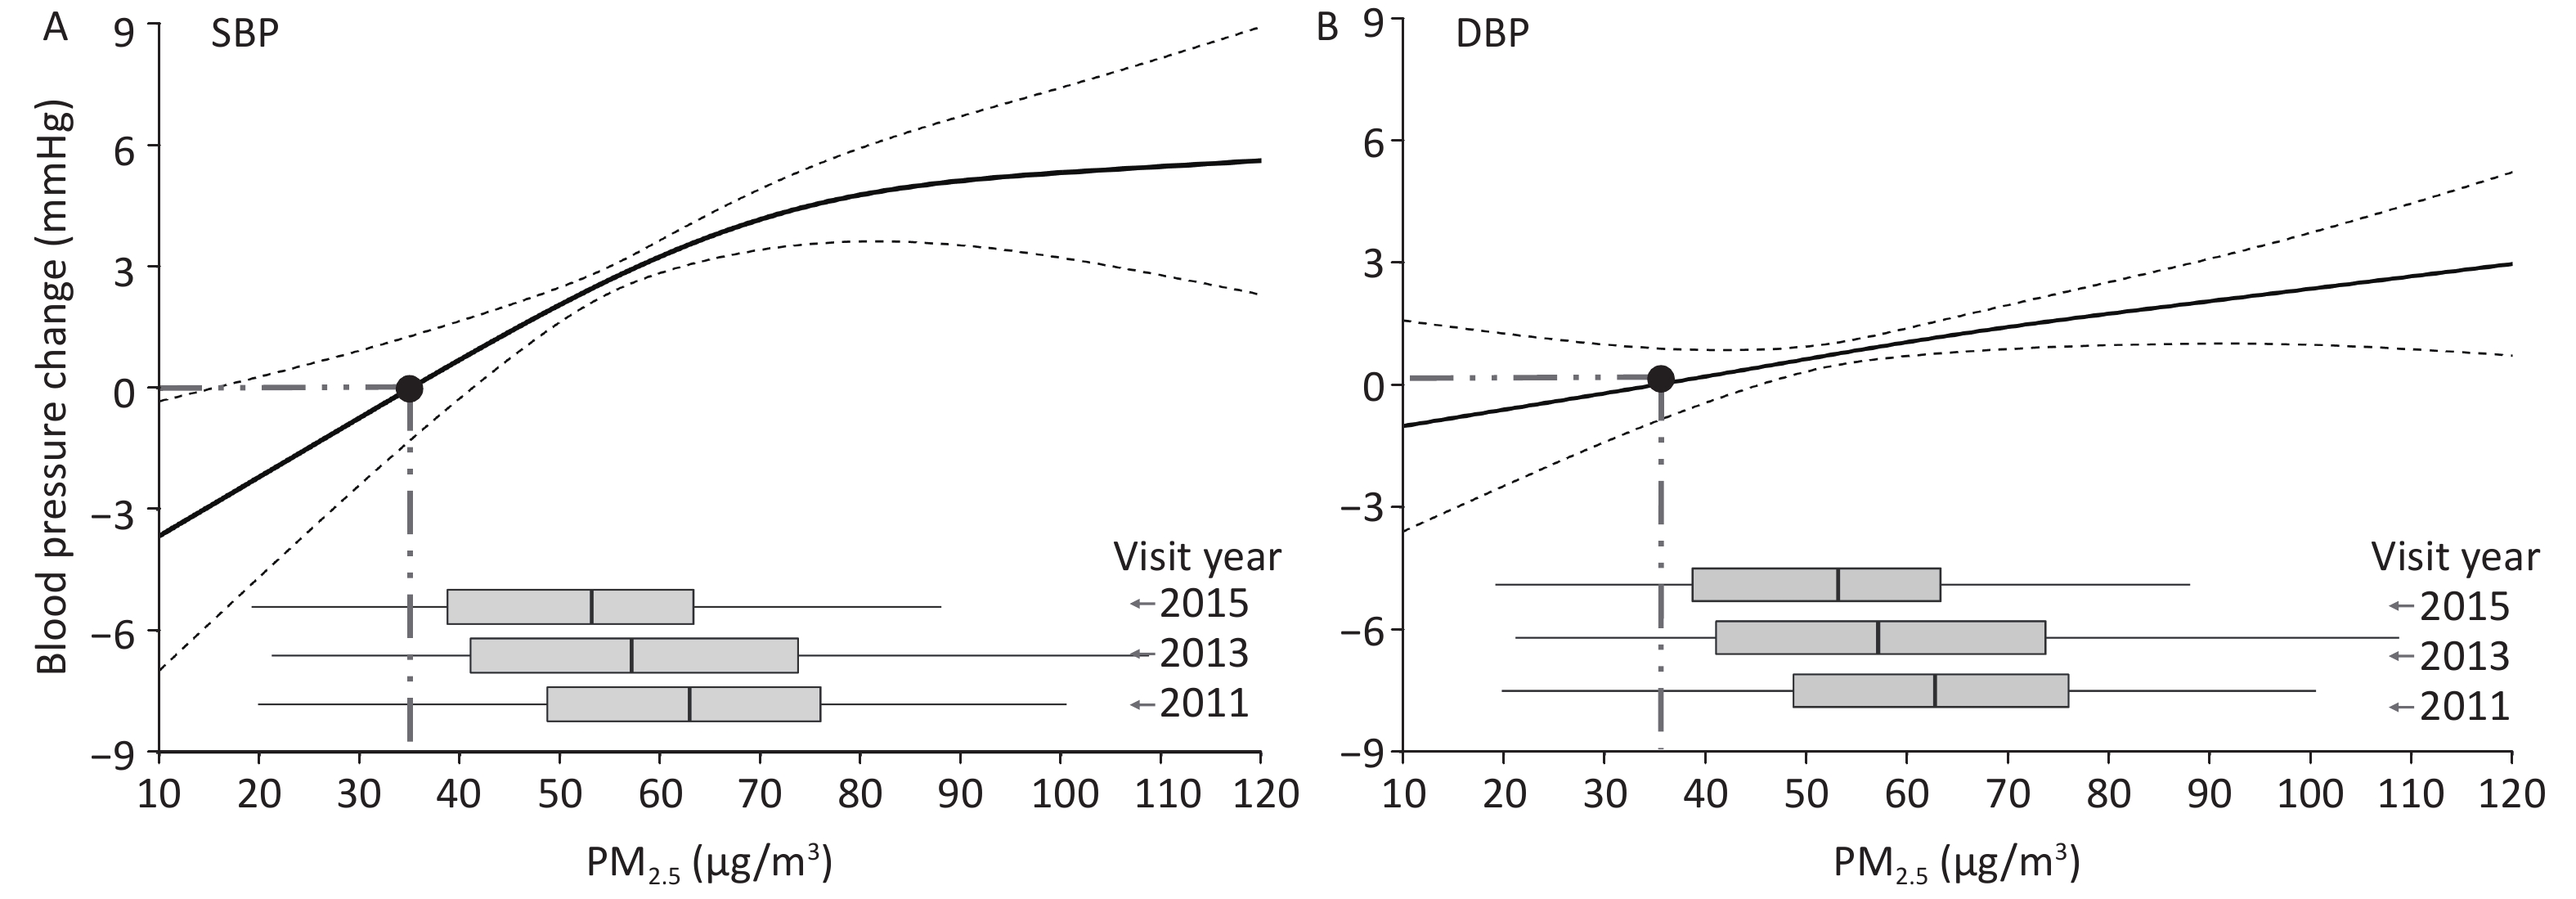
We further used the generalized additive mixed model to evaluate the relative BP at different FPM1Y concentrations, referring to the BP at an FPM1Y concentration of 35 µg/m3. SBP increased non-linearly with increasing FPM1Y concentration, but an approximate linear range was observed when the FPM1Y concentration was < 70 µg/m3 (Figure 2A). DBP increased approximately linearly with the increase in FPM1Y without a clear peak (Figure 2B). The slope of the regression curve of SBP with increasing FPM1Y was larger than that of DBP.
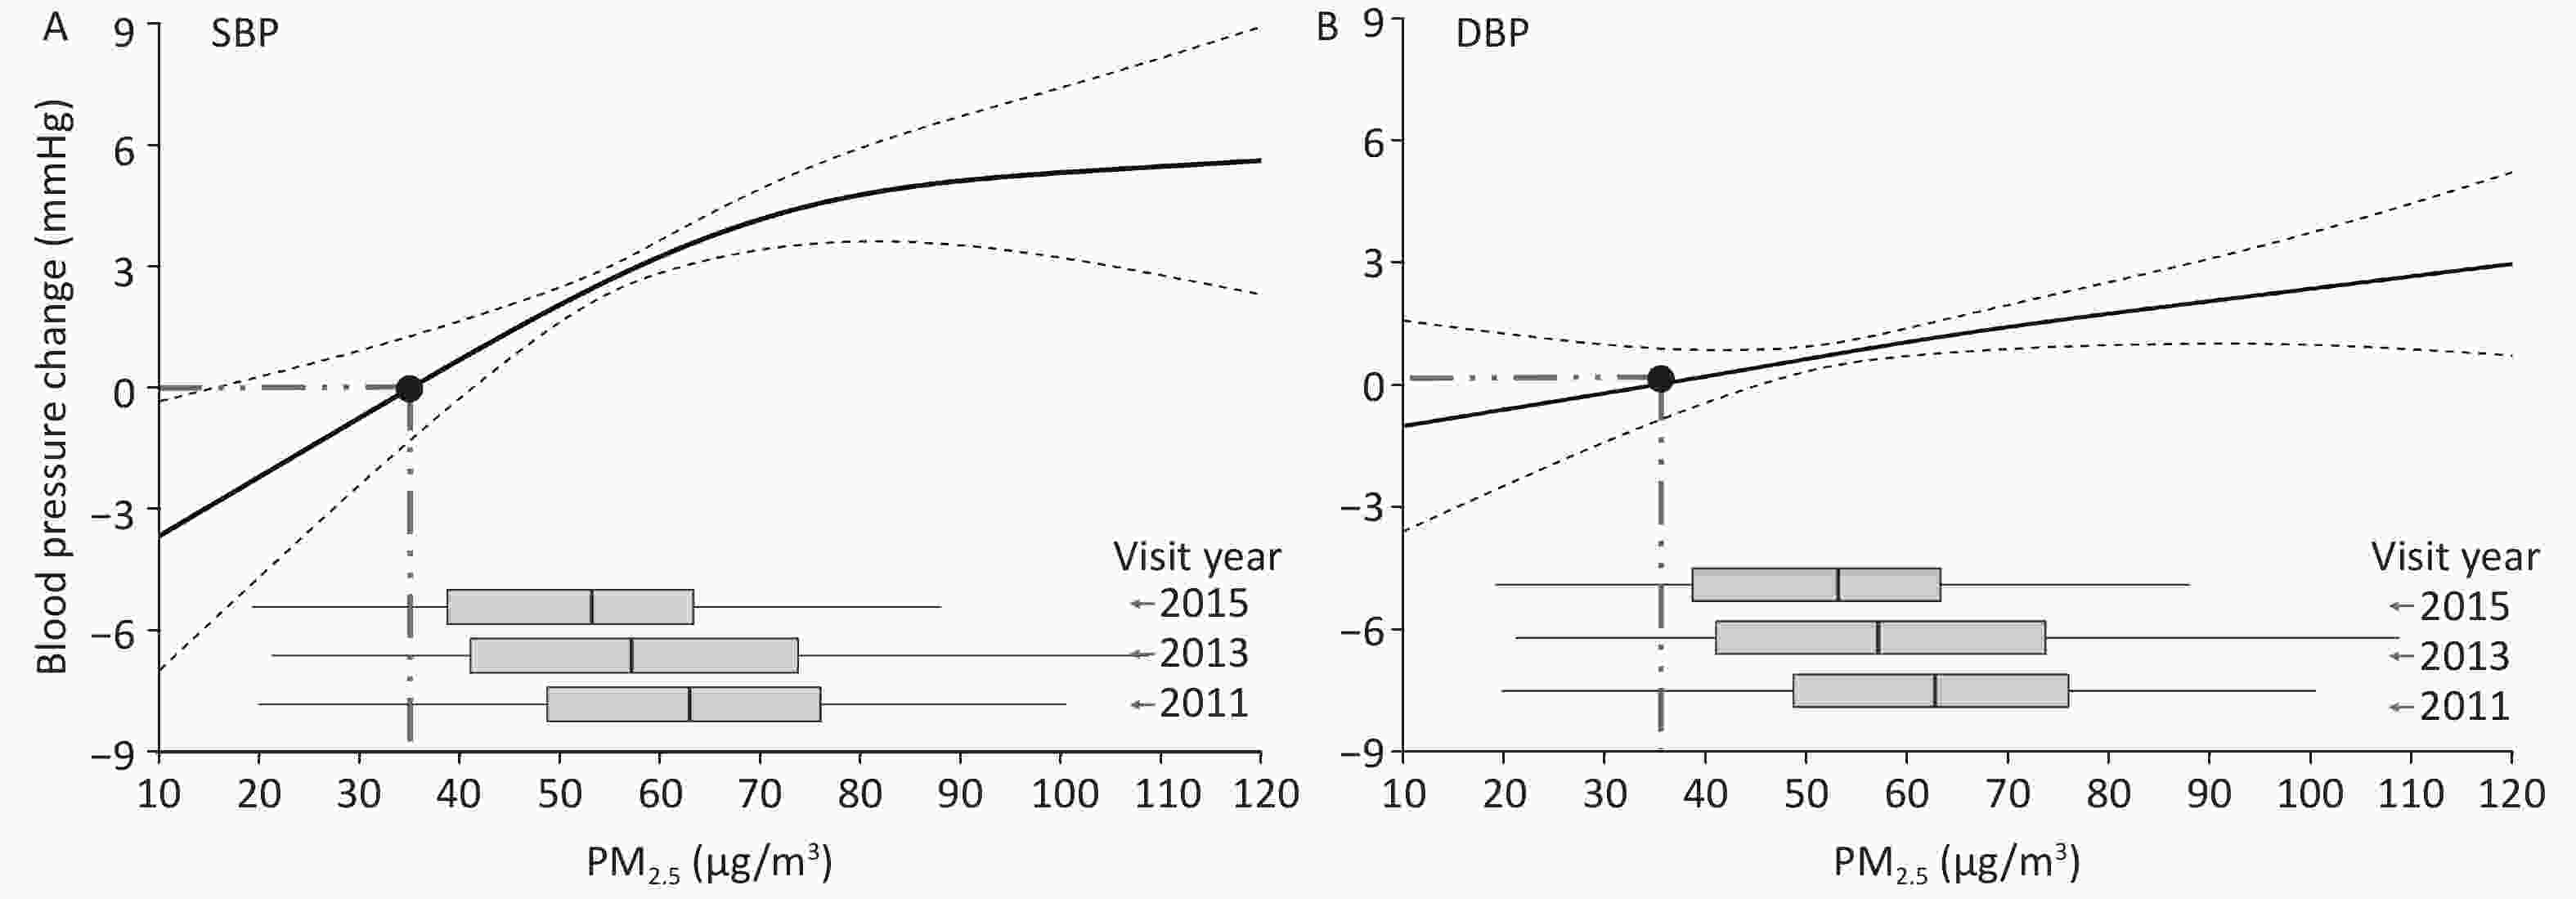
Figure 2. Non-linear association between average FPM1Y and systolic (A) and diastolic (B) blood pressures, with inclusion of the same covariates in model III. DBP: diastolic blood pressure; PM2.5: fine particulate matter; SBP: systolic blood pressure.
-
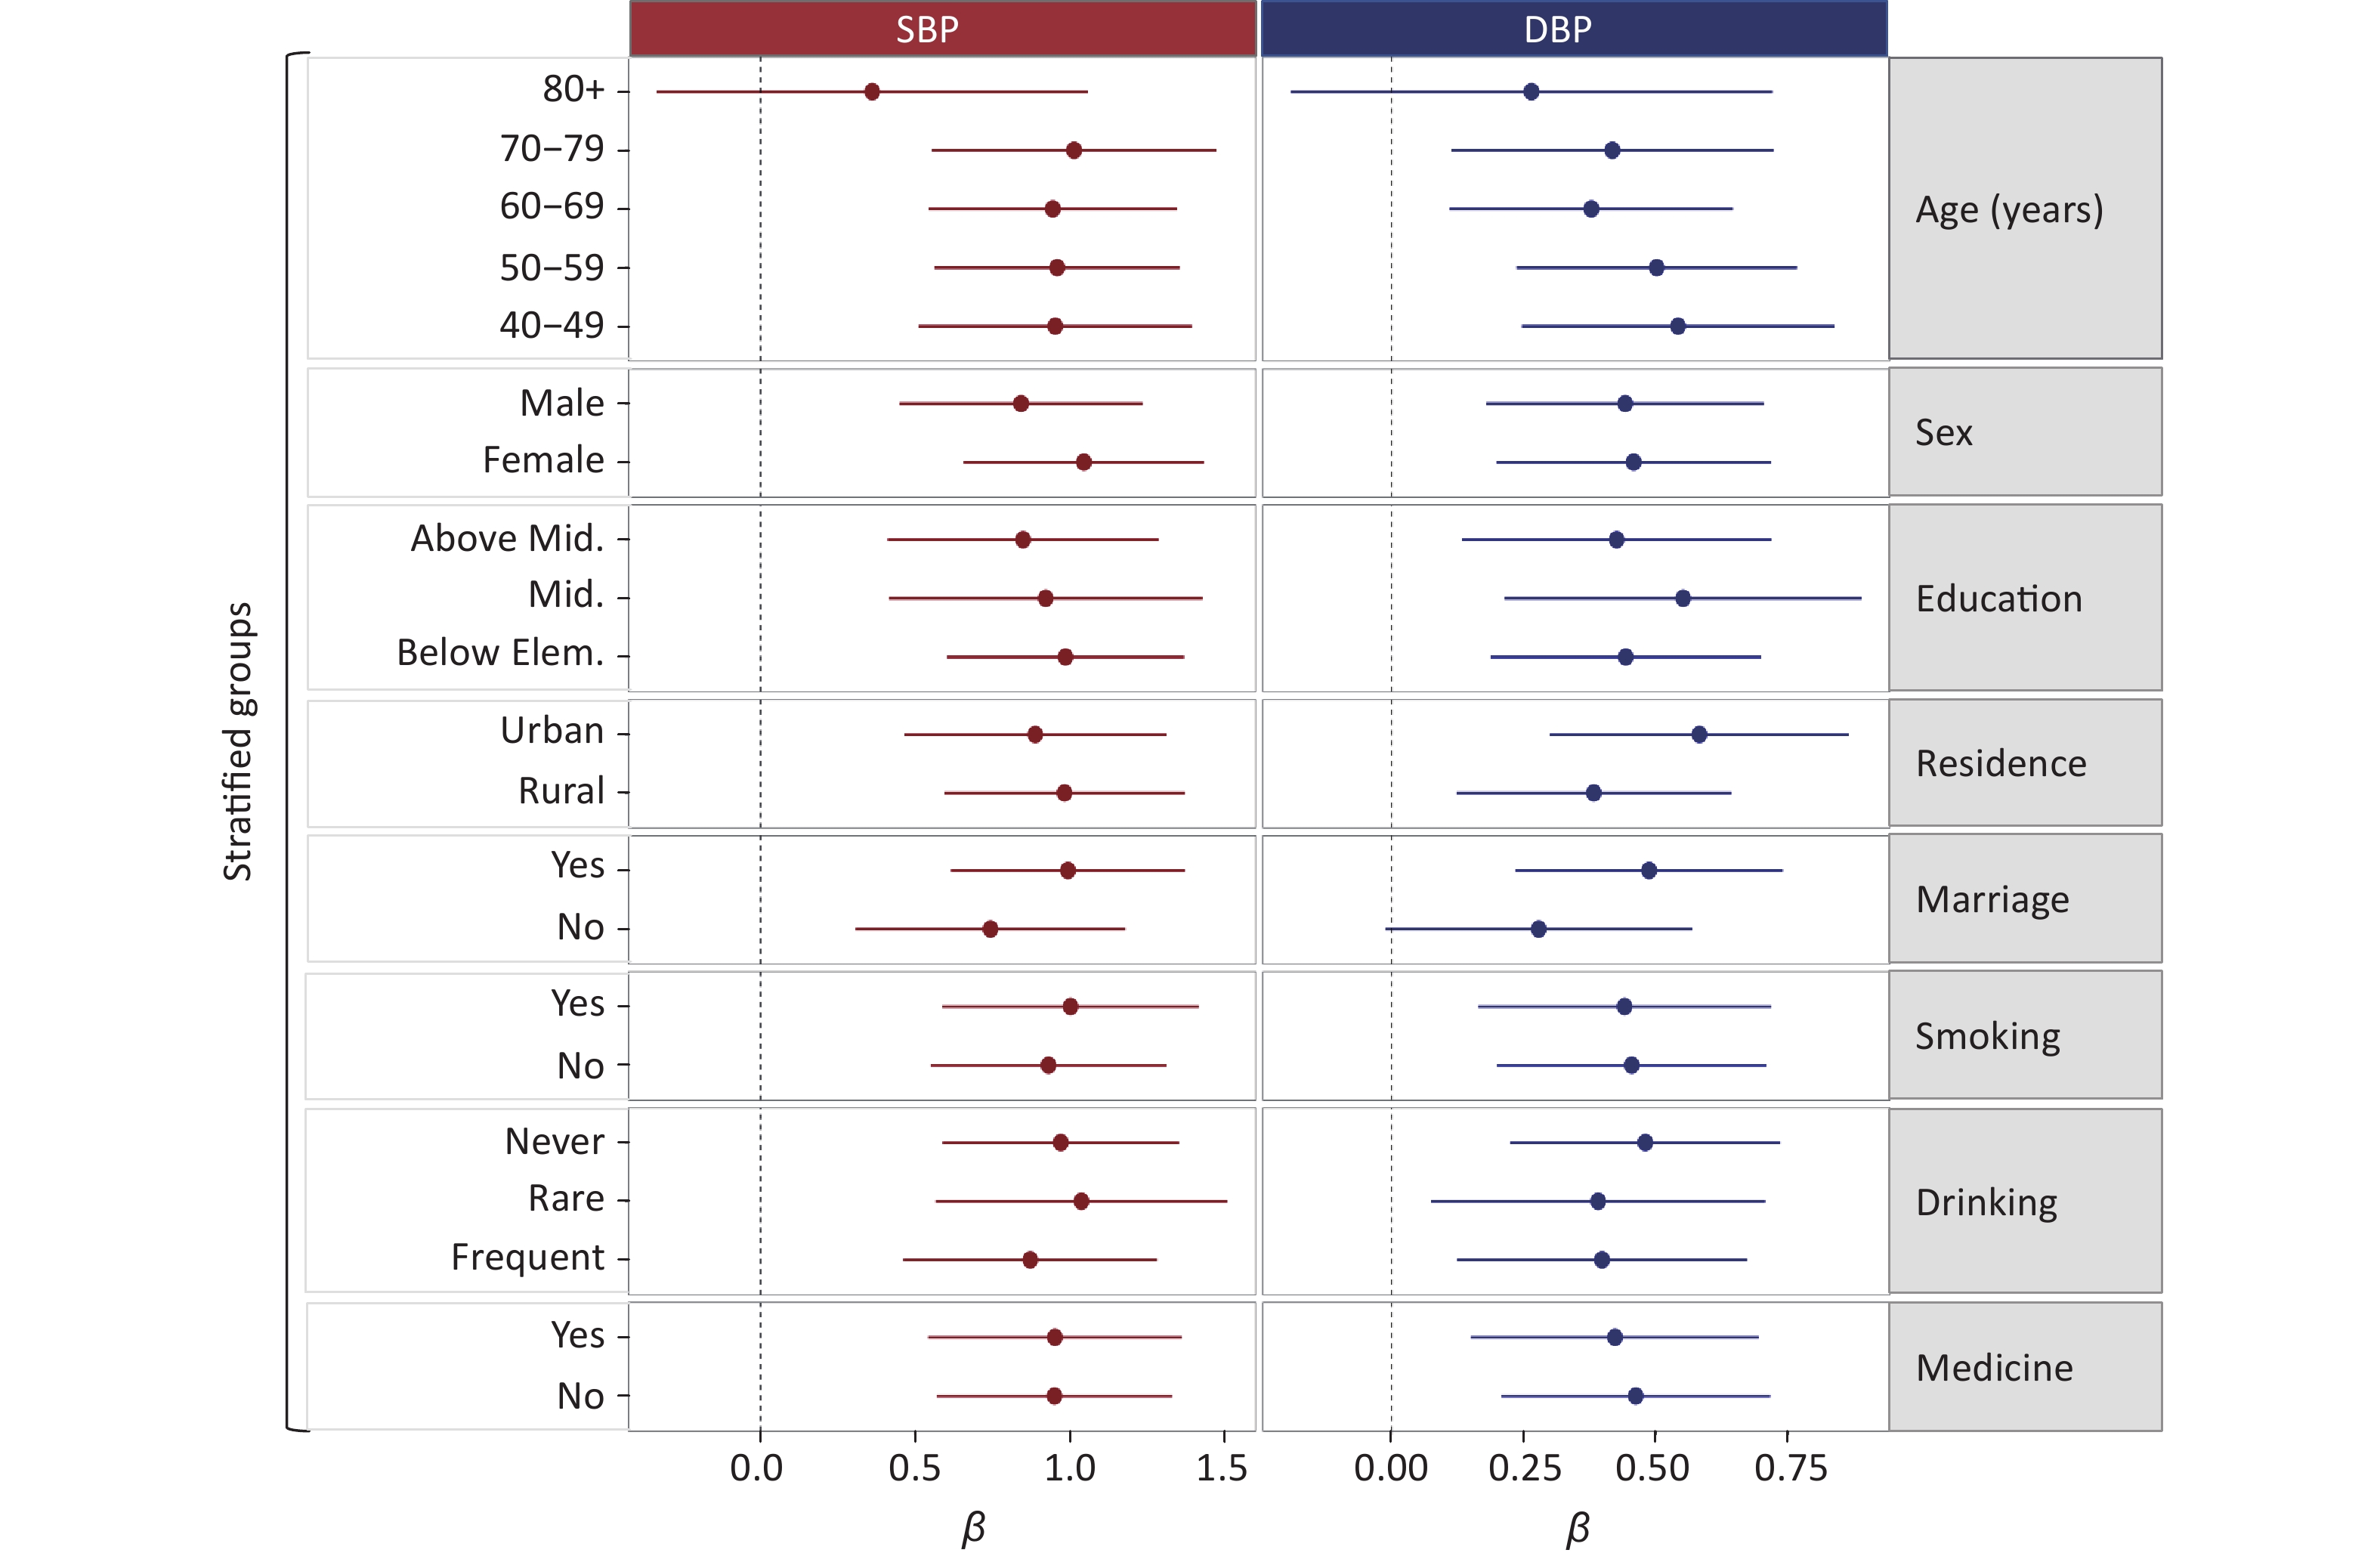
A stratified analysis was performed to investigate the association between FPM1Y and BP under different levels or grades of various confounders (i.e., medication, age, residence, gender, marriage, smoking, alcohol consumption, education, and heating fuel) (Figure 3). The estimated associations between PM2.5 and BP did not vary significantly after inclusion of most confounders. For DBP, the association between FPM1Y and DBP was greater in urban residents than rural residents without adjustment of the P-value by the FDR method. In addition, a greater association was found in married participants than in single participants. These results suggested that residence and marital status may modify the association between FPM1Y and DBP. However, no significant modification effects of various confounders were observed in the association between FPM1Y and DBP after adjustment of the P-value by the FDR method. For SBP, the association between FPM1Y and SBP was greater in women than men without adjustment by the FDR method (Figure 3). Like DBP, no significant modification effects of various confounders were found after adjustment of the p-value by the FDR method. The detailed results are provided in Supplementary Table S2, available in www.besjournal.com. To test the robustness of the effect, we performed two additional sensitivity analyses. First, we excluded all participants who used anti-hypertension treatment, to test the robustness of the effect. The detailed results are provided in Supplementary Table S3 (available in www.besjournal.com) and were overall consistent with the dataset in Table 2. The association strength between ambient PM2.5 concentration and blood pressure after exclusion of participants taking anti-hypertension medicine was lower than that with inclusion of all participants. Second, because the amount of missing data was relatively small, we deleted the missing data to perform the analysis. After deletion of the missing data, the number of participants decreased to 11,479. For this population, the association between the PM2.5 exposure and blood pressure is provided in Supplementary Table S4, available in www.besjournal.com. The results were consistent with the main analysis dataset in Table 2.
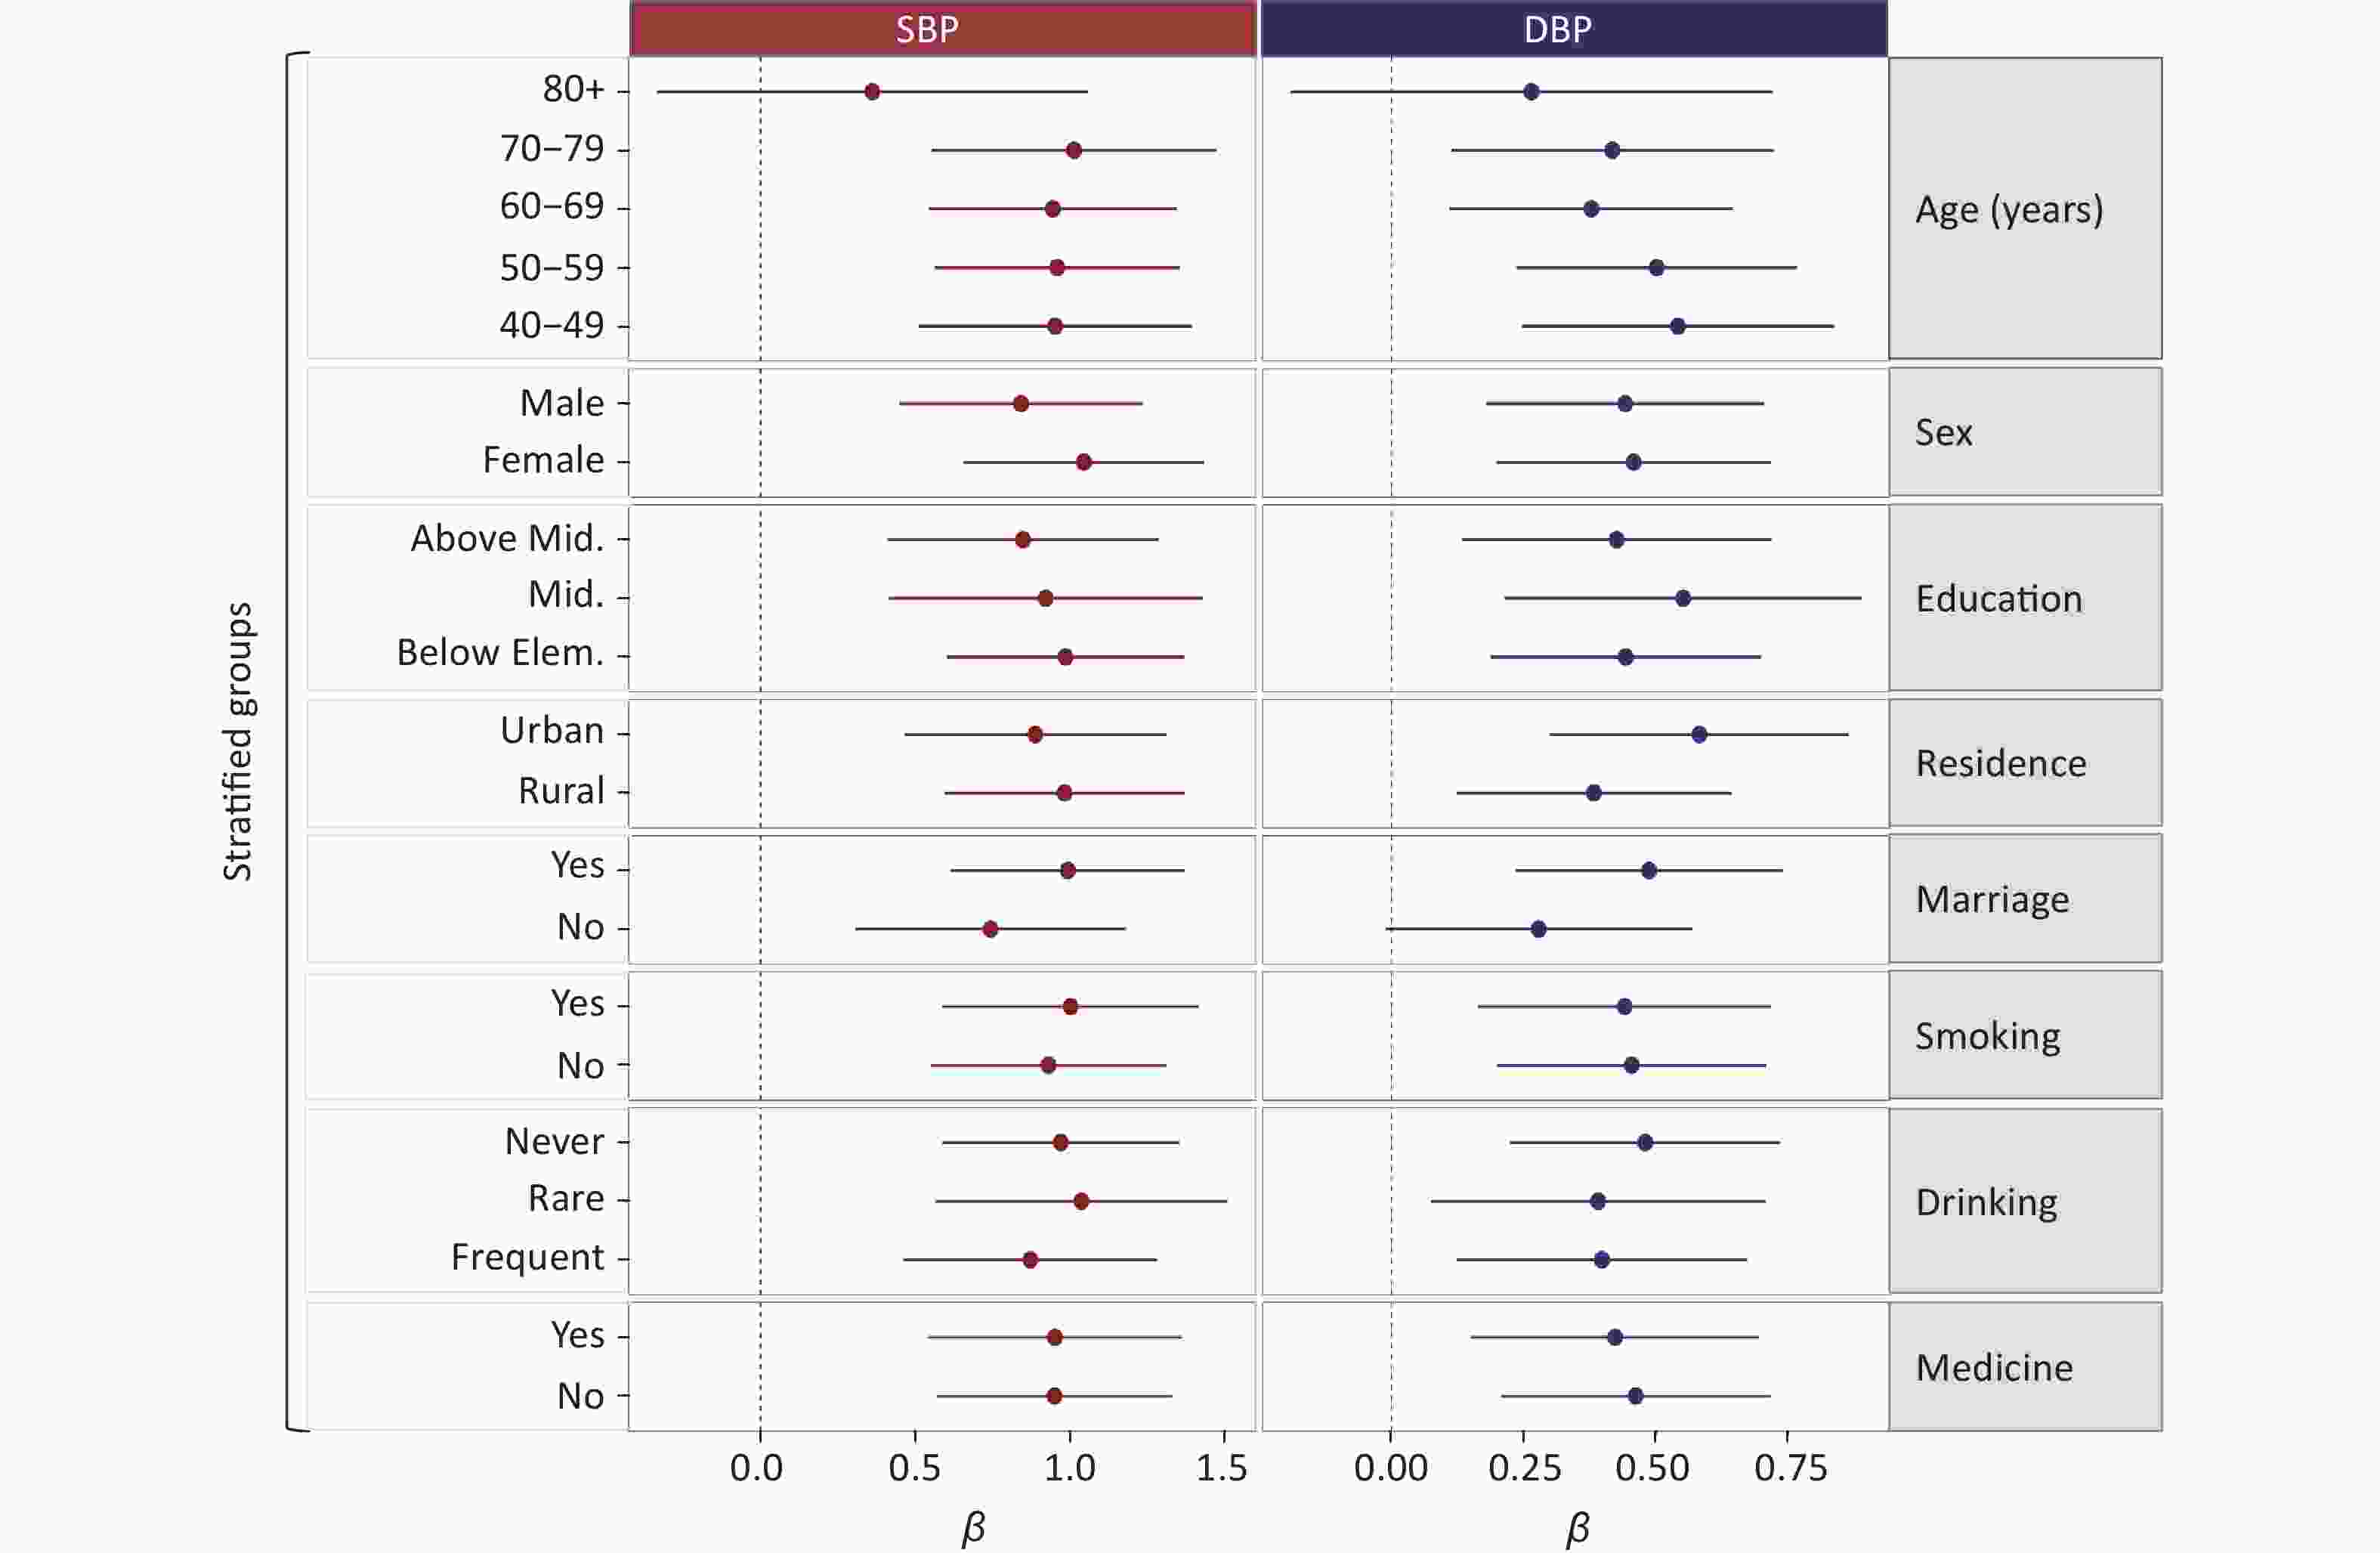
Figure 3. Associations between average PM2.5 concentration over the past one year and blood pressure, with model III. DBP: diastolic blood pressure; PM2.5: fine particulate matter; SBP: systolic blood pressure; Mid.: middle; Elem.: elementary.
-
In this study, we investigated the effect of PM2.5 exposure on BP by using data from the ongoing large population follow-up program in China. The estimated association remained robust after adjustment for a wide range of confounders. Nonlinear regression verified that the decreasing trend in BP with decreases in PM2.5 was almost linear. However, the effect of FPM1Y on SBP showed a threshold at approximately 70 µg/m3. Overall, our study supports the hypothesis that decreasing PM2.5 is significantly associated with a decrease in BP.
Several cross-sectional studies have examined the relationship between PM2.5 exposure and BP. Li et al. have reported a positive association between long-term exposure to air pollution and both SBP and DBP, in a cross-sectional study of 39,207 participants in Henan Province, China [47]. Xie et al. have observed increases of 0.569 (95% CI: 0.564–0.573) mmHg in SBP and 0.384 (95% CI: 0.381–0.388) mmHg in DBP with a 10 µg/m3 increase in PM2.5 above 47.9 µg/m3, in a study conducted among 39 million people across 2,790 counties of 31 provinces in China [17]. These previous cross-sectional studies have provided valuable evidence of the relationship between PM2.5 and BP. In addition, several cohort studies have examined this relationship. For example, Zhang et al. have reported positive associations of PM2.5 exposure with both SBP and DBP in their cohort study of 361,560 participants in Taiwan [26]. Adar et al. have reported decreases in pollution and BP over time among 5,527 older adults in a long-term follow-up prospective cohort [48]. Overall, these cohort or cross-sectional studies have provided evidence of the positive associations between PM2.5 and BP. Overall, the findings in our study were consistent with those in the previous reports. However, our study provided more valid evidence, given the study method and exposure scenario. Repeated measurement studies are well known to have a greater ability to verify causality than cross-sectional studies, and are a widely used study design in environmental epidemiology. However, such studies are difficult to conduct in large-scale populations, owing to the high cost and requirement for frequent visits. The sample sizes of previous repeated measurement studies on the relationship between PM2.5 and BP have comprised fewer than several hundred participants, to our knowledge [22,48,49]. Therefore our repeated measurement study from the CHARLS survey, including a large sample size of 14,080 participants with at least two valid visits, used a highly advantageous design.
Likewise, we chose an exposure scenario of these populations with the historically strict enforcement of air pollution prevention and control plan in China. This quasi-experimental study provided a unique opportunity to test our hypothesis. Many countries have mitigated air pollution in the past decades, and the benefits of decreasing the prevalence of hypertension and other outcomes in populations have been documented [49-51]. For example, a previous study has observed an association between mitigation of long-term PM2.5 exposure and a lower risk of hypertension among adults in Taiwan during 2001–2014 [51]. Huang et al. have discovered the potential benefits of air pollution control in urban China under several air quality improvement scenarios. They have reported that a mean PM2.5 decrease to Beijing Olympic levels by 2030 would provide a gain of approximately 241,000 (95% uncertainty interval, 189,000–293,000) life-years annually [52]. Wang et al. have estimated the PM2.5-associated disease burden by using models of virtual scenarios, and have reported that ameliorating air pollution would decrease the number of PM2.5-associated premature deaths in China [53]. Our study examined the benefits of improving air quality on BP and indicated a stronger causal association under a natural scenario of policy-driven air quality improvement in China.
We also used a nonlinear regression model to verify that BP increased linearly with the increase in FPM1Y when the FPM1Y concentration was < 70 µg/m3. Notably, a threshold was observed for the relationship between FPM1Y and SBP. In contrast, a repeated-measures study conducted in China has reported that both SBP and DBP increase linearly with PM2.5 concentrations < 50 µg/m3. A threshold in the dose-response curve between PM2.5 and SBP, as well as DBP, has been reported [54]. Fan et al. had reported a J-shaped concentration-response curve for the relationship between PM2.5 and SBP by using a generalized additive mixed model. They have observed remarkable increases in SBP when PM2.5 concentrations were > 100 µg/m3 but no significant changes in SBP at PM2.5 concentrations < 100 µg/m3[55]. A cross-sectional study of 4,121 older people in the United States has analyzed the dose-response curve between PM2.5 and SBP. The study has reported that SBP increases approximately linearly with increasing PM2.5 without a clear threshold [56], possibly because of the relatively lower average PM2.5 concentration of 10.4 µg/m3. Overall, thresholds have been observed in various studies, and their values may be population-dependent.
Without adjustment of the statistical results by the FDR method, the effect of PM2.5 on DBP was stronger in urban participants than rural participants. In addition, the effect of PM2.5 on DBP appeared to be stronger in the married population than the single population. A similar phenomenon has been observed in a nationwide cross-sectional study among 17,708 participants in China. In that study, the effects of PM2.5 on hypertension prevalence were stronger among middle-aged, obese, and urban participants [15]. One possible explanation for these findings is that the PM2.5 composition differs between rural and urban areas. For example, automobile exhaust and coal combustion are generally contributors in urban areas [57], whereas residential solid fuel burning is an important pollution source in rural areas. Meng et al. have summarized the contributions of non-residential and residential activities to ambient PM2.5 concentrations. They have reported that, in rural areas, the PM2.5 levels in indoor air (95 ± 34 μg/m3) were significantly higher than those in urban indoor air (58 ± 23 μg/m3), because of the strong dependence of rural residents on solid fuels. In contrast, ambient PM2.5, which was mainly from non-residential sources, was higher in urban (45 ± 19 μg/m3) than rural areas (22 ± 15 μg/m3) [58]. Interestingly, the married population was more sensitive to the adverse effects of PM2.5 on BP. Previous studies have reported that married and single people experience different economic conditions, living habits, and psychosocial stress [59, 60]. Li et al. have determined that the effect of PM2.5 on BP is modified by behavioral factors, including tobacco smoking, alcohol consumption, a high-fat diet, and frequent physical activity [27, 61]. In our study, the average age, as well as the proportions of participants with high frequencies of tobacco smoking and alcohol consumption, were higher in single participants than married participants. That is, age and living habits (smoking and alcohol consumption) may play more important roles in single than in married people, and thus BP in the married population might be more sensitive to PM2.5 exposure. However, these results cannot be well explained with the current data, and more evidence from additional studies remains needed. In addition, the effects of ambient PM2.5 concentration on blood pressure were lower after exclusion of the participants taking anti-hypertension medicine rather than including all participants. This finding suggested that the effects of medicine should be excluded in the risk evaluation of PM2.5 on blood pressure to support future policy-making.
Our study has four important limitations. First, the PM2.5 exposure assessment was based on historical estimates; we did not conduct exact personal exposure measurements, nor did we have information on indoor air quality. This uncertainty in the PM2.5 concentration might have led to exposure misclassifications and biased the results. Similarly, coarseness in the exposure assessment because of the lack of addresses might also have led to exposure misclassification, although previous studies have used a similar method, e.g., a prospective cohort study in six U.S. cities has measured air pollution data in each community at a centrally located air-monitoring station [62]. Second, no strict mathematical definition of the threshold was used; thus, this threshold should be well-defined in meta-analyses in the future. Third, some other important exposure variables, such as noise, air pollution components, body mass index, physical inactivity, diet, and salt intake were missing in the CHARLS database; therefore, we could not distinguish their contribution to the blood pressure, although these aspects should be considered from the perspective of human exposome [63]. However, to our knowledge, our study has examined the largest population to date in an investigation of the effect of PM2.5 on BP through a repeated measurement study design in China. In particular, our study results provide direct evidence of the protective effects of improved air quality on blood pressure. Further studies are warranted to confirm our conclusions.
-
We concluded that decreasing long-term PM2.5 exposure is associated with a decrease in BP among middle-aged and older residents in China. Our findings provide an important perspective in improving cardiovascular health through air pollution control and should provide a reference for related air quality improvement.
-
Conceptualization, JIANGTULU Bahabaike and WANG Bin; methodology, JIANGTULU Bahabaike and WANG Bin; software, JIANGTULU Bahabaike, WANG Bin, and CHEN Xi; validation, JIANGTULU Bahabaike, LAN Chang Xin, XUE Tao, and WANG Bin; formal analysis, JIANGTULU Bahabaike, LAN Chang Xin, CHEN Jun Xi, XUE Tao, and WANG Bin; investigation, JIANGTULU Bahabaike; resources, XUE Tao and WANG Bin; data curation, XUE Tao and WANG Bin; writing—original draft preparation, JIANGTULU Bahabaike; writing—review and editing, LAN Chang Xin, WANG Bin, and CHEN Xi; visualization, JIANGTULU Bahabaike and WANG Bin; supervision, XUE Tao and WANG Bin; project administration, XUE Tao and WANG Bin. All authors have read and agreed to the published version of the manuscript.
-
Informed consent was obtained from all participants involved in the study.
-
We thank the researchers from the environmental exposure and human health working group of the China Cohort Consortium (
http://chinacohort.bjmu.edu.cn/ ) for providing suggestions. -
The authors declare no conflicts of interest.
Model PM Conc.e β (95% CI)a Systolic blood pressure Diastolic blood pressure Model Ib FPM1Y 0.868 (0.576, 1.161) 0.354 (0.169, 0.539) FPM2Y 1.289 (0.818, 1.760) 0.675 (0.377, 0.973) Model IIc FPM1Y 1.266 (0.865, 1.667) 0.513 (0.260, 0.766) FPM2Y 1.558 (0.966, 2.150) 0.853 (0.479, 1.226) Model IVd FPM1Y 1.180 (0.777, 1.584) 0.513 (0.258, 0.768) FPM2Y 1.460 (0.864, 2.055) 0.835 (0.459, 1.211) Note. aBlood pressure change based on each 10 µg/m3 change of ambient PM2.5 concentration (Conc.); bModel I: BP = β × PM2.5 + β1-2 × CF1-2 + γ1(S) + γ2(H). This model incorporated fixed terms with the β coefficients of PM2.5, β1-2 of potential confounders (CF1-2: city and medication), as well as a random intercept for each subject γ1(S) and each household γ2(H); cModel II: BP = β × PM2.5 + β1-4 × CF1-4 + γ1(S) + γ2(H). This model incorporated fixed terms with the β coefficients of PM2.5, β1-4 of potential confounders (CF1-4: city, medication, temperature, and age), as well as a random intercept for each subject γ1(S) and each household γ2(H); dModel IV: BP = β × PM2.5 + β1-16× CF1-16 + γ1(S) + γ2(H). This model incorporated fixed terms with β coefficients of PM2.5, β1-16 of potential confounders (CF1-16: CF1-10, temperature maintenance of household, heating fuel, living in a multi-story building or not, renting a house, untidiness of the household, and telephone usage), as well as a random intercept for each subject γ1(S) and each household γ2(H); e verage fine particulate matter (FPM) concentration over the past time period before the survey, FPM1Y: average PM2.5 concentration in the past one year; FPM2Y: average PM2.5 concentration in the past two years. Table S1. Associations between ambient fine particulate matter (FPM or PM2.5) concentrations and blood pressure
Group Systolic blood pressure Diastolic blood pressure β* P-value† β P-value† Age (years) 40–49 1.208 0.314 0.587 0.716 50–59 1.223 0.563 60–69 1.220 0.419 70–79 1.443 0.465 > 80 0.509 0.308 Gender Female 1.046 0.270 0.512 0.858 Male 0.843 0.487 Education Below elementary 1.314 0.229 0.487 0.762 Above middle 1.196 0.586 Elementary & middle 1.006 0.503 Residence Rural 1.229 0.753 0.433 0.186 Urban 1.258 0.631 Marriage No 1.067 0.355 0.315 0.088 Yes 1.276 0.540 Smoking No 1.223 0.669 0.506 0.727 Yes 1.280 0.488 Drinking Frequent 1.064 0.274 0.448 0.886 Never 1.297 0.524 Rare 1.332 0.487 Medication No 1.197 0.292 0.512 1.003 Yes 1.342 0.471 Note. *Blood pressure change based on each 10 µg/m3 change of ambient PM2.5 concentration; †P-value of the analysis of variance. Table S2. Associations between fine particulate matter (PM2.5) concentrations in the year before the survey and blood pressure
Model PM Conc.e β (95% CI)a Systolic blood pressure Diastolic blood pressure Model Ib FPM1Y 0.200 (-0.115, 0.514) 0.023 (-0.192, 0.238) FPM2Y 0.388 (-0.123, 0.898) 0.204 (-0.145, 0.552) Model IIc FPM1Y 0.943 (0.511, 1.376) 0.379 (0.085, 0.673) FPM2Y 1.299 (0.658, 1.941) 0.720 (0.285, 1.156) Model IIIf FPM1Y 0.895 (0.463, 1.328) 0.357 (0.063, 0.65) FPM2Y 1.226 (0.585, 1.867) 0.680 (0.244, 1.116) Model IVd FPM1Y 0.819 (0.383, 1.255) 0.353 (0.057, 0.648) FPM2Y 1.139 (0.494, 1.785) 0.654 (0.216, 1.092) Note. aBlood pressure change based on each 10 µg/m3 change of ambient PM2.5 concentration (Conc.); bModel I: BP = β × PM2.5 + β1 × CF1 + γ1(S) + γ2(H). This model incorporated fixed terms with the β coefficients of PM2.5, β1-2 of potential confounders (CF1: city), as well as a random intercept for each subject γ1(S) and each household γ2(H); cModel II: BP = β × PM2.5 + β1-3 × CF1-3 + γ1(S) + γ2(H). This model incorporated fixed terms with the β coefficients of PM2.5, β1-4 of potential confounders (CF1-3: city, temperature, and age), as well as a random intercept for each subject γ1(S) and each household γ2(H); fModel III: BP = β × PM2.5 + β1-9 × CF1-9 + γ1(S) + γ2(H). This model incorporated fixed terms with the β coefficients of PM2.5, β1-10 of potential confounders (CF1-9: CF1-4, residence, gender, education, marriage, smoking, and drinking alcohol), as well as a random intercept for each subject γ1(S) and each household γ2(H); dModel IV: BP = β × PM2.5 + β1-15 × CF1-15 + γ1(S) + γ2(H). This model incorporated fixed terms with β coefficients of PM2.5, β1-16 of potential confounders (CF1-15: CF1-10, temperature maintenance of household, heating fuel, living in a multi-story building or not, renting a house, untidiness of the household, and telephone usage), as well as a random intercept for each subject γ1(S) and each household γ2(H); eAverage fine particulate matter (FPM) concentration over the past time period before the survey, FPM1Y: average PM2.5 concentration in the past one year; FPM2Y: average PM2.5 concentration in the past two years. Table S3. Associations between ambient fine particulate matter (FPM or PM2.5) concentrations and blood pressure, excluding participants taking anti-hypertension medicine
Model PM Conc.e β (95% CI)a Systolic blood pressure Diastolic blood pressure Model Ib FPM1Y 0.864 (0.553, 1.176) 0.292 (0.096, 0.489) FPM2Y 1.234 (0.729, 1.738) 0.529 (0.211, 0.848) Model IIc FPM1Y 1.126 (0.695, 1.556) 0.368 (0.096, 0.639) FPM2Y 1.305 (0.667, 1.942) 0.604 (0.203, 1.006) Model IIIf FPM1Y 1.101 (0.670, 1.532) 0.355 (0.083, 0.627) FPM2Y 1.276 (0.639, 1.913) 0.586 (0.184, 0.988) Model IVd FPM1Y 1.066 (0.633, 1.499) 0.391 (0.118, 0.664) FPM2Y 1.259 (0.619, 1.899) 0.627 (0.224, 1.030) Note. a Blood pressure change based on each 10 µg/m3 change of ambient PM2.5 concentration (Conc.); bModel I: BP = β × PM2.5 + β1 × CF1 + γ1(S) + γ2(H). This model incorporated fixed terms with the β coefficients of PM2.5, β1-2 of potential confounders (CF1: city), as well as a random intercept for each subject γ1(S) and each household γ2(H); cModel II: BP = β × PM2.5 + β1-3 × CF1-3 + γ1(S) + γ2(H). This model incorporated fixed terms with the β coefficients of PM2.5, β1-4 of potential confounders (CF1-3: city, temperature, and age), as well as a random intercept for each subject γ1(S) and each household γ2(H); fModel III: BP = β × PM2.5 + β1-9 × CF1-9 + γ1(S) + γ2(H). This model incorporated fixed terms with the β coefficients of PM2.5, β1-10 of potential confounders (CF1-9: CF1-4, residence, gender, education, marriage, smoking, and drinking alcohol), as well as a random intercept for each subject γ1(S) and each household γ2(H); dModel IV: BP = β × PM2.5 + β1-15 × CF1-15 + γ1(S) + γ2(H). This model incorporated fixed terms with β coefficients of PM2.5, β1-16 of potential confounders (CF1-15: CF1-10, temperature maintenance of household, heating fuel, living in a multi-story building or not, renting a house, untidiness of the household, and telephone usage), as well as a random intercept for each subject γ1(S) and each household γ2(H); eAverage fine particulate matter (FPM) concentration over the past time period before the survey, FPM1Y: average PM2.5 concentration in the past one year; FPM2Y: average PM2.5 concentration in the past two years. Table S4. Associations between ambient fine particulate matter (FPM or PM2.5) concentrations and blood pressure after deletion of missing data
HTML
Population Recruitment
Ambient PM2.5 Concentrations
Statistical Analyses

Population Characteristics
Association between PM2.5 Exposure and BP
Stratified Analysis
 22085Supplementary Materials.pdf
|

|

 Quick Links
 DownLoad: