

 下载:
下载:

-
Enterobacter cloacae (E. cloacae) is a facultatively anaerobic gram-negative bacillus belonging to the Enterobacteriaceae family. This microorganism can be widely found in nature and in saprophytic environments (e.g., soil and sewage); this microbe is also part of the commensal enteric flora of the human gastrointestinal tract. In recent decades, E. cloacae has emerged as a nosocomial pathogen with clinical significance in hospitals[1-6]. In previous work, sequencing of the heat shock protein 60 gene (hsp60) has been helpful for the phylogenetic analysis of Enterobacter. Using hsp60 genotyping, E. cloacae was divided into 12 genetic clusters (cluster Ⅰ-Ⅻ) and an unstable sequence cluster (cluster XⅢ)[7]. It is reported that different genetic clusters of E. cloacae result in different pathological outcomes[8-13]. However, there is no fast and effective method to identify the genetic clusters of E. cloacae from clinical specimens. The BioMerieux biochemical identification system usually confuses E. cloacae with Klebsiella (pneumoniae/oxytoca) or other species from clinical environments. 16S rDNA sequencing could only identify E. cloacae at the species level and is very time consuming and expensive.
Peptide mass fingerprinting (PMF) based on Matrix-Assisted Laser Desorption/Ionization Time-of-Flight Mass Spectrometry (MALDI-TOF MS) is very useful for the identification of a variety of microorganisms[14-17]. Beginning with whole cells, cell lysates, or crude bacterial extracts, the acquired fingerprint spectrum (including signal intensity and mass-to-charge ratio) shows species-specific patterns in cultures grown for a wide range of times using a variety of growth conditions. Through comparison of the acquired spectra with a corresponding reference library, the bacteria can be identified within minutes by analysing the data using various algorithms. With accuracy and automation, high-throughput methods make PMF superior to conventional identification techniques that are based on genome-based identification schemes and biochemical methods[18]. This study aimed to assess the performance of PMF in the identification and subtyping of E. cloacae. PMF data from 86 defined strains were analysed using Biotyper 2.0 software. A new reference database (NRD) and a super reference database (SRD) (including the common characteristics of NRD) were constructed and evaluated. Based on the peptide-mass fingerprints, we created a main spectra projection (MSP) dendrogram and analysed the dendrogram for specific peaks that could be used for the identification and subtyping of E. cloacae.
-
Eighty-six isolates belonging to 10 genetic clusters of E. cloacae, which were isolated from patients in different hospitals, were used in the study (Table 1). Each genetic cluster contained 2 to 16 isolates. A reference strain (ATCC 13047) was also included. All isolates were characterized for clonality using pulsed-field gel electrophoresis and subtyped using hsp60 genotyping[7, 19, 20]. Because no strain from clusters Ⅶ, Ⅹ, and Ⅻ was isolated from the clinical samples, our study did not contain these three genetic clusters.
Table 1. Enterobacter cloacae Strains Isolated from China
Cluster No. of strains Source Province Year I 10 SP (9), Ur (1) HB, HLJ 2011, 2012, 2013 Ⅱ 7 SP (3), Ur (1), SC (1), BI (2) HB, HLJ, SX 2010, 2011, 2012, 2013 Ⅲ 14 SP (7), Ur (1), SC (5), BL (1) HB, HLJ 2011, 2012 Ⅳ 5 SP (3), BI (1), OT (1) HB, HLJ 2011, 2012, 2013 V 6 SP (3), SC (2), BI (1) HB, HLJ 2011, 2012, 2013 Ⅵ 15 SP (8), Ur (2), SC (3), OT (2) HB, HLJ, BJ 2011, 2012, 2013 Ⅷ 16 SP (9), SC (4), BL (1), ST (2) HB, HLJ 2011, 2012 Ⅸ 5 SP (4), BL (1) HB, HLJ 2010, 2011, 2012 Ⅺ 2 SP (2) HB 2011, 2012 XⅢ 6 SP (3), BI (1), BL (1), ST (1) HB, HLJ, SX, GZ 2011, 2012, 2013 Total 86 Note.Sources: SP (sputum), UR (urine), SC (secretion), BI (bile), BL (blood culture), ST (stool), OT (others) Regions: BJ (Beijing), GZ (Guizhou), HB (Hebei), HLJ (Heilongjiang), HN (Henan), QH (Qinghai), SX (Shanxi). In this study, all strains were isolated from human patients for routine diagnostic purposes. All participants gave written informed consent. This study was approved by the ethics committee of the National Institute for Communicable Disease Control and Prevention, China CDC, according to the medical research regulations of the Ministry of Health, China [Approval No. ICDC-2014003].
-
Each strain was selected from brain-heart agar plates. After culturing at 37 ℃ for 12 h, two samples were prepared from each strain. The extraction method for sample preparation and data acquisition was in accordance with our previously described methods[16-17]. A colony was suspended in 300 μL of molecular-grade water and vortexed, and 900 μL of anhydrous ethanol was added. The samples were vortexed and centrifuged (13, 000 × g) for 2 min. The supernatant was discarded and 50 μL of 70% formic acid was added and mixed. Finally, 50 μL of acetonitrile was added, and the solution was carefully mixed. After centrifuging (13, 000 × g) for 2 min, the supernatant was the prepared sample. A Microflex LT (Bruker Daltonics) mass spectrometer was used for data acquisition. Escherichia coli strain ATCC 8739 was used for mass calibration and instrument parameter optimization. A Microflex LT instrument was equipped with an N2 laser (λ = 377 nm). The software program used for the data acquisition was FlexControl (version 3.0, Bruker Daltonics). The parameters used were as follows: mass range, 2, 000-20, 000 Da; ion source 1, 20 kV; ion source 2, 18.5 kV; lens, 8.45 kV; pulsed ion extraction, 330 ns; and laser frequency, 20.0 Hz. Each spectrum was obtained by using 100 shots, and the spectra obtained after 500 shots were superimposed to generate the total spectrum.
-
In brief, only 17 E. cloacae reference strains were present in the original reference database (ORD) of the Biotyper system. Thus, an NRD was constructed using the automated Biotyper (version 2.0) software package[21]. Thirty-four strains belonging to 10 genetic clusters of E. cloacae were added to the NRD. The parameters used were as follows: desired mass error for main spectra projection, 200; desired peak frequency minimum, 25%; max, desired peak number for the MSP: 70. For each database entry, 20 individually measured mass spectra were imported into the MSP, which perform normalization, smoothing, baseline correction and peak picking to generate a list of the most significant peaks. The program then calculates a primary spectrum containing average peak mass, peak intensity and frequency. Based on the results of the genetic cluster analysis, strains with common features were included in the SRD using the MSP function of Biotyper.
Fifty-three E. cloacae strains were used to evaluate the ORD, NRD, and SRD. For the ORD and NRD, score values > 2.300 were considered the highest recognition at the species level; score values > 2.000 were considered identified at the species level; score values of 1.700-1.999 were considered identified at the genus level; and score values < 1.700 were considered unidentified. For the SRD, score values > 1.700 were considered correctly classified[22].
-
To visualize the relationships among E. cloacae strains, an MSP dendrogram was created using the external MATLAB software tool in Biotyper 2.0. The creation of the dendrogram was based on the parameter settings of the standard MSP dendrogram creation method and the general dendrogram settings.
According to the results of the cluster analysis and the super reference spectra, peaks with frequencies greater than 95% were extracted using the Biotyper MSP Peak List Editor (version 2.0.57.0).
-
Individually measured mass spectra of the E. cloacae strains were imported into MSP, which performs normalization, smoothing, baseline correction, and peak picking and generates a list of the most significant peaks. Then, a primary spectrum that contains the average peak mass, the peak intensity and frequency was calculated using the program. Thirty-four reference spectra of 10 genetic clusters were added to the original 17 reference spectra in the ORD; thus, there are 51 reference spectra in the NRD (Table 2). Based on the results of the clustering analysis, 14 strains from clusters Ⅲ, Ⅵ, and Ⅷ were closely related and constituted clade 1, and 20 strains of the other seven clusters were closely related and constituted clade 2. Thus, the strains of clade 1 and clade 2 were compiled as two super reference spectra in the SRD.
Table 2. Evaluation of Different Reference Databases
Cluster For Construction For Evaluation ORD NRD SRD Misidentified
(n/%)Species Level
(n/%)Cluster Level
(n/%)Misidentified
(n/%)Species Level
(n/%)Cluster Level
(n/%)Misidentified
(n/%)Species Level
(n/%)Clades Level
(n/%)I 3 7 7/100 7/100 6/86 7/100 7/100 Ⅱ 4 3 3/100 3/100 3/100 3/100 3/100 Ⅲ 5 9 9/100 9/100 6/68 1/11 8/89 8/89 Ⅳ 3 2 1/50 1/50 2/100 2/100 2/100 2/100 Ⅴ 2 4 4/100 4/100 3/75 4/100 4/100 Ⅵ 5 10 10/100 10/100 7/70 10/100 10/100 Ⅷ 4 12 12/100 12/100 9/75 12/100 12/100 Ⅸ 3 2 2/100 2/100 2/100 2/100 2/100 Ⅺ 2 1 1/100 1/100 1/100 1/100 1/100 XⅢ 3 3 2/67 1/33 3/100 3/100 3/100 3/100 Total 34 53 13/25 40/75 53/100 42/79 1/2 52/98 52/98 Note. ORD, original reference database; NRD, new reference database; SRD, super reference database. -
Fifty-three strains were used to evaluate the ORD and NRD. By searching the ORD, thirteen strains with high scores (≥ 2.000) were identified as E. asburiae. The other 40 strains were identified as E. cloacae, but the score values of eight of these strains were lower than 2.000 (Figure 1).
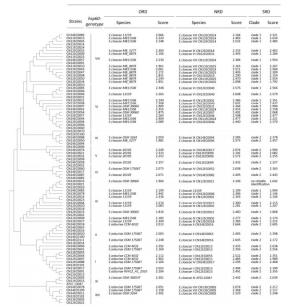
Figure 1. Comparison of the ORD, NRD, and SRD. The phylogenetic tree based on the hsp60 gene illustrates the relationship of the 10 clusters of E. cloacae. Thirty-four strains were added to the NRD, and another 53 strains were used to evaluate the NRD and SRD. The search results with score values are shown.
By searching the NRD, all isolates with high score values (100%, ≥ 2.000) were identified as E. cloacae. Only the spectrum for strain CN13EC0078, with a score value of 2.199, matched a previous spectrum; the remaining strains were the first to be matched to the Chinese reference spectrum in the NRD. While the strains of clusters Ⅱ, Ⅳ, Ⅸ, Ⅺ, and XⅢ were correctly identified to the genetic cluster level, misidentifications were identified in strains of clusters Ⅰ, Ⅴ, Ⅲ, Ⅵ, and Ⅷ, although these strains had high scores (Figure 1). Strains CN12EC0101 (cluster Ⅰ) and CN14EC0021 (cluster Ⅴ) were misidentified as belonging to cluster Ⅳ, which suggested that strain CN14EC0017 may be atypical as a reference for cluster Ⅳ.
In addition, we constructed and evaluated an SRD for E. cloacae identification. Searching the SRD, 30 strains of clusters Ⅲ, Ⅵ, and Ⅷ were identified in clade 1, and twenty-two isolates of seven other genetic clusters were identified in clade 2 (Figure 1). One strain of cluster Ⅲ (CN12EC0021) was not reliably identified (score value of 1.642) (Table 2).
-
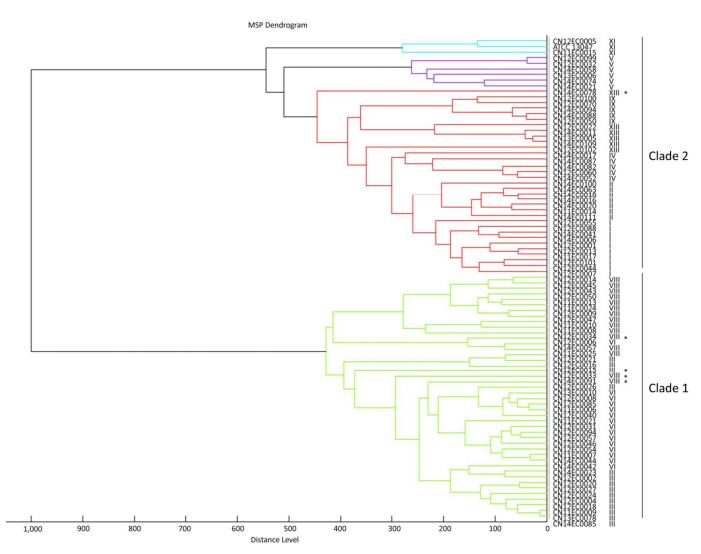
A score-oriented MSP dendrogram was generated using the default settings in Biotyper 2.0 (Figure 2). The 87 strains were categorized into two distinct clades with a distance level of 600. Strains of clusters Ⅲ, Ⅵ, and Ⅷ were categorized as clade 1. Most strains of clade 1 were clustered at the genetic cluster level, with some exceptions. Strains of clade 2 consisted of seven other genetic clusters of E. cloacae. The strains clustered at distance levels of 650, 500, 450, 400, 350, 300, and 250 were also classified to the genetic cluster level (Figure 2). Because cluster XⅢ was a sequence crowd, the high number of branches suggested that there may be many genotypes in this cluster.

Figure 2. Cluster analysis of E. cloacae based on the entire protein spectrum (2, 000 to 20, 000 Da). Strains of clusters Ⅲ, Ⅵ, and Ⅷ were categorized as clade 1, and strains of the seven remaining genetic clusters were clustered as clade 2. Strains that were non-clustered based on their hsp60 genotypes are labelled with asterisks.
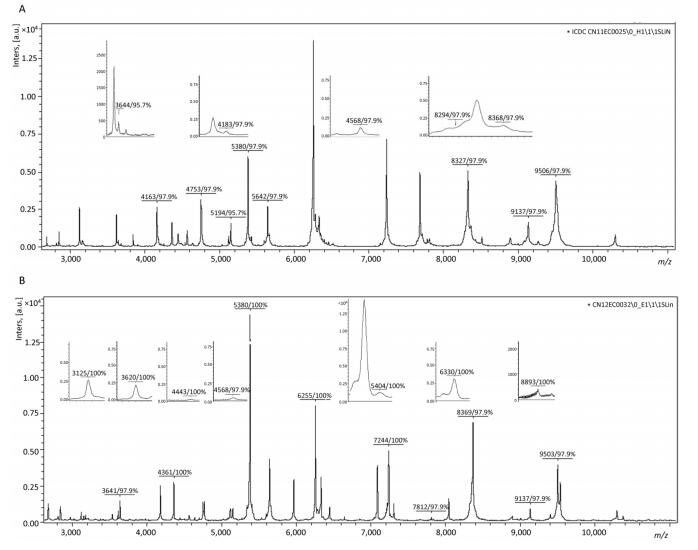
From the MSP of Biotyper, fifteen specific peaks with spectra frequencies > 97% were analysed and extracted from 44 strains of clade 1 (Figure 3A). Eighteen specific peaks with spectra frequencies > 97% were acquired from 43 strains of clade 2 (Figure 3B).

Figure 3. Specific peaks of clade 1 and clade 2 from 2, 000 to 20, 000 Da. (A) Representative pattern of a clade 1 strain (CN11EC0025); (B) Representative pattern of a clade 2 strain (CN12EC0032). The relative intensities of the ions (a.u., arbitrary units) are shown on the Y axis, and the masses (in Da) of the ions are shown on the X axis.
-
E. cloacae consists of 13 genetic clusters; the clinical importance and genetic heterogeneity of E. cloacae are well known[1, 3, 6, 23-25]. This pathogen usually causes nosocomial wound infections, urinary tract infections, pneumonia, and sepsis in intensive care units. Therefore, a high-throughput diagnostic method would be preferred to the current methods, which are cumbersome. In this study, we constructed and evaluated a new PMF database with hsp60-genotype E. cloacae strains; most of the strains were isolated from hospitals in China. The system identified different hsp60 genotypes and clustered E. cloacae strains to the genetic cluster level. To the best of our knowledge, this is the first report on the study of E. cloacae that was based on a combination of PMF and genetic clustering of E. cloacae.
Because of its genetic heterogeneity, E. cloacae could be clustered into 13 genetic clusters. In the ORD, there were 17 reference spectra from E. cloacae strains; no strain among them was clearly described to the genetic cluster level. In the NRD and SRD, all the added reference strains were typed with the corresponding genetic cluster. Therefore, the NRD and the SRD were more reliable and accurate than the ORD. By including 34 new reference spectra of 10 hsp60-genotype strains, the ability to identify E. cloacae strains at the species level improved from 75% to 100%, and at that at the genetic cluster level improved from 0 to 79% (Table 2). In previous reports, some of the genetic clusters have been named: E. asburiae (I), E. kobei (Ⅱ), E. ludwigii (Ⅴ), E. hormae chei subsp. oharae (Ⅵ), E. hormaechei subsp. hormaechei (Ⅶ), E. hormaechei subsp. steigerwaltii (Ⅷ), E. nimipressuralis (X), E. cloacae subsp. cloacae (Ⅺ), and E. cloacae subsp. dissolvens (Ⅻ); the three remaining clusters are referred to as E. cloacae Ⅲ, E. cloacae Ⅳ and E. cloacae Ⅸ[7]. Score values > 2.000 are considered to indicate species level identification for most bacteria[16]; however, this method is poorly suited to E. cloacae identification. Therefore, enriching the capacity of the database and improving the efficiency of recognition are both very important for accurate identification of E. cloacae. Hence, we constructed and evaluated the first version of an SRD for E. cloacae identification. Searching the SRD, 98% of the E. cloacae strains were matched to clade 1 or clade 2. In this study, the identification capabilities of the NRD and SRD for E. cloacae at the species level were roughly the same. However, 42 strains (79%) could be identified at the cluster level by searching the NRD, and 52 strains (98%) could be identified at the clade level by searching the SRD. The normal reference database was constructed using 20 spectra of one strain. The super reference database was constructed using the spectra of all the strains that had common characteristics. In theory, the accuracy of SRD is higher than that of NRD. However, the NRD searching was better for the identification of E. cloacae at the species level, which demonstrated the heterogeneity of E. cloacae.
Based on comparative genomic hybridization, E. cloacae was divided into two clades that are genetically distinct[19]. In our study, the MSP dendrogram clearly shows that clinical isolates can be divided into two distinct clades at the protein level, which is in agreement with the two genetic clades mentioned above. Strains of clusters (Ⅲ, Ⅵ, and Ⅷ) were clustered into clade 1, and the remaining strains were clustered into clade 2. Clade 1 contained the common clinical isolates and was usually isolated from hospital environments with high specific pressures (e.g., antibiotic use). In our previous study, we demonstrated that clusters (Ⅲ, Ⅵ, and Ⅷ) were the most prevalent representatives of E. cloacae in hospital settings (data not shown). Clade 2 contained a relatively large group of species that are associated with the environment or are plant pathogens[23]. Specific peaks were analysed using PMF, which enables discrimination between the two clades. Seven peaks (m/z 3644, 4568, 4753, 5380, 8368, 9137, and 9506) were common in clade 1 and clade 2 (94.8%, 98.9%, 97.9%, 98.9%, 94.8%, 94.8%, and 94.8%, respectively) and considered specific peaks for E. cloacae. Eight peaks (m/z 3133, 4163, 4183, 5149, 5642, 5669, 8294, and 8327) were specific for the identification of clade 1. Eleven peaks (m/z 3125, 3620, 4361, 4443, 5404, 6255, 6282, 6330, 7244, 7812, and 8893) were specific for the identification of clade 2. Therefore, further study of the different protein sequences between the two clades may help explain why clusters Ⅲ, Ⅵ, and Ⅷ are prevalent in hospitals. Strains from clade 2 were clustered at different distance levels, thus, the specific peaks corresponding to different genetic clusters warrant further study.
In recent years, many studies have used biochemical and molecular methods to focus on rapid identification and subtyping[19, 26]. Comparative genomic hybridization (CGH), multi-locus sequence analysis (MLSA), multi-locus sequence typing (MLST), and hsp60 and rpoB genotyping are better methods for the identification and subtyping of E. cloacae species; however, these methods are expensive and labour intensive. Peptide mass fingerprinting is an emerging technique for the rapid identification of microorganisms[27-29]. Our study shows that PMF is a powerful method for studying E. cloacae. Using PMF, the proteins could be tested immediately after the strains were cultured and isolated. The entire process, from protein extraction to reference database searching (NRD and SRD), could be performed within 10 min. Based on the PMF data, the MSP den-drogram can be used for identification and subtyping of E. cloacae. This method is high throughput and low cost. Therefore, we believe that the PMF method is equivalent or superior to traditional diagnostic methods for E. cloacae. Thus, the PMF method is a novel and powerful method to study genetic cluster assignments within E. cloacae and is able to detect specific genetic clusters that threaten hospital popula-tions. In combination with other genotyping methods, this method could be used to analyse the relationships among the genetic clusters of E. cloacae, greatly improving identification and molecular subtyping.
-
For excellent technical assistance, we thank ZHAO Ai Lan, WANG Yan, JIN Dong, YUAN Xue Jiao, YU Bo, MENG Shuang, and BAI Xiang Ning. In addition, we thank LIU Kai and LI Pei Jing for material support. The authors are grateful to WANG Yi for careful proofreading of the manuscript.
-
WANG Yi Qian and YE Chang Yun designed the project and wrote the paper. WANG Yi Qian, ⅪAO Di, ⅪONG Yan Wen, and ZHANG Jian Zhong carried out the experimental work. LI Juan, ZHANG Hui Fang, FU Bao Qing, WANG Xiao Ling, and AI Xiao Man isolated E. cloacae strains from samples. All authors read and approved the final manuscript.
-
The authors declare no conflict of interests.
doi: 10.3967/bes2018.005
Rapid Identification and Subtyping of Enterobacter cloacae Clinical Isolates Using Peptide Mass Fingerprinting
-
Abstract:
Objective To establish a domestic database of Enterobacteria cloacae (E. cloacae), and improve the identification efficiency using peptide mass fingerprinting. Methods Peptide mass fingerprinting was used for the identification and subtyping of E. cloacae. Eighty-seven strains, identified based on hsp60 genotyping, were used to construct and evaluate a new reference database. Results Compared with the original reference database, the identification efficiency and accuracy of the new reference database was greatly improved at the species level. The first super reference database for E. cloacae identification was also constructed and evaluated. Based on the super reference database and the main spectra projection dendrogram, E. cloacae strains were divided into two clades. Conclusion Peptide mass fingerprinting is a powerful method to identify and subtype E. cloacae, and the use of this method will allow us to obtain more information to understand the heterogeneous organism E. cloacae. -
Key words:
- E.cloacae /
- Identification /
- Peptide mass fingerprinting
-
Figure 1. Comparison of the ORD, NRD, and SRD. The phylogenetic tree based on the hsp60 gene illustrates the relationship of the 10 clusters of E. cloacae. Thirty-four strains were added to the NRD, and another 53 strains were used to evaluate the NRD and SRD. The search results with score values are shown.
Figure 2. Cluster analysis of E. cloacae based on the entire protein spectrum (2, 000 to 20, 000 Da). Strains of clusters Ⅲ, Ⅵ, and Ⅷ were categorized as clade 1, and strains of the seven remaining genetic clusters were clustered as clade 2. Strains that were non-clustered based on their hsp60 genotypes are labelled with asterisks.
Figure 3. Specific peaks of clade 1 and clade 2 from 2, 000 to 20, 000 Da. (A) Representative pattern of a clade 1 strain (CN11EC0025); (B) Representative pattern of a clade 2 strain (CN12EC0032). The relative intensities of the ions (a.u., arbitrary units) are shown on the Y axis, and the masses (in Da) of the ions are shown on the X axis.
Table 1. Enterobacter cloacae Strains Isolated from China
Cluster No. of strains Source Province Year I 10 SP (9), Ur (1) HB, HLJ 2011, 2012, 2013 Ⅱ 7 SP (3), Ur (1), SC (1), BI (2) HB, HLJ, SX 2010, 2011, 2012, 2013 Ⅲ 14 SP (7), Ur (1), SC (5), BL (1) HB, HLJ 2011, 2012 Ⅳ 5 SP (3), BI (1), OT (1) HB, HLJ 2011, 2012, 2013 V 6 SP (3), SC (2), BI (1) HB, HLJ 2011, 2012, 2013 Ⅵ 15 SP (8), Ur (2), SC (3), OT (2) HB, HLJ, BJ 2011, 2012, 2013 Ⅷ 16 SP (9), SC (4), BL (1), ST (2) HB, HLJ 2011, 2012 Ⅸ 5 SP (4), BL (1) HB, HLJ 2010, 2011, 2012 Ⅺ 2 SP (2) HB 2011, 2012 XⅢ 6 SP (3), BI (1), BL (1), ST (1) HB, HLJ, SX, GZ 2011, 2012, 2013 Total 86 Note.Sources: SP (sputum), UR (urine), SC (secretion), BI (bile), BL (blood culture), ST (stool), OT (others) Regions: BJ (Beijing), GZ (Guizhou), HB (Hebei), HLJ (Heilongjiang), HN (Henan), QH (Qinghai), SX (Shanxi).  下载: 导出CSV
Table 2. Evaluation of Different Reference Databases
Cluster For Construction For Evaluation ORD NRD SRD Misidentified
(n/%)Species Level
(n/%)Cluster Level
(n/%)Misidentified
(n/%)Species Level
(n/%)Cluster Level
(n/%)Misidentified
(n/%)Species Level
(n/%)Clades Level
(n/%)I 3 7 7/100 7/100 6/86 7/100 7/100 Ⅱ 4 3 3/100 3/100 3/100 3/100 3/100 Ⅲ 5 9 9/100 9/100 6/68 1/11 8/89 8/89 Ⅳ 3 2 1/50 1/50 2/100 2/100 2/100 2/100 Ⅴ 2 4 4/100 4/100 3/75 4/100 4/100 Ⅵ 5 10 10/100 10/100 7/70 10/100 10/100 Ⅷ 4 12 12/100 12/100 9/75 12/100 12/100 Ⅸ 3 2 2/100 2/100 2/100 2/100 2/100 Ⅺ 2 1 1/100 1/100 1/100 1/100 1/100 XⅢ 3 3 2/67 1/33 3/100 3/100 3/100 3/100 Total 34 53 13/25 40/75 53/100 42/79 1/2 52/98 52/98 Note. ORD, original reference database; NRD, new reference database; SRD, super reference database.
下载: 导出CSV
-
[1] Akbari M, Bakhshi B, Najar Peerayeh S. Particular Distribution of Enterobacter cloacae Strains Isolated from Urinary Tract Infection within Clonal Complexes. Iran Biomed J, 2016; 20, 49-55. http://applications.emro.who.int/imemrf/Iran_Biomed_J/Iran_Biomed_J_2016_20_1_49_55.pdf [2] Fursova NK, Astashkin EI, Knyazeva AI, et al. The spread of bla OXA-48 and bla OXA-244 carbapenemase genes among Klebsiella pneumoniae, Proteus mirabilis and Enterobacter spp. isolated in Moscow, Russia. Ann Clin Microbiol Antimicrob, 2015; 14, 46. doi: 10.1186/s12941-015-0108-y [3] Du H, Chen L, Chavda KD, et al. Genomic characterization of Enterobacter cloacae isolates from China that co-produce KPC-3 and NDM-1 carbapenemases. Antimicrob Agents Chemother, 2016; 60, 2519-23. doi: 10.1128/AAC.03053-15 [4] Zhao K, Jin M, Chen Q, et al. Polysaccharides produced by Enterobacter cloacae induce apoptosis in cervical cancer cells. Int J Biol Macromol, 2015; 72, 960-4. doi: 10.1016/j.ijbiomac.2014.09.047 [5] Taniyama D, Miyamoto K. Purpura Fulminans due to Enterobacter cloacae. Intern Med, 2015; 54, 2425-6. doi: 10.2169/internalmedicine.54.4971 [6] Stoesser N, Sheppard AE, Shakya M, et al. Dynamics of MDR Enterobacter cloacae outbreaks in a neonatal unit in Nepal:insights using wider sampling frames and next-generation sequencing. J Antimicrob Chemother, 2015; 70, 1008-15. doi: 10.1093/jac/dku521 [7] Hoffmann H, Roggenkamp A. Population genetics of the nomenspecies Enterobacter cloacae. Appl Environl Microb, 2003; 69, 5306-18. doi: 10.1128/AEM.69.9.5306-5318.2003 [8] Lee SO, Kim YS, Kim BN, et al. Impact of previous use of antibiotics on development of resistance to extended-spectrum cephalosporins in patients with enterobacter bacteremia. Eur J Clin Microbiol Infect Dis, 2002; 21, 577-81. doi: 10.1007/s10096-002-0772-7 [9] Sanders WE Jr, Sanders CC. Enterobacter spp.:pathogens poised to flourish at the turn of the century. Clin Microbiol Rev, 1997; 10, 220-41. https://www.researchgate.net/publication/14111533_Enterobacter_spp_Pathogens_poised_to_flourish_at_the_turn_of_the_century [10] Brenner DJ, McWhorter AC, Kai A, et al. Enterobacter asburiae sp. nov., a new species found in clinical specimens, and reassignment of Erwinia dissolvens and Erwinia nimipressuralis to the genus Enterobacter as Enterobacter dissolvens comb. nov. and Enterobacter nimipressuralis comb. nov. J Clin Microbiol, 1986; 23, 1114-20. https://www.researchgate.net/publication/281623165_Enterobacter_tabaci_sp_nov_a_novel_member_of_the_genus_Enterobacter_isolated_from_a_tobacco_stem [11] Hoffmann H, Schmoldt S, Trulzsch K, et al. Nosocomial urosepsis caused by Enterobacter kobei with aberrant phenotype. Diagn Microbiol Infect Dis, 2005; 53, 143-7. doi: 10.1016/j.diagmicrobio.2005.06.008 [12] Hoffmann H, Stindl S, Ludwig W. et al. Enterobacter hormaechei subsp. oharae subsp. nov., E. hormaechei subsp. hormaechei comb. nov., and E. hormaechei subsp. steigerwaltii subsp. nov., three new subspecies of clinical importance. J Clin Microbiol, 2005; 43, 3297-303. https://www.researchgate.net/publication/7744750_Enterobacter_hormaechei_subsp_oharae_subsp_nov_E_hormaechei_subsp_hormaechei_comb_nov_and_E_hormaechei_subsp_steigerwaltii_subsp_nov_Three_New_Subspecies_of_Clinical_Importance [13] Hoffmann H, Stindl S, Stumpf A, et al. Description of Enterobacter ludwigii sp. nov., a novel Enterobacter species of clinical relevance. Syst Appl Microbiol, 2005; 28, 206-12. doi: 10.1016/j.syapm.2004.12.009 [14] Camara JE, Hays FA. Discrimination between wild-type and ampicillin-resistant Escherichia coli by matrix-assisted laser desorption/ionization time-of-flight mass spectrometry. Anal Bioanal Chem, 2007; 389, 1633-8. doi: 10.1007/s00216-007-1558-7 [15] van Veen SQ, Claas EC, Kuijper EJ. High-throughput identification of bacteria and yeast by matrix-assisted laser desorption ionization-time of flight mass spectrometry in conventional medical microbiology laboratories. J Clin Microbiol, 2010; 48, 900-7. doi: 10.1128/JCM.02071-09 [16] Xiao D, Zhao F, Lv M, et al. Rapid identification of microorganisms isolated from throat swab specimens of community-acquired pneumonia patients by two MALDI-TOF MS systems. Diagn Microbiol Infect Dis, 2012; 73, 301-7. doi: 10.1016/j.diagmicrobio.2012.04.004 [17] Xiao D, Ye C, Zhang H, et al. The construction and evaluation of reference spectra for the identification of human pathogenic microorganisms by MALDI-TOF MS. PLoS One, 2014; 9, e106312. doi: 10.1371/journal.pone.0106312 [18] Zhu B, Xiao D, Zhang H, et al. MALDI-TOF MS distinctly differentiates nontypable Haemophilus influenzae from Haemophilus haemolyticus. PLoS One, 2013; 8, e56139. doi: 10.1371/journal.pone.0056139 [19] Paauw A, Caspers MP, Schuren FH, et al. Genomic diversity within the Enterobacter cloacae complex. PLoS One, 2008; 3, e3018. doi: 10.1371/journal.pone.0003018 [20] Tamura K, Dudley J, Nei M, et al. Molecular Evolutionary Genetics Analysis (MEGA) software version 4.0. Mol Biol Evol, 2007; 24, 1596-9. doi: 10.1093/molbev/msm092 [21] Murugaiyan J, Ahrholdt J, Kowbel V, et al. Establishment of a matrix-assisted laser desorption ionization time-of-flight mass spectrometry database for rapid identification of infectious achlorophyllous green micro-algae of the genus Prototheca. Clin Microbiol Infect, 2012; 18, 461-7. doi: 10.1111/j.1469-0691.2011.03593.x [22] Xiao D, Zhang H, He L, et al. High natural variability bacteria identification and typing:Helicobacter pylori analysis based on peptide mass fingerprinting. J Proteomics, 2014; 98, 112-2. doi: 10.1016/j.jprot.2013.11.021 [23] Mezzatesta ML, Gona F, Stefani S. Enterobacter cloacae complex:clinical impact and emerging antibiotic resistance. Future Microbiol, 2012; 7, 887-902. doi: 10.2217/fmb.12.61 [24] Kremer A, Hoffmann H. Prevalences of the Enterobacter cloacae complex and its phylogenetic derivatives in the nosocomial environment. Eur J Clin Microbiol Infect Dis, 2012; 31, 2951-5. doi: 10.1007/s10096-012-1646-2 [25] Fernandez A, Pereira MJ, Suarez JM, et al. Emergence in Spain of a multidrug-resistant Enterobacter cloacae clinical isolate producing SFO-1 extended-spectrum beta-lactamase. J Clin Microbiol, 2011; 49, 822-8. doi: 10.1128/JCM.01872-10 [26] Miyoshi-Akiyama T, Hayakawa K, Ohmagari N, et al. Multilocus sequence typing (MLST) for characterization of Enterobacter cloacae. PLoS One, 2013; 8, e66358. doi: 10.1371/journal.pone.0066358 [27] Khennouchi NC, Loucif L, Boutefnouchet N, et al. MALDI-TOF MS as a Tool To Detect a Nosocomial Outbreak of Extended-Spectrum-beta-Lactamase-and ArmA Methyltransferase-Producing Enterobacter cloacae Clinical Isolates in Algeria. Antimicrob Agents Chemother, 2015; 59, 6477-83. doi: 10.1128/AAC.00615-15 [28] Chui H, Chan M, Hernandez D, et al. Rapid, Sensitive, and Specific Escherichia coli H Antigen Typing by Matrix-Assisted Laser Desorption Ionization-Time of Flight-Based Peptide Mass Fingerprinting. J Clin Microbiol, 2015; 53, 2480-85. doi: 10.1128/JCM.00593-15 [29] Planatscher H, Weiss F, Eisen D, et al. Identification of short terminal motifs enriched by antibodies using peptide mass fingerprinting. Bioinformatics, 2014; 30, 1205-13. doi: 10.1093/bioinformatics/btu009 -

 点击查看大图

计量
- 文章访问数: 1296
- HTML全文浏览量: 375
- PDF下载量: 43
- 被引次数: 0

 Quick Links