

 下载:
下载:

-
Infectious diarrhea is a major public health problem worldwide, especially in developing and underdeveloped countries, imposing a heavy burden on societies. In 2000–2002, approximately 4.7% of the global daily disease burden was caused by diarrhea[1]. According to the World Health Organization (WHO) estimates, approximately tens of millions of people suffer from diarrhea every day, resulting in 3–5 billion cases annually. Moreover, 5–10 million people die of severe diarrhea, with a daily average of 25,000 deaths[2]. E. coli-associated diarrhea is the main cause of infectious diarrhea in humans and animals[3]. It is also one of the causes of diarrheal diseases among travelers in underdeveloped countries. Notably, E. coli includes pathogenic E. coli and common E. coli and is a ubiquitous symbiotic bacterium in the intestines, widely existing in the living environment such as air, water, and soil in regions inhabited by mammals and birds, among others. According to data from the National Food Poisoning Report of the Health Emergency Response Center of the China Center for Disease Control and Prevention, in the third quarter of 2018, the highest number of food poisoning cases was caused by microbes. E. coli has been identified as one of the most important pathogens causing bacterial food poisoning and is mainly transmitted through water and food[4-6].
In recent years, the emergence of antibiotic-resistant E. coli has posed a threat to global public health. This phenomenon is becoming increasingly serious, as it currently ranks third among the 12 listed antibiotic-resistant “priority pathogens” described by the WHO. Numerous studies have reported the high rates of antibiotic resistance in China and other Asian countries. For example, in Iran, diarrheagenic E. coli are resistant to tetracycline (63%), ampicillin (62%), streptomycin (56%), and amoxicillin/clavulanic acids (44.5%)[7]. In Taiwan, China, diarrheagenic E. coli strains are resistant to amoxicillin (97.9%), cefazolin (81.3%), nalidixic acid (76.4%), gentamicin (54.2%), and ciprofloxacin (39.6%)[8]. In Korea, these strains are highly resistant to nalidixic acid (44.0%), tetracycline (41.3%), ampicillin (40%), ticarcillin (38.7%), and trimethoprim/sulfamethoxazole (34.7%)[9]. Common E. coli strains also exhibit serious drug resistance, especially MDR[10, 11]. International studies (i.e., in Africa, Asia, Europe, South America, and other regions) have shown that MDR in E. coli is highly prevalent in clinical and community environments, such as in drinking water and poultry[12-14]. In general, E. coli with multidrug resistance (MDR) is considered a major health treat in both humans and animals globally and should be regarded as a serious public health concern.
Many studies have comprehensively examined drug resistance in E. coli by identifying and characterizing related resistance genes. In recent years, both domestic and foreign scholars have conducted extensive research on resistance using whole-genome sequencing (WGS). WGS offers the advantages of high throughput, high accuracy, and convenience and has been increasingly employed to analyze phylogenetic relationships and characterize differences.
Miyun is located northeast of Beijing and has the largest mountainous area and rural population. It has various scenic spots characterized by beautiful hills and clear water that attract tourists. However, an economic gap was noted when Miyun was compared with other central areas of Beijing. A study reported that the number of infectious diarrheal cases in this area had always ranked first in Beijing, with E. coli being the predominant diarrheal pathogen in the past ten years[15]. According to the Chinese Infectious Disease Detection Report Information System, infectious diarrhea cases remain at the top. However, there are no reports on ARGs or whole genomes available for Miyun.
In a previous study, we analyzed diarrheagenic E. coli. We collected the bacteria from patients with diarrhea at the Miyun District Hospital of the National Pathogen Identification Network. We then acquired WGS data for diarrheal E. coli. However, there has been very little analysis of common E. coli, especially in the context of sequencing, indicating a need to address these gaps. The remaining questions include: 1) What are the genotyping characteristics of human fecal E.coli including diarrheagenic E. coli and common E. coli? 2) What are the relationships between multidrug resistance and genotyping characteristics? 3) Do certain genetic characteristics and types reflect drug resistance? To address these questions, we studied diarrheagenic E. coli and common E. coli from the Miyun District subjects. In the following sections, we uniformly refer to both of these types as “E. coli”. The aim of this study was to conduct a comprehensive analysis of the phenotype and WGS of E. coli isolates to shed light on the relationship between the genotype and drug-resistance. This would provide a scientific reference for better control and prevalence of drug-resistant E. coli in the region, a basis for the allocation of future health resources, the formulation of strategies to prevent the spread of E. coli with MDR, and guidance for empirical antibiotic treatment. However, due to the limited data, complex analysis was insufficient. Therefore, it is necessary to consistently gather strains and accumulate further sequencing data.
-
According to the work requirements of the National Pathogen Identification Network, a total of 490 fecal samples were collected weekly from patients with diarrhea (diarrheal group) at the Miyun District Hospital, a surveillance hospital, from 2019 to 2021. Moreover, 53 fecal samples were collected from healthy individuals (healthy group). The diarrheal group included those having diarrhea ≥ 3 times every day. The healthy group included individuals without diarrhea symptoms. The fecal samples were sent to the laboratory as soon as possible. If the delivery time was > 2 h, they were placed in the Cary–Blair transport medium. The laboratory staff directly coated the fecal samples onto MacConkey agar medium and cultured the strains at 37 °C for 24 h. A peach-opaque single typical bacterial colony was selected from each plate, and a passage culture was maintained. The non-spore-forming Bacillus Gram-negative strain was identified using Gram staining under a microscope. Finally, the bioMerieux automatic bacterial identification system was used to identify biochemical reactions, such as lactose fermentation, acid and gas production, oxidase-negative reactions, and DNase-negative reactions, in accordance with the requirements of the National Food Safety Standard for Microbiological Examination of Food Coliform Group Count (GB/T 4789.3-2016). The isolates identified as E. coli were cultured to obtain pure strains.
-
Drug sensitivity tests for 17 antibiotics were performed using the microbroth dilution method. The nine drug classes were macrolides, tetracyclines, β-lactams, quinolones, aminoglycosides, sulfonamides, chloramphenicols, polypeptides, compounds and 17 kinds of drugs were analyzed, namely, AZI (Azithromycin), CIP (Ciproflaxacin), NAL (Nalidixic acid), TET (Tetracycline), TIG (Tegecycline), AMK (Amikacin), STR (Streptomycin), SXT (Trimethoprim/sulfamethoxazole), MEM (Meropenem), ETP (Ertapenem), CTX (Cefotaxime), CAZ (Ceftazidime), CZA (ceftazidime-avibactam), AMP (Ampicilin), CHL (Chloramphenicol), CT (Polymyxin E) and AMS (Ampicillin/sulbactam). ATCC 25922 was used as the reference strain. According to the standard reference values of the Clinical and Laboratory Standards Institute of the United States, the isolates were evaluated as resistant, intermediately resistant, or sensitive. MDR strains were defined as those resistant to ≥ 3 antibiotics. The nine drug classes, as long as they were resistant to one type of antibacterial drug, belonged to the drug resistance class.
-
Shanghai Berger Biotechnology Co., Ltd. performed sequencing of all the strains. Genomic DNA was extracted from E. coli isolates using the PureLink Genomic DNA Mini Kit (Thermo Fisher Scientific, Waltham, MA, USA), Qiagen, Gentra, or Puregene bacterial kits. DNA concentrations were determined using the Qubit dsDNA BR Assay Kit (Thermo Fisher Scientific). Sequencing libraries were prepared using the Nextera XT DNA Library Preparation Kit or the Nextera DNA Flex Library Preparation Kit, according to the manufacturer’s protocol (Illumina, Inc., San Diego, CA, USA). Pair-end sequencing was performed on the Illumina HiSeq, MiSeq, or NextSeq sequencing platforms. Raw reads were adapter-trimmed, quality-filtered using fastp[16] and assembled de novo using SPAdes version 3.11[17].
-
ARGs were identified using Resfinder 4.0. Identified ARGs were manually reviewed to eliminate potentially redundant ARGs predicted at the same genomic position. Phylogroups were assigned using the EzClermont too[18]. To predict MLST, seven conventional housekeeping genes (aspA, glnA, gltA, glyA, pgm, tkt, and uncA) were analyzed using MLST 2.0. Minimum spanning trees (MST) based on MLST data from all isolates were generated using PHYLOViZ v2.0 with the geoBURST Full MST algorithm.
-
R software (version 4.1.2, R Foundation for Statistical Computing, Vienna, Austria) was used for statistical analysis. The χ2 test was used to analyze the differences in counting data between the groups. P < 0.05 indicated a statistically significant difference. Ninety antibiotic resistance genes (ARGs) and MDR phenotypes were analyzed as variables. Based on the decision tree mechanisms, RF models combine various decision tree classifiers to provide the final classification and improve classification accuracy. In this study, the RF model included all the available variables that were randomly divided into the training (70%) and validation (30%) sets. Random processes were repeated until all data were equally distributed in both sets. Tuning was considered to avoid overfitting for maximum likelihood (ML)-based models, and the optimal hyperparameter in the training process for the ML models was a fivefold cross-validation.
-
Raw paired-end reads were mapped to the reference genome of E. coli str. K-12 (accession no. NC_000913.3) using the Burrows-Wheeler Aligner version 0.7.2. SNPs were identified using SAMtools Mpileup[19]. Qualified SNPs were chosen according to the following criteria: 1) a minimum distance of 10 bps between each SNP, 2) a minimum of 10% of the average depth, 3) mapping quality of > 25, 4) SNP quality of > 30, 5) all insertions and deletions were excluded. ML phylogenetic trees were established using RAxML[20] with a generalized time-reversible model and gamma distribution to model site-specific rates of variation. Bootstrapping with 1,000 replicates was used to determine the robustness of the SNP-based ML phylogenetic tree.
-
A total of 94 E. coli strains were identified in 490 fecal samples from patients with diarrhea and 53 fecal samples from healthy individuals between 2019 and 2021. Among them, 70 strains were from the diarrheal group, and 24 were from healthy donors.
-
The drug resistance rates of the 94 E. coli strains were 29.79% for macrolides, 40.43% for tetracyclines, 71.28% for β-lactams, 65.96% for quinolones, 32.98% for aminoglycosides, 35.11% for sulfonamides, 8.51% for chloramphenicols, 3.19% for polypeptides, and 26.60% for compounds. There were 64 (68.09%) MDR strains, including 41 strains (43.62%) resistant to ≥ 5 antibiotics and 9 strains (E21, E38, E43, E44, E45, E48, E68, E73, and E9) resistant to ≥ 9 antibiotics. The sensitivity of the strains from the healthy group to AMS (P = 0.003, P < 0.05), ETP (P = 0.000, P < 0.05), CZA (P = 0.000, P < 0.05), CTX (P = 0.011, P < 0.05), and AZI (P = 0.026, P < 0.05) was significantly higher than that of the diarrheal group. No significant difference in MDR was observed between the diarrheal and healthy groups. Drug resistance rates are listed in Table 1.
Table 1. Drug resistance of 94 E. coli strains
Antibiotic Toltel antibiotic resistance n (%) Diarrheagenic E. coli (n = 70) Common E.coli (n = 24) P Antibiotic resistance n (%) No antibiotic resistance n (%) Antibiotic resistance n (%) No antibiotic resistance n (%) Ampicillin (AMP) 63 (67.02) 49 (70.00) 21 (30.00) 14 (58.33) 10 (41.67) 0.294 Ampicillin/sulbactam (AMS) 25 (26.60) 24 (34.29) 46 (65.71) 1 (4.17) 23 (95.83) 0.004 Tetracycline (TET) 36 (38.30) 25 (35.71) 45 (64.29) 11 (45.83) 13 (54.17) 0.379 Meropenem (MEM) 2 (2.13) 2 (2.86) 68 (97.14) 0 24 (100) 0.986 Polymyxin E (CT) 2 (2.13) 1 (1.43) 69 (98.57) 1 (4.17) 23 (95.83) 1.000 Ertapenem (ETP) 30 (31.91) 30 (42.86) 40 (57.14) 0 24 (100) < 0.001 Ceftazidime/avibactam (CZA) 26 (27.66) 26 (37.14) 44 (62.86) 0 24 (100) < 0.001 Tigecycline (TIG) 7 (7.45) 7 (1.00) 63 (90.00) 0 24 (100) 0.279 Cefotaxime (CTX) 26 (27.66) 24 (34.29) 46 (65.71) 2 (8.33) 22 (91.67) 0.014 Ceftazidime (CAZ) 7 (7.45) 7 (1.00) 63 (90.00) 0 24 (100) 0.246 Ciprofloxacin (CIP) 39 (41.49) 30 (42.86) 40 (57.14) 9 (37.50) 15 (62.50) 0.646 Azithromycin (AZI) 28 (29.79) 25 (35.71) 45 (64.29) 3 (12.50) 21 (87.50) 0.032 Chloramphenicol (CHL) 8 (8.51) 8 (11.43) 62 (88.57) 0 24 (100) 0.191 Nalidixic acid (NAL) 53 (56.38) 38 (54.29) 32 (45.71) 15 (62.50) 9 (37.50) 0.484 Streptomycin (STR) 31 (32.98) 23 (32.86) 47 (67.14) 8 (33.33) 16 (66.67) 0.966 Trimethoprim/sulfamethoxazole (SXT) 33 (35.11) 25 (35.71) 45 (64.29) 8 (33.33) 16 (66.67) 0.833 Amikacin (AMK) 0 0 70 (100) 0 24 (100) / Multidrug resistance (MDR) 64 (68.09) 49 (70.00) 21 (30.00) 15 (62.50) 9 (37.50) 0.496 -
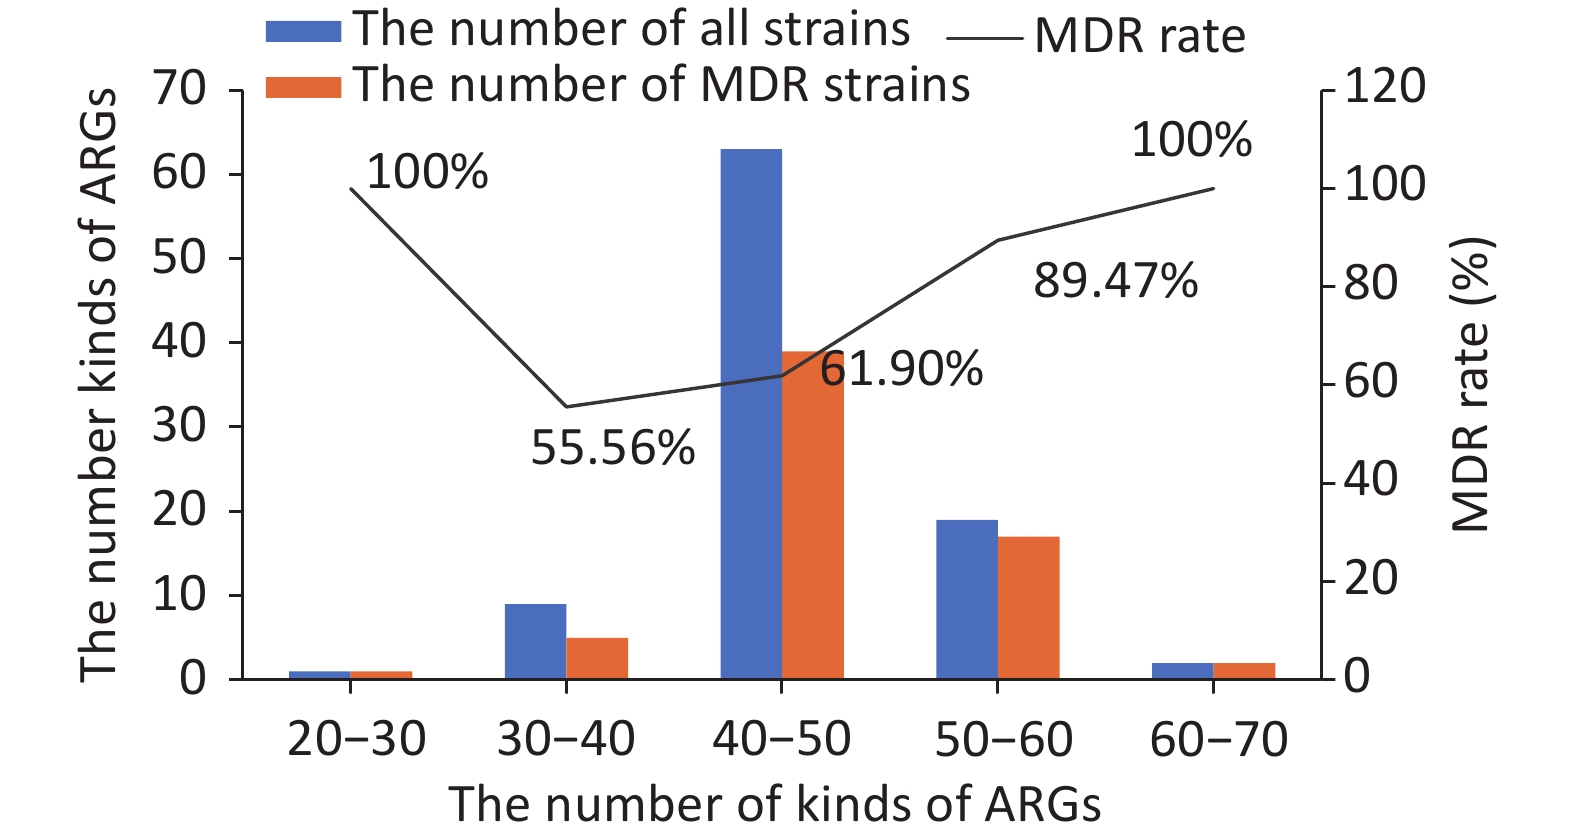
Ninety kinds of ARGs were identified in the 94 strains. All kinds of ARGs were constructed and divided into five drug resistance categories, from the most to least: efflux pump conferring antibiotic resistance (41), antibiotic inactivation or hydrolase (36), target-site changes (6), protein-altering cell wall charge conferring antibiotic resistance (5), and others (2). We then analyzed the relationship between MDR and ARGs. A comparison between the number of kinds of ARGs and MDR showed that there was a positive correlation, i.e., the higher the number of ARGs, the higher the MDR rate. However, an exception was found for E57, a sensitive strain that surprisingly contained more than 50 kinds of ARGs. Detailed information is shown in Figure 1. In total, among the strains containing 30–40 kinds of ARGs, 5 of the 9 strains were multidrug resistant. Among the strains containing 40–50 kinds of drug ARGs, 39 of the 63 strains were multidrug resistant. Among the strains containing 50–60 kinds of ARGs, 17 of the 19 strains were multidrug resistant.
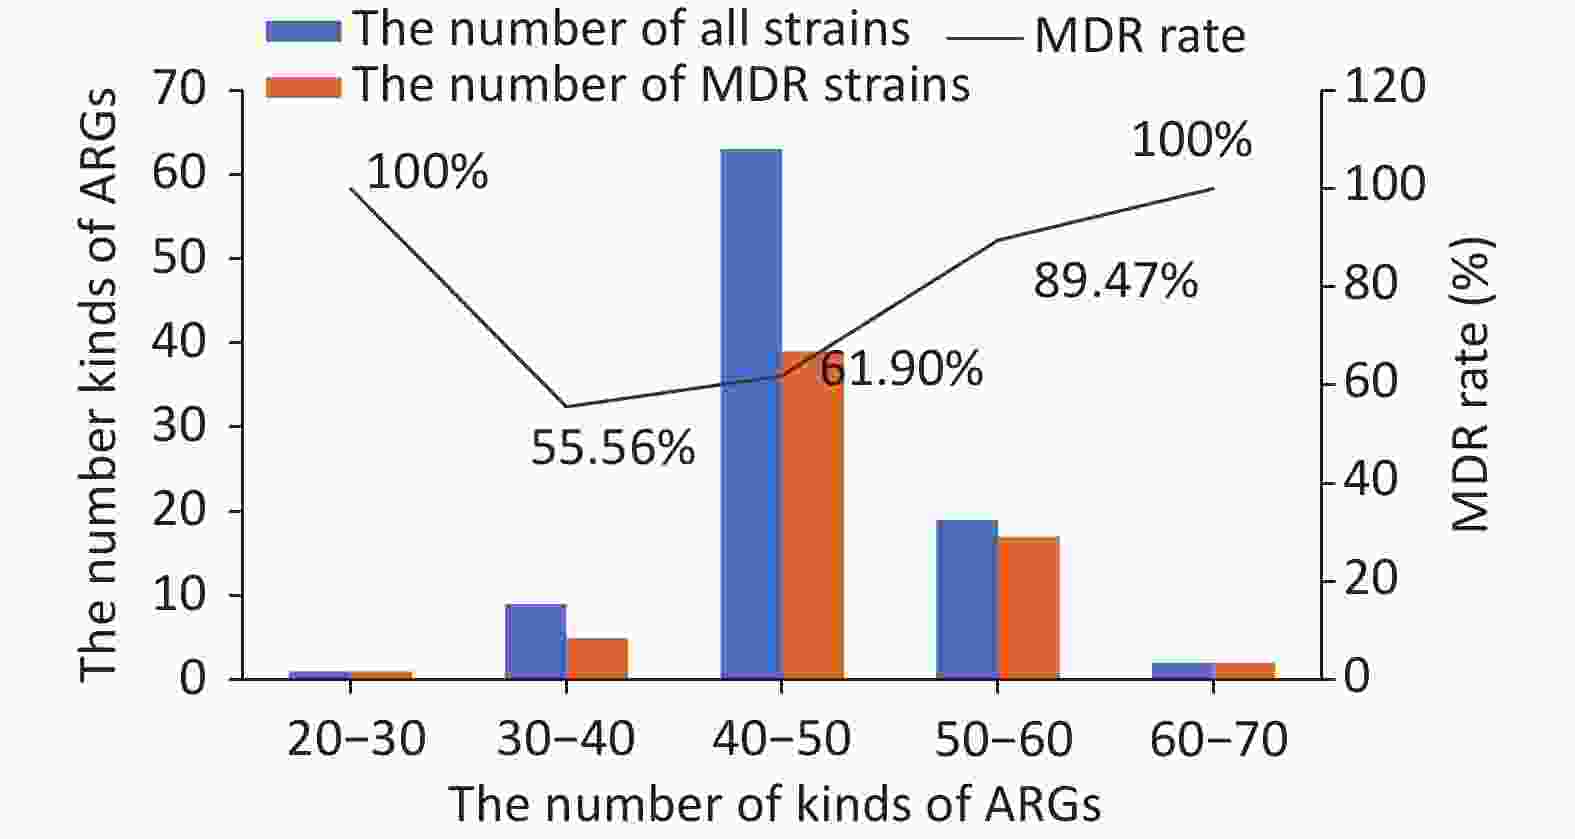
Figure 1. Number of kinds of ARGs and the MDR rate. ARGs, antibiotic resistance genes; MDR, multidrug resistance
-
This study analyzed the correlation between each of the 90 ARGs and MDR, revealing that only the following 8 ARGs are significantly associated with MDR. These eight ARGs are: gadW, dfrA17, mphA, aadA5, qnrS1, AAC(3)-IId, sul1, and TEM.1 (Table 2). The remaining 82 ARGs were not significantly associated with MDR.
Table 2. Eight drug resistance genes with significant correlation with MDR
ARGs χ2 P gadW 4.990 0.025* dfrA17 9.728 0.002** mphA 11.262 0.001** aadA5 9.038 0.003** qnrS1 5 .845 0.016* AAC(3)-IId 10.650 0.001** sul1 5.591 0.018* TEM.1 8.249 0.004** Note. *P < 0.05; **P < 0.01. ARGs, antibiotic resistance genes; MDR, multidrug resistance. -
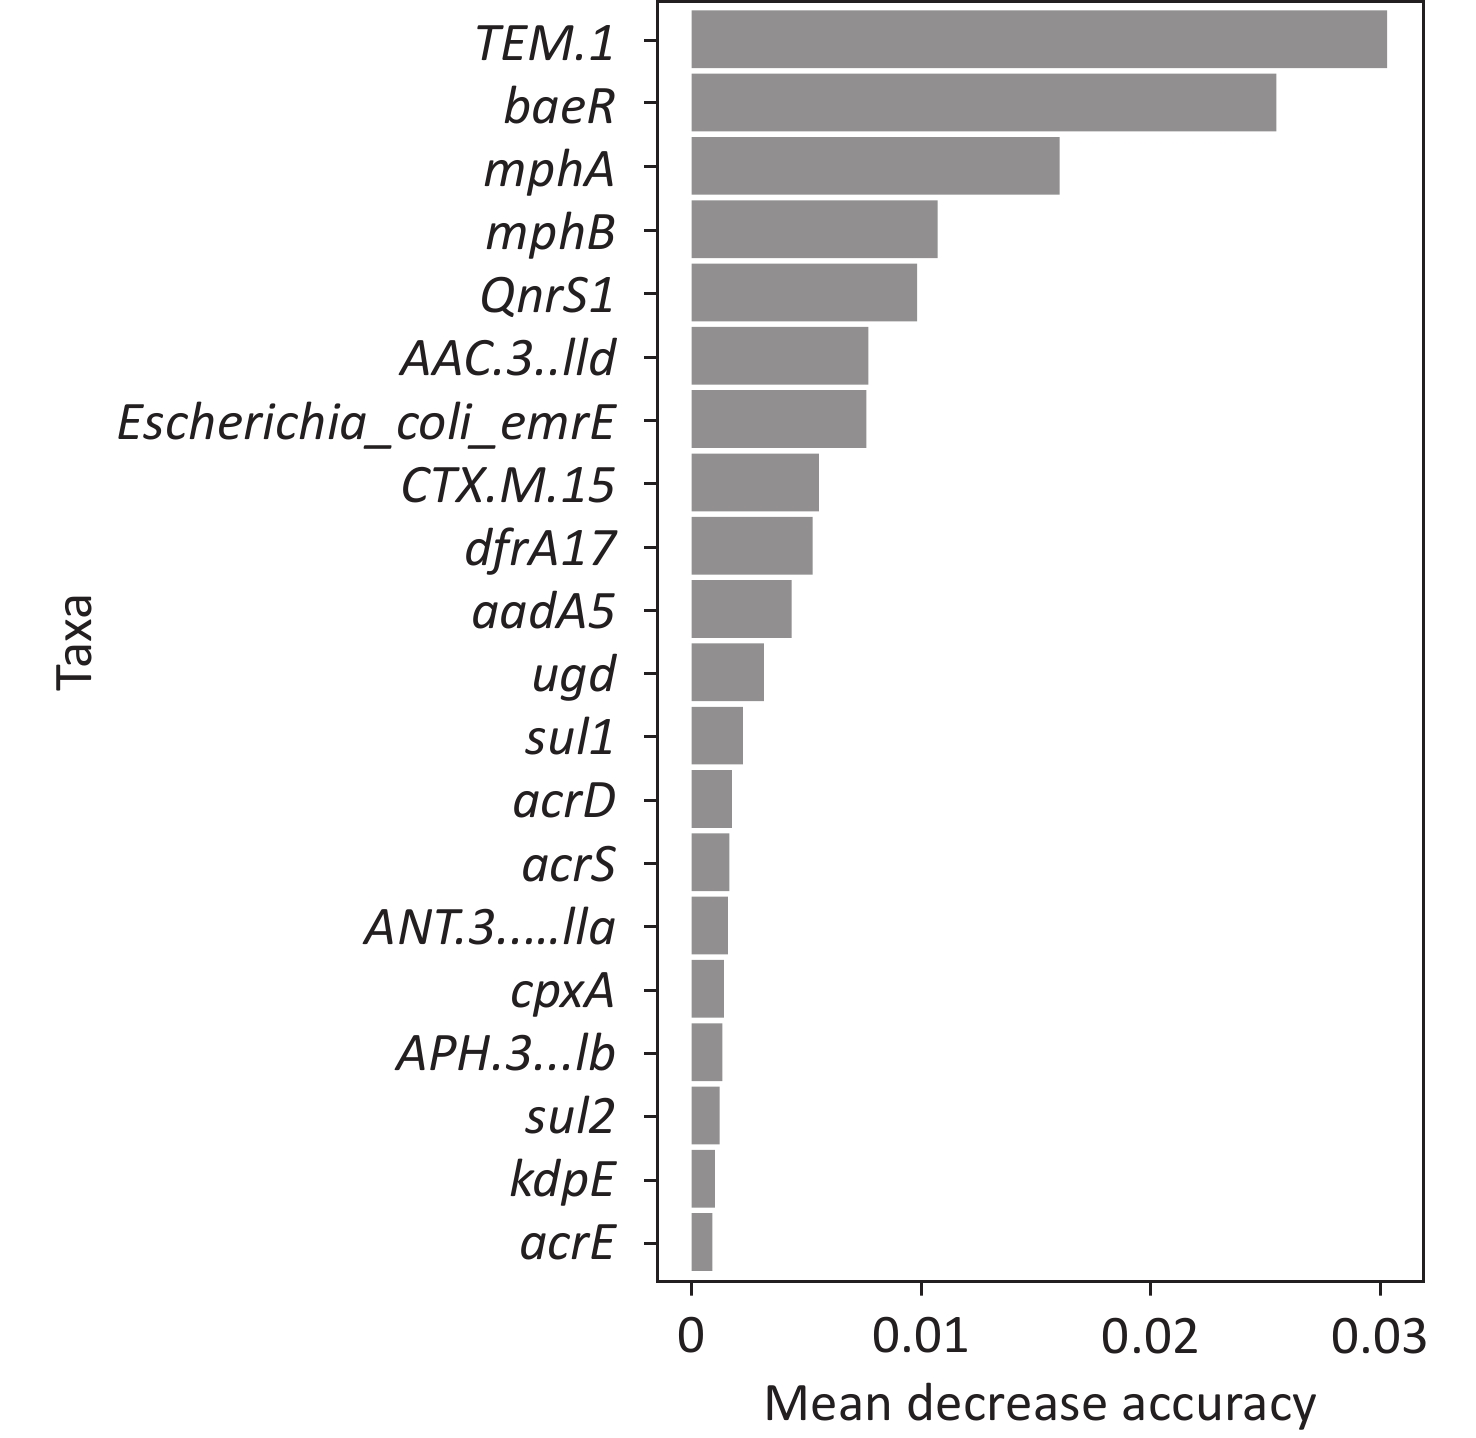
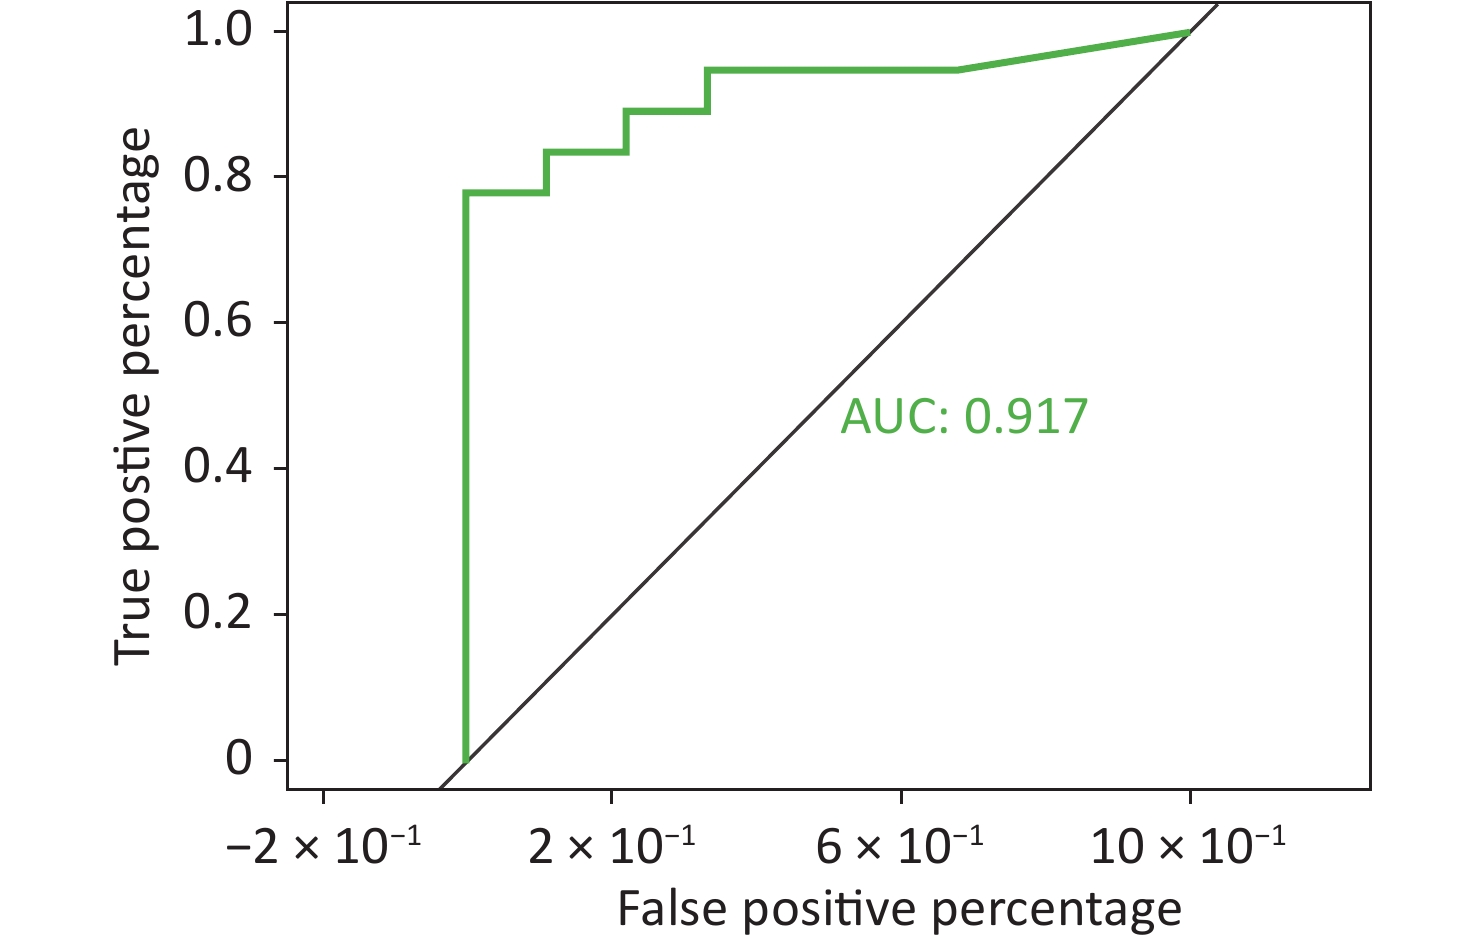
To better predict the gene combinations associated with MDR, the RF classifier approach was utilized to identify MDR risk markers. The optimal gene combination pattern of TEM.1 + baeR + mphA + mphB + QnrS1 + AAC.3-IId was associated with MDR by the RF method. An RF classifier model with 64 MDR and 30 non MDR controls was constructed to assess the potential of ARGs as predictors of multidrug resistance in E. coli. Six ARGs (TEM.1 + baeR + mphA + mphB + QnrS1 + AAC.3-IId) were found to comprise an influential group characteristics (top six features by relative influence), predicting MDR by a ten-fold cross-validation of the RF model (Figure 2). These six predictors achieved a classification accuracy of 85.19%. The MDR index reached an area under the receiver operating characteristic curve (AUC) of 0.917 with a 95% confidence interval (CI) of 0.6627–0.9581 between the MDR and non-MDR controls (P = 0.02754; Figure 3). The data indicated that the classifier model based on the six predictors achieved the predicted potential for the investigation of the risk of MDR in E. coli.
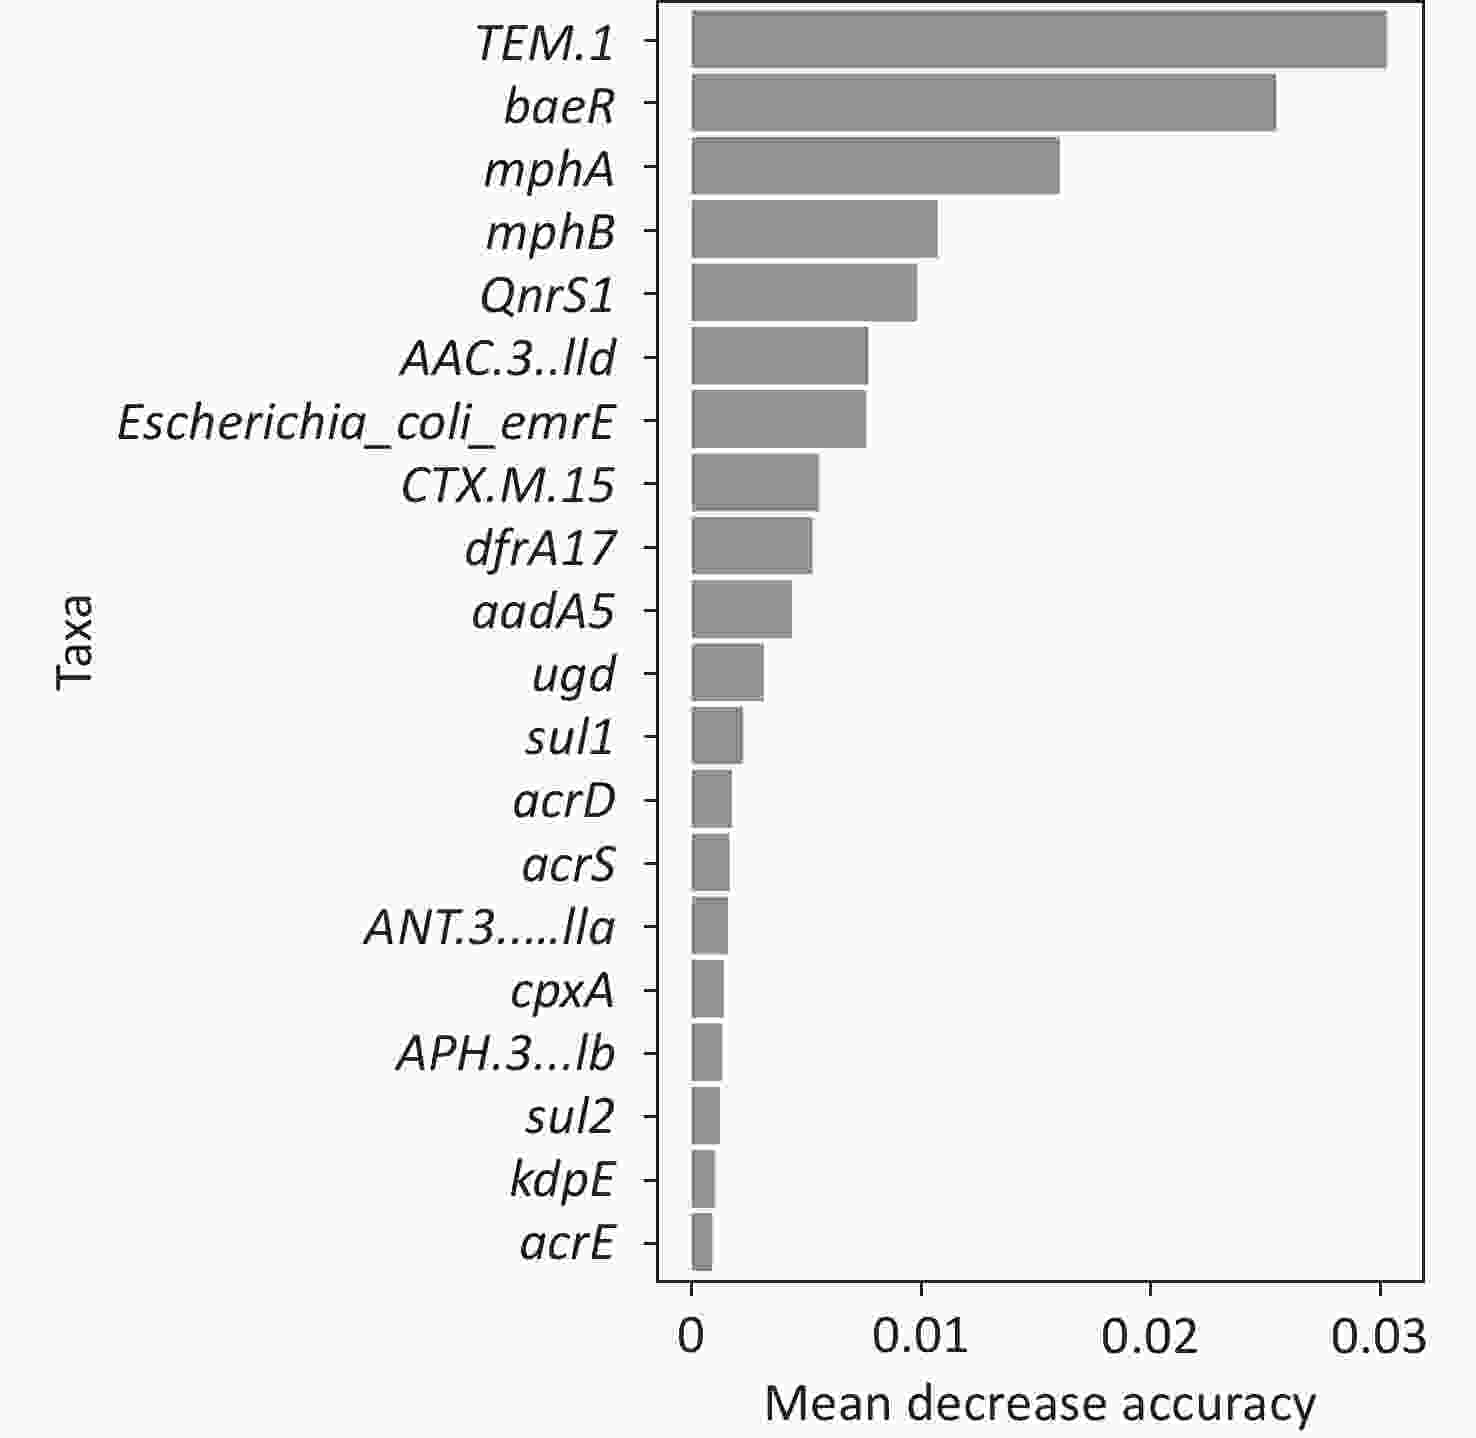
Figure 2. Correlation between the RF analysis gene combination and MDR. RF, random forest; MDR, multidrug resistance.
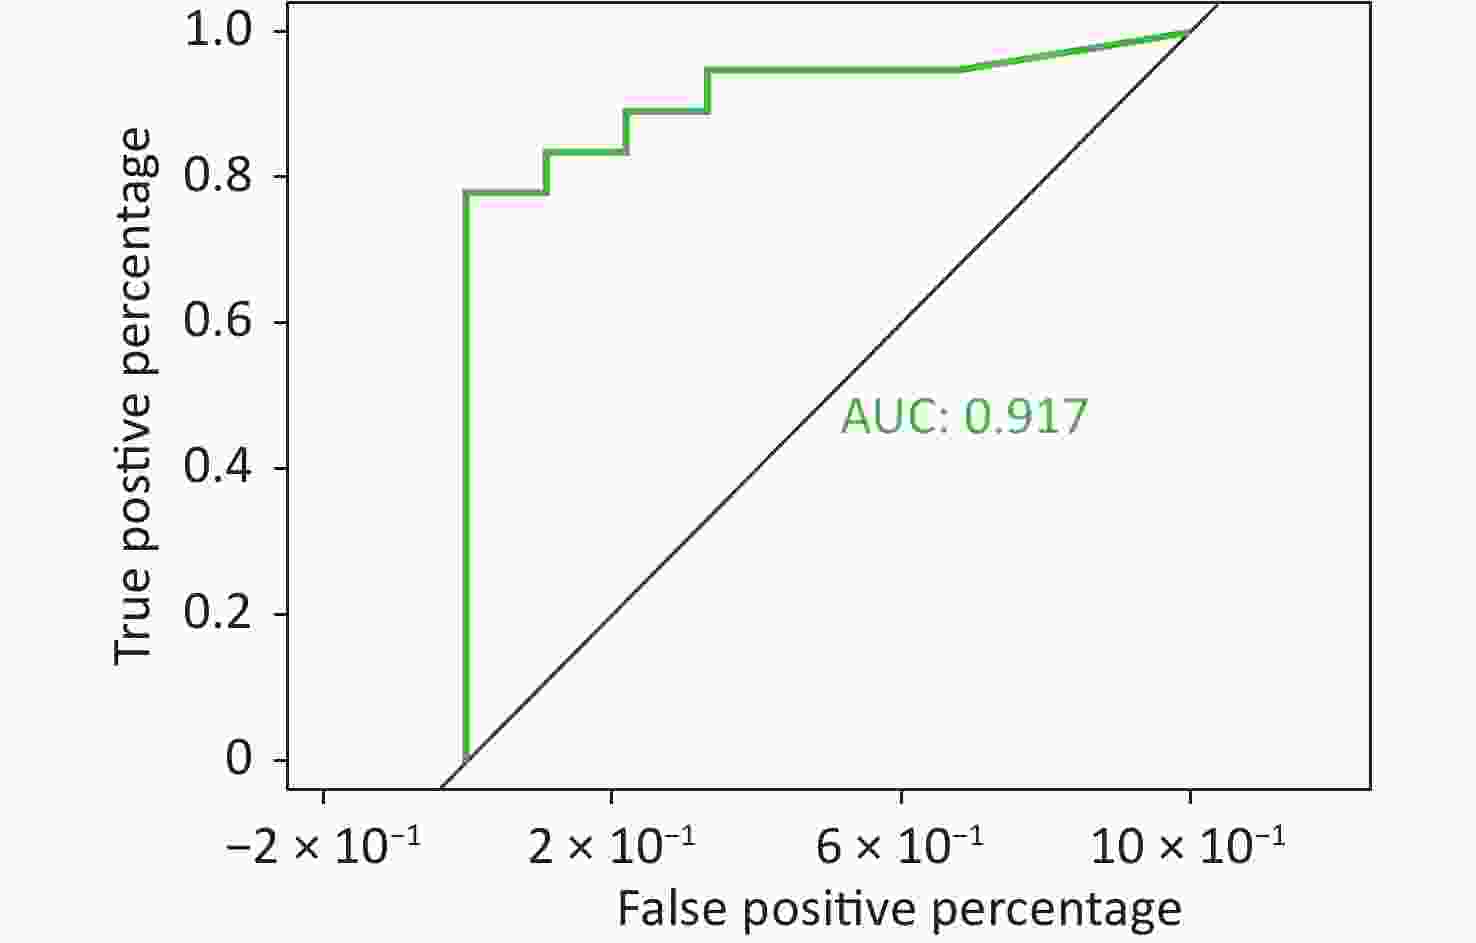
Figure 3. Confidence interval between the MDR and non-MDR controls. MDR, multidrug resistance; AUC, area under the receiver operating characteristic curve
-
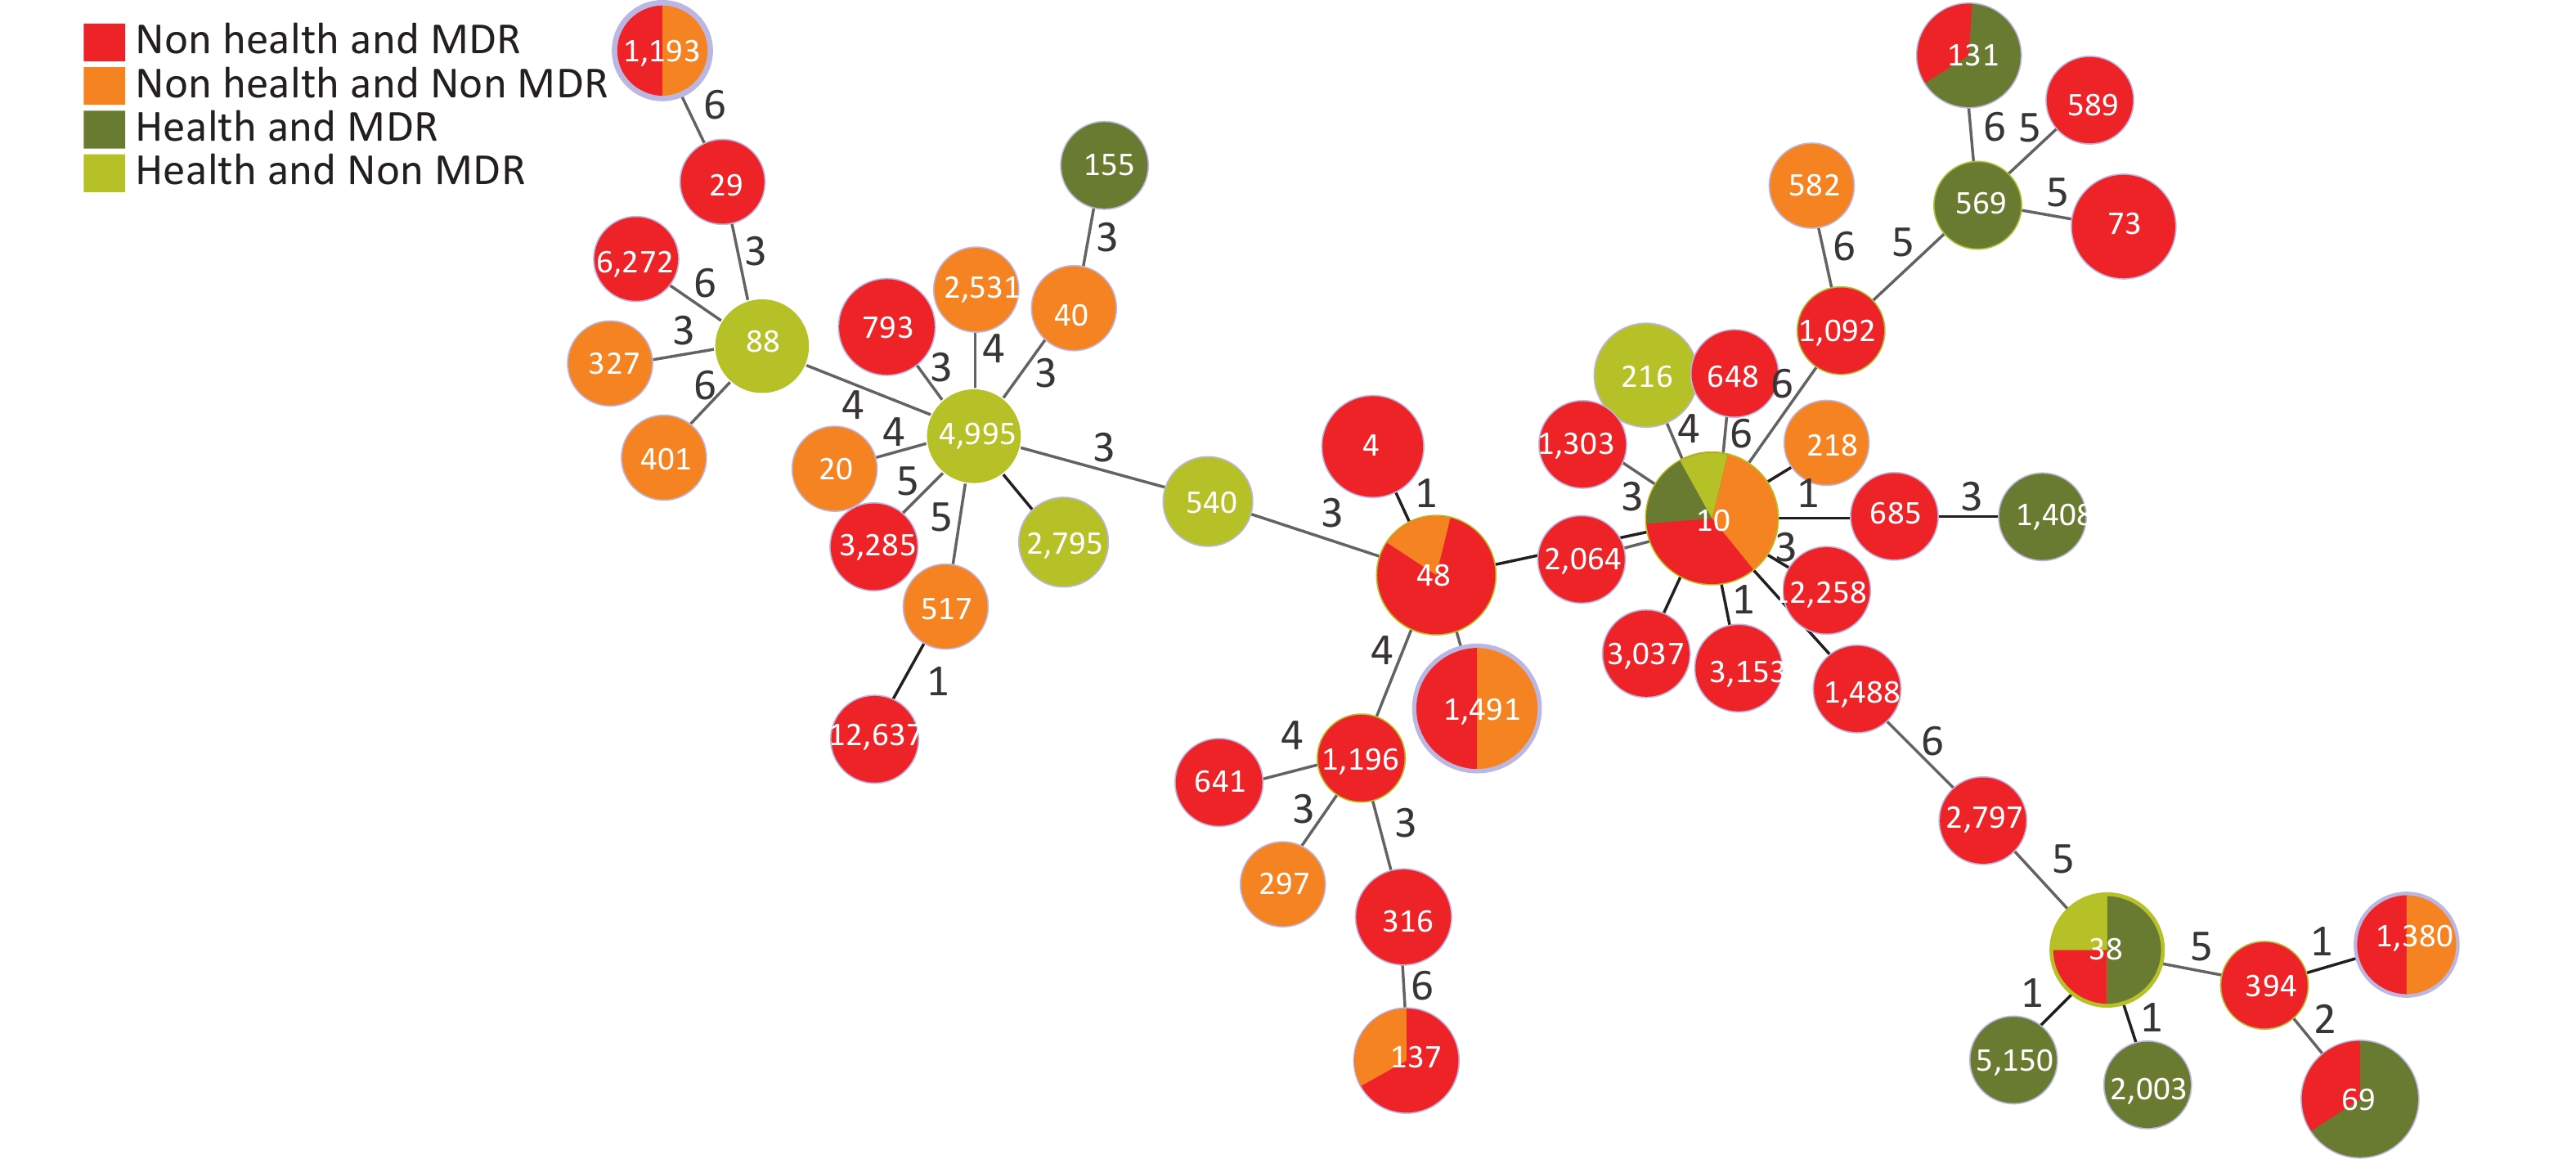
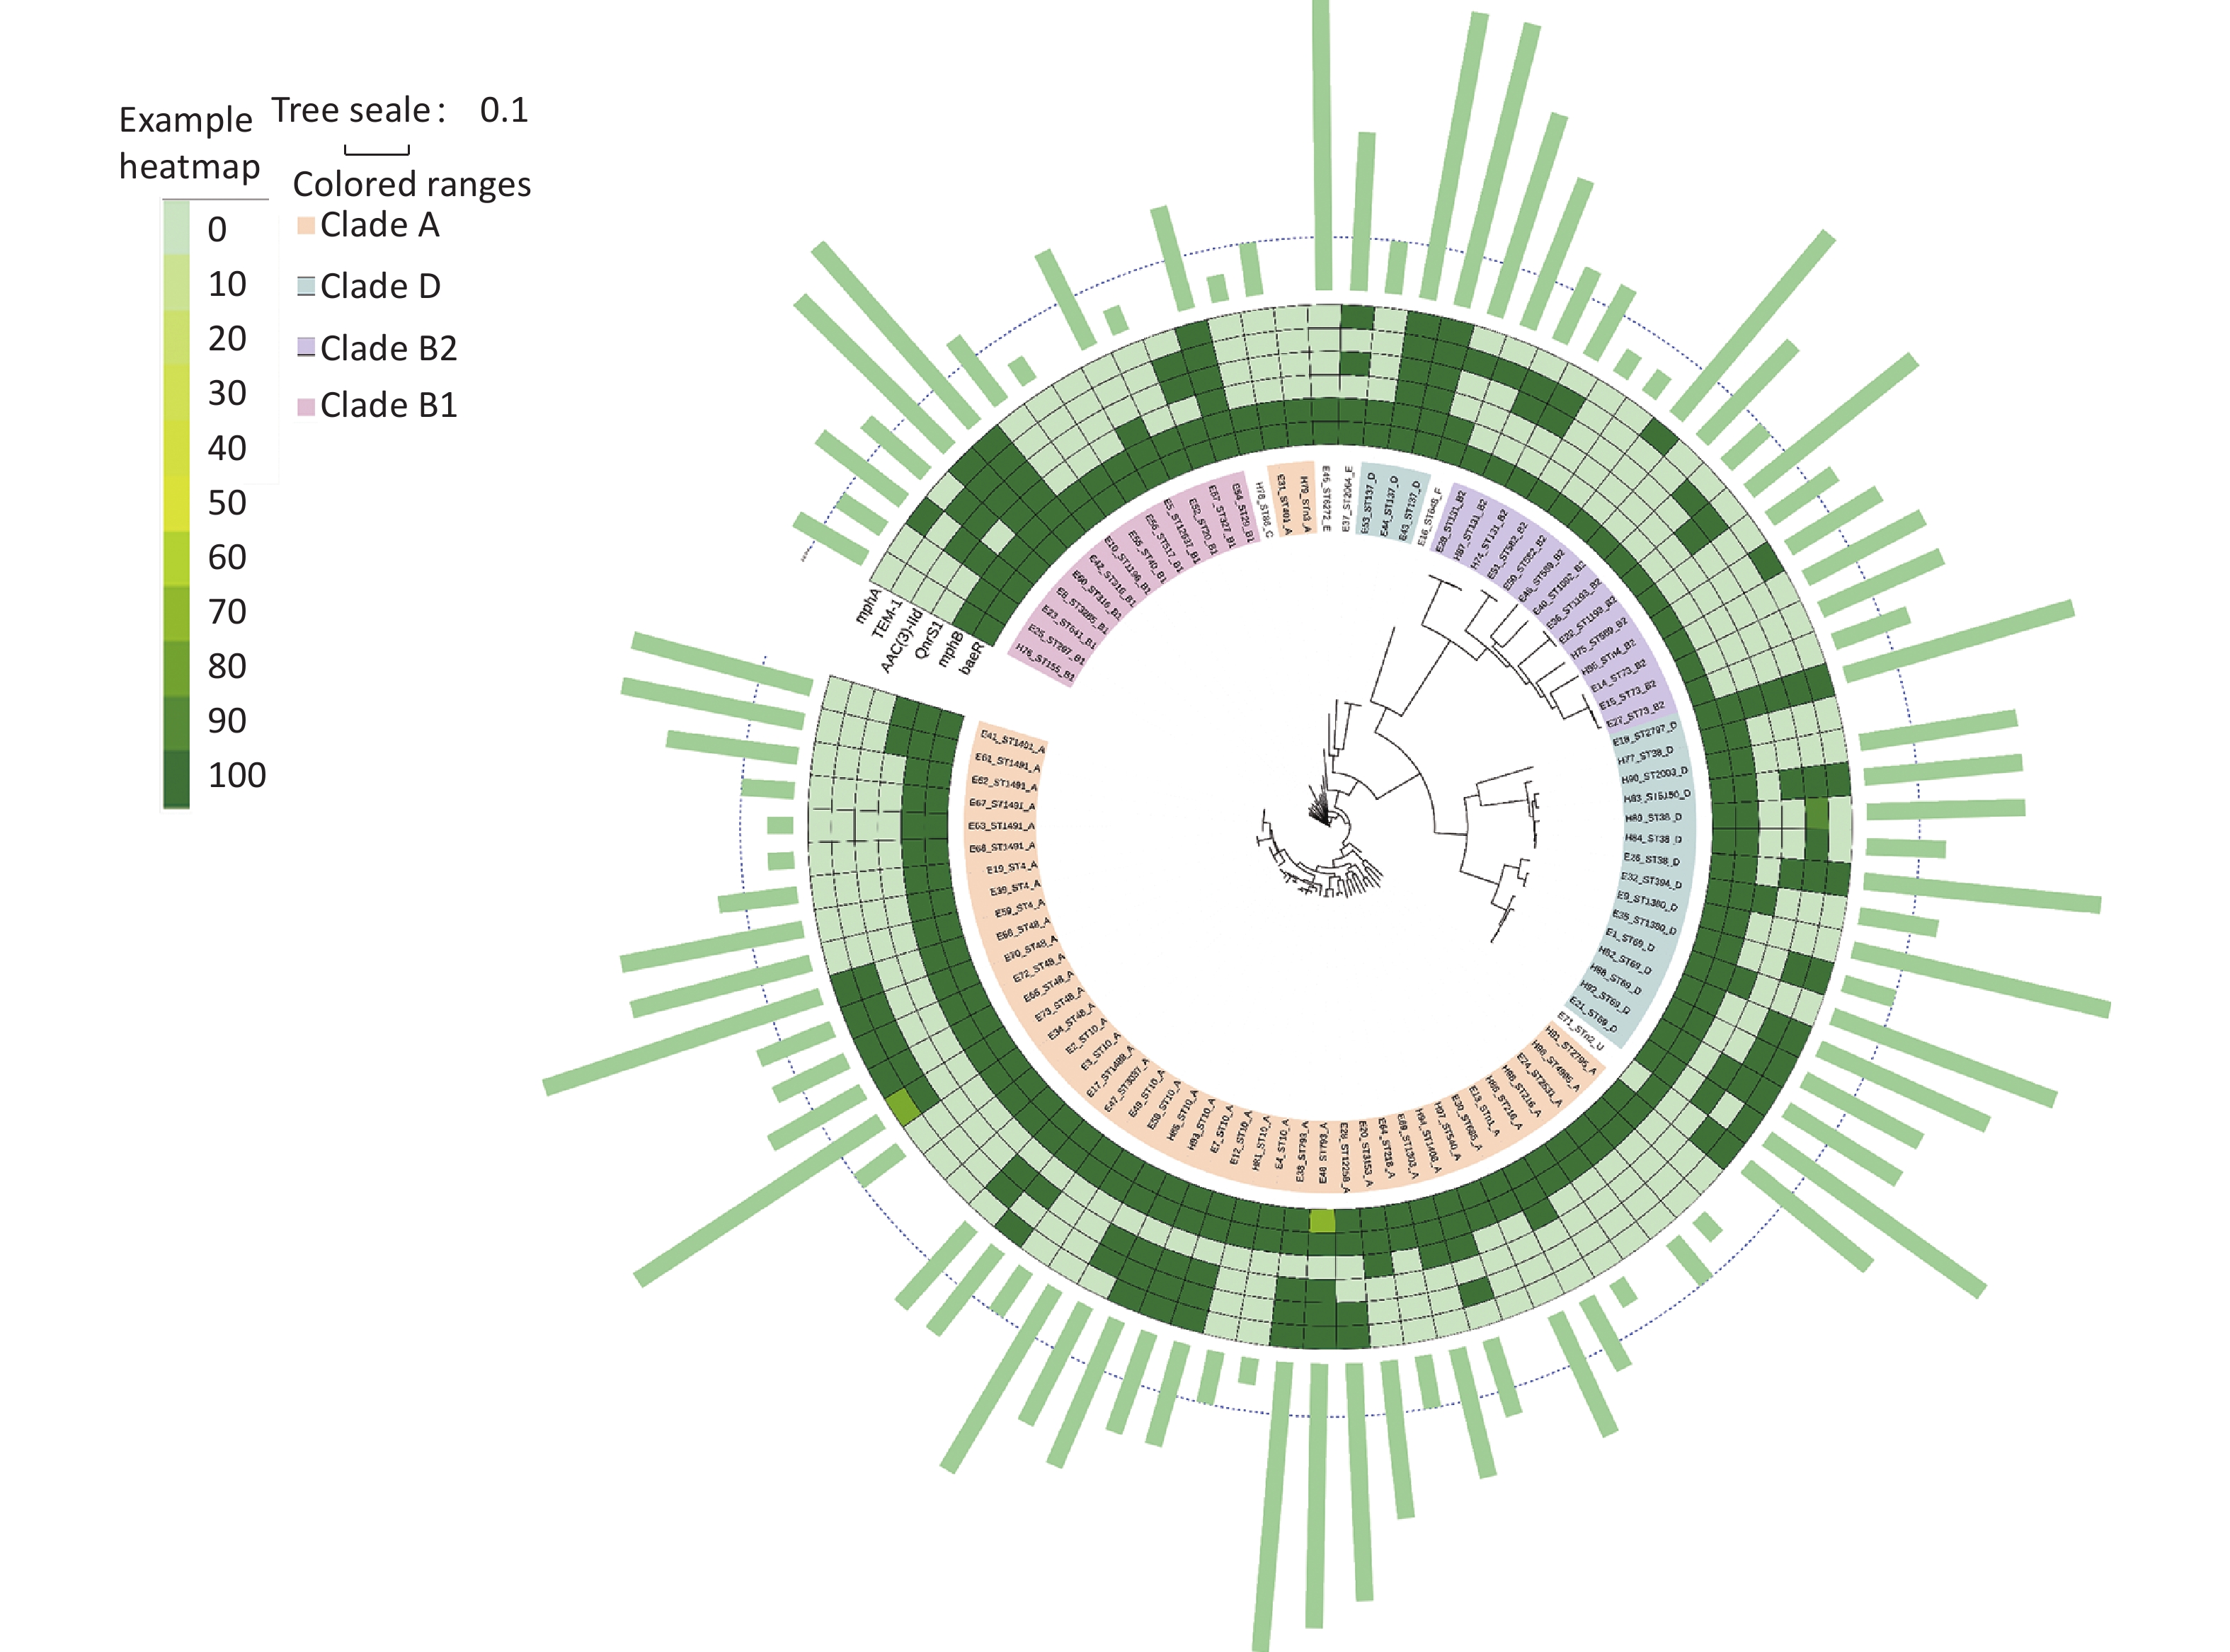
Based on the seven allelic differences, 94 E. coli strains were divided into 50 STs, of which two strains were named new STs, STn1 and STn2, because they failed to match any known ST. STs of E. coli isolates showed diverse distributions, with ST10 (10.64%) as the main epidemic type, followed by ST1491 (6.38%), ST48 (6.38%), and ST69 (5.32%), with MDR rates of 50.00% (5/10), 50.00% (3/6), 83.33% (5/6), and 100% (5/5). There were 28 STs (41 strains) with a 100% MDR, and 7 STs (20 strains) with a 50.00%–100% MDR. In addition, more than 50% of strains in four STs were resistant to > 4 types of antibiotics, including ST10 (50.00%), ST48 (50.00%), ST4 (66.70%), and ST73 (66.70%). Through a comparison between healthy and diarrheal patients, we found that ST48, ST137, ST4, ST73, ST69, ST38, and ST131 had more strains with MDR in the diarrheal group. ST38, ST69, ST131, and ST10 showed more strains with MDR in the healthy group. We also found that 70.00% (49/70) of the strains from the diarrheal group and 62.50% (15/24) of the strains from the healthy group had MDR. No difference in MDR was found between the two populations, indicating that the proportion of strains in the healthy group was relatively high. Therefore, the analysis was conducted according to the following conditions: i.e. diarrhea MDR, health MDR, diarrhea non MDR, and health non MDR. The results indicated that the MDR ratios of ST69 and ST131 were higher in the healthy group than in the diarrheal group. In ST69, MDR strains accounted for 60.00% of the participants in the healthy group and 40.00% in the diarrheal group. The healthy and diarrheal groups MDR rates for ST131 were 66.70% and 33.30%, respectively. In addition, more than 50% of the strains in four STs were resistant to > 4 types of antibiotics, including ST10 (50.00%), ST48 (50.00%), ST4 (66.70%), and ST73 (66.70%). Two new STs, namely STn1 and STn2, were identified in this study, with the representative strains E71, a strain with MDR from the diarrheal group, and H95, a strain with MDR from the healthy group (Figure 4).

Figure 4. Distribution of STs and MDR in the healthy and diarrheal groups. ST, sequence types; MDR, multidrug resistance
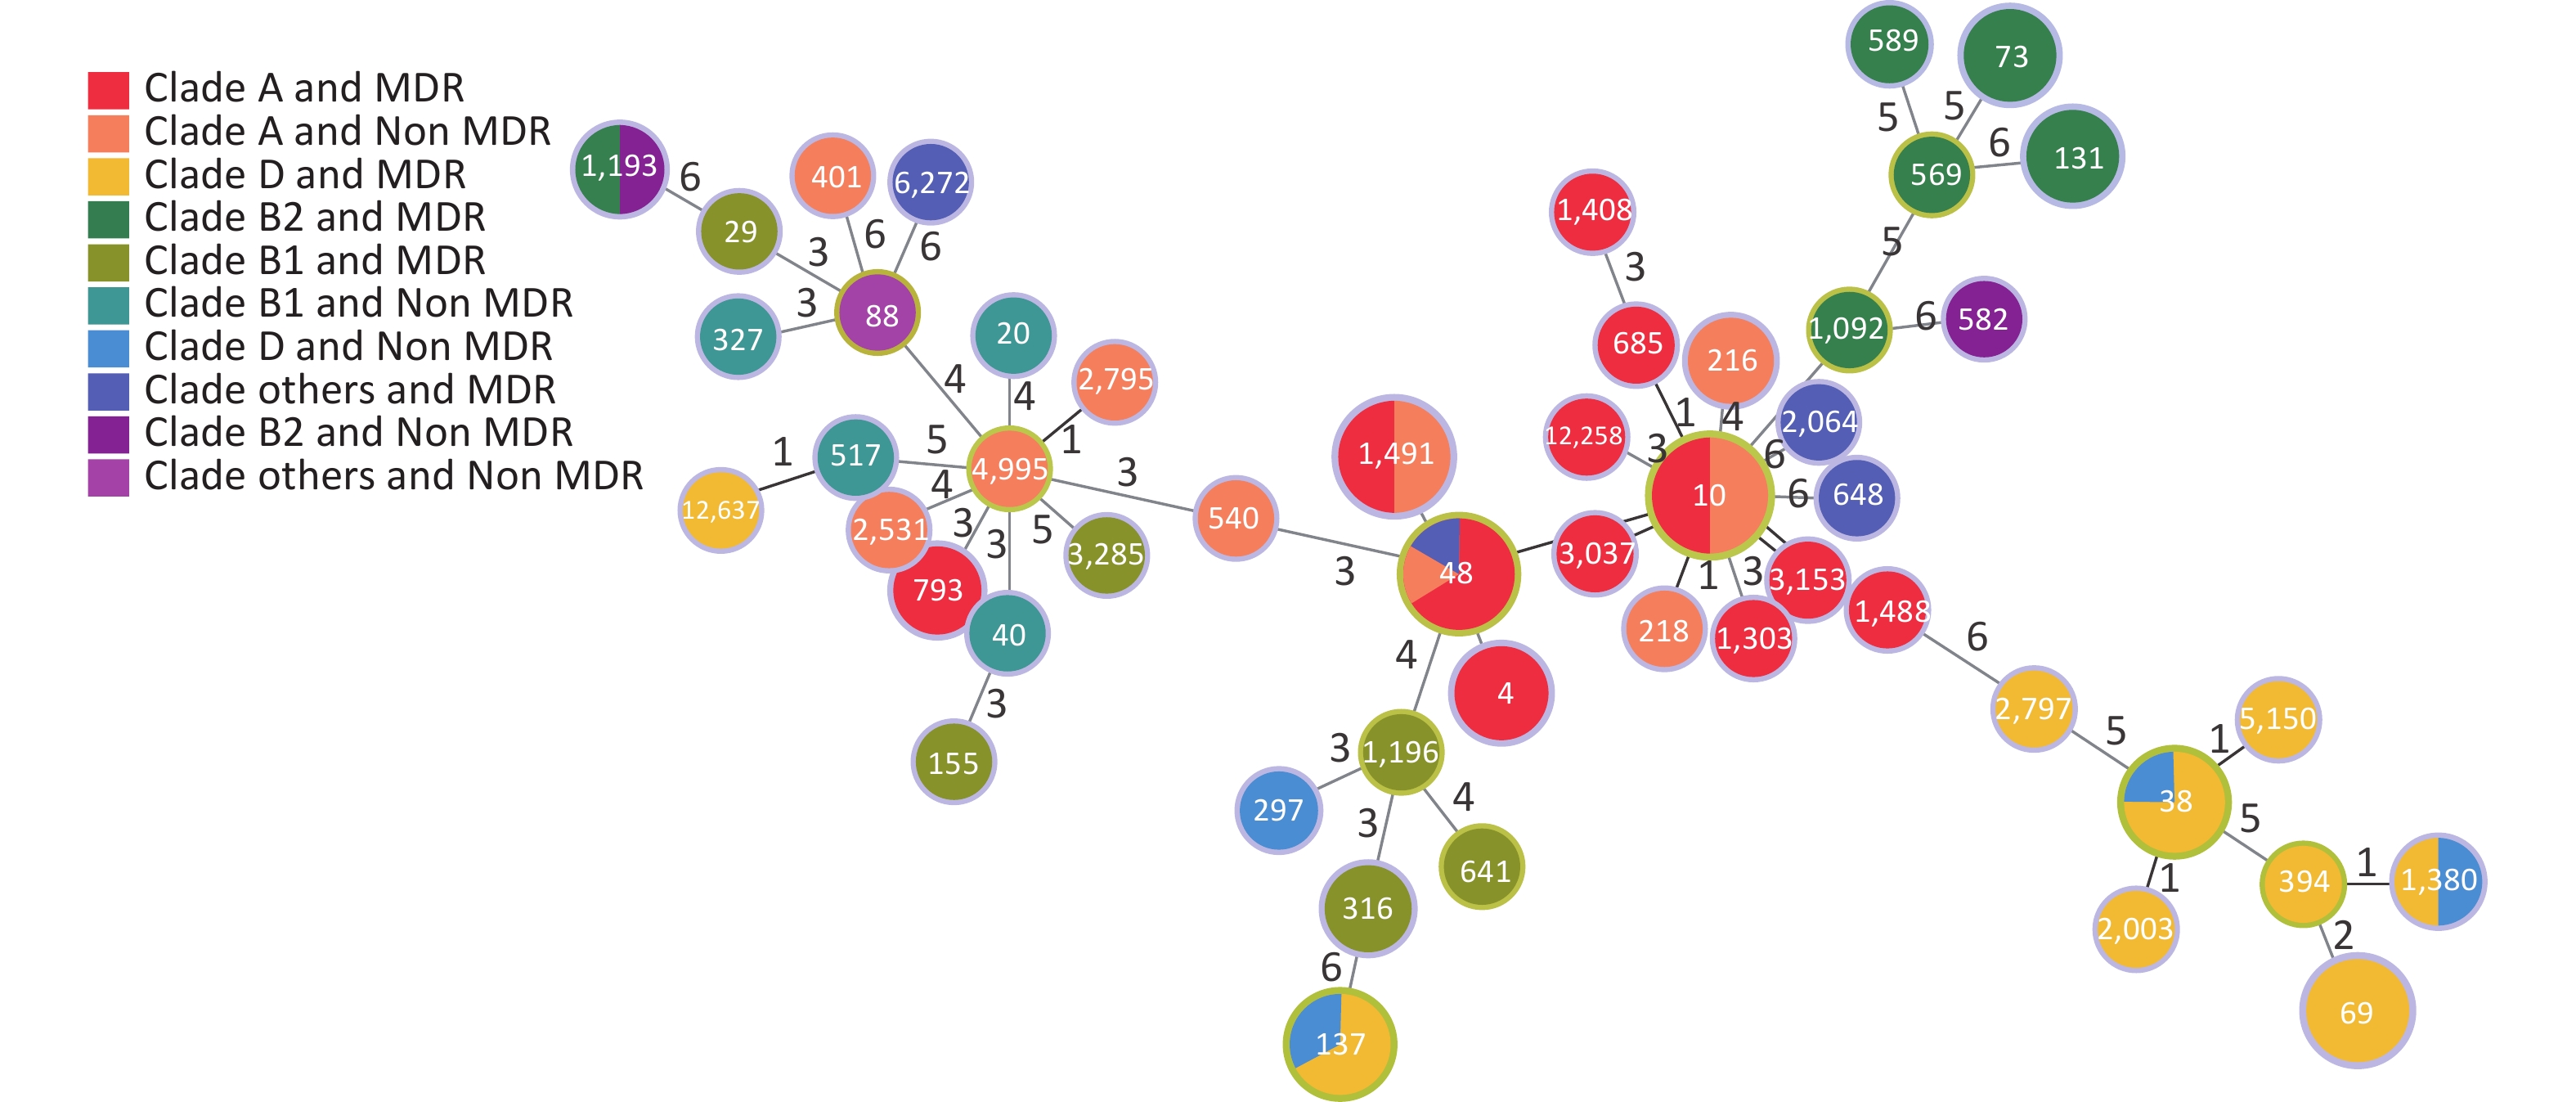
According to Clermont’s method, 94 E. coli strains could be divided into groups A (44 strains, 46.81%), B1 (11 strains, 11.70%), B2 (14 strains, 14.89%), C (1 strain, 1.06%), D (20 strains, 21.28%), E (2 strains, 2.13%), F (1 strain, 1.06%), and U (1 strain, 1.06%), with MDR rates of 59.09% (26/44), 63.64% (7/11), 78.57% (11/14), 0% (0/1), 80% (16/20), 100% (2/2), 100% (1/1), and 100% (1/1), respectively. Figure 5 shows the distribution of the groups and MDR. The Figure highlights that MDR groups are generally surrounded by MDR groups, and non MDR groups are also surrounded by non MDR groups. Because group B was more pathogenic than the other groups[21, 22], we analyzed group B in detail. The B2 group, including ST569, ST73, ST131, ST589, and ST1092, was an MDR group (100%). ST1193 in B2 had MDR (50%). ST582 in B2 did not have MDR (100%). ST29, ST3285, ST1196, ST155, ST316, ST641 in B1 had MDR (100%). ST327, ST20, ST517, ST40 in B1 were non MDR (100%).
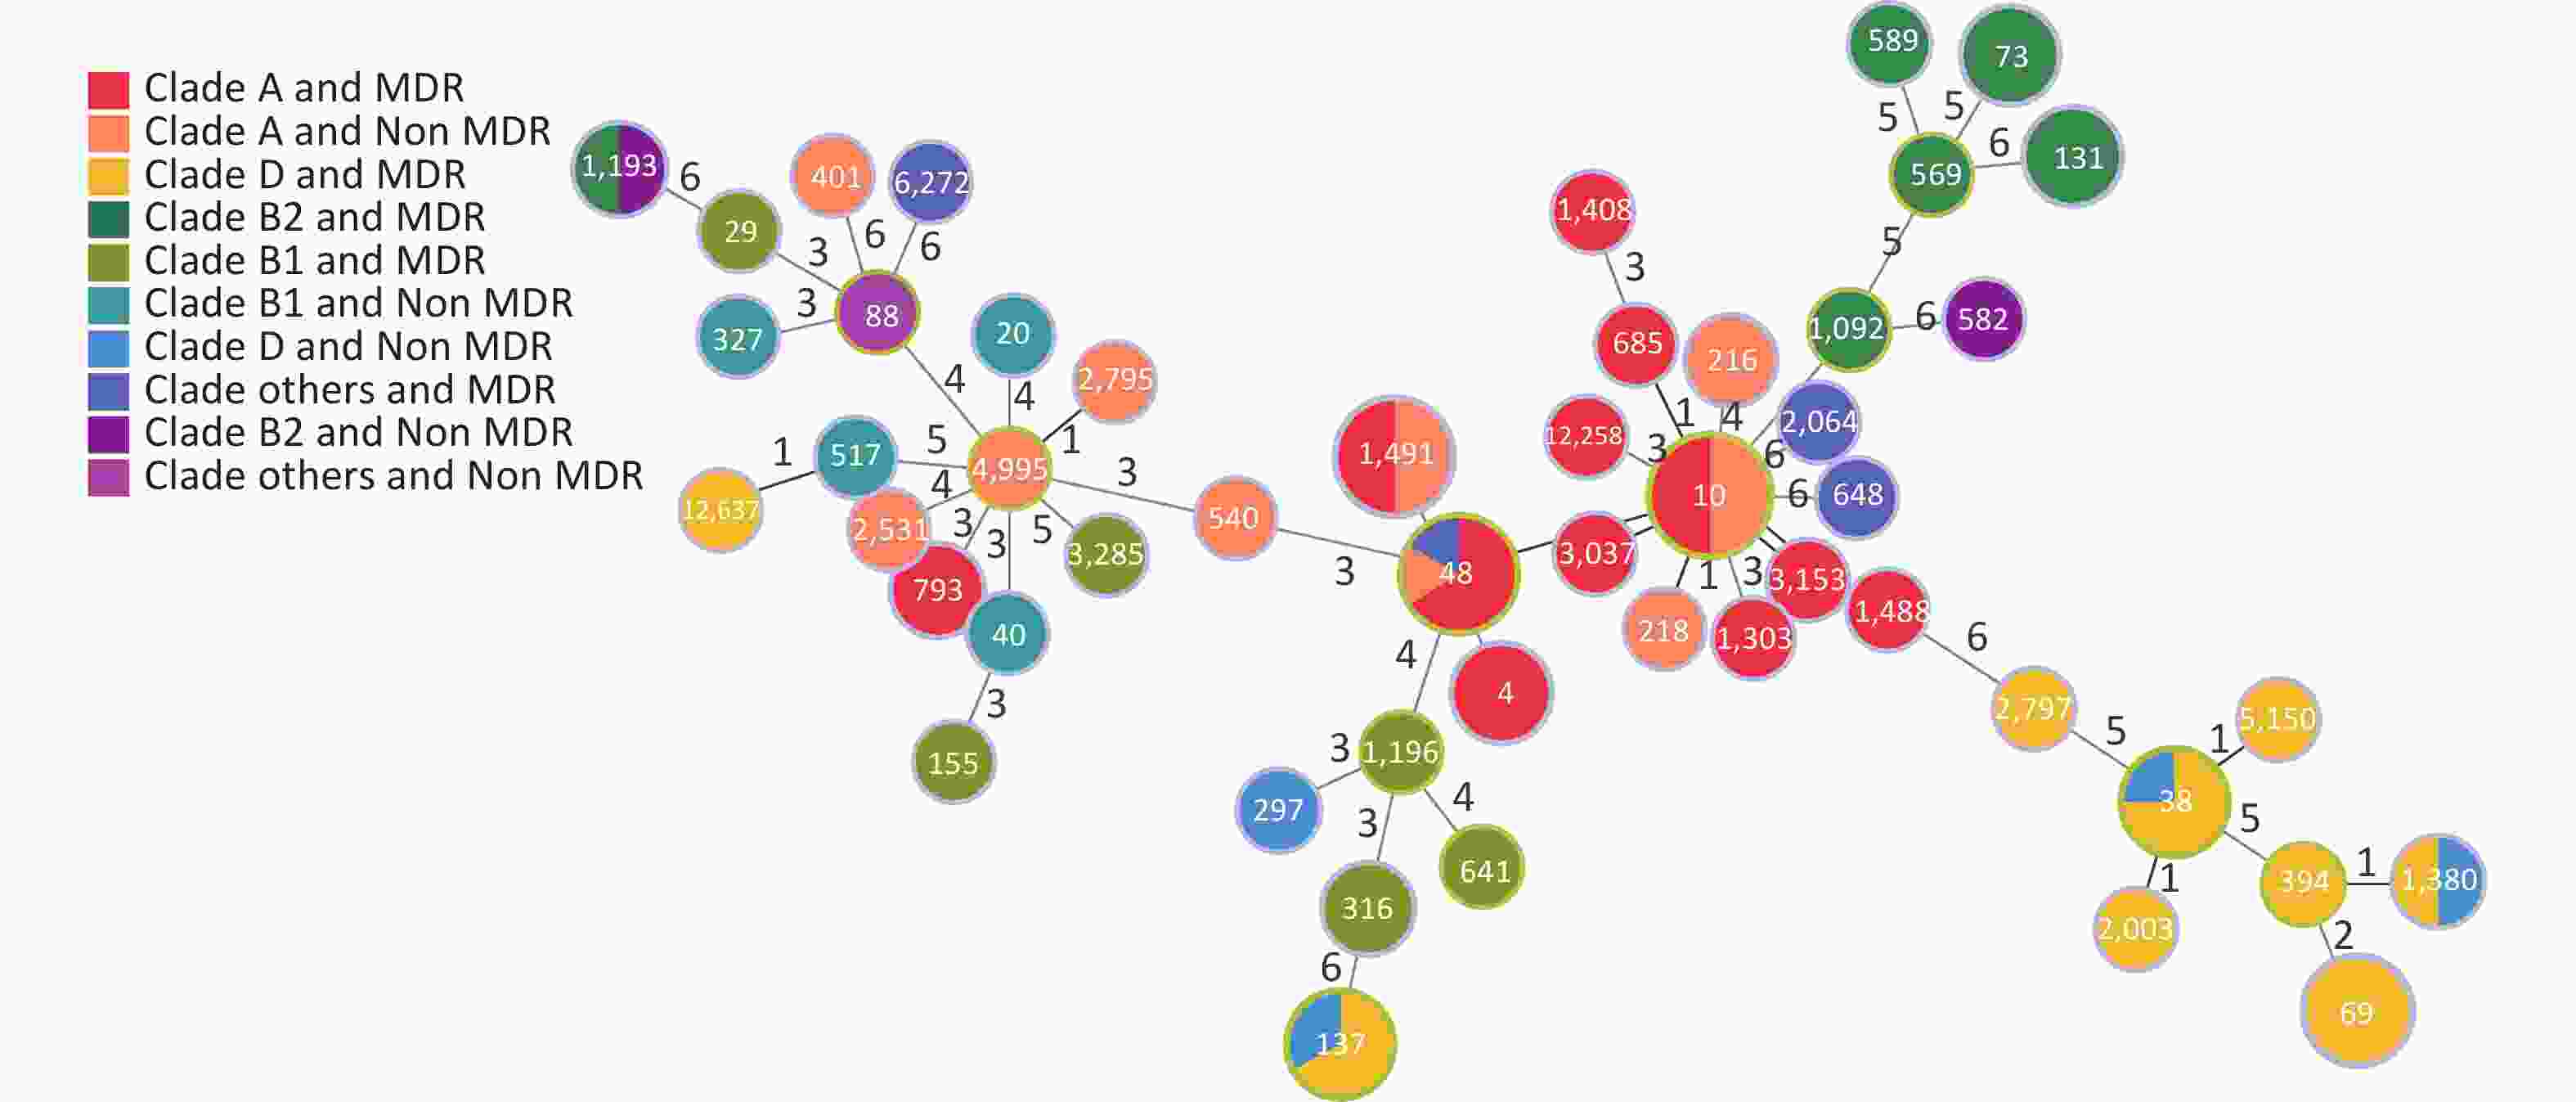
Figure 5. Distribution of the groups and MDR. MDR, multidrug resistance
We established an SNP tree for E. coli based on the number of SNP genes. We found that the MDR strains were distributed across all clades. No significant differences in MDR were observed among the clades. Moreover, Figure 6 shows that group A and D are the main groups. This represents the relationship between MDR and the six-gene combination. We can clearly see that the strains with TEM.1 + baeR + mphA + mphB + QnrS1 + AAC.3-IId genes positive combination all had MDR.
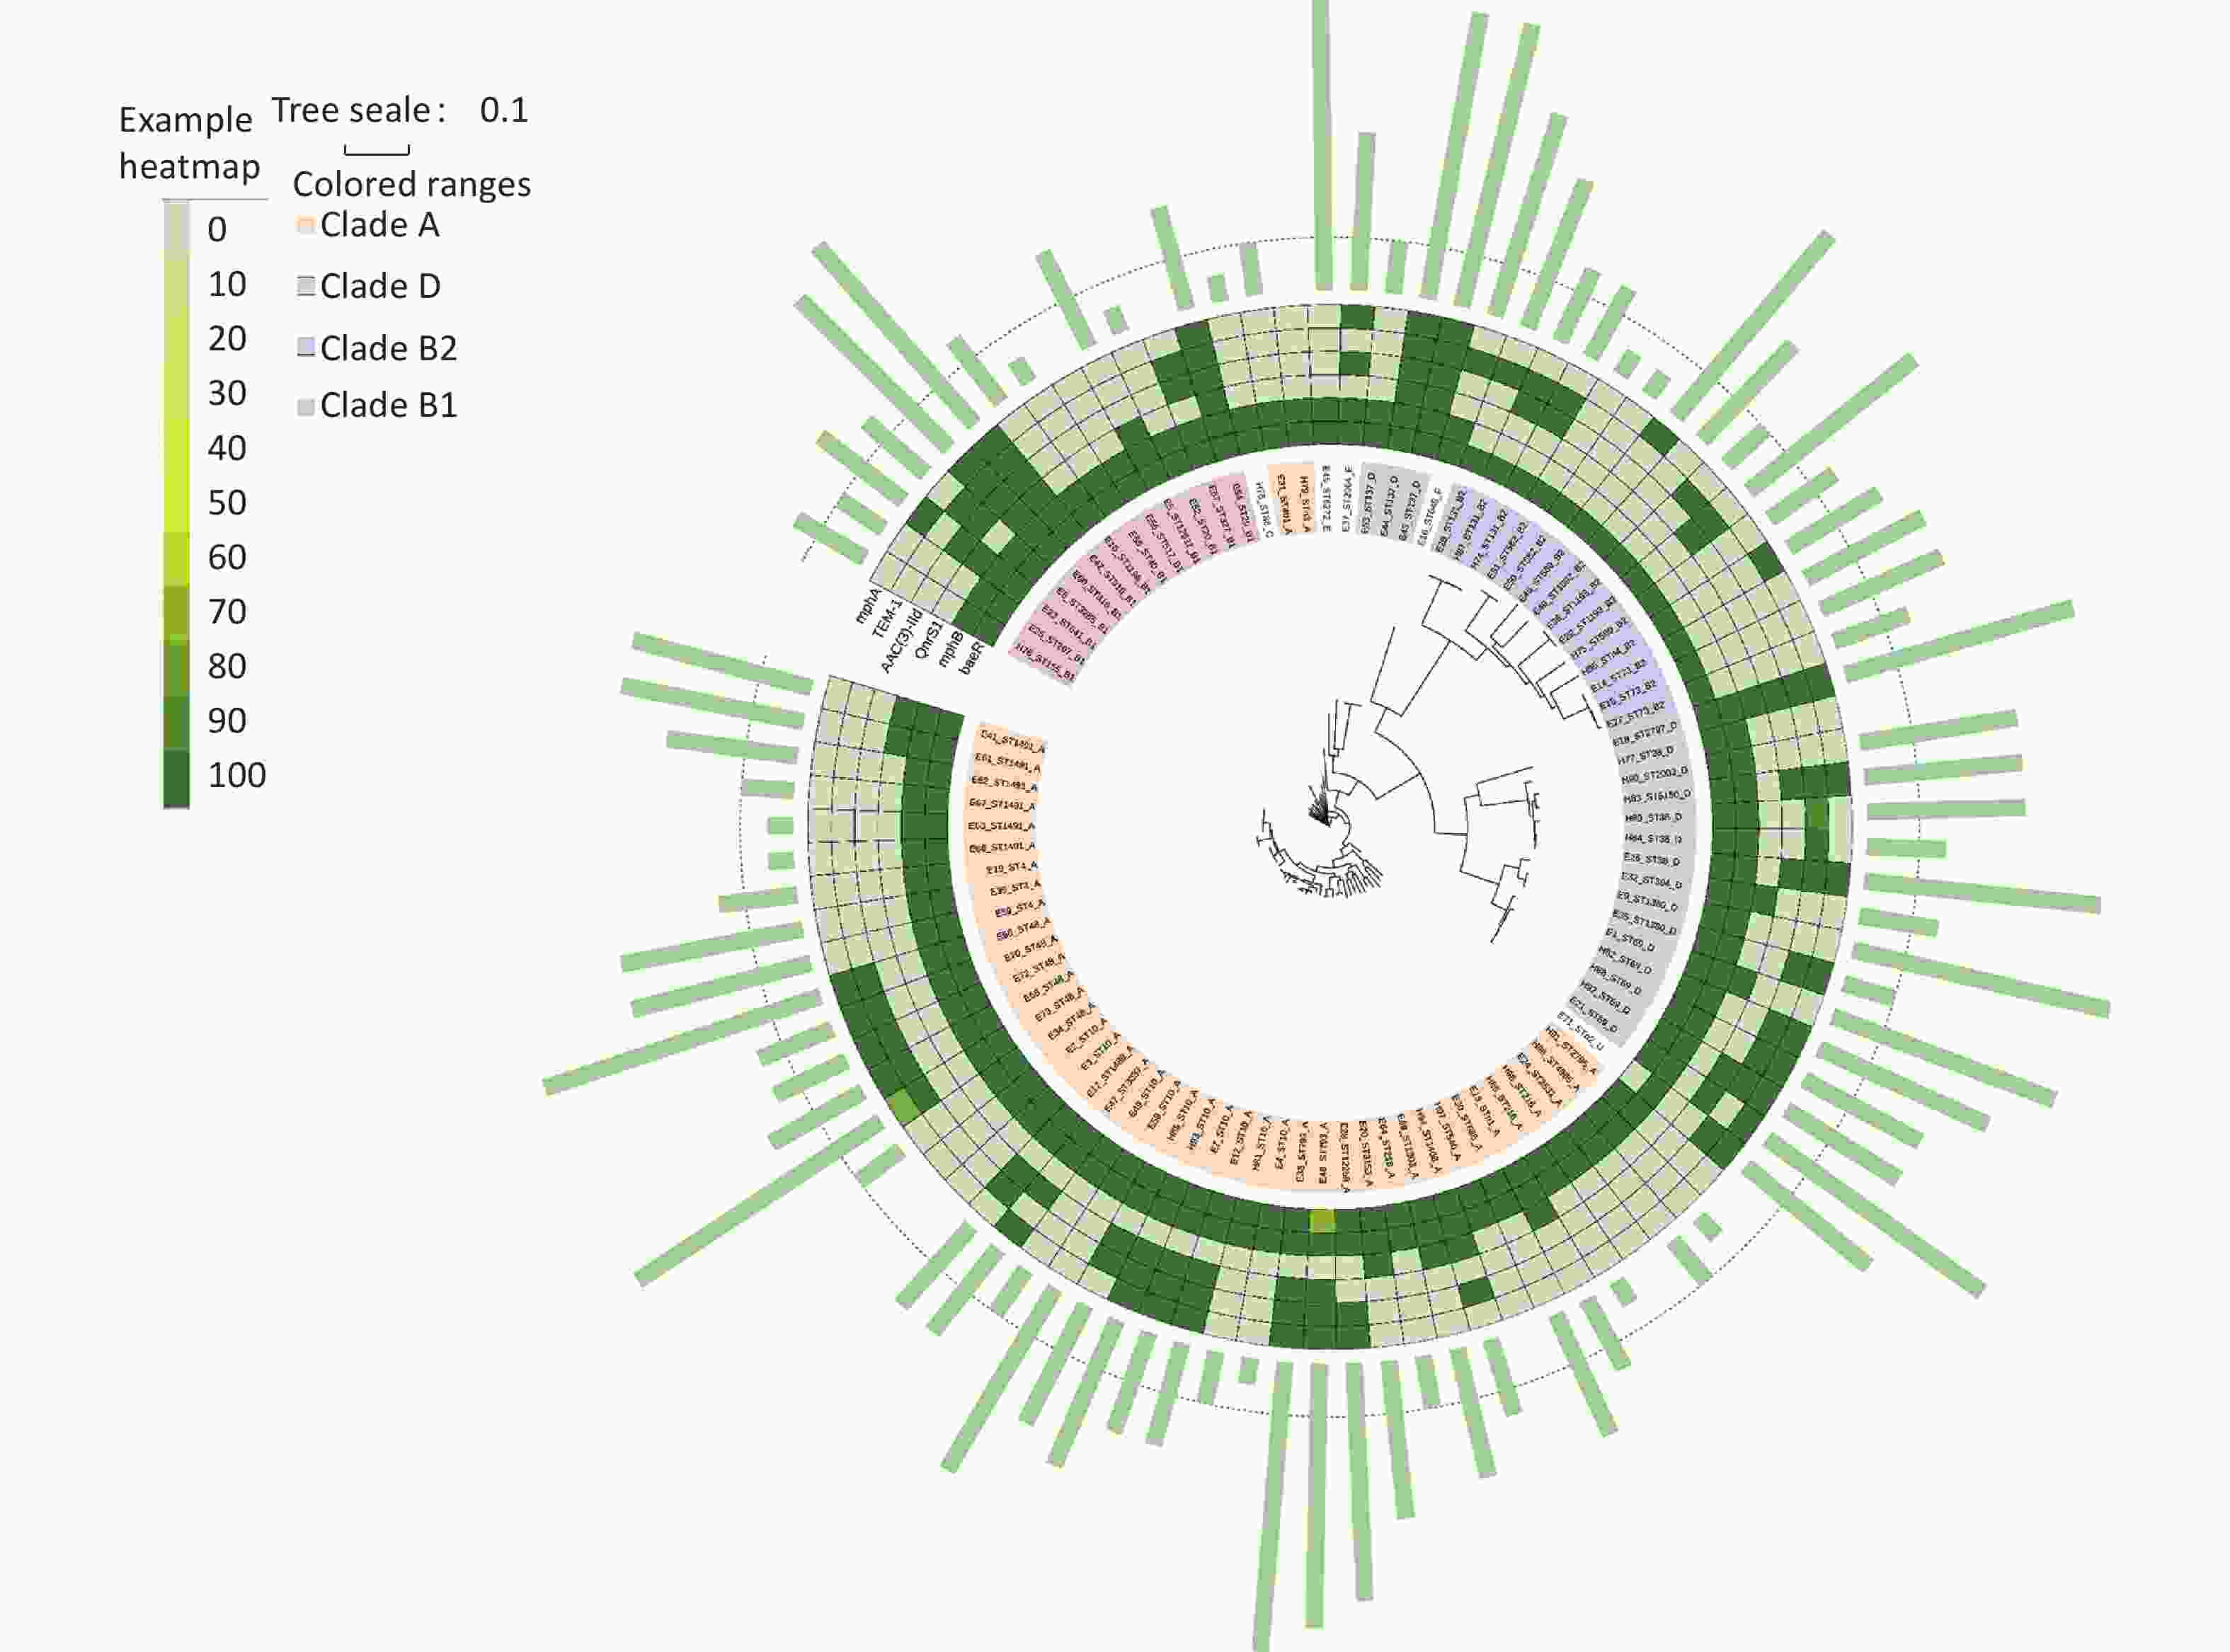
Figure 6. ML tree of E. coli based on SNP. ML, maximum likelihood; SNP, single nucleotide polymorphism
-
E. coli is a ubiquitous commensal bacterium in the intestinal tract and is an important pathogen of diarrhea and extraintestinal infections in humans and animals[3]. The resistance of E. coli to all available antimicrobial agents has been reported, including the last line of antibiotics that are reserved for treating infectious diarrhea. This is a medically alarming situation[10, 11]. The emergence of antimicrobial resistance in E. coli is a global public health threat, especially in the context of MDR[23-25]. Because commensal and pathogenic isolates usually share the same environment[3], MDR exists in living environments, such as water, meat, and healthy people[26]. This study showed that the E. coli MDR rate in the Miyun District was relatively high. Among the 94 isolated strains, 64 (68.09%) were multidrug resistant. This MDR rate was slightly lower than the 70.2% MDR rate of diarrheagenic E. coli in southeast China, slightly higher than the 63.97% rate in southwest China, and much higher than the 53.3% rate in Beijing [27-29]. Among these strains, 41 were resistant to ≥ 5 antibiotics, accounting for 43.62%, which is slightly lower than the resistance rate to 5–11 antibiotics reported in Southwest China (51.5%) [28]. However, two strains were resistant to 11 types of antibacterial drugs, warranting stringent and continuous surveillance of antibiotic resistance patterns.
Our results showed that the drug resistance rate of quinolones, which are the main drugs used for treating infectious diarrhea, reached 65.96%. The high drug resistance rate to quinolones may be related to their frequent use, which should be further investigated in Beijing and neighboring countries. The resistance rate to AMP was the highest in this study, and was slightly higher than that reported in Shanghai and Jilin, and slightly lower than that reported in India and Korea[30-33]. Among the antibiotic drugs tested, AMK, CT, and MEM were the most effective against E. coli. According to previously published reports, MDR presents with different rates of drug resistance in different regions. These variations could be attributed to the prevailing drug use and abuse in the specific study regions. In addition, compared to the diarrheal group, AMS, ETP, CZA, CTX, and AZI had obvious disinfection effects on E. coli isolated from the healthy group. In Miyun, these are the first-line drugs. This observation further illustrates the complexity of drug resistance in the strains isolated from the diarrheal group. Therefore, long-term monitoring of drug resistance is of crucial importance.
This study revealed that MDR was prevalent in different STs and clades of E. coli, including in the healthy group. This highlights the importance of paying attention to MDR even in apparently healthy individuals. From the perspective of STs, this study found that ST48, ST137, ST4, ST73, ST69, ST38, and ST131 had more MDR strains in the diarrheal group. However, ST38, ST69, ST131, and ST10 showed more MDR strains in the healthy group. There was no statistically significant difference in MDR between the diarrheal and healthy groups. This further highlights the notion that MDR is prevalent in healthy individuals. The MDR ratios of ST69 and ST131 in the healthy group were higher than those in the diarrheal group. Thus, the MDR of the healthy group in Miyun District was also highly valued. People continuously excrete drug resistant E. coli that can be transmitted via other humans, animals, and the environment through pollution[34]. This suggests that E. coli with MDR is present in the living environment. We should not only monitor resistance in samples obtained from patients with diarrhea, but also monitor samples from the environment and food over long periods of time. Our study also found that there were 61 strains (100%) in 35 STs with more than or equal to 50% of strains with MDR. Thus, the MDR of ST10, ST1491, ST48, ST4, and ST73 should be highlighted. Correlation analysis of STs and MDR revealed that ST10, ST1491, and ST48 were the top three epidemic STs of the 50 STs, with respective MDR rates of 50%, 50%, and 100% detected in this study, which is similar to the research conclusions of domestic clinical isolates in the Anhui province[35]. In contrast, ST1491 was highly susceptible to most antimicrobials in other parts of southeastern China[27]. The drug resistance of the ST type varied in different regions, which may be related to differences in strains and drug usage habits. These STs and their MDR rates must be monitored to detect changes over time, which is important for preventing the spread of drug resistance. Moreover, some studies have indicated that over 50% of the strains in ST73 with extraintestinal infections showed MDR, while drug resistance was rarely detected[36]. Whether different locations in the human body and the same ST of E. coli infection affect the same pattern of drug resistance is worth investigating. In seven cities in China, high MDR resistance rates in ST1193 strains were mostly observed in children[36]. Our study showed that the ST1193 strains were all isolated from elderly people over 60 years of age. Therefore, sufficient attention should be paid to the population characteristics as well.
From the perspective of different phylogenetic groups, there were no statistical differences in MDR among the different clades. The MDR situation is slightly more serious compared with the previous study in Beijing conducted in 2007–2009, which indicated that 50% of the MDR E. coli isolates belonged to phylogenetic group D, followed by group A. The polymorphism tree in this study showed that E. coli isolates had rich diversity, with a high proportion of groups A and D and a low proportion of group B1. The existing literature also shows that group B has a relatively strong pathogenicity, whereas groups A and D have a relatively weak pathogenicity [21, 22]. Therefore, a slightly positive aspect in Miyun is that these predominant MDR clades have low pathogenicity. This study showed that almost all STs in group B2 had MDR. Further investigations are required to determine whether toxicity is related to drug resistance. In addition, there was a statistically significant difference in the distribution of MDR in groups A, B, and D between the different age groups. In clade A, the proportion of MDR strains in young adults (16–30) was the highest (P < 0.05). There was no statistical difference in the distribution of MDR between the urban and mountainous areas.
To identify the risk genes for MDR, we compared ARGs with MDR. Eight genes were found to be significantly associated with MDR, namely gadW, dfrA17, mphA, aadA5, qnrS1, AAC(3)-Id, sul1, and TEM.1. These genes are common ARGs which have been extensively studied. Furthermore, to achieve more accurate risk prediction of complex combination patterns, we developed an RF machine learning approach to quantify the power of different combinations of ARGs to predict MDR. In a non-parametric deep machine learning model, all strains were used to train the model and were highly effective at extracting nonlinear relationships from input data while being time-efficient. RF regressors are ensemble models of regression trees trained on different subsets of input data, which reduce the variance of predictors and minimize overfitting [12]. In this study, a classification accuracy of 85.19% was achieved. Among the classifiers that provided the most accurate prediction was the pattern of TEM.1 + baeR + mphA + mphB + QnrS1 + AAC.3-IId genes. Strains that has all of those 6 genes belonged to the MDR group. We successfully applied the RF method to predict MDR, demonstrating its ability and simultaneously highlighting its importance. RF has been successfully utilized in prior studies to predict infectious diseases and has also been applied for short-term forecasting of COVID-19 infections by Ribeiro et al.[37]. To verify the model’s accuracy, we plan to increase the number of strains in future studies.
The six genes in the TEM.1 + baeR + mphA + mphB + QnrS1 + AAC.3-IId set were all related to mobile units. These mobile units may therefore be involved in MDR. Mph is present in the plasmid known to transfer MDR. TEM was used to locate the transposon Tn1 of the resistant plasmid. Sul1 is usually regulated by a class I integron which participates in the prediction of MDR. AAC(3)-IId can be found in mobile units such as class I integrons, insertion sequences, Tn transposons, and bacteriophages[38-41]. MDR is then most probably transmitted by these mobile units. In the last decade, numerous ARGs have been identified in E. coli isolates, many of which were acquired through horizontal gene transfer. Resistant E. coli may act as a significant reservoir for ARGs, thus playing a considerable role in the spread of drug resistance in the environment. In the enterobacterial gene pool, E. coli acts both as a donor and recipient of ARGs, meaning that E. coli cannot only acquire resistance genes from other bacteria but also pass such genes to other bacteria. These mobile elements can rearrange, resect, and transfer ARGs by capturing foreign genes and transferring them horizontally, thus easily spreading antibiotic resistance and promoting the rapid evolution, diversification, and adaptation of E. coli strains.
Moreover, among all MDR strains, 16 were resistant to more than 9 types of antibiotics, especially E43 and E44, which were resistant to 11 antibiotic drugs. All of them belonged to the severe MDR group. Among them, fosA3, dfrA1, and SAT-1 were relatively uncommon genes found in this study. FosA are found on mobile genetic elements[42]. Isolates carrying plasmid-mediated fosA have also been found in companion animals. The first cases in China were reported in 2012 and 2013 in dogs and cats [43]. Another study reported the high prevalence of fosA3-producing E. coli in pets and their owners, highlighting the transmission of fosfomycin-resistant E. coli isolates between humans and animals [44]. The discovery of fosA drug resistance gene in this study suggests that the MDR of this strain may be transmitted from animals to humans through transfer factors carrying the related drug resistance genes. Therefore, monitoring of drug resistance genes in animals, the environment, and humans is necessary. The E9 strain resistant to 10 antimicrobial drugs, was found to have SAT-1 and dfrA1 genes, which are rarely detected and can enhance drug resistance. However, the roles of SAT-1 and dfrA1 genes in drug resistance requires further evaluation. Uncommon genes in severe MDR strains warrant stringent and continuous surveillance.
-
This study found that MDR E. coli was prevalent, with a relatively high rate of distribution in different clades, including the healthy group. MDR and low pathogenic clade STs were prominent in the Miyun District. RF prediction model for TEM.1 + baeR + mphA + mphB + QnrS1 + AAC.3-IId, a marker of MDR, should be identified early to demonstrate its potential for MDR detection. The high rate of MDR was most likely caused by the presence of genetic mobile units. In the future, we will further increase the number of strains to verify the accuracy of the RF prediction model. At the same time, we should strengthen the monitoring of rare genes such as fosA. Long-term monitoring is necessary to control the prevalence of MDR E. coli in the region, formulate strategies, and guide the treatment of patients with diarrhea.
-
The study was conducted in accordance with the Declaration of Helsinki and was approved by the Institutional Review Board (or Ethics Committee) of the Biomedical Research Ethics Committee of the Miyun District Hospital, Beijing (2023, 002-001).
-
This study was exempt from informed consent and was approved by the Biomedical Research Ethics Committee of the Miyun District Hospital, Beijing. This retrospective study reviewed characteristics of drug resistance and drug resistance genes in E. coli. Information related to this study was kept strictly confidential. Names, families, addresses, and contact information were not disclosed in the study report, and personal photographs were not included. This study did not involve the recollection of other clinical samples from the participants, and no additional auxiliary examinations, treatment interventions, or follow-up requirements were made.
-
The data generated in the study are listed in Appendix.
doi: 10.3967/bes2023.050
Genotyping Characteristics of Human Fecal Escherichia coli and Their Association with Multidrug Resistance in Miyun District, Beijing
-
Abstract:
Objective To explore the genotyping characteristics of human fecal Escherichia coli (E. coli) and the relationships between antibiotic resistance genes (ARGs) and multidrug resistance (MDR) of E. coli in Miyun District, Beijing, an area with high incidence of infectious diarrheal cases but no related data. Methods Over a period of 3 years, 94 E. coli strains were isolated from fecal samples collected from Miyun District Hospital, a surveillance hospital of the National Pathogen Identification Network. The antibiotic susceptibility of the isolates was determined by the broth microdilution method. ARGs, multilocus sequence typing (MLST), and polymorphism trees were analyzed using whole-genome sequencing data (WGS). Results This study revealed that 68.09% of the isolates had MDR, prevalent and distributed in different clades, with a relatively high rate and low pathogenicity. There was no difference in MDR between the diarrheal (49/70) and healthy groups (15/24). Conclusion We developed a random forest (RF) prediction model of TEM.1 + baeR + mphA + mphB + QnrS1 + AAC.3-IId to identify MDR status, highlighting its potential for early resistance identification. The causes of MDR are likely mobile units transmitting the ARGs. In the future, we will continue to strengthen the monitoring of ARGs and MDR, and increase the number of strains to further verify the accuracy of the MDR markers. -
Key words:
- E. coli /
- Multidrug resistance /
- Whole-genome sequencing /
- Antibiotic resistance genes /
- Random forest
The authors have no conflicts of interest to declare.
&These authors contributed equally to this work.
注释:1) AUTHOR CONTRIBUTIONS: 2) CONFLICTS OF INTEREST: -
Figure 1. Number of kinds of ARGs and the MDR rate. ARGs, antibiotic resistance genes; MDR, multidrug resistance
Figure 2. Correlation between the RF analysis gene combination and MDR. RF, random forest; MDR, multidrug resistance.
Figure 3. Confidence interval between the MDR and non-MDR controls. MDR, multidrug resistance; AUC, area under the receiver operating characteristic curve
Figure 4. Distribution of STs and MDR in the healthy and diarrheal groups. ST, sequence types; MDR, multidrug resistance
Figure 6. ML tree of E. coli based on SNP. ML, maximum likelihood; SNP, single nucleotide polymorphism
Table 1. Drug resistance of 94 E. coli strains
Antibiotic Toltel antibiotic resistance n (%) Diarrheagenic E. coli (n = 70) Common E.coli (n = 24) P Antibiotic resistance n (%) No antibiotic resistance n (%) Antibiotic resistance n (%) No antibiotic resistance n (%) Ampicillin (AMP) 63 (67.02) 49 (70.00) 21 (30.00) 14 (58.33) 10 (41.67) 0.294 Ampicillin/sulbactam (AMS) 25 (26.60) 24 (34.29) 46 (65.71) 1 (4.17) 23 (95.83) 0.004 Tetracycline (TET) 36 (38.30) 25 (35.71) 45 (64.29) 11 (45.83) 13 (54.17) 0.379 Meropenem (MEM) 2 (2.13) 2 (2.86) 68 (97.14) 0 24 (100) 0.986 Polymyxin E (CT) 2 (2.13) 1 (1.43) 69 (98.57) 1 (4.17) 23 (95.83) 1.000 Ertapenem (ETP) 30 (31.91) 30 (42.86) 40 (57.14) 0 24 (100) < 0.001 Ceftazidime/avibactam (CZA) 26 (27.66) 26 (37.14) 44 (62.86) 0 24 (100) < 0.001 Tigecycline (TIG) 7 (7.45) 7 (1.00) 63 (90.00) 0 24 (100) 0.279 Cefotaxime (CTX) 26 (27.66) 24 (34.29) 46 (65.71) 2 (8.33) 22 (91.67) 0.014 Ceftazidime (CAZ) 7 (7.45) 7 (1.00) 63 (90.00) 0 24 (100) 0.246 Ciprofloxacin (CIP) 39 (41.49) 30 (42.86) 40 (57.14) 9 (37.50) 15 (62.50) 0.646 Azithromycin (AZI) 28 (29.79) 25 (35.71) 45 (64.29) 3 (12.50) 21 (87.50) 0.032 Chloramphenicol (CHL) 8 (8.51) 8 (11.43) 62 (88.57) 0 24 (100) 0.191 Nalidixic acid (NAL) 53 (56.38) 38 (54.29) 32 (45.71) 15 (62.50) 9 (37.50) 0.484 Streptomycin (STR) 31 (32.98) 23 (32.86) 47 (67.14) 8 (33.33) 16 (66.67) 0.966 Trimethoprim/sulfamethoxazole (SXT) 33 (35.11) 25 (35.71) 45 (64.29) 8 (33.33) 16 (66.67) 0.833 Amikacin (AMK) 0 0 70 (100) 0 24 (100) / Multidrug resistance (MDR) 64 (68.09) 49 (70.00) 21 (30.00) 15 (62.50) 9 (37.50) 0.496  下载: 导出CSV
Table 2. Eight drug resistance genes with significant correlation with MDR
ARGs χ2 P gadW 4.990 0.025* dfrA17 9.728 0.002** mphA 11.262 0.001** aadA5 9.038 0.003** qnrS1 5 .845 0.016* AAC(3)-IId 10.650 0.001** sul1 5.591 0.018* TEM.1 8.249 0.004** Note. *P < 0.05; **P < 0.01. ARGs, antibiotic resistance genes; MDR, multidrug resistance.
下载: 导出CSV
-
[1] Lopez AD, Mathers CD. Measuring the global burden of disease and epidemiological transitions: 2002-2030. Ann Trop Med Parasitol, 2006; 100, 481−99. doi: 10.1179/136485906X97417 [2] Mei L, Baiqing D. Status in epidemiological research of infectious diarrhea. China Trop Med Cine, 2008; 8, 675−7. (In Chinese [3] Wu GH, Day MJ, Mafura MT, et al. Comparative analysis of ESBL-positive Escherichia coli isolates from animals and humans from the UK, The Netherlands and Germany. PLoS One, 2013; 8, e75392. doi: 10.1371/journal.pone.0075392 [4] Wang XY, Wu XM, Wang R, et al. Epidemiological characteristics of food poisoning in China, the first quarter, 2018. Dis Surveill, 2018; 33, 452−6. (In Chinese [5] Wang XM, Ren JH, Wang XY, et al. Epidemiological characteristics of food poisoning event in China, 2018. Dis Surveill, 2019; 34, 640−4. (In Chinese [6] Ren JH, Wang XY, Wu XM, et al. Epidemiological characteristics of food poisoning in China, July-September, 2018. Dis Surveill, 2019; 34, 741−5. (In Chinese [7] Aslani MM, Ahrabi SSA, Alikhani YM, et al. Molecular detection and antimicrobial resistance of diarrheagenic Escherichia coli strains isolated from diarrheal cases. Saudi Med J, 2008; 29, 388−92. [8] Liu JY, Liao TL, Huang WC, et al. Increased mcr-1 in pathogenic Escherichia coli from diseased swine, Taiwan. J Microbiol, Immunol Infect, 2020; 53, 751−6. doi: 10.1016/j.jmii.2018.10.011 [9] Park SB, Park YK, Ha MW, et al. Antimicrobial resistance, pathogenic, and molecular characterization of Escherichia coli from diarrheal patients in South Korea. Pathogens, 2022; 11, 385. doi: 10.3390/pathogens11040385 [10] Russo TA, Johnson JR. Medical and economic impact of extraintestinal infections due to Escherichia coli: focus on an increasingly important endemic problem. Microbes Infect, 2003; 5, 449−56. doi: 10.1016/S1286-4579(03)00049-2 [11] Omolajaiye SA, Afolabi KO, Iweriebor BC. Pathotyping and antibiotic resistance profiling of Escherichia coli isolates from children with acute diarrhea in amatole district municipality of Eastern Cape, South Africa. BioMed Res Int, 2020; 2020, 4250165. [12] Nji E, Kazibwe J, Hambridge T, et al. High prevalence of antibiotic resistance in commensal Escherichia coli from healthy human sources in community settings. Sci Rep, 2021; 11, 3372. doi: 10.1038/s41598-021-82693-4 [13] Talukdar PK, Rahman M, Rahman M, et al. Antimicrobial resistance, virulence factors and genetic diversity of Escherichia coli isolates from household water supply in Dhaka, Bangladesh. PLoS One, 2013; 8, e61090. doi: 10.1371/journal.pone.0061090 [14] Iramiot JS, Kajumbula H, Bazira J, et al. Whole genome sequences of multi-drug resistant Escherichia coli isolated in a pastoralist community of western Uganda: phylogenomic changes, virulence and resistant genes. PLoS One, 2020; 15, e0231852. doi: 10.1371/journal.pone.0231852 [15] Jia LL, Chen YL, Wang YQ, et al. Analysis on epidemiological characteristics of other infectious diarrhea in Miyun County of Beijing from 2009-2014. Occup Health, 2016; 32, 1510−2. (In Chinese [16] Chen SF, Zhou YQ, Chen YR, et al. fastp: an ultra-fast all-in-one FASTQ preprocessor. Bioinformatics, 2018; 34, i884−90. doi: 10.1093/bioinformatics/bty560 [17] Bankevich A, Nurk S, Antipov D, et al. SPAdes: a new genome assembly algorithm and its applications to single-cell sequencing. J Comput Biol, 2012; 19, 455−77. doi: 10.1089/cmb.2012.0021 [18] Waters NR, Abram F, Brennan F, et al. Easy phylotyping of Escherichia coli via the EzClermont web app and command-line tool. Access Microbiol, 2020; 2, e000143. [19] Li H, Handsaker B, Wysoker A, et al. The sequence alignment/map format and SAMtools. Bioinformatics, 2009; 25, 2078−9. doi: 10.1093/bioinformatics/btp352 [20] Stamatakis A. RAxML version 8: a tool for phylogenetic analysis and post-analysis of large phylogenies. Bioinformatics, 2014; 30, 1312−3. doi: 10.1093/bioinformatics/btu033 [21] Clermont O, Christenson JK, Denamur E, et al. The Clermont Escherichia coli phylo-typing method revisited: improvement of specificity and detection of new phylo-groups. Environ Microbiol Rep, 2013; 5, 58−65. doi: 10.1111/1758-2229.12019 [22] Duprilot M, Baron A, Blanquart F, et al. Success of Escherichia coli O25b: H4 sequence type 131 clade C associated with a decrease in virulence. Infect Immun, 2020; 88, e520−76. [23] Rahman MM, Husna A, Elshabrawy HA, et al. Isolation and molecular characterization of multidrug-resistant Escherichia coli from chicken meat. Sci Rep, 2020; 10, 21999. doi: 10.1038/s41598-020-78367-2 [24] Bebell LM, Muiru AN. Antibiotic use and emerging resistance: how can resource-limited countries turn the tide? Global Heart, 2014; 9, 347-58. [25] Sun DS, Kissler SM, Kanjilal S, et al. Analysis of multiple bacterial species and antibiotic classes reveals large variation in the association between seasonal antibiotic use and resistance. PLoS Biol, 2022; 20, e3001579. doi: 10.1371/journal.pbio.3001579 [26] Purohit MR, Chandran S, Shah H, et al. Antibiotic resistance in an Indian rural community: a 'One-Health' observational study on commensal coliform from humans, animals, and water. Int J Environ Res Public Health, 2017; 14, 386. doi: 10.3390/ijerph14040386 [27] Chen Y, Chen X, Zheng S, et al. Serotypes, genotypes and antimicrobial resistance patterns of human diarrhoeagenic Escherichia coli isolates circulating in southeastern China. Clin Microbiol Infect, 2014; 20, 52−8. [28] Zhang SX, Zhou YM, Tian LG, et al. Antibiotic resistance and molecular characterization of diarrheagenic Escherichia coli and non-typhoidal Salmonella strains isolated from infections in Southwest China. Infect Dis Poverty, 2018; 7, 53. doi: 10.1186/s40249-018-0427-2 [29] Chen LJ, He X, Zhang H, et al. Antibiotic resistance of Escherichia coil in healthy human in Beijing and evaluation of antibiotics susceptibility assays. Mod Prev Med, 2007; 34, 3789−90. (In Chinese [30] Pan HJ. Antimicrobial susceptibility and subtyping of clinical isolates of diarrheagenic Escherichia coli and Campylobacter from Shanghai hospitals. Shanghai Jiaotong University. 2016. (In Chinese) [31] Shi B, Zhao W, Sun JY, et al. Molecular typing and drug resistance of diarrheagenic Escherichia coli in Jilin Province. Chin J Lab Diagn, 2020; 24, 1697−702. (In Chinese [32] Purohit MR, Lindahl LF, Diwan V, et al. High levels of drug resistance in commensal E. coli in a cohort of children from rural central India. Sci Rep, 2019; 9, 6682. doi: 10.1038/s41598-019-43227-1 [33] Cho SH, Lim YS, Park MS, et al. Prevalence of antibiotic resistance in Escherichia coli fecal isolates from healthy persons and patients with diarrhea. Osong Public Health Res Perspect, 2011; 2, 41−5. doi: 10.1016/j.phrp.2011.05.003 [34] Aworh MK, Kwaga JKP, Hendriksen RS, et al. Genetic relatedness of multidrug resistant Escherichia coli isolated from humans, chickens and poultry environments. Antimicrob Resist Infect Control, 2021; 10, 58. doi: 10.1186/s13756-021-00930-x [35] Li C, Zhang ZH, Chen QQ, et al. Resistance spectrum and multilocus sequence typing analysis of human diarrheagenic Escherichia coli isolates in Anhui province in 2018. J Pathogen Biol, 2020; 15, 897−902. [36] Gu S, Lai JD, Kang WQ, et al. Drug resistance characteristics and molecular typing of Escherichia coli isolates from neonates in class a tertiary hospitals: a multicentre study across China. J Infect, 2022; 85, 499−506. doi: 10.1016/j.jinf.2022.09.014 [37] Galasso J, Cao DM, Hochberg R. A random forest model for forecasting regional COVID-19 cases utilizing reproduction number estimates and demographic data. Chaos, Solitons Fractals, 2022; 156, 111779. doi: 10.1016/j.chaos.2021.111779 [38] Xiang Y, Wu F, Chai YH, et al. A new plasmid carrying mphA causes prevalence of azithromycin resistance in enterotoxigenic Escherichia coli serogroup O6. BMC Microbiol, 2020; 20, 247. doi: 10.1186/s12866-020-01927-z [39] Behera M, Parmanand, Roshan M, et al. Novel aadA5 and dfrA17 variants of class 1 integron in multidrug-resistant Escherichia coli causing bovine mastitis. Appl Microbiol Biotechnol, 2023; 107, 433−46. doi: 10.1007/s00253-022-12304-3 [40] Kivata MW, Mbuchi M, Eyase F, et al. Plasmid mediated penicillin and tetracycline resistance among Neisseria gonorrhoeae isolates from Kenya. BMC Infect Dis, 2020; 20, 703. doi: 10.1186/s12879-020-05398-5 [41] Girija ASS, Priyadharsini JV, Paramasivam A. Plasmid-encoded resistance to trimethoprim/sulfamethoxazole mediated by dfrA1, dfrA5, sul1 and sul2 among Acinetobacter baumannii isolated from urine samples of patients with severe urinary tract infection. J Glob Antimicrob Resist, 2019; 17, 145−6. doi: 10.1016/j.jgar.2019.04.001 [42] Dong ZM. Study on the epidemic characteristics and transmission mechanism of the drug-resistant fosA3 gene of Escherichia coli isolates from pigs. Jilin Agricultural University. 2016. (In Chinese) [43] Hou JX, Huang XH, Deng YT, et al. Dissemination of the fosfomycin resistance gene fosA3 with CTX-M β-lactamase genes and rmtB carried on IncFII plasmids among Escherichia coli isolates from pets in China. Antimicrob Agents Chemother, 2012; 56, 2135−8. doi: 10.1128/AAC.05104-11 [44] Yao H, Wu DF, Lei L, et al. The detection of fosfomycin resistance genes in Enterobacteriaceae from pets and their owners. Vet Microbiol, 2016; 193, 67−71. doi: 10.1016/j.vetmic.2016.07.019 -

 点击查看大图
计量
- 文章访问数: 348
- HTML全文浏览量: 146
- PDF下载量: 21
- 被引次数: 0

 Quick Links