


-
The global cancer burden continues to increase. There were approximately 19.3 million new cancer cases and nearly 10 million cancer deaths worldwide by 2020[1]. Additionally, 15%–20% of all cancer cases are caused by viruses[2]. Extensive research has been conducted to elucidate the link between viruses and cancer. Multiple human oncogenic viruses, such as hepatitis B (HBV) and C (HCV), human tumor virus (HPV), Epstein-Barr virus (EBV), and Kaposi sarcoma herpes virus (KSHV), are strongly associated with diverse cancer types[3-6]. The influenza A virus (IAV) is a zoonotic pathogen that circulates continuously in several avian and mammalian hosts, including humans. It is the major cause of respiratory infections worldwide and remains a serious and persistent threat to global public health[7,8]. Currently, it is the only influenza virus with clear evidence of influenza pandemics[9]. According to the U.S. Centers for Disease Control and Prevention (CDC), influenza caused 9–41 million cases of illness in the U.S. each year between 2010 and 2020 (https://www.cdc.gov/flu). The currently prevalent IAV caused the 2009 pandemic, which emerged in spring and quickly spread worldwide (http://www.cdc.gov/h1n1flu/). Influenza viral infection also causes severe complications, especially in patients with lung cancer, by altering the tumor microenvironment (TME), which may promote lung cancer progression and disrupt the response to antineoplastic therapy[10].
Influenza viruses pose a risk to human health and numerous studies have revealed their tumorigenic potential[11,12]. In 1993, a study reported that in vitro cultured Madin-Darby canine kidney (MDCK) and HeLa cells exhibited a series of specific apoptotic phenotypes following human IAV infection. This suggests that influenza viruses can induce apoptosis in cultured tumor cells in vitro[13]. Preexisting influenza A immunity could be used for cancer immunotherapy by delivering influenza A-related peptides to targeted tumors[14]. However, the relationship between IAV and cancer remains unclear compared with that between IAVs and validated oncoviruses. Thus, the role of influenza-A virus target genes (IATGs) in human host tumors also needs further exploration.
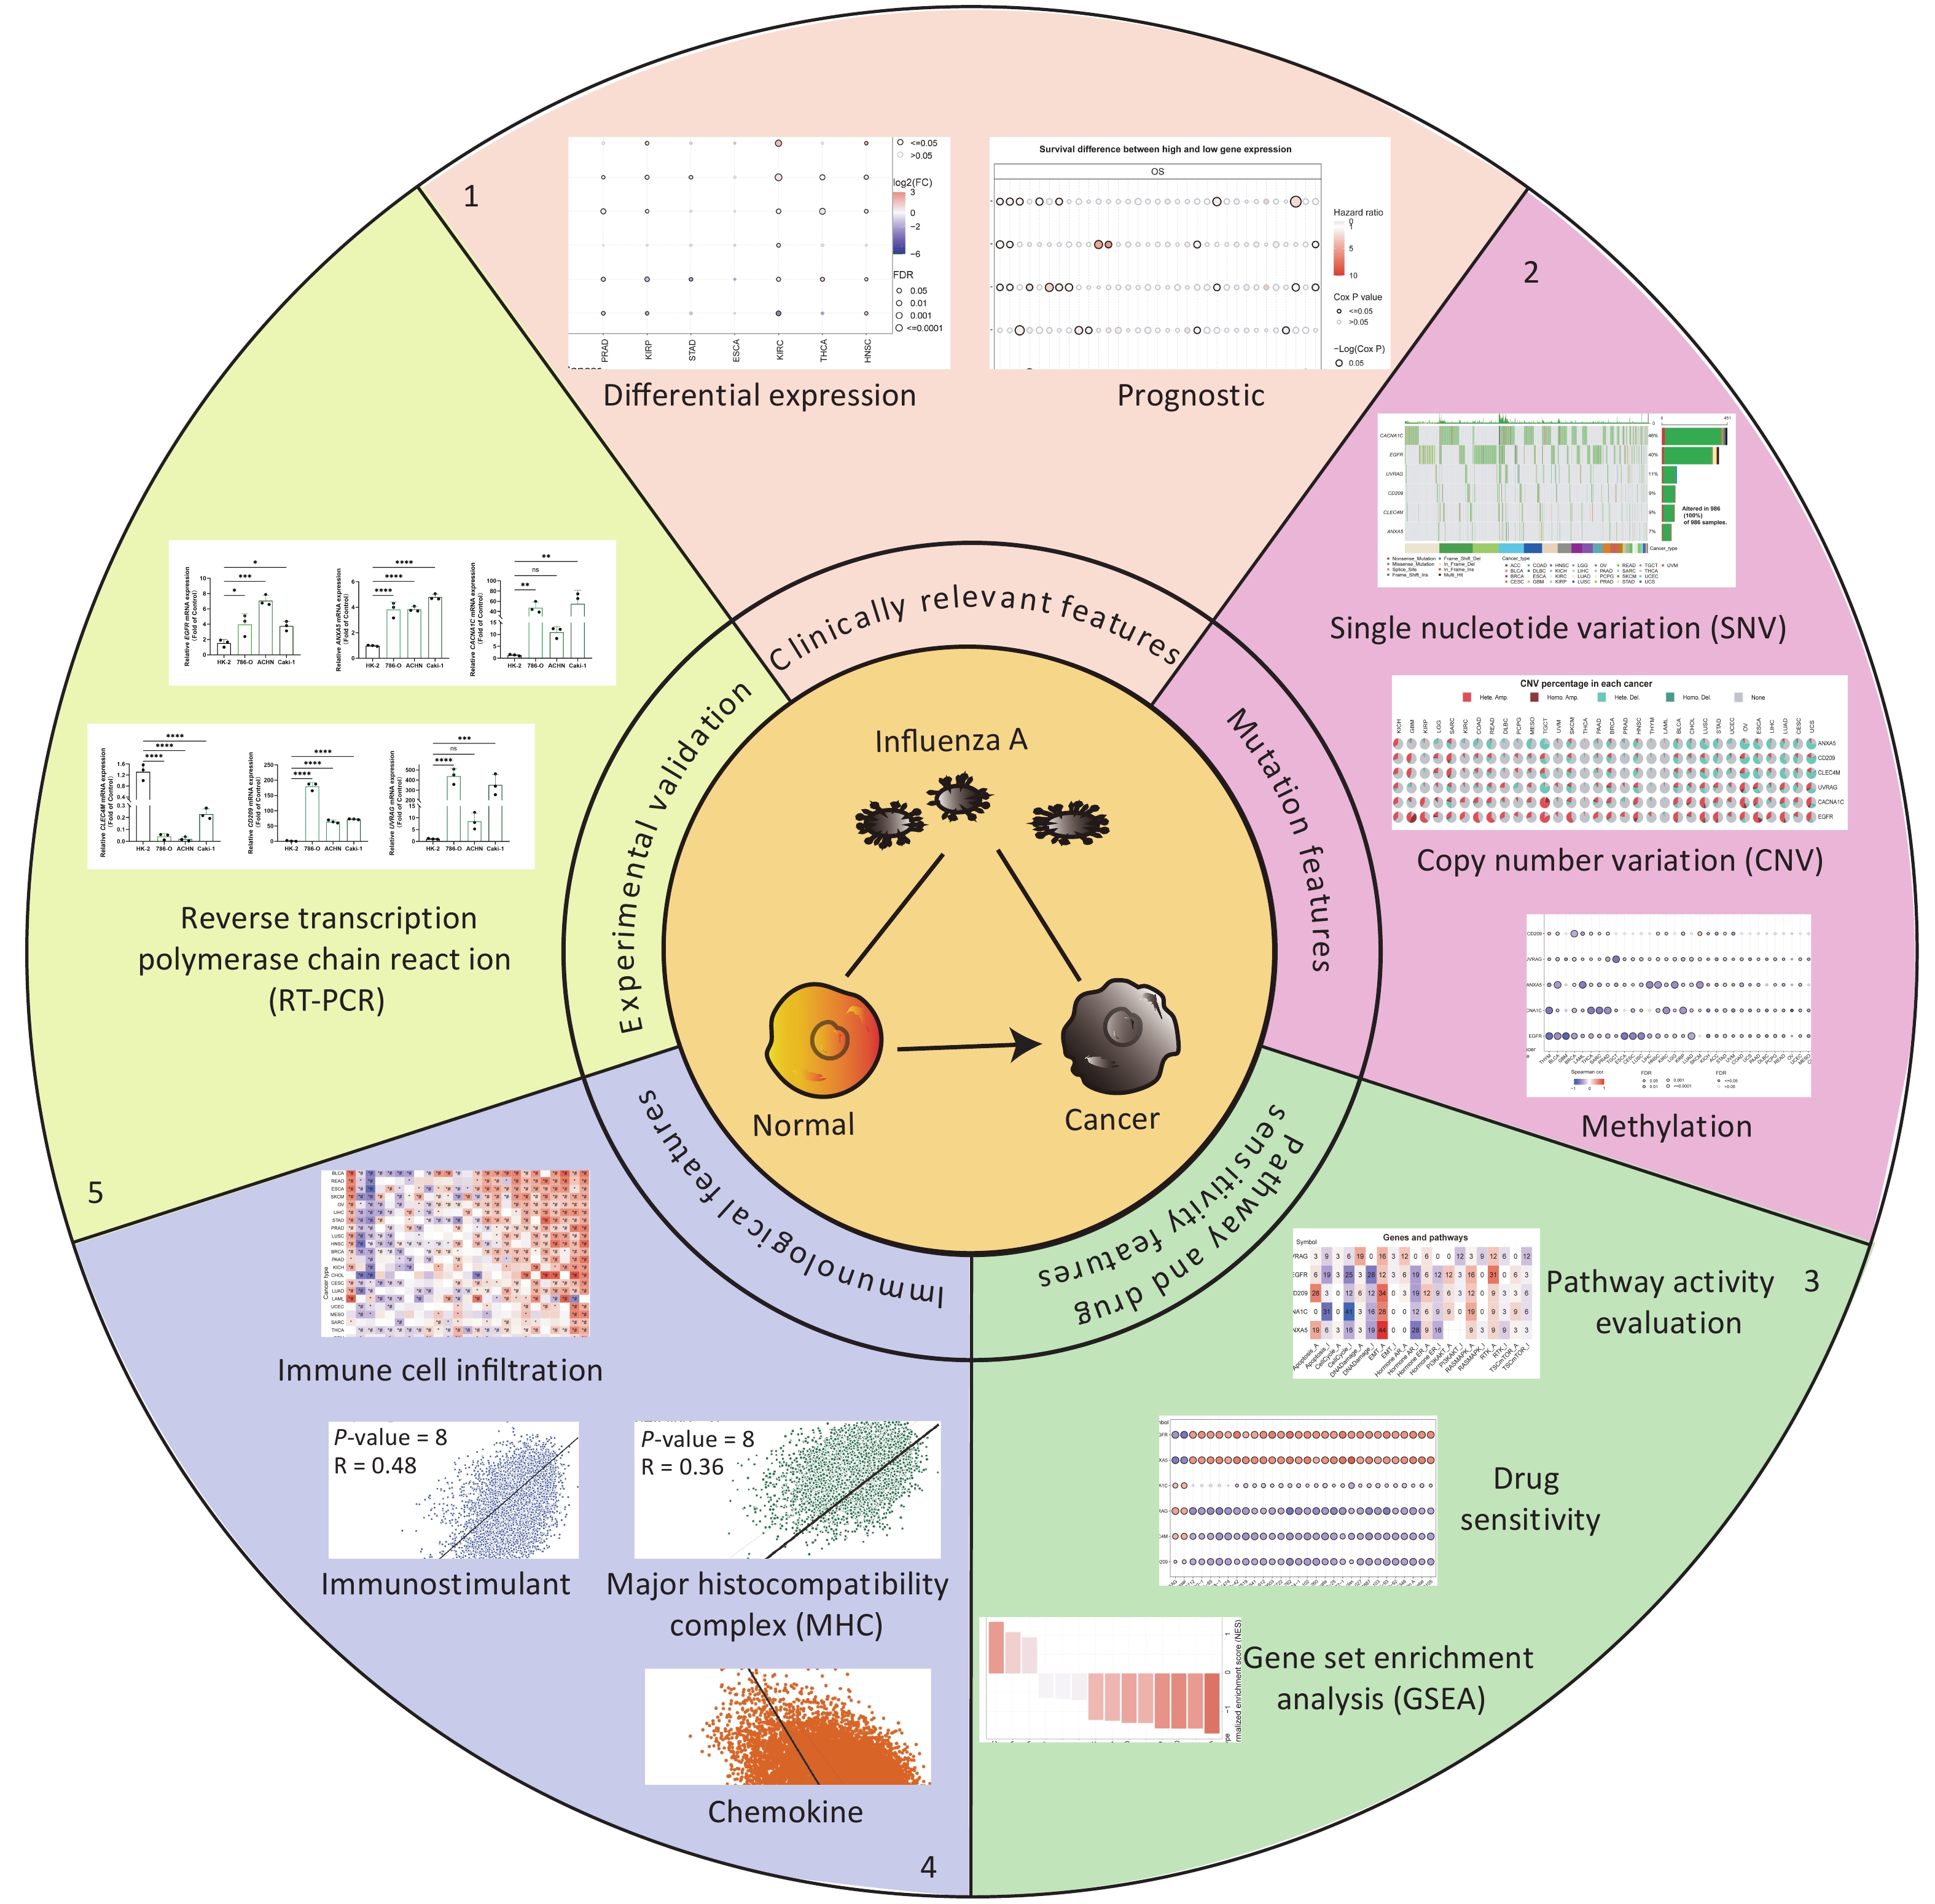
In this study, we identified six target genes of influenza A virus—epidermal growth factor receptor (EGFR), Annexin 5 (ANXA5), C-type lectin domain family 4 member (CLEC4M), cluster of differentiation 209 (CD209), UV radiation resistance-associated gene protein (UVRAG), and calcium voltage-gated channel subunit alpha1 C (CACNA1C)—from the VThunter database. Except the CACNA1C, the other five IATGs participate in the evasion of IVA into the host cells. Stimulation of the EGFR signaling pathway facilitates the internalization of IAV through endocytosis and uptake by host cells[15-17]. ANXA5 is a member of the family of proteins that bind to calcium or phospholipids. It binds to three distinct strains of influenza A virus and assists in viral entry into host cells[18]. CLEC4M and CD209 are members of the C-type lectin domain family that facilitate the binding and entry of IVA into cells, regardless of the presence of sialic acid on the cell surface[19]. UVRAG, a gene associated with resistance to UV radiation, acts as a tumor suppressor by promoting autophagy, which plays a vital role in facilitating the entry of negative-stranded RNA viruses, such as influenza A virus, independent of interferon (IFN) or autophagy[20]. However, in contrast to the other five IATGs, the knockdown of CACNA1C by siRNA did not decrease viral titers compared to controls in A549 cells, a pulmonary epithelial cell line[21]. Further studies are needed to explore the underlying association between CACNA1C and IVA.
Recently, the development of omics technology has led to unparalleled attempts to identify gene alterations that reveal the onset and progression of a vast array of diseases, including cancer. Consequently, analyses based on omics technologies in genomics, transcriptomics, and other omics fields have been focused on and hailed to discover potential molecular targets for the development of new drugs[22]. In this study, we systematically analyzed the characteristics of IATGs in thirty-three cancers at the genomic and clinical levels. Genomic and epigenetic alterations result in aberrant expression of influenza A virus receptors. In addition, these changes were strongly associated with signature-related signaling pathway activation, clinical survival, and immune infiltration in tumors. Targeting influenza A virus receptors may be a plausible approach for exploring new cancer treatment options.
-
Six IATGs (EGFR, ANXA5, CLEC4M, CD209, UVRAG, and CACNA1C) were retrieved from the VThunter database (URL: https://db.cngb.org/VThunter/). Selected “Orthomyxoviridae” from the “Virus Family” dropdown menu and “Influenza A virus” from the “Virus” dropdown menu, then the target genes of Influenza A virus were shown in the “Target Gene” dropdown menu. The VThunter database is an up-to-date and accessible database specifically created to examine and analyze the manifestations of viral receptors in the tissues of various animal species at the single-cell level. This database identified 107 viral receptors in 142 viral species and acquired accurate expression profiles using 285 scRNA-seq datasets, which cover 2,100,962 cells from 47 distinct animal species[23].
-
We procured human kidney renal cell carcinoma cell lines (786-O, ACHN, and Caki-1) and HK-2, a proximal tubular cell line derived from the normal kidney from the American Type Culture Collection (ATCC, VA, USA). The primers were synthesized by Sangon Biotech (Shanghai, China). Cells were cultured and collected for qRT-PCR analysis as described previously[24,25]. Briefly, 50,000 cells from each of the cell lines indicated above were plated in 6-well plates. Total RNA was collected and isolated from cell cultures after the cells reached confluence using the TRIzol reagent (Invitrogen, NY, USA). iScript cDNA synthesis reagent (Bio-Rad, Hercules, CA, USA) was used to synthesize cDNA. β-actin was utilized as an internal control. The primer sequences are listed below.
-
Public databases were accessed to acquire tumor sample-related data from The Cancer Genome Atlas (TCGA) (https://portal.gdc.cancer.gov/)[26], and mRNA sequencing, clinical, single-nucleotide variants (SNV), copy number variants (CNV), and methylation data from the GSCA database (http://bioinfo.life.hust.edu.cn/GSCA)[27]. The details have been described previously[24-25]. Reverse phase protein array (RPPA) data retrieved from The Cancer Proteome Atlas (TCPA) database were used for pathway analysis[28]. The correlation between gene expression and drug sensitivity was based on the Genomics of Drug Sensitivity in Cancer (GDSC) database[29]. Samples collected from thirty-three cancer types were included in pan-cancer analysis. Detailed cancer types and cases are listed in Supplementary Table S1 (available in www.besjournal.com).
Gene Forward sequence 5'-3' Reverse sequence 5'-3' EGFR TTGCCGCAAAGTGTGTAACG GTCACCCCTAAATGCCACCG CACNA1C AATCGCCTATGGACTCCTCTT GCGCCTTCACATCAAATCCG CLEC4M GAGTAACCGCTTCTCCTGGATG CGCACAGTCTTCATTCCCGCTA ANXA5 AACCCTCTCGGCTTTATGATGC CGCTGGTAGTACCCTGAAGTG CD209 TCAAGCAGTATTGGAACAGAGGA CAGGAGGCTGCGGACTTTTT UVRAG CTTGGGTCAGCAGATTCATGC CATCGTAAGAATTGCGAACACAG Table 1. Primers
Cancer type (Abbreviation) Cases Adrenocortical carcinoma (ACC) 92 Breast cancer (BRCA) 1,218 Bladder uroepithelial carcinoma (BLCA) 411 Cervical squamous cell carcinoma and endocervical adenocarcinoma (CESC) 310 Cholangiocarcinoma (CHOL) 45 Colon adenocarcinoma (COAD) 329 Lymphoid neoplasm diffuse large B-cell lymphoma (DLBC) 48 Head and neck squamous cell carcinoma (HNSC) 566 Esophageal carcinoma (ESCA) 196 Glioblastoma multiforme (GBM) 174 Kidney chromophobe (KICH) 91 Kidney renal clear cell carcinoma (KIRC) 606 Kidney renal papillary cell carcinoma (KIRP) 323 Acute myeloid leukemia (LAML) 173 Brain lower grade glioma (LGG) 534 Liver hepatocellular carcinoma (LIHC) 359 Lung adenocarcinoma (LUAD) 576 Thyroid cancer (THCA) 572 Thymoma (THYM) 122 Uterine corpus endometrial carcinoma (UCEC) 201 Uterine carcinosarcoma (UCS) 57 Uveal melanoma (UVM) 80 Table S1. Cancer types and cases
-
Only fourteen cancer types were included (COAD, ESCA, LUSC, KIRC, HNSC, PRAD, BRCA, BLCA, THCA, STAD, KIRP, LUAD, LIHC, and KICH) in the mRNA expression analysis. The criterion was that the paired tumor and normal samples collected from the list of cancer types were more than ten. The mRNA expression values in TCGA are expressed as normalized RSEM values. Fold change was calculated as mean (tumor)/mean (normal), as described previously[24,25]. Moreover, the tumor samples were classified into two groups (high and low) based on the median values and further analyzed for the correlation between expression and survival.
-
SNV and clinical survival data from thirty-three cancers were extracted from TCGA database. Using the unique barcoding of each specimen, SNV and clinical survival data were merged. Mutated tumor specimens were identified based on the presence of certain mutated genes. For the survival analysis, at least two groups with two or more samples were included. The survival rate of the R package was used to match the survival time and status. Differences in survival between the wild-type and mutant groups were determined using the Cox proportional hazards model and log-rank test. Eight mutation types were included in the analysis: deleterious mutations, missense mutations, nonsense mutations, frame-shift insertions, splice-sites, frame-shift deletions, in-frame deletions, and in-frame insertions.
-
CNV data from thirty-three cancer types were collected from TCGA and analyzed using GISTICS 2.0[30]. The GISTIC database was used to identify significantly altered regions of amplification or deletion in the patient cohorts. This study explored the copy number level of each gene in the gene set in each pan-cancer cancer based on the GISTIC score derived from GISTIC and then summarized the four types of GISTIC scores: homozygous deletion, heterozygous deletion, heterozygous amplification, and homozygous amplification. Spearman’s correlation analysis was performed by merging the mRNA expression data with raw CNV data[31]. The false discovery rate (FDR) was used to adjust the P-value. A log-rank test was performed to examine the differences in survival between groups. SNV data and clinical survival data were merged using specimen barcoding. For the survival analysis, at least two groups with two or more samples were included. The R package for survival was used to fit survival time and status within each group. A log-rank test was performed to test survival differences between the groups.
-
Methylation analysis was performed based on the chosen fourteen cancer types with more than ten paired tumors and adjacent normal tissues. Differences in methylation levels between tumor and normal samples were determined using Student’s t-test. Spearman analysis was used to determine the correlation between the mRNA expression and methylation levels of the genes. Median methylation data were used for survival analysis after categorizing tumor samples into two groups (hypermethylated and hypomethylated). The FDR was also used to adjust the P-value.
-
Calculations were performed on ten cancer-related cell signaling pathways for thirty-three cancer types, including the TSC-mTOR pathway, receptor tyrosine kinases (RTKs), Ras/Raf/MAPK pathway, PI3K-AKT pathway, hormone estrogen receptors (ERs), androgen receptor (AR), EMT, DNA damage, cell cycle, and apoptotic pathways[32]. The activity scores of the listed pathways and gene expression between pathways (activation and repression) were determined using the median pathway scores[33].
First, all included data were grouped into high and low expression groups based on median gene expression values. A t-test was used to determine the difference in pathway activity scores (PAS) between the groups, and FDR was used to adjust the P-value. When PAS of the group with gene A in high expression was greater than PAS of the other group with gene A in low expression, gene A might activate a verified signaling pathway; otherwise, it might have a repressive effect on this pathway[33].
-
Gene set enrichment analysis (GSEA) calculations were performed using the R package fgsea[34]. By using the normalizing entrichment scores (NES), GSEA considered the differences in the sizes of the IATG gene sets and correlations within the expression datasets. NES was used to compare the results of the analyses across gene sets.
-
The IC50 values of 265 selected compounds with PubChem ID and the corresponding gene expression data in the GDSC2 dataset were collected from 860 tumor cell lines from the Genomics of Drug Sensitivity in Cancer database (GDSC; URL: https://www.cancerrxgene.org/). Compounds without valid PubChem ID were excluded from the study. These compounds are cytotoxic chemotherapeutics and targeted therapeutics that are acquired from commercial sources, academic researchers, and biopharmaceutical companies. The pathways targeted by these compounds included ABL signaling, apoptosis regulation, cell cycle, chromatin histone acetylation/methylation, cytoskeleton, kinases, DNA replication, EGFR signaling, ERK/MAPK signaling, genome integrity, hormone-related pathways, IGF1R signaling, immune response, JNK and p38 signaling, metabolism, mitosis, and other unclassified pathways. Pearson correlation analysis was performed to determine the relationship between the mRNA expression of the gene and the IC50 of the drug. The P-value was adjusted using FDR. A positive correlation implies that high gene expression suggests drug resistance.
-
The ImmuCellAI algorithm was used to calculate the infiltration of 24 immune cell lines and expressed as a correlation coefficient[35]. The association of immune cell infiltration with the GSVA scores of IATGs was analyzed using Spearman’s correlation with P-value adjusted by FDR. A set of marker genes for three immune-related pathways, including chemotactic cytokines, the MHC class I antigen presentation pathway, and immunostimulators, was obtained from the TISIDB database[36]. The relationship between IATGs and the three immune-related pathways was analyzed using the GEPIA2 database (Pearson’s coefficient)[37].
-
RNA-sequencing expression profiles and corresponding clinical information for IATGs in KIRC were downloaded from the TCGA dataset, while those for normal control group were downloaded from GTEx database (https://gtexportal.org/home/)[38]. The test for differential expression of genes was performed using the Wilcoxon rank sum test.
-
Unless otherwise stated, all statistical analyses were performed using the GraphPad Prism (version 8.0.1) and R software (version 4.0.2). Correlation analysis was conducted using the Spearman’s correlation test. Survival risk and HR were calculated using the Cox proportional risk model. The “survival” R program was used to examine the two groups’ survival time and survival status. The log-rank test was used for comparative analysis. The rank sum test was used to identify data from both groups, and a P-value < 0.05 or FDR ≤ 0.05 was considered statistically significant. Genes and cancer types with a P-value of less than 0.05 were shown. The significance of the differences between the two subgroups was evaluated using the Mann–Whitney U test (n < 5). One-way ANOVA and Bonferroni’s post hoc tests were used to perform multiple comparisons. P < 0.05 was deemed statistically significant. Independent qRT-PCR analyses were performed in triplicates.
-
Six IATGs were retrieved from the VThunter database: EGFR, ANXA5, CACNA1C, CLEC4M, CD209, and UVRAG. The following analyses were performed based on the six identified IATGs (Figure 1).
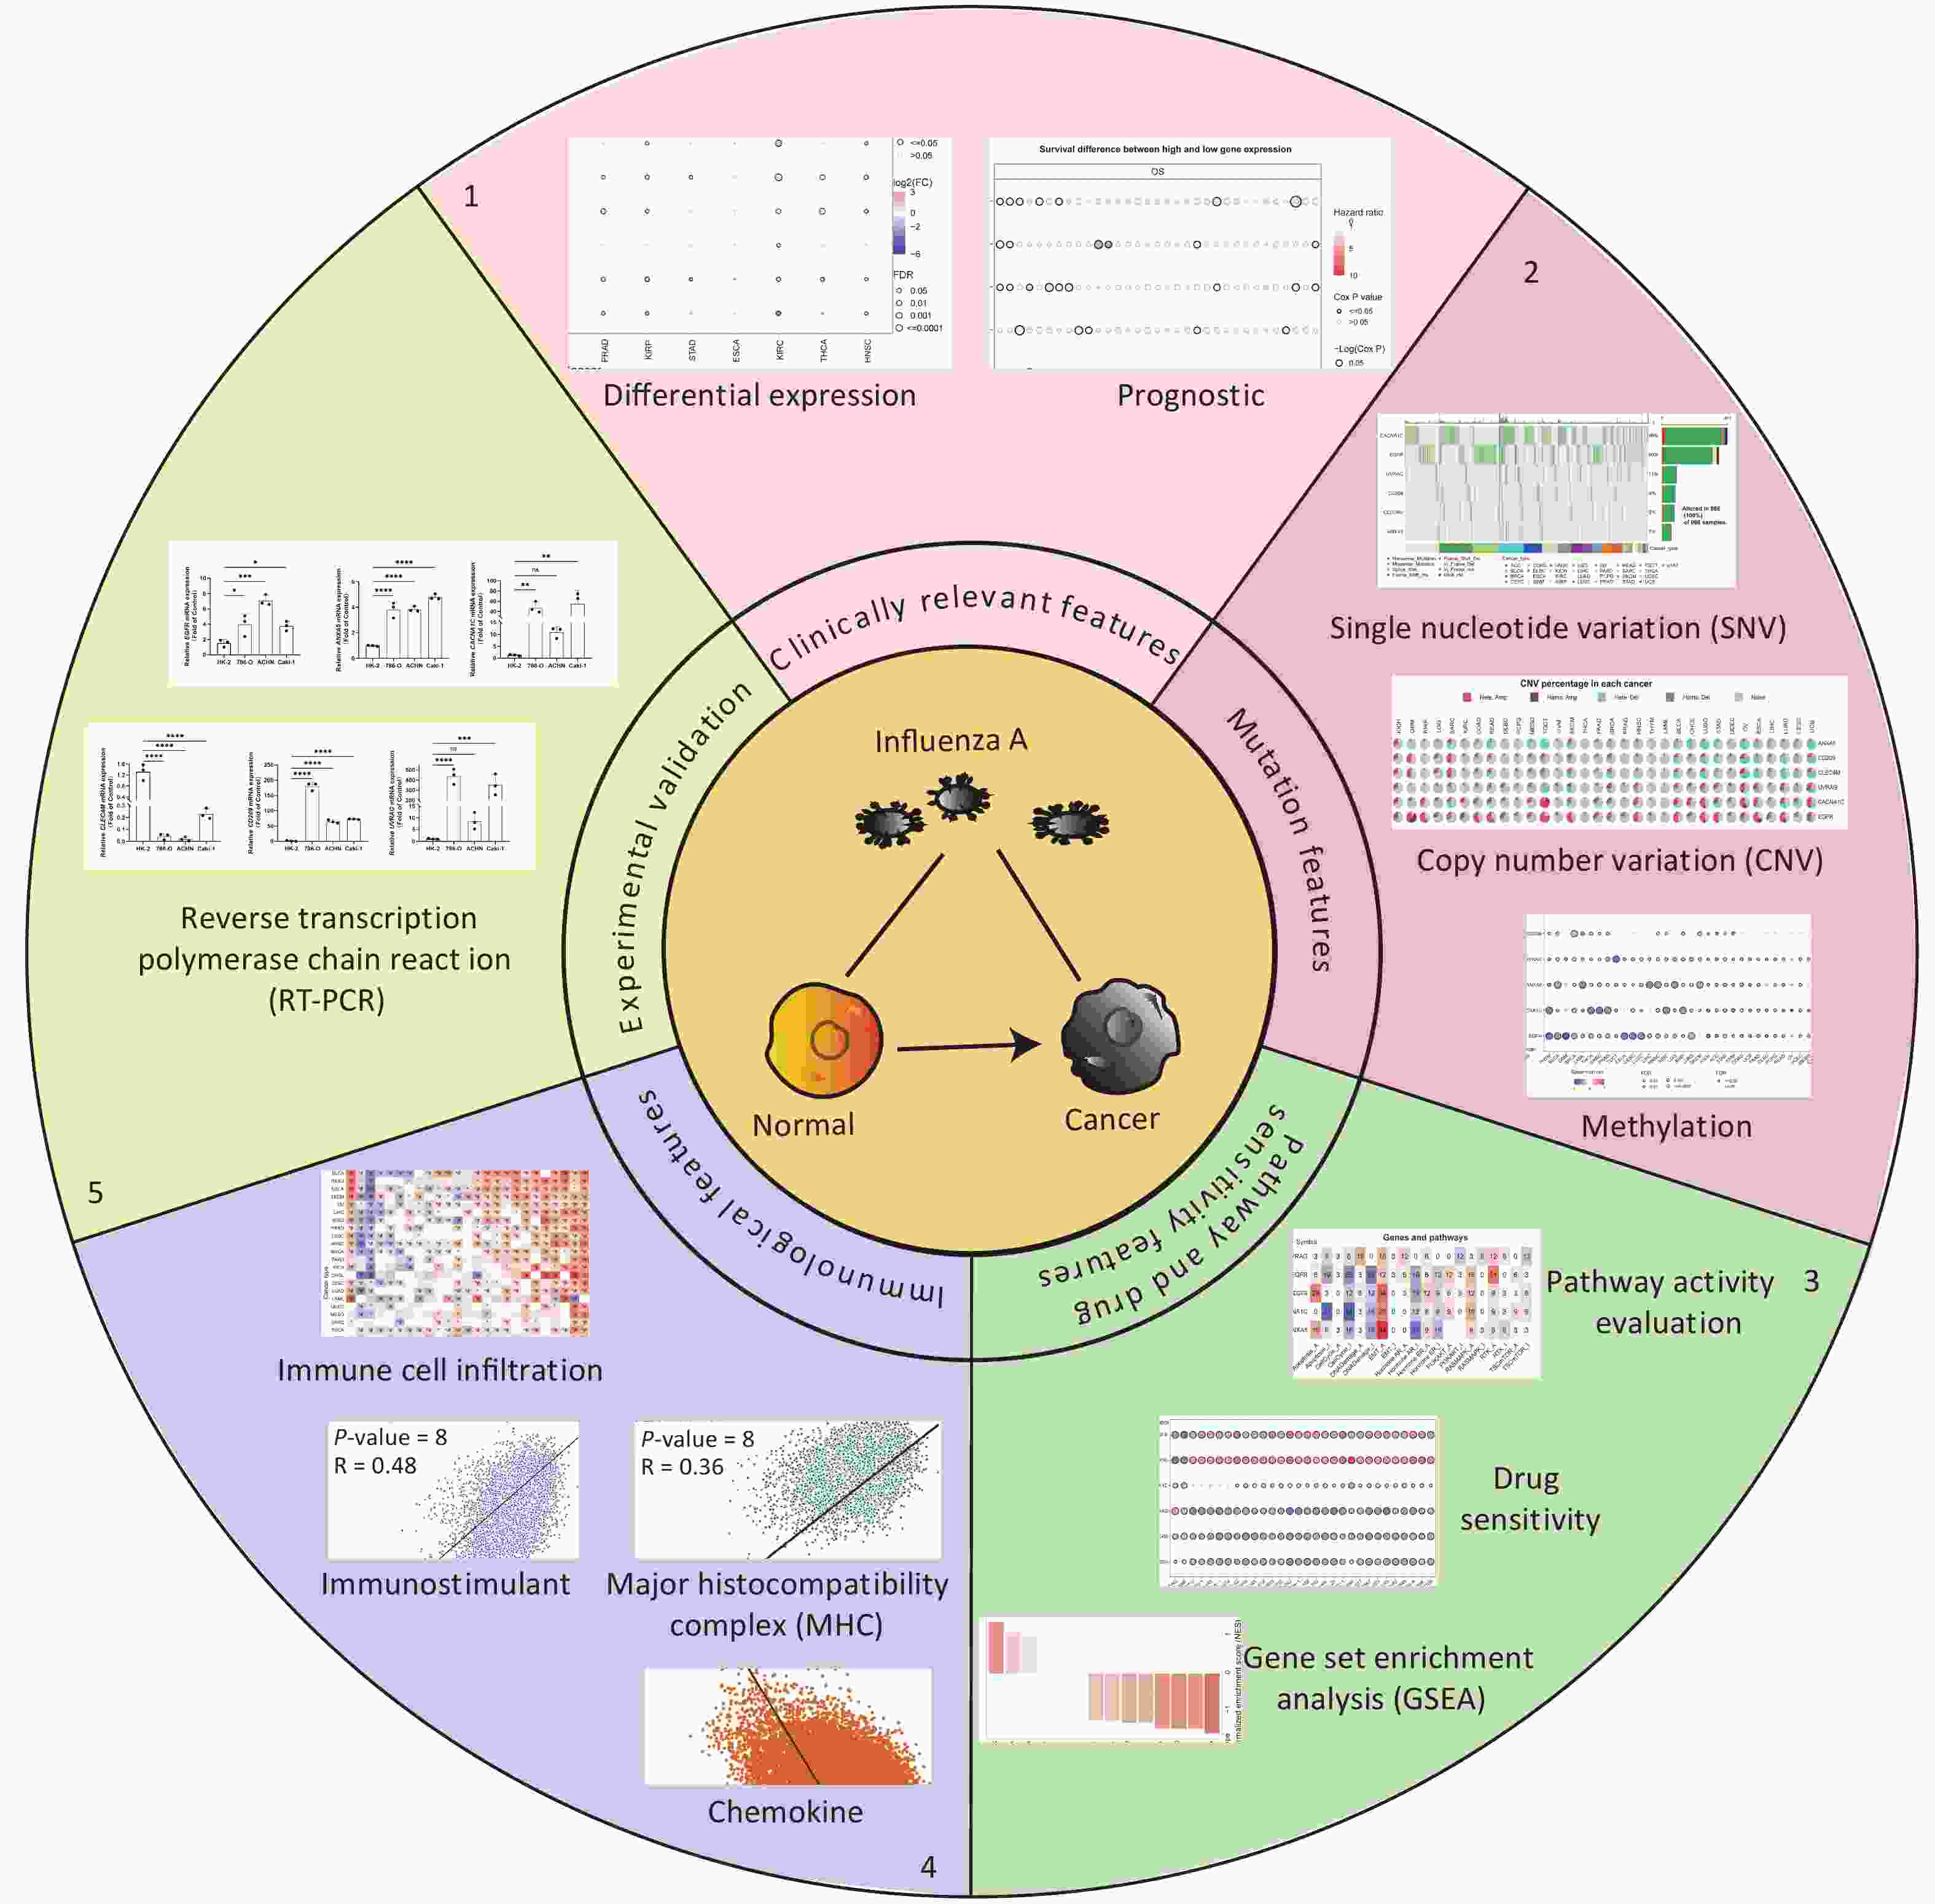
Figure 1. Flow chart.
-
Expression and survival analyses of the IATGs were performed to identify their clinical impact on cancer. IATGs were aberrantly expressed in 13 solid tumors, including BRCA, COAD, LUSC, BLCA, LUAD, KICH, LIHC, PRAD, KIRP, STAD, KIRC, THCA, and HNSC (FDR ≤ 0.05; Figure 2A). Specifically, the expression CACNA1C, UVRAG, and CLEC4M, was significantly downregulated. In contrast, EGFR and ANXA5 expression levels were markedly elevated in multiple cancers (FDR ≤ 0.05; Figure 2A). Furthermore, the hazard ratios (HR) of ANXA5 in LUSC, STAD, BLCA, HNSC, MESO, LIHC, LGG, and CLEC4M in LUSC, STAD, THCA, THYM, and KIRC; CACNA1C in LUSC, STAD, UVM, KIRP, MESO, and OV; EGFR in BLCA, PAAD, and SARC; CD209 in UVM; and UVRAG in UCEC were > 1 (P ≤ 0.05; Figure 2B), suggesting that the aberrant expression of ANXA5, CLEC4M, CACNA1C, and EGFR are risk factors for the listed cancer types. However, CLEC4M in ESCA, CACNA1C in LIHC, LGG, ESCA, EGFR in KIRC, CHOL, CD209 in SKCM, UVRAG in MESO, and LGG had risk < 1 (P ≤ 0.05; Figure 2B), indicating that these genes are protective factors for the listed cancer types. Overall, aberrant expression of IATGs may affect tumorigenesis and the prognosis of diverse cancer types.
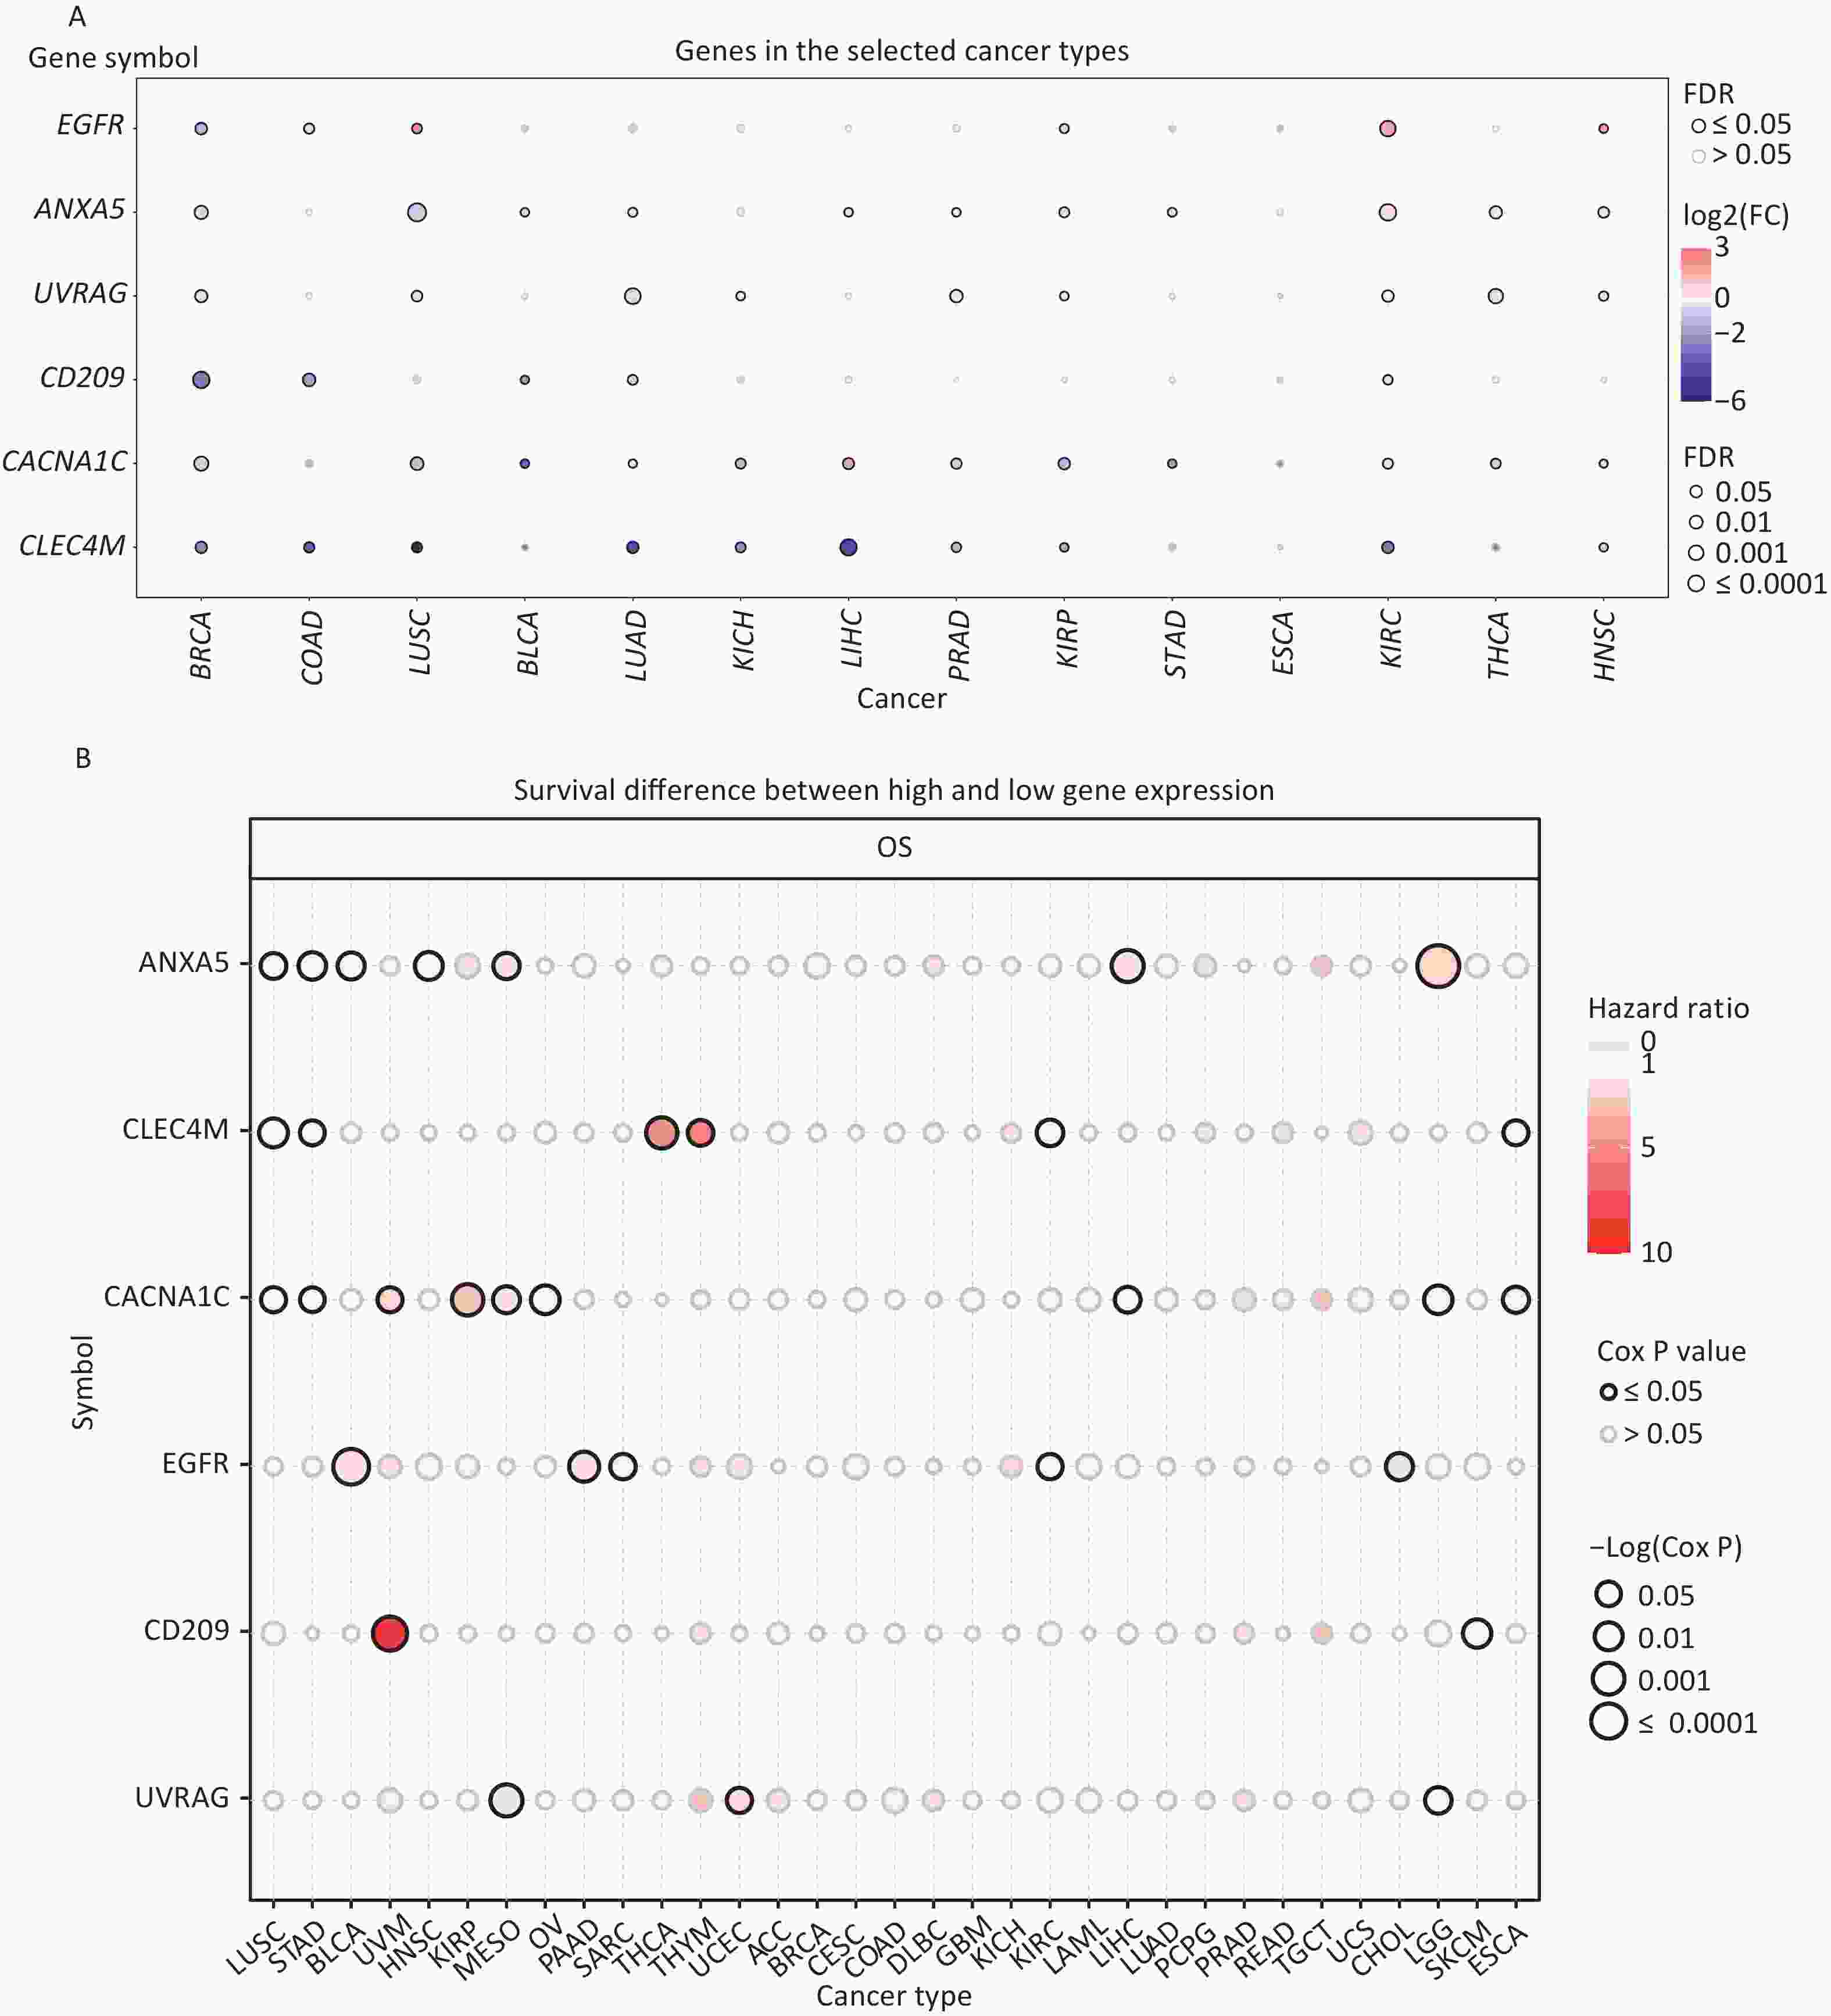
Figure 2. Expression and survival analysis of IATGs. Only genes with significant differential expression are shown. (A) Different expression profiles of IATGs in tumor samples compared to normal samples. (B) Survival differences of IATGs. The size of the dots shows the importance of the influence of the gene on survival for every type of cancer; the P-value was calculated using the Kaplan–Meier method. Red dots indicate a low survival rate of gene expression in the stated cancer type, whereas blue dots indicate a high survival rate of gene expression in the indicated cancer type. FDR, false discovery rate; IATGs, influenza-A virus target genes.
-
All cancer cells harbored somatic mutations. A certain number of these somatic alterations, generally known as “driver” mutations, confer selective cell subgroup growth advantages and are causally linked to oncogenesis[39,40]. Thus, the SNV data associated with IATGs were further analyzed to determine the mutation frequency and type in each cancer. The data showed that somatic mutations in IATGs existed in most cancer types, except UCS, DLBC, UVM, KICH, PCPG, THCA, CHOL, LAMI, and MESO (Figure 3A). Among them, CACNA1C in SKCM and EGFR in GBM had the highest SNV frequencies of up to 20%, which presented with the darkest labeling color (Figure 3A). Next, we focused on missense mutations, which are the predominant somatic mutations. SNV percentage analysis revealed the following gene mutation rates: CACNA1C (46%), EGFR (40%), UVRAG (11%), CD209 (9%), CLEC4M (9%), and ANXA5 (7%) (Figure 3B). The high frequency of mutations in IATGs was observed in these cancer types, including STAD, SKCM, GBM, PAAD, and LUSC (Figure 3B). Furthermore, the HRs of UVRAG, CACNA1C, and EGFR in UCEC were < 1 (P ≤ 0.05, Figure 3C), indicating that they are protective factors for these cancer types. However, the HRs for EGFR and CD209 in LGG, EGFR in COAD, and CACNA1C in KIRP were > 1 (P ≤ 0.05, Figure 3C), suggesting that these genes are risk factors for certain cancer types. Collectively, these findings revealed a substantial difference in survival between patients with mutant and non-mutated IATG genes, which may affect the prognosis of patients with cancer.
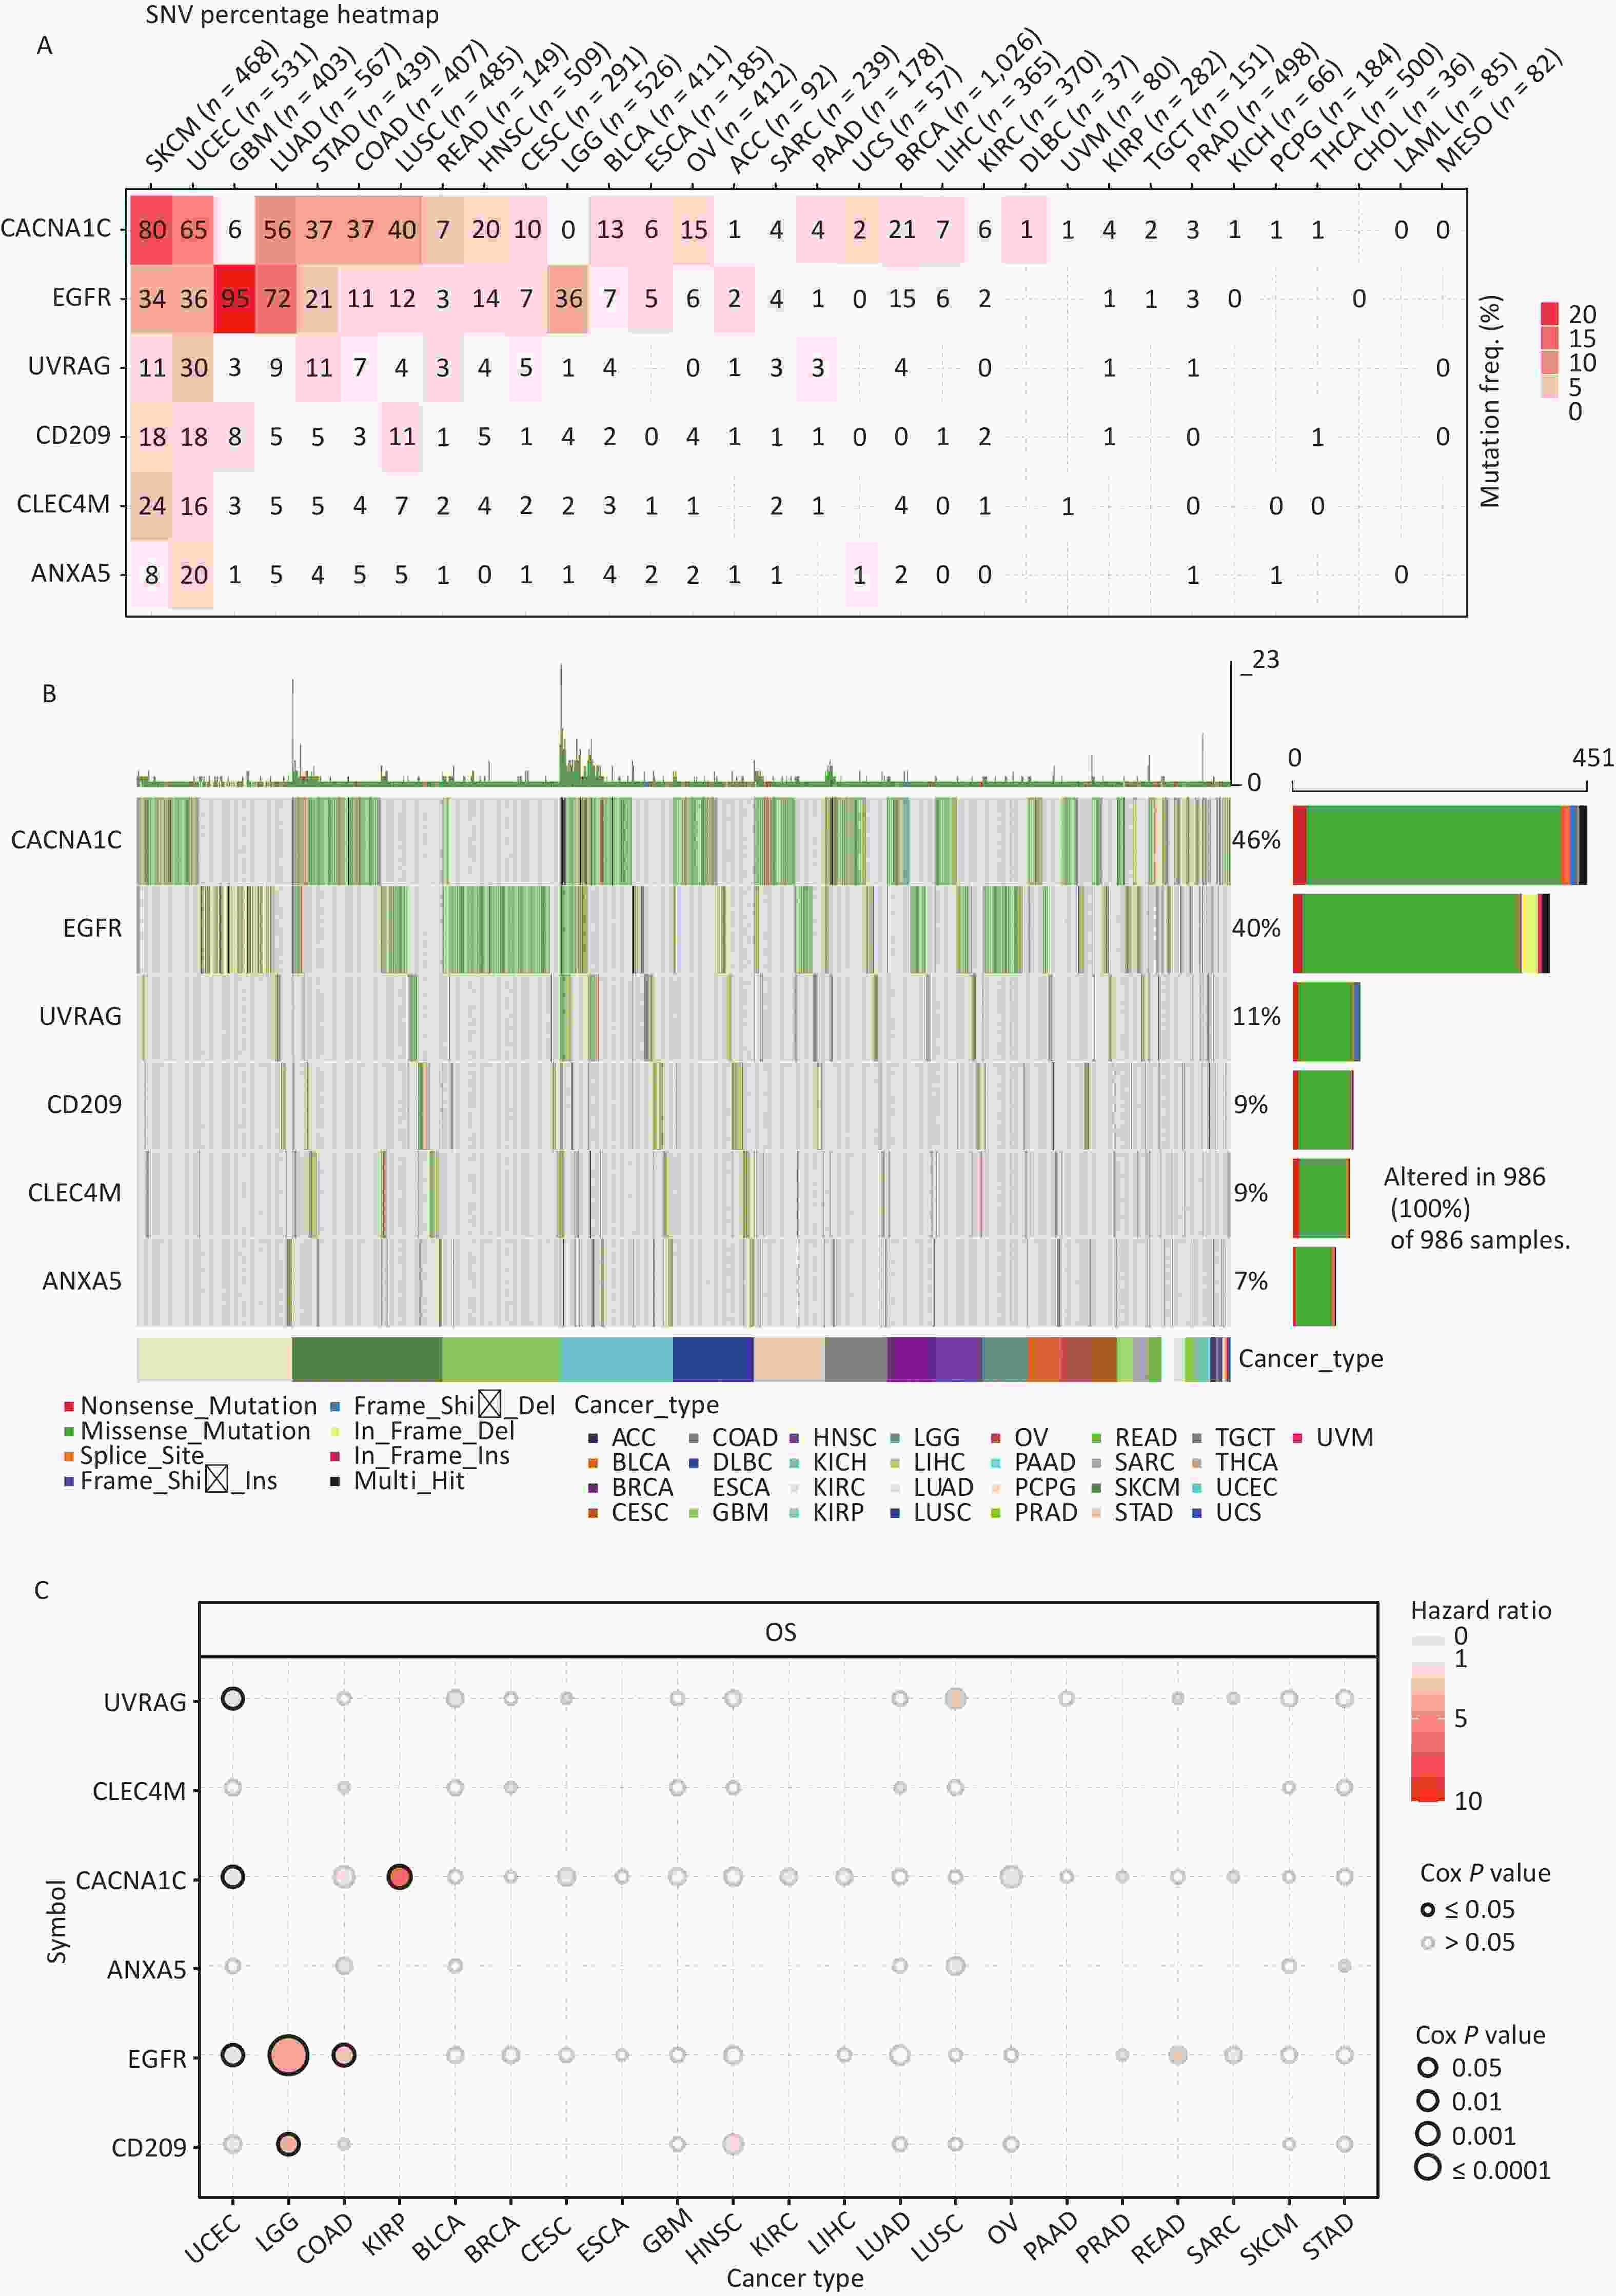
Figure 3. Frequencies of SNVs and variant forms of IATGs. (A) IATG mutation frequencies. The numbers indicate the mutations of the identified gene in a specific type of cancer. “0” shows that there were no mutations in the coding region of the gene, and “null” shows that there were no mutations in any area of the gene. (B) A waterfall graph of tumor distribution illustrates the spectrum of mutations in IATGs as well as the categorization of SNV types. (C) The connection between SNV and the survival of IATGs. Risk ratios and Cox P values are indicated by the size and color of the bubbles. The hue of the bubbles, from blue to red, represents low to high hazard ratios, and bubble size is positively connected with the Cox P value. Black border outlines show Cox P values ≤ 0.05. SNV, single-nucleotide variants; IATGs, influenza-A virus target genes.
-
CNV refers to the phenomenon in which the number of copies of a specific DNA segment varies among individuals. Changes in copy number are closely associated with cancer initiation and progression[41]. Therefore, the changes in CNV were analyzed for IATGs. This showed that the major types of CNV in the IATGs were heterozygous amplifications and deletions (Figure 4A). The largest percentage of heterozygous amplification and deletion was respectively found for EGFR and UVRAG in TGCT, while THCA and LAML had the lowest mutation rates, compared to other cancer types (Figure 4A).
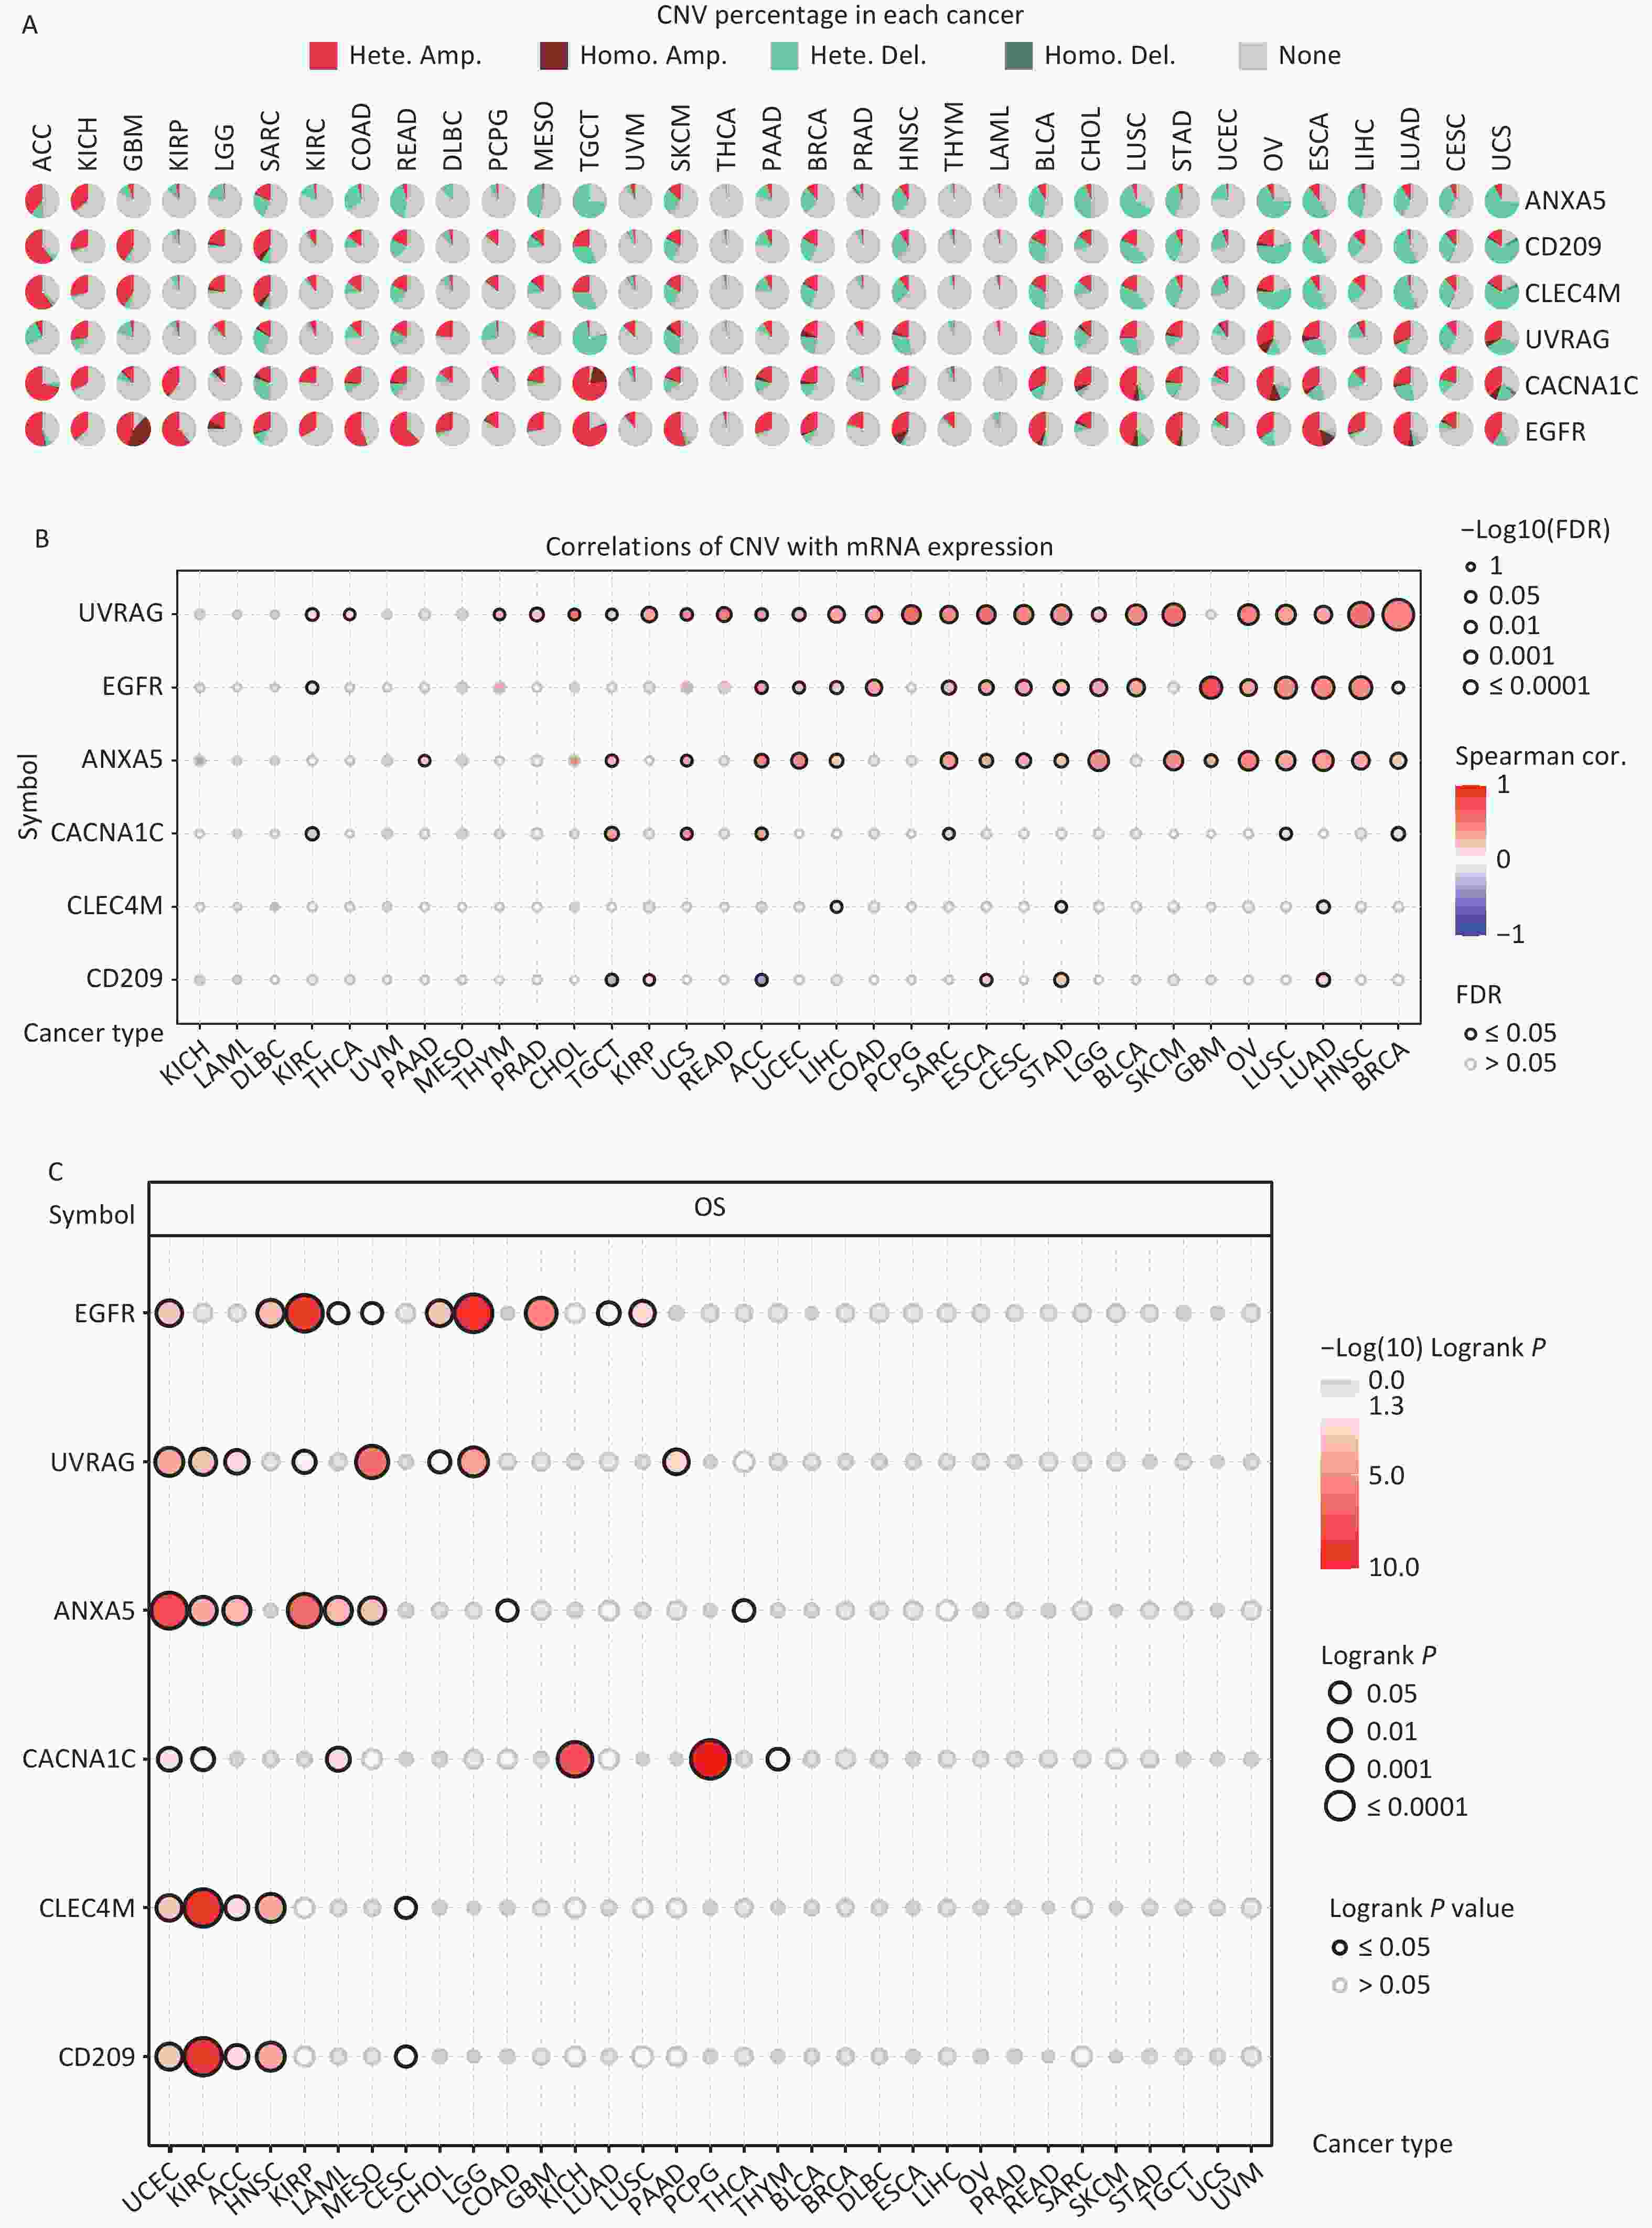
Figure 4. Significant role of CNVs in the aberrant expression of IATGs. (A) Distribution of CNVs in 33 kinds of cancer. CNV pie charts depicts the heterozygous or pure CNV of each gene within the specified cancer type. Pie charts depict the proportion of various CNV forms of a certain gene in a particular tumor, with different colors representing the various CNV kinds. (B) Correlations between the mRNA expression of IATGs and CNV levels are depicted using bubble plots. The darker the color, the greater the association. There is a positive correlation between bubble size and FDR significance. The black border edge signified FDR ≤ 0.05. (C) The relationship between CNV and IATG survival in cancer. Log-rank P values are represented by the size and color of the bubbles. The bubble size is positively connected with the importance of Log-rank P value. The bubble hue from blue to red shows the significance of Log-rank P value from low to high. The black outline suggests that the Log-rank P value is less than 0.05. CNV, copy number variants; FDR, false discovery rate; IATGs, influenza-A virus target genes.
Additionally, CACNA1C expression in KIRC, LUSC, and BRCA, and CD209 expression in TGCT and ACC were negatively correlated with CNV (FDR ≤ 0.05, Figure 4B). However, in most tumors, UVRAG, EGFR, and ANXA5 expression levels were positively correlated with CNV (FDR ≤ 0.05, Figure 4B). Specifically, EGFR, ANXA5, CACNA1C, CLEC4M, CD209 and UVRAG in UCEC; UVRAG, ANXA5, CACNA1C, CLEC4M, CD209 in KIRC; UVRAG, ANXA5, CLEC4M, CD209 in ACC; EGFR, CLEC4M, CD209 in HNSC; EGFR, UVRAG, ANXA5 in KIRP; ANXA5, CACNA1C in LAML; UVRAG, ANXA5 in MESO; EGFR, UVRAG in CHOL, LGG; EGFR in GBM, LUAD, LUSC; CACNA1C in KICH and PCPG; UVRAG in PAAD all had a HR which was greater than 1 and defined as risk factors (P ≤ 0.05, Figure 4C). In contrast, EGFR in LAML and MESO; CLEC4M, CD209 in CESC, ANXA5 in COAD and THCA, and CACNA1C in THYM had HR less than 1 and were defined as protective factors (P ≤ 0.05, Figure 4C). Together, these findings illustrate that the vast majority of CNV in IATGs are heterozygous amplifications and deletions that correlate with tumor progression and prognosis.
-
DNA methylation is the key regulator of gene expression. Aberrant DNA methylation profiles are generally linked with cancer events[42,43]. Therefore, we investigated the methylation status of IATGs in various cancer types. First, the mRNA expression of most IATGs was negatively correlated with their methylation levels in most tumors, whereas CD209 in THYM, HNSC, SKCM, and STAD, as well as CLEC4M in SKCM, were positively correlated with their methylation levels (FDR ≤ 0.05, Figure 5A). Second, hypermethylation of UVRAG in MESO and UCEC, as well as EGFR in KIRC was associated with low survival, with HRs greater than 1, indicating they are risk factors (P ≤ 0.05, Figure 5B). In contrast, hypermethylation of UVRAG in LGG; EGFR in LGG and BLCA; CLEC4M in SARC, STAD, and MESO; CD209 in LGG, UVM, SARC, and SKCM; CACNA1C in LGG, UVM, KIRP, and STAD; and ANXA5 in LGG, BLCA, LIHC, SKCM, LUAD, GBM, KIRC, and HNSC were associated with high survival and were defined as protective factors (HR < 1, P ≤ 0.05, Figure 5B). Finally, the methylation of IATGs in different cancer types was highly heterogeneous. More hypermethylated than hypomethylated genes were found in BRCA, UCEC, and LUAD (FDR ≤ 0.05, Figure 6A). In contrast, HNSC, ESCA, PAAD, THCA, LUSC, LIHC, and KIRC exhibited more hypomethylated genes (FDR ≤ 0.05, Figure 6A).
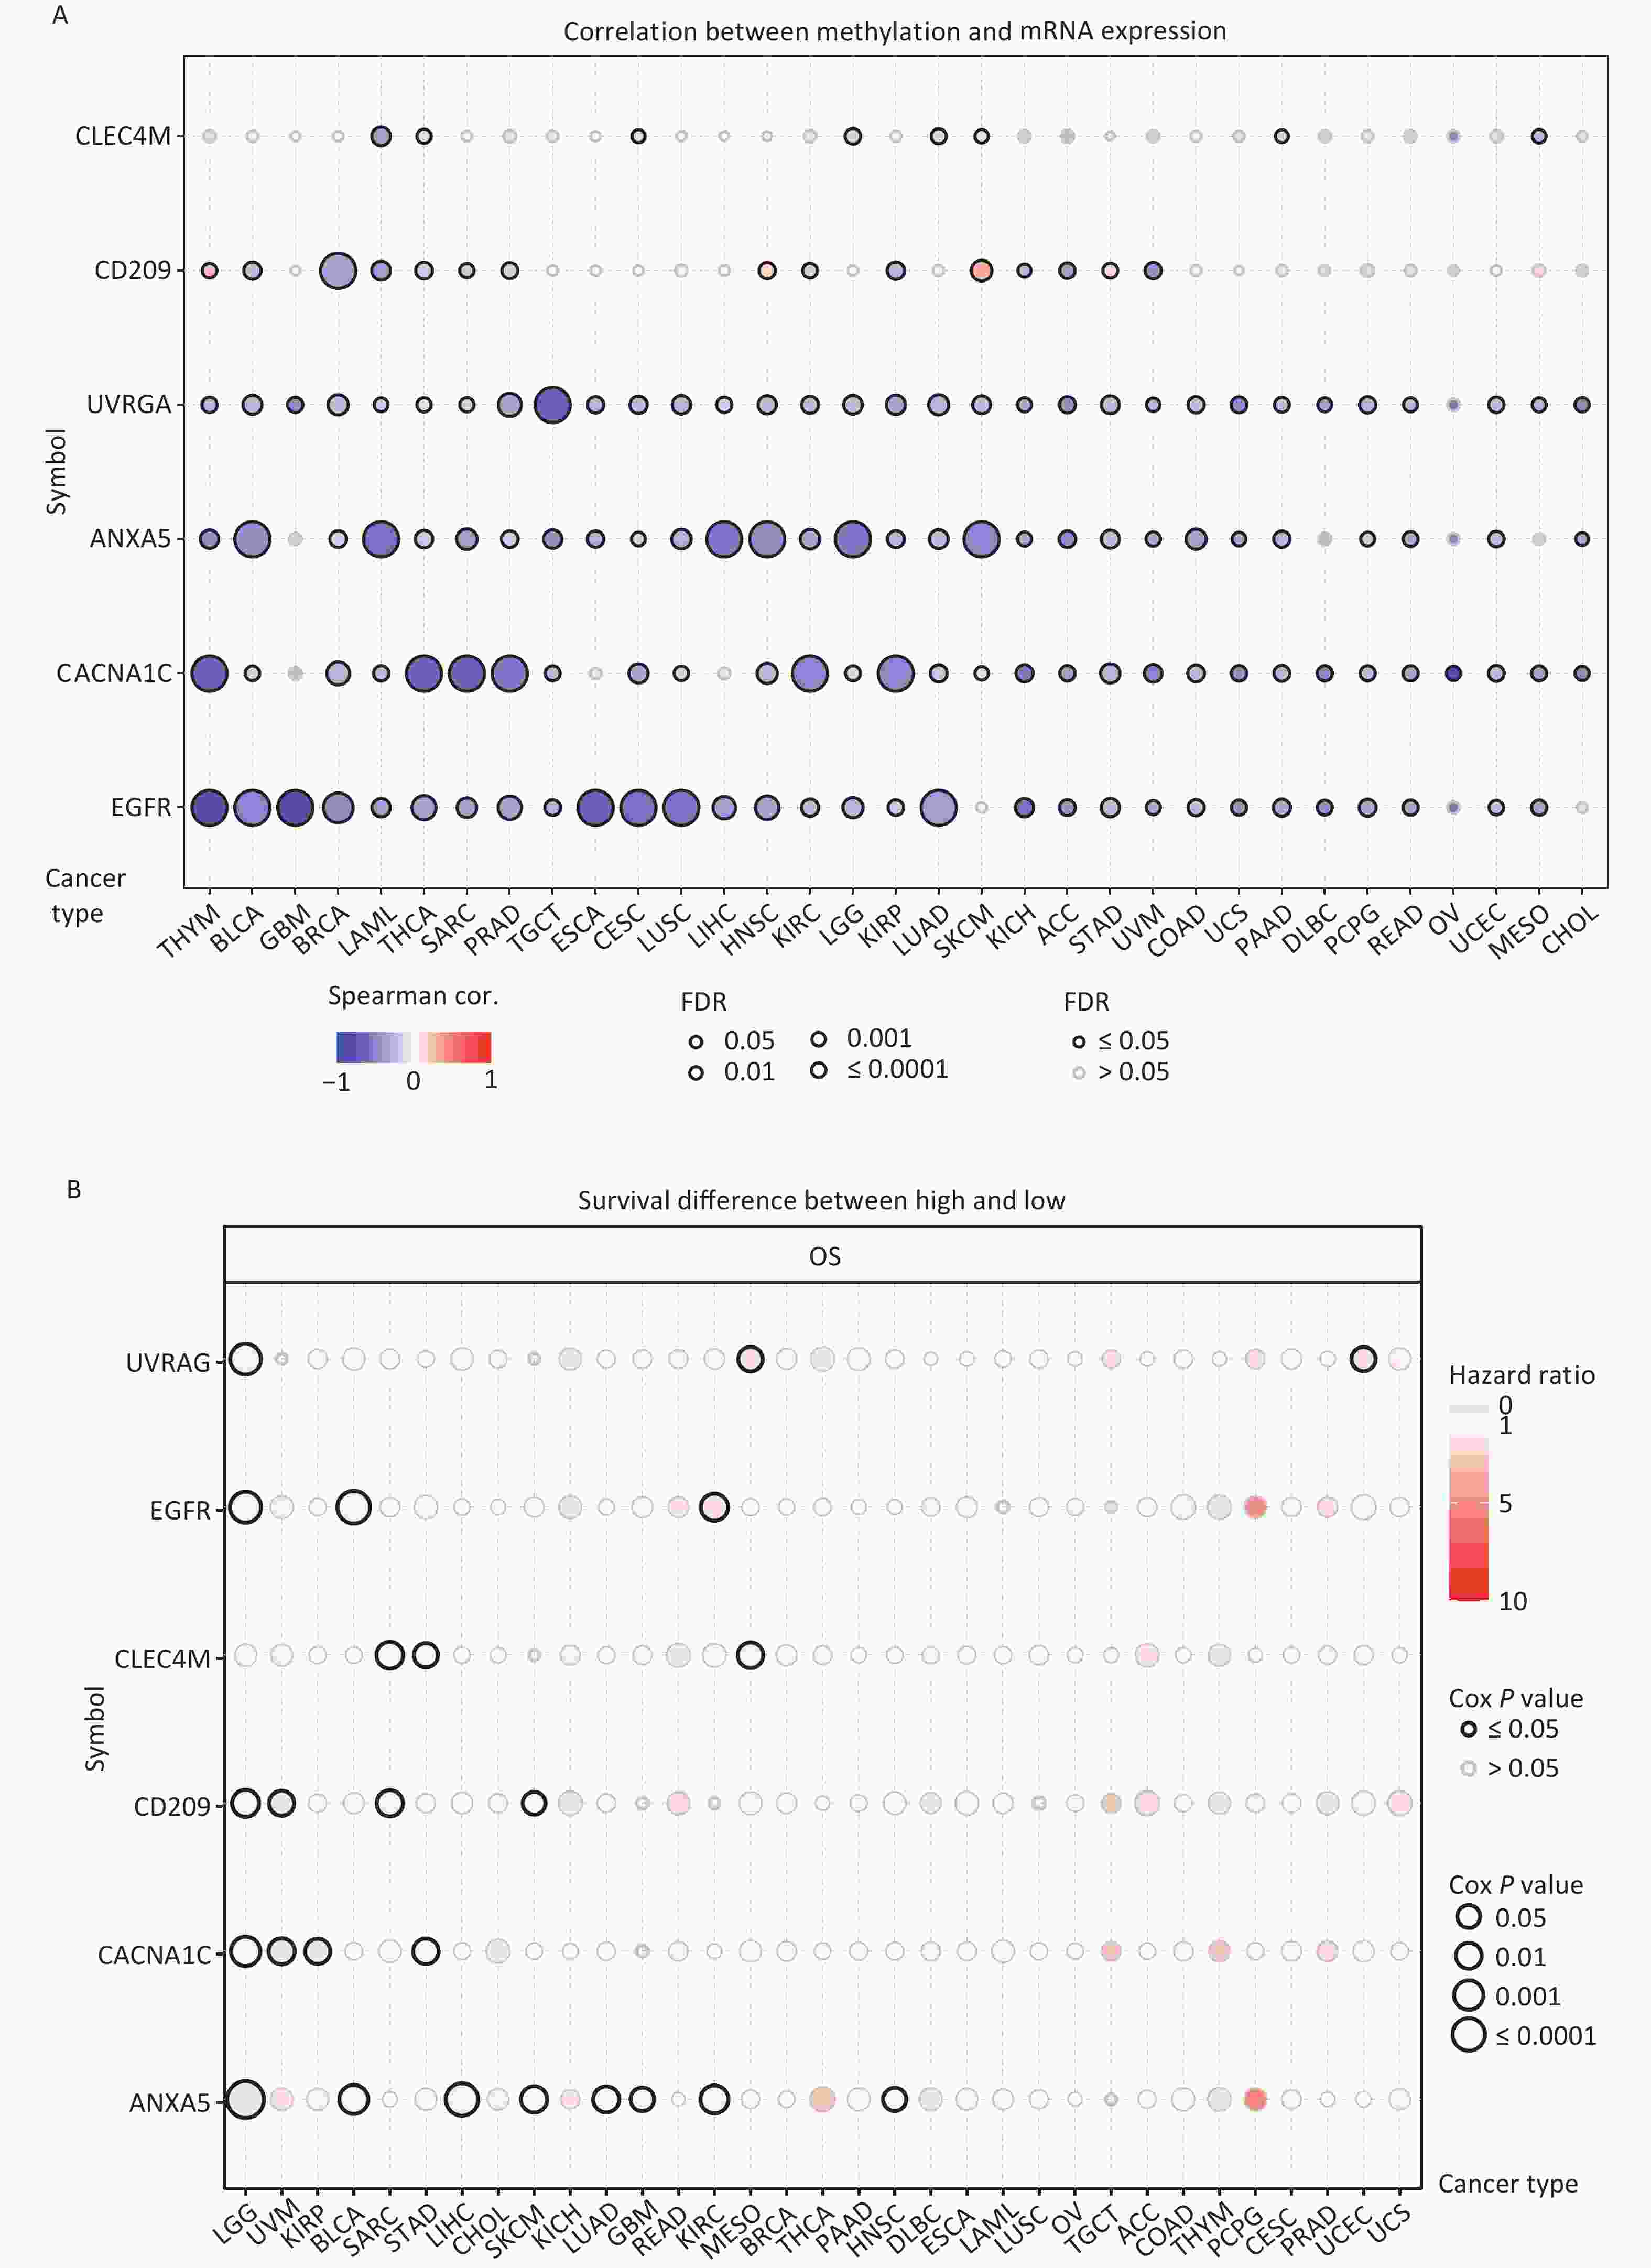
Figure 5. Methylation status of IATGs. (A) Correlation between methylation and the expression of IATGs. Blue dots represent a negative connection, while red dots represent a positive correlation; the darker the hue, the greater the association. (B) Variations in survival between samples with hypermethylated and hypomethylated DNA of IATGs. Risk ratios and Cox P values are indicated by the size and color of the bubbles. The hue of the bubbles, from blue to red, signify low to high hazard ratios, and bubble size is strongly connected with the significance of the Cox P value. Cox P-value ≤ 0.05 are denoted by black outline borders. FDR, false discovery rate; IATGs, influenza-A virus target genes.
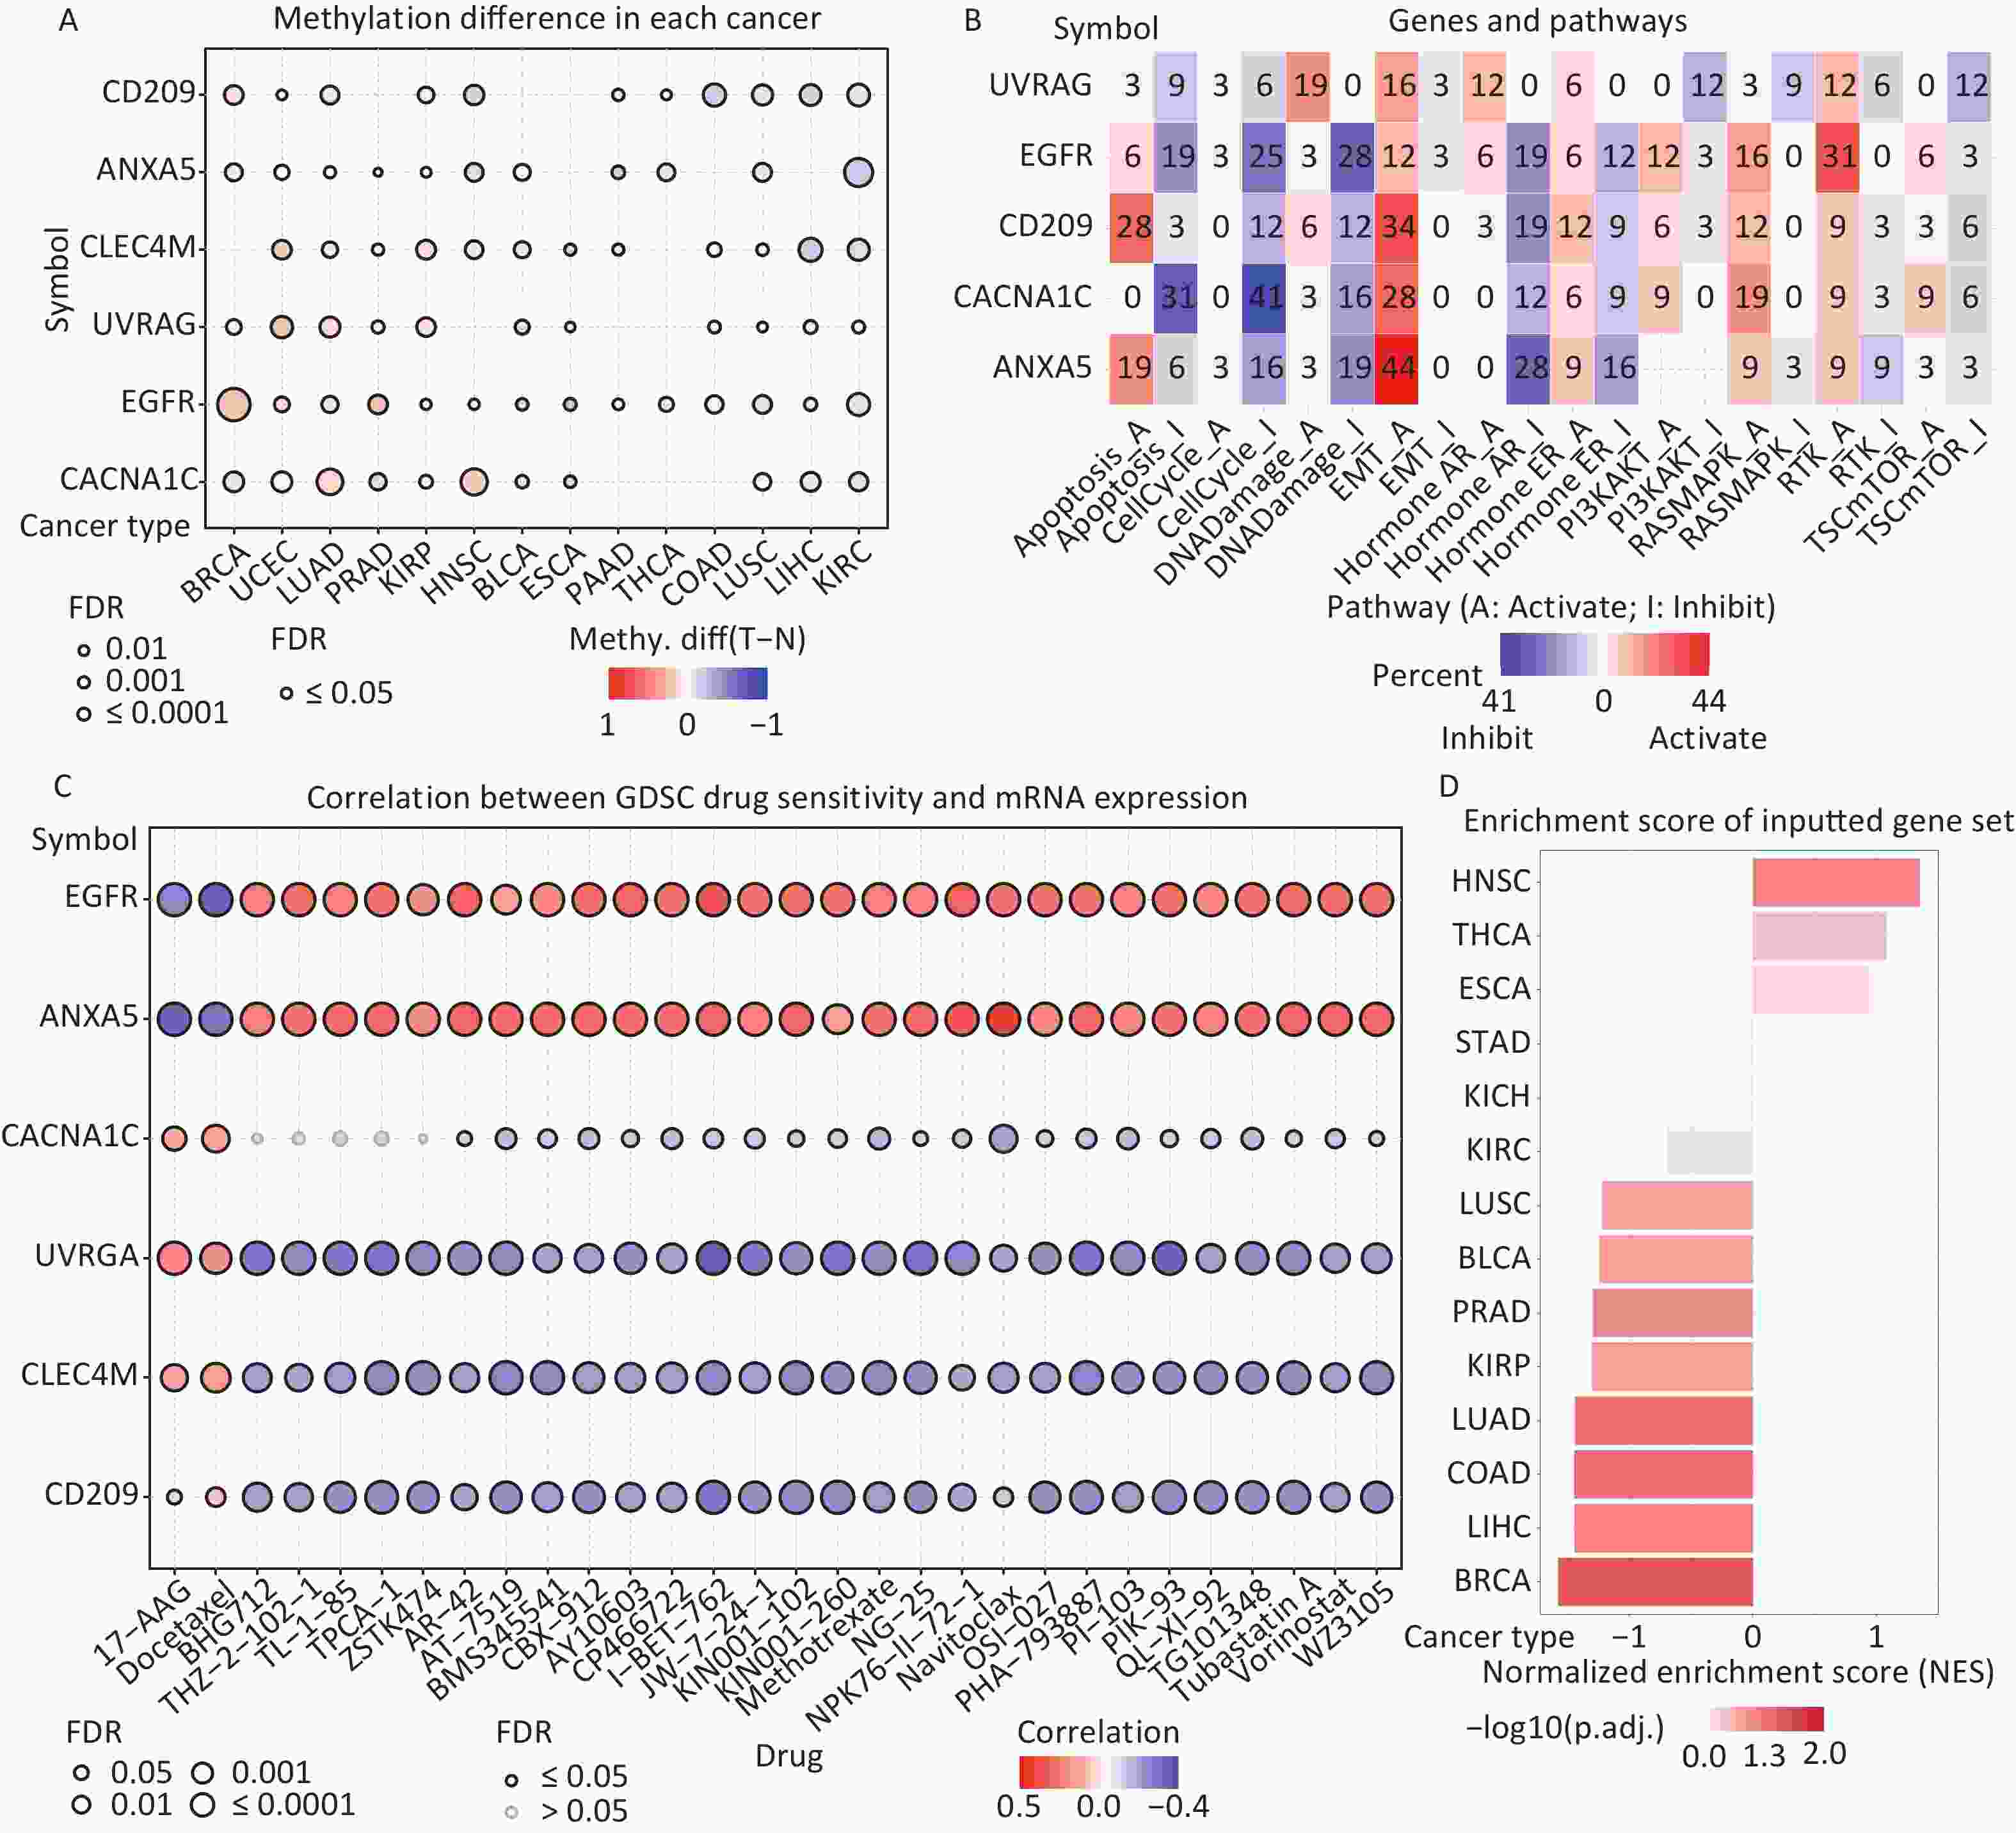
Figure 6. (A) Differences in IATGs’ methylation between tumor and normal samples for each type of cancer. Blue dots show decreased methylation, whereas red dots indicate increased methylation; the darker the color, the greater the methylation. (B) The numbers in each cell indicate the percentage of the gene which is associated with a specific pathway in all the cancer types stated in the study. (C) Bubble diagrams illustrate the relationship between IATGs expression and drug IC50 concentration. Blue bubbles represent unfavorable associations, while red bubbles represent favorable associations; the deeper the color, the stronger the association was. There is a positive correlation between bubble size and FDR significance. Black border outlines denote FDR ≤ 0.05. (D) Bar graphs illustrate the enrichment distribution of input IATGs in various types of cancer. The transformation of the bar from white to red signified FDR’s significance. FDR, false discovery rate; IATGs, influenza-A virus target genes.
-
In this study, the relationship between IATGs and cancer-related pathways was analyzed. All six IATGs included in this study, except CLEC4M, were significantly involved in classical cancer-related signaling pathways. The detailed signaling pathways were as follows: apoptosis, cell cycle, DNA damage, EMT, hormone AR, hormone ER, PI3K/AKT, RAS/MAPK, RTK, and TSC/mTOR. The numbers in each cell in Figure 6B indicated the percentage of the gene associated with a specific pathway in cancers. The major pathways affected by the UVRAG regulation were DNA damage (19%) and EMT (16%). The major pathways involved in EGFR were RTK activation (31%) and DNA Damage inhibition (28%). For CD209, the affected pathways were apoptosis (28%) and EMT (34%) activation. For CACNA1C, the main pathways were apoptosis (31%) and cell cycle (41%) inhibition; for ANXA5, the main pathways involved were EMT activation (44%) and Hormone AR inhibition (28%) (Figure 6B). These results suggest that IATGs play a vital role in the regulation of cancer-related signaling pathways.
-
Drug resistance remains a major challenge in cancer therapy. Overcoming this resistance is extremely urgent. Two chemotherapeutic drugs (tanespimycin and docetaxel), which can be applied to several cancer types, were negatively correlated with the expression of EGFR and ANXA5 but positively correlated with the expression of CACNA1C, UVRAG, CLEC4M, and CD209 (FDR ≤ 0.05, Figure 6C). Furthermore, the resistance of the following drugs, including BHG712, THZ-2-102-1, TL-1-85, TPCA-1, ZSTK474, AR-42, AT-7519, BMS345541, BX-912, CAY10603, CP466722, I-BET-762, JW-7-24-1, KIN001-102, KIN001-260, Methotrexate, NG-25, NPK76-II-72-1, Navitoclax, OSI-027, PHA-793887, PI-103, PIK-93, QL-XI-92, TG101348, Tubastatin A, Vorinostat, and WZ3105 were negatively correlated with EGFR, ANXA5 expression and positively correlated with UVRAG, CLEC4M and CD209 expression, respectively (FDR ≤ 0.05, Figure 6C). These results suggest that the aberrant expression of IATGs may involve in tumor resistance to chemotherapy or targeted drug.
-
The NES obtained from the GSEA reflects the degree of specific gene enrichment. The NES of IATGs was upregulated in HNSC, THCA, and ESCA, which was more likely to be enriched in these three cancer types, but was downregulated in LUSC, BLCA, PRAD, KIRP, LUAD, COAD, LIHC, and BRCA, which were considered to have a lower possibility of enrichment in these cancer types (FDR ≤ 0.05, Figure 6D).
-
Currently, cancer immunotherapy is widely applied to treat diverse types of cancer with good prognosis[44,45]. Therefore, it is important to explore the link between IATGs and immunity. As shown in Figure 7A, based on the GSVA scores of IATGs, IATGs were positively correlated with the infiltration score in most tumor types as well as with the expression of markers of immune infiltrating cells such as CD4+ T cells, natural killer cells (NK), natural killer T cells (NKT), T follicular helper cells (Tfh), central memory T cells (TCM cells), dendritic cells (DCs), Inducible regulatory T cells (iTreg), and macrophages. On the contrary, IATGs were negatively correlated with the expression of markers of effector memory T cells (TEM cells), neutrophils, B cell, and naive CD4+ T cells (*P value ≤ 0.05; #: FDR ≤ 0.05). Furthermore, correlation analysis of IATGs and immunostimulatory pathways using the GEPIA2 database revealed a positive correlation between IATGs and the immunostimulator (Figure 7B, R = 0.48), MHC immune (Figure 7C, R = 0.36), and chemokine immune pathways (Figure 7D, R = 0.40). Taken together, these results suggest that IATGs are closely linked to tumor immunity and affect tumor immune pathways that influence tumor progression.
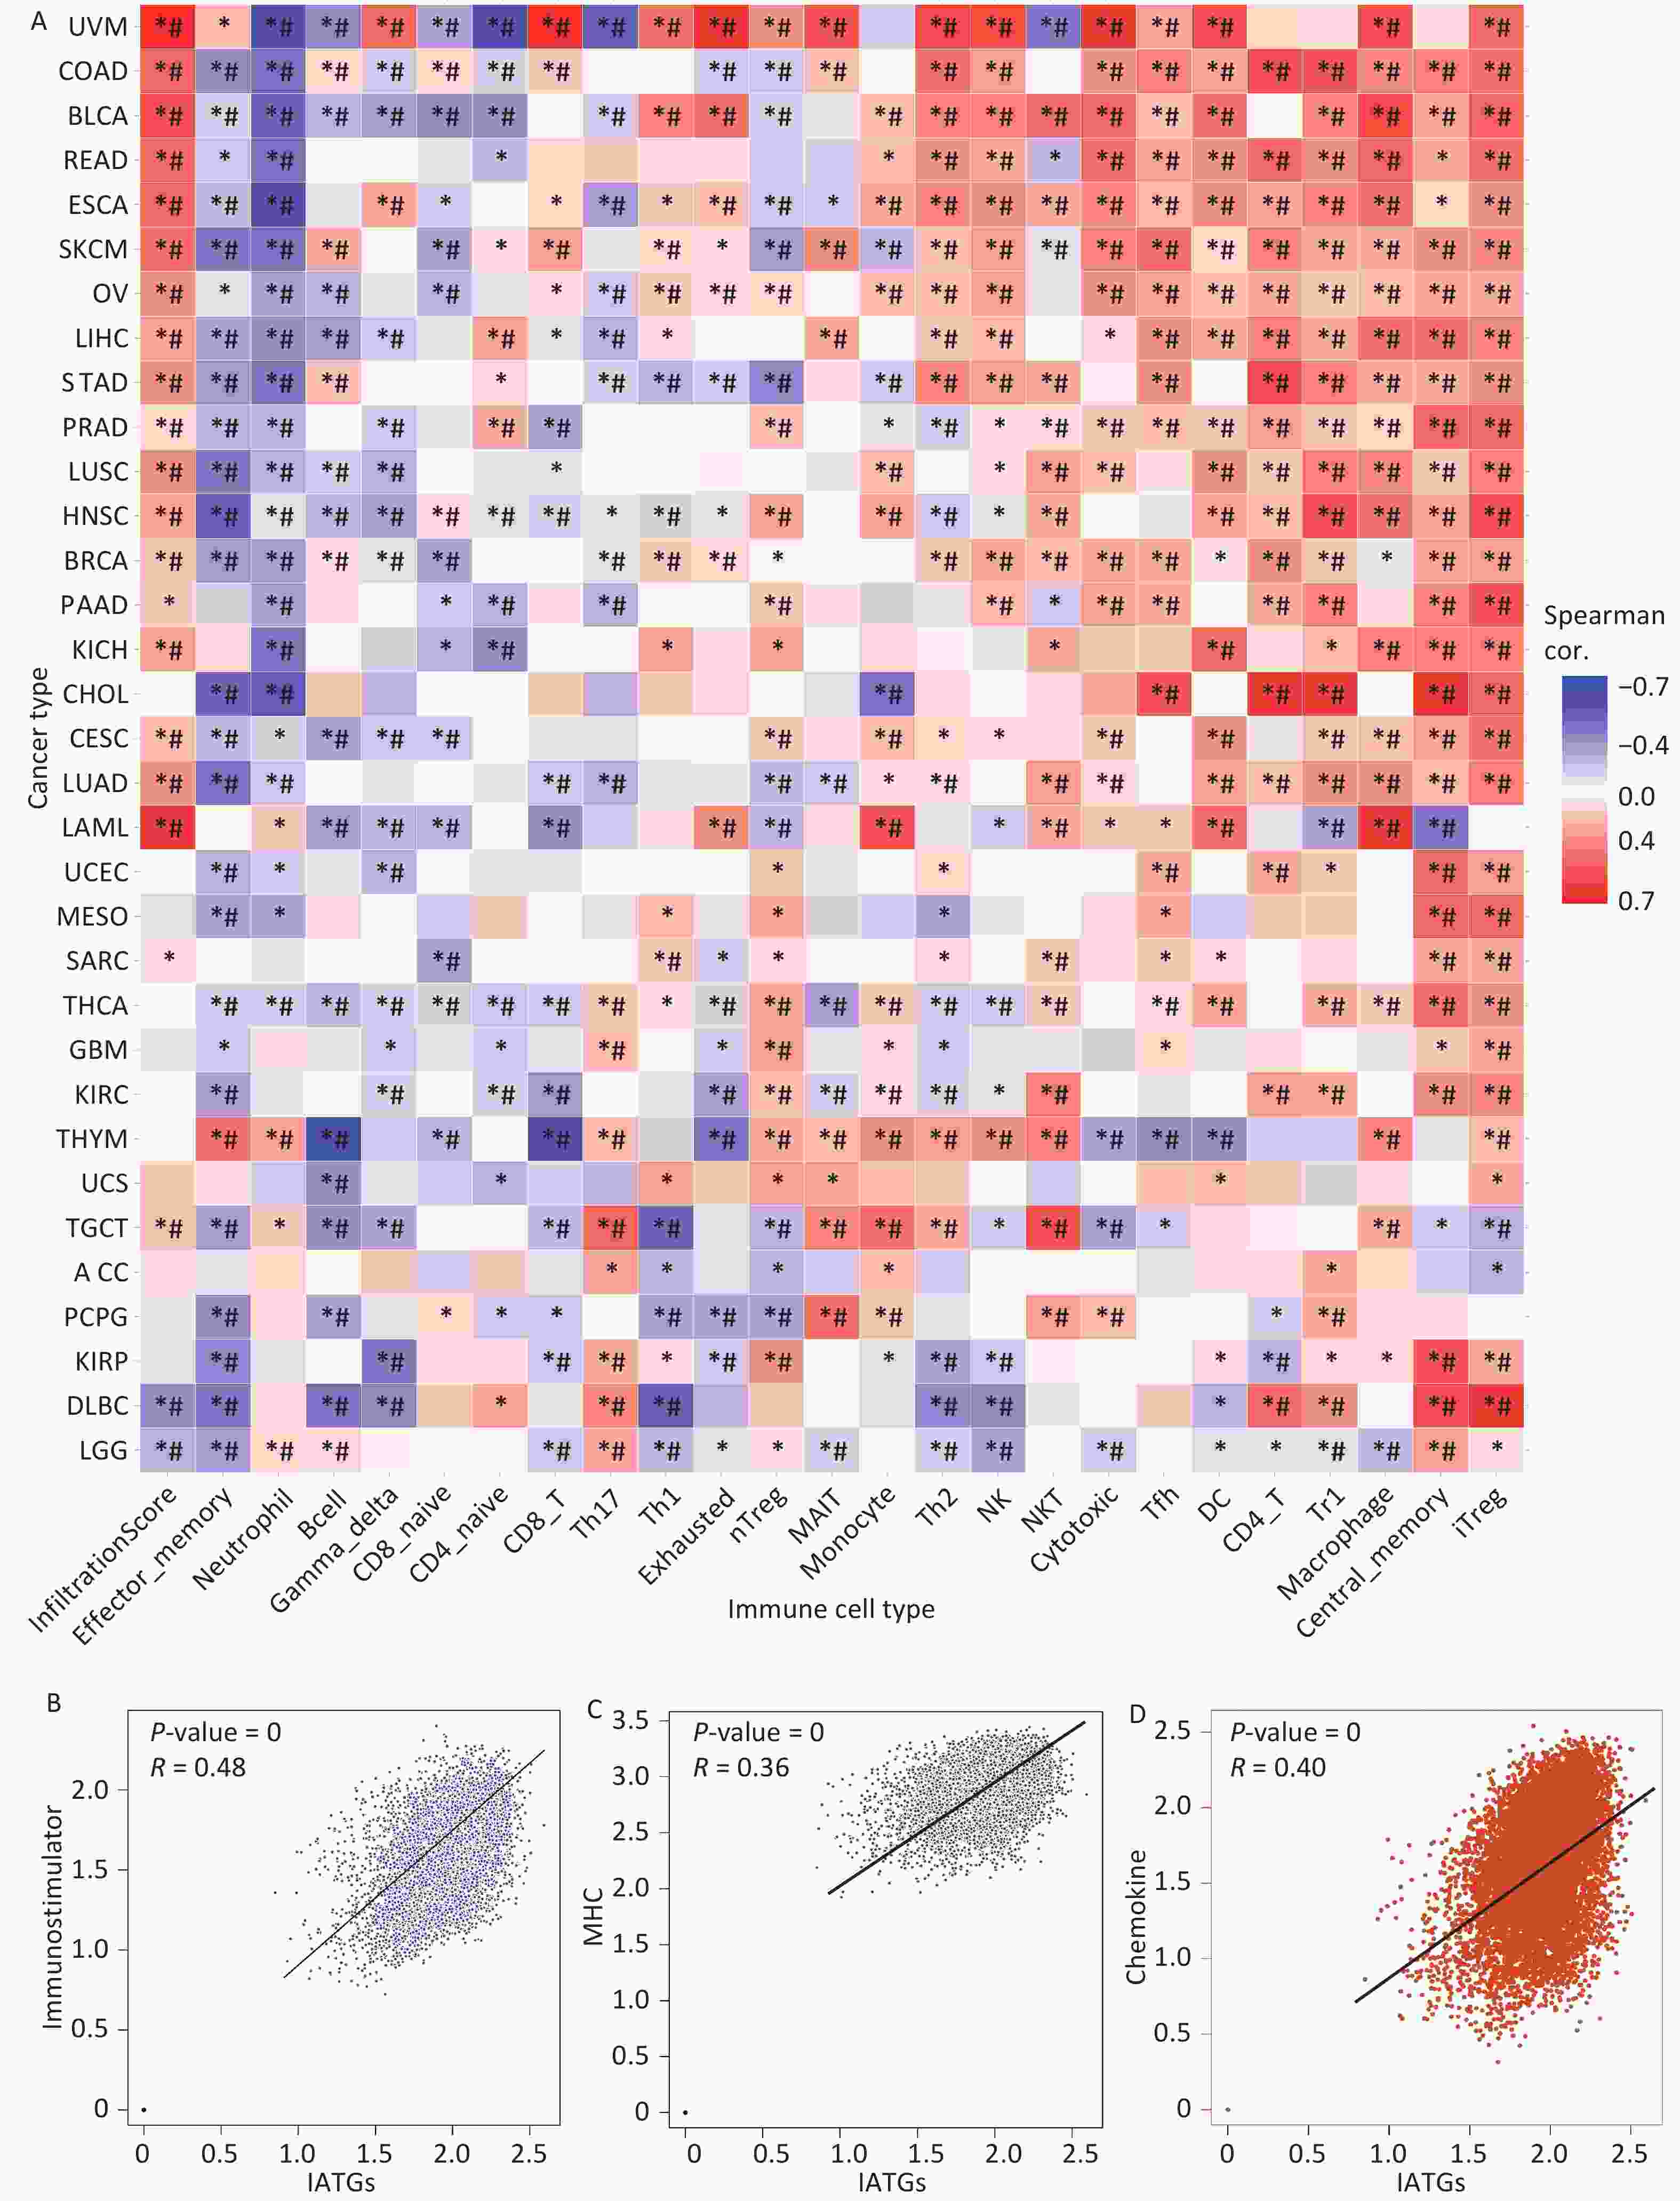
Figure 7. Immunoassay of IATGs. (A) Relationship between immune cell infiltration and IATG Score. The significance of P values and FDR is summarized in a heat map based on the Pearman correlation analysis between input gene set GSA scores and immune cell infiltration. Blue dots represent unfavorable correlations, while red dots represent favorable correlations; the denser the color, the stronger the correlation. *P-value ≤ 0.05; #FDR ≤ 0.05. (B) IATGs and immunostimulant immune pathway correlation. R denotes the correlation, and R > 0 shows that the correlation is positive. (C) IATGs are correlated with the MHC immune pathway. R is the correlation coefficient, and R > 0 indicated that the correlation is positive. (D) IATGs are correlated with the chemokine immune pathway. R denoted the relationship between variables, and R > 0 showed that the correlation was positive. IATGs, influenza-A virus target genes.
-
To increase the reliability of the analyses, we further confirmed the gene expression of ITAGs, including EGFR, ANXA5, CACNA1C, CLEC4M, CD209, and UVRAG, by qRT-PCR in kidney clear cell carcinoma (KIRC). KIRC is one of the most common cancer types and was chosen as the representative cancer type in this study. The HK-2 cell line is a normal kidney epithelial cell line that was used as a control. The 786-O, ACHN, and Caki-1 cell lines are the kidney carcinoma cell lines were used. RT-PCR results in the KIRC cell lines showed that EGFR, ANXA5, CACNA1C, CD209, UVRAG were upregulated, and CLEC4M were downregulated, which was consistent with the data analyzed from the TCGA and GTEx databases (Figure 8).
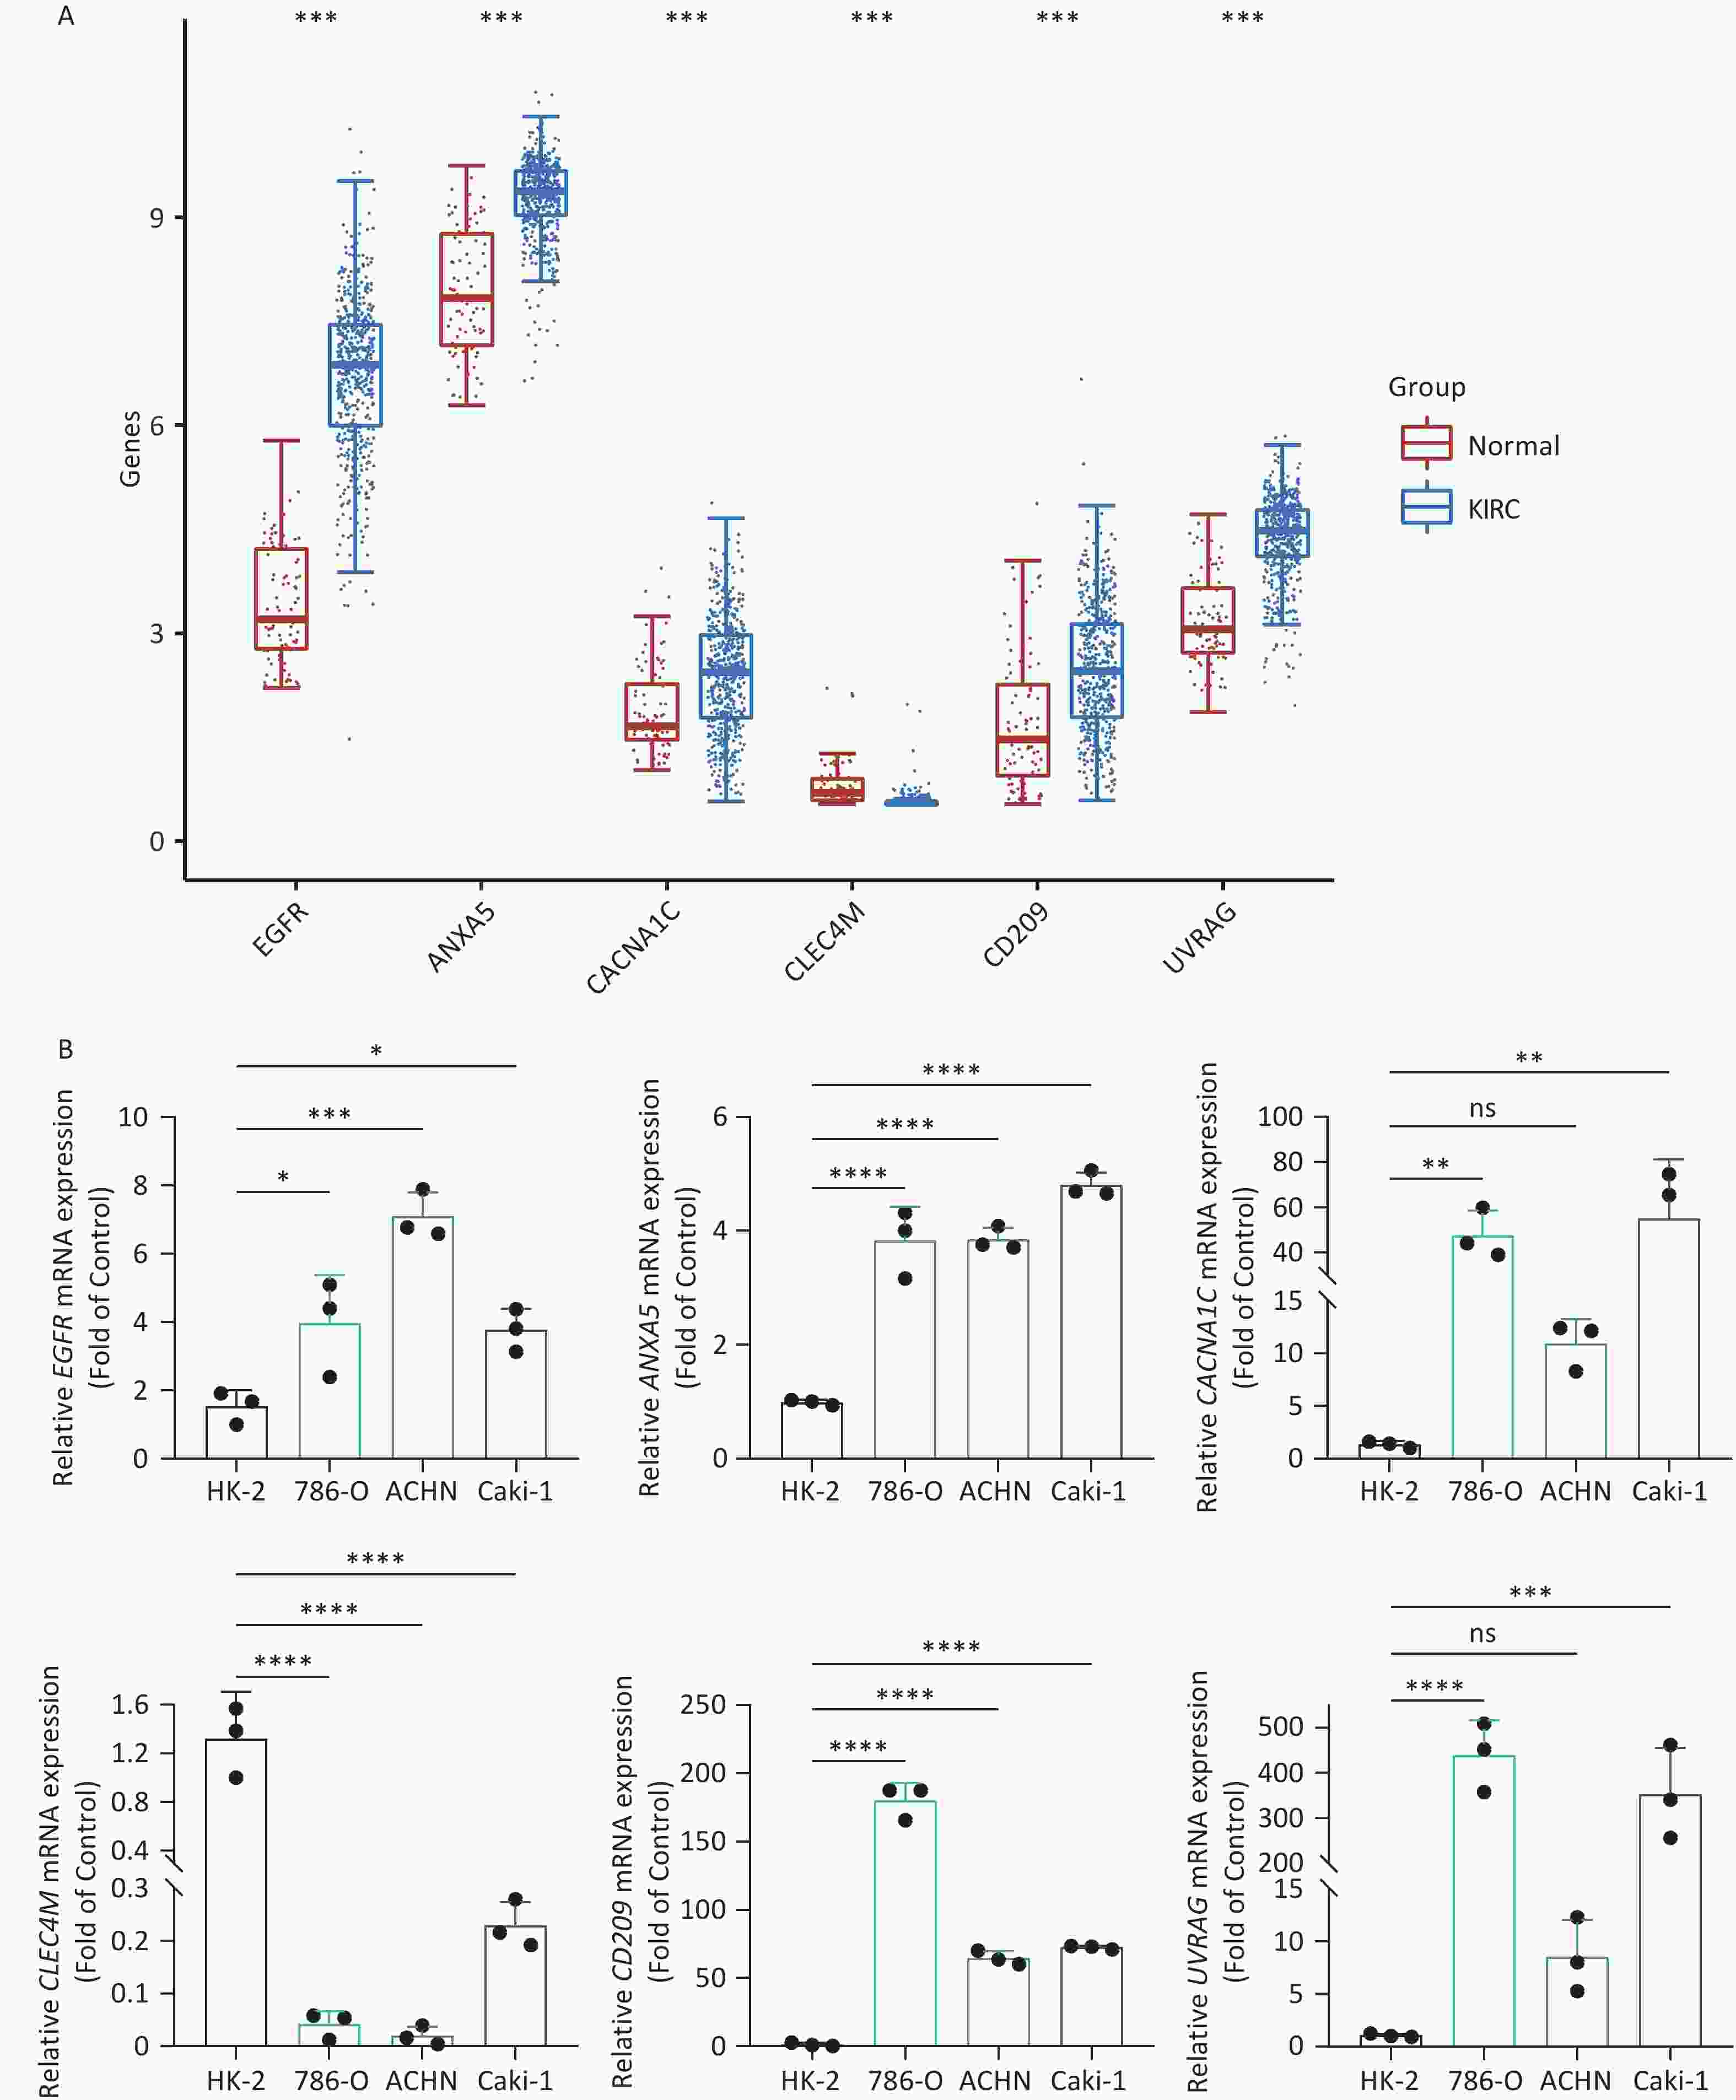
Figure 8. IATG expression in kidney renal clear cell carcinoma (KIRC). (A) Gene transcript level in KIRC according to The Cancer Genome Atlas (TCGA) and GTEx databases; (B) qRT-PCR evaluation of IATGs in KIRC (n = 3). P < 0.05 is statistically significant. *P < 0.05, **P < 0.01, ***P < 0.001, ****P < 0.0001, ns: not significant. IATGs, influenza-A virus target genes.
-
Progress made in clinical research on viral therapeutics suggests that developing viral-targeted cancer techniques is a promising complement to conventional therapy. However, after viral therapy, the alterations and interactions in solid tumors are complicated and may be influenced by various factors[46]. Furthermore, the interaction between IAV and malignancies is not well understood and requires further study and evaluation. By mining data from multi-omics analyses, we fully and systematically described IATGs in samples from thirty-three kinds of cancer. Our findings not only highlight the probable association between IATGs and tumors but also illuminate the entire picture of the relationship between influenza A and tumors.
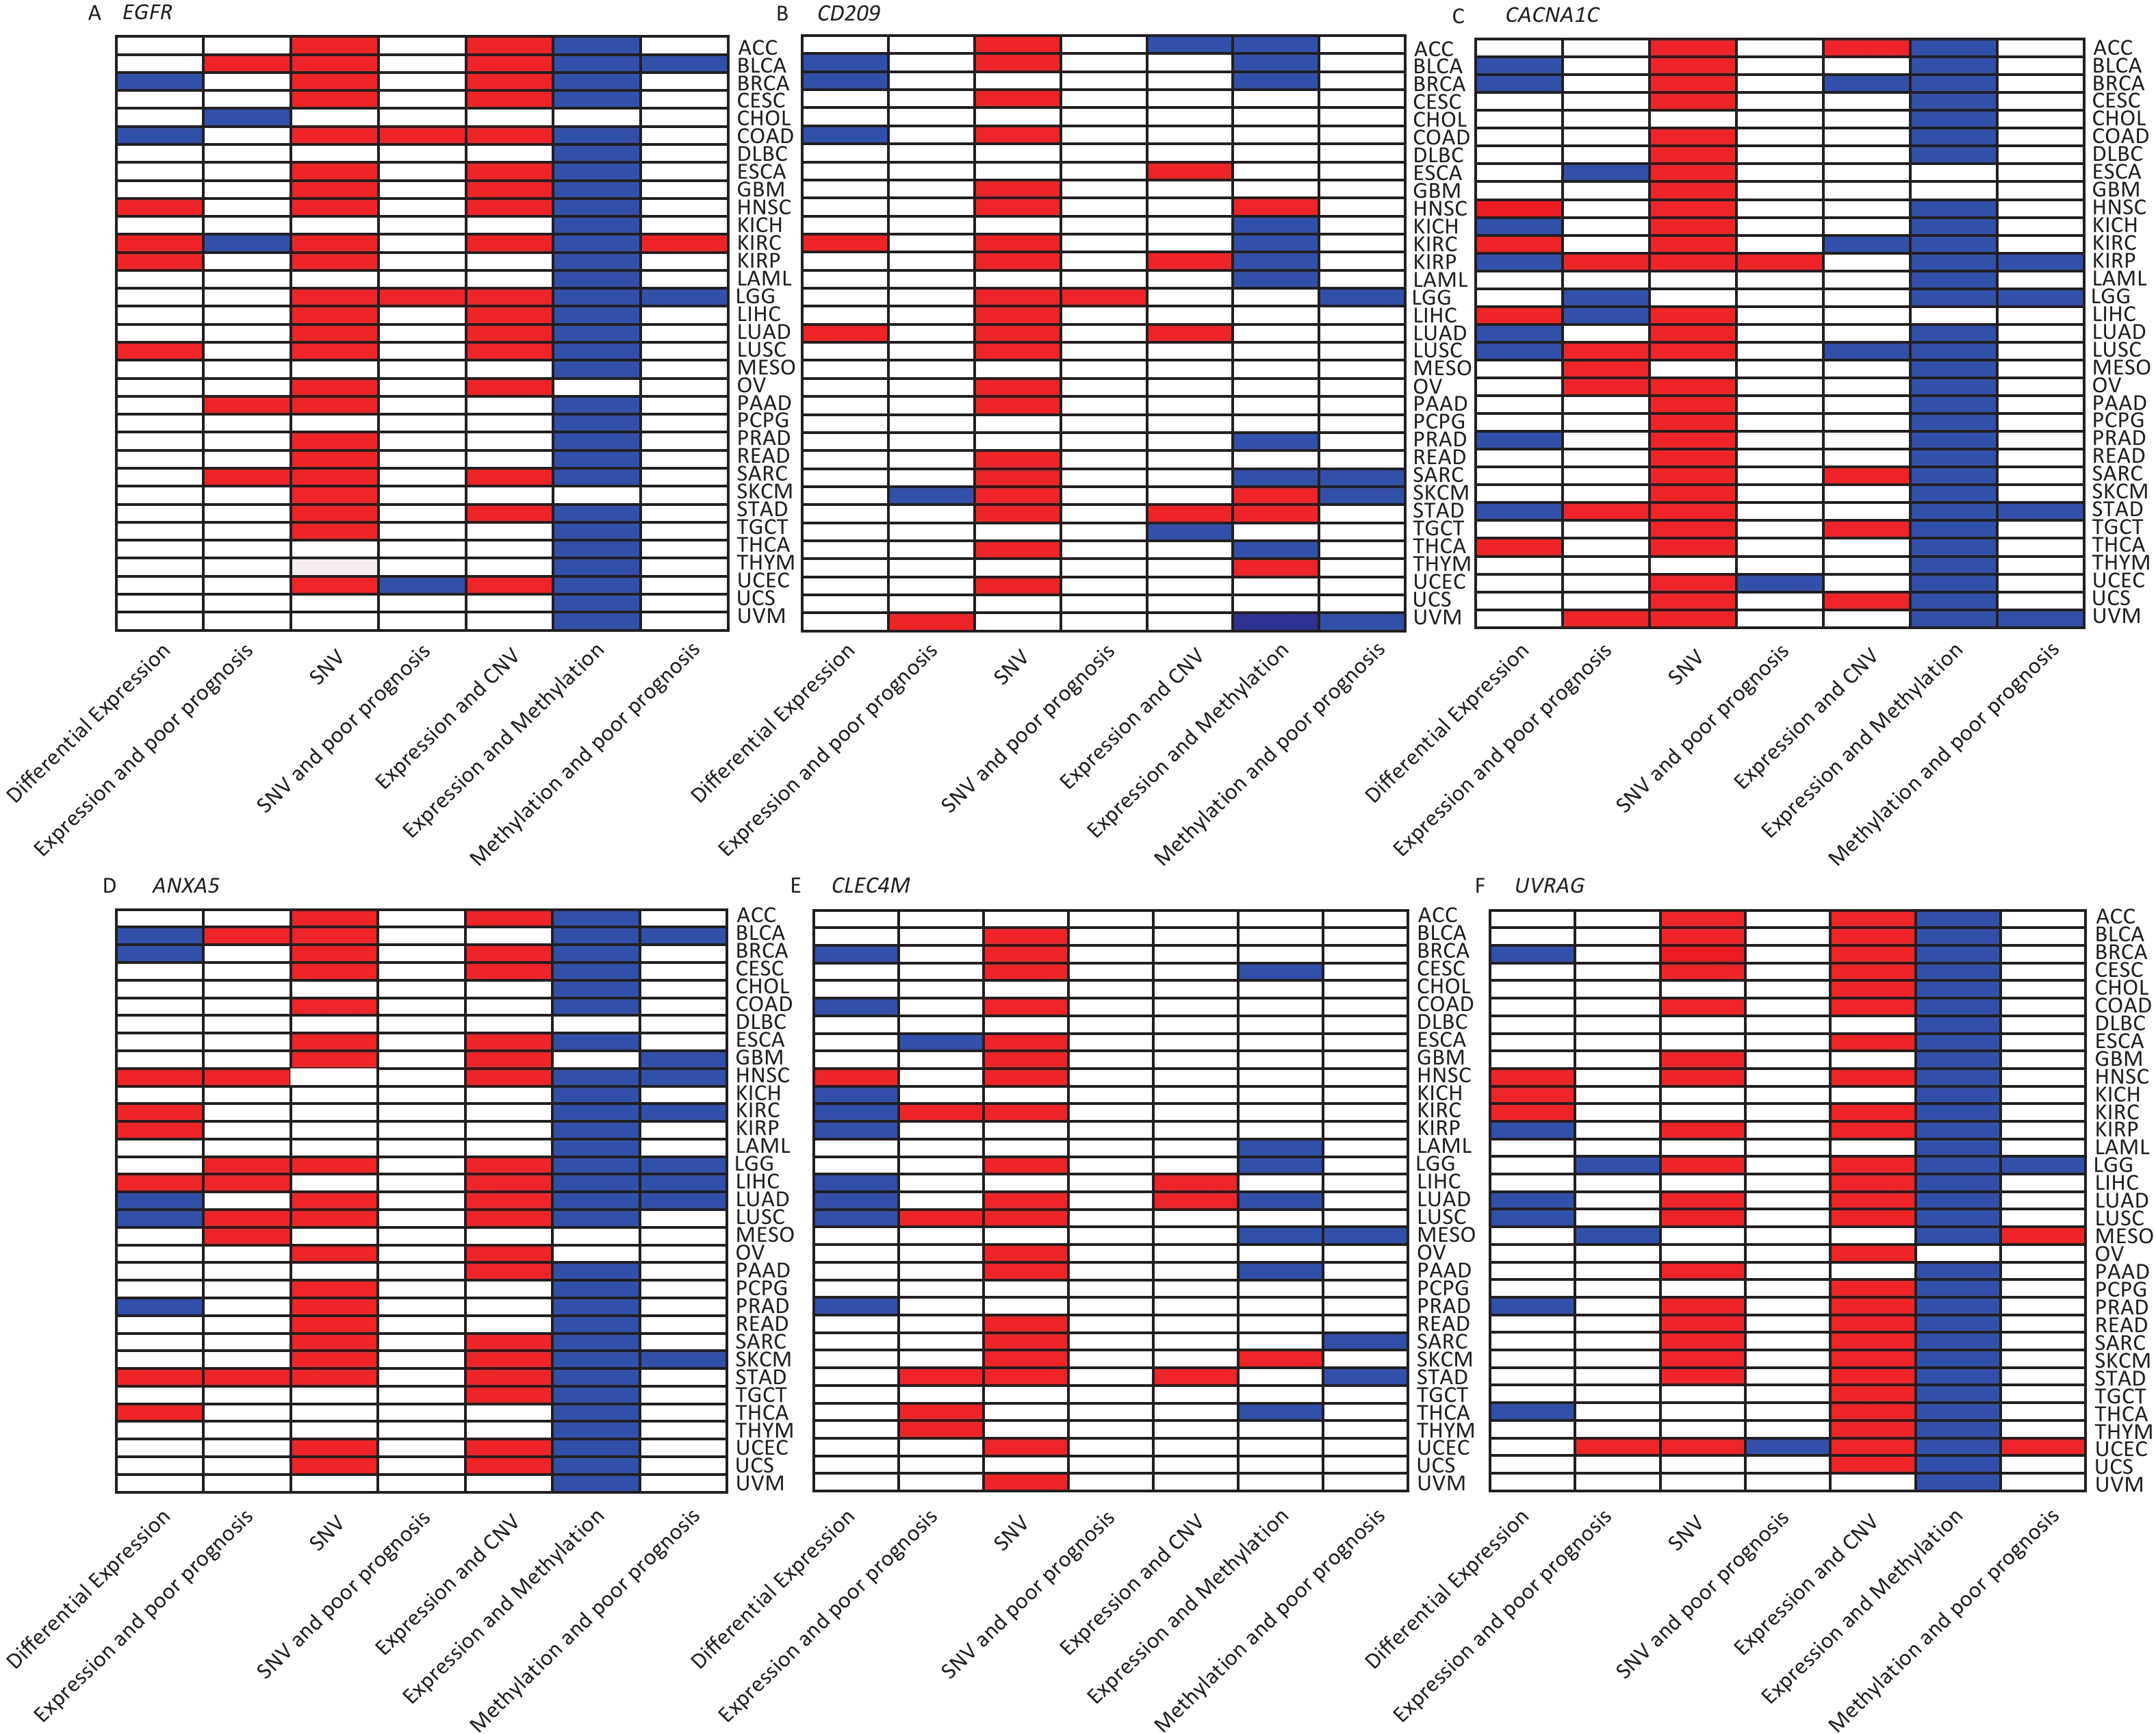
We investigated the genetic signature of IATGs in thirty-three cancer types. We observed that IATGs are involved in carcinogenesis, and their expression affects tumor prognosis. As shown in Figure 9, IATGs were frequently aberrantly expressed in multiple cancer types in three different situations. First, while the low and high expression levels of ANXA5 seem to be evenly distributed in the investigated types of cancers, the overexpression of ANXA5 is often positively correlated with poor prognosis. Second, CACNA1C and CLEC4M are more frequently downregulated in many tumor types; however, their overexpression is more positively correlated with poor prognosis. Third, there was no clear correlation between the high and low expression profiles of EGFR, CD209, and UVRAG in multiple cancers, nor between their expressions and prognosis.
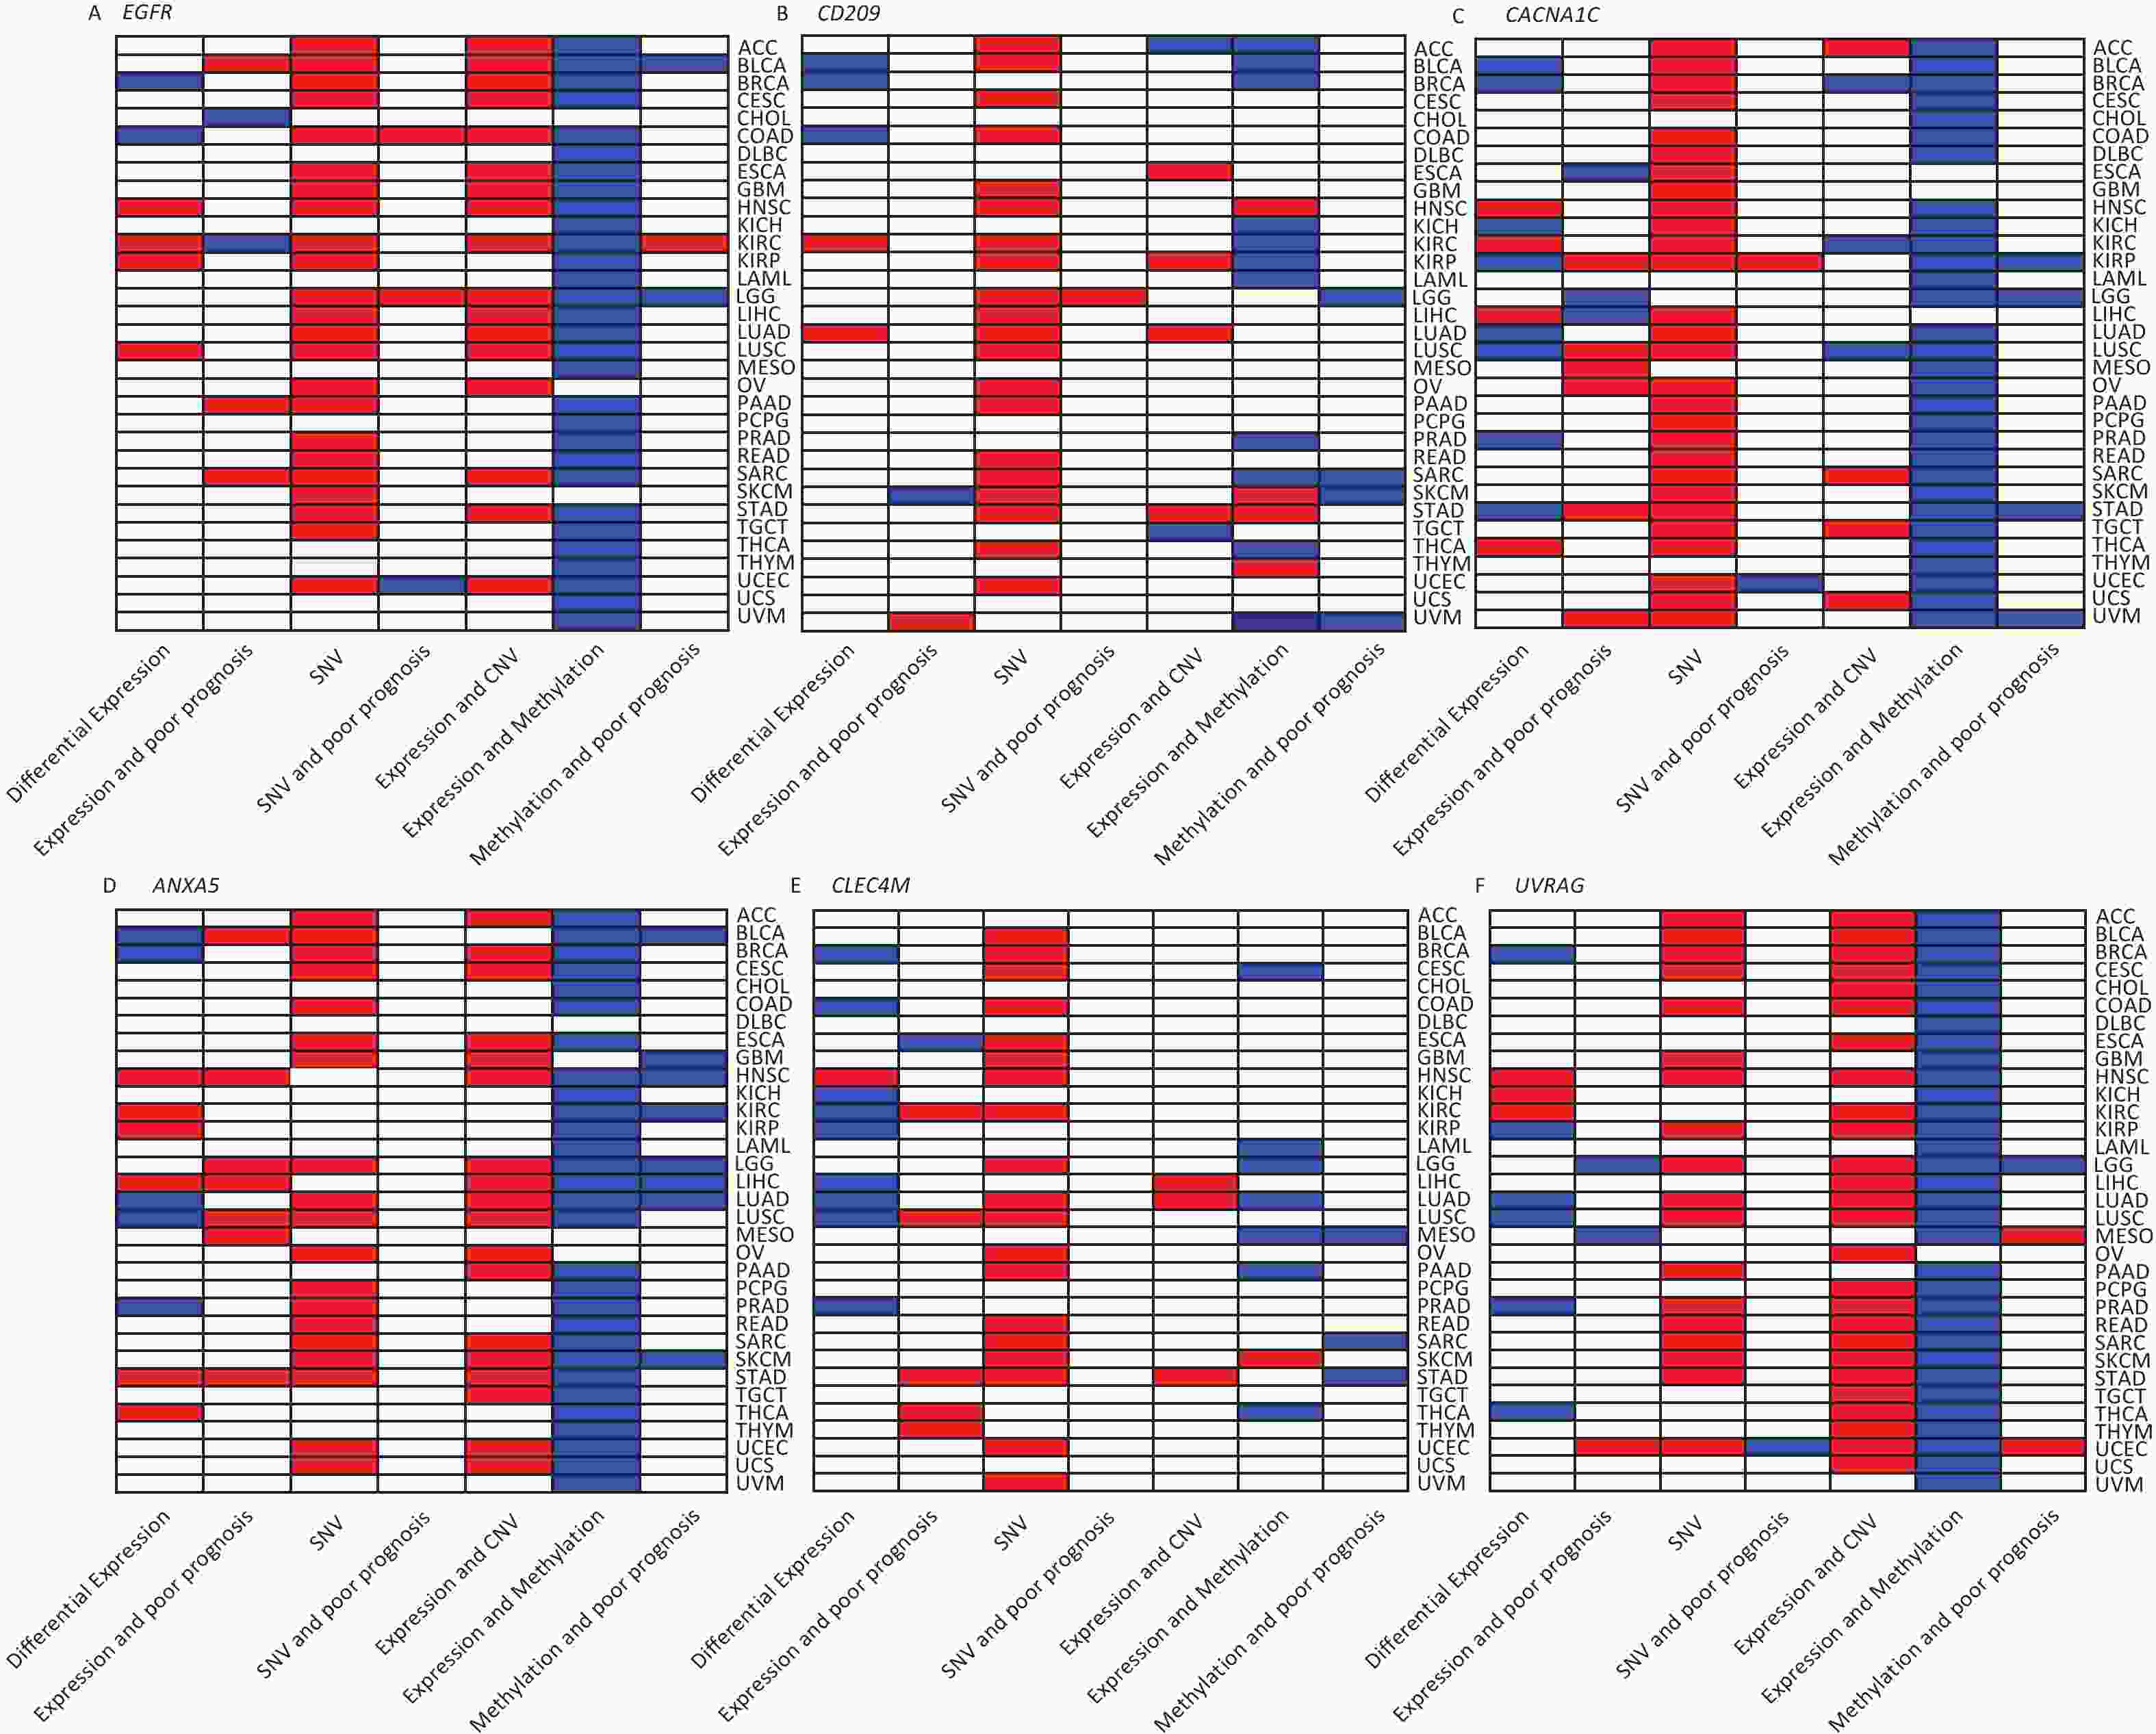
Figure 9. Gene-based two-dimensional map (heat map) of the correlation between related factors. Red signifies an uptrend adjustment, a positive correlation, or a positive presence. Blue represents negative correlation and down-regulation. White represents a correlation that is insignificant, nonexistent, or absent. (A) EGFR, (B) CD209, (C) CACNA1C, (D) ANXA5, (E) CLEC4M, (F) UVRAG.
Moreover, our genetic study indicated a high prevalence of SNV, CNV, and IATG methylation. The mutation frequency and type of SNV in each cancer were analyzed in this study, which showed that SNV was observed in most cancer types except UCS, DLBC, UVM, KICH, PCPG, THCA, CHOL, LAMI, and MESO. However, these IATGs have only been shown to be associated with prognosis in a few cancers (Figure 9), probably because of the relatively low SNV data from the limited number of specimens included in this study.
Furthermore, as shown in Figure 9, there were three different situations for the relationship between the expression of CNV and IATGs. First, the expression of EGFR, ANXA5, and UVRAG is closely related to the CNV of these three IATGs in most tumor types, and their expression always presents a positive correlation with CNV. Second, the expression of CLEC4M was positively correlated with the expression of CNV, but only in three types of tumors. Third, the remaining two IATGs, CD209 and CACNA1C, were also associated with CNV in several tumors. However, their expression displayed both positive and negative correlations with CNV. Overall, this suggests that CNV in IATGs most likely upregulate their expression and promote carcinogenesis in a few cases.
The epigenetic analysis used in Figure 9 revealed notable findings. The methylation of EFGR, CACNA1C, ANXA5, and UVRAG in most tumors negatively correlated with their expression, whereas the methylation status of CD209 and CLEC4M was only linked to their expression in a few tumor types. Both hypermethylation and hypomethylation of CD209 and CLEC4M can negatively regulate their expression depending on the cancer type. However, negatively regulated by hypermethylation was more common than hypomethylation. Abnormally high methylation levels promote the downregulation of IATGs in a higher proportion of cases and are associated with longer survival in various tumors.
In summary, based on the analysis of the genetic and epigenetic changes in IATGs, CNV is positively linked with IATGs expression, while methylation is negatively linked in most cases, which promotes or hinders tumor formation in some way or other. Despite the systematic identification of the genetic and epigenetic characteristics of IATGs, the present study did not examine post-translational modifications (PTMs) of IATG proteins. PTMs are essential for modulating protein functions in numerous cellular processes. The integration of PTM data into the analysis is, therefore, an objective of the subsequent phase of work.
Regarding cancer-associated signaling pathways, different IATGs are connected to different signaling pathways related to cancer and induce uneven activation or inhibition. It has been established that modulation of NF-κB signaling by EBV and KSHV is not only critical for viral infections, but also contributes to the formation of malignant tumors[47]. In contrast, EGFR, UVRAG, CD209, CACNA1C, and ANXA5 are involved in the activation of the EMT pathway. Thus, these data show that IATGs represent a network of interactions among cancer-related signaling pathways that may be implicated in driving tumor growth.
Furthermore, the present study investigated the role of IATGs in tumor immunity using the GSVA score of IATGs and found that IATGs are closely related to immune infiltrating cells and that they work together to play a part in maintain the immunological homeostasis of the body. Further research indicated that IATGs were positively associated with three immunological pathways, namely the immunostimulant route, MHC pathway, and chemokines, which may imply the promoting influence of high IATG expression on tumor immunity and that high IATG expression may limit tumor progression. Moreover, previous studies have revealed that viruses, such as EBV, might interfere with the tumor immune environment and consequently affect tumor progression[48]. The results of the present immunological analysis may reveal the mechanism by which IAV regulates the tumor immune milieu and consequently alters the tumor through IATGs. However, to gain a more comprehensive understanding of the correlation between IATGs and immunity, it is possible to further include and subdivide the tumor specimens undergoing analysis into treated and untreated groups. This would enable the examination of the effects of anti-cancer drugs on IATGs expression levels and the immune microenvironment. In this study, IATGs were also found to be related to tumor resistance to several anticancer drugs or compounds (Figure 6). Therefore, targeting IATGs is a promising strategy for cancer treatment.
The main drawback of this study is that there has not been enough investigation into the effects of IAV on tumors via IATGs. Existing research results are still limited. To validate the correlation between IATGs and IAV, further wet experiments should be performed to acquire more reliable and substantial evidence. However, the findings of this study are important and provide fresh insights into the mechanisms of tumor-ATG interactions. In addition, changes in IATGs exist at all regulatory levels, including genetic and epigenetic modifications, mRNA expression, immune infiltration microenvironment, and pathway connectivity. These alterations may, in turn, contribute to variations in the pharmacological effects, therapy response, and patient survival. Moreover, the results of this study indicate the genomic and clinical characteristics of IATGs in tumors, revealing the close relationship between IAV and pan-cancer, and that IAV may influence tumorigenesis and prognosis through IATGs, which, together with the immune correlation, will provide new ideas with a good reference for virotherapy and immunotherapy in tumors.
-
In conclusion, we explored the genomes of IATGs and their clinical characteristics in thirty-three forms of cancer. Our results demonstrated that SNV, CNV, and methylation of IATGs have important pan-cancer significance, including their links to various crucial cancer-related pathways. The expression of IATGs correlates with tumor prognosis, immunity, and drug resistance, revealing a picture of tumor and metapneumovirus interactions that will aid in the development of new tumor-targeted therapies, viral therapies, and immunotherapies.
-
Unless otherwise stated, all statistical analyses were performed using the GraphPad Prism (version 8.0.1) and R software (version 4.0.2).
HTML
IATGs Identification
Cell Culture and qRT-PCR
Data Set Download and Processing
Differential Expression and Prognostic Analysis
Single Nucleotide Variant Analysis
Copy Number Change Analysis
Methylation Analysis
Cell Signaling Pathway Activity Evaluation
Enrichment Analysis of IATGs in Tumors
Drug Sensitivity Analysis
Analysis between IATGs and Immunity
Differential Expression of IATGs in KIRC and Normal
Statistical Analysis
Identification of Influenza A Target Genes
Significant Differences in the Expression of IATGs between Tumor and Normal Tissues
Somatic Mutations in IATGs
Copy Number Variation of IATGs
Methylation Analysis of IATGs
Analysis of the Relationship between IATGs and Cancer Related Pathways
IATGs and Tumor Drug Resistance Analysis
Summary of Gene Set Enrichment Scores in IATGs Tumors
Relationship between IATGs and Immunization
Confirmation of the Transcript Expression of IATGs in KIRC
 23352+Supplementary Materials.pdf
|

|

 Quick Links
 DownLoad: