

 下载:
下载:

-
Antimicrobial resistance (AMR) is a fast-growing global threat. Infections associated with AMR bacteria lead to over 23,000 deaths in the United States and 25,000 deaths in Europe annually, and the number is much higher in Asian countries[1, 2]. It is estimated that up to 300 million premature deaths could occur from AMR by 2050, with 100 trillion U.S. dollars lost to the global economy, unless effective action is taken[3]. AMR is particularly severe in China, which is one of the largest producers and users of antimicrobial agents[4]. Bacterial AMR is a complicated and active process, whereby numerous AMR genes can be rapidly selected for and transmitted in clinical, veterinary, food production and transportation, and environmental settings. AMR originating from the use of antimicrobials in animals plays an important role in the development and spreading of antibiotic resistant bacteria. The AMR genes could be widely spread via transmission cycles, such as food or ecological chains, and broiler feces was considered as a good storage of AMR genes [5-7]. To investigate AMR genes in broiler fecal samples will give important information to AMR surveillance of ‘One Health’ in China.
Conventional AMR surveillance often focuses on bacterial resistant phenotypes (e.g. minimum inhibitory concentration values of antimicrobial agents), and/or the screening of a limited number of AMR genes. Such methods restrict the collection of comprehensive AMR data in a timely manner[8-11]. Therefore, a more direct, rapid and high-throughput AMR surveillance technique is essential for monitoring and controlling the increase of AMR genes. To address this issue, we developed a new high-throughput microfluidic dynamic assay and applied it to monitor AMR gene presence. Microfluidic dynamic technology has recently been introduced into biological automation applications and widely adopted due to its advantages of rapid, high-throughput screening, with high repeatability and low cross reaction [12-15]. It uses microfluidics and high-resolution imaging to perform qPCR with fluorescence detection in nanoliter reaction volumes. Here, we show that our microfluidic dynamic assay can be applied to perform screening for the detection of multiple AMR genes simultaneously. A total of 45 groups AMR genes and 2 AMR gene spread related elements were screened in the Fluidigm, selected according to previous research descriptions and frequency of antimicrobial agent usage in China. The AMR gene dissemination status in fecal samples collected from two broiler farms was analyzed and compared.
-
A total of 273 broiler fecal samples were collected from two geographically distinct farms in March 2017, with each farm containing approximately 20,000 broilers simultaneously. The farms were divided into five sampling zones (north, south, east, west, and middle). The samples were selected randomly at a ratio of 1:150 for each farm. In total, 145 and 128 broiler fecal samples were obtained from farm A and B, respectively. Samples were shipped to the laboratory at 4 ℃ within six hours. The antimicrobial agent usage was investigated by questionnaire during the sample collection period. Amoxicillin, ampicillin, ceftiofur sodium, enrofloxacin, florfenicol, gentamicin, kanamycin, tylosin, and terramycin were commonly used in both farms during broiler production.
Bacterial DNA was extracted directly from sample using Automated Nucleic Acid Extraction System-96 (BioTeke, Beijing, China). The bacterial DNA was eluted into 100 μL of TE buffer and stored at −80 ℃ for further study.
-
In this study, a total of 47 gene groups, containing 688 unique variants, were included in screening (Table 1 and Supplementary Table S1 available in www.besjournal.com). The 47 gene groups were subdivided into eight classes in this study, based on antimicrobial agent. Among these 47 gene groups, 42 could mediate resistance to a single class of antimicrobial agent, 3 could mediate multidrug resistance, and 2 were related with AMR gene transmission. All AMR gene sequences were downloaded from the GenBank database. Genbank accession numbers of reference gene sequences for each AMR gene group were list in Table 1. Due to the numerous variants existing among carbapenem-resistance, fluoroquinolone-resistance and β-lactam-resistance genes, DNAMAN version 5.0 and MEGA version 5.0 were used to analyze and classify variants. The AMR gene group classification used was neither based on the gene variant-mediated resistance phenotype nor order of discovery, but on gene sequence identity and evolutionary relationship. Therefore, the primers and probe design for each group in this study could potentially target many more AMR gene variants. Gene variants with high sequence similarity were classified together into one AMR gene group according to phylogenetic trees performed by MEGA software. The conserved sequences intergroup were identified and analyzed by DNAMAN software, and the probes/primers were assessed and chosen by Oligo version 6.0. All conserved sequences identified from carbapenem-resistance, fluoroquinolone-resistance, and β-lactam-resistance genes, as well as sequences from AMR genes without variants, were used as target sequences for primer design using Primer version 6.0. All of the primers and probes were tested by BLAST analysis. In total, 688 unique AMR gene variants could be detected. The primers and minor groove binder (MGB) probes were specifically designed for this study, except for the genes armA, mcr-1, intI1, and element ISCR1
[9, 16, 17]. Additionally, the bacterial 16S rDNA locus was used as an internal processing control. Table 1. Target AMR gene information used in this study
Antimicrobial agent No.a Gene group Numberb Accession no. of reference sequences Antimicrobial agent No. Gene group Number Accession no. of reference sequences Carbapenems 1 blaOXA-48-like 14 AY236073 other β-lactams 25 blaSHV D 2 JQ029959 2 blaIMP A 13 S71932 26 blaTEM A 157 AF093512 3 blaIMP B 5 AF290912 27 blaTEM B 4 J01749 4 blaIMP C 4 AB074436 28 blaOXA 7 JN596991 5 blaIMP D 5 AY553332 29 blaPER 6 AY740681 6 blaIMP E 9 EF118171 30 blaCARB A 22 KJ934265 7 blaIMP F 2 KF148593 31 blaCARB B 4 AF313471 8 blaNDM 15 FN396876 32 blaCARB C 3 AF030945 9 blaKPC 21 AF297554 33 blaCARB D 5 AF135373 10 blaVIM 38 JN982330 Fluoroquinolones 34 qnrA 8 GU295952 11 blaIMI 5 DQ173429 35 qnrC 1 EU917444 12 blaIND A 6 AF219131 36 qnrS 4 FJ167861 13 blaIND B 2 AF099139 Colistin 37 mcr-1 1 KP347127 14 blaIND C 2 AF219127 38 mcr-3 1 KY924928 15 blaIND D 2 GU186044 Aminoglycosides 39 armA 1 [16] Other β-lactams 16 blaGES 22 AF156486 40 aac(6′)-Ie-aph(2″)-Ia 1 HQ015159 17 blaCTX-M A 58 AF255298 Phenicols 41 fexA 1 KC222021 18 blaCTX-M B 22 AJ416344 42 fexB 1 JN201336 19 blaCTX-M C 11 FR682582 Multidrug 43 cfr 1 JF969273 20 blaCTX-M D 48 HQ833652 44 optrA 1 KP396637 21 blaCTX-M E 3 AY238472 45 aac(6′)-Ib-cr 1 GU189577 22 blaSHV A 132 AF148850 Gene spread related 46 intI1 1 [17] 23 blaSHV B 4 LN515533 47 ISCR1 1 [17] 24 blaSHV C 2 JQ341060 Internal processing control 48 16SrDNA 1 [9] Note. aThe serial number for the assay arranged on 48.48 Dynamic ArrayTM IFC. bNumber of variants including in this AMR gene group. Table S1. Target AMR gene primers and probes used in this study
No Gene group Forward primer (5′-3′) Reverse primer (5′-3′) Probe (5′-FAM-MGB-3′) 1 blaOXA-48-like GGG CGA ACC AAG CAT TTT T GCG ATC AAG CTA TTG GGA ATT T CCC GCA TCT ACC TTT 2 blaIMP A CCG(A) GGA CAC ACT CCA GAT AAC CCG TAC GGT TTA ATA AAA CAA CCA TGC CTG AAA GGA AAA T 3 blaIMP B CGC GGC TAT AAA ATA AAA GGC AG ATA GAT TGA GAA TTA AGC CAC TCT ATT CC TTC ATA GCG ACA GCA CG 4 blaIMP C TGT GGA GCG CGG CTA TAA A TGC TGT CGC TAT GGA AAT GTG TCA AAG GCA GTA TTT CC 5 blaIMP D CAG TAT TTC CAC ACA TTT CCA TGG GTG GAG GAT AGA TTG AGA ATT AAG CCA CT ACA GTA CGG CTG GAA TA 6 blaIMP E ACA TTT CCA TAG CGA CAG CAC AG CCA AAC CAC TAC GGT TAT CTT GAG TGT CCC ACG TAT GCA TCT G 7 blaIMP F GCC GGA CGG TCT TGG TTA CGG ACT TAG GCC ATG CTT CT TGG GAG ACG CAA ATC 8 blaNDM GCC CGC TCA AGG TAT TTT ACC CGA TCC CAA CGG TGA TAT TGT CCG GCC ACA CCA GT 9 blaKPC AAC CAT TCG CTA AAC TCG AAC AG AAT GAG CTG CAC AGT GGG AAG ACT TTG GCG GCT CC 10 blaVIM AAT GGT CTC ATT GTC CGT GAT G TTC GCA CCC CAC GCT GTA TGA TGA GTT GCT TTT GAT TG 11 blaIMI GGT GTC TAC GCT TTA GAC ACT GGC CTG TGT TTA GAT CTA ACT CCC AAC GA TGG TCC TGA GGG TAT G 12 blaIND A CGA CCG CCA AGA CCA ATG ATA ATT TCG GTT GAG GTT GCT TTT ACT GTT GAA AAA AGA CG 13 blaIND B TTG TTA CCC AAA AAG GAG TTG TCT T GGT ATC CAT CAG GCT TTG GTA CTG CCG TGG GAA AAG G 14 blaIND C TCT TGA AAA AAG ACG GAA AAG CA GGT ACG GTT TTC CGG TTT TGA CAT CCA CAG AAA TC 15 blaIND D GCC CAA GAC GAT GAA TAA ATT AAA A TTC ATC ATG CCC GGG AAT CCA AAT ATT CAA AAG CC 16 blaGES CAC YTC GAC CCA CAC CAT TG CGC GTC TCC CGT TTG GT AGG TGG CTG ATC GGA 17 blaCTX-M A YGR ACG TAC AGC AAA AAC CGC TCA TCW GCA CGA TAA ATT AGA GCR GCA GTC GGG AG 18 blaCTX-M B CAG TTG GTG ACG TGG CTT AAG G GCC GGT TTT ATC GCC CAC T CCG GTA GCG CGA GCA 19 blaCTX-M C TGG CTG AAA GGC AAC ACC AC GCG ATA TCA TTC GTC GTA CCA TAA CAG GGC TAC CCA CAT C 20 blaCTX-M D TAT CGC GGT GAT GAA CGC TT AAG CAG CTG CTT AAT CAG CCT G CCA ATG TGC AGT ACC AG 21 blaCTX-M E GCC GCC GAC GCT AAT ACA T TTA GGT TGA GGC TGG GTG AAG T CGA CGG CTT TCT G 22 blaSHV A TGC CTT TTT GCG CCA GAT GCC TCA TTC AGT TCC GTT TCC CAA CGT CAC CCG CCT T 23 blaSHV B GAC GGT CGG CGA ACT CTG T AGA TTG GCG GCG CTG TTA T CGC CAT TAC CAT GAG C 24 blaSHV C CCG TCG GCA AGG TGT TTT T TCC ACT ATC GCC AGC AGG AT ACC GGC GAG TAG TC 25 blaSHV D ATT GTC GCC CTG CTT GGC TTG TGG TGA TAT TAT CTG CGG GA CGA ATA ACA AAG CAG AGC G 26 blaTEM A GAT AAC ACT GCD GCC MAC TGG TAY GGC YTC AKT CAG TTC TGA CAA CGA TCG GAG GA 27 blaTEM B TCG TCG TTT GGT ATG GCT GCC AAC TTA CTT CTG ACA AC TTC AGC TCC GGT TCC CAA CG 28 blaOXA GGA ACA GCA ATC ATA CAC CAA AGA C TTG GGT TAT TTC TTG CGA AAC C TGG ATG CAA TTT TC 29 blaPER GCC GAT GAT CAG GTG CAG TA ACT TCC ATA ACA AAG CCT GCG A CAA AAC TGG ACC TCG ATG 30 blaCARB A CCT TGA TGG AAG ATA ACG CCC TA CAG AGC GGT CTG CAA TCG A CTT ACG AGT CAC GCA CAC A 31 blaCARB B CGT CTA GAC CGT ATT GAG CCT GAT TTG CCT TAG GAG TTG TCG TAT CC AAA TGA AGG TAA GCT CG 32 blaCARB C CCA GCA CGT TAA ATC AAT TAT TAT TTG CAC TGG CAA TAC TGA CCT CAA TAA AT TCC ACA TTA TCT GAA GCT AGT CA 33 blaCARB D TCG TCA ACA ACT AGA ATC TTG GCT TA GGA ACG CCT TTA CGA AAC AAT G AGG TAA TGA GGT TGG CGA T 34 qnrA TCG AGG ATT GCA GTT TCA TTG A TCC CTG AAC TCT ATG CCA AAG C CAC TTC AGC TAT GCC GAT 35 qnrC CAT TTT CTG ATG ACT TTT GGG AGC CTG CTC CAA AAG CTG CTC TTG T TGG CTT AGA ACC TCG 36 qnrS GCG GGY GCA TCA CTG AAA G ACA ACA ATA CCC ARY GCT TCG AGA CAC GCC GAA CTC G 37 mcr-1 TCG GCT TTG TGC TGA CGA T AAA TCA ACA CAG GCT TTA GCA CAT A CTG TCG TGC TCT TTG 38 mcr-3 AAT CGC GCT CGC AAT AGC TTA GGT ACT CGG TCG CAG ACG AGG GCC TGC TAG ATG 39 armA TCA AAA ACC TAT ACT TTA TCG TCG TCT T TAT TTT AGA TTT TGG TTG TGG CTT CA AAC TTC CCA ATA ATG CTA C 40 aac(6′)-Ie-aph(2″)-Ia GCTAATGCAGTTATTTTAGACCCTCATA ATA TTT CAT TGC CTT AAC ATT TGT GG CCA AGA GCA ATA AGG 41 fexA GCA AAT AAC GCC GCA GTA AGT TTA TCG GCT CAG TAG CAT CAC G ACT CGA TGC AGA CAA G 42 fexB TGA TTG AAC GCG GAG TCT GG AAA TCA CCC AAG TCA ATG ACG TCT AGT GTG GCT CTT GTC C 43 cfr AAT AAG TGC ACC TGA GAT GTA TGG AG CAT ATA ATT GAC CAC AAG CAG CG CGA AGG GCA GGT AGA 44 optrA AAG GGG ACA GAA GCT TGG AAT T TCC ACT AAA CTG AAA TGA GCCAAG TTG GTA AAT CCA CGT TGC T 45 aac(6′)-Ib-cr AGCTCTGGTTGAGTTGCTGTTC TAG GCA TCA CTG CGT GTT CG CCG AGG TCA CCA AGA T 46 intI1 GGC AAC YTT GGG CAG CA CTG AAG CCA GGG CAG ATC C TTC GGT CTC CAC GCA TCG TCA GG 47 ISCR1 TAA CCG AAG CAC CAT GTA ATT GA CCT CAG CCA TCG CAT CG TCG TCT TCG CCC TCT TCC AGT GTC A 48 16SrDNA CCT GGA CGA AGA CTG ACG CTC CTC AAG GGC ACA ACC TCC AAG CAA ACA GGA TTA GAT ACC CTG GTA GT -
A unique recombinant plasmid was constructed for each target gene. Due to high similarity of AMR gene sequences with selectable markers encoding genes on vectors, different types of vectors were chosen to avoid inaccurate results in this study. The vectors T1, pUC19, pUC57 were used to generate plasmids harboring various target-specific fragments (using either the primers described in this study or isolated DNA containing AMR genes) to measure the copy number. A total of 43 novel recombinant plasmids were generated in this study (Supplementary Table S2, available in www.besjournal.com). Standard curves were generated for each recombinant plasmid by conventional real-time PCR using a LightCycler 480II (Roche Diagnostics) [9].
Table S2. 43 novel recombinant plasmids generated in this study
No. Gene group Vector type Recombinant plasmid concentration (ng/μL) Recombinant plasmid length (nt) ×1010Copies/μL 1 blaOXA-48-like pUC19 173.3 2,750 5.57 2 blaIMP A pUC57 160.8 2,794 5.25 3 blaIMP B pUC57 49.3 2,796 1.61 4 blaIMP C pUC57 46.3 2,769 1.53 5 blaIMP D pUC57 210.2 2,782 6.89 6 blaIMP E pUC57 159.2 2,924 4.96 7 blaIMP F pUC57 115.3 2,766 3.82 8 blaNDM T1 95.0 3,892 2.23 9 blaKPC T1 183.8 3,967 4.23 10 blaVIM T1 192.8 3,890 4.52 11 blaIMI pUC19 147.7 3,074 4.47 12 blaIND A pUC19 83.8 2,753 4.63 13 blaIND B pUC19 139.7 2,766 4.44 14 blaIND C pUC19 134.7 2,752 7.80 15 blaIND D pUC19 235.2 2,762 5.81 16 blaGES pUC57 83.8 2,766 2.76 17 blaCTX-M A pUC57 93.2 2,776 3.33 18 blaCTX-M B pUC57 126.1 2,803 4.10 19 blaCTX-M C pUC57 142.9 2,823 4.62 20 blaCTX-M D T1 176.3 3,934 4.09 21 blaCTX-M E T1 188.3 3,886 4.42 22 blaSHV A T1 125.7 3,898 2.94 23 blaSHV B pUC57 370.6 2,770 12.21 24 blaSHV C T1 262.4 3,893 6.15 25 blaSHV D T1 303.1 3,889 7.11 26 blaTEM A T1 155.7 3,889 5.97 27 blaTEM B T1 70.8 3,890 5.54 28 blaOXA T1 90.6 3,899 2.12 29 blaPER pUC57 117.0 2,828 3.77 30 blaCARB A pUC57 106.9 2,841 3.43 31 blaCARB B pUC57 98.4 2,795 3.22 32 blaCARB C pUC57 62.1 2,831 2.00 33 blaCARB D pUC57 77.2 2,778 2.53 34 qnrA pUC57 38.8 2,855 1.24 35 qnrC pUC57 27.9 2,853 0.89 36 qnrS pUC57 27.0 2,907 0.85 37 mcr-1 [9] 38 mcr-3 T1 248.0 3,942 5.74 39 armA [16] 40 aac(6′)-Ie-aph(2″)-Ia pUC57 102.9 2,896 3.24 41 fexA pUC57 138.3 2,861 4.41 42 fexB pUC57 151.2 2,827 4.88 43 cfr pUC57 25.0 2,853 0.80 44 optrA pUC57 129.7 2,963 3.93 45 aac(6′)-Ib-cr pUC57 151.3 2,908 4.75 46 intI1 [17] 47 ISCR1 [17] 48 16SrDNA [9] -
An integrated fluidic circuit (IFC), commonly referred to as a ‘chip’, was used for AMR gene screening. The BioMarkTM real-time PCR system (Fluidigm, USA) was used for high-throughput microfluidic real-time PCR amplification using 48.48 Dynamic ArrayTM IFC kit (Fluidigm, USA). 2,304 (48 target genes×48 samples) individual PCR reactions were conducted simultaneously [14].
Amplification was performed using 6-carboxyfluorescein (FAM)- and MGB-labeled probes with TaqMan® Gene Expression Master Mix, in accordance with the manufacturer’s instructions (Applied Biosystems, USA). The high-throughput real time assay chip was prepared according to Fluidigm 48.48 Dynamic ArrayTM IFC kit manufacturer protocol. The assay conditions were: 2 min at 50 ℃, 1 min at 95 ℃, followed by 40 cycles of two-step amplification of 15 s at 95 ℃, 1 min at 60 ℃. Data were automatically collected using BiomarkTM HD Data Collection Software.
-
A detection limit estimation for the high-throughput BioMarkTM real time PCR was carried out using a mixture of the 47 recombinant plasmids previously generated and harbouring different AMR target genes. The mixture was 10-fold serially diluted from 106 to 100 order of magnitude of copies/μL. Three independent dilution mixtures containing the AMR genes mentioned above were loaded into the sample inlets of one chip simultaneously to estimate the sensitivity and specificity of the high-throughput BioMarkTM real-time PCR array.
-
In order to validate the detection sensitivity, capability, and specificity of the novel high-throughput real-time PCR assay, all recombinant plasmids harbouring AMR target genes were randomly combined into groups, serially diluted and then subjected to the high-throughput BioMarkTM real-time PCR assay. Briefly, plasmids were divided into 8 groups each containing 6 target genes, or 4 groups each containing 12 target genes, or 3 groups each containing 16 target genes, or 2 groups each containing 24 target genes, or 1 group containing all target genes. Starting with 108 copies/μL, each plasmid mixture underwent a 10-fold serial dilution, as described above, followed by the high-throughput BioMarkTM real-time PCR assay, run in triplicate. The formulas for sensitivity rate, specificity rate, positive predictive value, negative predictive value and correct indices were list in the notes of Table 2.
Table 2. Validation of the new high-throughput real-time PCR array for the detection of AMR target genes contained within a plasmid mixture
High-throughput assay AMR target genes contained in plasmid mixture Total Positive Negative Positive reactions 9,670a 476b 10,146 Negative reactions 68c 24,346d 24,414 Total 9,738 24,822 34,560 Note. Sensitivity rate = $\dfrac{ { {\text{a} } } }{ { {\text{a} } + {\text{c} } } } $ × 100%; specificity rate = $\dfrac{ {\text{d} } }{ { {\text{b} } + {\text{d} } } }$ × 100%; positive predictive value = $\dfrac{ {\text{a} } }{ { {\text{a} } + {\text{b} } } }$ × 100%; negative predictive value = $\dfrac{ {\text{d} } }{ { {\text{c} } + {\text{d} } } }$ × 100%; correct indices = sensitivity rate + specificity rate-1. -
45 groups AMR genes and 2 AMR gene spread related elements were detected in a total of 273 broiler fecal samples using the BioMarkTM real-time PCR system. The results were analyzed using Microsoft® Office Excel 2007 and IBM SPSS® Statistics version 19.0. The Chi-square test was used to estimate the difference in AMR gene dissemination between the two farms, and P < 0.05 was used as the cutoff for significance. The Pearson Chi-square test, correction for continuity, and Fisher’s exact test were used to test for statistical significance when n ≥ 5, 1 ≤ n < 5, and n < 1, respectively. The relative abundance values for AMR genes were calculated using the ratio of AMR gene copies and 16S rDNA copies. Software R version 3.6.1 was used to draw a heat-map of AMR gene dissemination from the two farms.
-
A total of 43 new recombinant plasmids harbouring AMR genes were constructed in this study. Conventional real-time PCR assays performed on these plasmids gave a limit of detection (LOD), quantification of detection (LOQ), and the unique linear dynamic range for each AMR gene and standard curve parameters were list in Supplementary Table S3, available in www.besjournal.com. The standard curve parameter showed good relationship between logarithmic value of recombinant plasmid diluted concentration and Ct value and excellent LOQs in linear dynamic range of all the estimated plasmids. The LODs ranged from 12.2 to 89.2 copies/reaction suggested good detectability of this study.
Table S3. Standard curves parameters for 43 AMR genes from conventional real-timePCR assays
No. Gene type group linear dynamic range r2 (%) Linear regression equation LOD (copies/reaction) 1 blaOXA-48-like 5.75×10 9−5.75×10² 0.999 y = −3.519x + 45.50 57.5 2 blaIMP A 5.25×10 9−5.25×10² 0.997 y = −3.551x + 46.85 52.5 3 blaIMP B 1.61×10 9−1.61×10² 0.993 y = −3.321x + 45.49 16.1 4 blaIMP C 1.53×10 9−1.53×101 0.998 y = −3.592x + 45.09 15.3 5 blaIMP D 6.89×10 9−6.89×101 0.999 y = −3.653x + 46.44 68.9 6 blaIMP E 4.96×10 9−4.96×101 0.998 y = −3.568x + 45.16 49.6 7 blaIMP F 3.82×10 9−3.82×10² 0.998 y = −3.506x + 44.56 38.2 8 blaNDM 2.23×10 9−2.23×101 0.995 y = −3.470x + 43.73 22.3 9 blaKPC 4.23×10 9−4.23×101 0.997 y = −3.343x + 43.77 42.3 10 blaVIM 4.52×10 9−4.52×10² 0.997 y = −3.534x + 46.05 45.2 11 blaIMI 4.47×10 9−4.47×10² 0.999 y = −3.802x + 49.85 44.7 12 blaIND A 4.44×10⁹−4.44×10³ 0.986 y = −3.520x + 51.11 44.4 13 blaIND B 4.44×10⁷−4.44×10² 0.998 y = −3.410x + 42.51 44.4 14 blaIND C 7.80×10⁹−7.80×101 0.998 y = −3.568x + 43.73 78.0 15 blaIND D 5.81 ×15.81×109−5.81×101 0.997 y = −3.469x + 44.63 58.1 16 blaGES 2.76×10⁹−2.76×101 0.999 y = −3.477x + 44.03 27.6 17 blaCTX-M A 3.33×10⁹−3.33×10³ 0.995 y = −3.753x + 42.96 33.3 18 blaCTX-M B 4.10×10⁹−4.10×10³ 0.999 y = −3.748x + 47.70 41.0 19 blaCTX-M C 4.62×10⁹−4.62×10² 0.996 y = −3.486x + 44.81 46.2 20 blaCTX-M D 4.09×10⁹−4.09×10³ 0.984 y = −3.651x + 47.14 40.9 21 blaCTX-M E 4.42×10⁹−4.42×101 0.983 y = −3.558x + 44.01 44.2 22 blaSHV A 2.94×10 7−2.94×10² 0.998 y = −3.228x + 42.61 29.4 23 blaSHV B 1.22×10⁹−1.22×10² 0.998 y = −3.081x + 46.53 12.2 24 blaSHV C 6.15×10 8−6.15×101 0.998 y = −2.971x + 38.70 61.5 25 blaSHVⅣ 7.11×10⁹−7.11×101 0.998 y = −3.457x + 46.18 71.1 26 blaTEM A 5.97×10⁸−5.97×101 0.991 y = −3.628x + 42.58 59.7 27 blaTEM B 5.45×10⁸−5.45×10² 0.995 y = −3.670x + 42.46 54.5 28 blaOXA 2.12×10 9−2.12×10² 0.991 y = −3.133x + 41.88 21.2 29 blaPER 3.77×10⁹−3.77×10² 0.998 y = −3.464x + 48.88 37.7 30 blaCARB A 3.43×10⁹−3.43×10² 0.999 y = −3.502x + 47.06 34.3 31 blaCARB B 3.22×10⁹−3.22×10² 0.999 y = −3.400x + 46.71 32.2 32 blaCARB C 2.00×10⁹−2.00×10³ 0.999 y = −3.763x + 50.30 20.0 33 blaCARB D 2.53×10⁹−2.53×10² 0.999 y = −3.494x + 46.60 25.3 34 qnrA 1.24×10⁹−1.24×101 0.995 y = −3.294x + 44.77 12.4 35 qnrC 8.92×10⁸−8.92×101 0.990 y = −3.125x + 42.66 89.2 36 qnrS 8.47×10⁹−8.47×10³ 0.998 y = −3.692x + 52.81 84.7 37 mcr-3 2.70×10⁹−2.70×10³ 0.994 y = −3.224x + 46.27 27.3 38 aac(6′)-Ie-aph(2″)-Ia 3.24×10⁹−3.24×10³ 0.980 y = −2.858x + 46.50 32.4 39 fexA 4.41×10⁸−4.41×10³ 0.999 y = −3.625x + 46.93 44.1 40 fexB 4.88×10⁹−4.88×10² 0.996 y = −3.766x + 50.58 48.8 41 cfr 8.00 ×10⁹−8.00×10³ 0.995 y = −3.560x + 48.66 80.0 42 optrA 3.93×10⁹−3.93×10² 0.998 y = −3.663x + 46.63 39.3 43 aac(6′)-Ib-cr 4.75×10⁹−4.75×10² 0.999 y = −3.499x + 45.48 47.5 -
The LODs for the high-throughput real-time PCR assays established here were verified using a 10-fold serially diluted mixture (106–100 order of magnitude copies/μL) of the 48 recombinant plasmids harbouring different AMR target genes/spread related elements/internal processing control gene. As expected, all of tested genes were successfully detected and displayed no cross-detection, even among the AMR gene groups that shared a high level of sequence similarity. The amplification signals remained specific to the target gene until at least cycle 25. The LODs ranged from 40.9 to 8,470 copies/reaction, and are shown in Table 3.
Table 3. LODs of high-throughput real-time pcr assay in this study
No. Gene group LOD (copies/reaction) No. Gene group LOD (copies/reaction) No. Gene group LOD (copies/reaction) 1 blaOXA-48-like 5,750 17 blaCTX-M E 442 33 blaCARB D 2,530 2 blaIMP A 5,250 18 blaSHV A 294 38 qnrA 124 3 blaIMP B 1,610 19 blaSHV B 1,220 39 qnrC 892 4 blaIMP C 153 20 blaSHV C 615 40 qnrS 8,470 5 blaIMP D 689 21 blaSHV D 711 13 mcr-1 100 6 blaIMP E 496 22 blaTEM A 59.7 14 mcr-3 2,730 7 blaIMP F 382 23 blaTEM B 54.5 15 armA 4,070 8 blaNDM 223 24 blaCTX-M A 3,330 16 aac(6′)-Ie-aph(2″)-Ia 3,240 9 blaKPC 423 25 blaCTX-M B 4,100 41 fexA 4,410 10 blaVIM 452 26 blaCTX-M C 4,620 42 fexB 488 11 blaIMI 4,470 27 blaCTX-M D 40.9 43 cfr 8,000 12 blaIND A 4,440 28 blaOXA 2,120 44 optrA 393 13 blaIND B 4,440 29 blaPER 3,770 45 aac(6′)-Ib-cr 475 14 blaIND C 780 30 blaCARB A 3,430 46 intI1 589 15 blaIND D 581 31 blaCARB B 322 47 ISCR1 413 16 blaGES 276 32 blaCARB C 2,000 48 16SrDNA 321 -
A total of 34,560 microfluidic reactions were performed in this study to evaluate the sensitivity, specificity, and detection capability of the new array. A comparison between the novel high-throughput real-time PCR array results and the cloned target AMR genes contained in the plasmid mixtures is given in Table 2. The sensitivity rate, specificity rate, positive predictive value, negative predictive value and correct indices were 99.30%, 98.08%, 95.31%, 99.79%, and 0.9755, respectively.
-
Among 273 broiler fecal samples, the AMR gene positive detection rate ranged from 0 to 97.07% (Table 4). Eight groups of the AMR gene positive detection rates were over 80%, while 28 of them were below 5%. Genes blaIMP F, blaIMI, and qnrC were not identified in any fecal sample tested. The most common AMR genes related with carbapenem-resistance, alternative β-lactam-resistance, fluoroquinolone-resistance, colistin-resistance, aminoglycoside-resistance, phenicol and oxazolidinone-resistance, multidrug resistance, and AMR gene spread were blaNDM, blaTEM B, and blaCTX-M E, qnrS, mcr-1, aac(6′)-
Ie-aph(2′′)-Ia, fexA, optrA, and intI1, respectively. Table 4. AMR genes dissemination and statistical differences between two broiler farms
Antimicrobial agent No. Gene group Frequency of AMR gene (%) Statistical analysis Total (%) Farm A (%) Farm B (%) χ2 value P value Carbapenems 1 blaOXA-48-like 1 (0.37) 1 (0.37) 0 (0) 0.000 1.000 2 blaIMP A 7 (2.56) 3 (1.10) 4 (1.47) 0.000 1.000 3 blaIMP B 7 (2.56) 0 (0) 7 (2.56) 5.210 0.015 4 blaIMP C 1 (0.37) 0 (0) 1 (0.37) 0.000 1.000 5 blaIMP D 2 (0.73) 2 (0.73) 0 (0) 0.502 0.499 6 blaIMP E 3 (0.73) 1 (0.37) 2 (0.73) 0.000 1.000 7 blaIMP F 0 (0) 0 (0) 0 (0) − − 8 blaNDM 14 (5.13) 5 (1.83) 9 (3.30) 1.173 0.418 9 blaKPC 2 (0.73) 2 (0.73) 0 (0) 0.502 0.499 10 blaVIM 7 (2.56) 2 (0.73) 5 (1.83) 0.579 0.447 11 blaIMI 0 (0) 0 (0) 0 (0) − − 12 blaIND A 1 (0.37) 1 (0.37) 0 (0) 0.000 1.000 13 blaIND B 2 (0.73) 2 (0.73) 0 (0) 0.502 0.499 14 blaIND C 2 (0.73) 2 (0.73) 0 (0) 0.502 0.499 25 blaIND D 1 (0.37) 1 (0.37) 0 (0) 0.000 1.000 Other β-lactams 16 blaGES 8 (2.93) 0 (0) 8 (2.93) 6.216 0.007 17 blaCTX-M A 254 (93.04) 143 (52.38) 111 (40.66) 7.538 0.006 18 blaCTX-M B 6 (2.20) 5 (1.83) 1 (0.37) 1.517 0.218 19 blaCTX-M C 1 (0.37) 1 (0.37) 0 (0) 0.000 1.000 20 blaCTX-M D 205 (75.10) 135 (49.45) 70 (25.64) 33.000 0.000 21 blaCTX-M E 260 (95.24) 144 (52.75) 116 (42.49) 5.757 0.016 22 blaSHV A 17 (6.23) 9 (3.30) 8 (2.93) 0.061 1.000 23 blaSHV B 12 (4.40) 8 (2.93) 4 (1.47) 0.767 0.381 24 blaSHV C 7 (2.56) 4 (1.47) 3 (1.10) 0.000 1.000 25 blaSHV D 8 (2.93) 6 (2.20) 2 (0.73) 1.142 0.285 26 blaTEM A 230 (84.25) 142 (52.01) 88 (32.23) 21.906 0.000 27 blaTEM B 260 (95.24) 145 (53.11) 115 (42.12) 6.608 0.013 28 blaOXA 140 (51.28) 108 (39.56) 32 (11.72) 55.484 0.000 29 blaPER 12 (4.03) 4 (1.47) 8 (2.93) 0.767 0.381 30 blaCARB A 1 (0.37) 1 (0.37) 0 (0) 0.000 1.000 31 blaCARB B 23 (8.42) 12 (4.40) 11 (4.03) 0.045 1.000 32 blaCARB C 2 (0.73) 2 (0.73) 0 (0) 0.502 0.499 33 blaCARB D 65 (23.81) 51 (18.68) 14 (5.13) 23.908 0.000 Fluoroquinolones 34 qnrA 5 (1.83) 0 (0) 5 (1.83) 3.230 0.061 35 qnrC 0 (0) 0 (0) 0 (0) − − 36 qnrS 113 (41.39) 94 (34.43) 19 (6.96) 62.770 0.000 Colistin 37 mcr-1 217 (79.49) 105 (38.46) 112 (41.03) 0.375 0.540 38 mcr-3 10 (3.66) 6 (2.20) 4 (1.47) 0.102 0.750 Aminoglycosides 39 armA 11 (4.03) 2 (0.73) 9 (3.30) 3.340 0.068 40 aac(6′)-Ie-aph(2″)-Ia 257 (94.14) 136 (49.81) 121 (44.32) 1.654 0.198 Phenicols 41 fexA 256 (93.77) 140 (51.28) 116 (42.49) 4.774 0.029 42 fexB 4 (1.47) 3 (1.10) 1 (0.37) 0.252 0.616 Multidrug 43 cfr 134 (49.08) 123 (45.05) 11 (4.03) 124.059 0.000 44 optrA 223 (81.68) 128 (46.89) 95 (34.80) 8.255 0.004 45 aac(6′)-Ib-cr 199 (72.89) 135 (49.45) 64 (23.44) 55.956 0.000 Gene spread related 46 intI1 265 (97.07) 145 (53.11) 120 (43.96) 4.583 0.040 47 ISCR1 128 (46.89) 96 (35.16) 32 (11.72) 41.799 0.000 The AMR gene positive detection rates are shown in detail in Table 4. AMR genes were found to be widely disseminated and commonly co-existed in fecal samples using the high-throughput real-time PCR array. Except for 4 fecal samples in which no AMR genes were detected, 24 groups of distinct AMR genes were identified in 2 fecal samples (0.73%), 23 groups in 1 sample (0.37%), 21 groups in 1 (0.37%), 20 groups in 1 (0.37%), 19 groups in 6 (2.20%), 18 groups in 3 (1.10%), 17 groups in 10 (3.66%), 16 groups in 28 (10.26%), 15 groups in 25 (9.16%), 14 groups in 31 (11.36%), 13 groups in 33 (12.09%), 12 groups in 31 (11.36%), 11 groups in 30 (10.99%), 10 groups in 18 (6.59%), 9 groups in 20 (7.33%), 8 groups in 12 (4.40%), 7 groups in 4 (1.47%), 6 groups in 5 (1.83%), 5 groups in 4 (1.47%), 4 groups in 3 (1.10%) and 1 groups in 1 (0.73%).
-
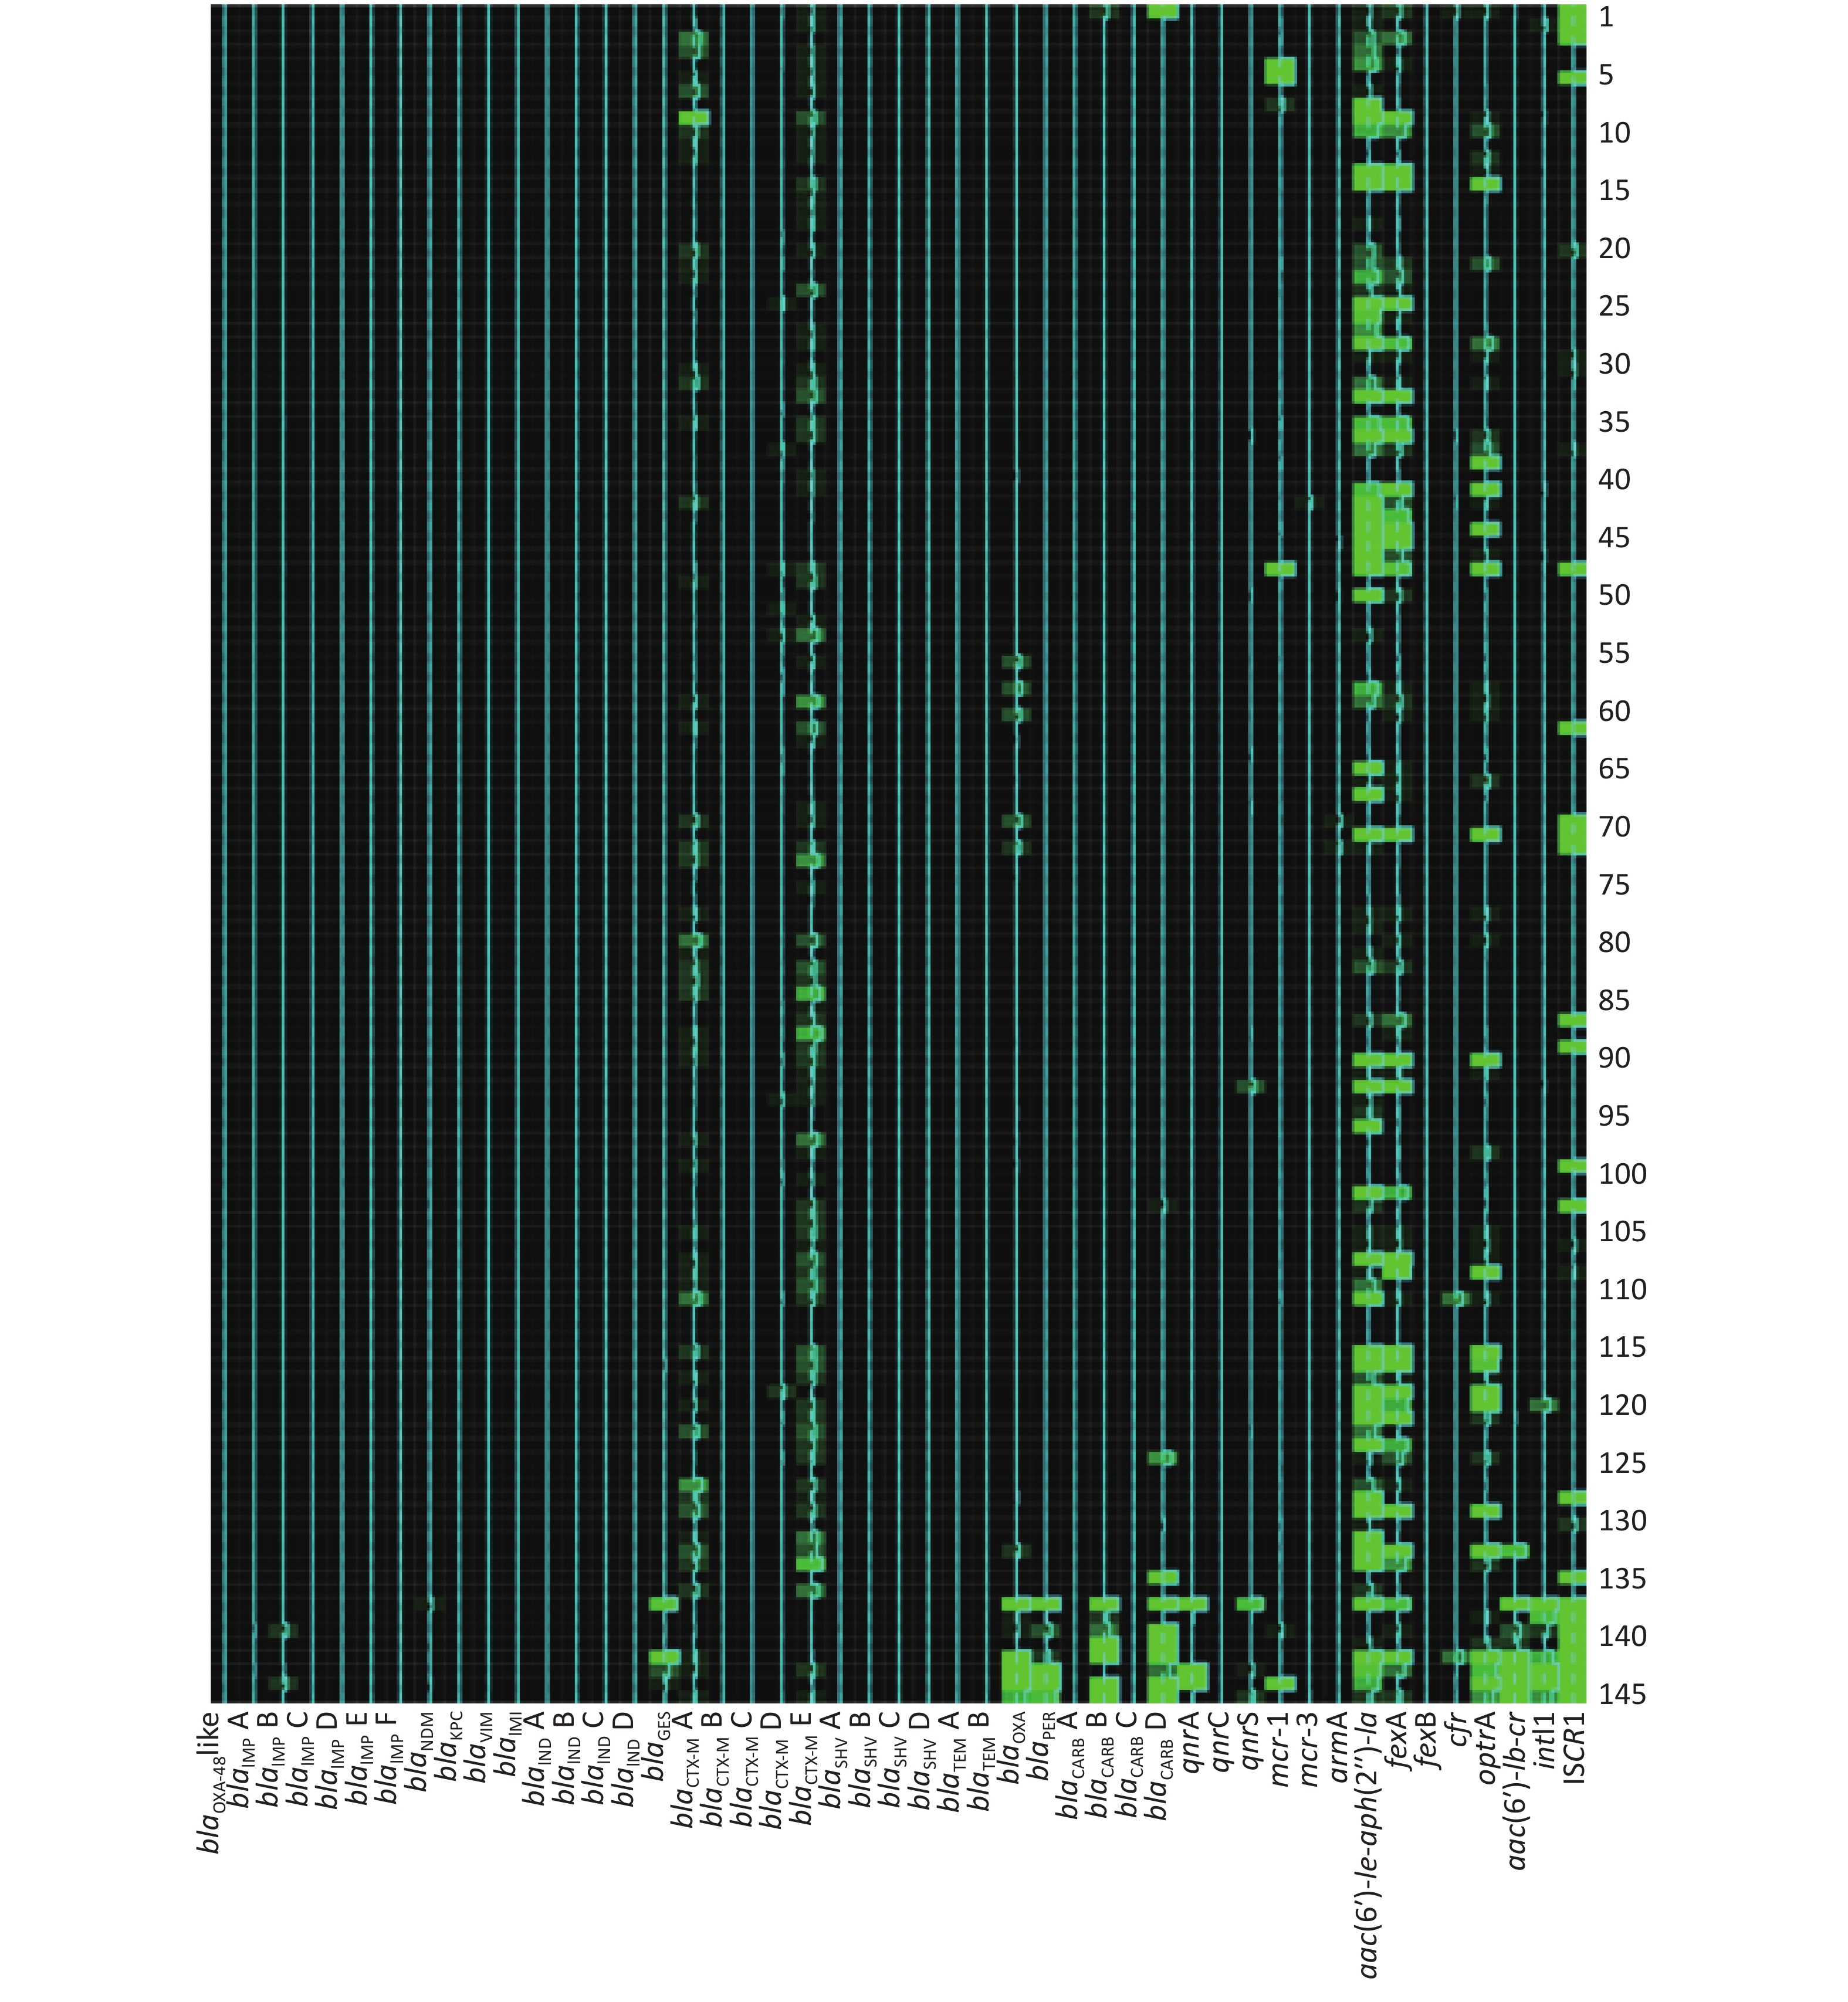
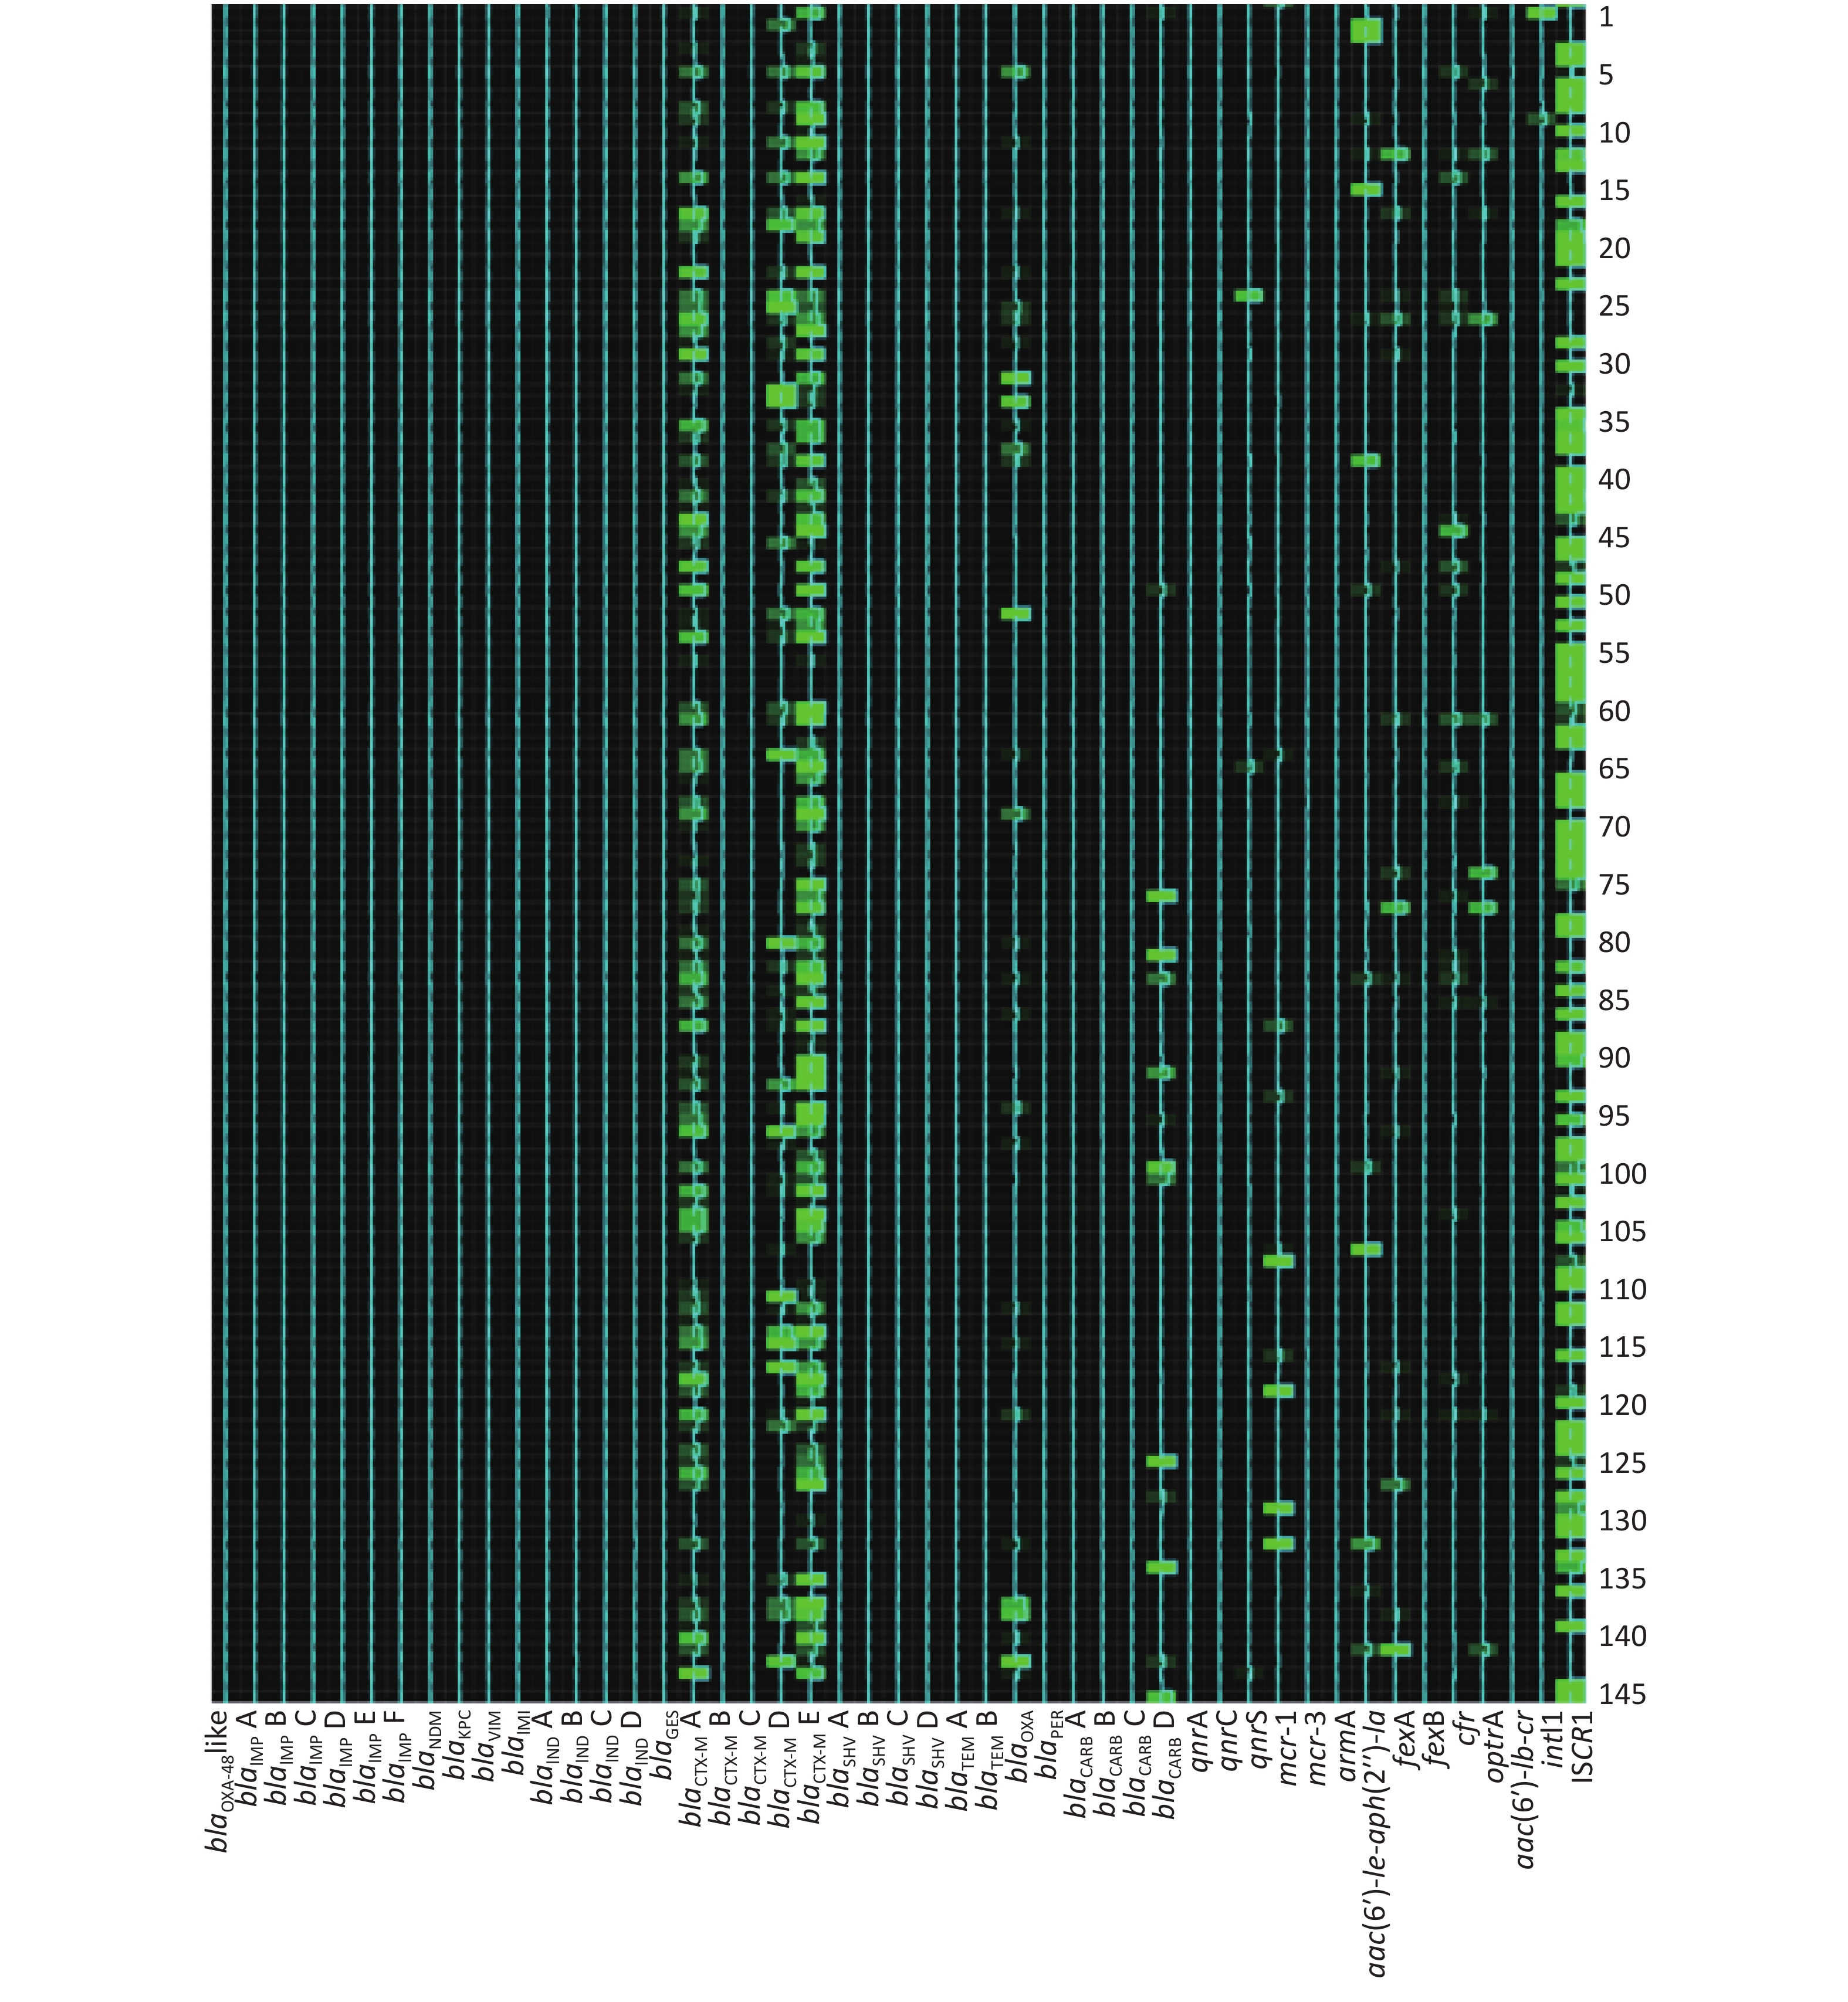
The frequencies (n) of AMR gene dissemination are shown in Table 4, Figures 1−2. The AMR gene groups blaIMP B, blaGES, blaCTX-M A, blaCTX-M D, blaCTX-M E, blaTEM A, blaTEM B, blaOXA, blaCARB D, qnrS, fexA, cfr, optrA, aac(6′)-
Ib-cr, intI1, and ISCR1 showed statistically significant differences (P < 0.05) in dissemination between the two broiler farms, while all other AMR gene groups showed no statistically significant differences in dissemination. Compared with farm B, farm A exhibited a significantly higher prevalence of 14 AMR gene groups. In contrast, farm B only exhibited a significantly higher prevalence of the AMR gene groups blaIMP B and blaGES than farm A. Heat-map analysis showed that the majority of broiler fecal samples exhibited low relative abundance values for AMR genes, except for ISCR1 in farm A, and aac(6′)- Ie-aph(2′′)-Ia and fexA in farm B. Farm A had a greater number of fecal samples that contained multiple AMR genes compared to farm B. 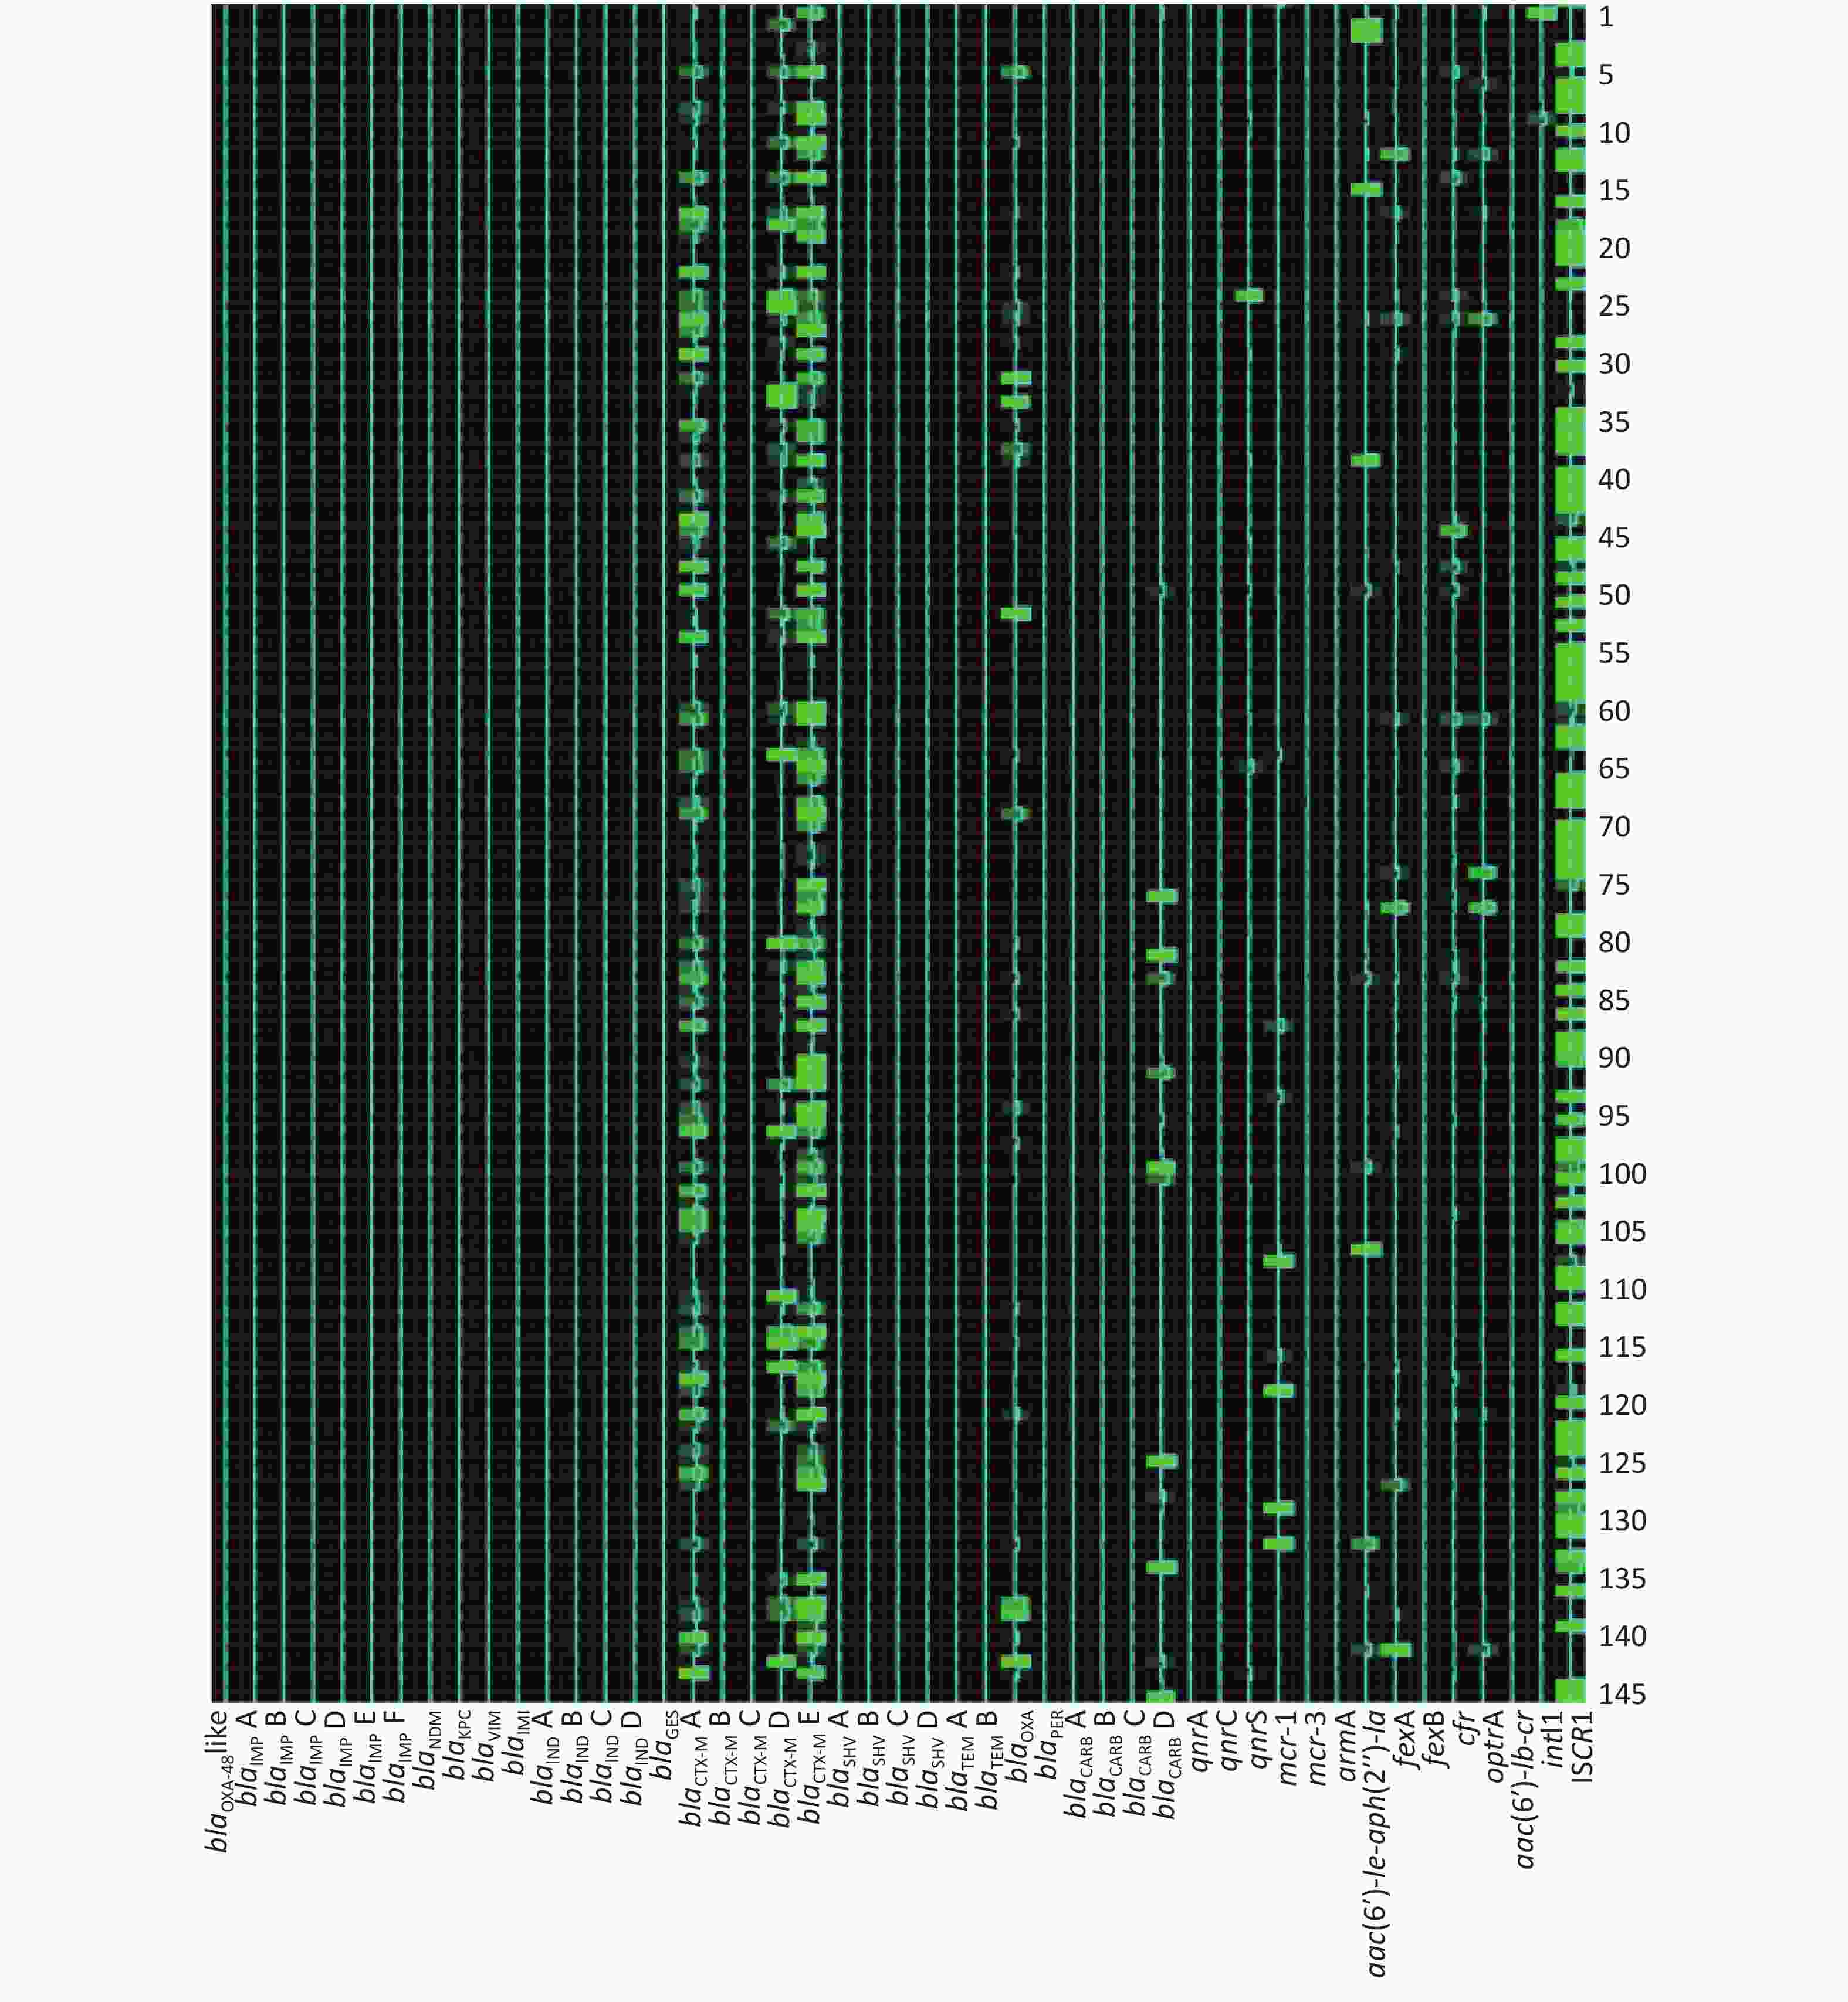
Figure 1. Heat-map of AMR gene dissemination of 145 broiler fecal samples obtained from farm A. Black block: AMR gene negative; Green block: AMR gene positive, the deeper of the green color, the higher of the gene relative abundance.
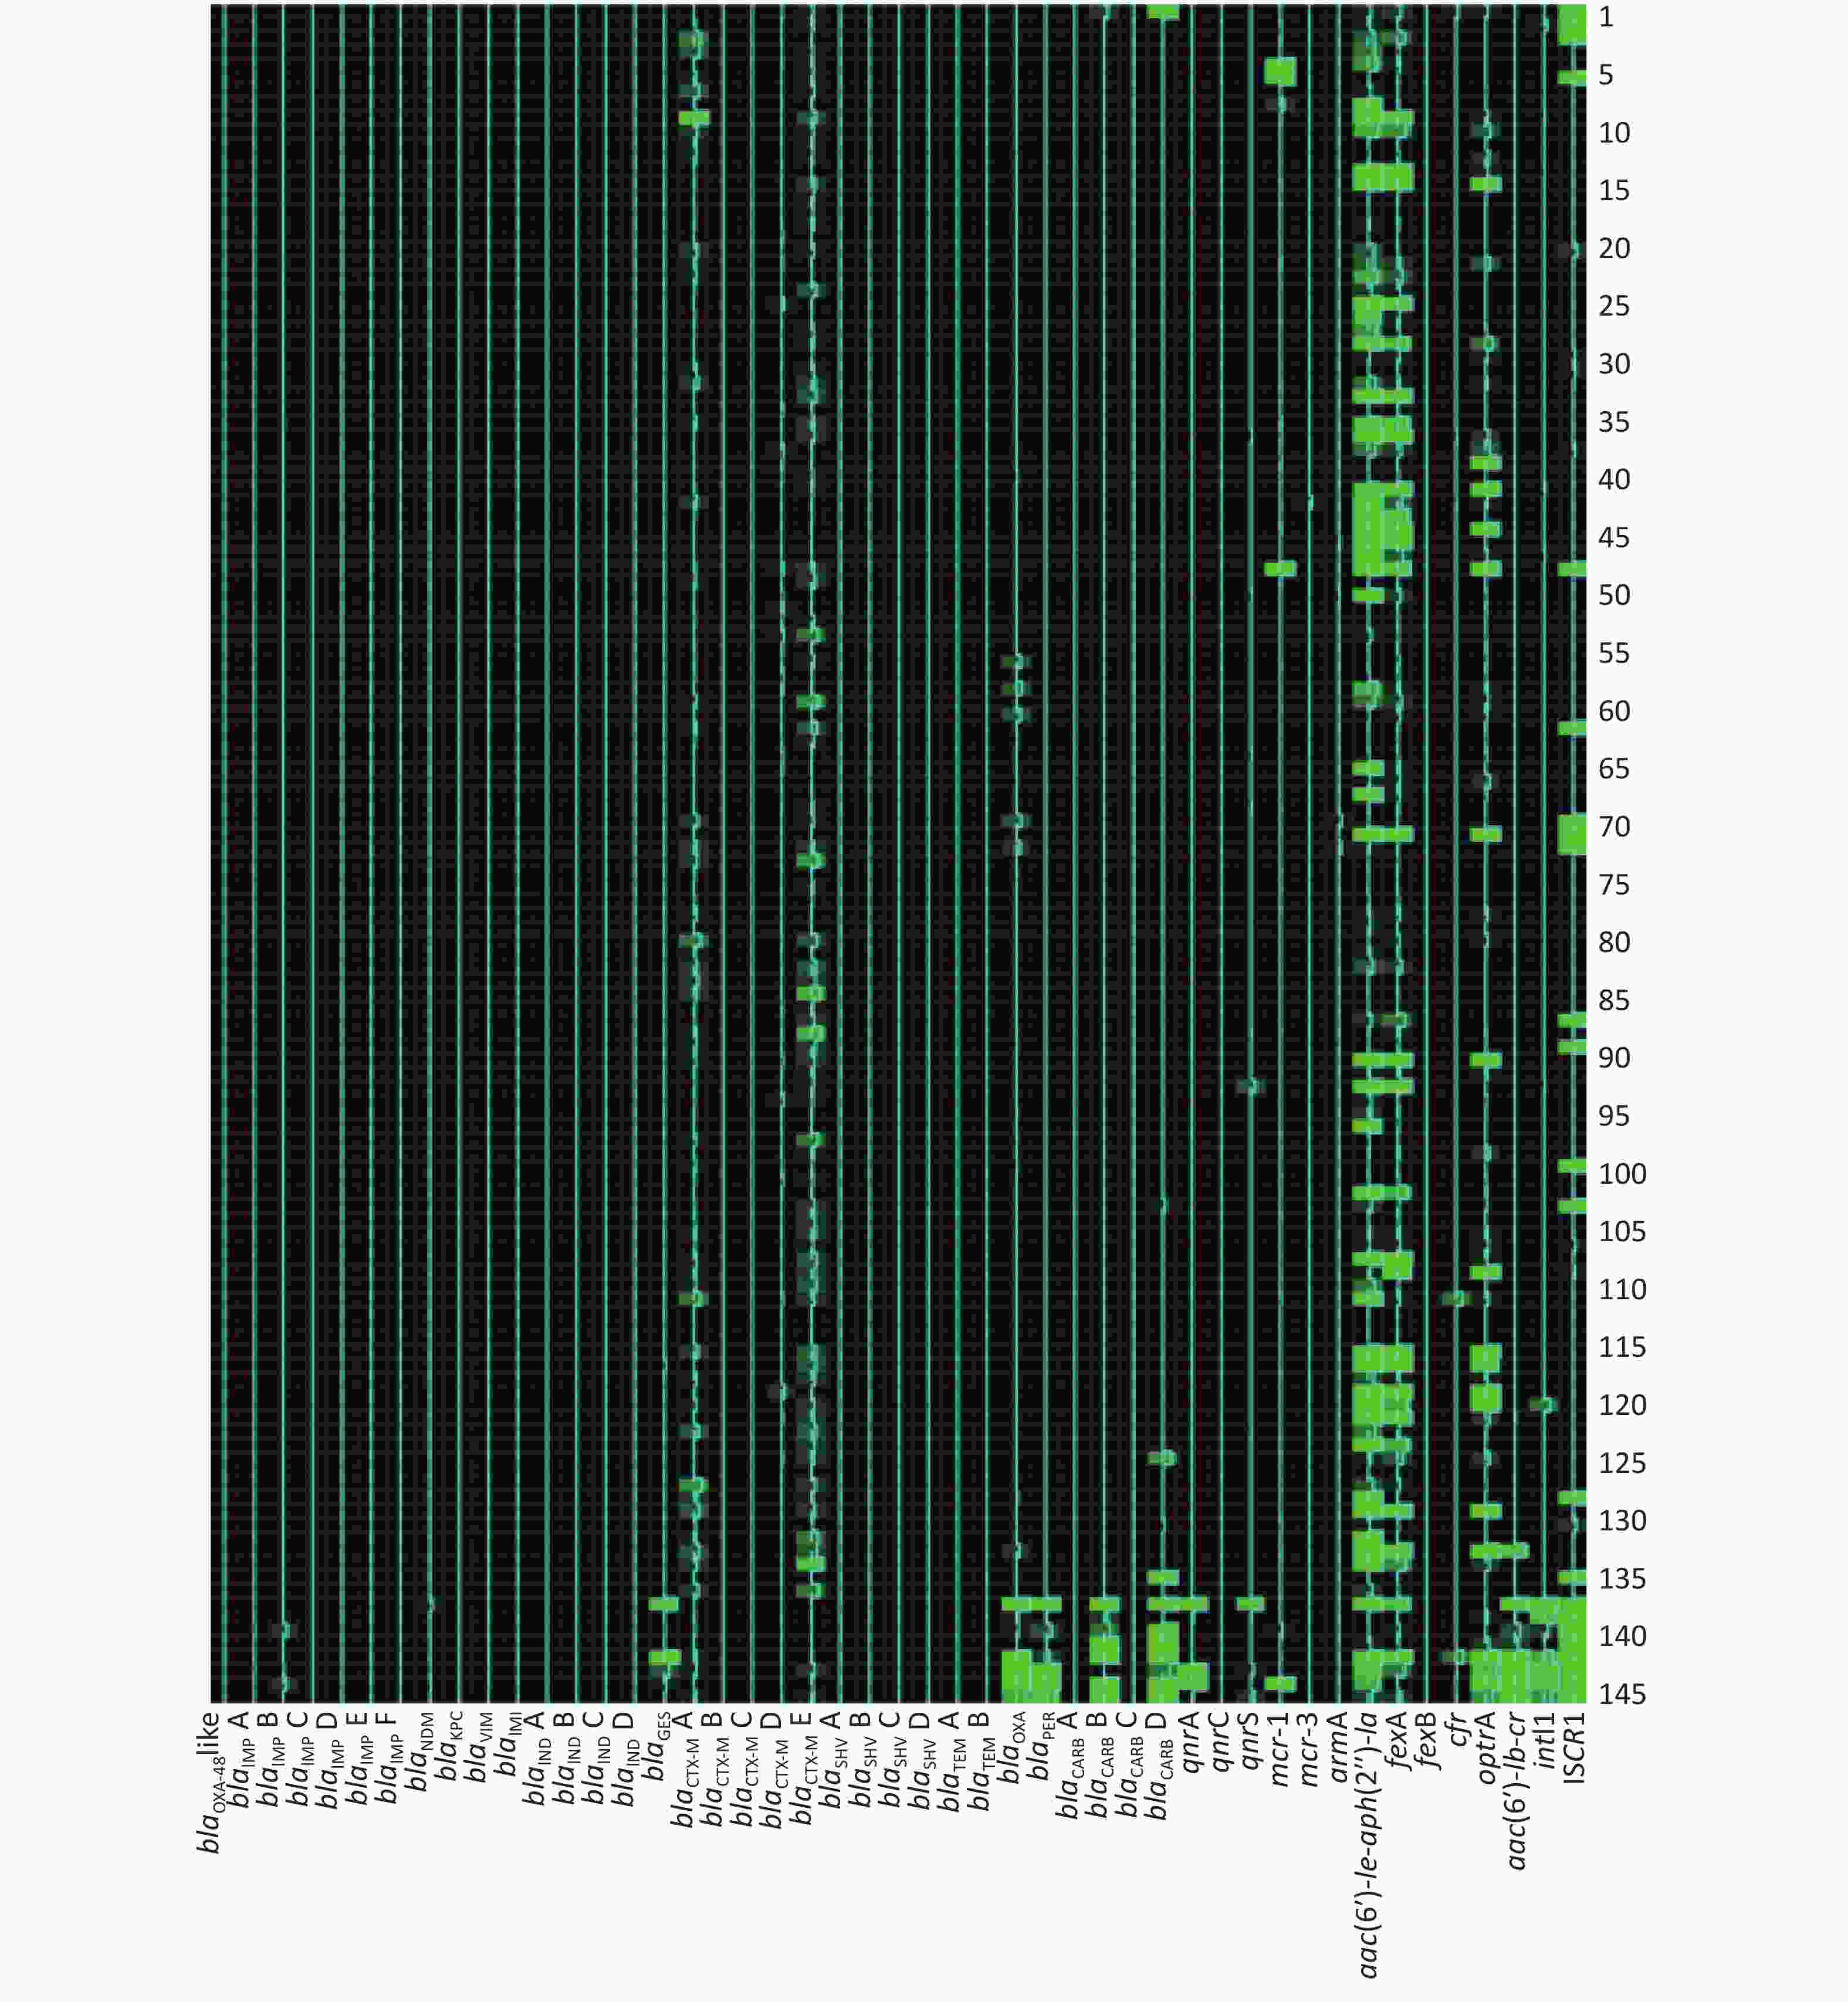
Figure 2. Heat-map of AMR gene dissemination of 128 broiler fecal samples obtained from farm B. Black block: AMR gene negative; Green block: AMR gene positive, the deeper of the green color, the higher of the gene relative abundance.
-
AMR genes play a pivotal role in the occurrence, development and dissemination of antibiotic resistance worldwide, accelerating the progression of bacteria from being multi-drug resistant, to extensively-drug resistant to pan-drug resistant [18]. The AMR genes could be widely disseminated via transmission cycles, such as food or ecological chains, and animal is often considered as potential origin of AMR genes spread. Due to the numerous AMR genes already described, a rapid, convenient, accurate, and high-throughput screening method is urgently needed for AMR surveillance. Conventional PCR and real-time PCR methods have been widely applied to AMR gene detection for a decade, but high-throughput arrays have not. Here, we introduced a new high-throughput real-time PCR array based on integrated fluidic circuit, which could simultaneously analyze and detect 45 groups AMR genes and 2 AMR gene spread related elements. Compared with conventional PCR and real-time PCR assays, the new array exhibited higher fluxes and avoided cross-reaction in the detection of multiple AMR genes. Through one high-throughput real-time array, we could obtain a large amount of information on the presence and prevalence of AMR genes including specific AMR gene variants.
The new high-throughput real-time PCR array was based on conventional real-time PCR. The recombinant plasmid standard curves of 43 AMR genes (others were constructed in a previous study) established by conventional real-time PCR displayed good linear relationship, sensitivity, and specificity. Compared with the low LODs of conventional real-time PCR, high-throughput real-time PCR showed a wide range of LODs. This phenomenon could be due to the requirement of restricting the annealing temperature of the high-throughput real-time PCR reaction to one value.
As such, the amplification efficiency may be reduced in certain AMR gene PCR reactions. Previous research suggests that 14 cycles of specific target amplification before initiating the microfluidic reaction could increase the target DNA by 210 to 214 times without bias [19]. Such an additional reaction could easily be introduced into the current AMR gene screening using high-throughput real-time PCR array.
The validation of the high-throughput real-time PCR array results showed that the primers and probes designed here were highly specific (specificity rate 98.09%) to target genes. The high positive predictive value, negative predictive value, and correct indices value indicated that the new high-throughput real-time PCR array was credible and valuable in the detection of multiple AMR genes, even when up to 45 groups AMR genes and 2 AMR gene spread related elements were simultaneously present in one recombinant plasmid mixture. The results of this study suggested that the high-throughput real-time PCR array was exactly stabled and sensitive. The novel designed assay could be widely used in large scale screening of AMR gene, and more AMR target genes could be involved in the ‘chip’ assay design in further.
The novel high-throughput method established in this study was applied to detect the AMR genes disseminated in 273 broiler fecal samples. A total of 45 groups AMR genes and 2 AMR gene spread related elements could be detected in 47 fecal samples simultaneously using the array, along with one internal processing control for the detection arrays and one negative control in the sample arrays. Compared with conventional culturing and antimicrobial susceptibility tests, the novel array was successfully used on broiler fecal samples to obtain greater detail on the presence and prevalence of AMR genes, saving both time and reagents. The AMR gene dissemination patterns identified in this study indicated that a wide range of antimicrobial resistance existed among the 273 broiler fecal samples. All eight groups of AMR genes were detected, some with high prevalence. Gene intI1 is commonly involved in the of many AMR genes transmission, and is closely associated with multidrug resistance [20-22]. Our results showed a high positive detection rate for intI1 indicating that the potential for multiple AMR genes movement and widespread in the two broiler farms studied. The β-lactam-resistance genes blaCTX-M A, blaCTX-M B, blaCTX-M E, blaTEM A, and blaTEM B also showed high prevalence in this study, which suggested that bacteria in the collected samples may show common resistance to cephalosporins including the third generation cephalosporins as previously described [7, 9, 23, 24]. Although many AMR genes showed low relative abundance values, antimicrobial agent usage strictly controlling, reduce additives usage of antimicrobial agent rotational and mixed application, and non-pharmaceutical therapy should be performed to enhance broiler growth and reduce feed cost in broiler production in the farm. In this study, the patterns of AMR gene dissemination between the two broiler farms were distinct. Many researchers have found that these AMR genes are widely spread in livestock and poultry husbandry [4, 6, 20, 24]. Our questionnaire showed that many kinds of antimicrobial agents were commonly used during broiler production. It suggested that the drugs may give selection pressure for AMR genes and multidrug resistance widely dissemination. A greater amount of information on AMR gene presence and prevalence could be collected through expansion of both the types of genes and numbers of primers used in AMR surveillance in further.
The prevalence of the carbapenem-resistance gene group was the lowest among the eight AMR gene groups, with blaNDM showing the highest positive detection rate in the group (Table 4, 5.13%, assay 1 to assay 12). Although the use of carbapenems is forbidden in livestock and poultry husbandry, carbapenem-resistance AMR genes are being increasingly identified [25-27]. It has been suggested that plasmid-mediated AMR gene transfer might play an important role in the spread of bacterial resistance even with a lack of antimicrobial agent selective pressure. The mcr genes have been found giving a big contribution to high levels of colistin resistance [4, 9, 18, 25, 26]. Colistin was a common and legal antimicrobial agent used in livestock/poultry husbandry in China until April, 2017. The wide spread of mcr-1 in broiler farms indicates that colistin perhaps cannot be used effectively in disease prevention and control under these conditions.
ISCR1 is recognized as a powerful AMR gene capture and movement system element, and can widely transmit AMR genes among different species of bacteria [28, 29]. The existence of the intI1- ISCR1 complex structure is responsible for both multidrug resistance and extensive resistance [30-32]. Our finding of over 95% prevalence for intI1 and nearly 50% prevalence for ISCR1 are suggestive of a large number of multidrug resistant and extensively resistant bacteria in broiler farms, which could seriously reduce the effectiveness of antimicrobial agents.
In this study, two farms underwent AMR gene screening. The results showed statistically significant differences in the dissemination and prevalence of 16 AMR gene groups between these two farms. These differences indicated that the predominant AMR gene types varied between the two geographically distinct farms. This observation is consistent with previous research [9, 33]. Heat-map analysis further highlighted the different relative abundance levels in AMR genes between farm A and farm B. There were higher relative abundance values for AMR genes in fecal samples from farm B, suggesting higher copy numbers for these AMR genes, which could contribute to a higher level of AMR and severe multidrug resistance. Compared with farm B, the AMR gene prevalence rates were more seriously in farm A, especially gene spread related element intI1 and ISCR1
. This observation indicated that more strictly antimicrobial agent usage controlling should be given, and antimicrobial agent rotational and mixed application strategy should be considered urgently in farm A. From Heat-map analysis, the high relative abundance values of aac(6′)- Ie-aph(2′′)-Ia and fexA in farm B indicated that aminoglycosides and phenicols agents should be used cautiously in further. -
In conclusion, we have established a new, reliable, convenient, rapid and high-throughput real-time PCR assay for the screening and identification of AMR genes in broiler fecal samples. Our method can provide a great amount of data on the presence and abundance of 47 groups of distinct AMR genes/AMR gene spread related elements, including 688 variants, from a total of 47 different samples directly and simultaneously. The new assay was successfully applied to AMR gene screening in 273 broiler fecal samples from two farms. Both qualitative and quantitative information obtained from this novel assay highlighted the high prevalence of AMR gene existence in broiler farms, with different AMR gene groups predominating between the two farms. To our best knowledge, this is the first report of the simultaneous screening of up to 47 groups of AMR genes/AMR gene spread related elements directly from broiler fecal samples using a high-throughput microfluidic dynamic real-time assay. This novel assay could be popularized and applied to AMR surveillance in situations other than livestock and poultry husbandry in the near future.
-
The ethics approval and consent of participate isnot applicable.
doi: 10.3967/bes2019.111
A New High-throughput Real-time PCR Assay for the Screening of Multiple Antimicrobial Resistance Genes in Broiler Fecal Samples from China
-
Abstract:
Objective Antimicrobial resistance (AMR) has become a global concern and is especially severe in China. To effectively and reliably provide AMR data, we developed a new high-throughput real-time PCR assay based on microfluidic dynamic technology, and screened multiple AMR genes in broiler fecal samples. Methods A high-throughput real-time PCR system with an new designed integrated fluidic circuit assay were performed AMR gene detection. A total of 273 broiler fecal samples collected from two geographically separated farms were screened AMR genes. Results The new assay with limits of detection ranging from 40.9 to 8,000 copies/reaction. The sensitivity rate, specificity rate, positive predictive value, negative predictive value and correct indices were 99.30%, 98.08%, 95.31%, 99.79%, and 0.9755, respectively. Utilizing this assay, we demonstrate that AMR genes are widely spread, with positive detection rates ranging from 0 to 97.07% in 273 broiler fecal samples. blaCTX-M, blaTEM, mcr-1, fexA, cfr, optrA, and intI1 showed over 80% prevalence. The dissemination of AMR genes was distinct between the two farms. Conclusions We successfully established a new high-throughput real-time PCR assay applicable to AMR gene surveillance from fecal samples. The widespread existence of AMR genes detected in broiler farms highlights the current and severe problem of AMR. -
Figure 1. Heat-map of AMR gene dissemination of 145 broiler fecal samples obtained from farm A. Black block: AMR gene negative; Green block: AMR gene positive, the deeper of the green color, the higher of the gene relative abundance.
Figure 2. Heat-map of AMR gene dissemination of 128 broiler fecal samples obtained from farm B. Black block: AMR gene negative; Green block: AMR gene positive, the deeper of the green color, the higher of the gene relative abundance.
Table 1. Target AMR gene information used in this study
Antimicrobial agent No.a Gene group Numberb Accession no. of reference sequences Antimicrobial agent No. Gene group Number Accession no. of reference sequences Carbapenems 1 blaOXA-48-like 14 AY236073 other β-lactams 25 blaSHV D 2 JQ029959 2 blaIMP A 13 S71932 26 blaTEM A 157 AF093512 3 blaIMP B 5 AF290912 27 blaTEM B 4 J01749 4 blaIMP C 4 AB074436 28 blaOXA 7 JN596991 5 blaIMP D 5 AY553332 29 blaPER 6 AY740681 6 blaIMP E 9 EF118171 30 blaCARB A 22 KJ934265 7 blaIMP F 2 KF148593 31 blaCARB B 4 AF313471 8 blaNDM 15 FN396876 32 blaCARB C 3 AF030945 9 blaKPC 21 AF297554 33 blaCARB D 5 AF135373 10 blaVIM 38 JN982330 Fluoroquinolones 34 qnrA 8 GU295952 11 blaIMI 5 DQ173429 35 qnrC 1 EU917444 12 blaIND A 6 AF219131 36 qnrS 4 FJ167861 13 blaIND B 2 AF099139 Colistin 37 mcr-1 1 KP347127 14 blaIND C 2 AF219127 38 mcr-3 1 KY924928 15 blaIND D 2 GU186044 Aminoglycosides 39 armA 1 [16] Other β-lactams 16 blaGES 22 AF156486 40 aac(6′)-Ie-aph(2″)-Ia 1 HQ015159 17 blaCTX-M A 58 AF255298 Phenicols 41 fexA 1 KC222021 18 blaCTX-M B 22 AJ416344 42 fexB 1 JN201336 19 blaCTX-M C 11 FR682582 Multidrug 43 cfr 1 JF969273 20 blaCTX-M D 48 HQ833652 44 optrA 1 KP396637 21 blaCTX-M E 3 AY238472 45 aac(6′)-Ib-cr 1 GU189577 22 blaSHV A 132 AF148850 Gene spread related 46 intI1 1 [17] 23 blaSHV B 4 LN515533 47 ISCR1 1 [17] 24 blaSHV C 2 JQ341060 Internal processing control 48 16SrDNA 1 [9] Note. aThe serial number for the assay arranged on 48.48 Dynamic ArrayTM IFC. bNumber of variants including in this AMR gene group.  下载: 导出CSV
S1. Target AMR gene primers and probes used in this study
No Gene group Forward primer (5′-3′) Reverse primer (5′-3′) Probe (5′-FAM-MGB-3′) 1 blaOXA-48-like GGG CGA ACC AAG CAT TTT T GCG ATC AAG CTA TTG GGA ATT T CCC GCA TCT ACC TTT 2 blaIMP A CCG(A) GGA CAC ACT CCA GAT AAC CCG TAC GGT TTA ATA AAA CAA CCA TGC CTG AAA GGA AAA T 3 blaIMP B CGC GGC TAT AAA ATA AAA GGC AG ATA GAT TGA GAA TTA AGC CAC TCT ATT CC TTC ATA GCG ACA GCA CG 4 blaIMP C TGT GGA GCG CGG CTA TAA A TGC TGT CGC TAT GGA AAT GTG TCA AAG GCA GTA TTT CC 5 blaIMP D CAG TAT TTC CAC ACA TTT CCA TGG GTG GAG GAT AGA TTG AGA ATT AAG CCA CT ACA GTA CGG CTG GAA TA 6 blaIMP E ACA TTT CCA TAG CGA CAG CAC AG CCA AAC CAC TAC GGT TAT CTT GAG TGT CCC ACG TAT GCA TCT G 7 blaIMP F GCC GGA CGG TCT TGG TTA CGG ACT TAG GCC ATG CTT CT TGG GAG ACG CAA ATC 8 blaNDM GCC CGC TCA AGG TAT TTT ACC CGA TCC CAA CGG TGA TAT TGT CCG GCC ACA CCA GT 9 blaKPC AAC CAT TCG CTA AAC TCG AAC AG AAT GAG CTG CAC AGT GGG AAG ACT TTG GCG GCT CC 10 blaVIM AAT GGT CTC ATT GTC CGT GAT G TTC GCA CCC CAC GCT GTA TGA TGA GTT GCT TTT GAT TG 11 blaIMI GGT GTC TAC GCT TTA GAC ACT GGC CTG TGT TTA GAT CTA ACT CCC AAC GA TGG TCC TGA GGG TAT G 12 blaIND A CGA CCG CCA AGA CCA ATG ATA ATT TCG GTT GAG GTT GCT TTT ACT GTT GAA AAA AGA CG 13 blaIND B TTG TTA CCC AAA AAG GAG TTG TCT T GGT ATC CAT CAG GCT TTG GTA CTG CCG TGG GAA AAG G 14 blaIND C TCT TGA AAA AAG ACG GAA AAG CA GGT ACG GTT TTC CGG TTT TGA CAT CCA CAG AAA TC 15 blaIND D GCC CAA GAC GAT GAA TAA ATT AAA A TTC ATC ATG CCC GGG AAT CCA AAT ATT CAA AAG CC 16 blaGES CAC YTC GAC CCA CAC CAT TG CGC GTC TCC CGT TTG GT AGG TGG CTG ATC GGA 17 blaCTX-M A YGR ACG TAC AGC AAA AAC CGC TCA TCW GCA CGA TAA ATT AGA GCR GCA GTC GGG AG 18 blaCTX-M B CAG TTG GTG ACG TGG CTT AAG G GCC GGT TTT ATC GCC CAC T CCG GTA GCG CGA GCA 19 blaCTX-M C TGG CTG AAA GGC AAC ACC AC GCG ATA TCA TTC GTC GTA CCA TAA CAG GGC TAC CCA CAT C 20 blaCTX-M D TAT CGC GGT GAT GAA CGC TT AAG CAG CTG CTT AAT CAG CCT G CCA ATG TGC AGT ACC AG 21 blaCTX-M E GCC GCC GAC GCT AAT ACA T TTA GGT TGA GGC TGG GTG AAG T CGA CGG CTT TCT G 22 blaSHV A TGC CTT TTT GCG CCA GAT GCC TCA TTC AGT TCC GTT TCC CAA CGT CAC CCG CCT T 23 blaSHV B GAC GGT CGG CGA ACT CTG T AGA TTG GCG GCG CTG TTA T CGC CAT TAC CAT GAG C 24 blaSHV C CCG TCG GCA AGG TGT TTT T TCC ACT ATC GCC AGC AGG AT ACC GGC GAG TAG TC 25 blaSHV D ATT GTC GCC CTG CTT GGC TTG TGG TGA TAT TAT CTG CGG GA CGA ATA ACA AAG CAG AGC G 26 blaTEM A GAT AAC ACT GCD GCC MAC TGG TAY GGC YTC AKT CAG TTC TGA CAA CGA TCG GAG GA 27 blaTEM B TCG TCG TTT GGT ATG GCT GCC AAC TTA CTT CTG ACA AC TTC AGC TCC GGT TCC CAA CG 28 blaOXA GGA ACA GCA ATC ATA CAC CAA AGA C TTG GGT TAT TTC TTG CGA AAC C TGG ATG CAA TTT TC 29 blaPER GCC GAT GAT CAG GTG CAG TA ACT TCC ATA ACA AAG CCT GCG A CAA AAC TGG ACC TCG ATG 30 blaCARB A CCT TGA TGG AAG ATA ACG CCC TA CAG AGC GGT CTG CAA TCG A CTT ACG AGT CAC GCA CAC A 31 blaCARB B CGT CTA GAC CGT ATT GAG CCT GAT TTG CCT TAG GAG TTG TCG TAT CC AAA TGA AGG TAA GCT CG 32 blaCARB C CCA GCA CGT TAA ATC AAT TAT TAT TTG CAC TGG CAA TAC TGA CCT CAA TAA AT TCC ACA TTA TCT GAA GCT AGT CA 33 blaCARB D TCG TCA ACA ACT AGA ATC TTG GCT TA GGA ACG CCT TTA CGA AAC AAT G AGG TAA TGA GGT TGG CGA T 34 qnrA TCG AGG ATT GCA GTT TCA TTG A TCC CTG AAC TCT ATG CCA AAG C CAC TTC AGC TAT GCC GAT 35 qnrC CAT TTT CTG ATG ACT TTT GGG AGC CTG CTC CAA AAG CTG CTC TTG T TGG CTT AGA ACC TCG 36 qnrS GCG GGY GCA TCA CTG AAA G ACA ACA ATA CCC ARY GCT TCG AGA CAC GCC GAA CTC G 37 mcr-1 TCG GCT TTG TGC TGA CGA T AAA TCA ACA CAG GCT TTA GCA CAT A CTG TCG TGC TCT TTG 38 mcr-3 AAT CGC GCT CGC AAT AGC TTA GGT ACT CGG TCG CAG ACG AGG GCC TGC TAG ATG 39 armA TCA AAA ACC TAT ACT TTA TCG TCG TCT T TAT TTT AGA TTT TGG TTG TGG CTT CA AAC TTC CCA ATA ATG CTA C 40 aac(6′)-Ie-aph(2″)-Ia GCTAATGCAGTTATTTTAGACCCTCATA ATA TTT CAT TGC CTT AAC ATT TGT GG CCA AGA GCA ATA AGG 41 fexA GCA AAT AAC GCC GCA GTA AGT TTA TCG GCT CAG TAG CAT CAC G ACT CGA TGC AGA CAA G 42 fexB TGA TTG AAC GCG GAG TCT GG AAA TCA CCC AAG TCA ATG ACG TCT AGT GTG GCT CTT GTC C 43 cfr AAT AAG TGC ACC TGA GAT GTA TGG AG CAT ATA ATT GAC CAC AAG CAG CG CGA AGG GCA GGT AGA 44 optrA AAG GGG ACA GAA GCT TGG AAT T TCC ACT AAA CTG AAA TGA GCCAAG TTG GTA AAT CCA CGT TGC T 45 aac(6′)-Ib-cr AGCTCTGGTTGAGTTGCTGTTC TAG GCA TCA CTG CGT GTT CG CCG AGG TCA CCA AGA T 46 intI1 GGC AAC YTT GGG CAG CA CTG AAG CCA GGG CAG ATC C TTC GGT CTC CAC GCA TCG TCA GG 47 ISCR1 TAA CCG AAG CAC CAT GTA ATT GA CCT CAG CCA TCG CAT CG TCG TCT TCG CCC TCT TCC AGT GTC A 48 16SrDNA CCT GGA CGA AGA CTG ACG CTC CTC AAG GGC ACA ACC TCC AAG CAA ACA GGA TTA GAT ACC CTG GTA GT
下载: 导出CSV
S2. 43 novel recombinant plasmids generated in this study
No. Gene group Vector type Recombinant plasmid concentration (ng/μL) Recombinant plasmid length (nt) ×1010Copies/μL 1 blaOXA-48-like pUC19 173.3 2,750 5.57 2 blaIMP A pUC57 160.8 2,794 5.25 3 blaIMP B pUC57 49.3 2,796 1.61 4 blaIMP C pUC57 46.3 2,769 1.53 5 blaIMP D pUC57 210.2 2,782 6.89 6 blaIMP E pUC57 159.2 2,924 4.96 7 blaIMP F pUC57 115.3 2,766 3.82 8 blaNDM T1 95.0 3,892 2.23 9 blaKPC T1 183.8 3,967 4.23 10 blaVIM T1 192.8 3,890 4.52 11 blaIMI pUC19 147.7 3,074 4.47 12 blaIND A pUC19 83.8 2,753 4.63 13 blaIND B pUC19 139.7 2,766 4.44 14 blaIND C pUC19 134.7 2,752 7.80 15 blaIND D pUC19 235.2 2,762 5.81 16 blaGES pUC57 83.8 2,766 2.76 17 blaCTX-M A pUC57 93.2 2,776 3.33 18 blaCTX-M B pUC57 126.1 2,803 4.10 19 blaCTX-M C pUC57 142.9 2,823 4.62 20 blaCTX-M D T1 176.3 3,934 4.09 21 blaCTX-M E T1 188.3 3,886 4.42 22 blaSHV A T1 125.7 3,898 2.94 23 blaSHV B pUC57 370.6 2,770 12.21 24 blaSHV C T1 262.4 3,893 6.15 25 blaSHV D T1 303.1 3,889 7.11 26 blaTEM A T1 155.7 3,889 5.97 27 blaTEM B T1 70.8 3,890 5.54 28 blaOXA T1 90.6 3,899 2.12 29 blaPER pUC57 117.0 2,828 3.77 30 blaCARB A pUC57 106.9 2,841 3.43 31 blaCARB B pUC57 98.4 2,795 3.22 32 blaCARB C pUC57 62.1 2,831 2.00 33 blaCARB D pUC57 77.2 2,778 2.53 34 qnrA pUC57 38.8 2,855 1.24 35 qnrC pUC57 27.9 2,853 0.89 36 qnrS pUC57 27.0 2,907 0.85 37 mcr-1 [9] 38 mcr-3 T1 248.0 3,942 5.74 39 armA [16] 40 aac(6′)-Ie-aph(2″)-Ia pUC57 102.9 2,896 3.24 41 fexA pUC57 138.3 2,861 4.41 42 fexB pUC57 151.2 2,827 4.88 43 cfr pUC57 25.0 2,853 0.80 44 optrA pUC57 129.7 2,963 3.93 45 aac(6′)-Ib-cr pUC57 151.3 2,908 4.75 46 intI1 [17] 47 ISCR1 [17] 48 16SrDNA [9]
下载: 导出CSV
Table 2. Validation of the new high-throughput real-time PCR array for the detection of AMR target genes contained within a plasmid mixture
High-throughput assay AMR target genes contained in plasmid mixture Total Positive Negative Positive reactions 9,670a 476b 10,146 Negative reactions 68c 24,346d 24,414 Total 9,738 24,822 34,560 Note. Sensitivity rate = $\dfrac{ { {\text{a} } } }{ { {\text{a} } + {\text{c} } } } $ × 100%; specificity rate = $\dfrac{ {\text{d} } }{ { {\text{b} } + {\text{d} } } }$ × 100%; positive predictive value = $\dfrac{ {\text{a} } }{ { {\text{a} } + {\text{b} } } }$ × 100%; negative predictive value = $\dfrac{ {\text{d} } }{ { {\text{c} } + {\text{d} } } }$ × 100%; correct indices = sensitivity rate + specificity rate-1.
下载: 导出CSV
S3. Standard curves parameters for 43 AMR genes from conventional real-timePCR assays
No. Gene type group linear dynamic range r2 (%) Linear regression equation LOD (copies/reaction) 1 blaOXA-48-like 5.75×10 9−5.75×10² 0.999 y = −3.519x + 45.50 57.5 2 blaIMP A 5.25×10 9−5.25×10² 0.997 y = −3.551x + 46.85 52.5 3 blaIMP B 1.61×10 9−1.61×10² 0.993 y = −3.321x + 45.49 16.1 4 blaIMP C 1.53×10 9−1.53×101 0.998 y = −3.592x + 45.09 15.3 5 blaIMP D 6.89×10 9−6.89×101 0.999 y = −3.653x + 46.44 68.9 6 blaIMP E 4.96×10 9−4.96×101 0.998 y = −3.568x + 45.16 49.6 7 blaIMP F 3.82×10 9−3.82×10² 0.998 y = −3.506x + 44.56 38.2 8 blaNDM 2.23×10 9−2.23×101 0.995 y = −3.470x + 43.73 22.3 9 blaKPC 4.23×10 9−4.23×101 0.997 y = −3.343x + 43.77 42.3 10 blaVIM 4.52×10 9−4.52×10² 0.997 y = −3.534x + 46.05 45.2 11 blaIMI 4.47×10 9−4.47×10² 0.999 y = −3.802x + 49.85 44.7 12 blaIND A 4.44×10⁹−4.44×10³ 0.986 y = −3.520x + 51.11 44.4 13 blaIND B 4.44×10⁷−4.44×10² 0.998 y = −3.410x + 42.51 44.4 14 blaIND C 7.80×10⁹−7.80×101 0.998 y = −3.568x + 43.73 78.0 15 blaIND D 5.81 ×15.81×109−5.81×101 0.997 y = −3.469x + 44.63 58.1 16 blaGES 2.76×10⁹−2.76×101 0.999 y = −3.477x + 44.03 27.6 17 blaCTX-M A 3.33×10⁹−3.33×10³ 0.995 y = −3.753x + 42.96 33.3 18 blaCTX-M B 4.10×10⁹−4.10×10³ 0.999 y = −3.748x + 47.70 41.0 19 blaCTX-M C 4.62×10⁹−4.62×10² 0.996 y = −3.486x + 44.81 46.2 20 blaCTX-M D 4.09×10⁹−4.09×10³ 0.984 y = −3.651x + 47.14 40.9 21 blaCTX-M E 4.42×10⁹−4.42×101 0.983 y = −3.558x + 44.01 44.2 22 blaSHV A 2.94×10 7−2.94×10² 0.998 y = −3.228x + 42.61 29.4 23 blaSHV B 1.22×10⁹−1.22×10² 0.998 y = −3.081x + 46.53 12.2 24 blaSHV C 6.15×10 8−6.15×101 0.998 y = −2.971x + 38.70 61.5 25 blaSHVⅣ 7.11×10⁹−7.11×101 0.998 y = −3.457x + 46.18 71.1 26 blaTEM A 5.97×10⁸−5.97×101 0.991 y = −3.628x + 42.58 59.7 27 blaTEM B 5.45×10⁸−5.45×10² 0.995 y = −3.670x + 42.46 54.5 28 blaOXA 2.12×10 9−2.12×10² 0.991 y = −3.133x + 41.88 21.2 29 blaPER 3.77×10⁹−3.77×10² 0.998 y = −3.464x + 48.88 37.7 30 blaCARB A 3.43×10⁹−3.43×10² 0.999 y = −3.502x + 47.06 34.3 31 blaCARB B 3.22×10⁹−3.22×10² 0.999 y = −3.400x + 46.71 32.2 32 blaCARB C 2.00×10⁹−2.00×10³ 0.999 y = −3.763x + 50.30 20.0 33 blaCARB D 2.53×10⁹−2.53×10² 0.999 y = −3.494x + 46.60 25.3 34 qnrA 1.24×10⁹−1.24×101 0.995 y = −3.294x + 44.77 12.4 35 qnrC 8.92×10⁸−8.92×101 0.990 y = −3.125x + 42.66 89.2 36 qnrS 8.47×10⁹−8.47×10³ 0.998 y = −3.692x + 52.81 84.7 37 mcr-3 2.70×10⁹−2.70×10³ 0.994 y = −3.224x + 46.27 27.3 38 aac(6′)-Ie-aph(2″)-Ia 3.24×10⁹−3.24×10³ 0.980 y = −2.858x + 46.50 32.4 39 fexA 4.41×10⁸−4.41×10³ 0.999 y = −3.625x + 46.93 44.1 40 fexB 4.88×10⁹−4.88×10² 0.996 y = −3.766x + 50.58 48.8 41 cfr 8.00 ×10⁹−8.00×10³ 0.995 y = −3.560x + 48.66 80.0 42 optrA 3.93×10⁹−3.93×10² 0.998 y = −3.663x + 46.63 39.3 43 aac(6′)-Ib-cr 4.75×10⁹−4.75×10² 0.999 y = −3.499x + 45.48 47.5
下载: 导出CSV
Table 3. LODs of high-throughput real-time pcr assay in this study
No. Gene group LOD (copies/reaction) No. Gene group LOD (copies/reaction) No. Gene group LOD (copies/reaction) 1 blaOXA-48-like 5,750 17 blaCTX-M E 442 33 blaCARB D 2,530 2 blaIMP A 5,250 18 blaSHV A 294 38 qnrA 124 3 blaIMP B 1,610 19 blaSHV B 1,220 39 qnrC 892 4 blaIMP C 153 20 blaSHV C 615 40 qnrS 8,470 5 blaIMP D 689 21 blaSHV D 711 13 mcr-1 100 6 blaIMP E 496 22 blaTEM A 59.7 14 mcr-3 2,730 7 blaIMP F 382 23 blaTEM B 54.5 15 armA 4,070 8 blaNDM 223 24 blaCTX-M A 3,330 16 aac(6′)-Ie-aph(2″)-Ia 3,240 9 blaKPC 423 25 blaCTX-M B 4,100 41 fexA 4,410 10 blaVIM 452 26 blaCTX-M C 4,620 42 fexB 488 11 blaIMI 4,470 27 blaCTX-M D 40.9 43 cfr 8,000 12 blaIND A 4,440 28 blaOXA 2,120 44 optrA 393 13 blaIND B 4,440 29 blaPER 3,770 45 aac(6′)-Ib-cr 475 14 blaIND C 780 30 blaCARB A 3,430 46 intI1 589 15 blaIND D 581 31 blaCARB B 322 47 ISCR1 413 16 blaGES 276 32 blaCARB C 2,000 48 16SrDNA 321
下载: 导出CSV
Table 4. AMR genes dissemination and statistical differences between two broiler farms
Antimicrobial agent No. Gene group Frequency of AMR gene (%) Statistical analysis Total (%) Farm A (%) Farm B (%) χ2 value P value Carbapenems 1 blaOXA-48-like 1 (0.37) 1 (0.37) 0 (0) 0.000 1.000 2 blaIMP A 7 (2.56) 3 (1.10) 4 (1.47) 0.000 1.000 3 blaIMP B 7 (2.56) 0 (0) 7 (2.56) 5.210 0.015 4 blaIMP C 1 (0.37) 0 (0) 1 (0.37) 0.000 1.000 5 blaIMP D 2 (0.73) 2 (0.73) 0 (0) 0.502 0.499 6 blaIMP E 3 (0.73) 1 (0.37) 2 (0.73) 0.000 1.000 7 blaIMP F 0 (0) 0 (0) 0 (0) − − 8 blaNDM 14 (5.13) 5 (1.83) 9 (3.30) 1.173 0.418 9 blaKPC 2 (0.73) 2 (0.73) 0 (0) 0.502 0.499 10 blaVIM 7 (2.56) 2 (0.73) 5 (1.83) 0.579 0.447 11 blaIMI 0 (0) 0 (0) 0 (0) − − 12 blaIND A 1 (0.37) 1 (0.37) 0 (0) 0.000 1.000 13 blaIND B 2 (0.73) 2 (0.73) 0 (0) 0.502 0.499 14 blaIND C 2 (0.73) 2 (0.73) 0 (0) 0.502 0.499 25 blaIND D 1 (0.37) 1 (0.37) 0 (0) 0.000 1.000 Other β-lactams 16 blaGES 8 (2.93) 0 (0) 8 (2.93) 6.216 0.007 17 blaCTX-M A 254 (93.04) 143 (52.38) 111 (40.66) 7.538 0.006 18 blaCTX-M B 6 (2.20) 5 (1.83) 1 (0.37) 1.517 0.218 19 blaCTX-M C 1 (0.37) 1 (0.37) 0 (0) 0.000 1.000 20 blaCTX-M D 205 (75.10) 135 (49.45) 70 (25.64) 33.000 0.000 21 blaCTX-M E 260 (95.24) 144 (52.75) 116 (42.49) 5.757 0.016 22 blaSHV A 17 (6.23) 9 (3.30) 8 (2.93) 0.061 1.000 23 blaSHV B 12 (4.40) 8 (2.93) 4 (1.47) 0.767 0.381 24 blaSHV C 7 (2.56) 4 (1.47) 3 (1.10) 0.000 1.000 25 blaSHV D 8 (2.93) 6 (2.20) 2 (0.73) 1.142 0.285 26 blaTEM A 230 (84.25) 142 (52.01) 88 (32.23) 21.906 0.000 27 blaTEM B 260 (95.24) 145 (53.11) 115 (42.12) 6.608 0.013 28 blaOXA 140 (51.28) 108 (39.56) 32 (11.72) 55.484 0.000 29 blaPER 12 (4.03) 4 (1.47) 8 (2.93) 0.767 0.381 30 blaCARB A 1 (0.37) 1 (0.37) 0 (0) 0.000 1.000 31 blaCARB B 23 (8.42) 12 (4.40) 11 (4.03) 0.045 1.000 32 blaCARB C 2 (0.73) 2 (0.73) 0 (0) 0.502 0.499 33 blaCARB D 65 (23.81) 51 (18.68) 14 (5.13) 23.908 0.000 Fluoroquinolones 34 qnrA 5 (1.83) 0 (0) 5 (1.83) 3.230 0.061 35 qnrC 0 (0) 0 (0) 0 (0) − − 36 qnrS 113 (41.39) 94 (34.43) 19 (6.96) 62.770 0.000 Colistin 37 mcr-1 217 (79.49) 105 (38.46) 112 (41.03) 0.375 0.540 38 mcr-3 10 (3.66) 6 (2.20) 4 (1.47) 0.102 0.750 Aminoglycosides 39 armA 11 (4.03) 2 (0.73) 9 (3.30) 3.340 0.068 40 aac(6′)-Ie-aph(2″)-Ia 257 (94.14) 136 (49.81) 121 (44.32) 1.654 0.198 Phenicols 41 fexA 256 (93.77) 140 (51.28) 116 (42.49) 4.774 0.029 42 fexB 4 (1.47) 3 (1.10) 1 (0.37) 0.252 0.616 Multidrug 43 cfr 134 (49.08) 123 (45.05) 11 (4.03) 124.059 0.000 44 optrA 223 (81.68) 128 (46.89) 95 (34.80) 8.255 0.004 45 aac(6′)-Ib-cr 199 (72.89) 135 (49.45) 64 (23.44) 55.956 0.000 Gene spread related 46 intI1 265 (97.07) 145 (53.11) 120 (43.96) 4.583 0.040 47 ISCR1 128 (46.89) 96 (35.16) 32 (11.72) 41.799 0.000
下载: 导出CSV
-
[1] World Health Organization. Antimicrobial resistance global report on surveillance. http://apps.who.int/gb/ebwha/pdf_files/EB134/B134_R12-en.pdf. [2018-11-12] [2] Nhung NT, Cuong NV, Thwaites G, et al. Antimicrobial usage and antimicrobial resistance in animal production in Southeast Asia: A review. Antibiotics (Basel), 2016; 5, 37. doi: 10.3390/antibiotics5040037 [3] O’Neill J. Antimicrobial Resistance: Tackling a crisis for the health and wealth of nations. The Review on Antimicrobial Resistance. https://amr-review.org/sites/default/files/AMR%20Review%20Paper%20-%20Tackling%20a%20crisis%20for%20the%20health%20and%20wealth%20of%20nations_1.pdf. [2018-11-12] [4] Liu YY, Wang Y, Walsh RT, et al. Emergence of plasmid-mediated colistin resistance mechanism MCR-1 in animals and human beings in China: a microbiological and molecular biological study. Lancet Infect Dis, 2016; 16, 161−8. doi: 10.1016/S1473-3099(15)00424-7 [5] Ramírez-Castillo FY, Moreno-Flores AC, Avelar-González FJ, et al. An evaluation of multidrug-resistant Escherichia coli isolates in urinary tract infections from Aguascalientes, Mexico: cross-sectional study. Ann Clin Microbiol Antimicrob, 2018; 17, 34. doi: 10.1186/s12941-018-0286-5 [6] Dominguez JE, Redondo LM, Figueroa Espinosa RA, et al. Simultaneous carriage of mcr-1 and other antimicrobial resistance determinants in Escherichia coli from poultry. Front Microbiol, 2018; 9, 1679. doi: 10.3389/fmicb.2018.01679 [7] Doi Y, lovleva A, Bonomo RA. The ecology of extended-spectrum β-lactamases (ESBLs) in the developed world. J Travel Med, 2017; 24, S44-51. [8] Azargun R, Sadeghi MR, Soroush Barhaghi MH, et al. The prevalence of plasmid-mediated quinolone resistance and ESBL-production in Enterobacteriaceae isolated from urinary tract infections. Infect Drug Resist, 2018; 1, 1007−14. [9] Chen X, Zhao X, Che J, et al. Detection and dissemination of the colistin resistance gene, mcr-1, from isolates and faecal samples in China. J Med Microbiol, 2017; 66, 119−25. doi: 10.1099/jmm.0.000425 [10] Moghnieh RA, Kanafani ZA, Tabaja HZ, et al. Epidemiology of common resistant bacterial pathogens in the countries of the Arab League. Lancet Infect Dis, 2018; 18, e379−84. doi: 10.1016/S1473-3099(18)30414-6 [11] Jousset AB, Bernabeu S, Bonnin RA, et al. Development and validation of a multiples PCR assay for the detection of the five families of plasmid-encoded colistin resistance. Int J Antimicrob Agents, 2019; 53, 302−9. doi: 10.1016/j.ijantimicag.2018.10.022 [12] Spurgeon SL, Jones RC, Ramakrishnan R. High throughput gene expression measurement with real time PCR in a microfluidic dynamic array. PLoS One, 2008; 3, e1662. doi: 10.1371/journal.pone.0001662 [13] Dhoubhadel BG, Yasunami M, Yoshida LM, et al. A novel high-throughput method for molecular serotyping and serotype-specific quantification of Streptococcus pneumoniae using a nanofluidic real-time PCR system. J Med Microbiol, 2014; 63, 528−39. doi: 10.1099/jmm.0.071464-0 [14] Michelet L, Delannoy S, Devillers E, et al. High-throughput screening of tick-borne pathogens in Europe. Front Cell Infect Microbiol, 2014; 4, 103. [15] Dufour MC, Magnin N, Dumas B, et al. High-throughput gene-expression quantification of grapevine defense responses in the field using microfluidic dynamic arrays. BMC Genomics, 2016; 17, 957. doi: 10.1186/s12864-016-3304-z [16] Che J, Zhao X, Lu J, et al. Establishment of a duplex MGB real-time PCR assay for int1 gene and ISCR1 element detections. Dis Surveil, 2017; 32, 878−82. (In Chinese) [17] Gong L, Yuan M, Chen X, et al. Establishment of Real-time PCR assay to detect resistance gene armA. Dis Surveil, 2014; 29, 901−4. (In Chinese) [18] O’Neill J. Tackling drug-resistant infections globally: final report and recommendations. https://amr-review.org/sites/default/files/160525_Final%20paper_with%20cover.pdf. [2018-11-12] [19] Ishii S, Segawa T, Okabe S. Simultaneous quantification of multiple food- and waterborne pathogens by use of microfluidic quantitative PCR. Appl Environ Microbial, 2013; 79, 2891−8. doi: 10.1128/AEM.00205-13 [20] Chen X, Li GX, Zhang H, et al. Characterization of class 1 integron gene cassettes among clinical bacteria isolated from one large hospital in northern China. Biomed Environ Sci, 2013; 26, 1003−7. [21] Colello R, Krüger A, Conza JD, et al. Antimicrobial resistance in class 1 integron-positive Shiga toxin-producing Escherichia coli isolated from cattle, pigs, food and farm environment. Microorganisms, 2018; 6, 99. doi: 10.3390/microorganisms6040099 [22] Faghri J, Nouri S, Jalalifar S, et al. Investigation of antimicrobial susceptibility, class I and II integrons among Pseudomonas aeruginosa isolates from hospitalized patients in Isfahan, Iran. BMC Res Notes, 2018; 11, 806. doi: 10.1186/s13104-018-3901-9 [23] Ur Rahman S, Ali T, Ali I, et al. The growing genetic and functional diversity of extended spectrum beta-lactamases. Biomed Res Int, 2018; 95, 19718. [24] Bidell MR, Palchak M, Mohr J, et al. Fluoroquinolone and third-generation-cephalosporin resistance among hospitalized patients with urinary tract infections due to Escherichia coli: Do rates vary by hospital characteristics and geographic region? Antimicrob Agents Chemother, 2016; 60, 3170−3. doi: 10.1128/AAC.02505-15 [25] Wang Y, Zhang R, Li J, et al. Comprehensive resistome analysis reveals the prevalence of NDM and MCR-1 in Chinese poultry production. Nat Microbiol, 2017; 2, 16260. doi: 10.1038/nmicrobiol.2016.260 [26] Danadchi I, Chabou S, Daoud Z, et al. Prevalence and emergence of extended-spectrum cephalosporin-, carbapenems- and colistin-resistant gram negative bacteria of animal origin in the Mediterranean Basin Front Microbiol, 2018; 9, 2299. [27] Vikram A, Schmidt JW. Functional blaKPC-2 sequences are present in U.S. beef cattle feces regardless of antibiotic use Foodborne Pathog Dis, 2018; 15, 444-8. [28] Dimude JU, Amyes SGB. Molecular characterisation and diversity in Enterobacter cloacae from Edinburgh and Egypt carrying blaCTX-M-14 and blaVIM-4 β-lactamase genes. Int J Antimicrob Agents, 2013; 41, 574−7. doi: 10.1016/j.ijantimicag.2013.02.012 [29] Lallement C, Pasternak C, Ploy M-C, et al. The role of ISCR1-borne POUT promoters in the expreesion of antibiotic resistance genes. Front Microbiol, 2018; 9, 2579. doi: 10.3389/fmicb.2018.02579 [30] Toleman MA, Bennett PM, Walsh TR. ISCR elements: novel gene-capturing systems of the 12st century? Microbiol Mol Biol Rev, 2006; 70, 296−16. doi: 10.1128/MMBR.00048-05 [31] Bennett PM. Plasmid encoded antibiotic resistance: acquisition and transfer of antibiotic resistance genes in bacteria. Br J Pharmacol, 2008; 153, S347−57. doi: 10.1038/sj.bjp.0707569 [32] Chen X, Che J, Zhao X, et al. Dissemination of insertion sequence common regions 1 and int1 gene and drug resistance of 483 Escherichia coli and Klebsiella pneumonia broiler isolates. Chinese Journal of Preventive Medicine, 2017; 51, 886−9. (In Chinese) [33] Theuretzbacher U. Global antimicrobial resistance in Gram-negative pathogens and clinical need. Curr Opin Microbiol, 2017; 39, 106−12. doi: 10.1016/j.mib.2017.10.028 -

 点击查看大图
计量
- 文章访问数: 4102
- HTML全文浏览量: 1700
- PDF下载量: 107
- 被引次数: 0

 Quick Links