

 下载:
下载:

-
Pregnancy is always associated with several important physiological changes in women, including sex hormone levels, glycolipid metabolism, and oxidative stress. These changes may have short-term and long-term effects on their cardiovascular system. Parity is the number of times a woman has given birth. Several studies have investigated the association between parity and risk of cardiovascular diseases in women. Prospective studies have shown a fairly low incidence of cardiovascular endpoints for parous women[1]. Therefore, it would be meaningful to assess the relationship between parity and other surrogate markers.
Carotid atherosclerosis is widely recognized as a good marker of systemic atherosclerotic burden, including the presence of carotid plaques and the measurement of carotid intima-media thickness (IMT). It is well known that carotid atherosclerosis is a significant predictor of subsequent cardiovascular diseases such as myocardial infarction and ischemic stroke. Although the association between parity and carotid atherosclerosis has been assessed in various ethnic populations, the results are conflicting. A progressive increasing tendency was found in elderly women from the Netherlands[2], a U-shaped association was found in women from Germany[3], and a J-shaped association was observed in British women[4]. However, no significant association was found between parity and either IMT or presence of plaques in women from Finland and southern Germany[5,6]. To the best of our knowledge, the findings related to this topic have not been reported in Chinese population. Therefore, we performed a cohort study of women aged ≥ 40 years in Northern China with an aim to assess the association between parity and carotid atherosclerosis in this cross-sectional analysis.
Participants were recruited from Jidong and Kailuan communities (Tangshan City, Hebei, Northern China) in 2010 to 2014. A total of 3,386 participants remained in the statistical analysis after excluding 8,025 males, 2,002 females aged < 40 years, and 1,082 females with missing information on parity and carotid plaques. Twenty-three nulliparous women were also excluded from the current analysis because of small sample size. The study was conducted according to the guidelines of Helsinki Declaration and was approved by the Ethics Committee of Jidong Oilfield Inc. Medical Center and Kailuan General Hospital. Written informed consent was obtained from all the participants.
A standardized, structured questionnaire was administered to collect information on subjects’ demographic characteristics, socioeconomic status, cardiovascular risk factors, and medical history by well-trained interviewers. Parity was classified into four categories: one, two, three, and four or more (Supplementary Table S1 available in www.besjournal.com).
Table S1. Parity distribution in this study
Parity Frequency Percentage Cumulative frequency Cumulative percentage 0 23 0.67 23 0.67 1 2,498 73.28 2,521 73.95 2 633 18.57 3,154 92.52 3 186 5.46 3,340 97.98 4 53 1.55 3,393 99.53 5 13 0.38 3,406 99.91 6 2 0.06 3,408 99.97 7 1 0.03 3,409 100.00 The carotid artery was assessed by certified sonographers blinded to participants’ clinical characteristics. High-resolution B-mode ultrasound (Philips iU22 ultrasound system, Philips Medical Systems, Bothell, WA, USA) with a 5–12 MHz linear array transducer was used to detect plaques bilaterally on three segments: the common carotid artery, the carotid artery bifurcation, and the internal carotid artery. IMT was defined as the distance from the leading edge of the lumen-intima interface to the leading edge of the media-adventitia interface on a longitudinal image of each carotid artery. Carotid plaque was defined as a focal structure encroaching into the arterial lumen of at least 0.5 mm or 50% of the surrounding IMT value or a thickness > 1.5 mm as measured from the media-adventitia interface to the intima-lumen interface. Carotid atherosclerosis was considered as the presence of plaques at one or more sites. IMTs of the bilateral common carotid artery and the internal carotid artery were then averaged to obtain a mean IMT value for each subject. IMTs were measured twice by the same technician for subsequent assessment of interpreter reproducibility. The results were reviewed by two independent sonographers. Discrepancies between their evaluations were resolved by consensus.
Comparisons between the parity groups were tested using one-way ANOVA for continuous variables or chi-square test for categorical variables. Ordinal variables and continuous variables with skewed distribution were compared using the nonparametric Kruskal-Wallis test. The association between parity and carotid artery plaques was examined by logistic regression models, while the association of parity with carotid artery IMT was analyzed by multivariate linear regression models. Results of logistic regression models are presented as odds ratio (OR) with 95% confidence interval (CI), and results of linear regression models are presented as unstandardized β-coefficient and standard error (SE). Potential confounders, including age, hypertension, diabetes mellitus, dyslipidemia, education level, income, current smoking, alcohol use, body mass index (BMI), physical activity, antihypertensive medication, use of insulin or oral hypoglycemic drugs, use of antilipidemic agents, and oral contraceptives, were adjusted in these models. The parity of one was considered as the reference in all models. A P value of < 0.05 was considered to be statistically significant. All statistical analyses were performed with SAS 9.4 (SAS Institute Inc., Cary, NC, USA).
Parity in this population ranged from one to a maximum of seven births (Supplementary Table S1). Women with one birth (2,498 participants) constituted the majority (73.8%) of the population. Table 1 shows the baseline characteristics of the participants according to the parity status. Both age and age at menopause increased with increasing parity. The incidence of current smoking increased with increasing parity, while alcohol usage decreased with increasing parity. Physical activity showed a significant difference across the parity groups. Higher prevalence of hypertension, diabetes mellitus, and dyslipidemia was associated with increasing parity (all with P < 0.001). There was also a significant trend toward the usage of more antihypertensive, antidiabetic, antihyperlipidemic, and contraceptive drugs with parity (all with P < 0.001), except estrogen replacement therapy (P = 0.36). Socioeconomic status, measured by education level and mean equivalent household income, showed a statistical difference among the parity groups (all with P < 0.001). In Supplementary Table S2 (available in www.besjournal.com), it adds the parity group of zero.
Table 1. Baseline characteristics of participants stratified by parity
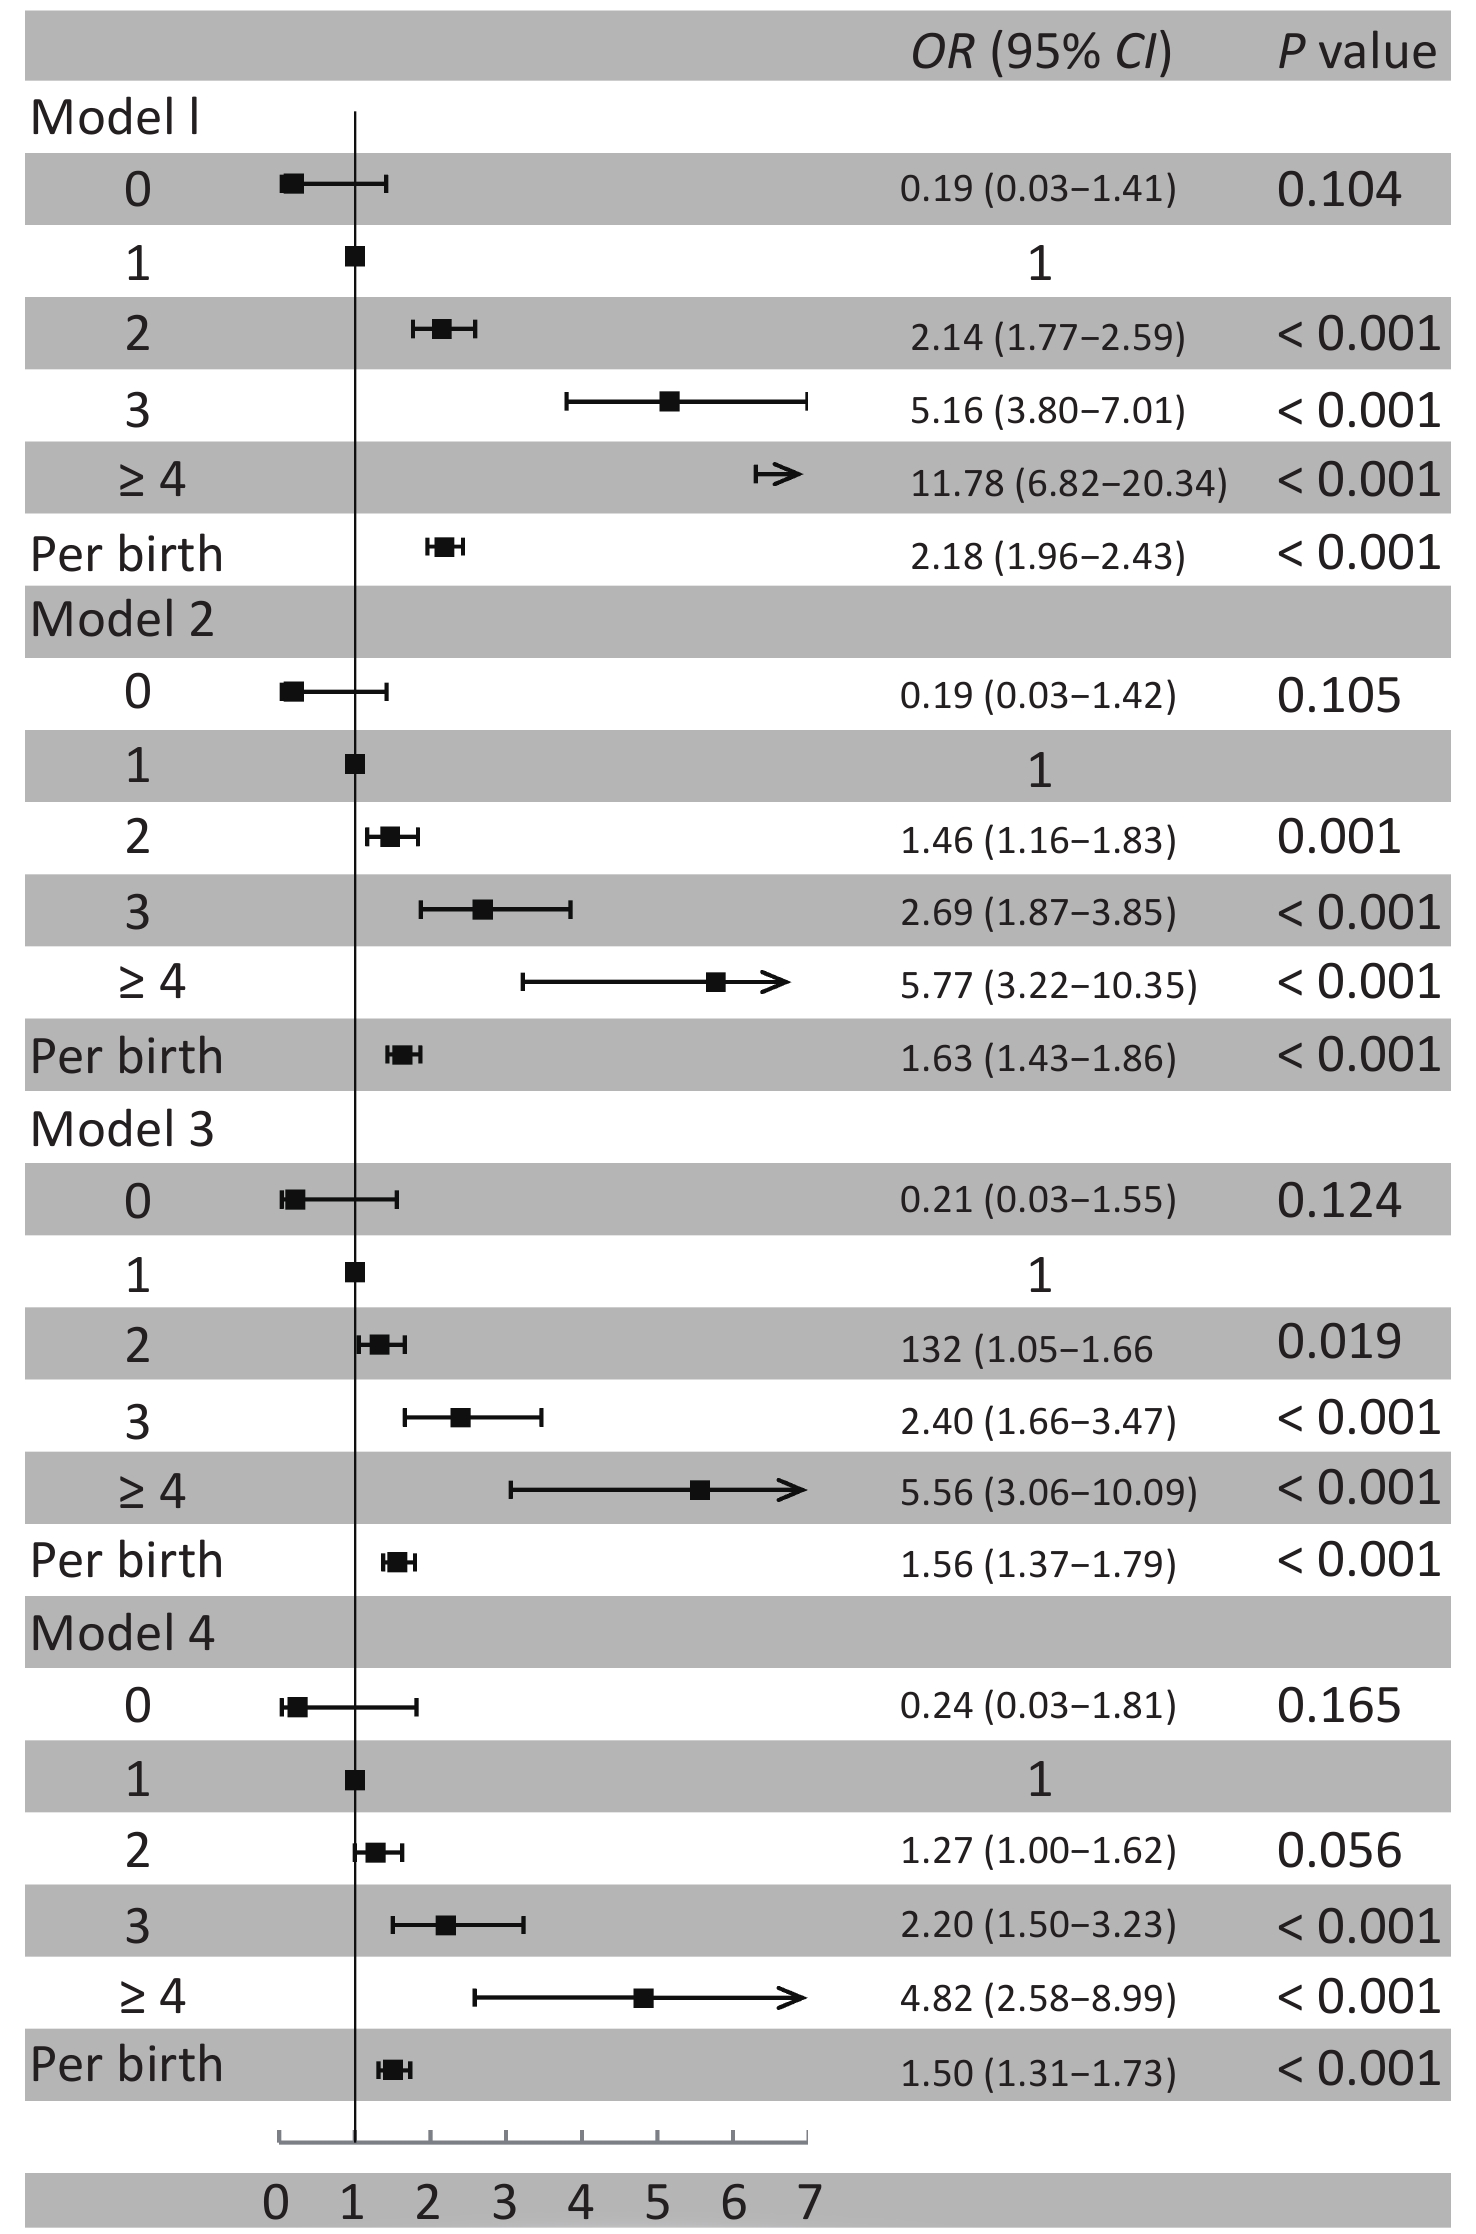
Characteristics Overall Parity group P value 1 2 3 ≥ 4 Number, n (%) 3,386 2,498 633 186 69 Age, year 52.5 ± 8.9 49.2 ± 6.3 59.4 ± 7.3 66.5 ± 6.9 71.9 ± 6.9 < 0.001 Age at menopause, year 58.4 ± 7.4 54.5 ± 5.4 61.4 ± 5.6 66.3 ± 5.9 72.3 ± 6.2 < 0.001 BMI, kg/m2 24.5 ± 3.4 24.2 ± 3.3 25.2 ± 3.5 25.3 ± 3.7 25.2 ± 3.4 < 0.001 Current smoking, n (%) 92 (2.7) 57 (2.3) 20 (3.2) 10 (5.4) 5 (7.3) 0.006 Alcohol use, n (%) 84 (2.5) 71 (2.8) 13 (2.1) 0 0 0.025 Physical activity, n (%) < 0.001 Inactive 1,106 (32.7) 831 (33.3) 196 (31.0) 62 (33.3) 17 (24.6) Moderate active 650 (19.2) 535 (21.4) 74 (11.7) 29 (15.6) 12 (17.4) Active 1,630 (48.1) 1,132 (45.3) 363 (57.4) 95 (51.1) 40 (58.0) Hypertension, n (%) 1,210 (35.7) 720 (28.8) 331 (52.3) 115 (61.8) 44 (63.8) < 0.001 Diabetes mellitus, n (%) 304 (9.0) 168 (6.7) 92 (14.5) 32 (17.2) 12 (17.4) < 0.001 Dyslipidemia, n (%) 1434 (42.4) 960 (38.4) 320 (50.6) 115 (61.8) 39 (56.5) < 0.001 Antihypertensive medication, n (%) 592 (27.8) 301 (21.1) 189 (37.1) 69 (48.3) 33 (67.4) < 0.001 Insulin or oral hypoglycemic drug, n (%) 178 (9.5) 91 (7.1) 61 (13.4) 17 (16.0) 9 (31.0) < 0.001 Antilipemic agent, n (%) 72 (2.1) 41 (1.6) 17 (2.7) 12 (6.5) 2 (2.9) < 0.001 Oral contraceptives, n (%) 119 (7.4) 67 (5.3) 32 (15.2) 11 (12.1) 9 (17.3) < 0.001 Estrogen replacement therapy, n (%) 33 (1.7) 26 (2.2) 5 (1.0) 2 (1.2) 0 0.361 Education level, n (%) < 0.001 Illiteracy/primary school 280 (8.3) 76 (3.0) 129 (20.4) 46 (24.7) 29 (42.0) Middle/high school 2,187 (64.6) 1,588 (63.6) 444 (70.1) 121 (65.1) 34 (49.3) College or above 919 (27.1) 834 (33.4) 60 (9.5) 19 (10.2) 6 (8.7) Income, ¥/month, n (%) < 0.001 ≤ ¥3,000 2,444 (72.2) 1721 (68.9) 511 (80.7) 155 (83.3) 57 (82.6) ¥3,001–5,000 813 (24.0) 670 (26.8) 105 (16.6) 27 (14.5) 11 (15.9) > ¥5,000 129 (3.8) 107 (4.3) 17 (2.7) 4 (2.2) 1 (1.5) Plaques, n (%) 853 (25.2) 484 (19.4) 215 (34.0) 103 (55.4) 51 (73.9) < 0.001 Mean common carotid IMT, mm 0.72 ± 0.13 0.70 ± 0.11 0.76 ± 0.13 0.84 ± 0.14 0.86 ± 0.13 < 0.001 Mean internal carotid IMT, mm 0.65 ± 0.09 0.63 ± 0.08 0.67 ± 0.10 0.69 ± 0.10 0.73 ± 0.10 < 0.001 Figure 1 shows the association between parity and carotid artery plaques. Women with more births tended to have higher risk of carotid artery plaques than those with only one birth. Logistic regression analysis yielded an age-adjusted OR of 1.61 (95% CI 1.41 to 1.84) per birth. Additional adjustment for hypertension, diabetes mellitus, and dyslipidemia did not alter the association (OR 1.55, 95% CI 1.35 to 1.77). In the multivariate adjusted model, the risk of carotid artery plaques increased by 49% (95% CI 29% to 72%) per birth after full adjustment for age, hypertension, diabetes mellitus, dyslipidemia, education level, income, current smoking, alcohol use, BMI, physical activity, antihypertensive medication, use of insulin or oral hypoglycemic drugs, use of antilipidemic agents, and oral contraceptives. Supplementary Figure S1 (available in www.besjournal.com) shows the results of parity group of zero.
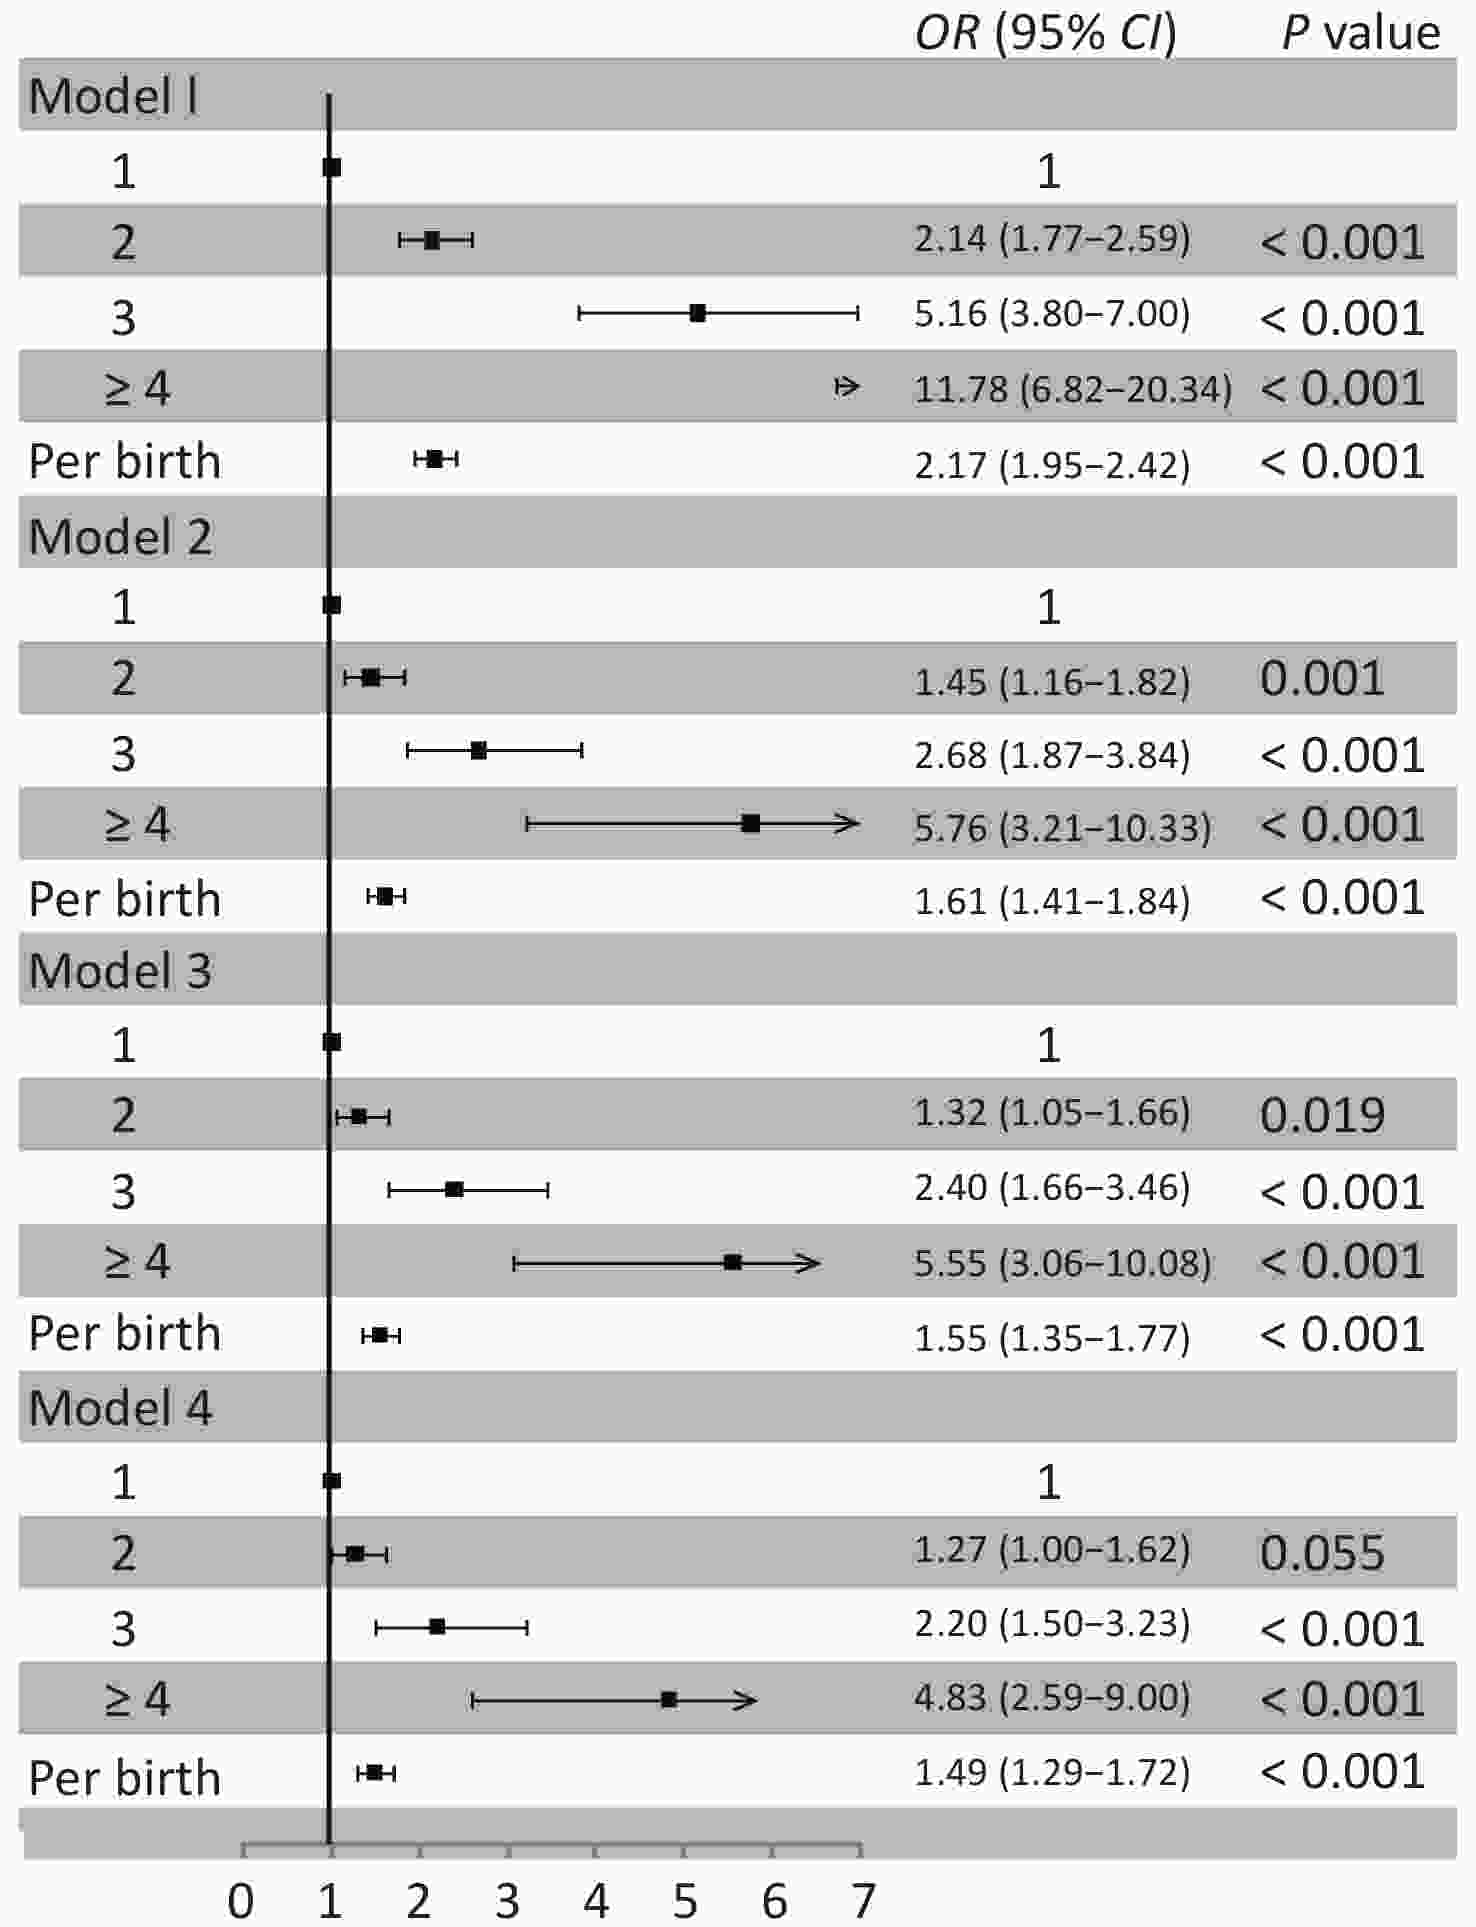
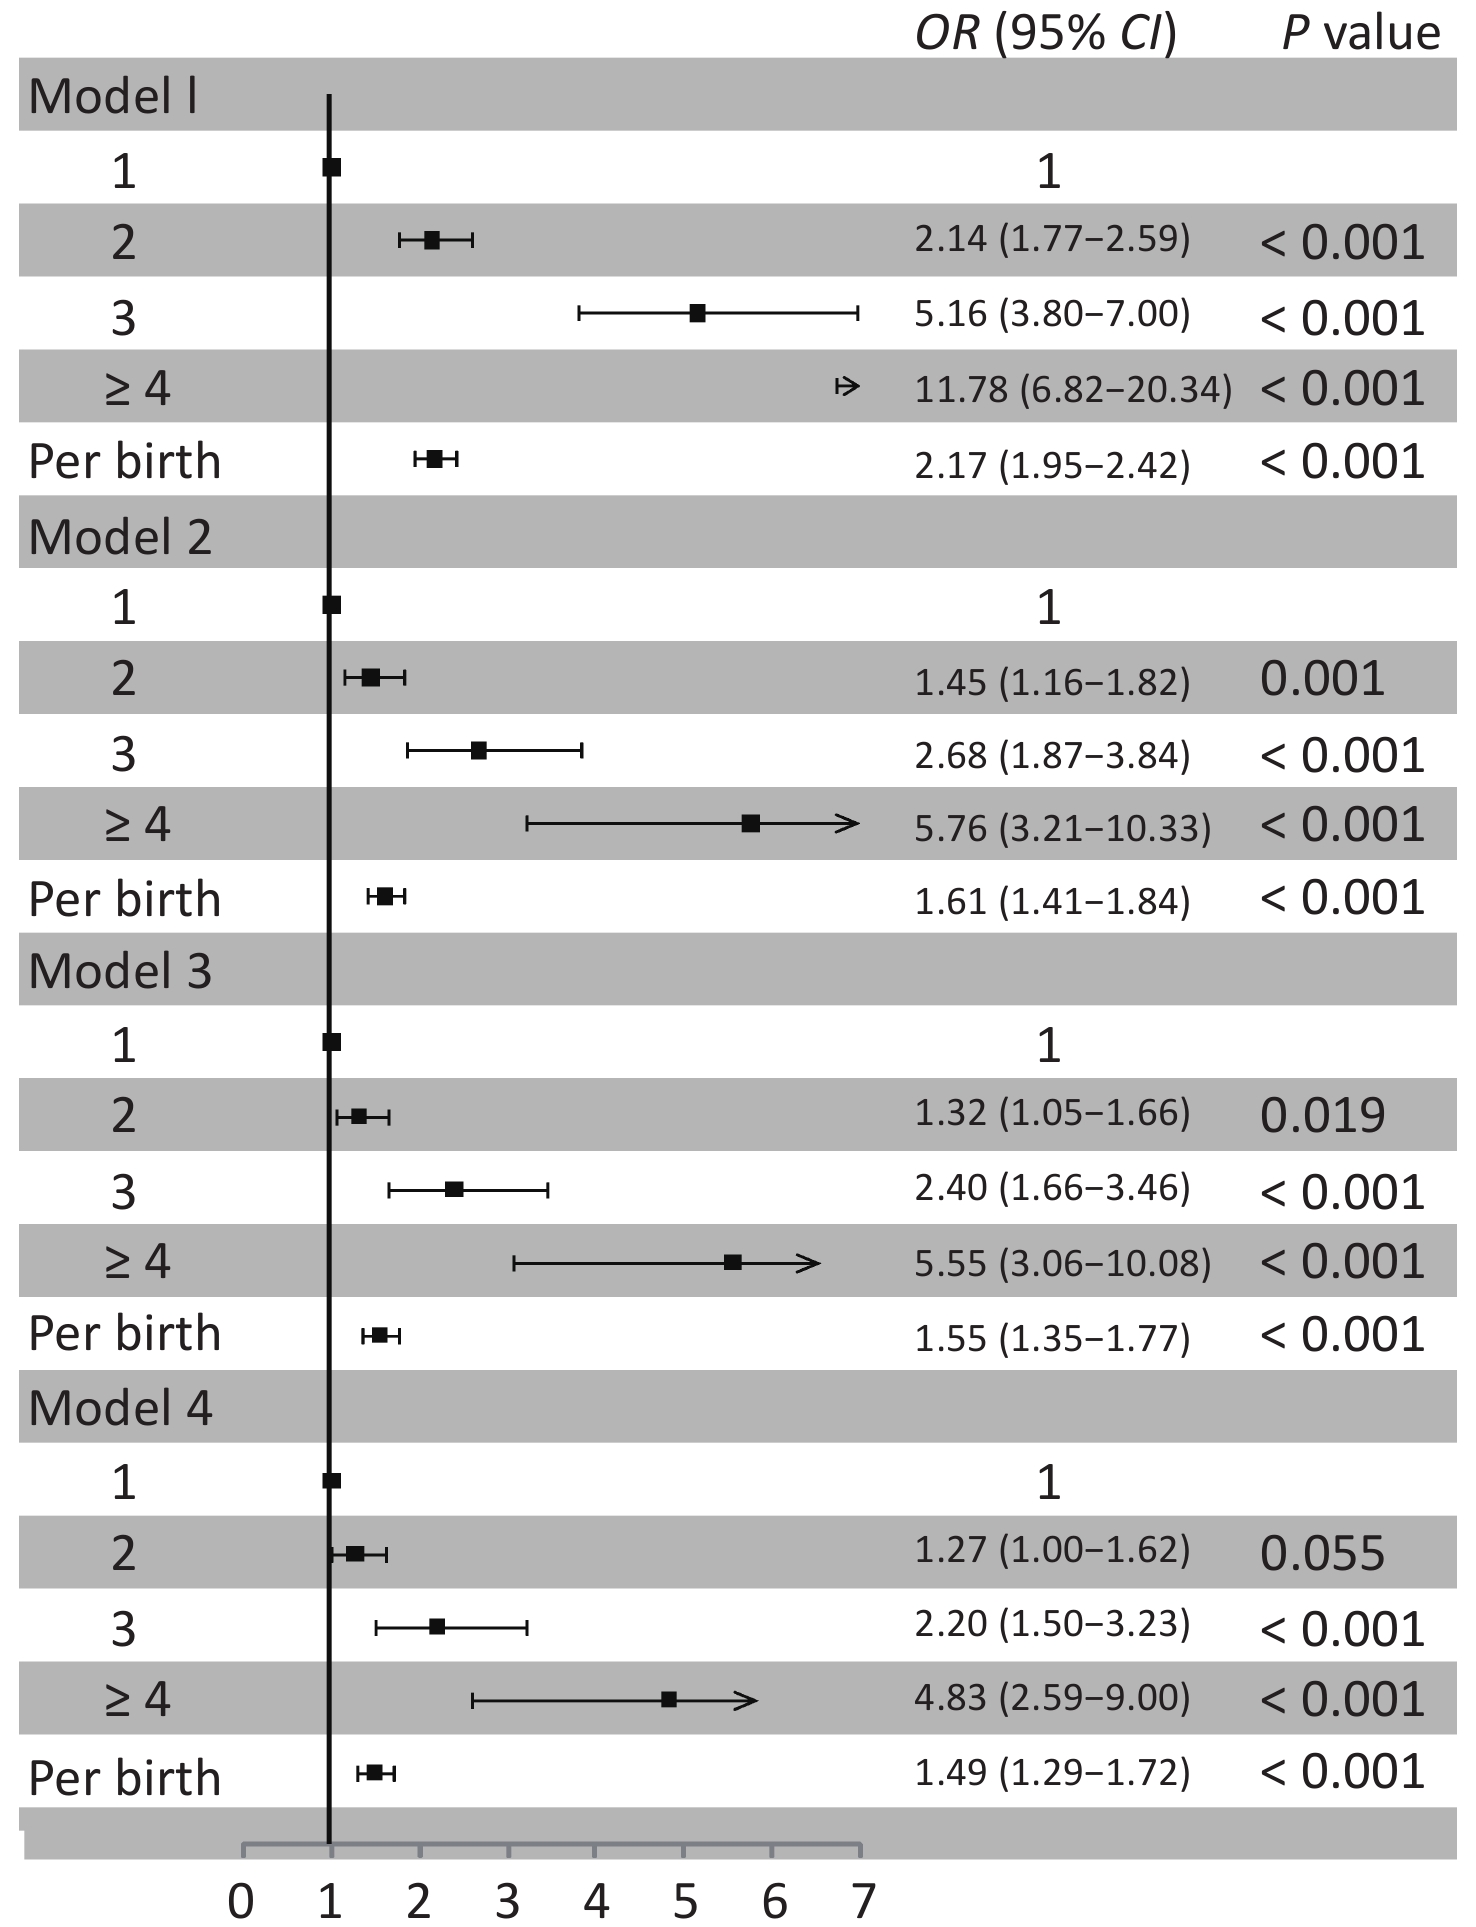
Figure 1. Association between parity and carotid artery plaques. Model 1: unadjusted; Model 2: adjusted for age; Model 3: adjusted for age, hypertension, diabetes mellitus and dyslipidemia; Model 4: adjusted for age, hypertension, diabetes mellitus, dyslipidemia, education level, income, current smoking, alcohol use, BMI, physical activity, antihypertensive medication, insulin or oral hypoglycemic drug, antilipemic agent, and oral contraceptives
As shown in Table 2, a positive association was found between parity and mean carotid artery IMT. Linear regression analysis showed an age-adjusted β of 0.024 (SE = 0.004) for common carotid IMT and 0.017 (SE = 0.003) for internal carotid IMT. In the fully adjusted model, this association remained statistically significant between parity and common carotid IMT [β (SE) = 0.016 (0.004)] and between parity and internal carotid IMT [β (SE) = 0.011 (0.003)]. Interestingly, higher parity was associated with greater IMT values for both the common carotid artery and the internal carotid artery in all the adjusted models, although this association appeared to be weaker with internal carotid IMT than with common carotid IMT for women with the same parity. If added the parity group of zero, it seemed no influences on these associations (Supplementary Table S3 available in www.besjournal.com).
Table 2. Association between parity and carotid artery IMT
Parity Model 1 Model 2 Model 3 Model 4 β (SE) P value β (SE) P value β (SE) P value β (SE) P value Common carotid IMT 1 0 0 0 0 2 0.062 (0.005) < 0.001 0.017 (0.006) 0.003 0.010 (0.006) 0.086 0.005 (0.006) 0.393 3 0.136 (0.009) < 0.001 0.056 (0.010) < 0.001 0.046 (0.010) < 0.001 0.039 (0.010) < 0.001 ≥ 4 0.160 (0.015) < 0.001 0.072 (0.015) < 0.001 0.065 (0.015) < 0.001 0.055 (0.015) < 0.001 Per birth 0.061 (0.003) < 0.001 0.024 (0.004) < 0.001 0.020 (0.004) < 0.001 0.016 (0.004) < 0.001 Internal carotid IMT 1 0 0 0 0 2 0.037 (0.004) < 0.001 0.019 (0.005) < 0.001 0.016 (0.005) < 0.001 0.010 (0.005) 0.043 3 0.059 (0.008) < 0.001 0.028 (0.009) 0.002 0.024 (0.009) 0.006 0.018 (0.009) 0.041 ≥ 4 0.092 (0.014) < 0.001 0.057 (0.015) < 0.001 0.053 (0.015) < 0.001 0.044 (0.015) 0.003 Per birth 0.032 (0.003) < 0.001 0.017 (0.003) < 0.001 0.015 (0.003) < 0.001 0.011 (0.003) < 0.001 Note. Model 1: unadjusted; Model 2: adjusted for age; Model 3: adjusted for age, hypertension, diabetes mellitus and dyslipidemia; Model 4: adjusted for age, hypertension, diabetes mellitus, dyslipidemia, education level, income, current smoking, alcohol use, BMI, physical activity, antihypertensive medication, insulin or oral hypoglycemic drug, antilipemic agent, and oral contraceptives. IMT, intima-media thickness. We assessed for the first time the association between parity and carotid atherosclerosis in Chinese women. We found that women with more births had increased risk of carotid plaques. A positive association was observed between parity and carotid artery IMT, and increased parity was associated with higher IMT values for both the common carotid artery and the internal carotid artery.
Several previous studies have reported inconsistent relationships between parity and carotid atherosclerosis. Humphries et al. found a progressive increase between parity and risk of carotid artery plaques in Dutch women aged ≥ 55 years[2]. Skilton et al observed a linear association between parity and risk of carotid artery plaques in French women aged > 45 years[7]. Wolff et al. found a U-shaped association between parity and mean and maximum common carotid IMT among women aged 45–79 years in northeast Germany[3]. Sanghavi et al. reported a U-shaped relationship between parity and the risk of subclinical coronary and aortic atherosclerosis in US women aged 30–65 years[8]. In British women aged 60–79 years, a J-shaped association was found between parity and the risk of coronary heart disease[4]. However, in Finnish women aged 45–74 years and in women aged 50–81 years from southern Germany, no significant associations were observed between parity and carotid plaques or IMT[5,6]. In the present study, we found positive associations between parity and carotid artery plaques and between parity and carotid IMT. Women with more births tended to have higher risk of carotid artery plaques than those with only one birth. Higher parity was associated with greater IMT values for both the common carotid artery and the internal carotid artery. Our results agreed with the findings of Humphries in women from the Netherlands[2].
Several reasons might explain the inconsistencies among these studies. First, the study populations were from different countries with different ethnicities, and consequently, they had specific sociodemographic characteristics, which might lead to confounding results related to the associations[9]. Second, women were enrolled at different age groups. Several studies included only elderly women, whereas some other studies included both young and old women. In addition, the composition of study population was distinct from each other. Nulliparous women constituted 21.5% of the population in the Netherlands[2], but there were 8.5% and 18.0% nulliparous women in cohorts of Germany and France[3,7], respectively. In our cohort, the majority were women with parity of one (73.8%), which might be because of specific one-child birth control policies in China.
The present study has several limitations. First, the study participants comprised women from northern China and had specific sociodemographic characteristics; hence, the findings might not be generalized to other districts and countries. Second, there were particular family planning policies in China during the study period, such as one-child policy; therefore, the composition of study population was different from other cohorts, which might cause unavoidable bias. In addition, reproductive factors, including miscarriage, abortions, breastfeeding, pre-eclampsia, and gestational hypertension, were not assessed in the present study. Finally, the cross-sectional study design might overlook some ongoing changes in carotid IMT.
In conclusion, we found there were positive associations between parity and carotid atherosclerosis in Chinese women. Increased parity conferred more risk of developing carotid plaques and higher values of carotid IMT, suggesting that multiparous women may experience more atherosclerotic burden.
Table S2. Baseline characteristics of participants stratified by parity
Characteristics Overall Parity groups P value 0 1 2 3 ≥ 4 Number, n (%) 3,409 23 2,498 633 186 69 Age, year 52.5 ± 8.9 46.4 ± 5.1 49.2 ± 6.34 59.4 ± 7.3 66.5 ± 6.9 71.9 ± 6.9 < 0.001 Age at menopause, year 58.4 ± 7.4 52.9 ± 5.3 54.5 ± 5.4 61.4 ± 5.6 66.3 ± 5.7 72.3 ± 6.2 < 0.001 BMI, kg/m2 24.5 ± 3.4 22.7 ± 2.2 24.2 ± 3.3 25.2 ± 3.5 25.3 ± 3.7 25.2 ± 3.4 < 0.001 Current smoking, n (%) 93 (2.7) 1 (4.4) 57 (2.3) 20 (3.2) 10 (5.4) 5 (7.2) 0.013 Alcohol use, n (%)* 86 (2.5) 2 (8.7) 71 (2.8) 13 (2.1) 0 0 0.011 Physical activity, n (%) < 0.001 Inactive 1,115 (32.7) 9 (39.1) 831 (33.3) 196 (31.0) 62 (33.3) 17 (24.6) Moderate active 652 (19.1) 2 (8.7) 535 (21.4) 74 (11.7) 29 (15.6) 12 (17.4) Active 1,642 (48.2) 12 (52.2) 1,132 (45.3) 363 (57.4) 95 (51.1) 40 (58.0) Hypertension, n (%) 1,216 (35.7) 6 (26.1) 720 (28.8) 331 (52.3) 115 (61.8) 44 (63.8) < 0.001 Diabetes mellitus, n (%) 304 (8.9) 0 168 (6.7) 92 (14.5) 32 (17.2) 12 (17.4) < 0.001 Dyslipidemia, n (%) 1,440 (42.2) 6 (26.1) 960 (38.4) 320 (50.6) 115 (61.8) 39 (56.5) < 0.001 Antihypertensive medication, n (%) 592 (17.42) 2 (8.7) 301 (12.1) 189 (29.9) 69 (37.1) 33 (47.8) < 0.001 Insulin or oral hypoglycemic drug, n (%) 178 (5.22) 0 91 (3.6) 61 (9.6) 17 (9.1) 9 (13.0) < 0.001 Antilipemic agent, n (%)* 72 (2.11) 0 41 (1.6) 17 (2.7) 12 (6.5) 2 (2.9) 0.002 Oral contraceptives, n (%) 119 (3.5) 0 67 (2.7) 32 (5.1) 11 (5.9) 9 (13.0) < 0.001 Estrogen replacement therapy, n (%)* 33 (1.7) 0 26 (2.2) 5 (1.0) 2 (1.2) 0 0.415 Education level, n (%) < 0.001 Illiteracy/primary school 281 (8.2) 1 (4.4) 76 (3.0) 129 (20.4) 46 (24.7) 29 (42.0) Middle/high school 2,195 (64.4) 8 (34.8) 1,588 (63.6) 444 (70.1) 121 (65.1) 34 (49.3) College or above 933 (27.4) 14 (60.9) 834 (33.4) 60 (9.5) 19 (10.2) 6 (8.7) Income, ¥/month, n (%) < 0.001 ≤ ¥3,000 2,454 (72.0) 10 (43.5) 1,721 (68.9) 511 (80.7) 155 (83.3) 57 (82.6) ¥3,001–5,000 824 (24.2) 11 (47.8) 670 (26.8) 105 (16.6) 27 (14.5) 11 (15.9) > ¥5,000 131 (3.8) 2 (8.7) 107 (4.3) 17 (2.7) 4 (2.2) 1 (1.5) Plaques, n (%) 854 (25.1) 1 (4.4) 484 (19.4) 215 (34.0) 103 (55.4) 51 (73.9) < 0.001 Mean common carotid IMT, mm 0.72 ± 0.13 0.66 ± 0.07 0.70 ± 0.11 0.76 ± 0.13 0.84 ± 0.14 0.86 ± 0.13 < 0.001 Mean internal carotid IMT, mm 0.65 ± 0.09 0.62 ± 0.08 0.63 ± 0.08 0.67 ± 0.10 0.69 ± 0.10 0.73 ± 0.10 < 0.001 Note. *Use Fisher's exact test. Table S3. Association between parity and carotid artery IMT
Parity Model 1 Model 2 Model 3 Model 4 β (SE) P value β (SE) P value β (SE) P value β (SE) P value common carotid IMT 0 −0.043 (0.025) 0.084 −0.042 (0.024) 0.083 −0.035 (0.023) 0.136 −0.026 (0.023) 0.272 1 0 0 0 0 2 0.062 (0.005) < 0.001 0.017 (0.006) 0.003 0.010 (0.006) 0.077 0.005 (0.006) 0.373 3 0.136 (0.009) < 0.001 0.056 (0.010) < 0.001 0.046 (0.010) < 0.001 0.040 (0.010) < 0.001 ≥ 4 0.160 (0.015) < 0.001 0.072 (0.015) < 0.001 0.065 (0.015) < 0.001 0.055 (0.015) < 0.001 Per birth 0.058 (0.003) < 0.001 0.023 (0.004) < 0.001 0.019 (0.003) < 0.001 0.016 (0.003) < 0.001 internal carotid IMT 0 −0.013 (0.019) 0.489 −0.013 (0.019) 0.503 −0.010 (0.019) 0.588 −0.002 (0.019) 0.924 1 0 0 0 0 2 0.037 (0.004) < 0.001 0.019 (0.005) < 0.001 0.016 (0.005) < 0.001 0.010 (0.005) 0.046 3 0.059 (0.008) < 0.001 0.028 (0.009) 0.002 0.024 (0.009) 0.006 0.018 (0.009) 0.043 ≥ 4 0.092 (0.014) < 0.001 0.056 (0.015) < 0.001 0.053 (0.015) < 0.001 0.044 (0.015) 0.003 Per birth 0.030 (0.003) < 0.001 0.016 (0.003) < 0.001 0.014 (0.003) < 0.001 0.010 (0.003) 0.001 Note. Model 1: unadjusted; Model 2: adjusted for age; Model 3: adjusted for age, hypertension, diabetes mellitus and dyslipidemia; Model 4: adjusted for age, hypertension, diabetes mellitus, dyslipidemia, education level, income, current smoking, alcohol use, BMI, physical activity, antihypertensive medication, insulin or oral hypoglycemic drug, antilipemic agent, and oral contraceptives. 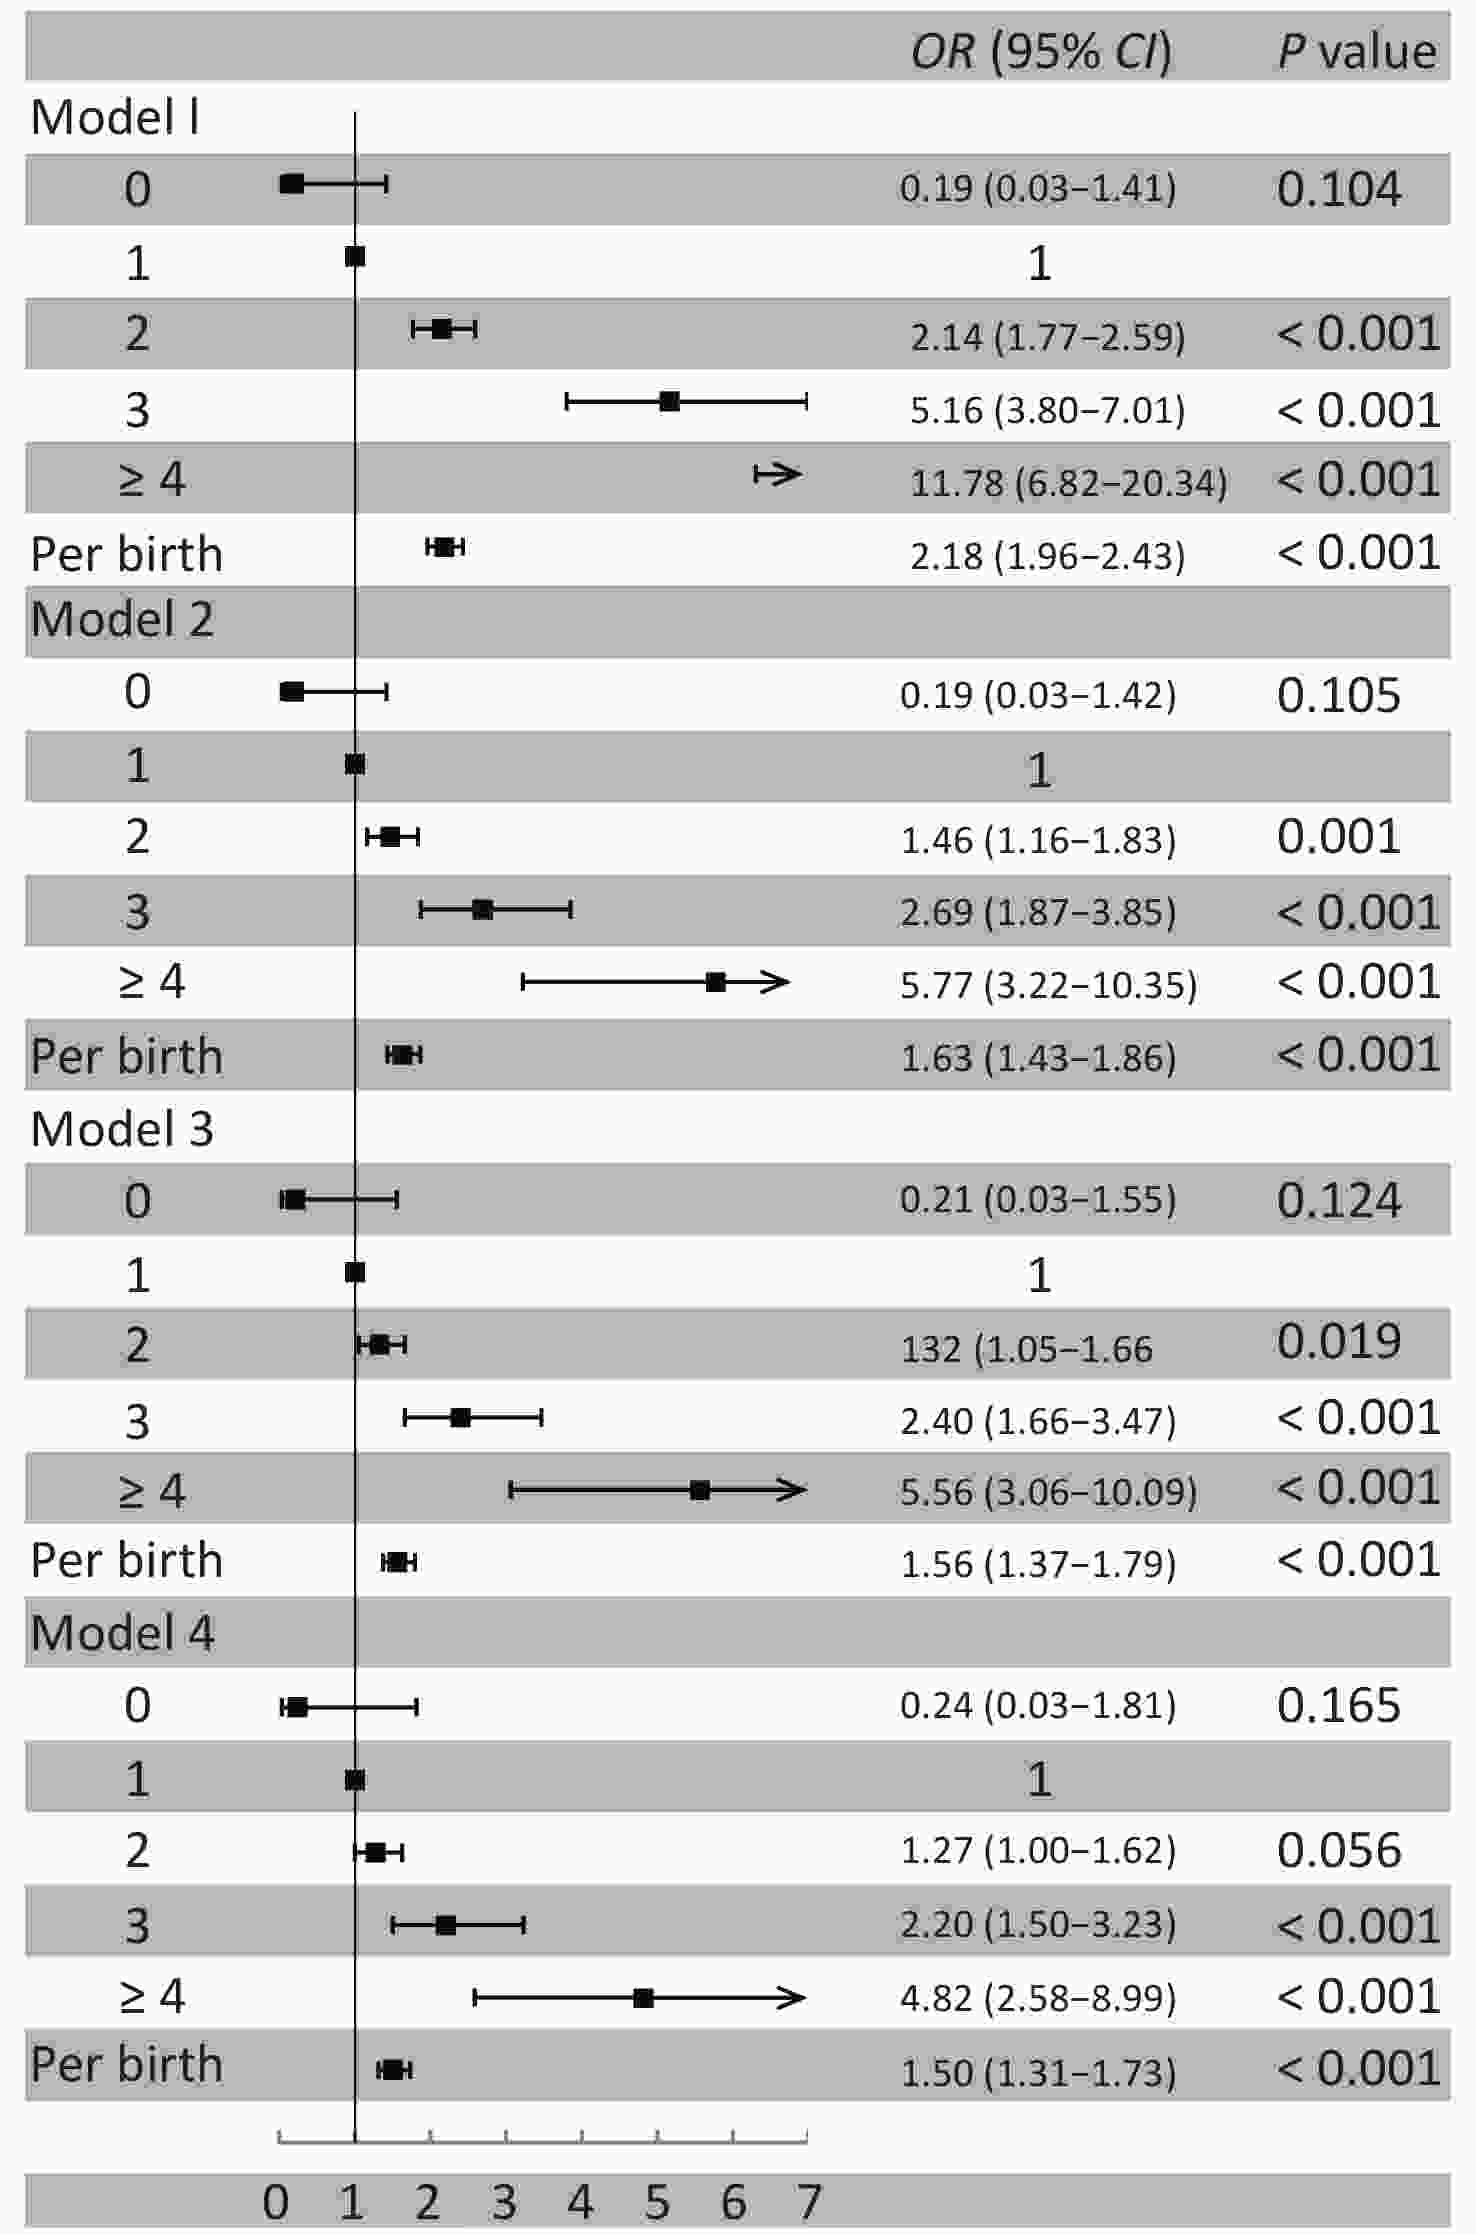
Figure S1. Association between parity and carotid artery plaques. Model 1: unadjusted; Model 2: adjusted for age; Model 3: adjusted for age, hypertension, diabetes mellitus and dyslipidemia; Model 4: adjusted for age, hypertension, diabetes mellitus, dyslipidemia, education level, income, current smoking, alcohol use, BMI, physical activity, antihypertensive medication, insulin or oral hypoglycemic drug, antilipemic agent, and oral contraceptives
-
Acknowledgments We thank all enrolled participants and their family members. We also thank Dr. Honghuang Lin (Boston University School of Medicine) for the critical review of the manuscript.
doi: 10.3967/bes2021.056
Association between Parity, Carotid Plaques, and Intima Media Thickness in Northern Chinese Women
-
-
Figure 1. Association between parity and carotid artery plaques. Model 1: unadjusted; Model 2: adjusted for age; Model 3: adjusted for age, hypertension, diabetes mellitus and dyslipidemia; Model 4: adjusted for age, hypertension, diabetes mellitus, dyslipidemia, education level, income, current smoking, alcohol use, BMI, physical activity, antihypertensive medication, insulin or oral hypoglycemic drug, antilipemic agent, and oral contraceptives
S1. Association between parity and carotid artery plaques. Model 1: unadjusted; Model 2: adjusted for age; Model 3: adjusted for age, hypertension, diabetes mellitus and dyslipidemia; Model 4: adjusted for age, hypertension, diabetes mellitus, dyslipidemia, education level, income, current smoking, alcohol use, BMI, physical activity, antihypertensive medication, insulin or oral hypoglycemic drug, antilipemic agent, and oral contraceptives
S1. Parity distribution in this study
Parity Frequency Percentage Cumulative frequency Cumulative percentage 0 23 0.67 23 0.67 1 2,498 73.28 2,521 73.95 2 633 18.57 3,154 92.52 3 186 5.46 3,340 97.98 4 53 1.55 3,393 99.53 5 13 0.38 3,406 99.91 6 2 0.06 3,408 99.97 7 1 0.03 3,409 100.00  下载: 导出CSV
Table 1. Baseline characteristics of participants stratified by parity
Characteristics Overall Parity group P value 1 2 3 ≥ 4 Number, n (%) 3,386 2,498 633 186 69 Age, year 52.5 ± 8.9 49.2 ± 6.3 59.4 ± 7.3 66.5 ± 6.9 71.9 ± 6.9 < 0.001 Age at menopause, year 58.4 ± 7.4 54.5 ± 5.4 61.4 ± 5.6 66.3 ± 5.9 72.3 ± 6.2 < 0.001 BMI, kg/m2 24.5 ± 3.4 24.2 ± 3.3 25.2 ± 3.5 25.3 ± 3.7 25.2 ± 3.4 < 0.001 Current smoking, n (%) 92 (2.7) 57 (2.3) 20 (3.2) 10 (5.4) 5 (7.3) 0.006 Alcohol use, n (%) 84 (2.5) 71 (2.8) 13 (2.1) 0 0 0.025 Physical activity, n (%) < 0.001 Inactive 1,106 (32.7) 831 (33.3) 196 (31.0) 62 (33.3) 17 (24.6) Moderate active 650 (19.2) 535 (21.4) 74 (11.7) 29 (15.6) 12 (17.4) Active 1,630 (48.1) 1,132 (45.3) 363 (57.4) 95 (51.1) 40 (58.0) Hypertension, n (%) 1,210 (35.7) 720 (28.8) 331 (52.3) 115 (61.8) 44 (63.8) < 0.001 Diabetes mellitus, n (%) 304 (9.0) 168 (6.7) 92 (14.5) 32 (17.2) 12 (17.4) < 0.001 Dyslipidemia, n (%) 1434 (42.4) 960 (38.4) 320 (50.6) 115 (61.8) 39 (56.5) < 0.001 Antihypertensive medication, n (%) 592 (27.8) 301 (21.1) 189 (37.1) 69 (48.3) 33 (67.4) < 0.001 Insulin or oral hypoglycemic drug, n (%) 178 (9.5) 91 (7.1) 61 (13.4) 17 (16.0) 9 (31.0) < 0.001 Antilipemic agent, n (%) 72 (2.1) 41 (1.6) 17 (2.7) 12 (6.5) 2 (2.9) < 0.001 Oral contraceptives, n (%) 119 (7.4) 67 (5.3) 32 (15.2) 11 (12.1) 9 (17.3) < 0.001 Estrogen replacement therapy, n (%) 33 (1.7) 26 (2.2) 5 (1.0) 2 (1.2) 0 0.361 Education level, n (%) < 0.001 Illiteracy/primary school 280 (8.3) 76 (3.0) 129 (20.4) 46 (24.7) 29 (42.0) Middle/high school 2,187 (64.6) 1,588 (63.6) 444 (70.1) 121 (65.1) 34 (49.3) College or above 919 (27.1) 834 (33.4) 60 (9.5) 19 (10.2) 6 (8.7) Income, ¥/month, n (%) < 0.001 ≤ ¥3,000 2,444 (72.2) 1721 (68.9) 511 (80.7) 155 (83.3) 57 (82.6) ¥3,001–5,000 813 (24.0) 670 (26.8) 105 (16.6) 27 (14.5) 11 (15.9) > ¥5,000 129 (3.8) 107 (4.3) 17 (2.7) 4 (2.2) 1 (1.5) Plaques, n (%) 853 (25.2) 484 (19.4) 215 (34.0) 103 (55.4) 51 (73.9) < 0.001 Mean common carotid IMT, mm 0.72 ± 0.13 0.70 ± 0.11 0.76 ± 0.13 0.84 ± 0.14 0.86 ± 0.13 < 0.001 Mean internal carotid IMT, mm 0.65 ± 0.09 0.63 ± 0.08 0.67 ± 0.10 0.69 ± 0.10 0.73 ± 0.10 < 0.001
下载: 导出CSV
Table 2. Association between parity and carotid artery IMT
Parity Model 1 Model 2 Model 3 Model 4 β (SE) P value β (SE) P value β (SE) P value β (SE) P value Common carotid IMT 1 0 0 0 0 2 0.062 (0.005) < 0.001 0.017 (0.006) 0.003 0.010 (0.006) 0.086 0.005 (0.006) 0.393 3 0.136 (0.009) < 0.001 0.056 (0.010) < 0.001 0.046 (0.010) < 0.001 0.039 (0.010) < 0.001 ≥ 4 0.160 (0.015) < 0.001 0.072 (0.015) < 0.001 0.065 (0.015) < 0.001 0.055 (0.015) < 0.001 Per birth 0.061 (0.003) < 0.001 0.024 (0.004) < 0.001 0.020 (0.004) < 0.001 0.016 (0.004) < 0.001 Internal carotid IMT 1 0 0 0 0 2 0.037 (0.004) < 0.001 0.019 (0.005) < 0.001 0.016 (0.005) < 0.001 0.010 (0.005) 0.043 3 0.059 (0.008) < 0.001 0.028 (0.009) 0.002 0.024 (0.009) 0.006 0.018 (0.009) 0.041 ≥ 4 0.092 (0.014) < 0.001 0.057 (0.015) < 0.001 0.053 (0.015) < 0.001 0.044 (0.015) 0.003 Per birth 0.032 (0.003) < 0.001 0.017 (0.003) < 0.001 0.015 (0.003) < 0.001 0.011 (0.003) < 0.001 Note. Model 1: unadjusted; Model 2: adjusted for age; Model 3: adjusted for age, hypertension, diabetes mellitus and dyslipidemia; Model 4: adjusted for age, hypertension, diabetes mellitus, dyslipidemia, education level, income, current smoking, alcohol use, BMI, physical activity, antihypertensive medication, insulin or oral hypoglycemic drug, antilipemic agent, and oral contraceptives. IMT, intima-media thickness.
下载: 导出CSV
S2. Baseline characteristics of participants stratified by parity
Characteristics Overall Parity groups P value 0 1 2 3 ≥ 4 Number, n (%) 3,409 23 2,498 633 186 69 Age, year 52.5 ± 8.9 46.4 ± 5.1 49.2 ± 6.34 59.4 ± 7.3 66.5 ± 6.9 71.9 ± 6.9 < 0.001 Age at menopause, year 58.4 ± 7.4 52.9 ± 5.3 54.5 ± 5.4 61.4 ± 5.6 66.3 ± 5.7 72.3 ± 6.2 < 0.001 BMI, kg/m2 24.5 ± 3.4 22.7 ± 2.2 24.2 ± 3.3 25.2 ± 3.5 25.3 ± 3.7 25.2 ± 3.4 < 0.001 Current smoking, n (%) 93 (2.7) 1 (4.4) 57 (2.3) 20 (3.2) 10 (5.4) 5 (7.2) 0.013 Alcohol use, n (%)* 86 (2.5) 2 (8.7) 71 (2.8) 13 (2.1) 0 0 0.011 Physical activity, n (%) < 0.001 Inactive 1,115 (32.7) 9 (39.1) 831 (33.3) 196 (31.0) 62 (33.3) 17 (24.6) Moderate active 652 (19.1) 2 (8.7) 535 (21.4) 74 (11.7) 29 (15.6) 12 (17.4) Active 1,642 (48.2) 12 (52.2) 1,132 (45.3) 363 (57.4) 95 (51.1) 40 (58.0) Hypertension, n (%) 1,216 (35.7) 6 (26.1) 720 (28.8) 331 (52.3) 115 (61.8) 44 (63.8) < 0.001 Diabetes mellitus, n (%) 304 (8.9) 0 168 (6.7) 92 (14.5) 32 (17.2) 12 (17.4) < 0.001 Dyslipidemia, n (%) 1,440 (42.2) 6 (26.1) 960 (38.4) 320 (50.6) 115 (61.8) 39 (56.5) < 0.001 Antihypertensive medication, n (%) 592 (17.42) 2 (8.7) 301 (12.1) 189 (29.9) 69 (37.1) 33 (47.8) < 0.001 Insulin or oral hypoglycemic drug, n (%) 178 (5.22) 0 91 (3.6) 61 (9.6) 17 (9.1) 9 (13.0) < 0.001 Antilipemic agent, n (%)* 72 (2.11) 0 41 (1.6) 17 (2.7) 12 (6.5) 2 (2.9) 0.002 Oral contraceptives, n (%) 119 (3.5) 0 67 (2.7) 32 (5.1) 11 (5.9) 9 (13.0) < 0.001 Estrogen replacement therapy, n (%)* 33 (1.7) 0 26 (2.2) 5 (1.0) 2 (1.2) 0 0.415 Education level, n (%) < 0.001 Illiteracy/primary school 281 (8.2) 1 (4.4) 76 (3.0) 129 (20.4) 46 (24.7) 29 (42.0) Middle/high school 2,195 (64.4) 8 (34.8) 1,588 (63.6) 444 (70.1) 121 (65.1) 34 (49.3) College or above 933 (27.4) 14 (60.9) 834 (33.4) 60 (9.5) 19 (10.2) 6 (8.7) Income, ¥/month, n (%) < 0.001 ≤ ¥3,000 2,454 (72.0) 10 (43.5) 1,721 (68.9) 511 (80.7) 155 (83.3) 57 (82.6) ¥3,001–5,000 824 (24.2) 11 (47.8) 670 (26.8) 105 (16.6) 27 (14.5) 11 (15.9) > ¥5,000 131 (3.8) 2 (8.7) 107 (4.3) 17 (2.7) 4 (2.2) 1 (1.5) Plaques, n (%) 854 (25.1) 1 (4.4) 484 (19.4) 215 (34.0) 103 (55.4) 51 (73.9) < 0.001 Mean common carotid IMT, mm 0.72 ± 0.13 0.66 ± 0.07 0.70 ± 0.11 0.76 ± 0.13 0.84 ± 0.14 0.86 ± 0.13 < 0.001 Mean internal carotid IMT, mm 0.65 ± 0.09 0.62 ± 0.08 0.63 ± 0.08 0.67 ± 0.10 0.69 ± 0.10 0.73 ± 0.10 < 0.001 Note. *Use Fisher's exact test.
下载: 导出CSV
S3. Association between parity and carotid artery IMT
Parity Model 1 Model 2 Model 3 Model 4 β (SE) P value β (SE) P value β (SE) P value β (SE) P value common carotid IMT 0 −0.043 (0.025) 0.084 −0.042 (0.024) 0.083 −0.035 (0.023) 0.136 −0.026 (0.023) 0.272 1 0 0 0 0 2 0.062 (0.005) < 0.001 0.017 (0.006) 0.003 0.010 (0.006) 0.077 0.005 (0.006) 0.373 3 0.136 (0.009) < 0.001 0.056 (0.010) < 0.001 0.046 (0.010) < 0.001 0.040 (0.010) < 0.001 ≥ 4 0.160 (0.015) < 0.001 0.072 (0.015) < 0.001 0.065 (0.015) < 0.001 0.055 (0.015) < 0.001 Per birth 0.058 (0.003) < 0.001 0.023 (0.004) < 0.001 0.019 (0.003) < 0.001 0.016 (0.003) < 0.001 internal carotid IMT 0 −0.013 (0.019) 0.489 −0.013 (0.019) 0.503 −0.010 (0.019) 0.588 −0.002 (0.019) 0.924 1 0 0 0 0 2 0.037 (0.004) < 0.001 0.019 (0.005) < 0.001 0.016 (0.005) < 0.001 0.010 (0.005) 0.046 3 0.059 (0.008) < 0.001 0.028 (0.009) 0.002 0.024 (0.009) 0.006 0.018 (0.009) 0.043 ≥ 4 0.092 (0.014) < 0.001 0.056 (0.015) < 0.001 0.053 (0.015) < 0.001 0.044 (0.015) 0.003 Per birth 0.030 (0.003) < 0.001 0.016 (0.003) < 0.001 0.014 (0.003) < 0.001 0.010 (0.003) 0.001 Note. Model 1: unadjusted; Model 2: adjusted for age; Model 3: adjusted for age, hypertension, diabetes mellitus and dyslipidemia; Model 4: adjusted for age, hypertension, diabetes mellitus, dyslipidemia, education level, income, current smoking, alcohol use, BMI, physical activity, antihypertensive medication, insulin or oral hypoglycemic drug, antilipemic agent, and oral contraceptives.
下载: 导出CSV
-
[1] Fraser A, Nelson SM, Macdonald-Wallis C, et al. Associations of pregnancy complications with calculated cardiovascular disease risk and cardiovascular risk factors in middle age: The Avon Longitudinal Study of Parents and Children. Circulation, 2012; 125, 1367−80. doi: 10.1161/CIRCULATIONAHA.111.044784 [2] Humphries KH, Westendorp IC, Bots ML, et al. Parity and carotid artery atherosclerosis in elderly women: the Rotterdam Study. Stroke, 2001; 32, 2259−64. doi: 10.1161/hs1001.097224 [3] Wolff B, Volzke H, Robinson D, et al. Relation of parity with common carotid intima-media thickness among women of the Study of Health in Pomerania. Stroke, 2005; 36, 938−43. doi: 10.1161/01.STR.0000162712.27799.20 [4] Lawlor DA, Emberson JR, Ebrahim S, et al. Is the association between parity and coronary heart disease due to biological effects of pregnancy or adverse lifestyle risk factors associated with child-rearing? Circulation, 2003; 107, 1260−4. doi: 10.1161/01.CIR.0000053441.43495.1A [5] Kharazmi E, Moilanen L, Fallah M, et al. Reproductive history and carotid intima-media thickness. Acta Obstet Gynecol Scand, 2007; 86, 995−1002. doi: 10.1080/00016340701464374 [6] Stöckl D, Peters A, Thorand B, et al. Reproductive factors, intima media thickness and carotid plaques in a cross-sectional study of postmenopausal women enrolled in the population-based KORA F4 study. BMC Womens Health, 2014; 14, 17. doi: 10.1186/1472-6874-14-17 [7] Skilton MR, Serusclat A, Begg LM, et al. Parity and carotid atherosclerosis in men and women: insights into the roles of childbearing and child-rearing. Stroke, 2009; 40, 1152−7. doi: 10.1161/STROKEAHA.108.535807 [8] Sanghavi M, Kulinski J, Ayers CR, et al. Association between number of live births and markers of subclinical atherosclerosis: The Dallas Heart Study. Eur J Prev Cardiol, 2016; 23, 391−9. doi: 10.1177/2047487315571891 [9] Mathieu RAt, Powell-Wiley TM, Ayers CR, et al. Physical activity participation, health perceptions, and cardiovascular disease mortality in a multiethnic population: The Dallas Heart Study. Am Heart J, 2012; 163, 1037−40. doi: 10.1016/j.ahj.2012.03.005 -

 点击查看大图
计量
- 文章访问数: 930
- HTML全文浏览量: 581
- PDF下载量: 40
- 被引次数: 0

 Quick Links