

 下载:
下载:

-
Most (> 90%) eukaryotic translation involves a cap-dependent initiation mechanism. However, under cellular stress and viral infection conditions, an alternative mechanism based on internal ribosome entry sites (IRESs) initiates 10% of mRNA translation. IRES-mediated translation is an important mode of alternative translation initiation for cellular mRNAs that has been implicated in the regulation of gene expression under different physiological conditions[1, 2]. IRESs are structured regions of RNA that directly recruit eukaryotic ribosomes and initiate translation in a cap-independent manner. IRESs were first discovered in viruses of the Picornaviridae family, such as poliovirus and encephalomyocarditis virus (EMCV)[3, 4]. Beyond being located in the 5′-UTRs of eukaryotic mRNA, as is typical viral IRESs[5-7], some IRESs are found in the coding regions of eukaryotic genes, such as PRNP[5], 14-3-3[8], CACNA1A[9], CDK11[10], p53[11], TDP2 p58(PITSLRE)[12], and Notch2[13]. Multiple reports have shown that viral protein translation is driven by IRESs in the coding regions of viral genomes. The RNA genomes of HIV-1 and HIV-2 contain two IRESs. One IRES in the coding region of HIV-1 gag initiates the expression of a novel Gag isoform[14]. The other IRES, located in the coding region of HIV-2 Gag, mediates the expression of three isoforms (57, 50, and 44 kD). The IRES in the coding region of murine hepatitis virus mRNA 5 mediates the translation of open reading frame (ORF) 5b[15]. Our previous study has shown that multiple putative IRESs are located in the coding region of the Human Rhinovirus 16 (HRV16) genome[16].
To understand whether IRESs are present in the CVB3 coding region, we fused the P1, P2, or P3 gene with the green fluorescent protein (GFP) gene. After transfection, possible IRES-driven proteins were preliminarily assessed by western blotting with antibodies to GFP. Subsequently, potential IRESs were inserted into a specific bicistronic vector with a hairpin between Renilla luciferase (Rluc) and Firefly luciferase (Fluc). After transfection, the presence of IRESs was determined according to the Fluc/Rluc activity ratio. Cryptic promoters of IRESs were excluded through RT-qPCR.
-
Human embryonic kidney (HEK 293T) and baby hamster kidney (BHK-21) cells were cultured with Dulbecco's modified Eagle's medium (Gibco) containing 10% fetal bovine serum (Gibco), penicillin-streptomycin (Hyclone) and glutamine (Hyclone). The two cell lines were cultured in a humidified incubator with 5% CO2 at 37 °C.
-
The full length P1, P2, or P3 gene was fused with the N-terminus of GFP and inserted in the pEGFP-N1 vector (Invitrogen, Carlsbad, CA, USA) to assess potential IRES-dependent protein translation in the P1, P2, or P3 coding region. To screen IRESs in the coding region of the CVB3 genome, we cloned each sequence from each ATG to the end of P1, P2, and P3 into the pEGFP-N1 vector up stream of GFP via the Hind III and Sac II restriction enzyme sites to generate plasmids pP1 (735–3304), pP1 (1235–3304), pP1 (1343–3304), pP1 (1478–3304), pP1 (1559–3304), pP1 (1697–3304), pP1 (1751–3304), pP1 (1811–3304), pP1 (2093–3304), pP1 (2183–3304), pP1 (2984–3304), pP1 (3089–3304), pP2 (3284–5029), pP2 (3284–5029), pP2 (3671–5029), pP2 (3737–5029), pP2 (4028–5029), pP2 (4073–5029), pP2 (4364–5029), pP2 (4619–5029), pP2 (4955–5029), pP3 (4754–7297), pP3 (4955–7297), pP3 (5390–7297), pP3 (5507–7297), pP3 (4765–7297), pP3 (6134–7297), pP3 (6344–7297), pP3 (6470–7297), pP3 (6581–7297), pP3 (6770–7297), pP3 (6881–7297), and pP3 (7088–7297).
To identify IRES elements in CVB3, we introduced a hairpin structure (AGCTGGGCCGGGCGCGGCCGCGCCCGGCCAGGTAC and CTGGCCGGGCGCGGCCGCGCCCGGCCA) between the Rluc and Fluc genes in psiCHECK-2 to form a fusion gene denoted pHP-IRES-Luc. The potential IRES sequences were cloned between the hairpin structure and Fluc genes to form 22 plasmids: pP1 (735–1234), pP1 (1197–1346), pP1 (1311–1810), pP1 (2376–2876), pP1 (2784–2983), pP1 (2589–3088), pP2 (3171–3670), pP2 (3528–4027), pP2 (3864–4363), pP2 (4065–4564), pP2 (4119–4618), pP2 (4455–4954), pP3 (4890–5389), pP3 (5634–6133), pP3 (5844–6343), pP3 (5970–6469), pP3 (6270–6769), pP3 (6305–6880), pP3 (6583–7087), and pP3 (6786–7285).
To further identify the exact IRES sequences, we successively truncated the potential IRESs to 150–200 bp and cloned them between the hairpin structure and Fluc genes to form 35 plasmids: pP1 (1197–1346), pP1 (1297–1446), pP1 (1297–1446), pP1 (1397–1546), pP1 (1497–1546), pP1 (1597–1646), pP1 (1697–1810), pP1 (1311–1696), pP1 (1311–1646), pP1 (1311–1596, pP1 (1311–1546), pP1 (1311–1496), pP1 (1361–1696), pP1 (1411–1696), pP1 (1461–1696), pP1 (1511–1696), pP1 (2484–2683), pP1 (2654–2833), pP1 (2784–2983), pP2 (4065–4265), pP2 (4215–4415), pP2 (4355–4615), pP3 (4890–5090), pP3 (5040–5240), pP3 (5190–5389), pP3 (5634–5834), pP3 (5784–5984), pP3 (5934–6133), pP3 (5970–6170), pP3 (6120–6320), pP3 (6270–6470), pP3 (6420–6620), pP3 (6570–6770), pP3 (6720–6920), and pP3 (6870–7087). The positive bicistronic reporter construct contained a cap-dependent Rluc reporter gene and EMCV IRES dependent Fluc reporter gene with a hairpin structure before the Fluc gene. The negative bicistronic reporter construct contained no EMCV IRES. The above plasmids were transiently transfected into cells with X-tremeGENE HP DNA Transfection Reagent (Roche) according to the manufacturer’s protocol.
-
Protein samples were separated by SDS-PAGE and transferred to nitrocellulose membranes. The membranes were incubated with primary antibodies to GFP (GENESCL, ZL8009). Horseradish peroxidase-labeled goat anti-rabbit/mouse IgG was used as the secondary antibody after primary antibody incubation. Specific proteins were visualized with an ECL Chemiluminescence Detection Kit (PerkinElmer, USA).
-
Approximately 3 × 10⁵ BHK cells were plated in 96-well tissue culture plates 12 h before transfection. Dual luciferase assays were performed with a dual luciferase reporter assay system (Beyotime Biotechnology, China) according to the manufacturer’s protocol. Briefly, when cells reached exponential growth phase in the appropriate medium, 10 μL of 1× lysis buffer was added to the cells and incubated for 5 min. Next, 10 μL of cell lysate was transferred into 384 well plates, and 10 μL Fluc reagent was successively added to the cell lysate. The mixture was then mixed and equilibrated 10 s, and the luminescence was measured through 10 s integration with ENSPIRE (PerkinElmer, USA). This was followed by the addition of 10 μL Rluc reagent and firefly luciferase quenching, 10 s equilibration and measurement of luminescence with 10 s integration. The data are represented as the Fluc/Rluc activity ratio. The efficiency in each group was evaluated with respect to the controls.
-
Bicistronic luciferase reporter plasmids containing truncated potential IRES sequences were transfected into BHK-21 cells. Total RNA was extracted with TRIzol reagent (Sigma-Aldrich) at 24 h post transfection and reverse transcribed to cDNA with a reverse transcription kit (Takara). The primers targeting the Rluc and Fluc genes were designed with Oligo software. Fluc primer: forward 5’-GTGCCAACCCTGTTCAGCTT-3’, reverse: 5’-TCGCCCACCTCCTTAGACAG-3’; Rluc primer: forward 5’-GTGCCAACCCTGTTCAGCTT-3’, reverse: 5’-TCGCCCACCTCCTTAGACAG-3’. The mRNA of Rluc and Fluc was compared by qRT-PCR with SYBR Premix Ex Taq II (Takara).
-
The research strategies were as follows: 1) Full length sequences of the P1, P2, or P3 genome were inserted into the pEGFP-N1 vector. After transfection of the constructed plasmids, bands of multiple proteins were detected with anti-GFP western blotting. The results indicated the presence of possible IRESs initiating genomic translation. 2) The correct ORF sequences from antithymocyte globulin (ATG) to the end of the P1, P2, and P3 genomes were inserted into the above vector. Potential IRES-mediated protein translation was detected in adjacent lanes through anti-GFP western blotting[5]. 3) The potential IRES sequences before IRES-mediated protein sequences were identified through a specific bicistronic luciferase expression vector with a hairpin structure.
-
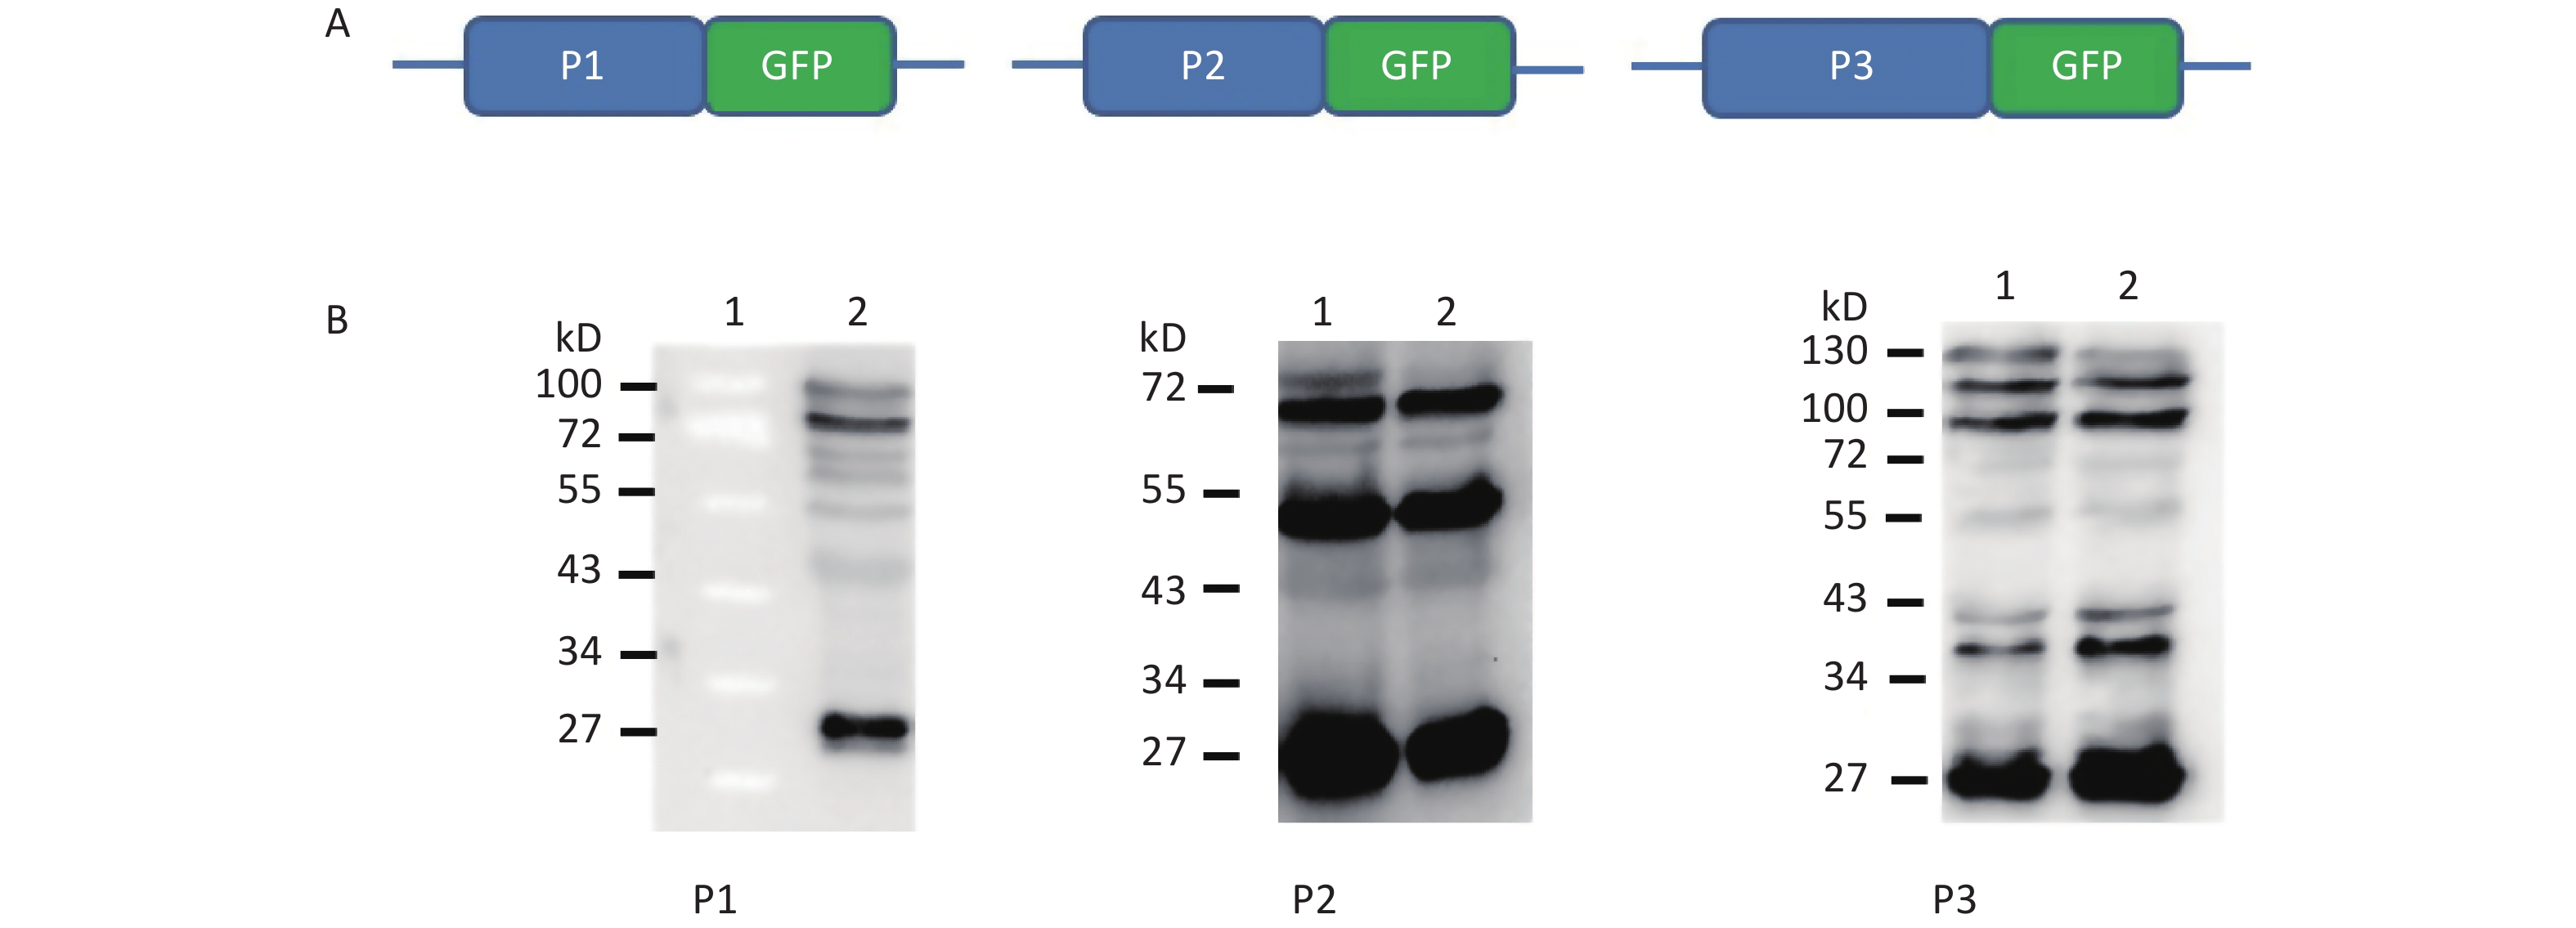
To understand whether IRES-dependent protein translation occurred in the P1, P2, or P3 coding region, we fused full length P1, P2, or P3 with the N-terminus of the GFP reporter gene. As described previously[5], if an IRES was present within the P1, P2, or P3 coding regions, IRES-mediated fusion protein bands would be detected by anti-GFP western blotting besides the full length cap-dependent translated protein. After the above P1, P2, or P3 plasmids were transfected into cells, more than nine protein bands appeared approximately 30–72 kD from the P1 plasmid, six protein bands appeared approximately 30–65 kD from the P2 plasmid, and nine protein bands appeared approximately 30–120 kD from the P3 plasmid (Figure 1B). Approximately 110 kD of cap-dependent P1 fusion protein, 80 kD of cap-dependent P2 fusion protein and 130 kD of cap-dependent P3 fusion protein appeared at the maximum molecular weight position (Figure 1). These results suggested that the P1, P2, and P3 genome sallow for cap-independent translation initiation.
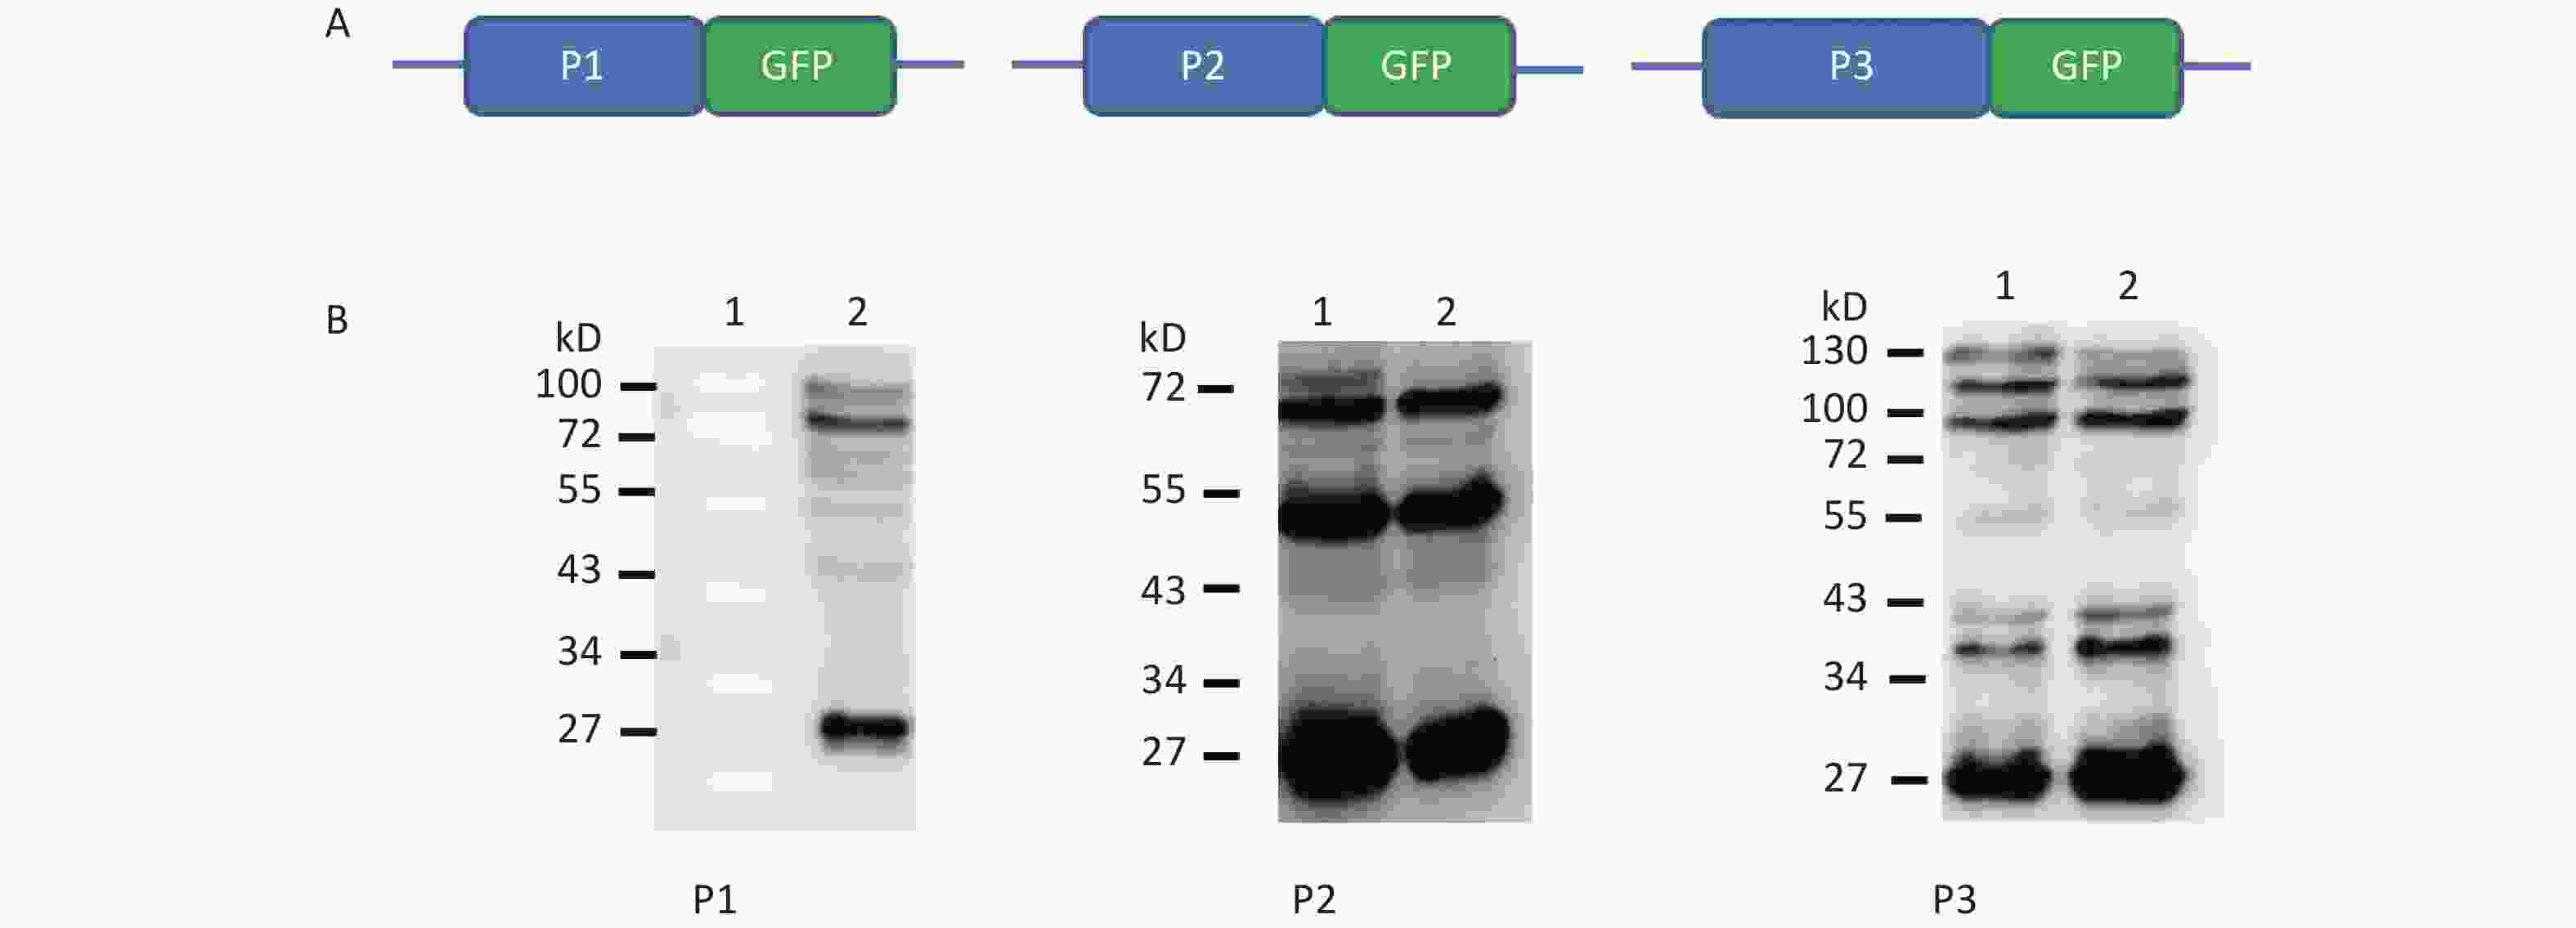
Figure 1. Possible cap-independent translation of P1, P2, and P3 genes of CVB3 in vitro. After transfection of plasmids bearing P1, P2, or P3 genes fused with GFP, nine bands in P1, six bands in P2 and nine bands in P3 were identified by anti-GFP western blotting. The protein molecular weight markers are indicated at left. GFP, green fluorescent protein.
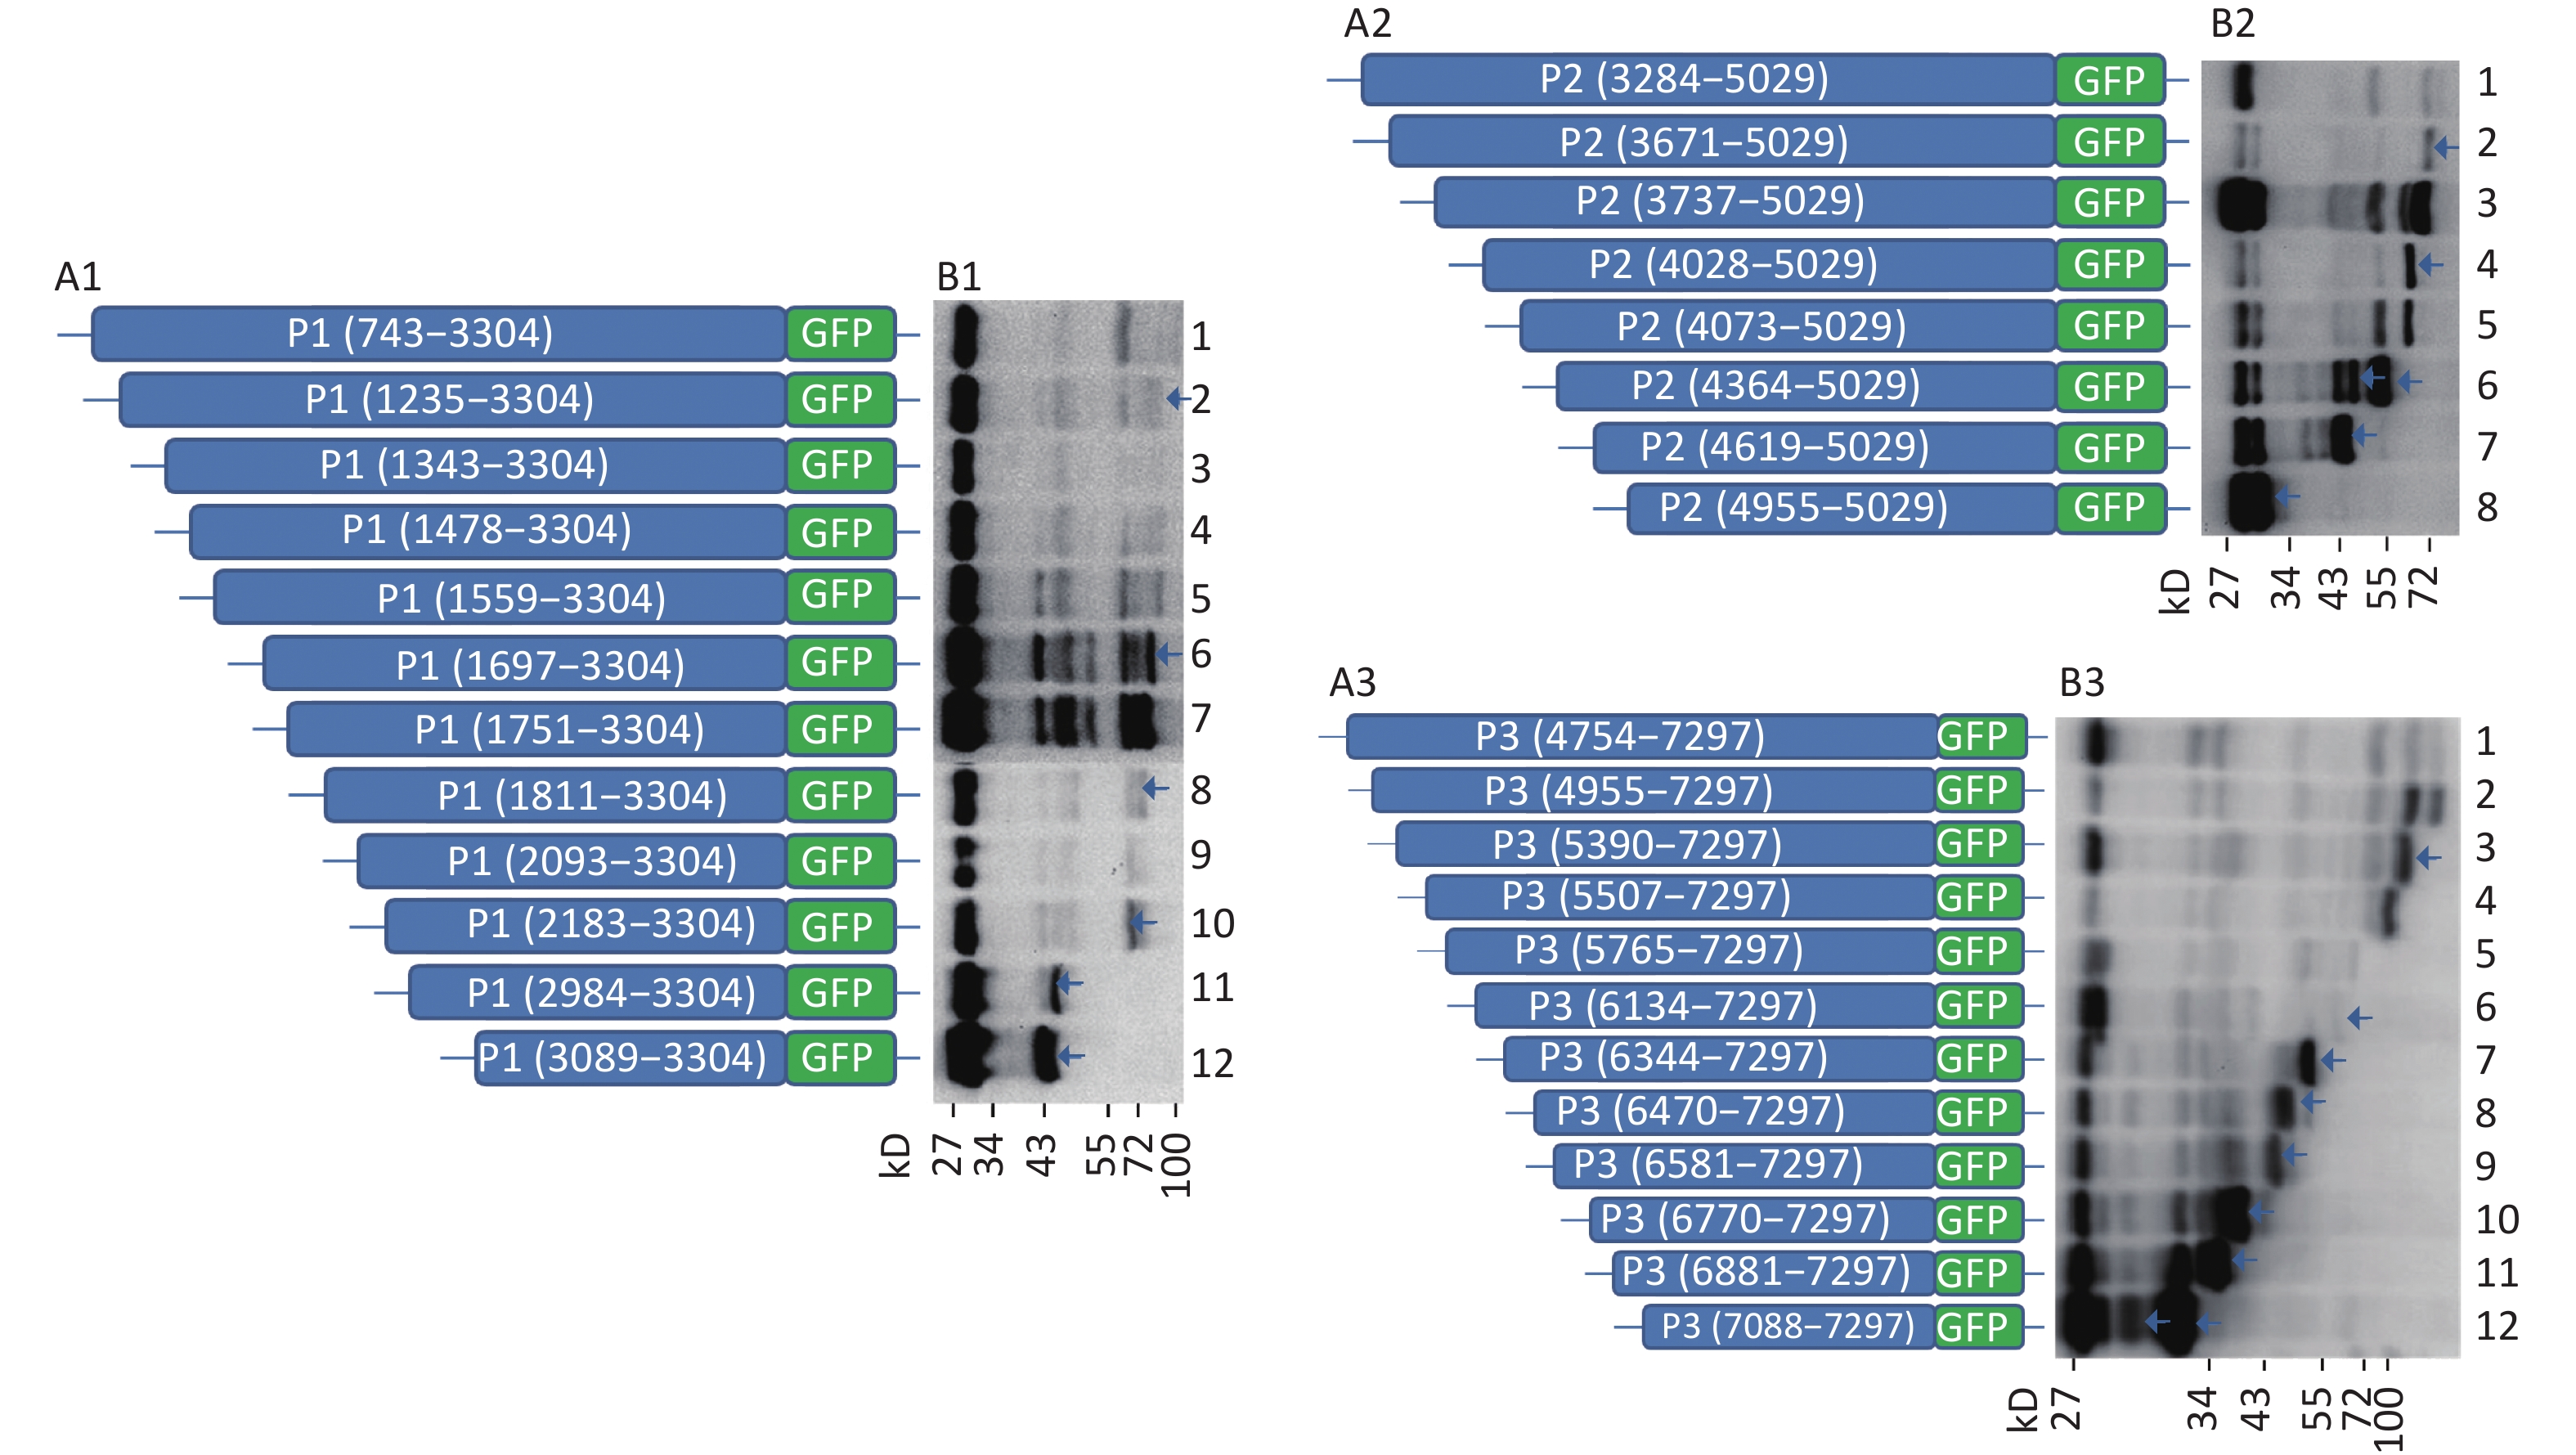
To further search for potential IRES positions in the genome of CVB3, we introduced the sequences from each start codon (ATG) to the 3’-terminus of P1, P2, or P3 into the plasmid pEGFP-N1 to form 12 plasmids containing the P1 coding region: pP1 (735–3304), pP1 (1235–3304), pP1 (1343–3304), pP1 (1478–3304), pP1 (1559–3304), pP1 (1697–3304), pP1 (1751–3304), pP1 (1811–3304), pP1 (2093–3304), pP1 (2183–3304), pP1 (2984–3304), pP1 (3089–3304); 8 plasmids containing the P2 coding region: pP2 (3284–5029), pP2 (3284–5029), pP2 (3671–5029), pP2 (3737–5029), pP2 (4028–5029), pP2 (4073–5029), pP2 (4364–5029), pP2 (4619–5029), pP2 (4955–5029); and 12 plasmids containing the P3 coding region: pP3 (4754–7297), pP3 (4955–7297), pP3 (5390–7297), pP3 (5507–7297), pP3 (4765–7297), pP3 (6134–7297), pP3 (6344–7297), pP3 (6470–7297), pP3 (6581–7297), pP3 (6770–7297), pP3 (6881–7297), and pP3 (7088–7297) (Figure 2A1, A2, and A3).
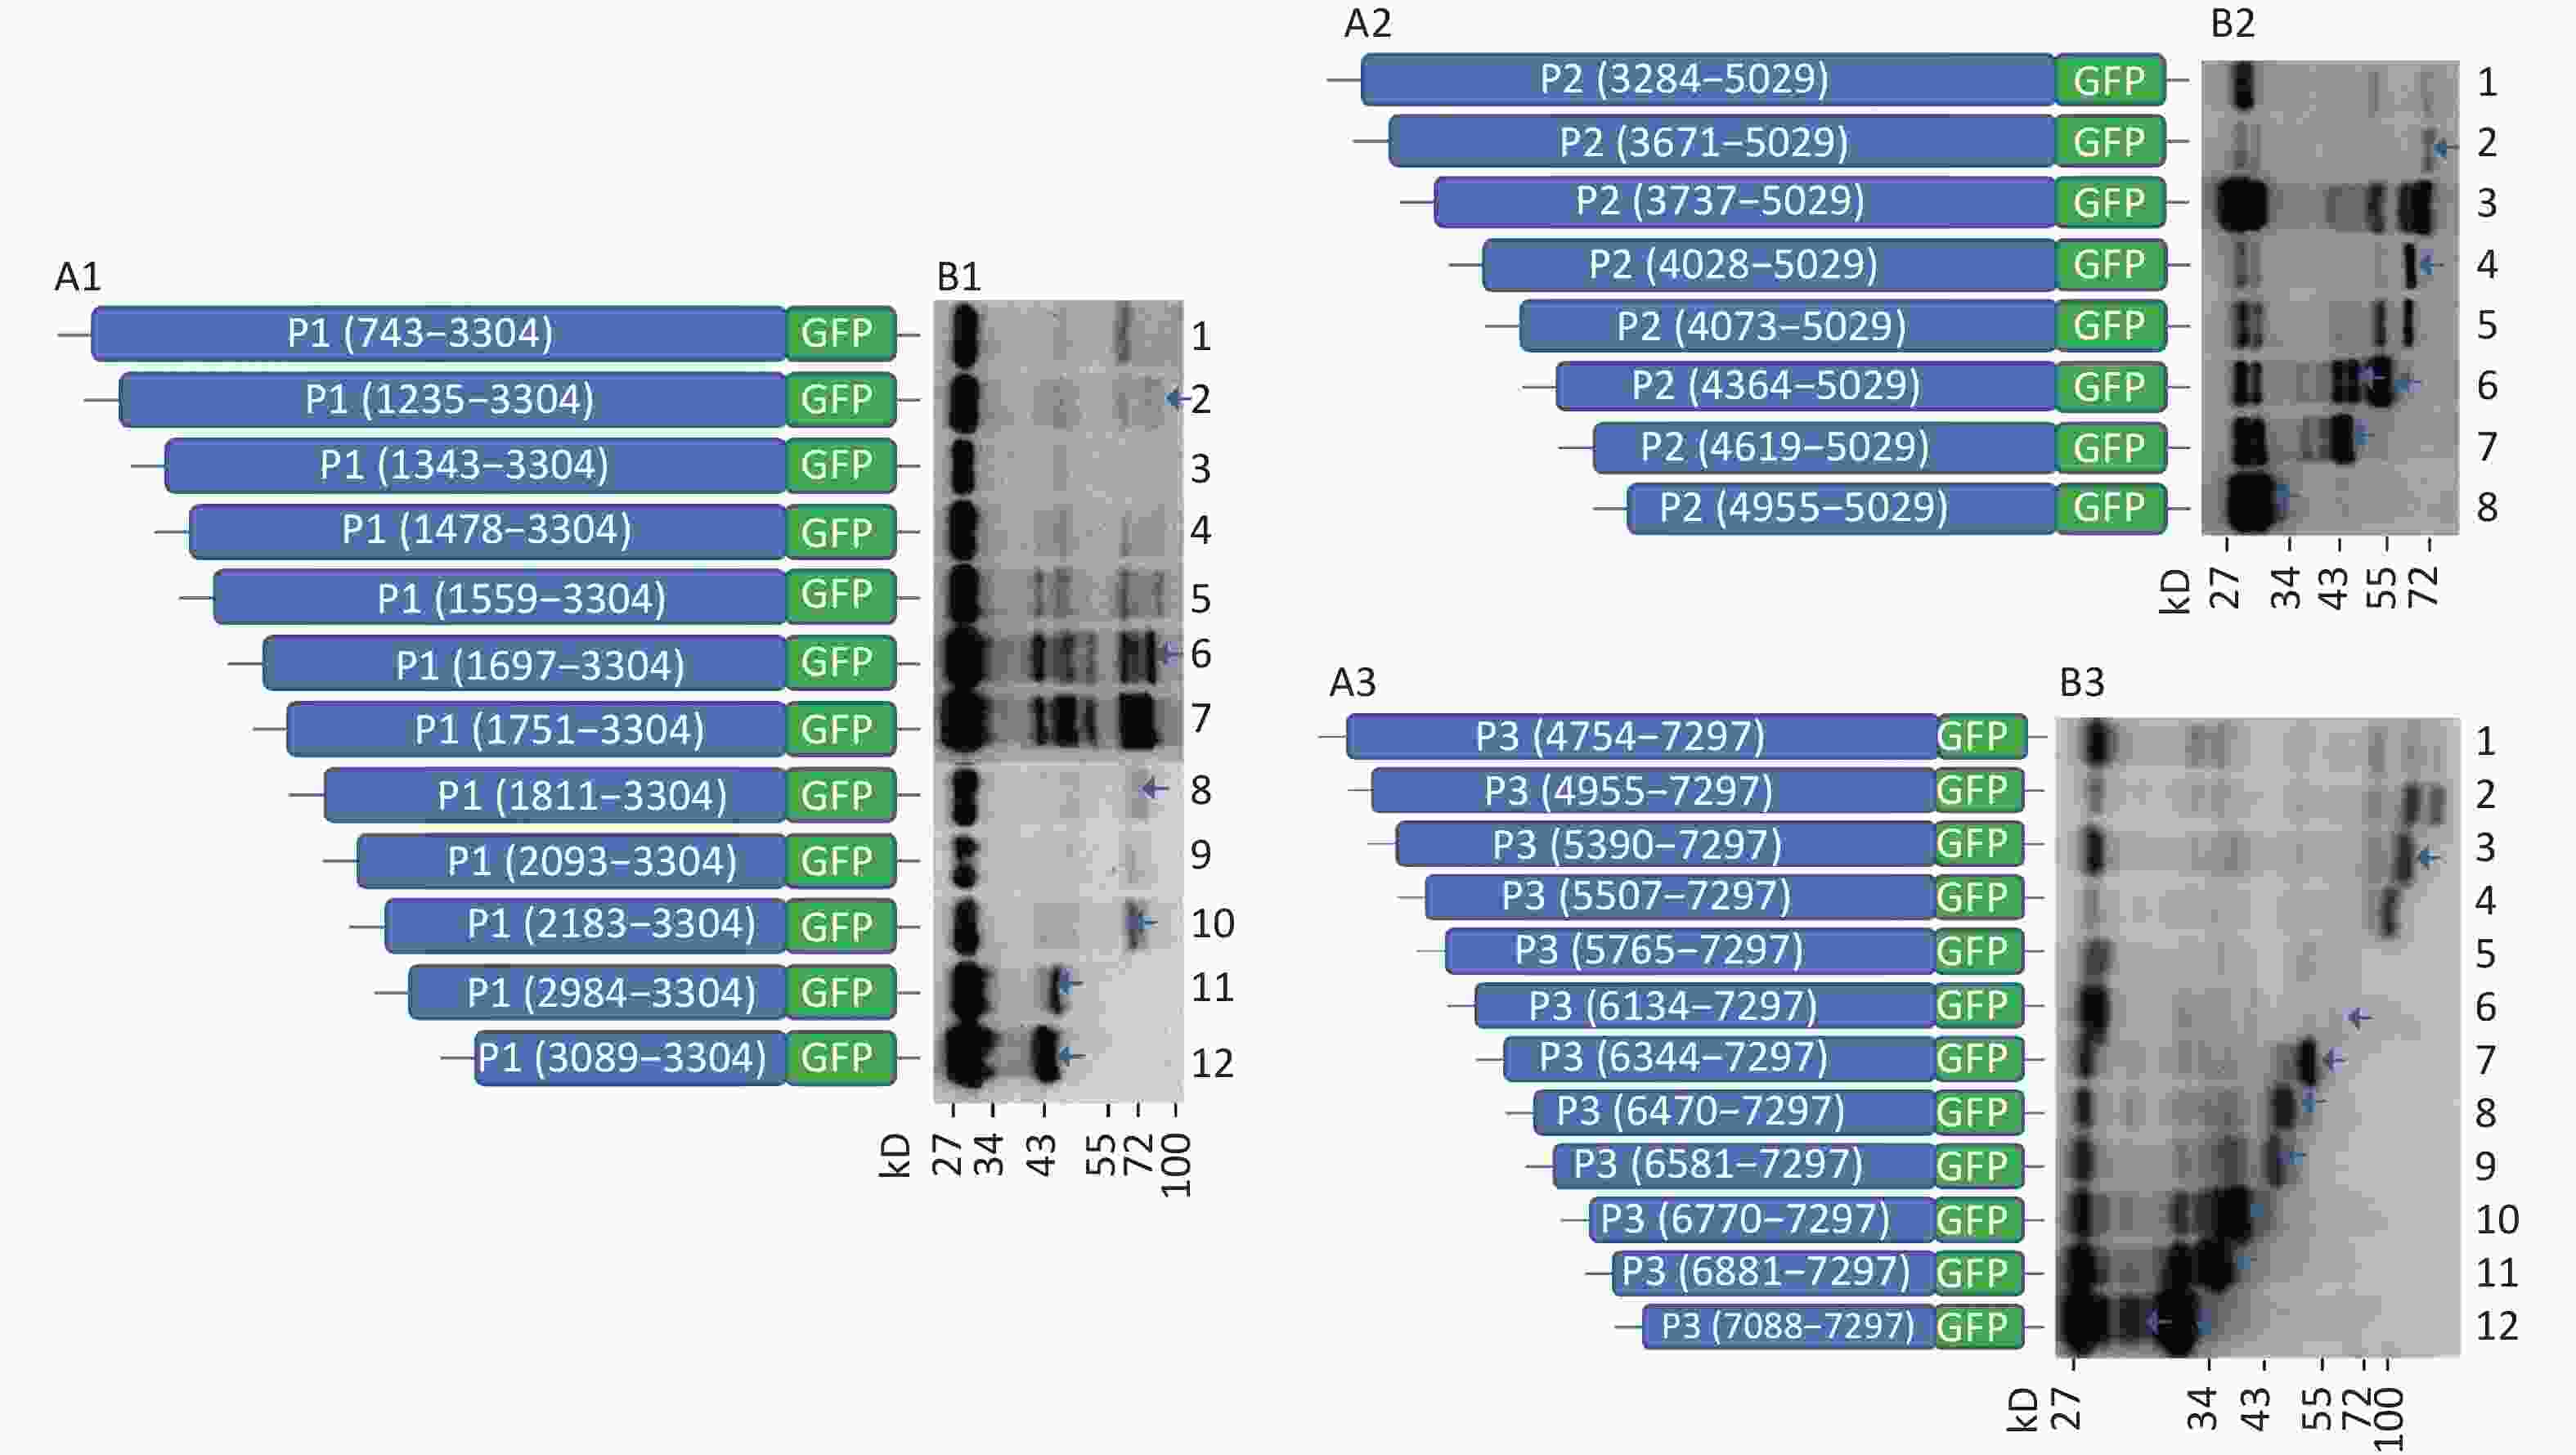
Figure 2. Screening of IRES translation in the coding region of CVB3. (A) Schematic diagram of IRES screening plasmids with sequences from each ATG to the end of P1 (A1), P2 (A2), or P3 (A3). (B) After transfection of plasmids pP1 (735–3304), pP1 (1235–3304), pP1 (1343–3304), pP1 (1478–3304), pP1 (1559–3304), pP1 (1697–3304), pP1 (1751–3304), pP1 (1811–3304), pP1 (2093–3304), pP1 (2183–3304), pP1 (2984–3304), and pP1 (3089–3304), potential IRES-dependent translation of P1 was identified by anti-GFP western blotting (B1). After transfection of plasmids pP2 (3284–5029), pP2 (3284–5029), pP2 (3671–5029), pP2 (3737–5029), pP2 (4028–5029), pP2 (4073–5029), pP2 (4364–5029), pP2 (4619–5029), and pP2 (4955–5029), potential IRES-dependent translation of P2 was identified by anti-GFP western blotting (B2). After transfection of plasmids pP3 (4754–7297), pP3 (4955–7297), pP3 (5390–7297), pP3 (5507–7297), pP3 (4765–7297), pP3 (6134–7297), pP3 (6344–7297), pP3 (6470–7297), pP3 (6581–7297), pP3 (6770–7297), pP3 (6881–7297), and pP3 (7088–7297), potential IRES-dependent translation ofP3 was identified by anti-GFP western blotting (B3). IRES, internal ribosome entry site; GFP, green fluorescent protein; ATG, antithymocyte globulin.
After transfection, the lanes from plasmids containing the truncated P1, P2, or P3 genes were successively arranged in a ladder according to the proteins’ molecular weights in western blotting (Figure 2B1, B2, and B3). Six potential IRESs in the P1 coding region, six potential IRESs in the P2 coding region and nine potential IRESs in the P3 coding region initiated protein translation (Figure 2B1, B2, and B3, arrow). The results also suggested no cryptic promoter or alternative splicing effect on the expression of multiple protein bands in the P1, P2, or P3 regions.
-
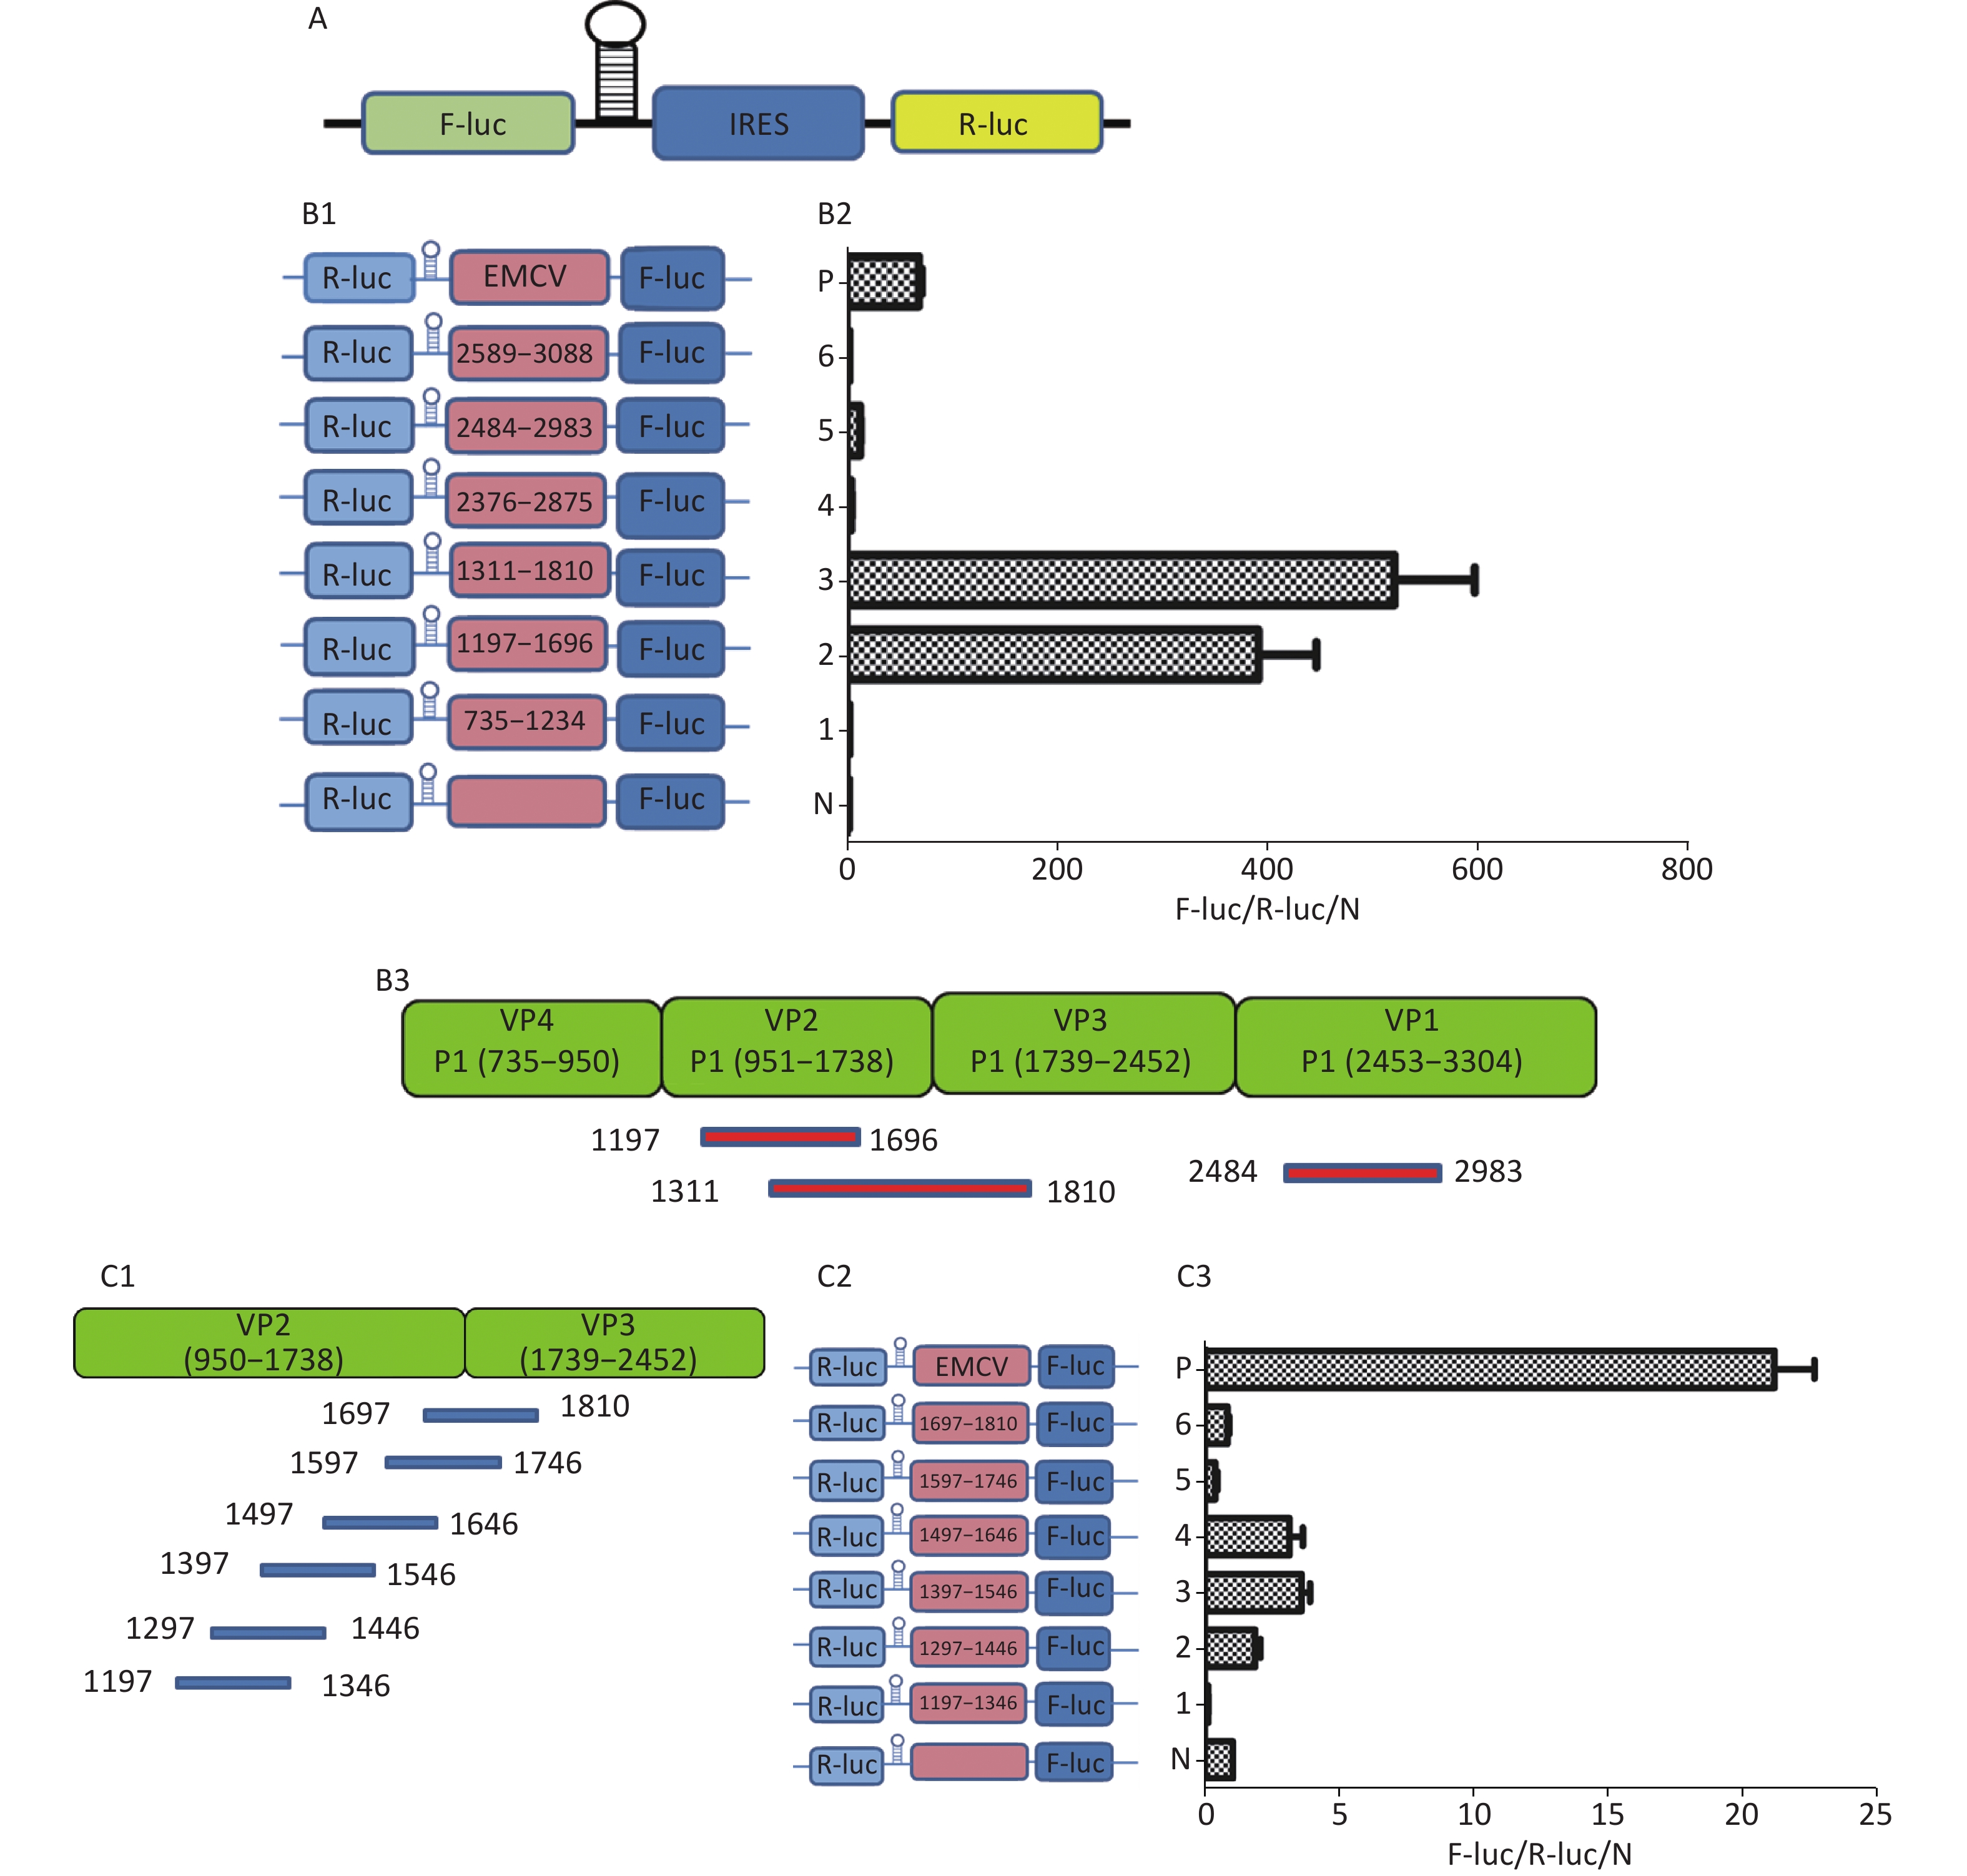
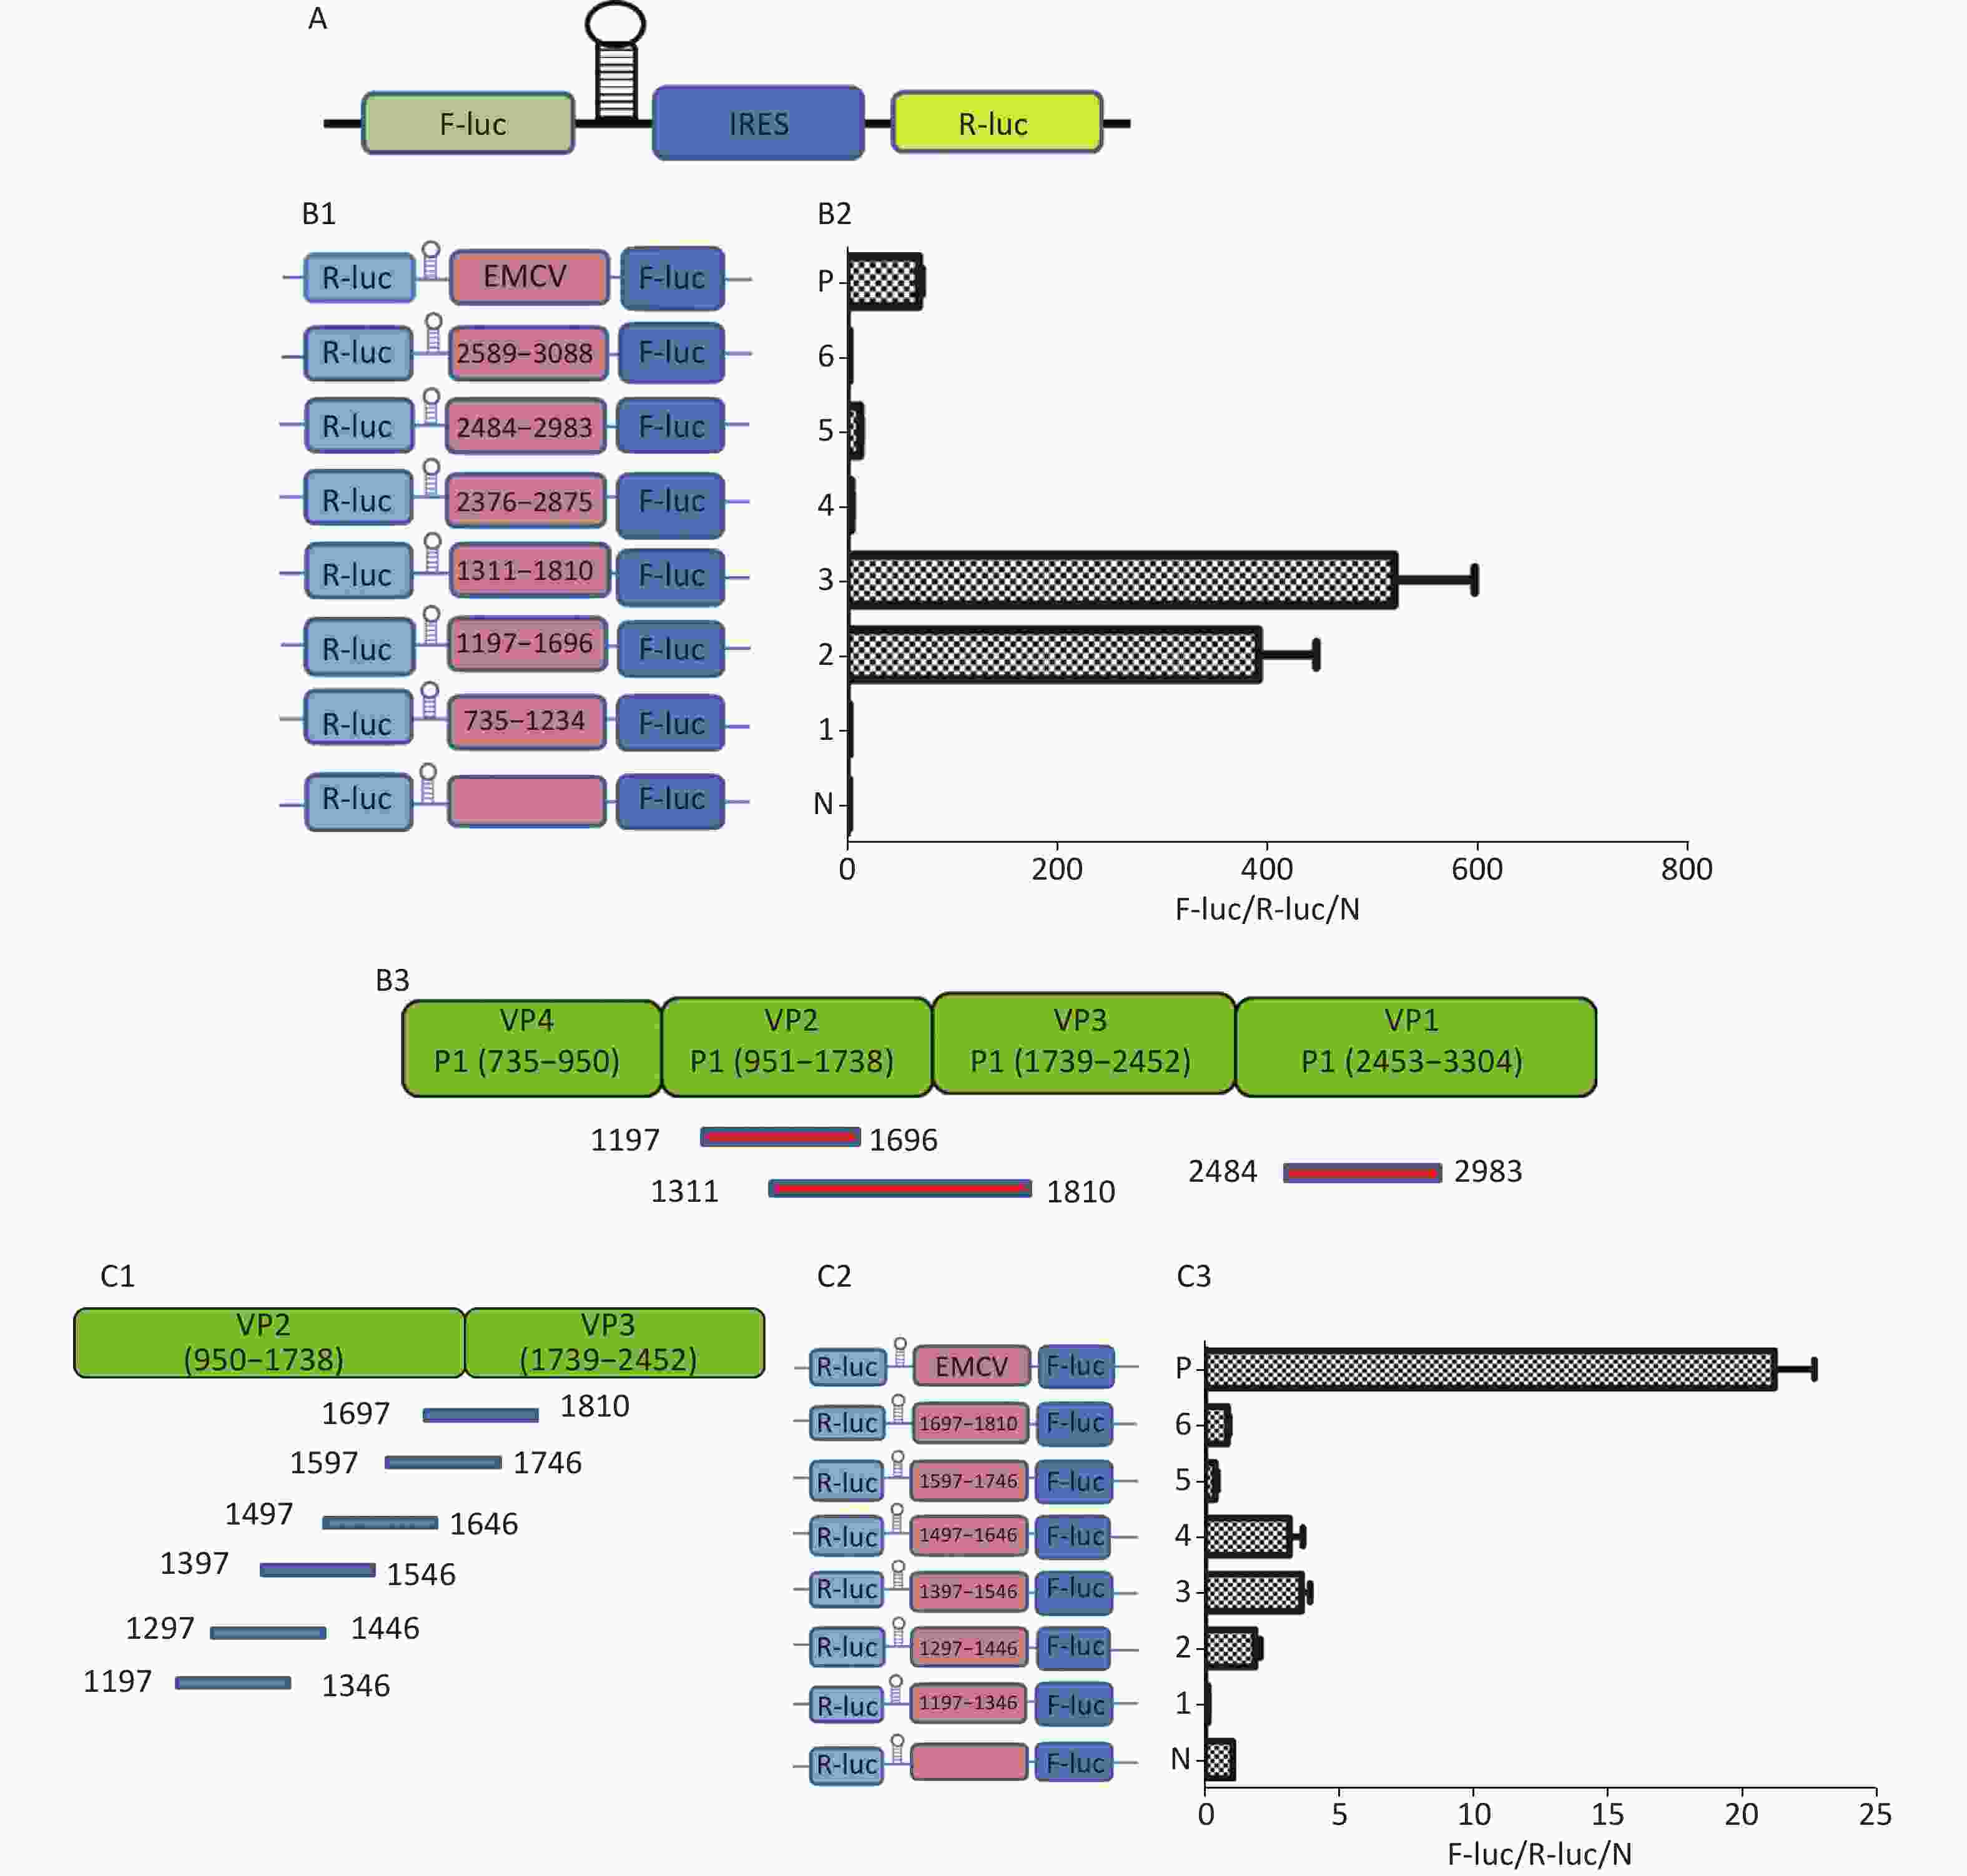
To identify the IRES sequences in the P1 coding region, we inserted a hairpin structure between the Rluc and Fluc genes of the bicistronic plasmid psiCHECKTM-2 to prevent ribosomal read through of Rluc (Figure 3A). According to the principle that IRESs may be located between adjacent protein bands[5], we cloned six IRES candidates (498 bp) into the bicistronic constructs to form plasmids pP1 (735–1234), pP1 (1197–1346), pP1 (1311–1810), pP1 (2376–2876), pP1 (2484–2983), and pP1 (2589–3088) (Figure 3B1). After transfection for 12 h, the Fluc/Rluc activity ratio of pP1 (1197–1346), pP1 (1311–1810), and pP1 (2484–2983) was 385.3, 491.6 and 13.8 times that of the negative control (Figure 3B2). The results indicated the presence of IRES elements in the P1 genome region. The results also demonstrated that IRESs of P1 mediated protein translation that was not due to ribosomal read through. According to these findings and the results of western blotting, the IRESs of P1 may be located at 1197–1696 nt and 1311–1810 nt in the VP2 and VP3 regions, and 2484–2983 nt in the VP1 region of P1 (Figure 3B2). Interestingly, the efficiency of both IRES 1197–1696 nt and IRES 1311–1810 nt was 6.1 and 7.8 times that of the EMCV IRES (positive control). These results revealed three cap-independent translation elements in the CVB3 coding region.
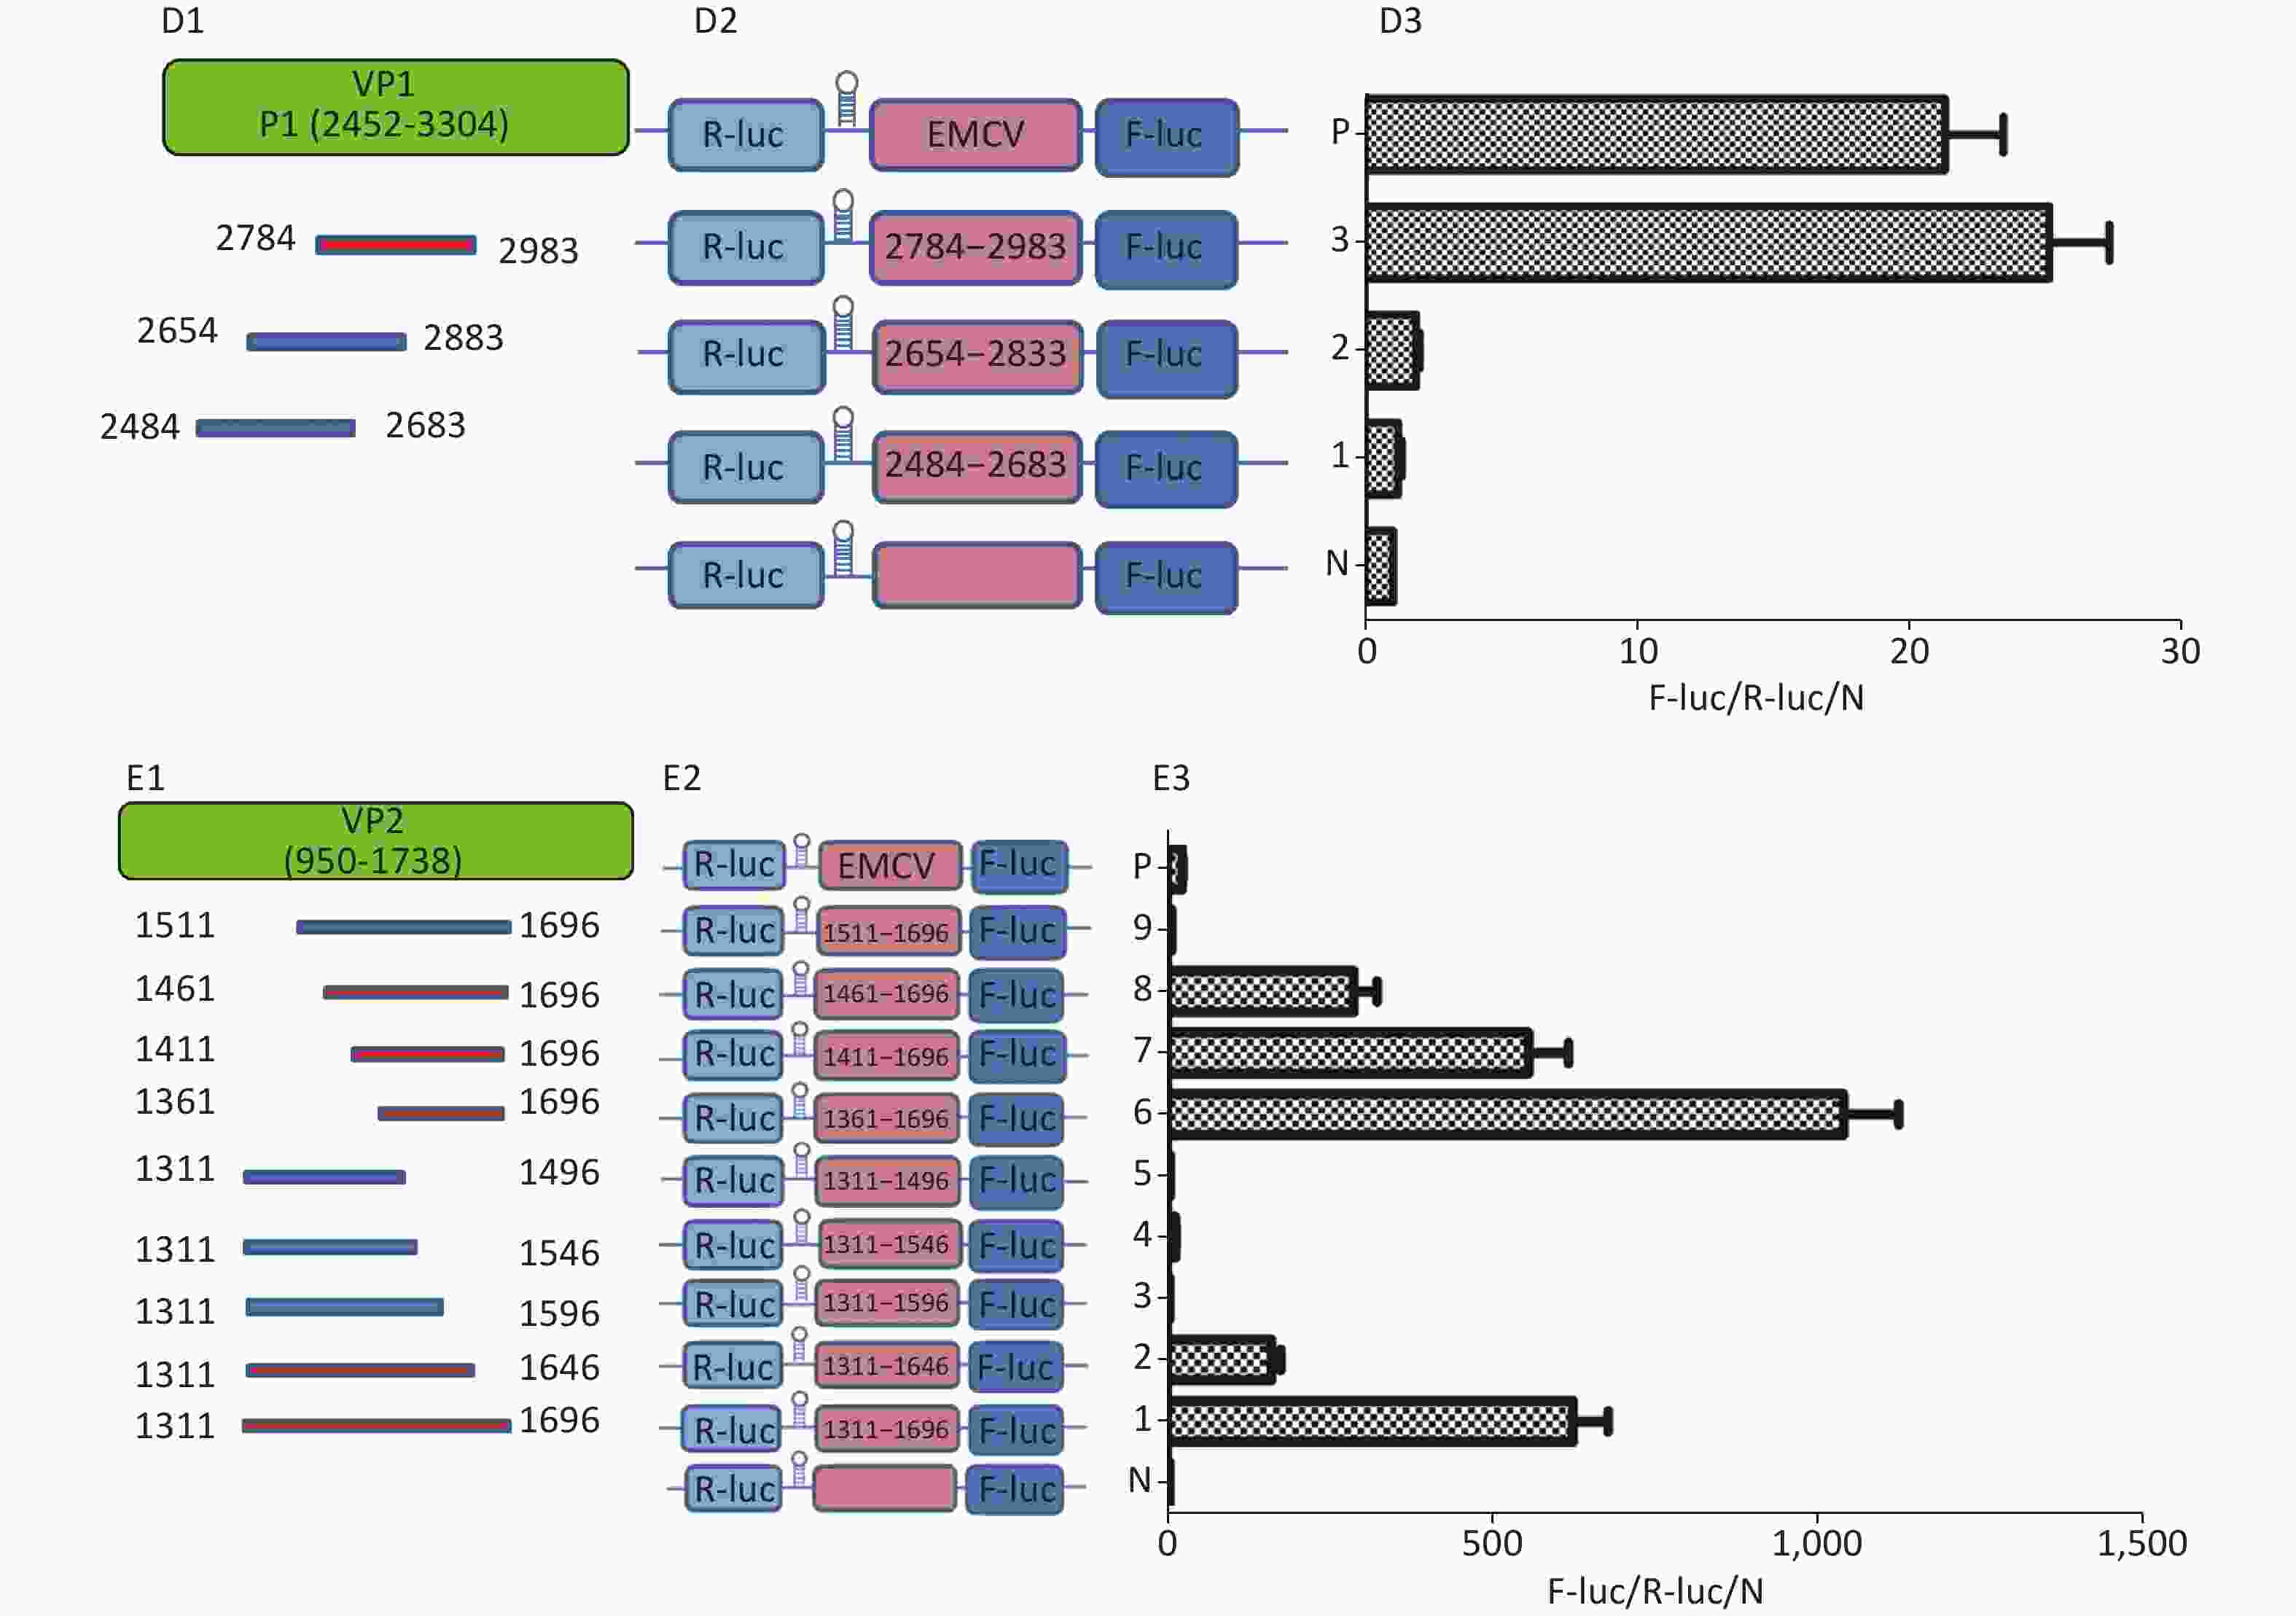
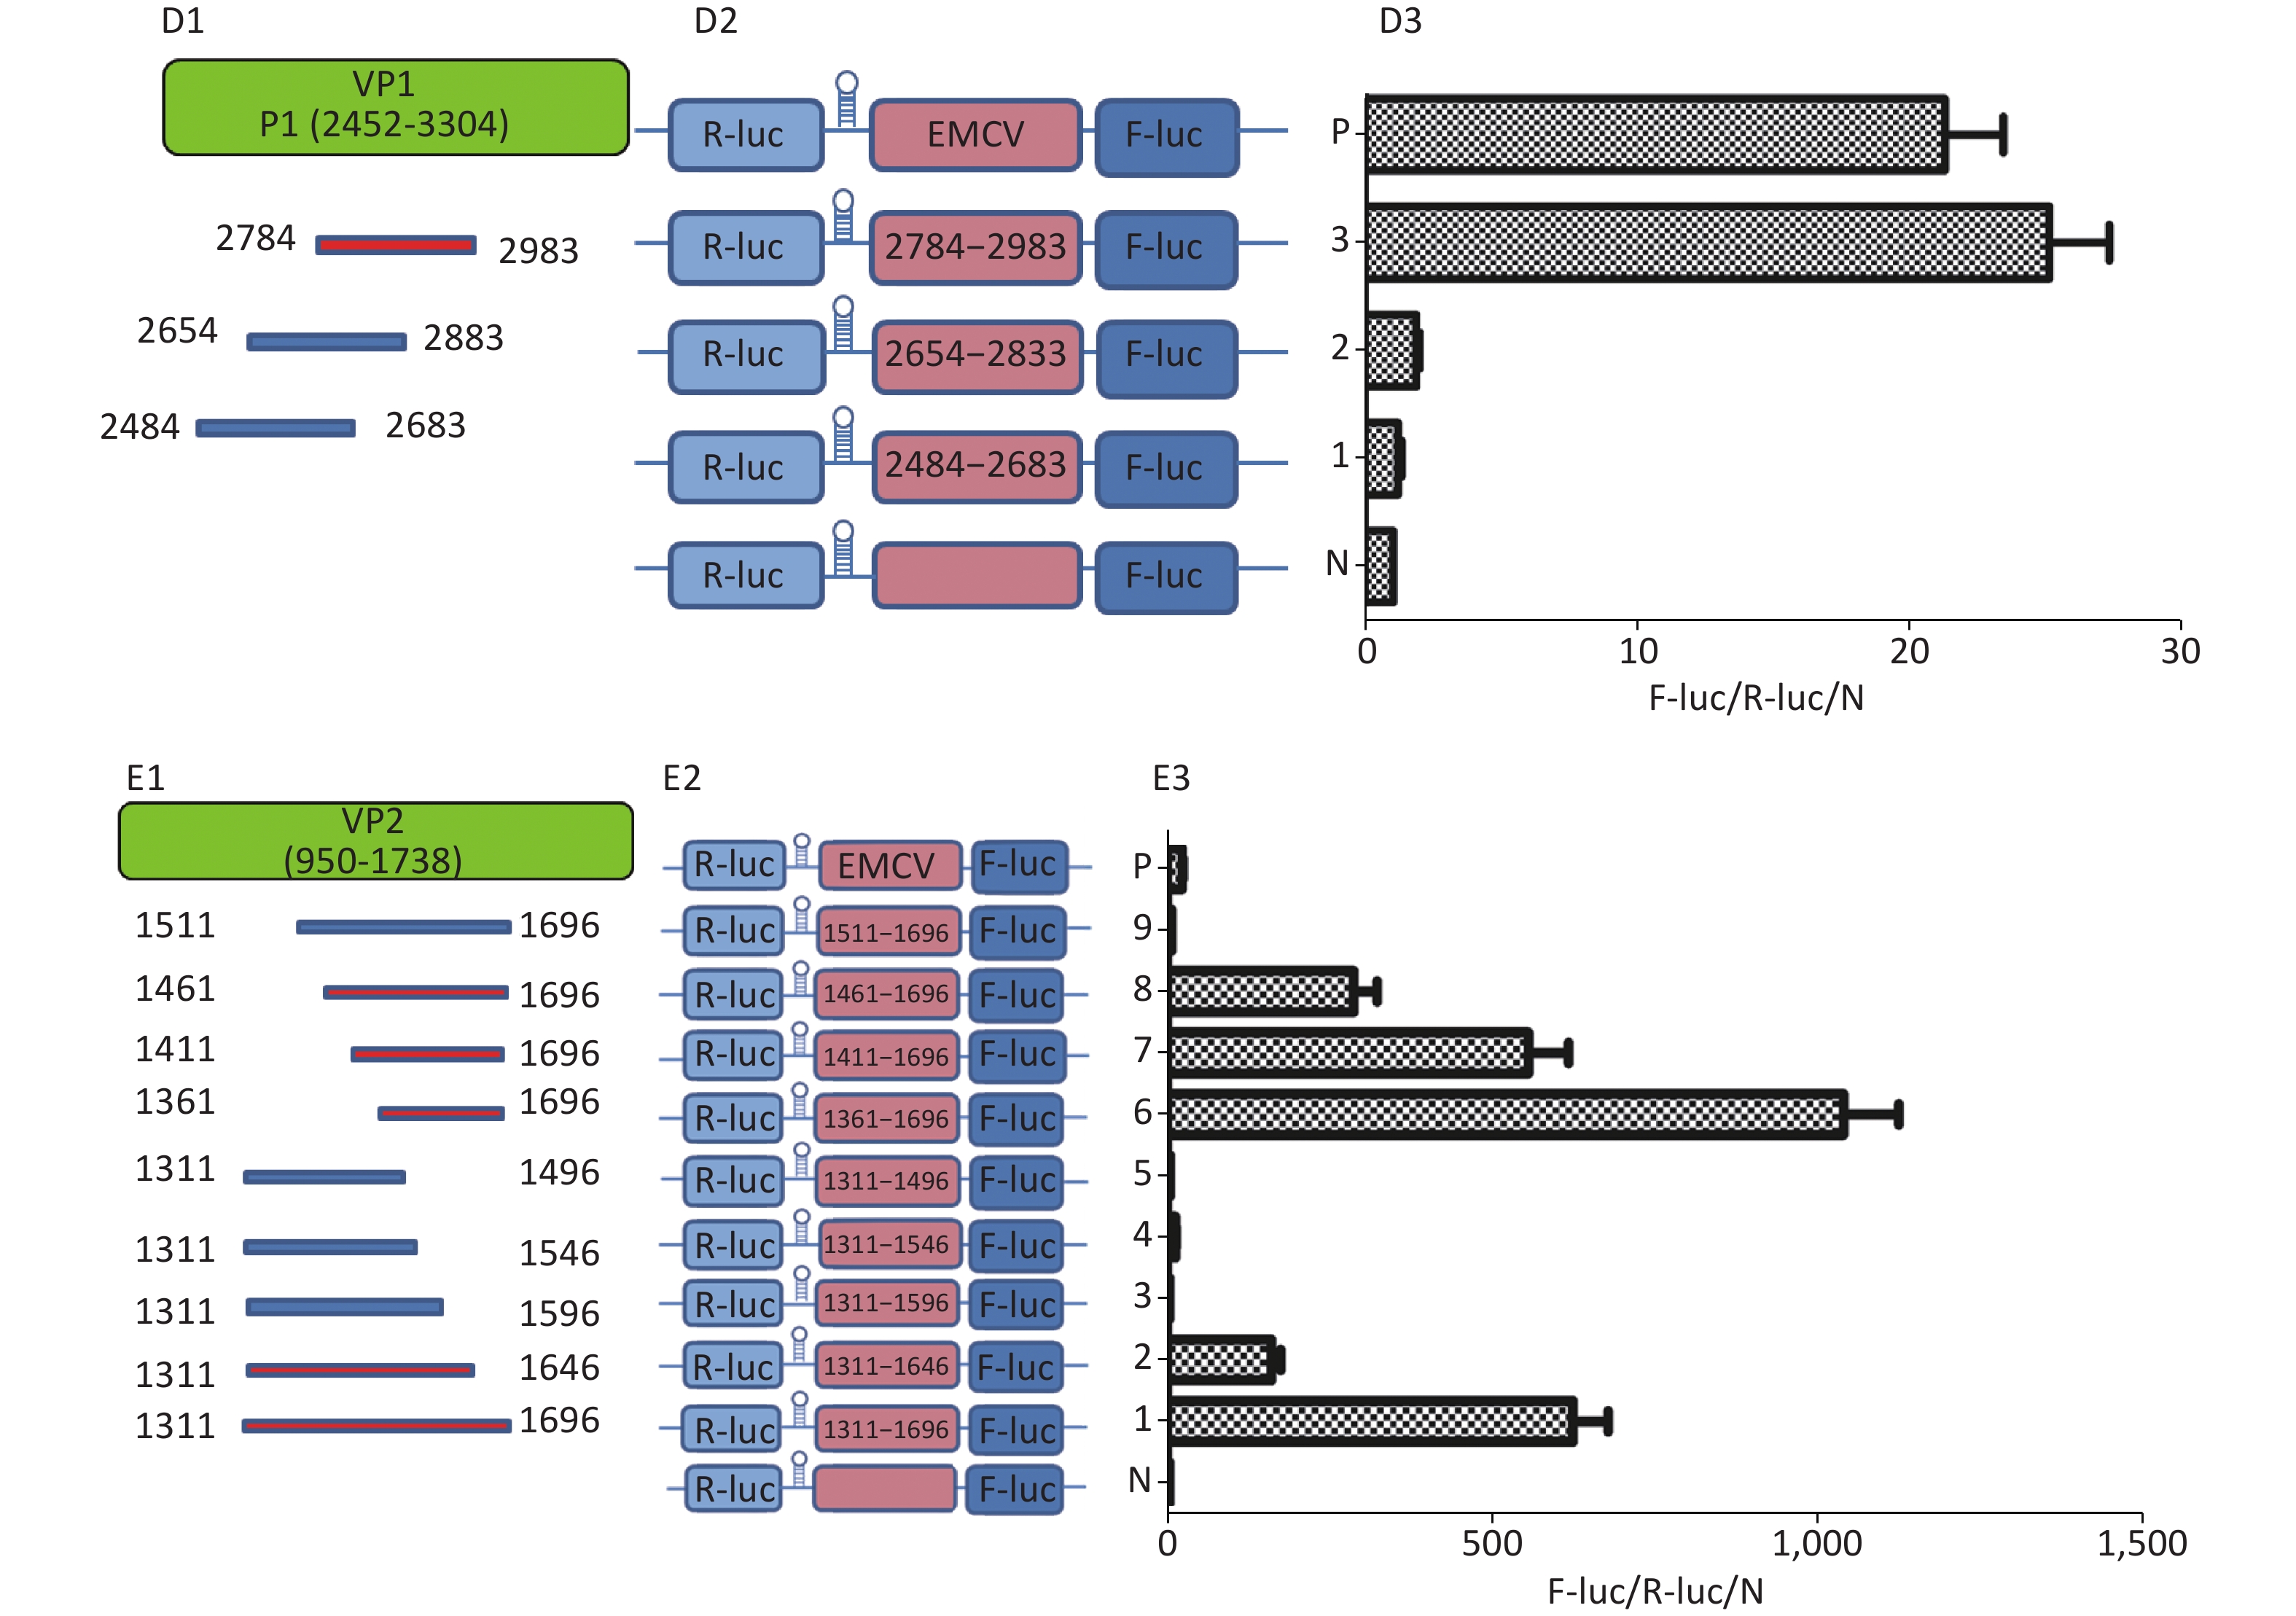
Figure 3. Identification of IRESs in the P1 coding region. (A) Schematic diagram of IRES identifying bicistronic vectors with a hairpin structure between the Rluc and putative IRES sequence. (B) Schematic diagram of identification of P1 IRESs. The potential IRES sequences of the P1 coding region were serially cloned into the bicistronic vectors (B1). pP1 (735–1234), pP1 (1197–1346), pP1 (1311–1810), pP1 (2376–2876), pP1 (2784–2983), and pP1 (2589–3088) were transfected into BHK cells. The Fluc/Rluc ratio of each vector was calculated and compared with that of the negative control (B2). The locations of three positive IRESs in P1 (B3). (C) Schematic diagram of shortened potential IRES sequences in VP2–VP3 region. The sequence at 1197–1810 nt was serially shortened with a 50 bp overlap between adjacent sequences (C1). Schematic diagram of shortened potential IRES sequences inserted into the bicistronic vectors (C2). IRES identification in VP2–VP3 through the constructed bicistronic vector. pP1 (1197–1346), pP1 (1297–1446), pP1 (1297–1446), pP1 (1397–1546), pP1 (1497–1546), pP1 (1597–1646), and pP1 (1697–1810) were transfected into BHK cells, and the Fluc/Rluc activity ratio of each vector was calculated and compared with that of the negative control (C3). (D) Schematic diagram of shortened potential IRES sequences in the VP1 region (D1). Schematic diagram of shortened P1 sequences inserted in bicistronic vectors (D2). IRES identification in the VP1 region through constructed bicistronic vectors. pP1 (2484–2683), pP1 (2654–2833), and pP1 (2784–2983) were transfected into BHK cells, and the Fluc/Rluc activity ratio of each vector was calculated and compared with that of the negative control (D3). (E) Schematic diagram of truncated IRES sequence at 1311–1810 nt in the VP2 region (E1). Schematic diagram of 50 bp deletion IRES sequences inserted into the bicistronic vectors (E2). pP1 (1311–1696), pP1 (1311–1646), pP1 (1311–1596, pP1 (1311–1546), pP1 (1311–1496), pP1 (1361–1696), pP1 (1411–1696), pP1 (1461–1696), or pP1 (1511–1696) was transfected into BHK cells, and the Fluc/Rluc activity ratioof each vector was compared with that of the negative control (E3). IRESs, internal ribosome entry site; EMCV, encephalomyocarditis virus; Rluc, Renilla luciferase; Fluc, Firefly luciferase.
To precisely define each IRES region in the P1 coding region, we truncated IRES sequences including 1197–1696 nt, 1311–1810 nt, and 2484–2983 nt to 150 bp with a 50 bp overlap between adjacent sequences. Because of the greater overlap between 1197–1696 nt and 1311–1810 nt, the full length sequences of the above two sequences at 1197–1810 nt were analyzed instead (Figure 3C1 and D1). The 150 bp truncated sequences at 1197–1810 nt and 2484–2983 nt were cloned into bicistronic constructs to form plasmids pP1 (1197–1346), pP1 (1297–1446), pP1 (1297–1446), pP1 (1397–1546), pP1 (1497–1546), pP1 (1597–1646), pP1 (1697–1810), pP1 (2484–2683), pP1 (2654–2833), and pP1 (2784–2983) (Figure 3C2 and D2). After transfection, the Fluc/Rluc activity ratio of pP1 (1197–1346), pP1 (1297–1446), pP1 (1397–1546), pP1 (1497–1546), pP1 (1597–1646), pP1 (1697–1810), pP1 (2484–2683), pP1 (2654–2833), and pP1 (2784–2983) was 0.1, 1.5, 3.2, 2.9, 0.3, 0.8, 1.1, 2.1, and 27.5 times that of the negative control (Figure 3C3 and D3). Moreover, the Fluc activity mediated by pP1 (2784–2983) (VP1) was 1.2 times that of the EMCV IRES (positive control), although the Fluc activity mediated by the shortened IRES sequences in VP2 and VP3 was lower than that of the positive control (Figure 3C3 and D3).
From the results above, we speculated that the overlapping sequences at 1311–1696 nt, 1197–1696 nt, and 1311–1810 nt were crucial as IRESs. Subsequently, we shortened 1311–1696 nt from the 3’ and 5’ termini by 50 bp. The shortened IRES candidates were cloned into bicistronic constructs to form plasmids pP1 (1311–1696), pP1 (1311–1646), pP1 (1311–1596, pP1 (1311–1546), pP1 (1311–1496), pP1 (1361–1696), pP1 (1411–1696), pP1 (1461–1696), and pP1 (1511–1696) (Figure 3E2). After transfection, the Fluc/Rluc activity ratio of pP1 (1311–1696), pP1 (1311–1646), pP1 (1361–1696), pP1 (1411–1696), and pP1 (1461–1696) was 625.7, 195.6, 1075.8, 573.2, and 298.3 times that of the negative control. The Fluc/Rluc activity ratio of pP1 (1311–1696), pP1 (1311–1646), pP1 (1361–1696), pP1 (1411–1696), and pP1 (1461–1696) was 32.9, 10.3, 56.6, 30.2, and 15.7 times that of the positive control (Figure 3E3). Thus, IRESs in the VP2 region were located at 1311–1696 nt, 1311–1646 nt, 1361–1696 nt, 1411–1696 nt, and 1461–1696 nt in P1. Because the sequence at 1461–1646 nt was the common sequence of the IRESs in VP2, this sequence was determined to be a crucial IRES in VP2.
-
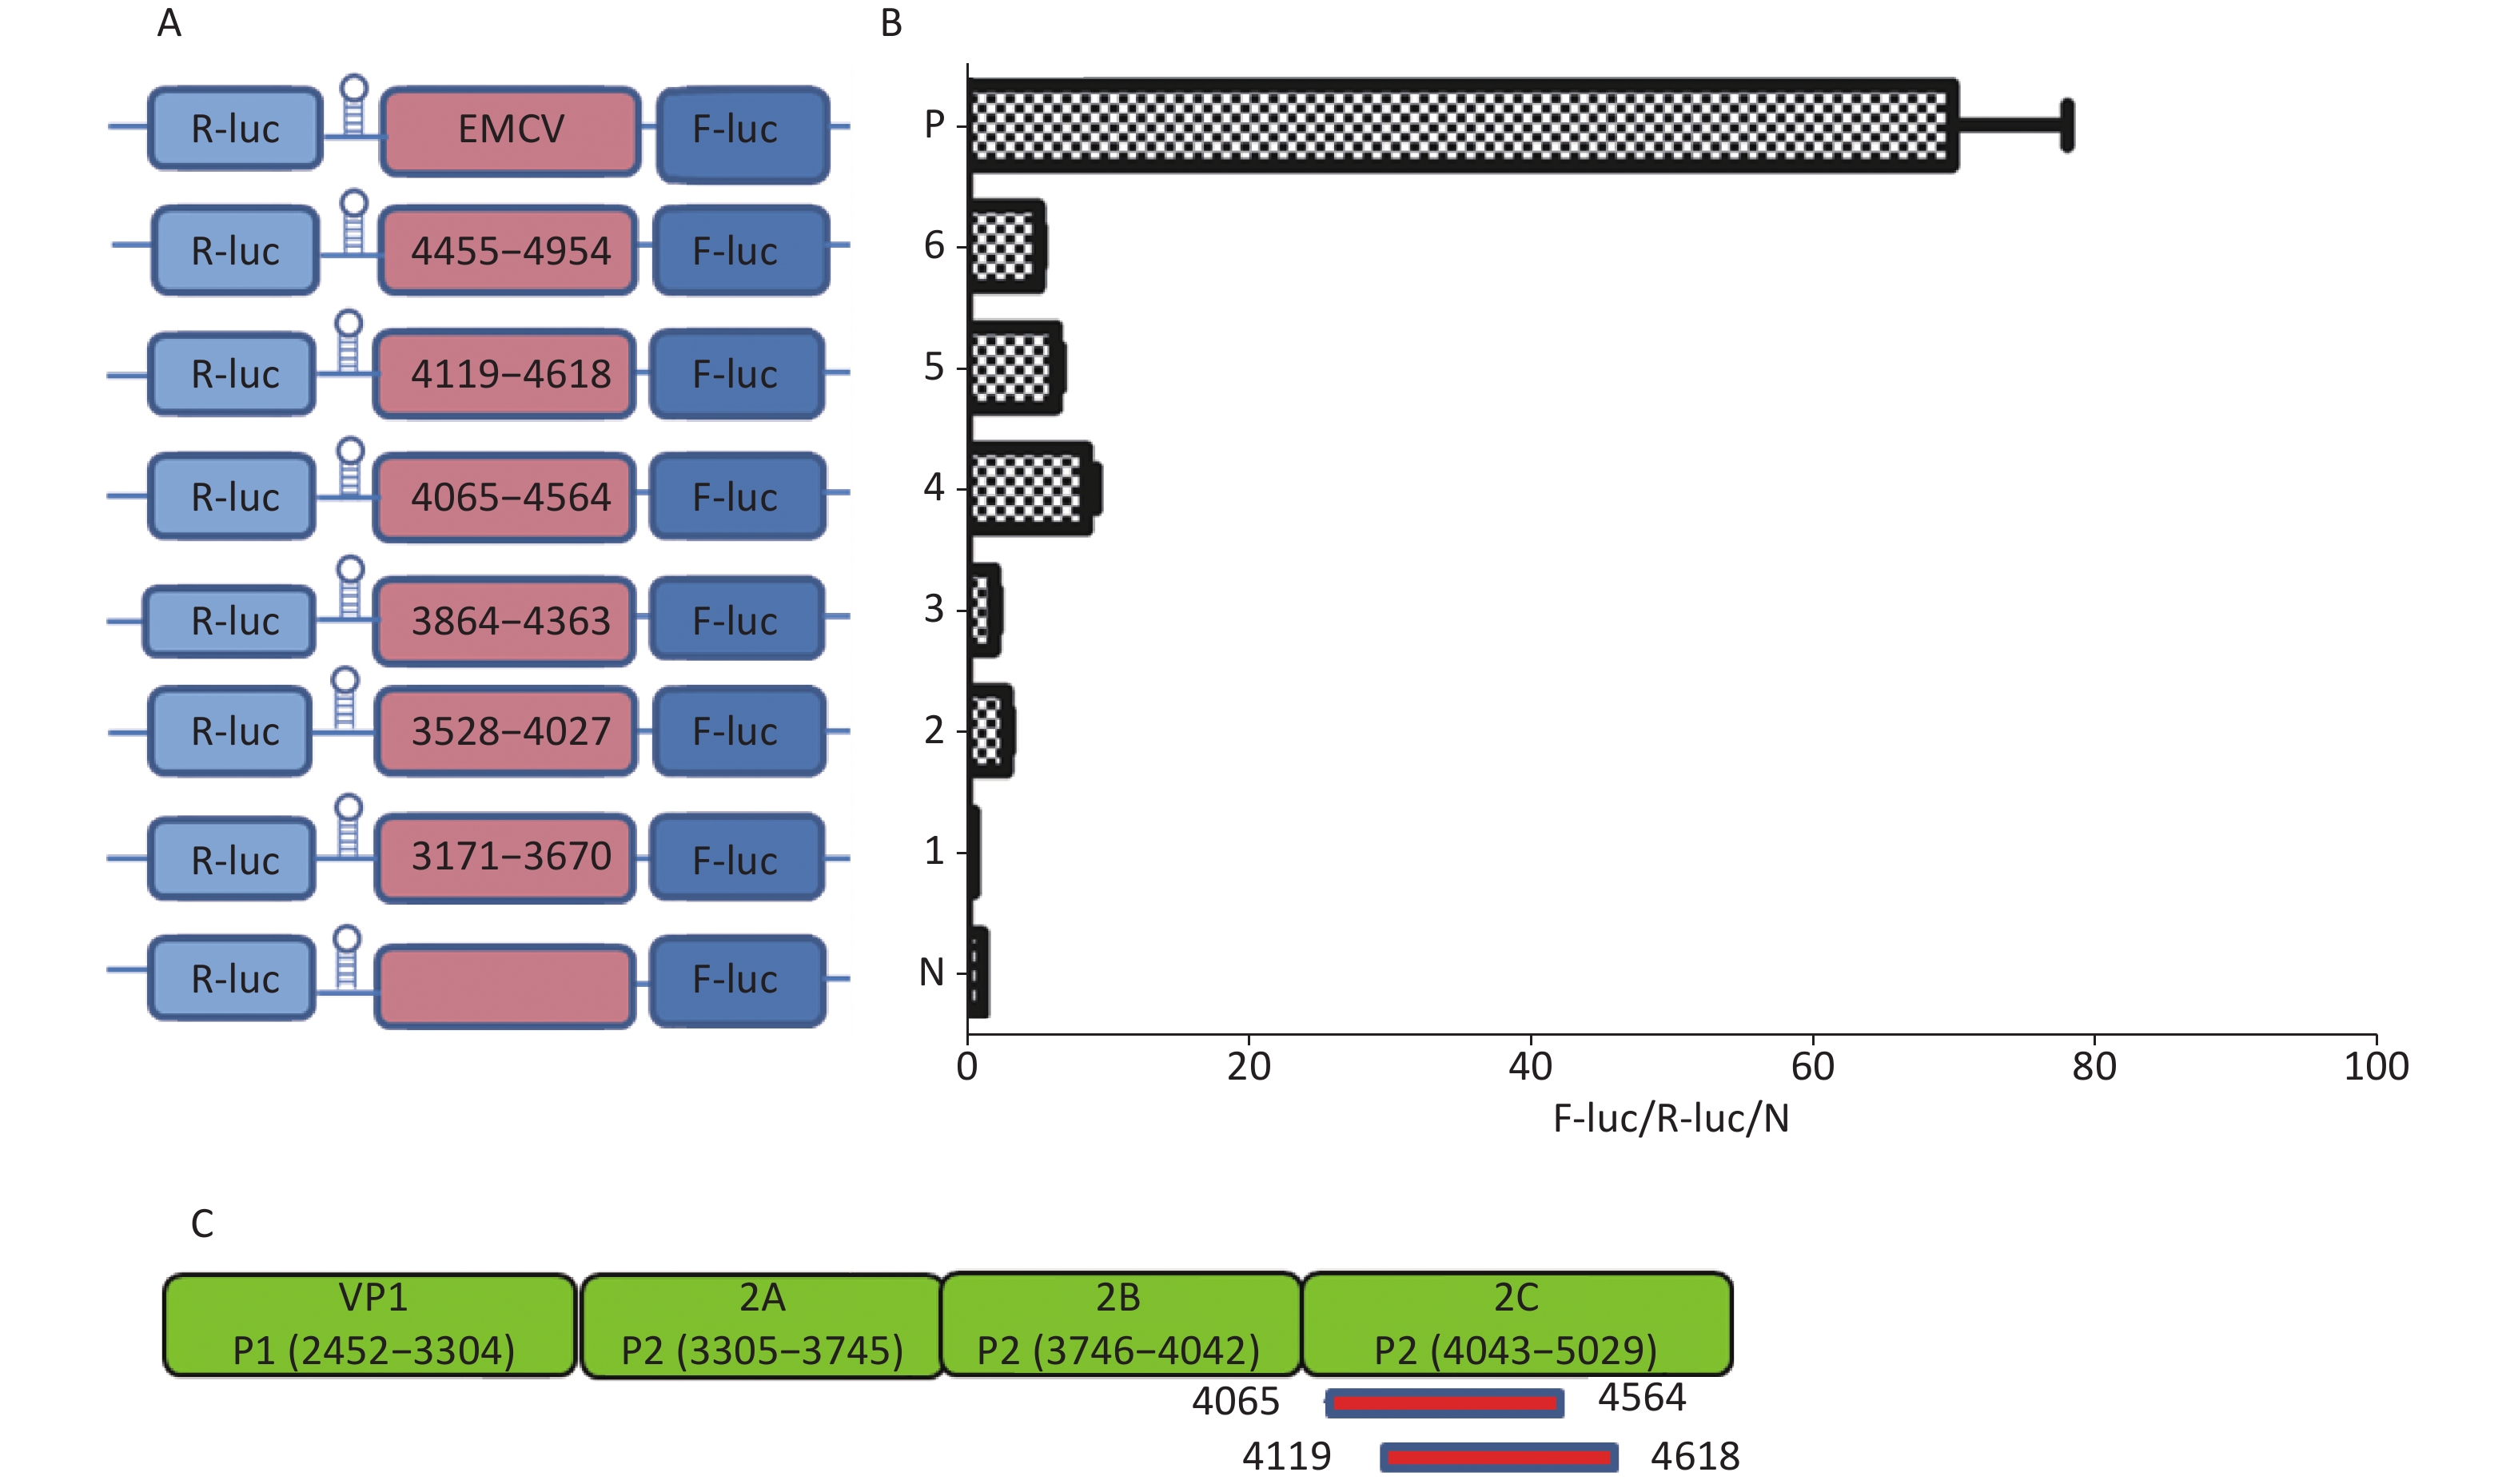
Similarly, to identify IRESs in the P2 coding region, we constructed six plasmids, pP2 (3171–3670), pP2 (3528–4027), pP2 (3864–4363), pP2 (4065–4564), pP2 (4119–4618), and pP2 (4455–4954), as described above (Figure 4A). After transfection, the Fluc/Rluc activity ratio of pP2 (4065–4564) and pP2 (4119–4618) was eight and five times that of the negative control (Figure 4B), respectively. Thus, the two IRESs regions were located at 4065–4564 nt and 4119–4618 nt in the 2C region of P2 (Figure 4C). As with the IRES detection in VP2 of P1, an overlap existed among sequences at 4119–4564 nt, 4065–4564 nt, and 4119–4618 nt. The sequence at 4119–4564 nt might be the crucial IRES in the P2 region.
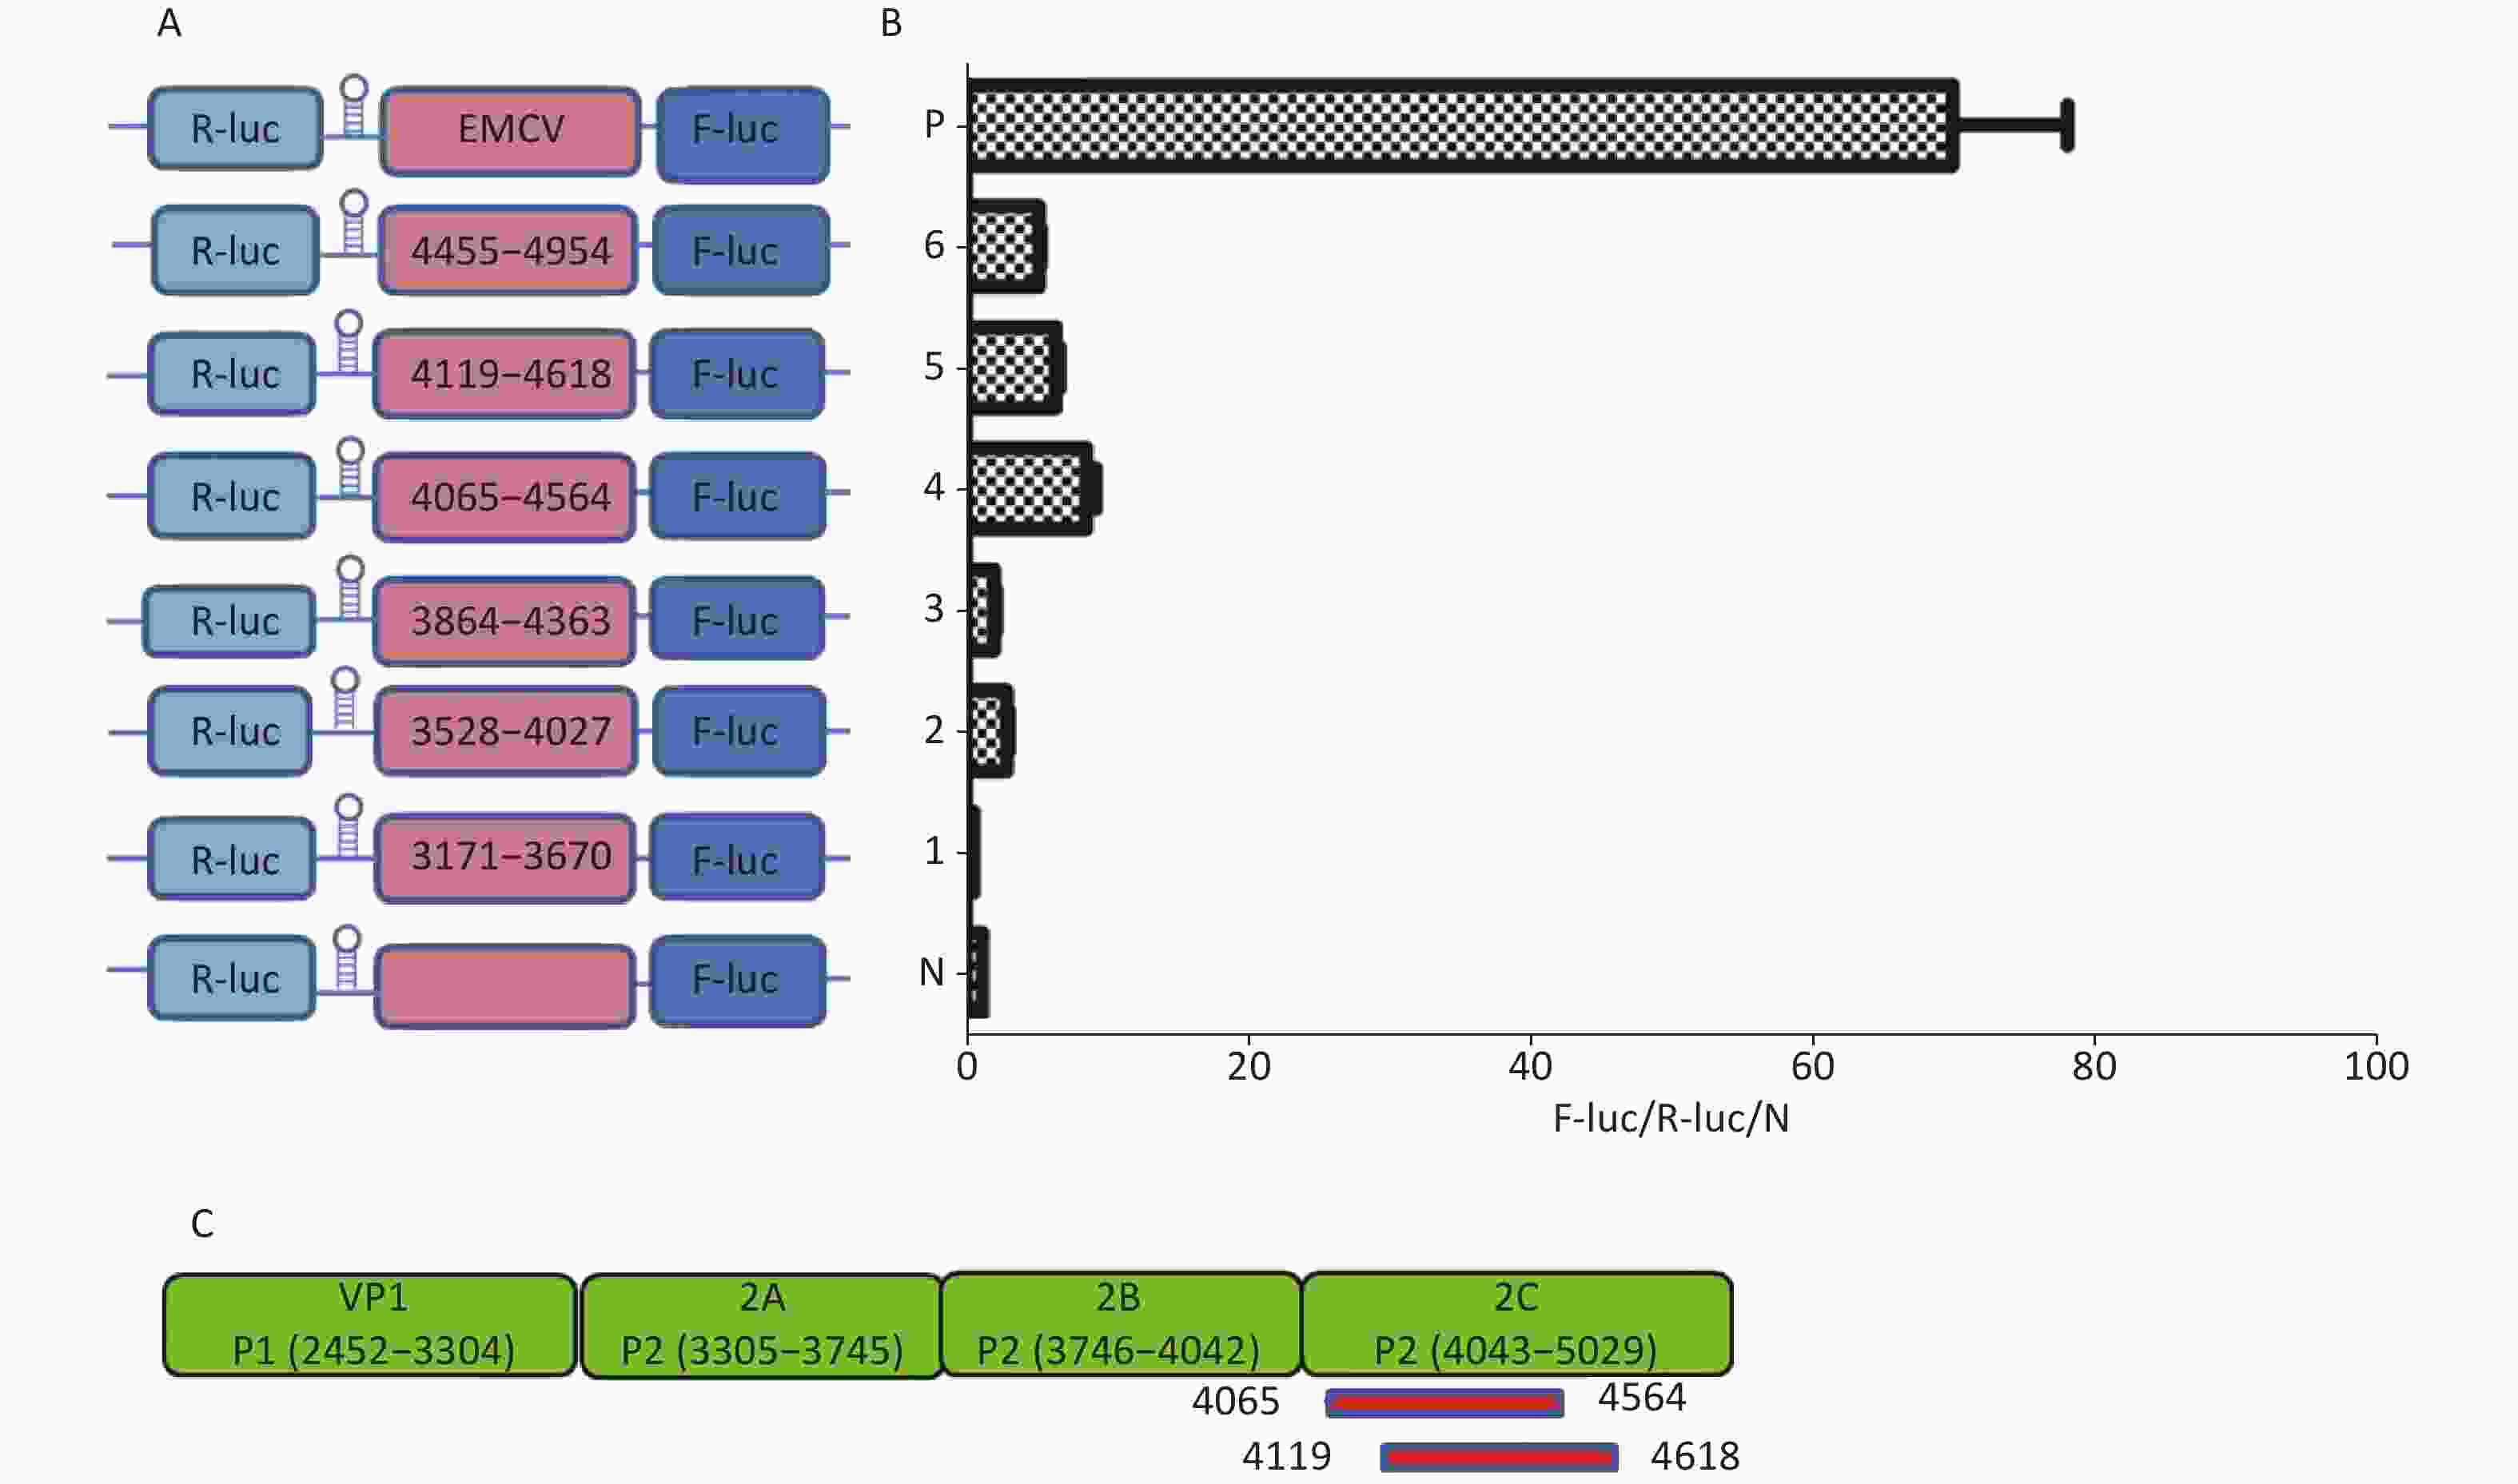
Figure 4. Identification of IRESs in the P2 region. Schematic diagram of IRES bicistronic reportersfor P2. The sequence before the ATG start codon of the P2 region was serially cloned between the hairpin structure and Fluc of the bicistronic vectors (A). pP2 (3171–3670), pP2 (3528–4027), pP2 (3864–4363), pP2 (4065–4564), pP2 (4119–4618), and pP2 (4455–4954) were transfected into BHK cells, and the Fluc/Rluc activity ratio of each vector was compared with that of the negative control (B). Locations of two positive IRESs in P2 (C). IRESs, internal ribosome entry site; EMCV, encephalomyocarditis virus; Rluc, Renilla luciferase; Fluc, Firefly luciferase.
-
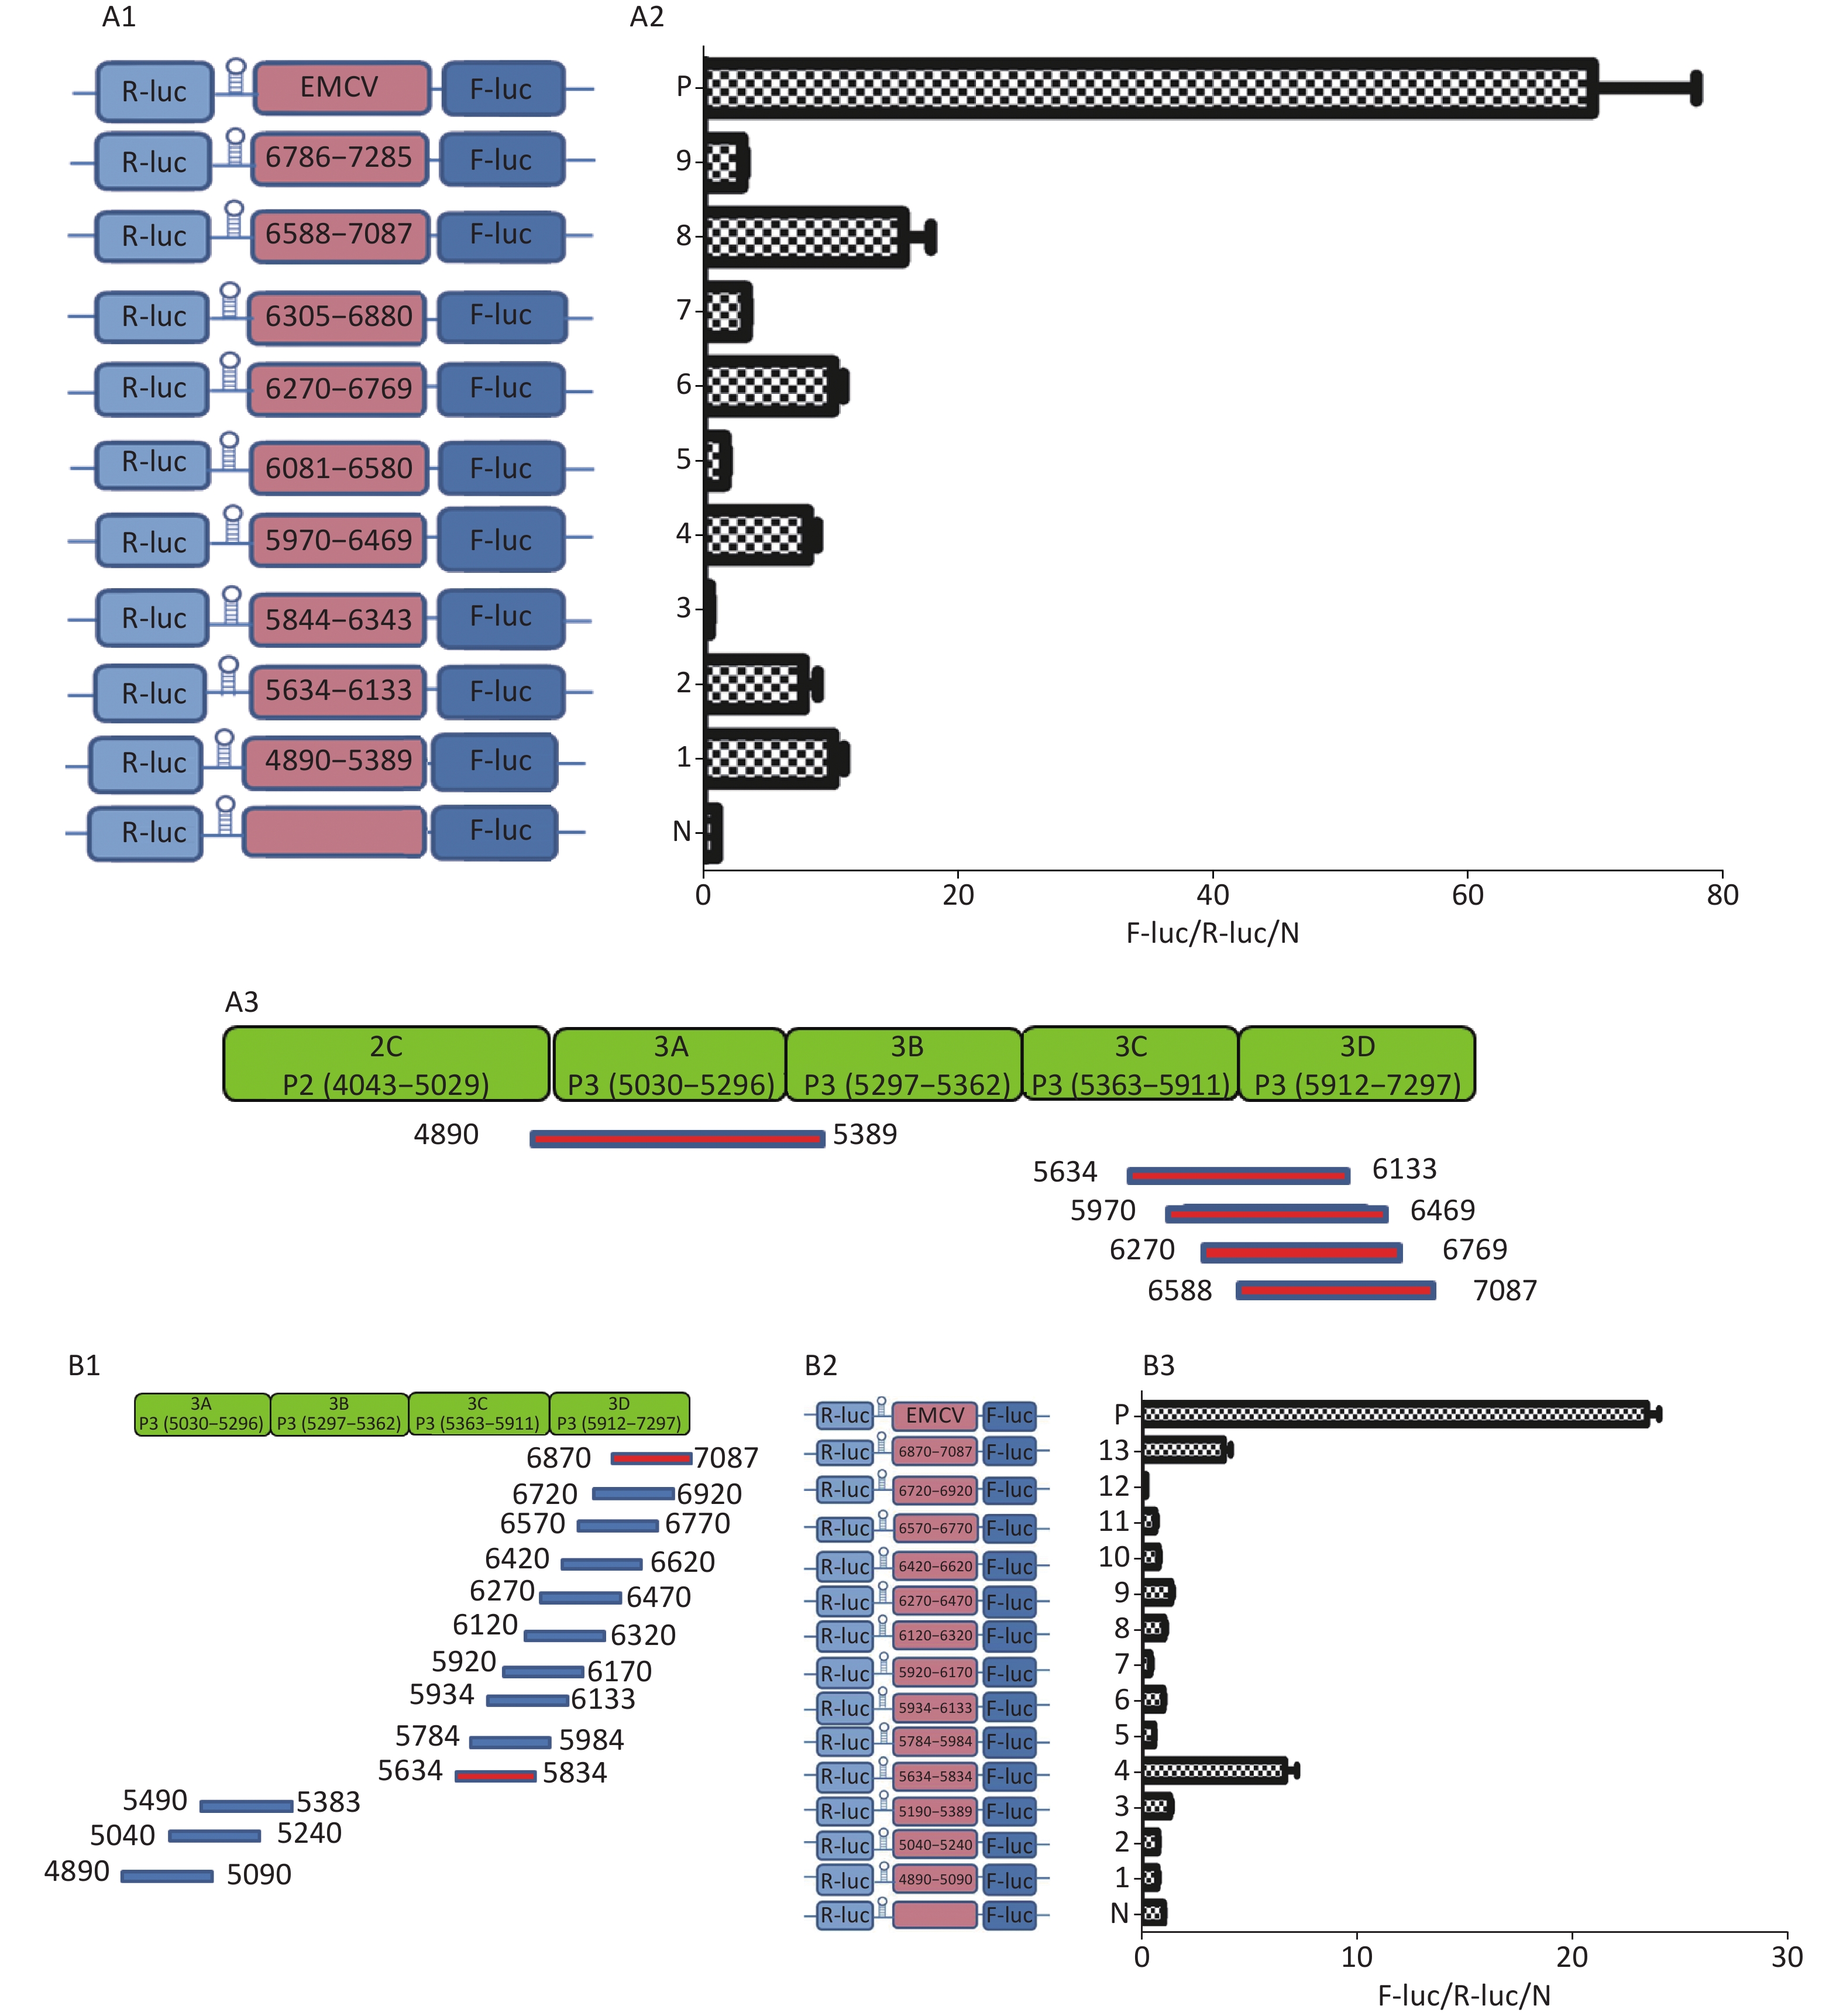
To identify the IRESs in P3, we constructed nine plasmids, pP3 (4890–5389), pP3 (5634–6133), pP3 (5844–6343), pP3 (5970–6469), pP3 (6270–6769), pP3 (6305–6880), pP3 (6583–7087), and pP3 (6786–7285) (Figure 5A1), as described above. After transfection, the activity of pP3 (4890–5389), pP3 (5634–6133), pP3 (5970–6469), pP3 (6270–6769), and pP3 (6583–7087) was 12, 8, 8.6, 12, and 18 times that of the negative control (Figure 5A2). Thus, the potential IRESs in P3 were located at 4890–5389 nt in the 3A region, and 5634–6133 nt, 5970–6469 nt, 6270–6769 nt, and 6583–7087 nt in the 3CD region (Figure 5A3).
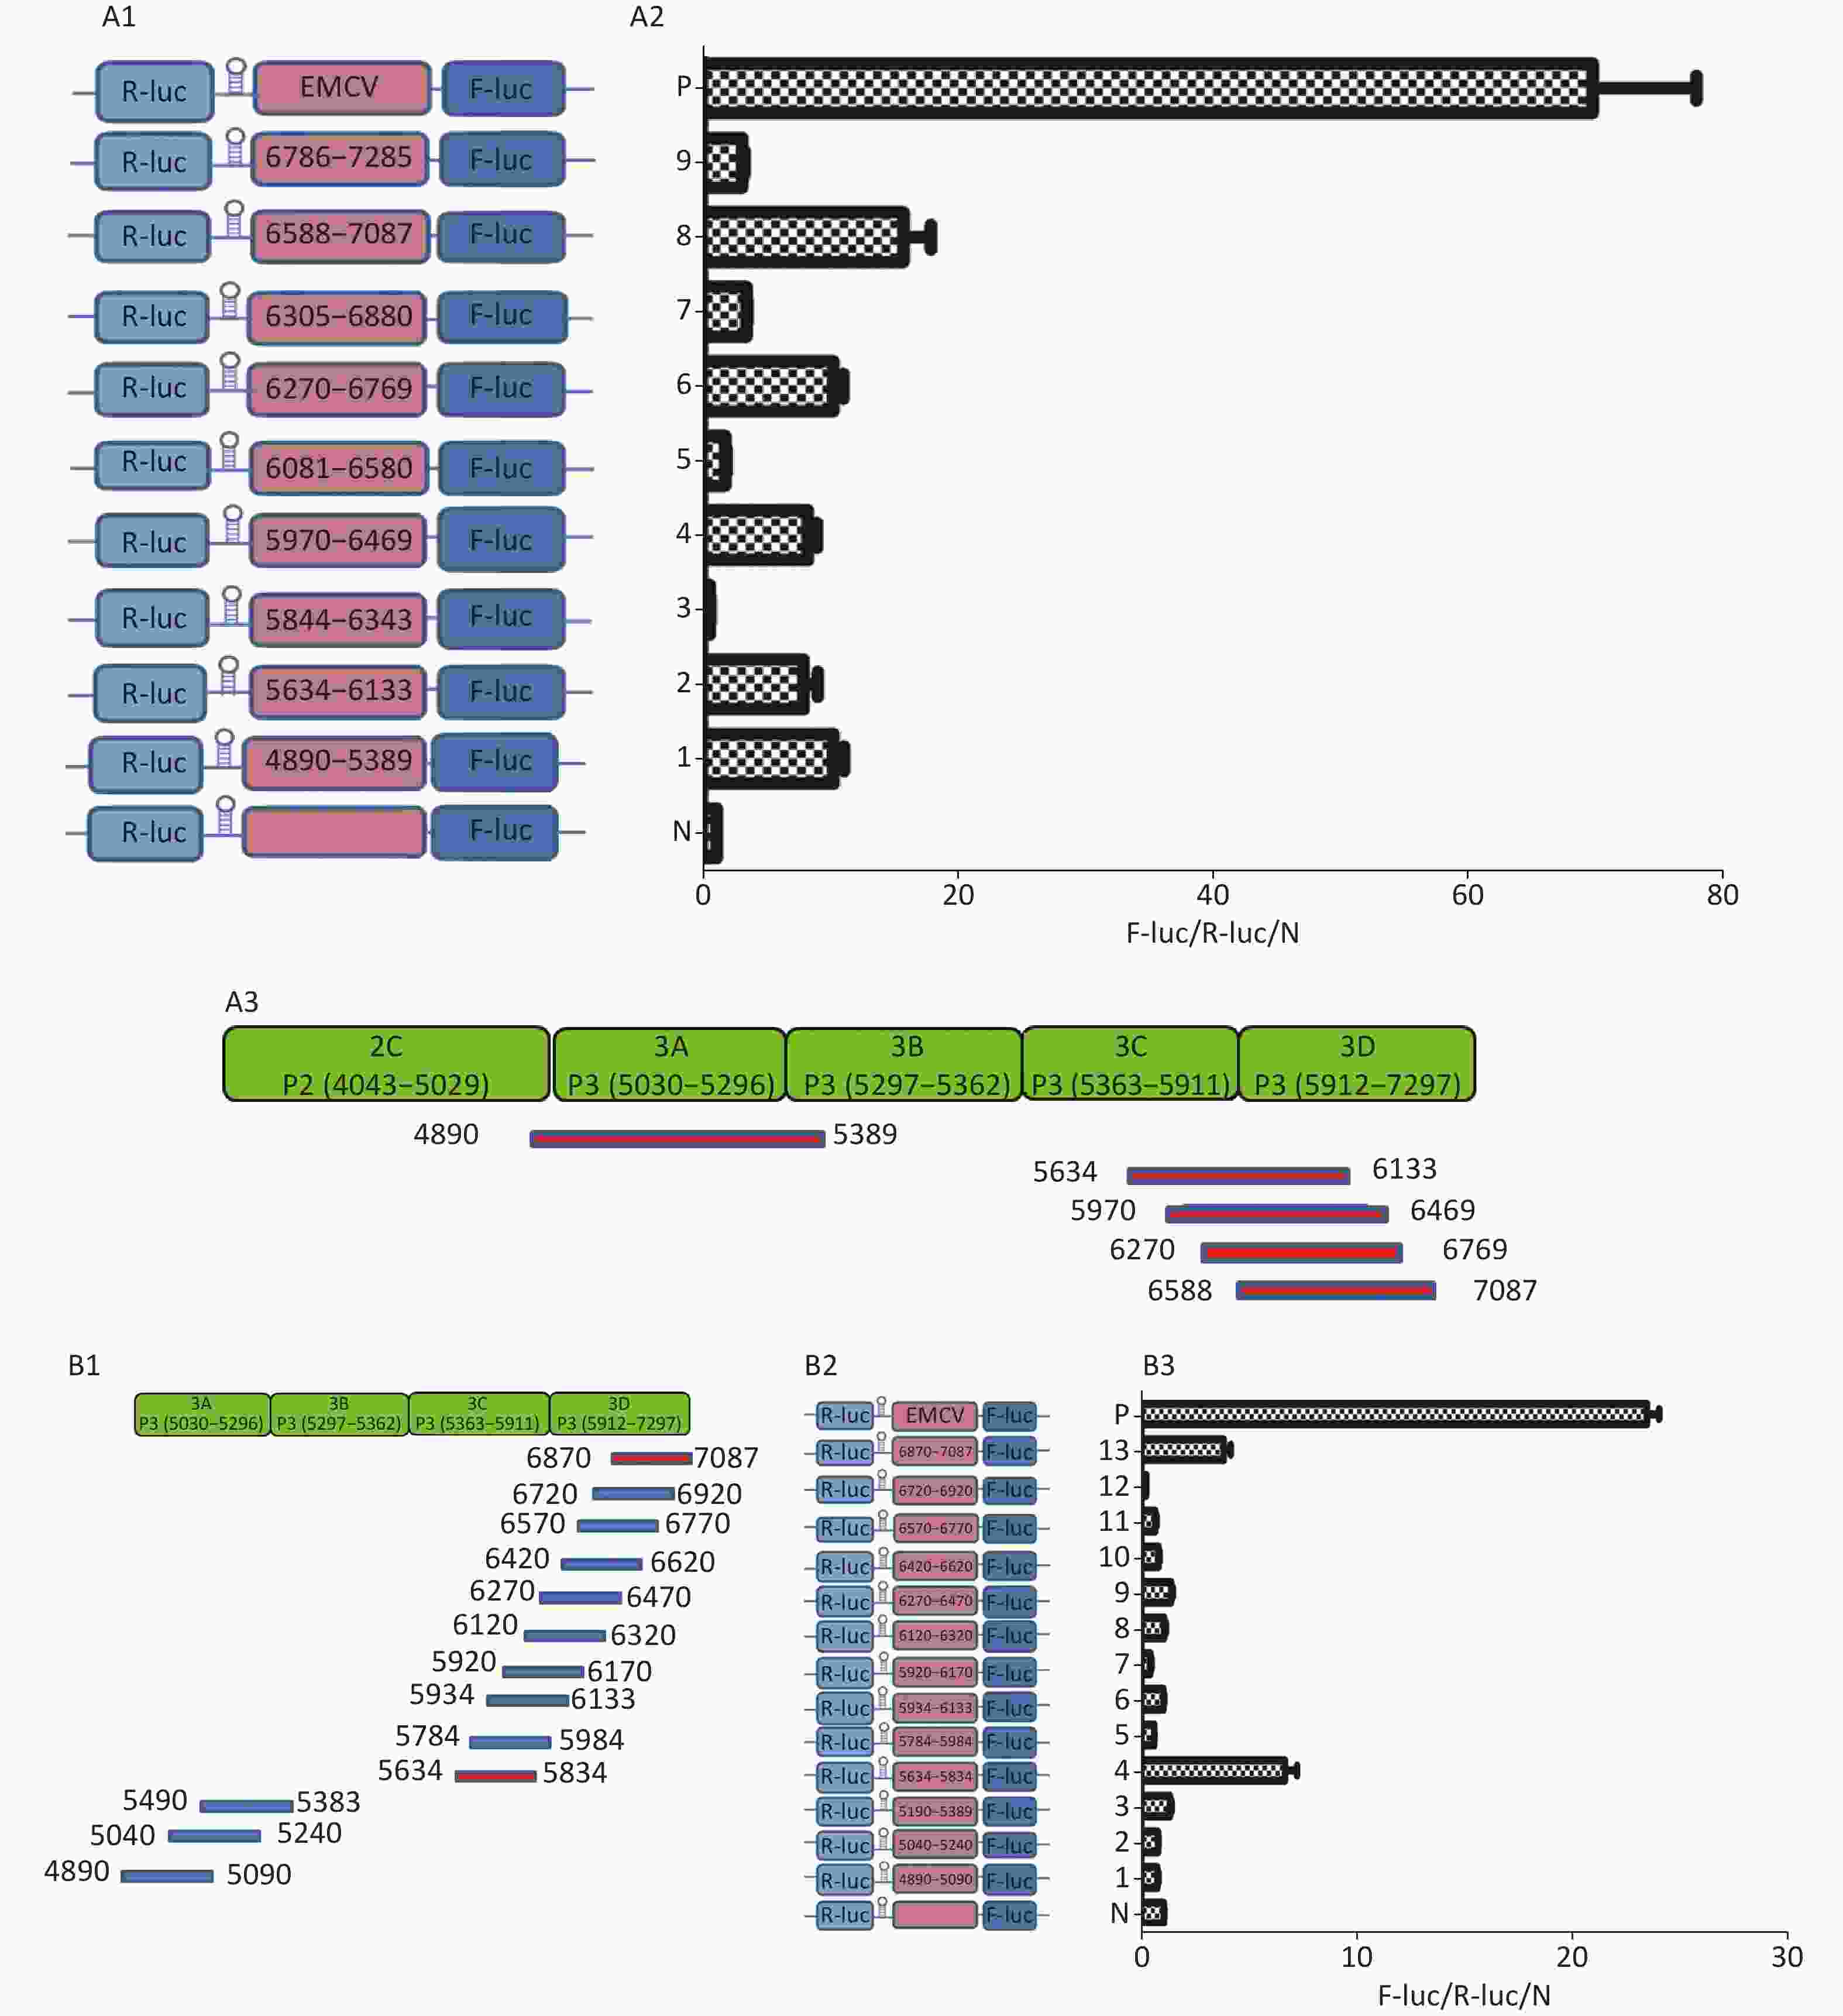
Figure 5. Identification of IRESs in the P3 region. (A) Constructs of bicistronic reportersfor P3 IRESs. Potential IRESs in the P3 region were serially cloned between the hairpin structure and Rluc in bicistronic vectors (A1). Identification of P3 IRESs with bicistronic vectors. pP3 (4890–5389), pP3 (5634–6133), pP3 (5844–6343), pP3 (5970–6469), pP3 (6270–6769), pP3 (6305–6880), pP3 (6583–7087), and pP3 (6786–7285) were transfected into BHK cells, and the Fluc/Rluc activity ratio was compared with that of the negative control (A2). Locations of five positive IRESs in 3A, 3C, and 3D (A3). (B) Mapping of potential IRESs in P3. The IRES sequences at 5634–7087 nt, 4890–5389 nt, and 5634–7087 nt were truncated to 150 bp with 50 bp overlap (B1). Construction of bicistronic reporters of potential P3 IRESs (B2). IRESs in the P3 region were identified with bicistronic vectors. pP3 (4890–5090), pP3 (5040–5240), pP3 (5190–5389), pP3 (5634–5834), pP3 (5784–5984), pP3 (5934–6133), pP3 (5970–6170), pP3 (6120–6320), pP3 (6270–6470), pP3 (6420–6620), pP3 (6570–6770), pP3 (6720–6920), and pP3 (6870–7087) were transfected into BHK cells, and the Fluc/Rluc activity ratio of each vector was compared with that of the negative control (B3). IRESs, internal ribosome entry site; EMCV, encephalomyocarditis virus; Rluc, Renilla luciferase; Fluc, Firefly luciferase.
To further define the IRESs in P3, we truncated the sequences of 4890–5389 nt, 5634–6133 nt, 5970–6469 nt, 6270–6769 nt, and 6583–7087 nt to 150 bp with 50 bp overlap between adjacent sequences (Figure 5B1). The plasmids pP3 (4890–5090), pP3 (5040–5240), pP3 (5190–5389), pP3 (5634–5834), pP3 (5784–5984), pP3 (5934–6133), pP3 (5970–6170), pP3 (6120–6320), pP3 (6270–6470), pP3 (6420–6620), pP3 (6570–6770), pP3 (6720–6920), and pP3 (6870–7087) were constructed as described above (Figure 5B2). After transfection, the Fluc/Rluc activity ratio of pP3 (5634–5834) and pP3 (6870–7087) was 6.5 and 9.8 times that of the negative control, respectively. The Fluc/Rluc activity ratio of pP3 (4890–5090), pP3 (5040–5240), pP3 (5190–5389), pP3 (5784–5984), pP3 (5934–6133), pP3 (5970–6170), pP3 (6120–6320), pP3 (6270–6470), pP3 (6420–6620), pP3 (6570–6770), and pP3 (6720–6920) was less than three times that of the negative control (Figure 5B3). Thus, we concluded that three IRESs in P3 might be located at 4890–5389 nt in the 2C–3A region, 5634–5834 nt in the 3C region, and 6870–7087 nt in the 3D region.
-
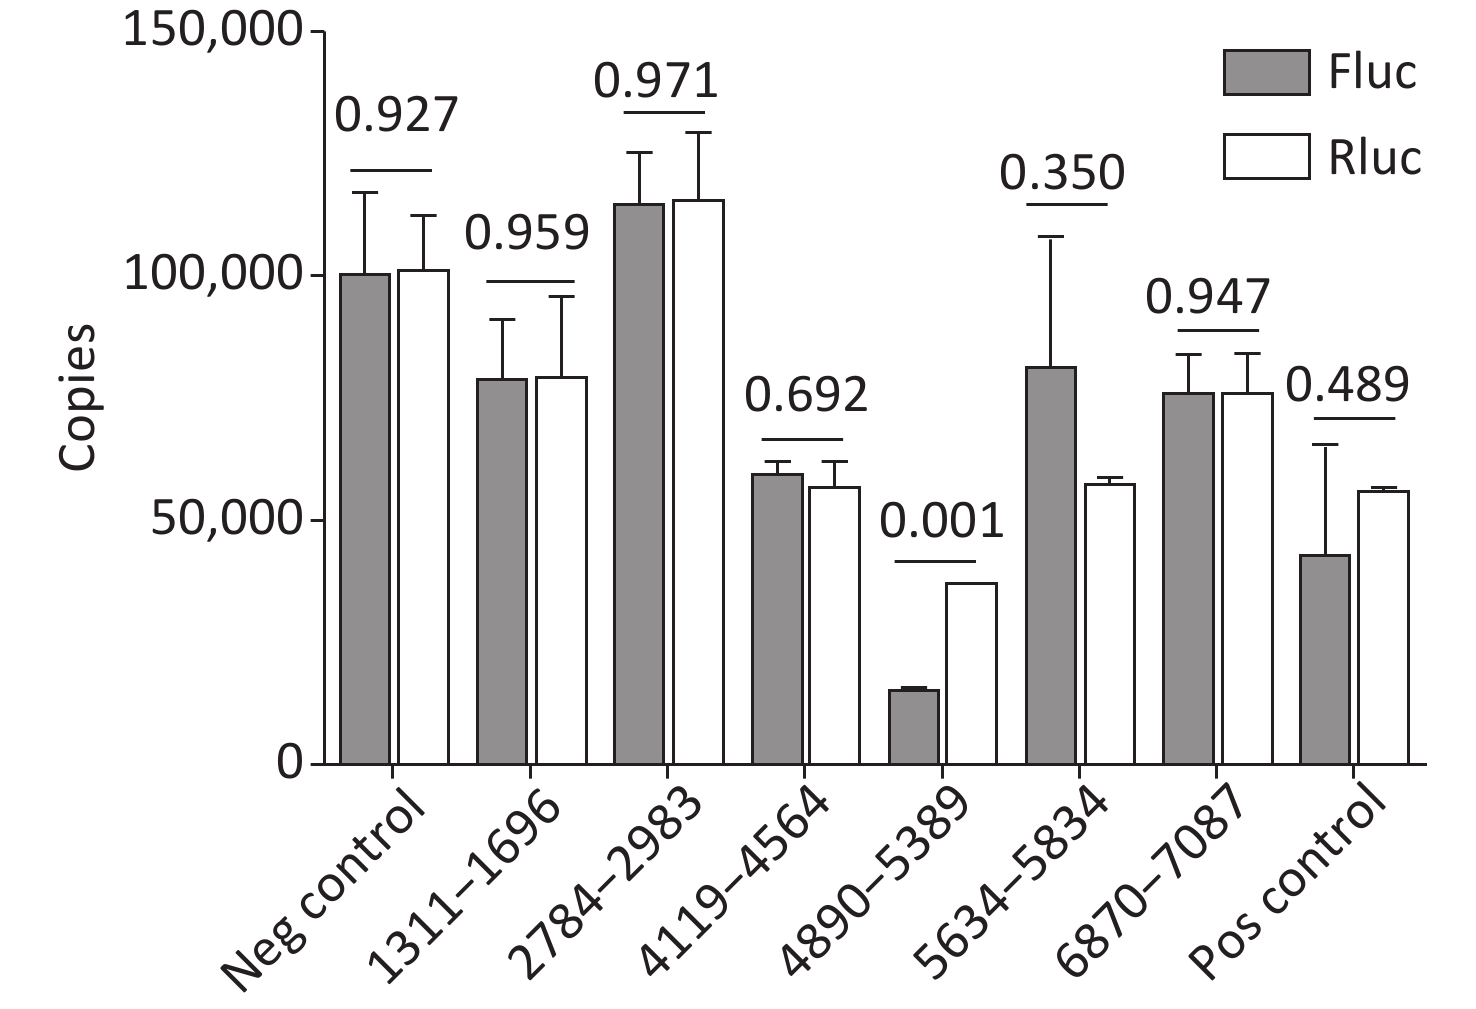
Cryptic promoters or alternative splicing produce abnormal mRNA isoforms. To exclude the possibility of IRESs with cryptic promoters or alternative splicing, we transfected pP1 (1311–1696), pP2 (1311–1646), pP3 (1361–1696), pP3 (1411–1696), pP3 (2784–2983), pP3 (4065–4564), pP3 (4119–4618), pP3 (4890–5389), pP3 (5634–5834), pP3 (6870–7087) and control plasmids into BHK-21 cells. After transfection for 24 h, the mRNA expression of Rluc and Fluc was detected by RT-qPCR. No significant differences were observed in the mRNA expression of Rluc and Fluc from pP1 (1311–1696), pP3 (2784–2983), pP3 (4119–4618), pP (4890–5389), pP3 (5634–5834), pP3 (6870–7087) and control plasmids, except pP3 (4890–5389) (Figure 6). Thus, the five IRESs were located at 1311–1696nt, 2784–2983 nt, 4119–4618 nt, 5634–5834 nt, and 6870–7087 nt.
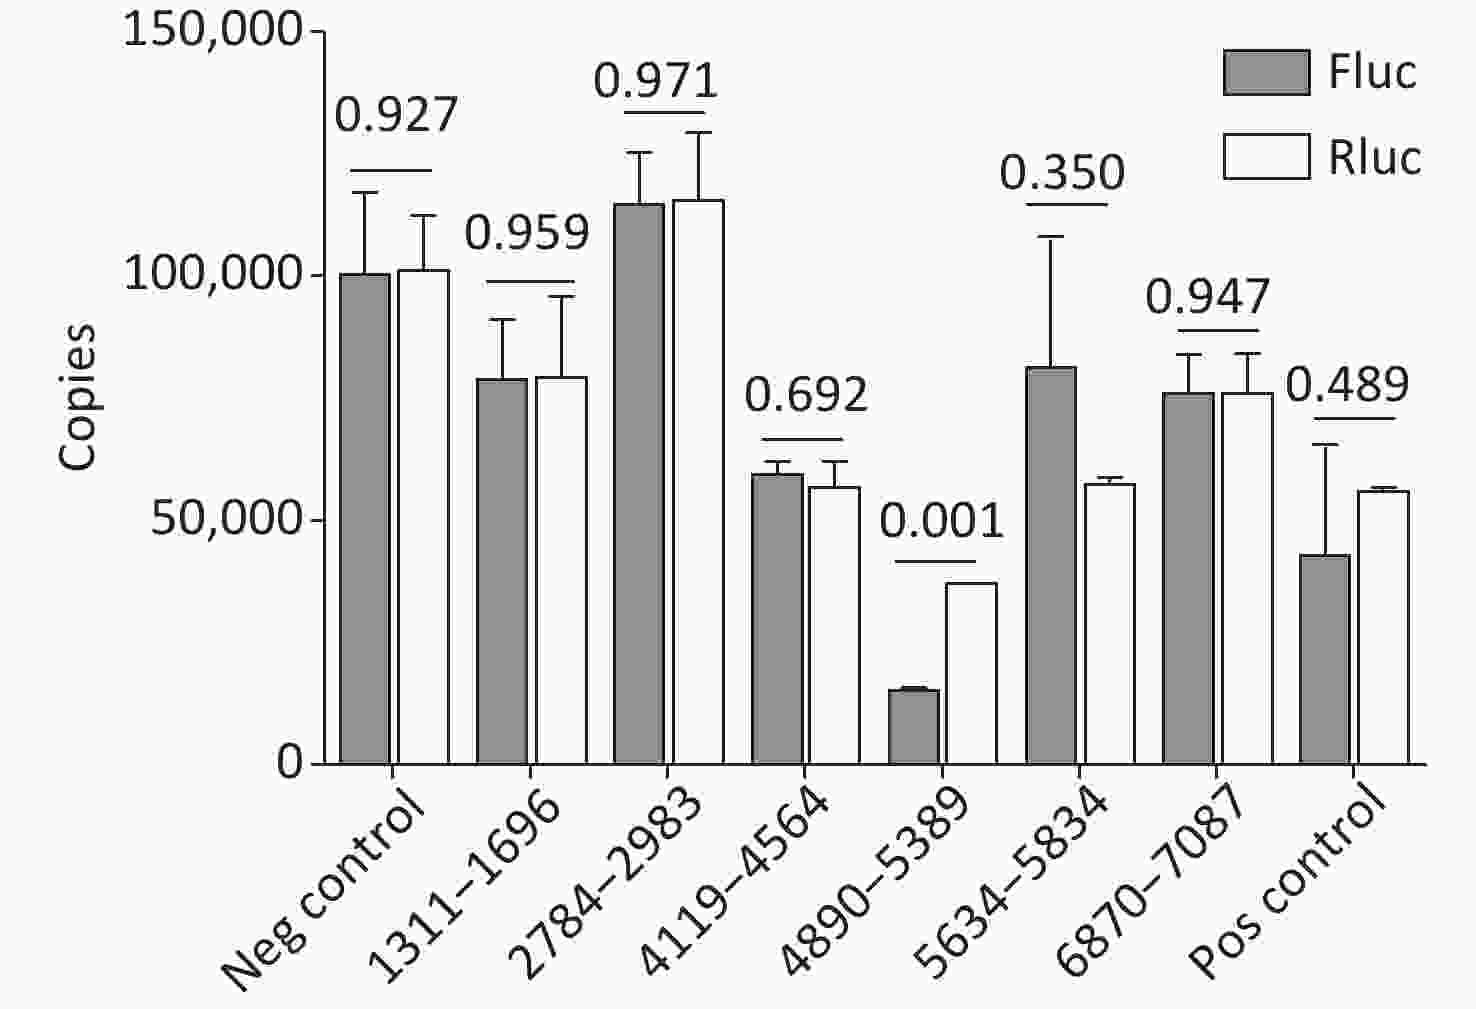
Figure 6. Identification of the integrity of dual luciferase bicistronic mRNAs containing IRESs. The X-axis represents the dual-luciferase reporter vectors, and the Y-axis represents mRNA copies of Rluc and Fluc. Black histogram: Rluc mRNA; white histogram: Fluc mRNA. Experiments were repeated independently three times. Significant difference (P < 0.05). Rluc, Renilla luciferase; Fluc, Firefly luciferase
-
Under cellular stress and viral infection conditions, cap-dependent translation is inhibited, and mRNAs cannot be translated into proteins. Therefore, IRES-mediated cap-independent translation is an alternative mechanism for initiating mRNA translation. Approximately 10% of cellular mRNAs have been estimated to be translated with a cap-independent mechanism involving IRES initiation[17]. IRES-mediated initiation of translation occurs under special physiological conditions, e.g., down-regulated activity of eIF4E[18, 19], and involves DNA damage, hypoxia, nutrient deprivation and viral infection. Under these conditions, cap-dependent translation is globally down-regulated by eIF2α phosphorylation or the cleavage of various cellular initiation factors by viral proteases and cellular caspase proteins[20-23]. Some IRES-mediated cellular mRNAs encode growth factors, and transcription and translation factors. Several studies have also reported that IRES-mediated translation of certain mRNAs is required for tumor growth or vascularization[24], or resistance to apoptosis[24-26]. Many cellular mRNAs, including immunoglobulin heavy chain binding protein (BiP), cat-1Arg/Lys transporter (CAT-1), sodium-coupled neutral amino acid transporter (SNAT2), BAG-1 and serine hydroxymethyltransferase 1 (SHMT1), contain IRES elements in the 5´-UTR[21, 27-30]. Translation of these cellular capped mRNAs is initiated by both cap-dependent and IRES-dependent mechanisms. Furthermore, the IRES elements of some mRNAs are located in the coding regions of the mRNAs, as described in the introduction [12, 13, 31,32]. Translation of such mRNAs results in the production of different protein products, depending on the utilization of the initiation site. Our previous studies have also found that mRNAs of both prion protein[5] and 14-3-3 protein[8] are translated into multiple protein products through IRESs in the coding region. Our studies have also revealed multiple IRESs in the coding region of the HRV16 genome[16]. Thus, we speculate that CVB3 initiates viral protein translation through IRES in not only the genome 5’UTR but also the coding region.
To confirm this hypothesis, we designed the research strategy described in the results. We first screened for the presence of IRESs in the CVB3 genome. Subsequently, we confirmed these potential IRES sequences by using specific bicistronic vectors.
Through this strategy, we found multiple cap-independent proteins through IRESs in the ORF of the CVB3 genome. To identify IRESs in the CVB3 genome, we constructed a vector with a GFP tag to prevent the false discovery of IRESs. The vector expressing GFP fusion protein might have eliminated the possibility of cryptic promoter initiated alternative transcription and perturbed cryptic splicing sites by shortening the IRES sequences. On the basis of molecular weight, GFP was an appropriate indicator protein for detection through western blotting in this study. Preliminarily, the IRES sequences in the CVB3 genome were determined through GFP fusion protein expression. If cap-independent translation occurred in the genome, two protein bands in the same lane would have been detected through anti-GFP western blotting. The number of protein bands was dependent on the number of IRESs in the ORF of the CVB3 genome. After transfection for 24 h, nine fused protein bands between 30 kD and 72 kD appeared in the P1 lane, six fused protein bands between 30 kD and 65 kD appeared in the P2 lane, and nine protein bands between 30 kD and 120 kD appeared in the P3 lane in anti-GFP western blots. The results suggest the existence of multiple IRES sequences in the P1, P2, and P3 coding regions.
Subsequently, the sequences from ATG to the ends of the P1, P2 and P3 regions were introduced into the above vector individually. After transfection, the fused proteins of P1, P2, and P3 were arranged into ladders according to their protein molecular weights in western blotting. On the basis of the principle of IRES-dependent protein translation, six IRES-dependent proteins might be encoded within the P1 coding region, six IRES-dependent proteins might be encoded within the P2 coding region, and nine IRES-dependent proteins might be encoded within the P3 coding region. These proteins maybe initially translated by the IRESs located before the coding sequences of these proteins.
To identify the exact IRES sequences in P1, P2, or P3, we introduced a hairpin structure into the bicistronic constructs to prevent ribosome read through from Rluc to Fluc. To find IRESs in the P1 region, we inserted approximately 500 bp IRES candidate sequences before the adjacent ATG into bicistronic vectors, then detected the activity of Rluc and Fluc. pP1 (1197–1346), pP1 (1311–1810), and pP1 (2484–2983) had higher Fluc/Rluc activity than that of the negative control plasmid. To determine the exact IRES positions, we truncated the sequences of IRESs into 150 bp with 50 bp overlap. The truncated sequences were inserted into bicistronic vectors again, and pP1 (1311–1696), pP1 (1311–1646), pP1 (1411–1696), pP1 (1461–1696), pP1 (1511–1696), and pP1 (2784–2983) were found to have higher Fluc/Rluc activity than that of the negative control plasmid. Thus, we concluded the IRESs in the P1 region were located at 1311–1696 nt of VP2 and 2784–2983 nt of VP1. Similar to the discovered IRESs in the P1 region, the sequence at 4119–4564 nt in 2C might be regarded as a crucial IRES in the P2 region, and the sequences at 5634–5834 nt in the 3C region and 6870–7087 nt in the 3D region might belong to IRESs in the P3 region.
We previously identified six IRESs in the coding region of the HRV 16 genome[16]. The IRES positions in the HRV16 genome were similar to those in CVB3. These included one IRES at VP3 in the P1 region, one IRES at 2C in the P2 region, one IRES at 3AB in the P3 region and two IRESs in 3D of the P3 region. In this study, one potential IRES located at 4890–5389 nt in the 2C–3A region was identified with a specific bicistronic vector. However, we unexpectedly observed that the expression of Rluc mRNA from the vector was much greater than that of Fluc in the 4890–5389 nt bicistronic construct. Whether the IRES might lead to alternative splicing requires further study.
In conclusion, we found five IRESs in the coding region of the CVB3 genome. One was located in VP2 (1461–1646) of P1, one was located in VP1 (2784–2983) of P1, one was located in 2C (4119–4564) of P2, one was located in 3C (5634–5834) of P3, and one was located in 3D (6870–7087) of P3. Interestingly, several IRESs in the CVB3 genome, such as P1 (1311–1696) and P1 (2784–2983), were more efficient than the classical EMCV IRES.
-
SONG Qin Qin performed the experiments, analysis and interpretation of data, and drafted the manuscript. LUO Xiao Nuan, SHI Bing Tian, LIU Mi, SONG Juan, XIA Dong, and XIA Zhi Qiang contributed to interpretation of data. HAN Jun and YAO Hai Lan contributed to the conception and design of the study, and revised the manuscript. All authors read and approved the final manuscript.
-
The authors declare no competing interests.
doi: 10.3967/bes2022.043
-
Abstract:
Objective This study aimed to identify internal ribosome entry sites (IRESs) in the open reading frame (ORF) of the Coxsackievirus B3 (CVB3) genome. Methods The sequences of P1, P2, or P3 of the CVB3 genome or the truncated sequences from each antithymocyte globulin (ATG) to the end of the P1, P2, or P3 gene were inserted into the pEGFP-N1 vector. After transfection, possible IRES-dependent green fluorescent protein (GFP)-fused proteins were detected by anti-GFP western blotting. The sequences of possible IRESs were inserted into specific Fluc/Rluc bicistronic vectors, in which the potential IRESs were determined according to the Fluc/Rluc activity ratio. Expression of Fluc and Rluc mRNA of the bicistronic vector was detected by RT-qPCR. Results After transfection of full length or truncated sequences of the P1, P2, or P3 plasmids, six GFP-fused protein bands in P1, six bands in P2 and nine bands in P3 were detected through western blotting. Two IRESs in VP2 (1461–1646 nt) and VP1 (2784–2983 nt) of P1; one IRES in 2C (4119–4564 nt) of P2; and two IRESs in 3C (5634–5834 nt) and 3D (6870–7087 nt) of P3 were identified according to Fluc/Rluc activity ratio. The cryptic promoter was also excluded by RT-qPCR. Conclusion Five IRESs are present in the CVB3 coding region. -
Figure 1. Possible cap-independent translation of P1, P2, and P3 genes of CVB3 in vitro. After transfection of plasmids bearing P1, P2, or P3 genes fused with GFP, nine bands in P1, six bands in P2 and nine bands in P3 were identified by anti-GFP western blotting. The protein molecular weight markers are indicated at left. GFP, green fluorescent protein.
Figure 2. Screening of IRES translation in the coding region of CVB3. (A) Schematic diagram of IRES screening plasmids with sequences from each ATG to the end of P1 (A1), P2 (A2), or P3 (A3). (B) After transfection of plasmids pP1 (735–3304), pP1 (1235–3304), pP1 (1343–3304), pP1 (1478–3304), pP1 (1559–3304), pP1 (1697–3304), pP1 (1751–3304), pP1 (1811–3304), pP1 (2093–3304), pP1 (2183–3304), pP1 (2984–3304), and pP1 (3089–3304), potential IRES-dependent translation of P1 was identified by anti-GFP western blotting (B1). After transfection of plasmids pP2 (3284–5029), pP2 (3284–5029), pP2 (3671–5029), pP2 (3737–5029), pP2 (4028–5029), pP2 (4073–5029), pP2 (4364–5029), pP2 (4619–5029), and pP2 (4955–5029), potential IRES-dependent translation of P2 was identified by anti-GFP western blotting (B2). After transfection of plasmids pP3 (4754–7297), pP3 (4955–7297), pP3 (5390–7297), pP3 (5507–7297), pP3 (4765–7297), pP3 (6134–7297), pP3 (6344–7297), pP3 (6470–7297), pP3 (6581–7297), pP3 (6770–7297), pP3 (6881–7297), and pP3 (7088–7297), potential IRES-dependent translation ofP3 was identified by anti-GFP western blotting (B3). IRES, internal ribosome entry site; GFP, green fluorescent protein; ATG, antithymocyte globulin.
Figure 3. Identification of IRESs in the P1 coding region. (A) Schematic diagram of IRES identifying bicistronic vectors with a hairpin structure between the Rluc and putative IRES sequence. (B) Schematic diagram of identification of P1 IRESs. The potential IRES sequences of the P1 coding region were serially cloned into the bicistronic vectors (B1). pP1 (735–1234), pP1 (1197–1346), pP1 (1311–1810), pP1 (2376–2876), pP1 (2784–2983), and pP1 (2589–3088) were transfected into BHK cells. The Fluc/Rluc ratio of each vector was calculated and compared with that of the negative control (B2). The locations of three positive IRESs in P1 (B3). (C) Schematic diagram of shortened potential IRES sequences in VP2–VP3 region. The sequence at 1197–1810 nt was serially shortened with a 50 bp overlap between adjacent sequences (C1). Schematic diagram of shortened potential IRES sequences inserted into the bicistronic vectors (C2). IRES identification in VP2–VP3 through the constructed bicistronic vector. pP1 (1197–1346), pP1 (1297–1446), pP1 (1297–1446), pP1 (1397–1546), pP1 (1497–1546), pP1 (1597–1646), and pP1 (1697–1810) were transfected into BHK cells, and the Fluc/Rluc activity ratio of each vector was calculated and compared with that of the negative control (C3). (D) Schematic diagram of shortened potential IRES sequences in the VP1 region (D1). Schematic diagram of shortened P1 sequences inserted in bicistronic vectors (D2). IRES identification in the VP1 region through constructed bicistronic vectors. pP1 (2484–2683), pP1 (2654–2833), and pP1 (2784–2983) were transfected into BHK cells, and the Fluc/Rluc activity ratio of each vector was calculated and compared with that of the negative control (D3). (E) Schematic diagram of truncated IRES sequence at 1311–1810 nt in the VP2 region (E1). Schematic diagram of 50 bp deletion IRES sequences inserted into the bicistronic vectors (E2). pP1 (1311–1696), pP1 (1311–1646), pP1 (1311–1596, pP1 (1311–1546), pP1 (1311–1496), pP1 (1361–1696), pP1 (1411–1696), pP1 (1461–1696), or pP1 (1511–1696) was transfected into BHK cells, and the Fluc/Rluc activity ratioof each vector was compared with that of the negative control (E3). IRESs, internal ribosome entry site; EMCV, encephalomyocarditis virus; Rluc, Renilla luciferase; Fluc, Firefly luciferase.
Figure 4. Identification of IRESs in the P2 region. Schematic diagram of IRES bicistronic reportersfor P2. The sequence before the ATG start codon of the P2 region was serially cloned between the hairpin structure and Fluc of the bicistronic vectors (A). pP2 (3171–3670), pP2 (3528–4027), pP2 (3864–4363), pP2 (4065–4564), pP2 (4119–4618), and pP2 (4455–4954) were transfected into BHK cells, and the Fluc/Rluc activity ratio of each vector was compared with that of the negative control (B). Locations of two positive IRESs in P2 (C). IRESs, internal ribosome entry site; EMCV, encephalomyocarditis virus; Rluc, Renilla luciferase; Fluc, Firefly luciferase.
Figure 5. Identification of IRESs in the P3 region. (A) Constructs of bicistronic reportersfor P3 IRESs. Potential IRESs in the P3 region were serially cloned between the hairpin structure and Rluc in bicistronic vectors (A1). Identification of P3 IRESs with bicistronic vectors. pP3 (4890–5389), pP3 (5634–6133), pP3 (5844–6343), pP3 (5970–6469), pP3 (6270–6769), pP3 (6305–6880), pP3 (6583–7087), and pP3 (6786–7285) were transfected into BHK cells, and the Fluc/Rluc activity ratio was compared with that of the negative control (A2). Locations of five positive IRESs in 3A, 3C, and 3D (A3). (B) Mapping of potential IRESs in P3. The IRES sequences at 5634–7087 nt, 4890–5389 nt, and 5634–7087 nt were truncated to 150 bp with 50 bp overlap (B1). Construction of bicistronic reporters of potential P3 IRESs (B2). IRESs in the P3 region were identified with bicistronic vectors. pP3 (4890–5090), pP3 (5040–5240), pP3 (5190–5389), pP3 (5634–5834), pP3 (5784–5984), pP3 (5934–6133), pP3 (5970–6170), pP3 (6120–6320), pP3 (6270–6470), pP3 (6420–6620), pP3 (6570–6770), pP3 (6720–6920), and pP3 (6870–7087) were transfected into BHK cells, and the Fluc/Rluc activity ratio of each vector was compared with that of the negative control (B3). IRESs, internal ribosome entry site; EMCV, encephalomyocarditis virus; Rluc, Renilla luciferase; Fluc, Firefly luciferase.
Figure 6. Identification of the integrity of dual luciferase bicistronic mRNAs containing IRESs. The X-axis represents the dual-luciferase reporter vectors, and the Y-axis represents mRNA copies of Rluc and Fluc. Black histogram: Rluc mRNA; white histogram: Fluc mRNA. Experiments were repeated independently three times. Significant difference (P < 0.05). Rluc, Renilla luciferase; Fluc, Firefly luciferase
-
[1] Hellen CUT, Sarnow P. Internal ribosome entry sites in eukaryotic mRNA molecules. Genes Dev, 2001; 15, 1593−612. doi: 10.1101/gad.891101 [2] Ray PS, Grover R, Das S. Two internal ribosome entry sites mediate the translation of p53 isoforms. EMBO Rep, 2006; 7, 404−10. doi: 10.1038/sj.embor.7400623 [3] Pelletier J, Sonenberg N. Internal initiation of translation of eukaryotic mRNA directed by a sequence derived from poliovirus RNA. Nature, 1988; 334, 320−5. doi: 10.1038/334320a0 [4] Jang SK, Kräusslich HG, Nicklin MJ, et al. A segment of the 5' nontranslated region of encephalomyocarditis virus RNA directs internal entry of ribosomes during in vitro translation. J Virol, 1988; 62, 2636−43. doi: 10.1128/jvi.62.8.2636-2643.1988 [5] Luo XN, Song QQ, Yu J, et al. Identification of the internal ribosome entry sites (IRES) of prion protein gene. Int J Biochem Cell Biol, 2017; 93, 46−51. doi: 10.1016/j.biocel.2017.10.014 [6] Graber TE, Baird SD, Kao PN, et al. NF45 functions as an IRES trans-acting factor that is required for translation of cIAP1 during the unfolded protein response. Cell Death Differ, 2010; 17, 719−29. doi: 10.1038/cdd.2009.164 [7] Qin XL, Sarnow P. Preferential translation of internal ribosome entry site-containing mRNAs during the mitotic cycle in mammalian cells. J Biol Chem, 2004; 279, 13721−8. doi: 10.1074/jbc.M312854200 [8] Song QQ, Luo XN, Chi MM, et al. Identification of internal ribosomal entry site inside open reading frame of 14-3-3β gene. Biomed Environ Sci, 2020; 33, 273−6. [9] Du XF, Gomez CM. Spinocerebellar [corrected] ataxia type 6: molecular mechanisms and calcium channel genetics. Adv Exp Med Biol, 2018; 1049, 147−73. [10] Dos Santos Paparidis NF, Canduri F. The emerging picture of CDK11: genetic, functional and medicinal aspects. Curr Med Chem, 2018; 25, 880−8. doi: 10.2174/0929867324666170815102036 [11] Khan D, Katoch A, Das A, et al. Reversible induction of translational isoforms of p53 in glucose deprivation. Cell Death Differ, 2015; 22, 1203−18. doi: 10.1038/cdd.2014.220 [12] Cornelis S, Bruynooghe Y, Denecker G, et al. Identification and characterization of a novel cell cycle-regulated internal ribosome entry site. Mol Cell, 2000; 5, 597−605. doi: 10.1016/S1097-2765(00)80239-7 [13] Lauring AS, Overbaugh J. Evidence that an IRES within the Notch2 coding region can direct expression of a nuclear form of the protein. Mol Cell, 2000; 6, 939−45. doi: 10.1016/S1097-2765(05)00084-5 [14] Buck CB, Shen XF, Egan MA, et al. The human immunodeficiency virus type 1gag gene encodes an internal ribosome entry site. J Virol, 2001; 75, 181−91. doi: 10.1128/JVI.75.1.181-191.2001 [15] Thiel V, Siddell SG. Internal ribosome entry in the coding region of murine hepatitis virus mRNA 5. J Gen Virol, 1994; 75, 3041−6. doi: 10.1099/0022-1317-75-11-3041 [16] Shi BT, Song QQ, Luo XN, et al. Identification of cryptic putative IRESs within the ORF encoding the nonstructural proteins of the human rhinovirus 16 genome. Arch Virol, 2021; 166, 3373−86. doi: 10.1007/s00705-021-05209-5 [17] Mitchell SA, Spriggs KA, Bushell M, et al. Identification of a motif that mediates polypyrimidine tract-binding protein-dependent internal ribosome entry. Genes Dev, 2005; 19, 1556−71. doi: 10.1101/gad.339105 [18] Johannes G, Carter MS, Eisen MB, et al. Identification of eukaryotic mRNAs that are translated at reduced cap binding complex eIF4F concentrations using a cDNA microarray. Proc Natl Acad Sci USA, 1999; 96, 13118−23. doi: 10.1073/pnas.96.23.13118 [19] Sharathchandra A, Katoch A, Das S. IRES mediated translational regulation of p53 isoforms. Wiley Interdiscip Rev RNA, 2014; 5, 131−9. doi: 10.1002/wrna.1202 [20] Bushell M, Poncet D, Marissen WE, et al. Cleavage of polypeptide chain initiation factor eIF4GI during apoptosis in lymphoma cells: characterisation of an internal fragment generated by caspase-3-mediated cleavage. Cell Death Differ, 2000; 7, 628−36. doi: 10.1038/sj.cdd.4400699 [21] Spriggs KA, Bushell M, Willis AE. Translational regulation of gene expression during conditions of cell stress. Mol Cell, 2010; 40, 228−37. doi: 10.1016/j.molcel.2010.09.028 [22] Jeon YJ, Khelifa S, Ratnikov B, et al. Regulation of glutamine carrier proteins by RNF5 determines breast cancer response to ER stress-inducing chemotherapies. Cancer Cell, 2015; 27, 354−69. doi: 10.1016/j.ccell.2015.02.006 [23] Yaman I, Fernandez J, Liu HY, et al. The zipper model of translational control: a small upstream ORF is the switch that controls structural remodeling of an mRNA leader. Cell, 2003; 113, 519−31. doi: 10.1016/S0092-8674(03)00345-3 [24] Walters B, Thompson SR. Cap-independent translational control of carcinogenesis. Front Oncol, 2016; 6, 128. [25] Bellodi C, Kopmar N, Ruggero D. Deregulation of oncogene-induced senescence and p53 translational control in X-linked dyskeratosis congenita. EMBO J, 2010; 29, 1865−76. doi: 10.1038/emboj.2010.83 [26] Halaby MJ, Harris BRE, Miskimins WK, et al. Deregulation of internal ribosome entry site-mediated p53 translation in cancer cells with defective p53 response to DNA damage. Mol Cell Biol, 2015; 35, 4006−17. doi: 10.1128/MCB.00365-15 [27] Fox JT, Stover PJ. Mechanism of the internal ribosome entry site-mediated translation of serine hydroxymethyltransferase. J Biol Chem, 2009; 284, 31085−96. doi: 10.1074/jbc.M109.035576 [28] Macejak DG, Sarnow P. Internal initiation of translation mediated by the 5' leader of a cellular mRNA. Nature, 1991; 353, 90−4. doi: 10.1038/353090a0 [29] Fernandez J, Yaman I, Huang C, et al. Ribosome stalling regulates IRES-mediated translation in eukaryotes, a parallel to prokaryotic attenuation. Mol Cell, 2005; 17, 405−16. doi: 10.1016/j.molcel.2004.12.024 [30] Gaccioli F, Huang CC, Wang C, et al. Amino acid starvation induces the SNAT2 neutral amino acid transporter by a mechanism that involves eukaryotic initiation factor 2α phosphorylation and cap-independent translation. J Biol Chem, 2006; 281, 17929−40. doi: 10.1074/jbc.M600341200 [31] Maier D, Nagel AC, Preiss A. Two isoforms of the Notch antagonist Hairless are produced by differential translation initiation. Proc Natl Acad Sci USA, 2002; 99, 15480−5. doi: 10.1073/pnas.242596699 [32] Komar AA, Lesnik T, Cullin C, et al. Internal initiation drives the synthesis of Ure2 protein lacking the prion domain and affects [URE3] propagation in yeast cells. EMBO J, 2003; 22, 1199−209. doi: 10.1093/emboj/cdg103 -

 点击查看大图
计量
- 文章访问数: 1900
- HTML全文浏览量: 845
- PDF下载量: 163
- 被引次数: 0

 Quick Links