

 下载:
下载:

-
In December 2019, an outbreak of COVID-19 occurred in Wuhan City in Hubei Province of China. Neighboring Hunan Province launched a Level 1 public health emergency response on January 24, 2020. Chenzhou City, located in the southernmost part of Hunan Province, bordering Guangdong Province and Jiangxi Province, has formed an agglomeration zone for processing trade and labor-intensive industries. At the beginning of the outbreak, most businesses in this region suspended production, and they resumed production gradually after February 10, 2020.
To prevent clustered cases, most companies adopted closed-off management and strictly enforced disinfection measures. All personnel were advised to maintain social distancing, avoid gathering for entertainment activities, wear masks in public places, and strengthen hand hygiene. To evaluate the anxiety of returning employees of labor-intensive enterprises during this special period, we conducted repeated cross-sectional online surveys at three stages of different risk levels, as shown in Figure 1.
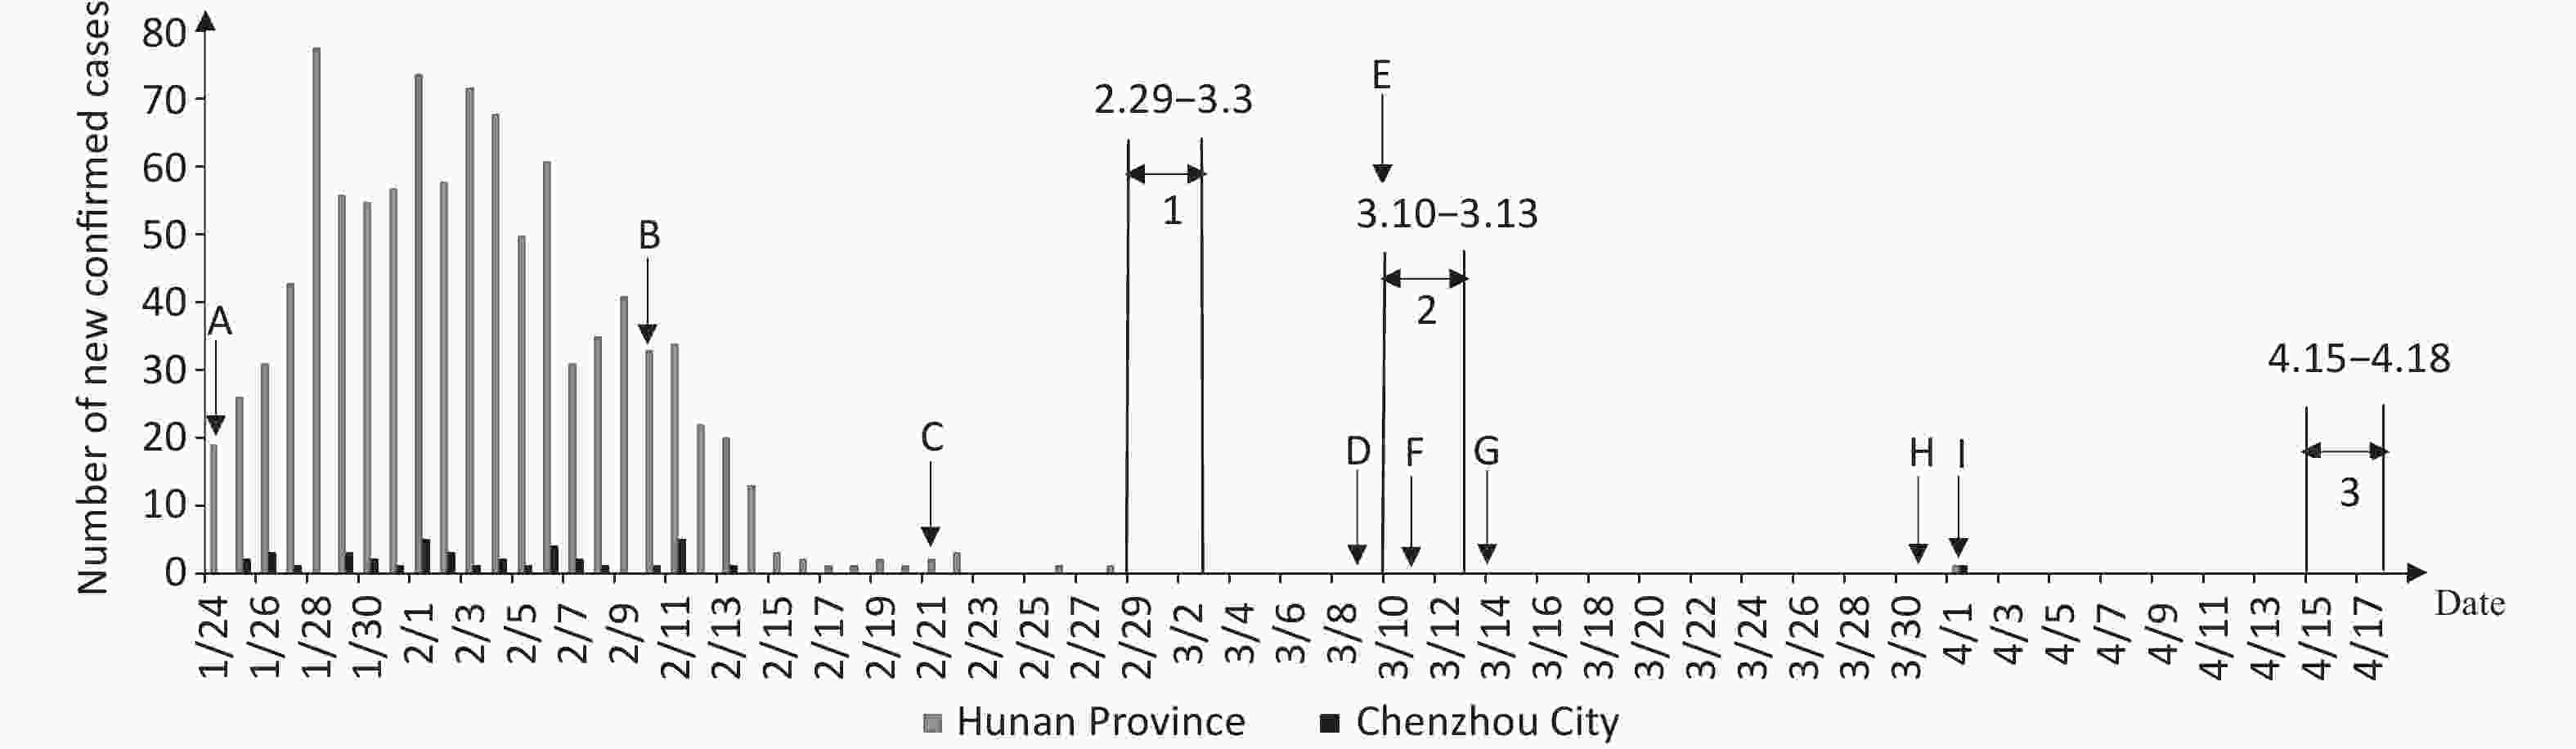
Figure 1. Graph of the pandemic development in Hunan Province and Chenzhou City. A, Hunan Province launched a Level 1 public health emergency response, and Chenzhou City was classified as a medium-risk B area. B, First batch of companies in Chenzhou allowed to officially reopen. C, Chenzhou City was adjusted to a medium-risk C area. D, Chenzhou City was adjusted to a low-risk area. E, Hunan Province emergency response level for COVID-19 was adjusted from Level 1 to Level 2. F, Chenzhou City no longer required reviews and approval for companies to resume operation. G, Number of COVID-19 patients hospitalized in Hunan Province became zero. H, Hunan Province emergency response level for COVID-19 was adjusted from Level 2 to Level 3. I, One new confirmed case of COVID-19 in Chenzhou City, imported from abroad. 1 First survey period, February 29–March 3, 2020. 2 Second survey period, March 10–March 13, 2020. 3 Third survey period, April 15–April 18, 2020.
The survey was conducted on the QuestionStar platform. A link to the questionnaire was posted for employees by the management of enterprises via WeChat or QQ. Employees aged 18 and older returning to work in labor-intensive enterprises in Chenzhou were invited to participate.
The questionnaire had four parts. The first part gathered the demographic information of the participants. The second part was the Chinese version of the Generalized Anxiety Disorder-7 (GAD-7) scale, and its overall score was interpreted as follows: normal (0–4), mild (5–9), moderate (10–14), and severe (15–21) anxiety. The third part asked about the influence of the pandemic on participants. The fourth part evaluated the social care the participants received.
All statistical analyses were carried out using SPSS (version 26.0, IBM Corp, Armonk, NY). Using the anxiety score as the dependent variable, we used the first survey’s results as the baseline data and chose a log-linked negative binomial generalized linear model to compare the change in the anxiety score between the second and the third survey. To explore factors potentially associated with anxiety, incidence rate ratios (IRRs) and 95% CIs were presented. Demographic characteristic variables were controlled for all our models. The significance level was set at α = 0.05.
In the three surveys, 1,043, 1,884, and 3,559 employees completed the survey after providing informed consent. Excluding respondents who worked from home, 812, 1,854, and 3,545 valid questionnaires were obtained. The effective response rate increased from 77.9% in the 1st survey to 99.6% in the 3rd survey. Table 1 shows the demographic characteristics of the respondents. In the first survey, the majority of respondents were male employees (63.3%), while in the second and third surveys, the proportion of female employees increased significantly, accounting for 73.8% and 69.2%, respectively, close to the actual situation before the outbreak. The average age of the respondents was 38.17 ± 7.75 years old, 82.9% were married, 83.9% had not attended university, 66.4% were production-line workers, and 90.9% were living with others.
Table 1. Sample demographics
Characteristics 1st survey 2nd survey 3rd survey Sample (n) 1,043 1,884 3,559 Effective Sample 812 1,854 3,545 Response rate 77.9 98.4 99.6 Gender, n (%) Male 514 (63.3) 486 (26.2) 1,091 (30.8) Female 298 (36.7) 1,368 (73.8) 2,454 (69.2) Age, n (%) < 30 110 (13.5) 198 (10.7) 472 (13.3) 30–39 311 (38.3) 985 (53.1) 1,491 (42.1) 40–49 254 (31.3) 625 (33.7) 1,417 (40.0) ≥ 50 137 (16.9) 46 (2.5) 165 (4.7) Marital status, n (%) Single 104 (12.8) 206 (11.1) 490 (13.8) Married 679 (83.6) 1,559 (84.1) 2,911 (82.1) Divorced/widowed 29 (3.6) 89 (4.8) 144 (4.1) Education attainment, n (%) Junior high school and below 229 (28.2) 1,135 (61.2) 2,136 (60.3) High school/technical secondary school 296 (36.5) 476 (25.7) 937 (26.4) Junior college and above 287 (35.3) 243 (13.1) 472 (13.3) Job position, n (%) Production-line workers 405 (49.9) 1,205 (65.0) 2,515 (70.9) Manager 185 (22.8) 237 (12.8) 388 (10.9) Technical/R&D personnel 58 (7.1) 123 (6.6) 268 (7.6) Clerical/office personnel 65 (8.0) 103 (5.6) 138 (3.9) Others 99 (12.2) 186 (10.0) 236 (6.7) Living arrangement, n (%) Living alone 73 (9.0) 177 (9.5) 317 (8.9) Living with family/friends 601 (74.0) 920 (49.6) 1,789 (50.5) Living with colleagues/others 138 (17.0) 757 (40.8) 1,439 (40.6) How long ago they resumed work, n (%) < 1 week 121 (14.9) 61 (3.3) 39 (0.01) 1 week 221 (27.2) 90 (4.9) 78 (0.02) 2 weeks 224 (27.6) 449 (24.2) 52 (0.02) 3 weeks 186 (22.9) 112 (6.0) 113 (0.03) 4 weeks 60 (7.4) 1,142 (61.6) 3,263 (0.92) Table 2 shows that the rate of anxiety was highest in the first survey, with 15.3% having mild anxiety (95% CI: 12.9%–17.9%), 3.1% having moderate anxiety (95% CI: 2.0%–4.5%), and 1.5% having severe anxiety (95% CI: 0.8%–2.6%). The results were lower than those of general population nationwide at 31.6% (95% CI: 31.2%–32.0%) during the same period [1]. We expected that returning to work would increase anxiety among employees, but the results showed a downward trend in the three surveys. Shi[1] reported that compared with those who did not work or worked from home or without exposure to people at work, the rate of anxiety in people who were exposed to people at work was lower. Tan[2] also found that returning to work did not cause high levels of psychiatric symptoms in the workforce.
Table 2. Anxiety and its temporal trend among returning employees of labor-intensive companies
Survey time Mild anxiety,
n (%, 95% CI)Moderate anxiety,
n (%, 95% CI)Severe anxiety,
n (%, 95% CI)IRR 95% CI 1st survey 124 (15.3, 12.9–17.9) 25 (3.1, 2.0–4.5) 12 (1.5, 0.8–2.6) 1 Reference 2nd survey 213 (11.5, 10.1–13.0) 62 (3.3, 2.6–4.3) 26 (1.4, 0.9–2.0) 0.875 0.791–0.969 3rd survey 365 (10.3, 9.3–11.3) 90 (2.5, 2.0–3.1) 48 (1.4, 1.0–1.8) 0.761 0.693–0.836 Note. IRR, incidence rate ratio; CI, confidence interval. Table 3 shows the underlying factors associated with anxiety. In the first survey, increased work stress and reduced expected earnings were associated with high levels of anxiety, possibly due to a lack of understanding and adaptation of returning employees to work patterns during the pandemic. In the second and third surveys, no change in work stress was associated with low anxiety levels, while significantly changed hygiene habits was associated with high anxiety levels. Previous studies have found that individuals with high pollution fear more frequently adopt safety behaviors[3], and there is a positive correlation between disease-related anxiety and safety behaviors[4]. While changes in the hygiene habits of returning employees may not be the result of voluntary choice[5], cumbersome operations may be a constant reminder of the risks of the pandemic, and a reduced risk of infection is associated with lower anxiety. How to relieve the negative emotions while requiring employees to adopt safe behaviors is worth further study.
Table 3. Underlying factors associated with anxiety of returning employees at labor-intensive companies
Characteristics 1st survey 2nd survey 3rd survey IRR 95% CI IRR 95% CI IRR 95% CI Intercept 0.912 0.469–1.772 1.879 0.976–3.617 2.497 1.626–3.833 Work stress Somewhat reduced – – 1 Reference 1 Reference No change 1 Reference 0.442 0.291–0.672 0.366 0.273–0.491 Increased 2.153 1.671–2.773 0.883 0.589–1.324 0.752 0.567–1.098 Significantly increased 2.230 1.657–3.001 1.281 0.838–1.959 0.901 0.668–1.215 Expected income No change 1 Reference 1 Reference 1 Reference Somewhat reduced 1.735 1.172–2.567 1.050 0.862–1.278 1.133 1.007–1.255 Significantly reduced 1.976 1.295–3.015 1.236 0.986–1.549 1.121 0.956–1.314 Unclear 1.861 1.173–2.953 1.145 0.844–1.554 1.070 0.868–1.318 Hygiene habits No change 1 Reference 1 Reference 1 Reference Moderately changed 0.897 0.667–1.207 1.224 1.021–1.467 0.971 0.854–1.104 Relatively significantly changed 1.223 0.921–1.624 1.494 1.238–1.804 1.150 1.004–1.317 Significantly changed 1.220 0.900–1.654 1.539 1.256–1.885 1.063 0.915–1.235 Quality of life No change 1 Reference 1 Reference 1 Reference Somewhat reduced 1.339 1.030–1.742 1.407 1.174–1.685 1.129 0.997–1.279 Significantly reduced 1.261 0.911–1.745 1.425 1.137–1.786 1.349 1.142–1.592 Risk of being infected Somewhat increased 1 Reference 1 Reference 1 Reference No change 0.456 0.280–0.741 0.793 0.504–1.249 0.717 0.533–0.964 Somewhat decreased 0.791 0.498–1.256 0.750 0.483–1.166 0.843 0.632–1.124 Significantly decreased 0.775 0.496–1.209 0.508 0.332–0.779 0.654 0.496–0.861 Corporate care No 1 Reference 1 Reference 1 Reference Yes 0.591 0.447–0.782 0.774 0.652–0.920 0.752 0.657–0.861 Psychological adjustment materials No 1 Reference 1 Reference 1 Reference Yes 1.043 0.785–1.385 0.897 0.751–1.071 0.817 0.713–0.938 Knowing the counseling hotline No 1 Reference 1 Reference 1 Reference Yes 0.842 0.692–1.025 0.726 0.634–0.832 0.850 0.768–0.940 Actively confide to others Rarely 1 Reference 1 Reference 1 Reference Sometimes 0.959 0.694–1.325 1.499 1.202–1.870 1.706 1.450–2.006 Frequently 1.046 0.718–1.524 1.674 1.286–2.177 2.429 2.014–2.931 Amount of false information
they thought they receivedMinority 1 Reference 1 Reference 1 Reference About half 1.128 0.807–1.575 1.034 0.839–1.274 1.345 1.178–1.535 Majority 1.258 0.838–1.888 1.086 0.855–1.379 1.180 1.000–1.391 Note. IRR, incidence rate ratio; CI, confidence interval. Notably, a decline in quality of life was consistently associated with high anxiety, while corporate care for employees was associated with low anxiety. In the first survey, psychological adjustment materials, knowing the counseling hotline, actively confiding in others, and misinformation were not associated with anxiety. In the second and third surveys, actively confiding in others was associated with high anxiety, while knowing the counseling hotline was associated with low anxiety. In the third survey, psychological adjustment materials were also a protective factor. From these results, it can be seen that in the early stage of resuming work, employees had a simple way to regulate their anxiety and tended to passively accept help, while after a period of time, they began to actively seek improvement. Results from a randomized clinical trial during the COVID-19 pandemic showed that a 4-week phone service with a lay person focused on empathetic listening improved loneliness, depression, and anxiety[6]. In addition, we found that people’s trust in pandemic information they received was also related to anxiety (1.345, 95% CI: 1.178–1.535). Wong[7] found that anxiety played a mediating role between using social media to receive COVID-19 information and trust in information. Anxiety symptoms predict a lower level of trust in information.
The current study is not without limitations. First, while the sample is representative of the returning employees across a number of key demographic indicators, the study is prone to a number of sampling biases. The psychological impact of the pandemic on employees may be underestimated, as many individuals were excluded due to rigorous health screening before returning to work. Second, despite the use of multi-stage cross-sectional investigation, it was still not possible to demonstrate the causal relationship between underlying factors and anxiety.
In conclusion, during the outbreak of emerging infectious diseases, the anxiety level of employees in labor-intensive enterprises is not significantly higher than that of the general population. When implementing epidemic prevention measures, enterprise managers should pay attention to the possible negative impact on employees. The negative emotions of returning employees can be alleviated by issuing authoritative information, caring for employees’ emotional needs, improving their life quality, and encouraging them to participate in psychological counseling by telephone.
No potential conflicts of interest were disclosed.
LIU Yu conceived the design, collected data, and wrote the manuscript. WANG Xiao Feng and XIAO Qi Peng designed the questionnaire and collected data. XI Jun Yan analyzed the data. HE Li Ping and LU Ci Yong reviewed the manuscript. HE Ling conceived the design and reviewed the manuscript.
doi: 10.3967/bes2022.077
Impact of COVID-19 Pandemic on the Mental Health of Returning Employees in Labor-Intensive Companies: A Study Based on Repeated Surveys
-
-
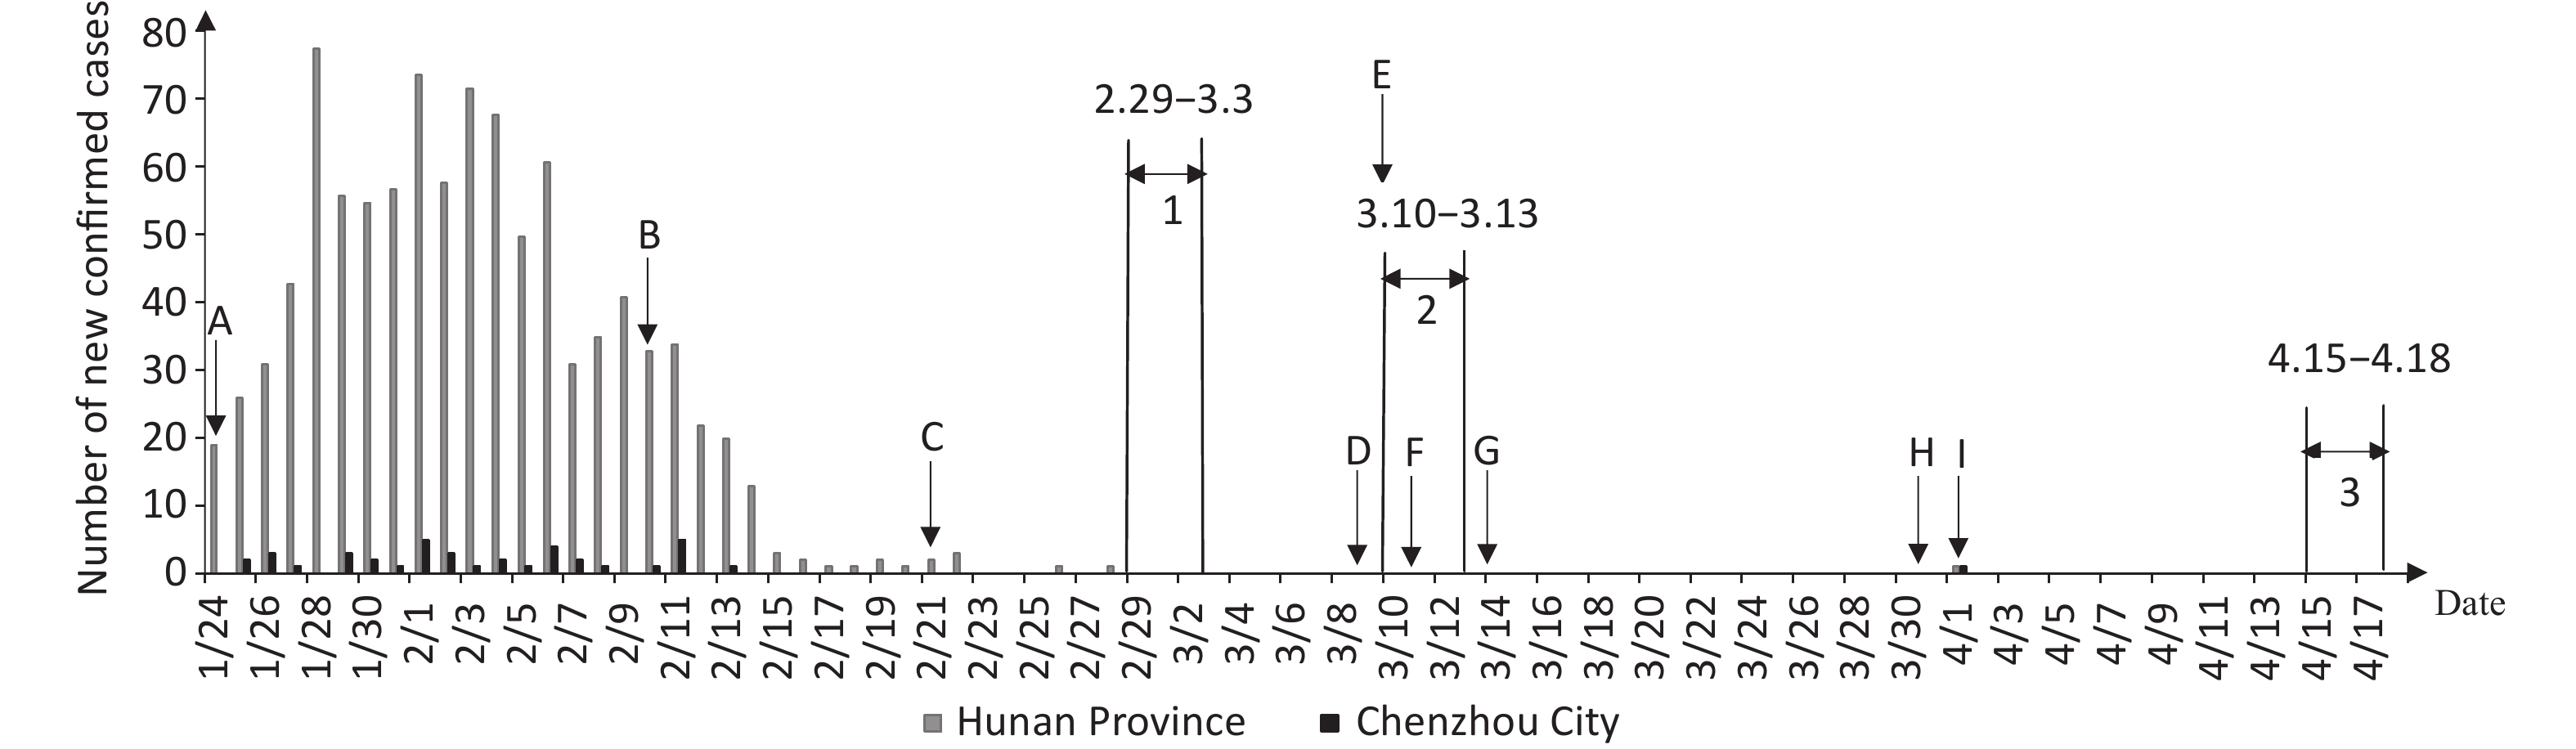
Figure 1. Graph of the pandemic development in Hunan Province and Chenzhou City. A, Hunan Province launched a Level 1 public health emergency response, and Chenzhou City was classified as a medium-risk B area. B, First batch of companies in Chenzhou allowed to officially reopen. C, Chenzhou City was adjusted to a medium-risk C area. D, Chenzhou City was adjusted to a low-risk area. E, Hunan Province emergency response level for COVID-19 was adjusted from Level 1 to Level 2. F, Chenzhou City no longer required reviews and approval for companies to resume operation. G, Number of COVID-19 patients hospitalized in Hunan Province became zero. H, Hunan Province emergency response level for COVID-19 was adjusted from Level 2 to Level 3. I, One new confirmed case of COVID-19 in Chenzhou City, imported from abroad. 1 First survey period, February 29–March 3, 2020. 2 Second survey period, March 10–March 13, 2020. 3 Third survey period, April 15–April 18, 2020.
Table 1. Sample demographics
Characteristics 1st survey 2nd survey 3rd survey Sample (n) 1,043 1,884 3,559 Effective Sample 812 1,854 3,545 Response rate 77.9 98.4 99.6 Gender, n (%) Male 514 (63.3) 486 (26.2) 1,091 (30.8) Female 298 (36.7) 1,368 (73.8) 2,454 (69.2) Age, n (%) < 30 110 (13.5) 198 (10.7) 472 (13.3) 30–39 311 (38.3) 985 (53.1) 1,491 (42.1) 40–49 254 (31.3) 625 (33.7) 1,417 (40.0) ≥ 50 137 (16.9) 46 (2.5) 165 (4.7) Marital status, n (%) Single 104 (12.8) 206 (11.1) 490 (13.8) Married 679 (83.6) 1,559 (84.1) 2,911 (82.1) Divorced/widowed 29 (3.6) 89 (4.8) 144 (4.1) Education attainment, n (%) Junior high school and below 229 (28.2) 1,135 (61.2) 2,136 (60.3) High school/technical secondary school 296 (36.5) 476 (25.7) 937 (26.4) Junior college and above 287 (35.3) 243 (13.1) 472 (13.3) Job position, n (%) Production-line workers 405 (49.9) 1,205 (65.0) 2,515 (70.9) Manager 185 (22.8) 237 (12.8) 388 (10.9) Technical/R&D personnel 58 (7.1) 123 (6.6) 268 (7.6) Clerical/office personnel 65 (8.0) 103 (5.6) 138 (3.9) Others 99 (12.2) 186 (10.0) 236 (6.7) Living arrangement, n (%) Living alone 73 (9.0) 177 (9.5) 317 (8.9) Living with family/friends 601 (74.0) 920 (49.6) 1,789 (50.5) Living with colleagues/others 138 (17.0) 757 (40.8) 1,439 (40.6) How long ago they resumed work, n (%) < 1 week 121 (14.9) 61 (3.3) 39 (0.01) 1 week 221 (27.2) 90 (4.9) 78 (0.02) 2 weeks 224 (27.6) 449 (24.2) 52 (0.02) 3 weeks 186 (22.9) 112 (6.0) 113 (0.03) 4 weeks 60 (7.4) 1,142 (61.6) 3,263 (0.92)  下载: 导出CSV
Table 2. Anxiety and its temporal trend among returning employees of labor-intensive companies
Survey time Mild anxiety,
n (%, 95% CI)Moderate anxiety,
n (%, 95% CI)Severe anxiety,
n (%, 95% CI)IRR 95% CI 1st survey 124 (15.3, 12.9–17.9) 25 (3.1, 2.0–4.5) 12 (1.5, 0.8–2.6) 1 Reference 2nd survey 213 (11.5, 10.1–13.0) 62 (3.3, 2.6–4.3) 26 (1.4, 0.9–2.0) 0.875 0.791–0.969 3rd survey 365 (10.3, 9.3–11.3) 90 (2.5, 2.0–3.1) 48 (1.4, 1.0–1.8) 0.761 0.693–0.836 Note. IRR, incidence rate ratio; CI, confidence interval.
下载: 导出CSV
Table 3. Underlying factors associated with anxiety of returning employees at labor-intensive companies
Characteristics 1st survey 2nd survey 3rd survey IRR 95% CI IRR 95% CI IRR 95% CI Intercept 0.912 0.469–1.772 1.879 0.976–3.617 2.497 1.626–3.833 Work stress Somewhat reduced – – 1 Reference 1 Reference No change 1 Reference 0.442 0.291–0.672 0.366 0.273–0.491 Increased 2.153 1.671–2.773 0.883 0.589–1.324 0.752 0.567–1.098 Significantly increased 2.230 1.657–3.001 1.281 0.838–1.959 0.901 0.668–1.215 Expected income No change 1 Reference 1 Reference 1 Reference Somewhat reduced 1.735 1.172–2.567 1.050 0.862–1.278 1.133 1.007–1.255 Significantly reduced 1.976 1.295–3.015 1.236 0.986–1.549 1.121 0.956–1.314 Unclear 1.861 1.173–2.953 1.145 0.844–1.554 1.070 0.868–1.318 Hygiene habits No change 1 Reference 1 Reference 1 Reference Moderately changed 0.897 0.667–1.207 1.224 1.021–1.467 0.971 0.854–1.104 Relatively significantly changed 1.223 0.921–1.624 1.494 1.238–1.804 1.150 1.004–1.317 Significantly changed 1.220 0.900–1.654 1.539 1.256–1.885 1.063 0.915–1.235 Quality of life No change 1 Reference 1 Reference 1 Reference Somewhat reduced 1.339 1.030–1.742 1.407 1.174–1.685 1.129 0.997–1.279 Significantly reduced 1.261 0.911–1.745 1.425 1.137–1.786 1.349 1.142–1.592 Risk of being infected Somewhat increased 1 Reference 1 Reference 1 Reference No change 0.456 0.280–0.741 0.793 0.504–1.249 0.717 0.533–0.964 Somewhat decreased 0.791 0.498–1.256 0.750 0.483–1.166 0.843 0.632–1.124 Significantly decreased 0.775 0.496–1.209 0.508 0.332–0.779 0.654 0.496–0.861 Corporate care No 1 Reference 1 Reference 1 Reference Yes 0.591 0.447–0.782 0.774 0.652–0.920 0.752 0.657–0.861 Psychological adjustment materials No 1 Reference 1 Reference 1 Reference Yes 1.043 0.785–1.385 0.897 0.751–1.071 0.817 0.713–0.938 Knowing the counseling hotline No 1 Reference 1 Reference 1 Reference Yes 0.842 0.692–1.025 0.726 0.634–0.832 0.850 0.768–0.940 Actively confide to others Rarely 1 Reference 1 Reference 1 Reference Sometimes 0.959 0.694–1.325 1.499 1.202–1.870 1.706 1.450–2.006 Frequently 1.046 0.718–1.524 1.674 1.286–2.177 2.429 2.014–2.931 Amount of false information
they thought they receivedMinority 1 Reference 1 Reference 1 Reference About half 1.128 0.807–1.575 1.034 0.839–1.274 1.345 1.178–1.535 Majority 1.258 0.838–1.888 1.086 0.855–1.379 1.180 1.000–1.391 Note. IRR, incidence rate ratio; CI, confidence interval.
下载: 导出CSV
-
[1] Shi L, Lu ZA, Que JY, et al. Prevalence of and risk factors associated with mental health symptoms among the general population in China during the coronavirus disease 2019 pandemic. JAMA Netw Open, 2020; 3, e2014053. doi: 10.1001/jamanetworkopen.2020.14053 [2] Tan WQ, Hao FY, McIntyre RS, et al. Is returning to work during the COVID-19 pandemic stressful? A study on immediate mental health status and psychoneuroimmunity prevention measures of Chinese workforce. Brain Behav Immun, 2020; 87, 84−92. doi: 10.1016/j.bbi.2020.04.055 [3] Blakey SM, Abramowitz JS. The effects of safety behaviors during exposure therapy for anxiety: critical analysis from an inhibitory learning perspective. Clin Psychol Rev, 2016; 49, 1−15. doi: 10.1016/j.cpr.2016.07.002 [4] Knowles KA, Olatunji BO. Anxiety and safety behavior usage during the COVID-19 pandemic: the prospective role of contamination fear. J Anxiety Disord, 2021; 77, 102323. doi: 10.1016/j.janxdis.2020.102323 [5] Sun CX, He B, Mu D, et al. Public awareness and mask usage during the COVID-19 epidemic: a survey by China CDC New Media. Biomed Environ Sci, 2020; 33, 639−45. [6] Kahlon MK, Aksan N, Aubrey R, et al. Effect of layperson-delivered, empathy-focused program of telephone calls on loneliness, depression, and anxiety among adults during the COVID-19 pandemic: a randomized clinical trial. JAMA Psychiatry, 2021; 78, 616−22. doi: 10.1001/jamapsychiatry.2021.0113 [7] Wong FHC, Liu TY, Leung DKY, et al. Consuming information related to COVID-19 on social media among older adults and its association with anxiety, social trust in information, and COVID-safe behaviors: cross-sectional telephone survey. J Med Internet Res, 2021; 23, e26570. doi: 10.2196/26570 -

 点击查看大图
计量
- 文章访问数: 748
- HTML全文浏览量: 327
- PDF下载量: 37
- 被引次数: 0

 Quick Links