

 下载:
下载:


-
Iodine is an essential trace element for human health. The thyroid gland uses iodine for the synthesis of thyroid hormones. Most iodine comes from food and drinking water, and approximately 85% is excreted through the urine. Therefore, urinary iodine content is an important indicator for judging the iodine nutrition level of a population[1]. A thyroid nodule is a discrete mass resulting from the abnormal proliferation of thyroid cells. Iodine deficiency in the general population has dramatically diminished after implementing universal salt iodization (USI) policies. However, the incidence of thyroid nodules has been reported to be increasing following the implementation of USI, leading some to question the plausibility of USI. This data from Zhao et al. indicated that the prevalence of thyroid nodules after 2002 was higher than the rate before 2002; between 1999 and 2001, 11.0% of those investigated were diagnosed with thyroid nodules, which increased to 24.4% between 2002 and 2014[2]. Controversy exists regarding the relationship between iodine nutritional status and thyroid nodules. Multiple studies have shown a higher incidence of thyroid nodules in iodine-deficient regions[3]. In addition, many researchers have studied the risk factors of thyroid nodules, but their views are only partially consistent. The incidence of thyroid nodules has been reported to result from a combination of factors related to age, sex, dietary habits, lifestyle, iodine status, and psychosocial factors[4]. Our study uses objective data to explore whether iodine nutrition status is associated with thyroid nodule disease. The aim is to eliminate widespread public suspicion and provide evidence for strategies for USI. In addition, we explored other risk factors for thyroid nodule disease to provide a basis for thyroid nodule prevention.
In 2017, we used a hierarchical cluster sampling method based on different administrative divisions and different geographical locations in Fujian Province, China, divided into two levels: inland-coastal and urban-rural areas. Nine cities exist in Fujian Province. One urban survey site and one rural survey site were selected for each city. A total of 18 survey sites in four different geographic regions of Fujian Province were surveyed in this study: coastal urban survey sites, inland urban survey sites, coastal rural survey sites, and inland rural survey sites.
Respondents selected residents aged 8–75 years who had lived in the local area for at least 5 years. Their ages were grouped as follows: 8–15 years, 16–25 years, 26–35 years, 36–45 years, 46–55 years, 56–65 years, and 66–75 years; 30 individuals in each age group were investigated, with an equal number of males and females.
The study’s exclusion criteria included pregnant women, lactating women, those with recent (< 6 months) coronary angiography, Endoscopic Retrograde Cholangiopancreatography (ERCP), using iodinated contrast media and amiodarone medication, those with abnormal renal function, those with mental illness, and those who could not properly understand or answer the questionnaire.
After the ethical review, investigated participants were invited to various communities to read and sign informed consent. A B-mode ultrasound of the thyroid gland with a probe frequency of 7.5 MHz was performed by physicians with formal training in thyroid gland imaging, and the presence of thyroid nodules was documented.
Participants were interviewed face-to-face using a structured questionnaire by uniformly trained Centers for Disease Control and Prevention (CDC) and community investigators. The questionnaire’s main content included information on demographic characteristics and health status. Additionally, we gathered data on how much salt was ingested, how much fruit and vegetables were consumed, and how much meat, seafood, and iodine-rich meals were consumed.
After the questionnaire, 5 mL of urine was collected from each participant. Collected urine samples were stored in sealed plastic tubes and refrigerated at 4 °C. Urinary iodine concentration (UIC) was measured using cerium arsenical catalytic spectrophotometry, and median UIC (mUIC) was used for iodine nutrition evaluation. The iodine nutritional status of adults was determined according to the criteria recommended by World Health Organization/United Nations International Children’s Emergency Fund/International Council for the Control of Iodine Deficiency Disorders (WHO/UNICEF/ICCIDD). Insufficient iodine intake was defined as mUIC < 100 μg/L; adequate iodine intake as mUIC 100–199 μg/L; iodine intake above the requirement as mUIC 200–299 μg/L; and excessive iodine intake as mUIC ≥ 300 μg/L.
Table salt was collected from each systematically selected household, and no less than 30 g of each sample was used to determine the salt iodine concentration via direct titration. The homogenized mixed sample was obtained, labeled, and coded with the sampling date, source of salt, and batch number. Each sample was analyzed in triplicate, and the average sample concentration was used to calculate the iodine concentration. The standard for salt iodine level in Fujian province is 25 mg/kg. The salt type is defined as follows: qualified iodized salt, salt iodine > 18 mg/kg and < 33 mg/kg, and other unqualified iodized salts when < 18 mg/kg or > 33 mg/kg. The iodized salt content below 5 mg/kg is categorized as non-iodized salt.
Drinking water was sampled at each selected point. If the monitoring site was centralized, two samples were obtained at the end of the water supply. For decentralized water supply areas, water sources from the eastern, southern, western, northern, and central regions were selected with two sources chosen from each region, and the median value was computed. Samples were collected in screw-capped polyethylene bottles. Water iodine determination was performed according to the recommended detection method.
SPSS 20.0 (C) Copyright IBM Corp. 2011 (Armonk, New York, USA) was used for data analysis. Continuous variables are expressed as means ± standard deviation or median and interquartile range (IQR), whereas categorical variables are expressed as counts and percentages. Additionally, categorical and continuous variables were compared, and chi-square and t-tests were performed for participants with and without thyroid nodules. Because urinary iodine is not normally distributed, UICs are expressed as medians and IQRs; Wilcoxon’s test was then used to assess differences in non-coastal rural area (UICs). Lastly, we implemented a binary logistic regression model to analyze the risks of thyroid nodules. P < 0.05 was considered statistically significant.
Thyroid B-ultrasound examinations were conducted on 3,926 individuals across four survey regions, leading to the gathering of 46 water samples, 578 salt samples, 3,926 urine samples, and 3,325 questionnaires in total (Supplementary Table S1, available in www.besjournal.com). The average age of participants was 39.9 ± 20.6 years old [39.8 ± 20.7 years old for males and 40.0 ± 20.4 for females, with no significant difference (P = 0.4)].
Table S1. Summary of the general situation of this survey
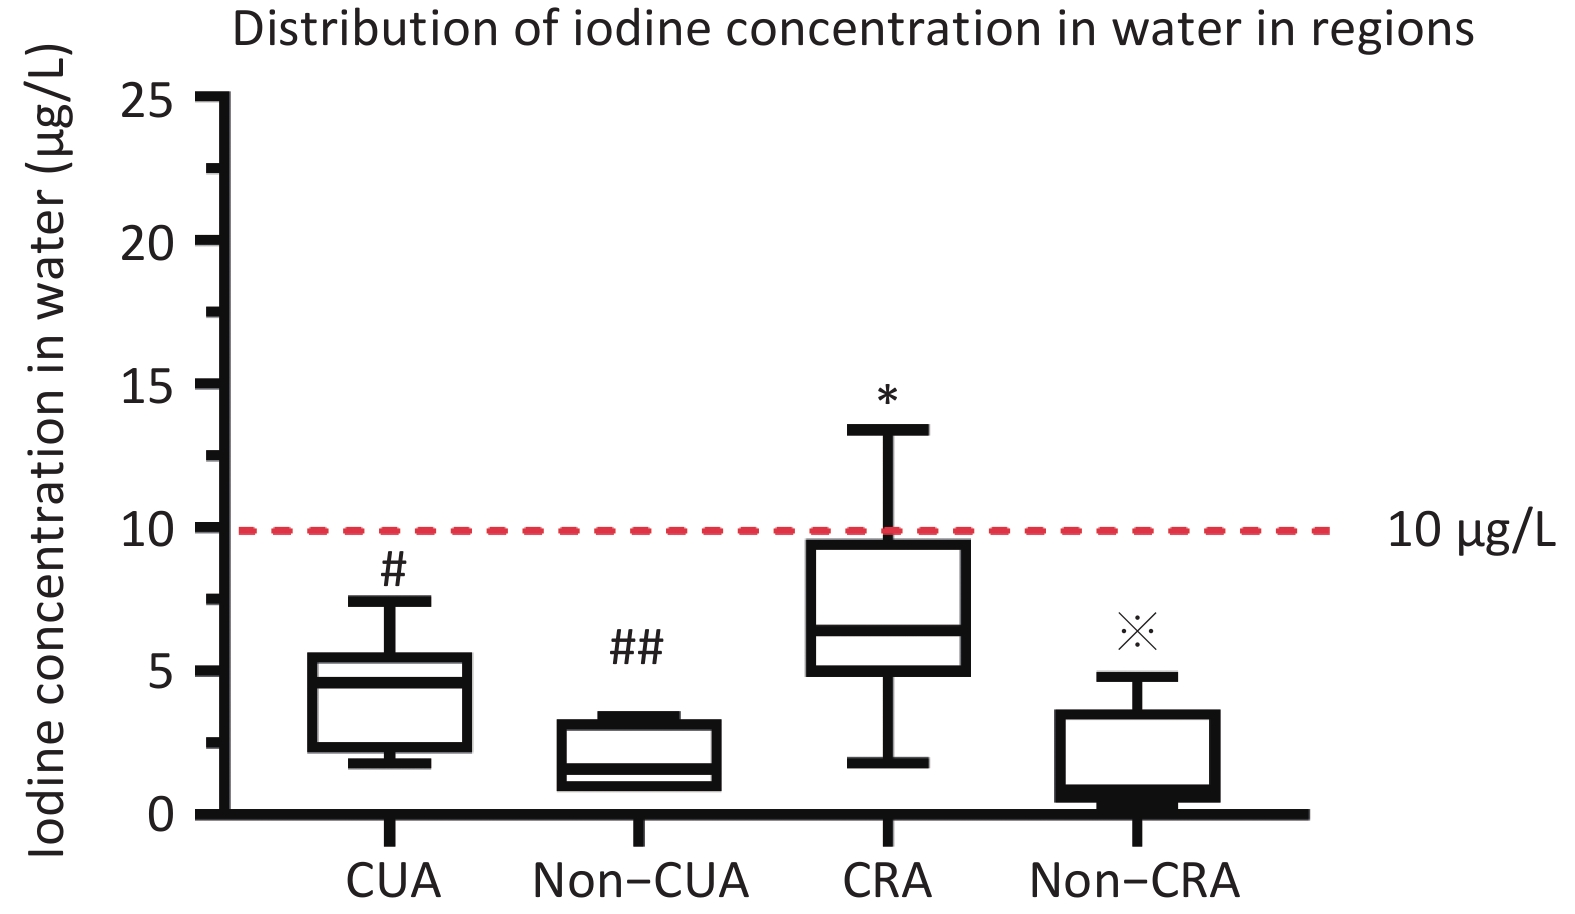
District Water samples Salt sample Urine sample B ultrasonic Questionnaire coastal urban area(CUA) 13 203 1,317 1,317 1,113 non–coastal urban area (Non-CUA) 6 96 649 649 551 coastal rural area(CRA) 19 190 1,315 1,315 1,106 non–coastal rural area (Non-CRA) 8 89 645 645 555 All 46 578 3,926 3,926 3,325 Note. CUA: coastal urban area; Non-CUA: non–coastal urban area; CRA: coastal rural area; Non-CRA: non-coastal rural area. The coastal urban survey sites (Jimei District of Xiamen City, Chengxiang District of Putian City, Taijiang District of Fuzhou City, Jiaocheng District of Ningde City, Licheng District of Quanzhou City, and Xiangcheng District of Zhangzhou City), The inland urban survey sites (Xinluo District of Longyan City, Yanping District of Nanping City, and the Sanyuan District of Sanming City), The coastal rural survey sites (Xiang’an District of Xiamen City, Licheng District of Putian City, Changle City of Fuzhou, Xiapu County of Ningde City, Nan’an City of Yangzhou City, and Dongshan County of Zhangzhou City), The inland rural survey sites (the Zhangping City of Longyan City, Jian’ou city of Nanping City, and Mingxi County of Sanming City). The median water iodine concentration across Fujian Province was 4.6 μg/L (P25: 1.9 μg/L; P75: 6.4 μg/L). The iodine content of drinking water was < 10 μg/L in 91.3% of the 18 survey platforms. The median concentration of iodine in water was observed to be less than 10 μg/L across all four investigation areas (non-CUA: 1.6 μg/L, CUA: 4.6 μg/L, CRA: 6.3 μg/L, non-CRA: 0.8 μg/L) (P < 0.001) (Supplementary Figure S1, available in www.besjournal.com).
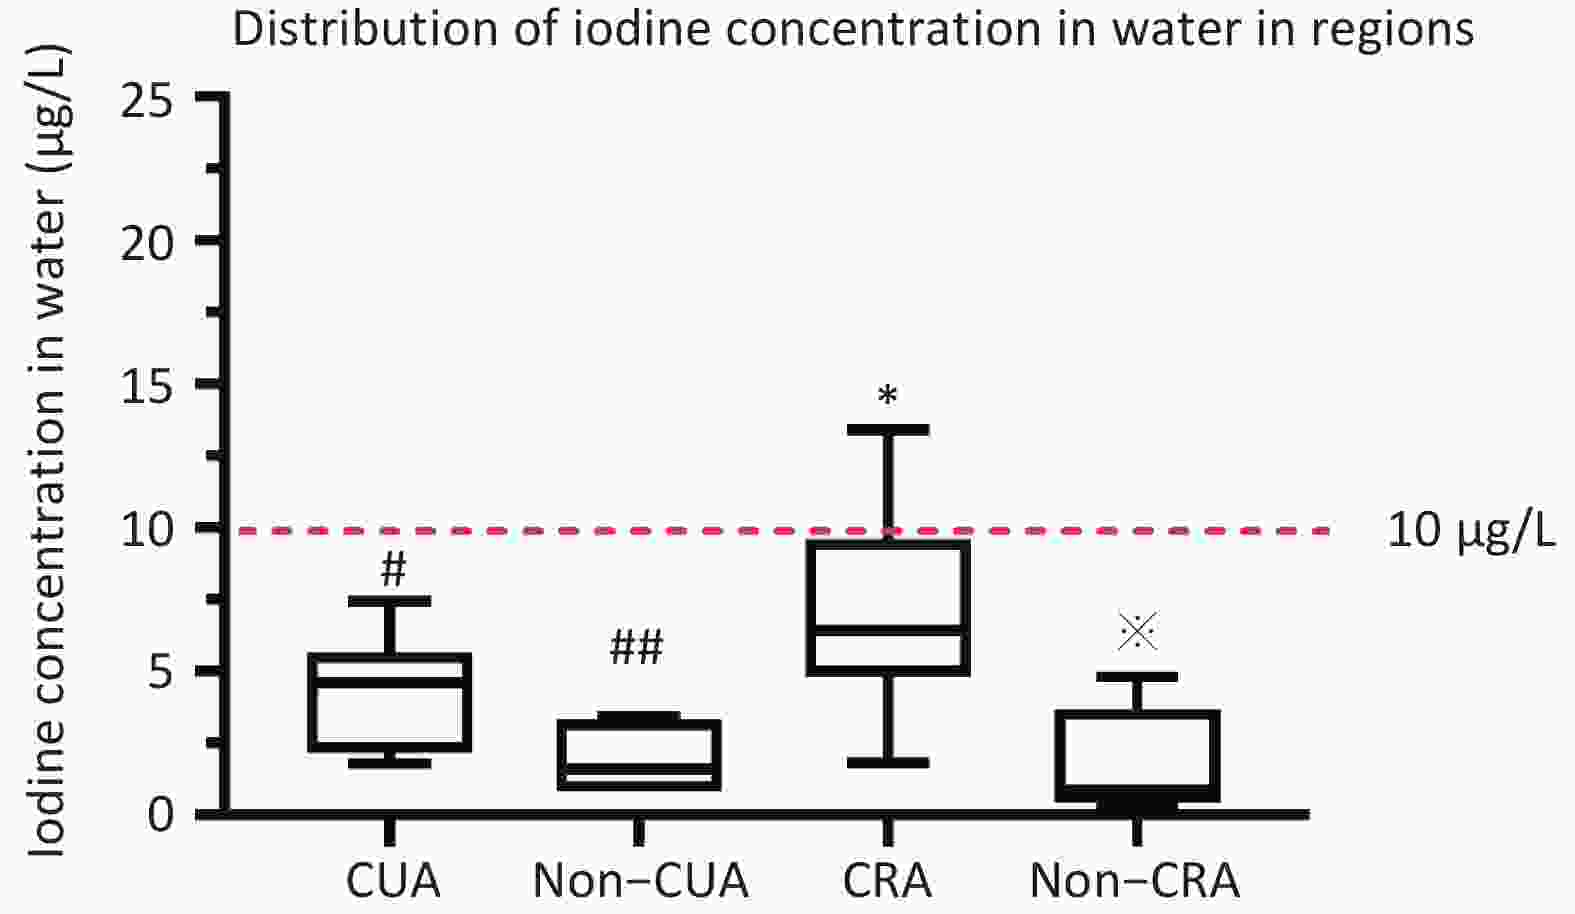
Figure S1. Distribution of mWIU in regions. #Median water iodine concentration (mWIC) of CRA was significantly higher compared to CUA (P < 0.05). ##Median water iodine concentration (mWIC) of Non-CUA was significantly lower compared to CUA (P < 0.05). *Median water iodine concentration (mWIC) of CRA was significantly higher compared to Non-CRA (P < 0.05). Median water iodine concentration (mWIC) of Non-CRA was significantly lower compared to Non-CUA (P < 0.05).
The median salt iodine concentration (mSIC) in Fujian Province was 23.2 mg/kg (P25: 21.3 mg/kg; P75: 24.6 mg/kg), and the qualified rate of iodized salt was 83.3%. As shown in Supplementary Figure S2 (available in www.besjournal.com), the mSIC was approximately 23.0 mg/kg in all regions. The exception was CRA (eligible iodized salt coverage of 66%), which exceeded 90% in the remaining regions (Supplementary Figure S2).
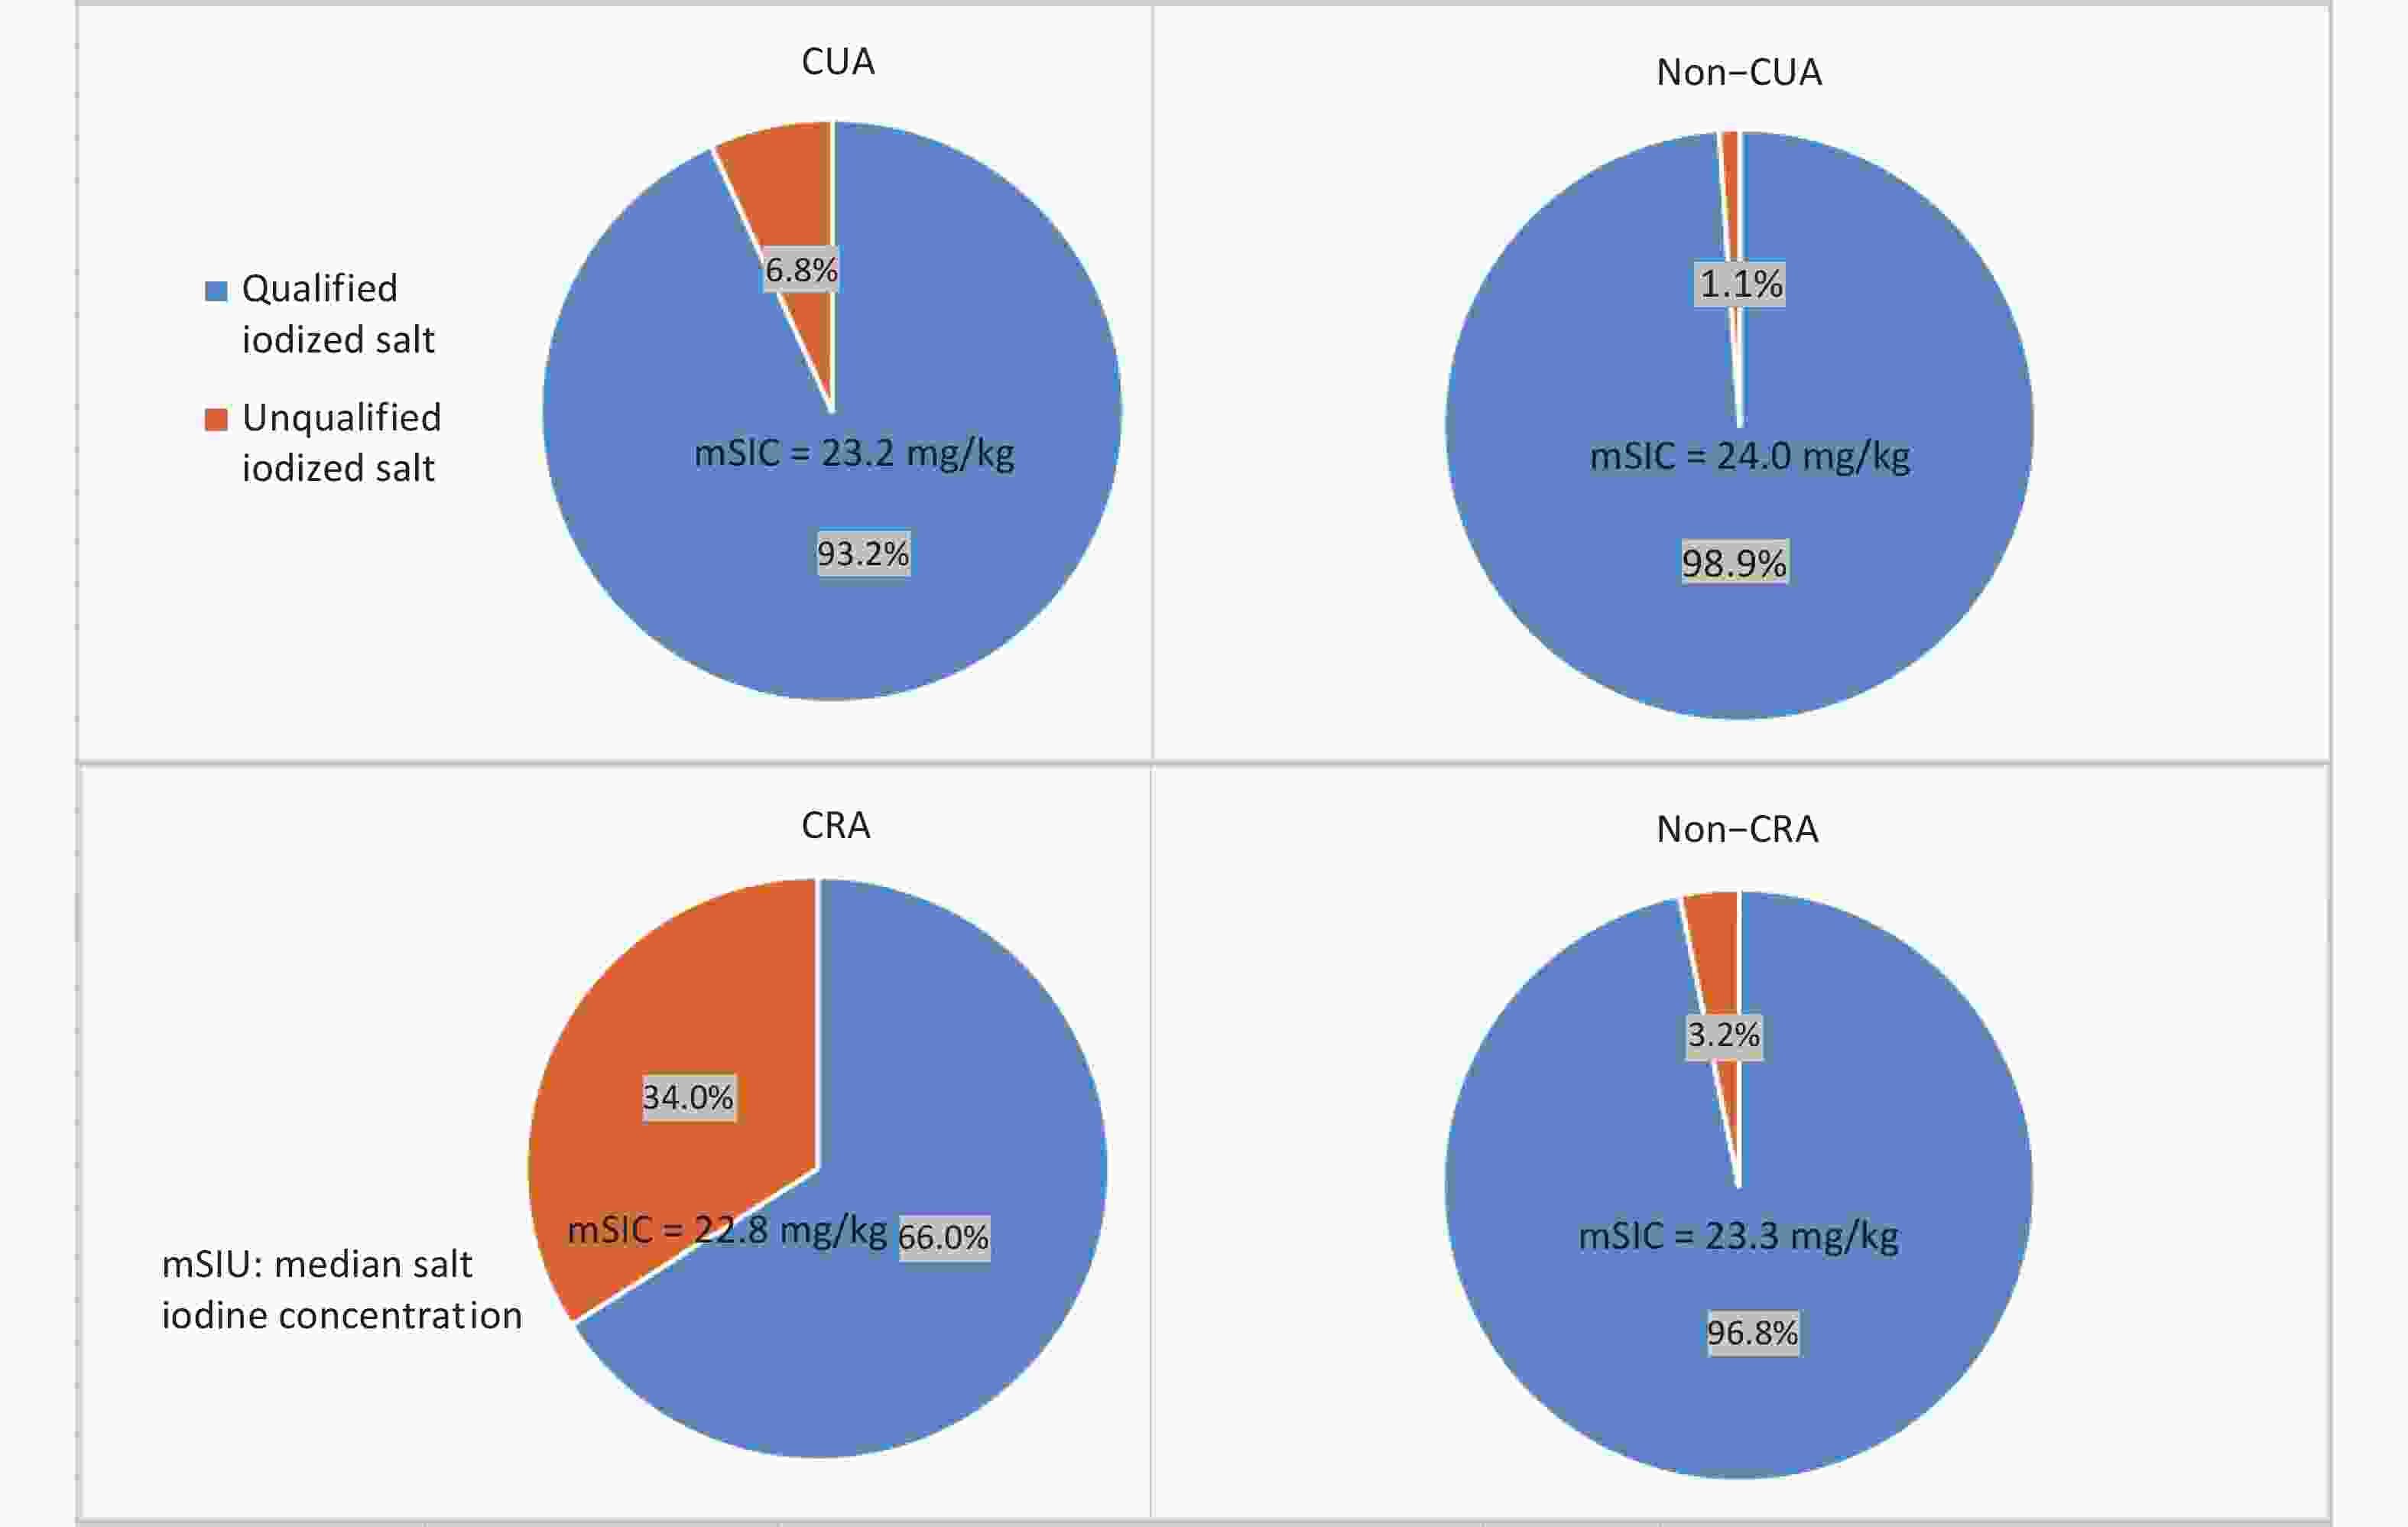
Figure S2. The percentage of qualified iodized and unqualified iodized salt collected from households from different regions in the year 2017.
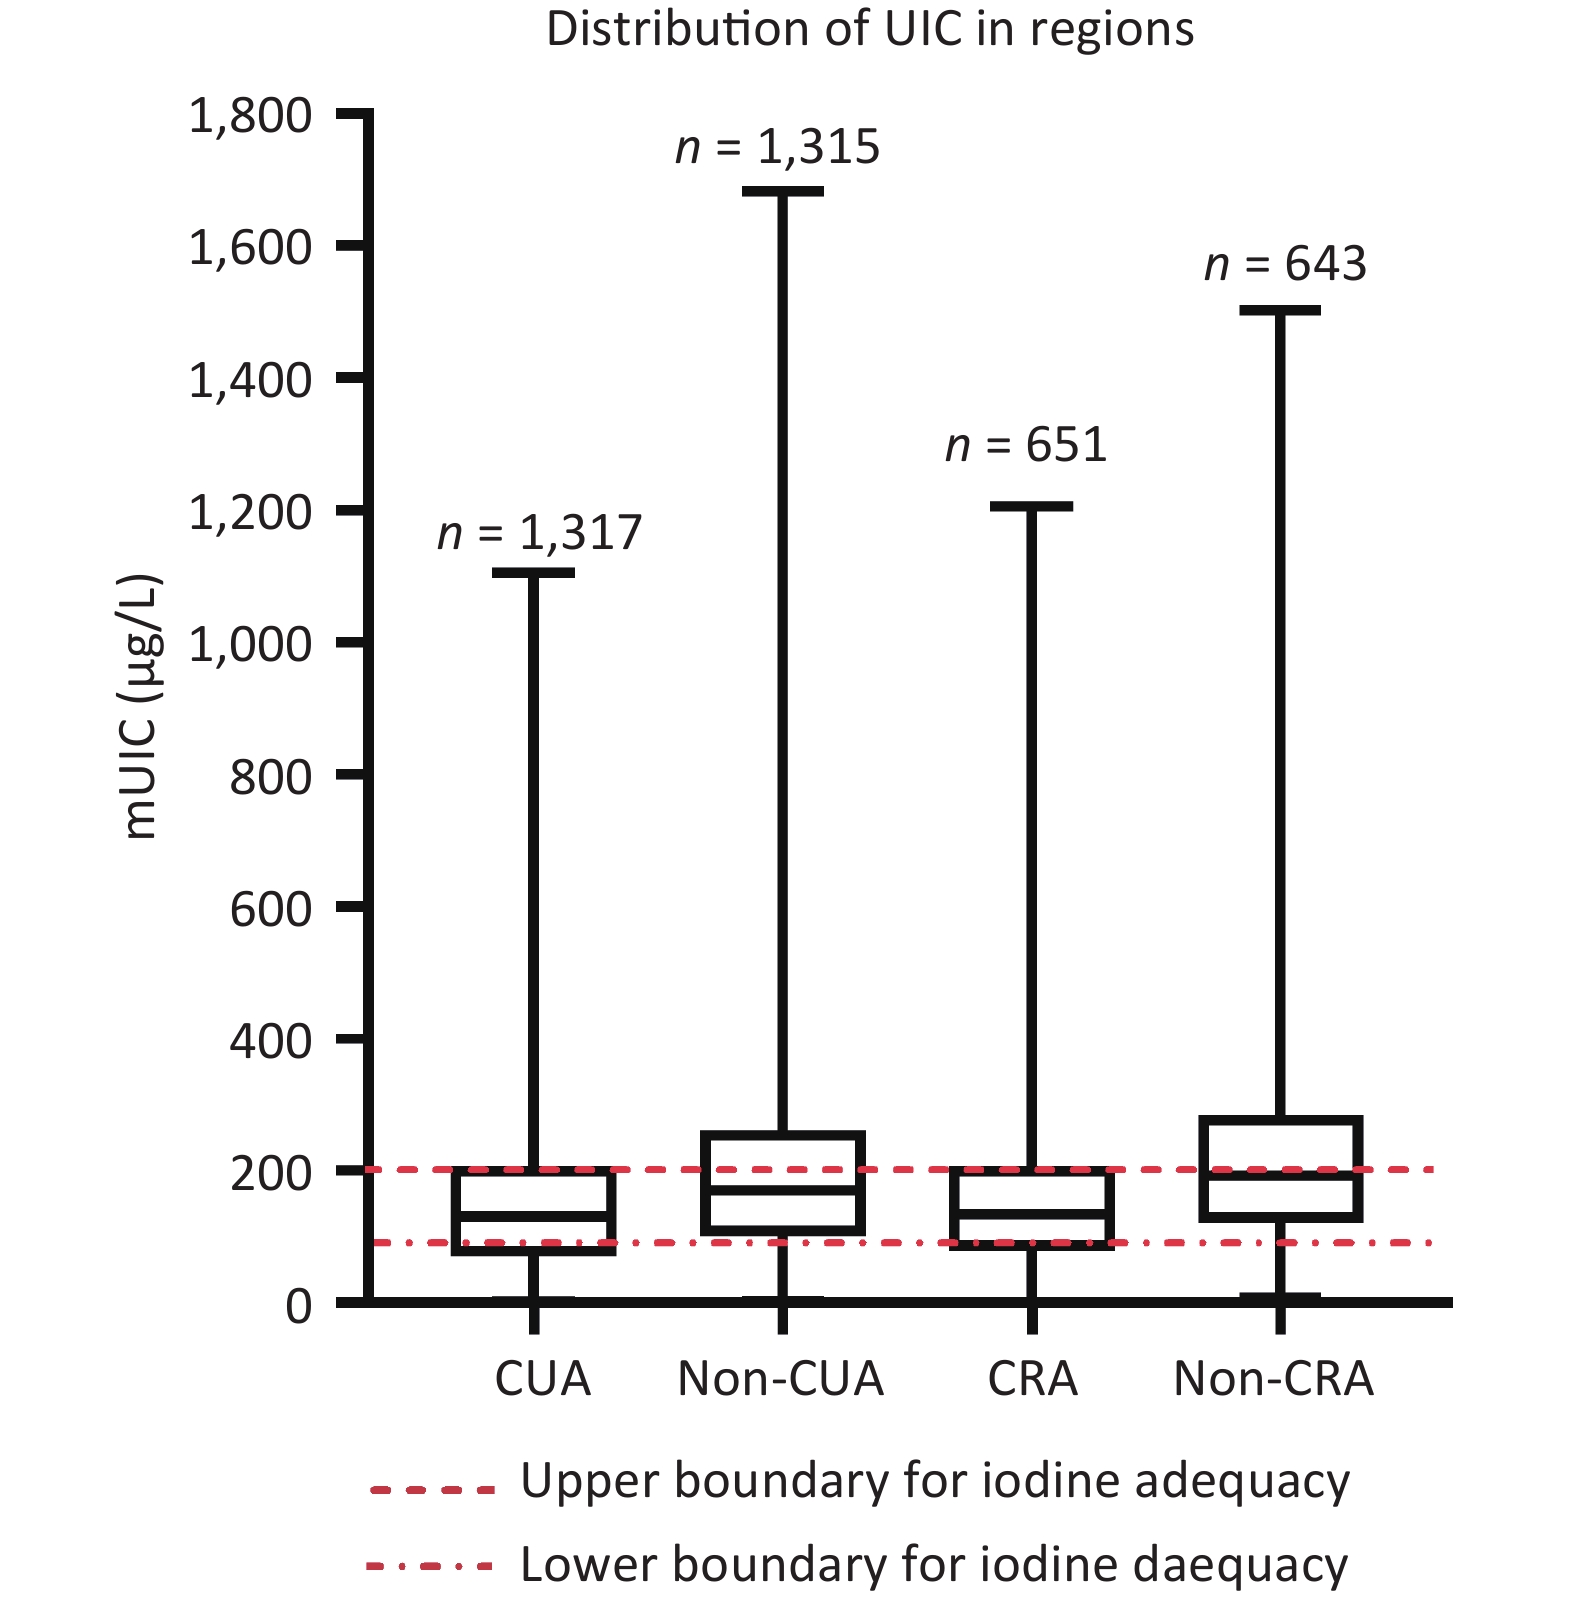
The distribution of UIC in this study population is shown in Supplementary Figure S3 (available in www.besjournal.com). Fujian Province residents had an mUIC of 149.1 μg/L (IQR: 84.0–231.0). Of the 3,325 respondents who participated, 1,199 (30.6%) were observed to have a UIC between 100 μg/L or less, 1,440 (36.9%) with 100–200 μg/L, 755 (19.3%) with 200–300 μg/L, and 527 (13.5%) with above 300 μg/L (Supplementary Figure S4, available in www.besjournal.com). Non-CRA participants had an mUIC close to the upper limit of iodine sufficiency (197.0 μg/L); the CUA, non-CUA, and CRA groups were Appropriate (130.0, 170.0, and 134.0 μg/L) (Supplementary Figure S3).
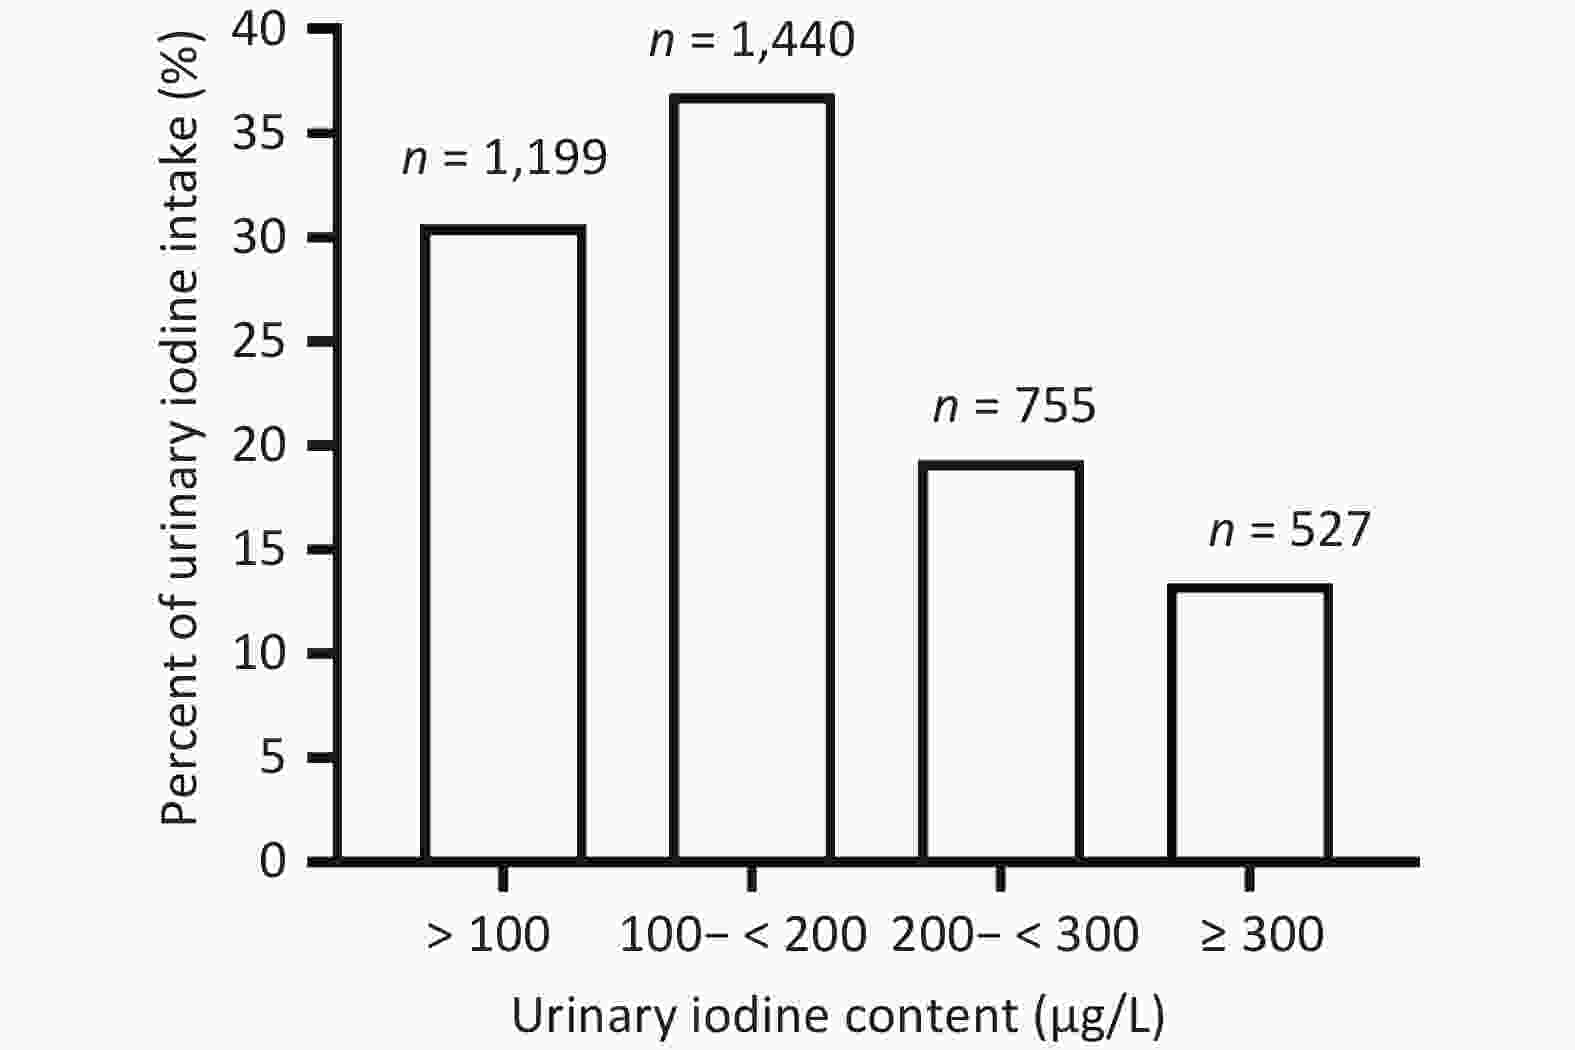
Figure S3. Distribution of UICs in the study population. In the study population, 30.57% of adults were iodine deficient (< 100 μg/L), 36.92% of adults had the recommended intake (100–200 μg/L), 19.25% of adults had greater than appropriate iodine intake (200-300 μg/l), and 13.36% of adults had excessive iodine intake (> 300 μg/L). UIC: urinary iodine concentration.
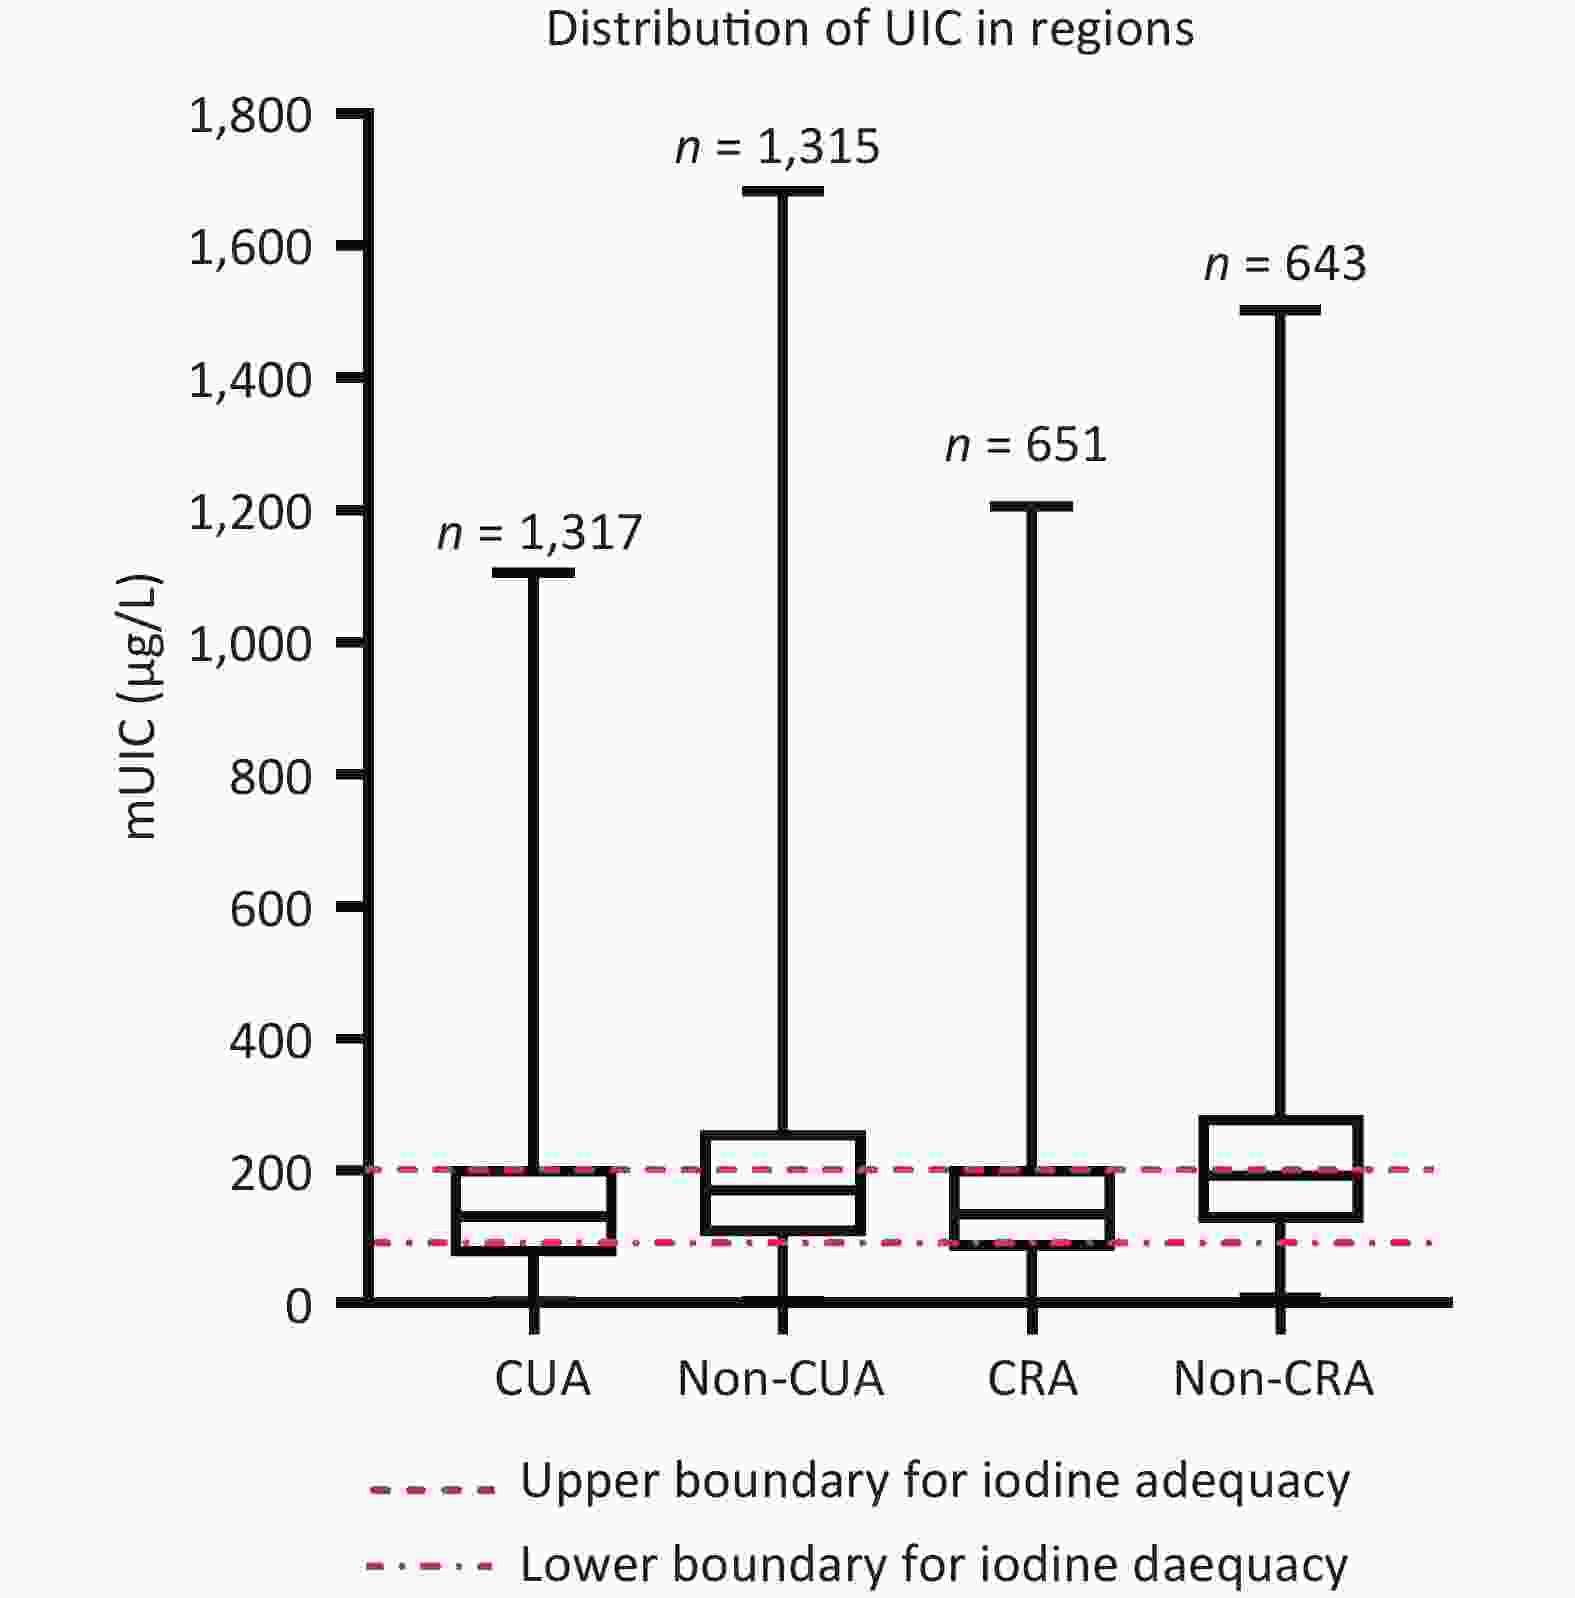
Figure S4. Distribution of UIC by different regions. mUIC: urinary iodine concentration; CUA: coastal urban area; Non-CUA: non-coastal urban area; CRA: coastal rural area; Non-CRA: non-coastal rural area
B ultrasonography was performed on 3,926 participants, of whom 880 were observed to have thyroid nodules (prevalence of 22.4%). In our study, the prevalence of thyroid nodules in Fujian Province remains relatively low compared to the overall national prevalence of 15.7%–58.7%[5]. Moreover, 317 of the 1,618 male participants and 563 of the 1,429 female participants were diagnosed with thyroid nodules, yielding a female : male ratio of 1.8:1. This indicates a significantly higher prevalence in women than that in men, which may be related to estrogen secretion in women since long-term exposure to estrogen was observed to promote nodule growth[6].
The lowest prevalence of thyroid nodules was observed in CRA (14.8%); the prevalence in respondents from CUA, non-CUA, and CRA was higher at 24.3%, 22.7%, and 23.8%, respectively (Table 1). The prevalence of thyroid nodules was higher in urban areas (23.8%) than those in rural areas (20.9%) (P < 0.05), and higher in coastal areas (24.1%) than that in inland areas (18.8%) (P < 0.001) (Table 1). The incidence of thyroid nodules was higher in non-manual laborers than those in manual laborers, where mental stress and mental status may affect thyroid hormone secretion.
Table 1. Prevalence of thyroid nodules in different populations
Groups Thyroid nodules, n Participants, n Prevalence (%) χ2 P Gender 79.6 < 0.001 Male 317 1,935 16.5 Female 563 1,992 28.6 Age, years 201.0 < 0.001 8– 87 511 14.5 16– 95 452 17.4 26– 58 492 10.5 36– 118 432 21.5 46– 124 435 22.2 56– 195 375 34.2 66–75 212 337 38.6 Different regions 27.2 < 0.001 CUA 320 1,317 24.3 Non-CUA 155 651 23.8 CRA 311 1,315 23.7 Non-CRA 94 644 14.6 Urban 6.8 < 0.050 Rural area 475 1,968 24.1 Non-rural area 405 19,59 20.7 Coastal 11.3 < 0.001 Coastal 631 2,632 24.0 Non-coastal 249 1,295 19.2 All 880 3,927 22.4 Note. CUA, coastal urban area; Non-CUA, non-coastal urban area; CRA, coastal rural area; Non-CRA, non-coastal rural area. Residents from different water iodide areas (0–5, 5–10, 10–20 μg/L) had mUIC of 127.0, 133.0, and 156.5 μg/L, respectively, and this was statistically significant (P < 0.001). The mUIC in the iodized table salt group was significantly higher than that in the non-iodized table salt group (P < 0.05). The more frequent the consumption of foods rich in iodine, the higher the mUIC (P < 0.05). Foods that inhibited iodine absorption had no significant effect on mUIC (P > 0.05). Compared with those who consumed iodine-rich foods or iodized salt, those who did not consume these foods were more likely to have a lower mUIC [OR: 1.19; 95% Confidence Interval (95% CI): 1.1–1.4] [males (Odds Ratio (OR): 1.3, 95% CI: 1.1–1.7); females (OR: 1.14, 95% CI: 1.1–1.3)] (Supplementary Tables S2 and S3, available in www.besjournal.com). Compared with those who eat iodine-rich food or iodized salt, people who do not eat these foods are likelier to have lower mUIC. The main factor contributing to iodine deficiency may be inadequate dietary iodine intake.
Table S2. Comparison of urinary iodine concentrations among the adult population
Variables Number of subjects Urinary iodine concentration P Water iodine P < 0.001 0–5 μg/L 2,616 127.0 (60.3–183.3) 5–10 μg/L 1,099 133.0 (79.0–211.5) 10–20 μg/L 207 156.5 (85.6–244.5) Iodized salt P = 0.002 NO 58 113.8 (49.5–183.5) YES 526 184.0 (118.8–280.8) Iodine–rich food P < 0.05 None 160 124.5 (77.7–196.0) 1–11t per year 467 126.75 (69.1–194.8) 1–3t per month 1,093 147.30 (83.8–228.5) 1–2t per week 1,155 147.33 (82.2–235.8) > 3t per week 454 156.0 (87.5–237.0) Goitrogenic food P > 0.05 None 74 130.0 (81.75–183.5) 1–11t per year 304 128.0 (73.3–197.5) 1–3t per month 662 150.0 (93.8–242.0) 1–2t per week 1,127 142.0 (80.0–227.0) > 3t per week 1,162 144.0 (80.0–229.0) Note. 1Wilcoxon’s test. 2Values are medians; IQRs in parentheses. 3Iodized salt indicates that subjects consistently consumed iodized salt; non–ionized salt indicates that subjects intermittently consumed iodized salt or consistently consumed non–iodized salt. 1–11t: 1–11 times; 1–3t: 1–3 times; 1–2t: 1–2 times; 3t: 3 times. Table S3. The joint association1 of iodized salt and iodine–rich food on UIC among male and female adults, respectively
Type of salt Iodine–rich food UI (μg/L) UI < 100 μg/L (%) UI ≥ 100 μg/L (%) OR (95% CI) P Pooled Iodized salt Yes 149 (85.0–235.0) 334 (73.9) 2,148 (79.7) 1.00 (ref) No 130 (73.7–202.0) 43 (10.3) 427 (14.7) 1.19 (1.1–1.3) 0.012 Non-iodized salt Yes 140 (78.0–214.0) 27 (6.6) 193 (6.4) No 118 (68.5–169.0) 15 (3.6) 138 (4.7) P < 0.000 Female Iodized salt Yes 150 (83.0–238.0) 175 (76.8) 1,062 (72.5) 1.00 (ref) No 134 (75.7–208.5) 28 (12.3) 226 (15.4) 1.14 (1.1–1.3) 0.050 Non-iodized salt Yes 146 (78.0–216.5) 15 (6.6) 98 (6.7) No 116.5 (60.0–191.7) 10 (4.4) 78 (5.3) P < 0.010 Male Iodized salt Yes 149 (86.5–230.0) 159 (83.2) 1,086 (75.3) 1.00 (ref) No 123 (70.2–183.2) 15 (7.9) 201 (13.9) 1.33 (1.1–1.7) 0.011 Non-iodized salt Yes 130 (72.0–215.0) 12 (6.3) 95 (6.6) No 122 (77.0–189.0) 5 (2.6) 60 (4.2) P < 0.001 We analyzed the association between iodized salt, iodine-rich foods, goitrogenic foods, drinking water, and thyroid nodules. No significant differences were observed between the factors and thyroid nodules (P > 0.05) (Supplementary Table S4, available in www.besjournal.com).
Table S4. Associations between iodized salt, milk and dairy product, iodine–rich food, goitrogenic food, drinking water, and thyroid nodule
Variables Nodule N (%) Non–nodule N (%) OR (95% CI) P Pooled Water iodine 0–5 µg/L 561 (63.8) 2,059 (67.6) 1.00 5–10 µg/L 270 (30.7) 830 (27.2) 0.8 (0.7–1.0) 0.12 10–20 µg/L 49 (5.2) 158 (5.6) 0.8 (0.5–1.3) 0.49 Salt iodine No 692 (86.1) 2,257 (88.8) 1.00 Yes 112 (13.9) 284 (11.2) 1 (0.8–1.2) 0.81 Iodine–rich food < 1t per week 416 (53.0) 1,306 (51.3) 1.00 1–2t per week 272 (34.6) 885 (34.7) 1.0 (0.8–1.2) 0.69 3–4t per week 73 (9.3) 264 (10.4) 1.0 (0.7–1.4) 0.94 > 5t per week 24 (3.1) 93 (3.6) 1.1 (0.7–1.9) 0.75 Goitrogenic food < 1t per week 239 (30.4) 802 (31.5) 1.00 1–2t per week 277 (35.3) 852 (33.4) 0.9 (0.7–1.1) 0.22 3–4t per week 174 (22.2) 599 (23.5) 1.1 (0.8–1.3) 0.69 > 5t per week 95 (12.1) 295 (11.6) 1.0 (0.8–1.4) 0.93 Man Drinking water 0–5 µg/L 202 (63.7) 1,093 (67.6) 1.00 5–10 µg/L 99 (31.2) 443 (27.4) 0.8 (0.6–1.1) 0.22 10–20 µg/L 16 (5.0) 82 (5.1) 0.7 (0.3–1.6) 0.42 Iodized salt No 32 (10.1) 169 (10.4) 1.00 Yes 284 (89.6) 1,442 (89..1) 1.0 (0.8–1.5) 0.71 Iodine–rich food < 1t per week 150 (52.3) 684 (50.7) 1.00 1–2t per week 100 (34.8) 472 (35) 0.9 (0.7–1.3) 0.69 3–4t per week 30 (10.5) 138 (10.2) 0.8 (0.5–1.3) 0.45 > 5t per week 7 (2.4) 56 (4.1) 1.5 (0.6–3.5) 0.38 Goitrogenic food . < 1t per week 98 (34.1) 412 (30.5) 1.00 1–2t per week 101 (35.2) 472 (35) 1.1 (0.8–1.5) 0.60 3–4t per week 58 (20.2) 309 (22.9) 1.4 (0.9–2.0) 0.12 > 5t per week 30 (10.5) 157 (11.6) 1.3 (0.8–2.1) 0.29 Women Water iodine 0–5 µg/L 359 (63.8) 966 (67.6) 1.00 5–10 µg/L 171 (30.4) 387 (27.1) 0.9 (0.5–1.7) 0.73 10–20 µg/L 33 (5.9) 76 (5.3) 0.9 (0.6–1.2) 0.30 Iodized salt NO 63 (11.2) 156 (10.9) 1.00 YES 500 (88.8) 1269 (88.9) 0.9 (0.7–1.2) 0.55 Iodine–rich food < 1t per week 266 (53.4) 622 (51.9) 1.00 1–2t per week 172 (34.5) 413 (34.5) 1.0 (0.9–1.3) 0.89 3–4t per week 43 (8.6) 126 (10.5) 1.1 (0.7–1.7) 0.58 > 5t per week 17 (3.4) 37 (3.1) 0.9 (0.5–1.8) 0.80 Goitrogenic food < 1t per week 141 (28.3) 390 (32.6) 1.00 1–2t per week 176 (35.3) 380 (31.7) 0.7 (0.5–1) 0.22 3–4t per week 116 (23.3) 290 (24.2) 0.8 (0.6–1.2) 0.29 > 5t per week 65 (13.1) 138 (11.5) 0.8 (0.5–1.2) 0.21 Note. 1Adjustment for age, iodized salt, water iodine, urban and rural, geographical, BMI, ethnicity, marital status, education, occupation, smoking, drinking, consumption of salt, iodine–rich food, goitrogenic food, milk, and dairy product intake. 2A logistic regression model was used in the analysis. 3OR: Odds Ratio; BMI: Body mass index; 95% CI: 95% confidence interval. 1t: 1 times; 1–2t: 1–2 times; 3–4t: 3– 4 times; 5t: 3 times. Solely relying on the OR value, Except for the CUA,it was observed that MUIC levels both below 100 μg/L and above 300 μg/L were linked to an elevated risk of thyroid nodules; however, this association was not statistically significant (P > 0.05). The risk of thyroid nodule occurrence was significantly higher in CUA with a urinary iodine level greater than 300 μg/L, when stratified by region (OR: 1.8; 95% CI: 1.1–3.0; P = 0.21). However, the risk of incidence rate of thyroid nodules was no observed in coastal rural areas. No significant relationship exists between urinary iodine levels and thyroid nodules in different genders (P > 0.05) (Table 2). Inland rural areas had the highest urinary iodine levels with the lowest incidence rate of thyroid nodules, which was lower than in urban and coastal areas; this was consistent with the findings in Dalian and Shijiazhuang[7]. However, when we euphorically applied statistical analysis of the relationship, it was observed that urinary iodine was not significantly associated with thyroid nodules in rural areas. This may be attributed to the fact that we obtained a non-selective urine sample from the investigator.
Table 2. Associations of UIC and thyroid nodule disease
Variables, μg/L Nodule, n (%) Nonnodule, n (%) OR (95% CI) P Pooled 100–199 332 (37.8) 1,108 (36.4) 1.0 200–299 147 (16.7) 608 (20.0) 0.9 (0.7–1.2) 0.57 < 100 278 (31.6) 921 (30.3) 1.1 (0.8–1.3) 0.51 > 300 122 (13.9) 406 (13.3) 1.1 (0.8–1.4) 0.45 Non-CRA 100–199 18 (19.4) 144 (26.2) 1.0 200–299 30 (32.3) 179 (32.6) 0.7 (0.4–1.3) 0.27 < 100 30 (32.3) 127 (23.1) 1.160 (0.5–2.3) 0.68 > 300 15 (16.1) 99 (18.0) 1.416 (0.6–2.9) 0.34 Non-CUA 100–199 39 (25.2) 114 (23.0) 1.0 200–299 57 (36.8) 172 (34.7) 1.1 (0.6–2.1) 0.68 < 100 24 (15.5) 85 (17.2) 1.5 (0.8–2.6) 0.13 > 300 35 (22.6) 124 (25.1) 0.9 (0.5–1.5) 0.74 CRA 100–199 56 (18.0) 179 (17.8) 1.0 200–299 122 (39.2) 397 (39.6) 1.1 (0.6–1.8) 0.78 < 100 30 (9.6) 92 (9.2) 1.0 (0.7–1.4) 0.93 > 300 103 (33.1) 335 (33.4) 0.8 (0.5–1.5) 0.42 CUA 100–199 34 (10.6) 171 (17.2) 1.0 200–299 123 (38.4) 360 (36.1) 0.7 (0.4–1.2) 0.25 < 100 38 (11.9) 102 (10.2) 1.0 (0.7–1.4) 0.91 > 300 125 (39.1) 363 (36.4) 1.8 (1.1–3.0) 0.21 Note. Adjustment for age, sex, iodized salt, water iodine, ethnicity, body mass index, marital status, education level, occupation, radiation availability, smoking, alcohol consumption, iodine-rich food, milk and product intake, goitrogenic food intake, urine iodine. A logistic regression model was used in the analysis. Urinary iodine concentrations: low: < 100 μg/L; normal: 100–200 μg/L; high: 200–300 μg/L and excessive: > 300 μg/L. CUA, coastal urban area; Non-CUA, non-coastal urban area; CRA, coastal rural area; Non-CRA, non-coastal rural area. In this study, we performed a univariate analysis and observed that the possible contributing factors for thyroid nodules were: age, sex, marital status, education level, occupation, BMI, region, smoking, alcohol consumption, exercise habits, staying overnight, iodine-rich foods, goitrogenic foods, milk, and dairy intake, number of exercise sessions, duration of work, stress status, and family history of thyroid nodules (P < 0.05) (Supplementary Table S5, available in www.besjournal.com). Furthermore, in our regression analysis, sex (female), older age, occupation (student, homemaker, employees of enterprises and institutions), less milk and dairy product intake (< 3 times per week), fewer vegetable and fruit intake (< 3 times per week), and living in coastal or city areas were significantly associated with an increased risk of thyroid nodules (P < 0.05) (Figure 1).
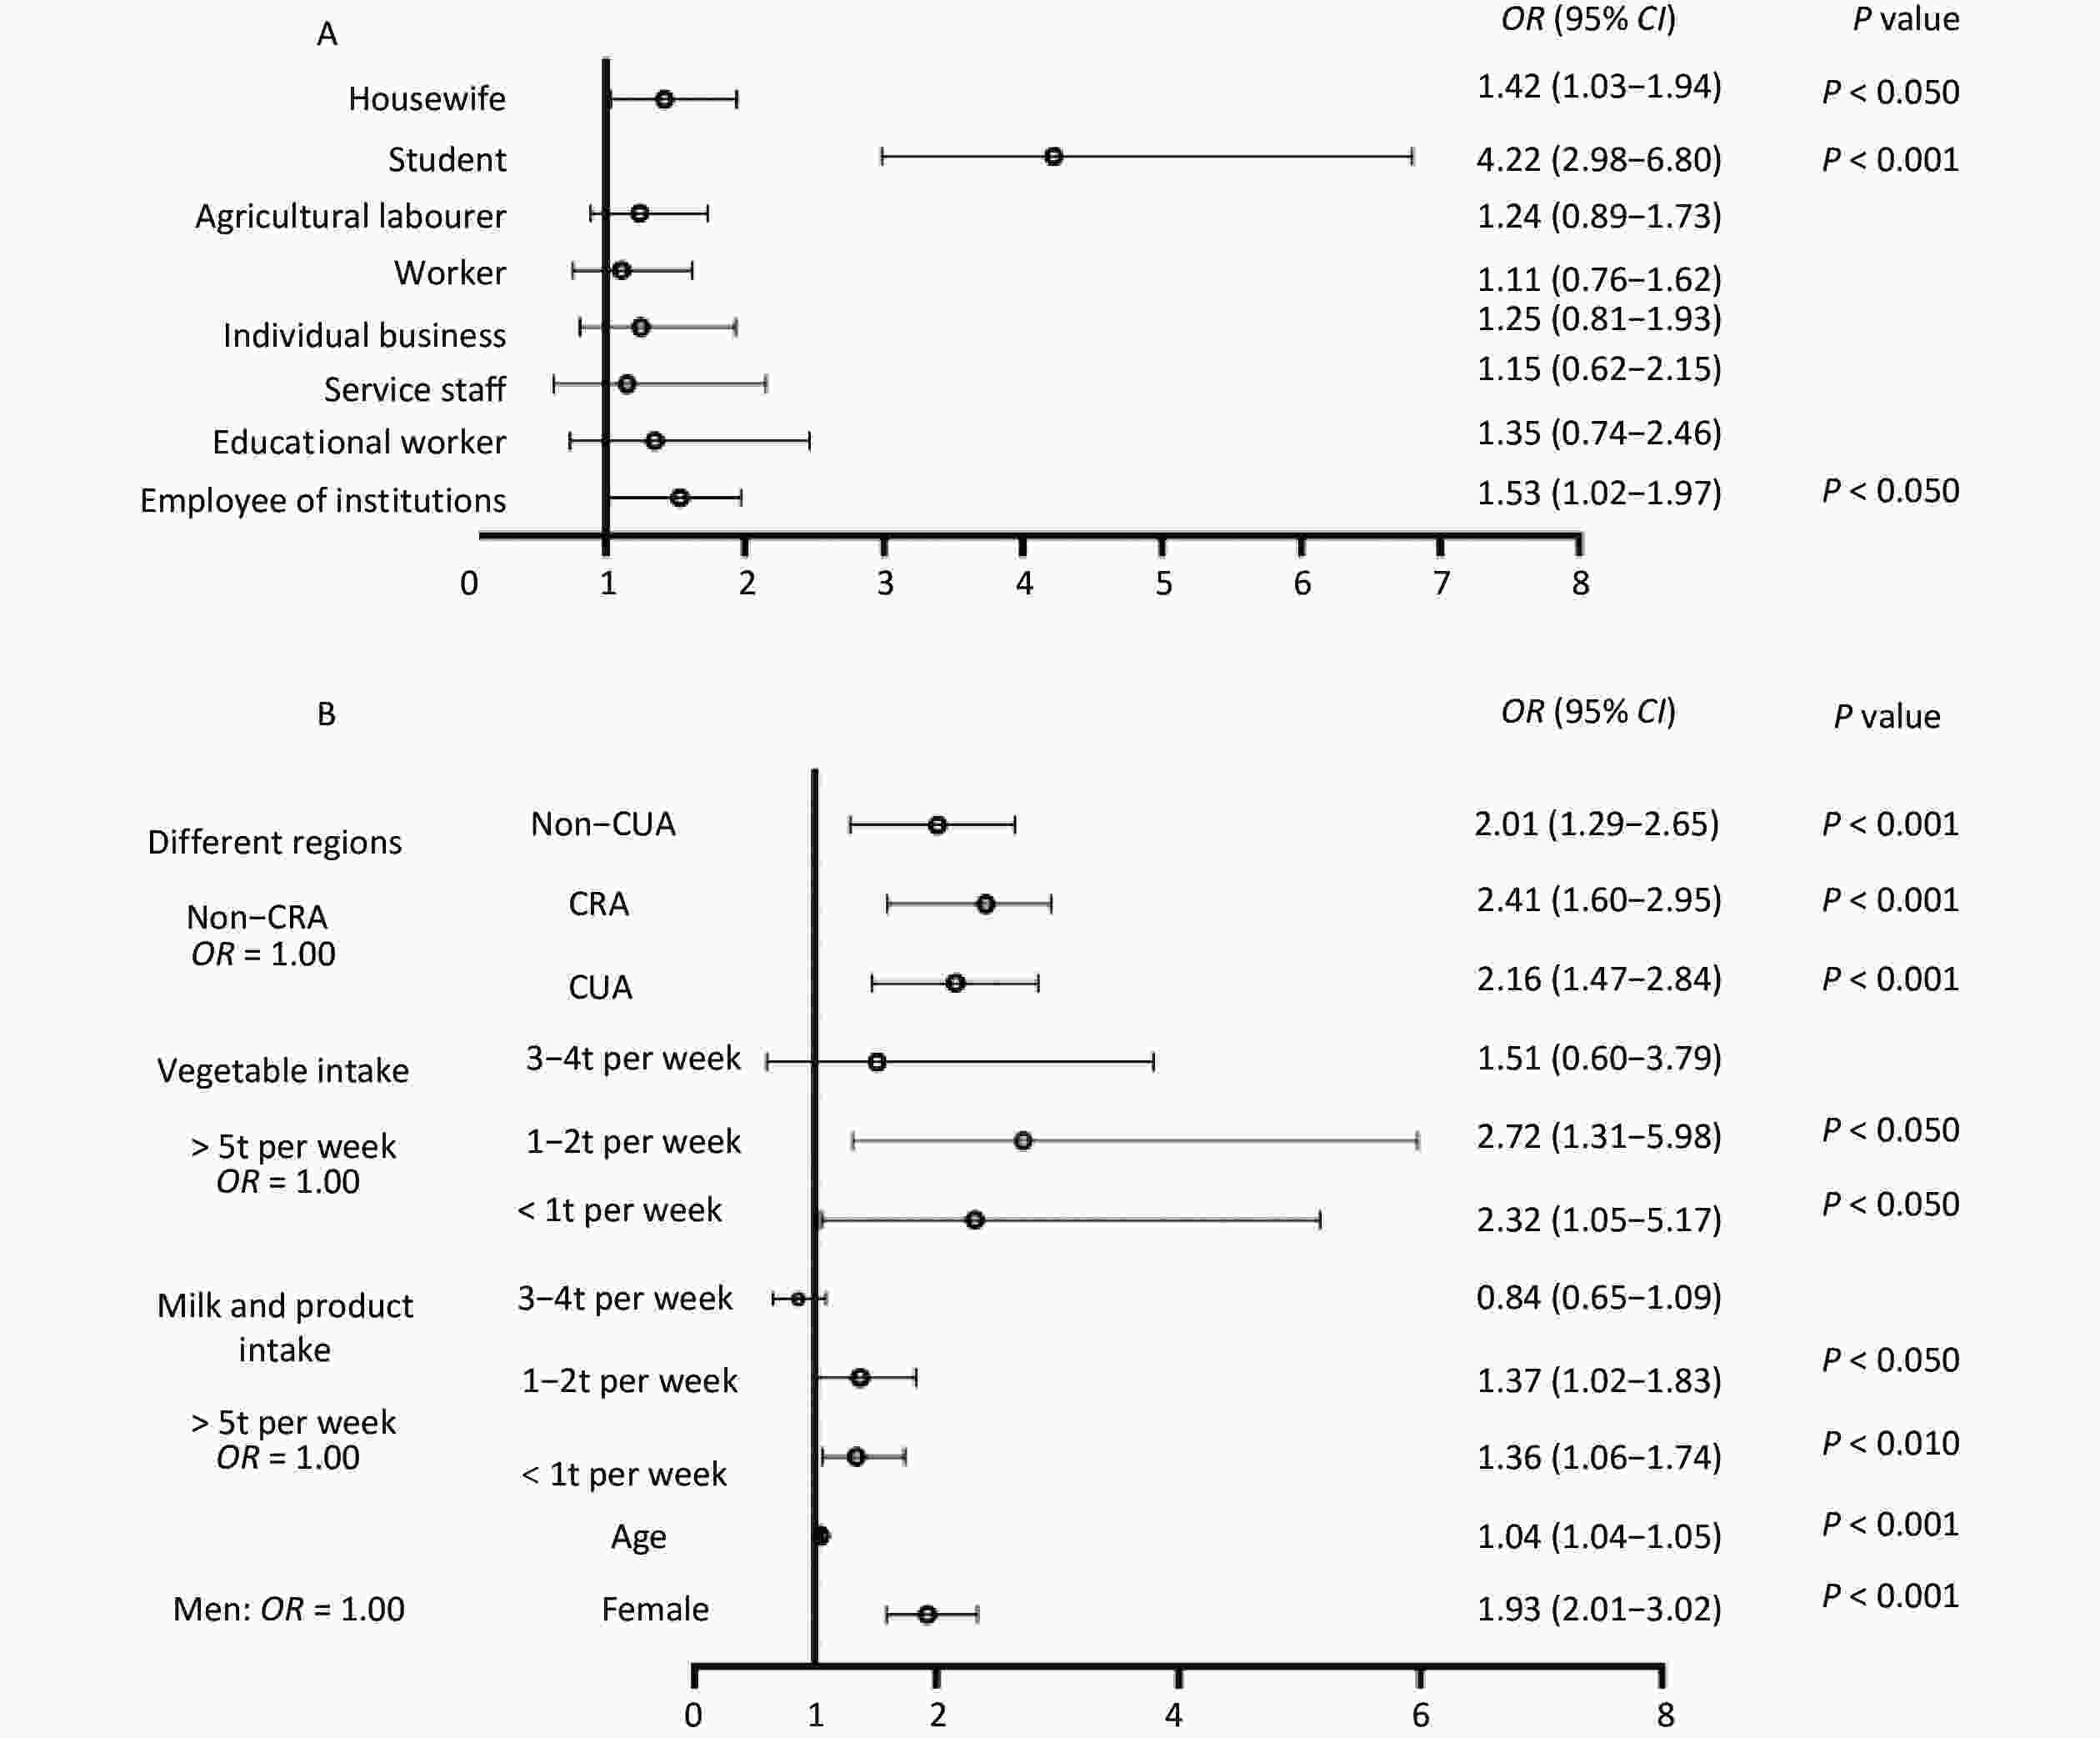
Figure 1. Forest map with regression analysis of risk factors for thyroid nodules at 18 survey points (A and B). Adjustment for age, sex, iodine salt, water iodine concentration, body mass index, marital status, education level, occupation, radiation availability, smoking consumption, alcohol consumption, iodine-rich food, goitrogenic food, urinary iodine concentration, different regions, milk and dairy intake, vegetable, and fruit intake. A logistic regression model was used in the analysis. CUA, coastal urban area; Non-CUA, non-coastal urban area; CRA, coastal rural area; Non-CRA, non-coastal rural area.
Table S5. Socio–demographic characteristics of different patients
Variables Nodule (%) Non–nodule (%) P Basic information Age (y) 47.2 ± 20.5 37.7 ± 20.1 < 0.001 Sex, n (%) < 0.001 Male 320 (36) 1614 (53.2) Female 569 (64) 1420 (46.8) Marital status < 0.001 Unmarried 108 (13.4) 489 (19.2) Married 634 (78.8) 1969 (77.5) Divorce 9 (1.1) 24 (0.9) Widowed 54 (6.7) 60 (2.4) Educational status < 0.001 Primary and below 308 (38.3) 768 (30.2) Secondary education 183 (22.7) 680 (26.8) Secondary education 209 (26.0) 629 (24.7) College or above 105 (13.0) 465 (18.3) Physical index BMI 23.2 ± 3.4 23.1 ± 3.9 > 0.05 BSA 1.59 ± 0.2 1.61 ± 0.2 0.015 Different Regions < 0.001 Coastal cities 323 (36.3) 994 (32.8) Coastal rural areas 319 (35.9) 992 (32.7) Inland cities 149 (16.8) 502 (16.5) Rural land 98 (11.0) 546 (18.0) Lifestyle Smoking 0.05 No 628 (78.0) 1835 (72.2) Closed 28 (3.5) 119 (4.7) Yes 149 (18.5) 588 (23.1) Drinking < 0.001 No 677 (84.1) 1978 (77.8) Closed 19 (2.4) 52 (2.1) Yes 109 (13.5) 512 (20.1) Exercise habits 0.023 ≥ 6/week 209 (26.0) 530 (20.8) 3–5/week 131 (16.3) 397 (15.6) 1–2/week 130 (16.2) 473 (18.6) < 1/week 296 (36.8) 1023 (40.2) None 38 (4.7) 119 (4.7) Stay up late 0.001 No 587 (74.8) 1745 (68.5) Yes 198 (25.2) 803 (31.5) Eating habits Water iodine > 0.05 0–5 µg/L 561 (63.8) 2059 (67.6) 5–10 µg/L 270 (30.7) 830 (27.2) 10–20 µg/L 49 (5.2) 158 (5.6) Salt iodine > 0.05 NO 36 (4.5) 144 (5.8) YES 703 (88.2) 2226 (89.0) Iodine–rich food 0.002 < 1/week 416 (53.0) 1306 (51.3) 1–2/week 272 (34.6) 885 (34.7) 3–4/week 73 (9.3) 264 (10.4) > 5/week 24 (3.1) 93 (3.6) Milk and dairy intake < 0.001 < 1 per week 432 (55) 1379 (54.1) 1–2 per week 106 (13.5) 497 (19.5) 3–4/week 94 (12) 277 (10.9) > 5/week 153 (19.5) 395 (15.5) Goitrogenic food > 0.05 < 1/week 239 (30.4) 802 (31.5) 1–2/week 277 (35.3) 852 (33.4) 3–4/week 174 (22.2) 599 (23.5) > 5/week 95 (12.1) 295 (11.6) Vegetable and fruit intake > 0.05 < 1/week 8 (1) 39 (1.5) 1–2/week 22 (2.8) 88 (3.5) 3–4/week 74 (9.4) 221 (8.7) > 5/week 681 (86.8) 2,200 (86.3) Soybean and Products Intake > 0.05 < 1/week 295 (37.6) 868 (34.1) 1–2/week 254 (32.4) 878 (34.5) 3–4/week 138 (17.6) 491 (19.3) > 5/week 98 (12.5) 311 (12.2) Social psychological factors Daily work hours < 0.001 < 2 hours 153 (19.5) 401 (15.7) 2–4 hours 120 (15.3) 275 (10.8) 5–7 hours 279 (35.5) 857 (33.6) > 8 hours 233 (29.7) 1,015 (39.9) Pressure in the last five years 0.002 No pressure 470 (59.9) 1,325 (52) Occasional stress 242 (30.8) 944 (37) Always under pressure 62 (7.9) 259 (10.2) Anxiety 11 (1.4) 20 (0.8) The prevalence of thyroid nodules is closely related to region and diet[8]. Li et al. reported that thyroid nodules were related to obesity (especially abdominal obesity), hyperglycemia, high blood lipids, and other metabolic diseases closely related to diet[9], which may be because insulin is a growth factor for the thyroid gland, leading to thyroid nodules[10]. In contrast, eating more fresh fruits and drinking dairy products in moderation is beneficial for helping control appropriate body weight, glucose, and lipid profile, which is well known.
In conclusion, despite the iodine deficiency in the outside environment of Fujian, the average concentration of iodized salt across different geographic regions and different population groups all meet the criteria of iodine addition to the iodized salt in Fujian Province, and the mUIC is within an appropriate range. No evidence exists on iodine content in drinking water, iodized salt, iodine-rich foods, goitrogenic foods, and mUIC being statistically associated with thyroid nodule disease. Possible factors contributing to thyroid nodules are occupation, different geographical settings, milk and dairy product intake, and vegetable and fruit intake frequency.
doi: 10.3967/bes2024.164
Thyroid Nodule Prevalence and Iodine Nutrition: Influencing Factors in Coastal Areas
-
Zhihui Chen and Muhua Wang: conception and design of the study, supervision of data collection, and interpretation of study findings; Lijin Wang: data analysis, interpretation of study findings, and manuscript revision; Jiani Wu, Xiaoyan Wu, Ying Lan, Meng He and Diqun Chen: data collection and interpretation of study findings. Laboratory analyses were conducted by Jiani Wu, Xiaoyan Wu, Ying Lan and Meng He. All authors read and approved the final manuscript.
All authors declare that there are no conflicts of interest in this study.
This study was conducted under the Declaration of Helsinki. Ethics approval was obtained from the Ethics Committee of Fujian Provincial CDC (No. 2017002). Written informed consent was obtained from respondents before their urine samples were collected. Each underage investigated person had their guardian read the informed consent form and sign it before we conducted the survey.
注释:1) Authors’ Contributions: 2) Competing Interests: 3) Ethics Approval and Consent to Participate: -
S1. Distribution of mWIU in regions. #Median water iodine concentration (mWIC) of CRA was significantly higher compared to CUA (P < 0.05). ##Median water iodine concentration (mWIC) of Non-CUA was significantly lower compared to CUA (P < 0.05). *Median water iodine concentration (mWIC) of CRA was significantly higher compared to Non-CRA (P < 0.05). Median water iodine concentration (mWIC) of Non-CRA was significantly lower compared to Non-CUA (P < 0.05).
S2. The percentage of qualified iodized and unqualified iodized salt collected from households from different regions in the year 2017.
S3. Distribution of UICs in the study population. In the study population, 30.57% of adults were iodine deficient (< 100 μg/L), 36.92% of adults had the recommended intake (100–200 μg/L), 19.25% of adults had greater than appropriate iodine intake (200-300 μg/l), and 13.36% of adults had excessive iodine intake (> 300 μg/L). UIC: urinary iodine concentration.
S4. Distribution of UIC by different regions. mUIC: urinary iodine concentration; CUA: coastal urban area; Non-CUA: non-coastal urban area; CRA: coastal rural area; Non-CRA: non-coastal rural area
Figure 1. Forest map with regression analysis of risk factors for thyroid nodules at 18 survey points (A and B). Adjustment for age, sex, iodine salt, water iodine concentration, body mass index, marital status, education level, occupation, radiation availability, smoking consumption, alcohol consumption, iodine-rich food, goitrogenic food, urinary iodine concentration, different regions, milk and dairy intake, vegetable, and fruit intake. A logistic regression model was used in the analysis. CUA, coastal urban area; Non-CUA, non-coastal urban area; CRA, coastal rural area; Non-CRA, non-coastal rural area.
S1. Summary of the general situation of this survey
District Water samples Salt sample Urine sample B ultrasonic Questionnaire coastal urban area(CUA) 13 203 1,317 1,317 1,113 non–coastal urban area (Non-CUA) 6 96 649 649 551 coastal rural area(CRA) 19 190 1,315 1,315 1,106 non–coastal rural area (Non-CRA) 8 89 645 645 555 All 46 578 3,926 3,926 3,325 Note. CUA: coastal urban area; Non-CUA: non–coastal urban area; CRA: coastal rural area; Non-CRA: non-coastal rural area. The coastal urban survey sites (Jimei District of Xiamen City, Chengxiang District of Putian City, Taijiang District of Fuzhou City, Jiaocheng District of Ningde City, Licheng District of Quanzhou City, and Xiangcheng District of Zhangzhou City), The inland urban survey sites (Xinluo District of Longyan City, Yanping District of Nanping City, and the Sanyuan District of Sanming City), The coastal rural survey sites (Xiang’an District of Xiamen City, Licheng District of Putian City, Changle City of Fuzhou, Xiapu County of Ningde City, Nan’an City of Yangzhou City, and Dongshan County of Zhangzhou City), The inland rural survey sites (the Zhangping City of Longyan City, Jian’ou city of Nanping City, and Mingxi County of Sanming City).  下载: 导出CSV
Table 1. Prevalence of thyroid nodules in different populations
Groups Thyroid nodules, n Participants, n Prevalence (%) χ2 P Gender 79.6 < 0.001 Male 317 1,935 16.5 Female 563 1,992 28.6 Age, years 201.0 < 0.001 8– 87 511 14.5 16– 95 452 17.4 26– 58 492 10.5 36– 118 432 21.5 46– 124 435 22.2 56– 195 375 34.2 66–75 212 337 38.6 Different regions 27.2 < 0.001 CUA 320 1,317 24.3 Non-CUA 155 651 23.8 CRA 311 1,315 23.7 Non-CRA 94 644 14.6 Urban 6.8 < 0.050 Rural area 475 1,968 24.1 Non-rural area 405 19,59 20.7 Coastal 11.3 < 0.001 Coastal 631 2,632 24.0 Non-coastal 249 1,295 19.2 All 880 3,927 22.4 Note. CUA, coastal urban area; Non-CUA, non-coastal urban area; CRA, coastal rural area; Non-CRA, non-coastal rural area.
下载: 导出CSV
S2. Comparison of urinary iodine concentrations among the adult population
Variables Number of subjects Urinary iodine concentration P Water iodine P < 0.001 0–5 μg/L 2,616 127.0 (60.3–183.3) 5–10 μg/L 1,099 133.0 (79.0–211.5) 10–20 μg/L 207 156.5 (85.6–244.5) Iodized salt P = 0.002 NO 58 113.8 (49.5–183.5) YES 526 184.0 (118.8–280.8) Iodine–rich food P < 0.05 None 160 124.5 (77.7–196.0) 1–11t per year 467 126.75 (69.1–194.8) 1–3t per month 1,093 147.30 (83.8–228.5) 1–2t per week 1,155 147.33 (82.2–235.8) > 3t per week 454 156.0 (87.5–237.0) Goitrogenic food P > 0.05 None 74 130.0 (81.75–183.5) 1–11t per year 304 128.0 (73.3–197.5) 1–3t per month 662 150.0 (93.8–242.0) 1–2t per week 1,127 142.0 (80.0–227.0) > 3t per week 1,162 144.0 (80.0–229.0) Note. 1Wilcoxon’s test. 2Values are medians; IQRs in parentheses. 3Iodized salt indicates that subjects consistently consumed iodized salt; non–ionized salt indicates that subjects intermittently consumed iodized salt or consistently consumed non–iodized salt. 1–11t: 1–11 times; 1–3t: 1–3 times; 1–2t: 1–2 times; 3t: 3 times.
下载: 导出CSV
S3. The joint association1 of iodized salt and iodine–rich food on UIC among male and female adults, respectively
Type of salt Iodine–rich food UI (μg/L) UI < 100 μg/L (%) UI ≥ 100 μg/L (%) OR (95% CI) P Pooled Iodized salt Yes 149 (85.0–235.0) 334 (73.9) 2,148 (79.7) 1.00 (ref) No 130 (73.7–202.0) 43 (10.3) 427 (14.7) 1.19 (1.1–1.3) 0.012 Non-iodized salt Yes 140 (78.0–214.0) 27 (6.6) 193 (6.4) No 118 (68.5–169.0) 15 (3.6) 138 (4.7) P < 0.000 Female Iodized salt Yes 150 (83.0–238.0) 175 (76.8) 1,062 (72.5) 1.00 (ref) No 134 (75.7–208.5) 28 (12.3) 226 (15.4) 1.14 (1.1–1.3) 0.050 Non-iodized salt Yes 146 (78.0–216.5) 15 (6.6) 98 (6.7) No 116.5 (60.0–191.7) 10 (4.4) 78 (5.3) P < 0.010 Male Iodized salt Yes 149 (86.5–230.0) 159 (83.2) 1,086 (75.3) 1.00 (ref) No 123 (70.2–183.2) 15 (7.9) 201 (13.9) 1.33 (1.1–1.7) 0.011 Non-iodized salt Yes 130 (72.0–215.0) 12 (6.3) 95 (6.6) No 122 (77.0–189.0) 5 (2.6) 60 (4.2) P < 0.001
下载: 导出CSV
S4. Associations between iodized salt, milk and dairy product, iodine–rich food, goitrogenic food, drinking water, and thyroid nodule
Variables Nodule N (%) Non–nodule N (%) OR (95% CI) P Pooled Water iodine 0–5 µg/L 561 (63.8) 2,059 (67.6) 1.00 5–10 µg/L 270 (30.7) 830 (27.2) 0.8 (0.7–1.0) 0.12 10–20 µg/L 49 (5.2) 158 (5.6) 0.8 (0.5–1.3) 0.49 Salt iodine No 692 (86.1) 2,257 (88.8) 1.00 Yes 112 (13.9) 284 (11.2) 1 (0.8–1.2) 0.81 Iodine–rich food < 1t per week 416 (53.0) 1,306 (51.3) 1.00 1–2t per week 272 (34.6) 885 (34.7) 1.0 (0.8–1.2) 0.69 3–4t per week 73 (9.3) 264 (10.4) 1.0 (0.7–1.4) 0.94 > 5t per week 24 (3.1) 93 (3.6) 1.1 (0.7–1.9) 0.75 Goitrogenic food < 1t per week 239 (30.4) 802 (31.5) 1.00 1–2t per week 277 (35.3) 852 (33.4) 0.9 (0.7–1.1) 0.22 3–4t per week 174 (22.2) 599 (23.5) 1.1 (0.8–1.3) 0.69 > 5t per week 95 (12.1) 295 (11.6) 1.0 (0.8–1.4) 0.93 Man Drinking water 0–5 µg/L 202 (63.7) 1,093 (67.6) 1.00 5–10 µg/L 99 (31.2) 443 (27.4) 0.8 (0.6–1.1) 0.22 10–20 µg/L 16 (5.0) 82 (5.1) 0.7 (0.3–1.6) 0.42 Iodized salt No 32 (10.1) 169 (10.4) 1.00 Yes 284 (89.6) 1,442 (89..1) 1.0 (0.8–1.5) 0.71 Iodine–rich food < 1t per week 150 (52.3) 684 (50.7) 1.00 1–2t per week 100 (34.8) 472 (35) 0.9 (0.7–1.3) 0.69 3–4t per week 30 (10.5) 138 (10.2) 0.8 (0.5–1.3) 0.45 > 5t per week 7 (2.4) 56 (4.1) 1.5 (0.6–3.5) 0.38 Goitrogenic food . < 1t per week 98 (34.1) 412 (30.5) 1.00 1–2t per week 101 (35.2) 472 (35) 1.1 (0.8–1.5) 0.60 3–4t per week 58 (20.2) 309 (22.9) 1.4 (0.9–2.0) 0.12 > 5t per week 30 (10.5) 157 (11.6) 1.3 (0.8–2.1) 0.29 Women Water iodine 0–5 µg/L 359 (63.8) 966 (67.6) 1.00 5–10 µg/L 171 (30.4) 387 (27.1) 0.9 (0.5–1.7) 0.73 10–20 µg/L 33 (5.9) 76 (5.3) 0.9 (0.6–1.2) 0.30 Iodized salt NO 63 (11.2) 156 (10.9) 1.00 YES 500 (88.8) 1269 (88.9) 0.9 (0.7–1.2) 0.55 Iodine–rich food < 1t per week 266 (53.4) 622 (51.9) 1.00 1–2t per week 172 (34.5) 413 (34.5) 1.0 (0.9–1.3) 0.89 3–4t per week 43 (8.6) 126 (10.5) 1.1 (0.7–1.7) 0.58 > 5t per week 17 (3.4) 37 (3.1) 0.9 (0.5–1.8) 0.80 Goitrogenic food < 1t per week 141 (28.3) 390 (32.6) 1.00 1–2t per week 176 (35.3) 380 (31.7) 0.7 (0.5–1) 0.22 3–4t per week 116 (23.3) 290 (24.2) 0.8 (0.6–1.2) 0.29 > 5t per week 65 (13.1) 138 (11.5) 0.8 (0.5–1.2) 0.21 Note. 1Adjustment for age, iodized salt, water iodine, urban and rural, geographical, BMI, ethnicity, marital status, education, occupation, smoking, drinking, consumption of salt, iodine–rich food, goitrogenic food, milk, and dairy product intake. 2A logistic regression model was used in the analysis. 3OR: Odds Ratio; BMI: Body mass index; 95% CI: 95% confidence interval. 1t: 1 times; 1–2t: 1–2 times; 3–4t: 3– 4 times; 5t: 3 times.
下载: 导出CSV
Table 2. Associations of UIC and thyroid nodule disease
Variables, μg/L Nodule, n (%) Nonnodule, n (%) OR (95% CI) P Pooled 100–199 332 (37.8) 1,108 (36.4) 1.0 200–299 147 (16.7) 608 (20.0) 0.9 (0.7–1.2) 0.57 < 100 278 (31.6) 921 (30.3) 1.1 (0.8–1.3) 0.51 > 300 122 (13.9) 406 (13.3) 1.1 (0.8–1.4) 0.45 Non-CRA 100–199 18 (19.4) 144 (26.2) 1.0 200–299 30 (32.3) 179 (32.6) 0.7 (0.4–1.3) 0.27 < 100 30 (32.3) 127 (23.1) 1.160 (0.5–2.3) 0.68 > 300 15 (16.1) 99 (18.0) 1.416 (0.6–2.9) 0.34 Non-CUA 100–199 39 (25.2) 114 (23.0) 1.0 200–299 57 (36.8) 172 (34.7) 1.1 (0.6–2.1) 0.68 < 100 24 (15.5) 85 (17.2) 1.5 (0.8–2.6) 0.13 > 300 35 (22.6) 124 (25.1) 0.9 (0.5–1.5) 0.74 CRA 100–199 56 (18.0) 179 (17.8) 1.0 200–299 122 (39.2) 397 (39.6) 1.1 (0.6–1.8) 0.78 < 100 30 (9.6) 92 (9.2) 1.0 (0.7–1.4) 0.93 > 300 103 (33.1) 335 (33.4) 0.8 (0.5–1.5) 0.42 CUA 100–199 34 (10.6) 171 (17.2) 1.0 200–299 123 (38.4) 360 (36.1) 0.7 (0.4–1.2) 0.25 < 100 38 (11.9) 102 (10.2) 1.0 (0.7–1.4) 0.91 > 300 125 (39.1) 363 (36.4) 1.8 (1.1–3.0) 0.21 Note. Adjustment for age, sex, iodized salt, water iodine, ethnicity, body mass index, marital status, education level, occupation, radiation availability, smoking, alcohol consumption, iodine-rich food, milk and product intake, goitrogenic food intake, urine iodine. A logistic regression model was used in the analysis. Urinary iodine concentrations: low: < 100 μg/L; normal: 100–200 μg/L; high: 200–300 μg/L and excessive: > 300 μg/L. CUA, coastal urban area; Non-CUA, non-coastal urban area; CRA, coastal rural area; Non-CRA, non-coastal rural area.
下载: 导出CSV
S5. Socio–demographic characteristics of different patients
Variables Nodule (%) Non–nodule (%) P Basic information Age (y) 47.2 ± 20.5 37.7 ± 20.1 < 0.001 Sex, n (%) < 0.001 Male 320 (36) 1614 (53.2) Female 569 (64) 1420 (46.8) Marital status < 0.001 Unmarried 108 (13.4) 489 (19.2) Married 634 (78.8) 1969 (77.5) Divorce 9 (1.1) 24 (0.9) Widowed 54 (6.7) 60 (2.4) Educational status < 0.001 Primary and below 308 (38.3) 768 (30.2) Secondary education 183 (22.7) 680 (26.8) Secondary education 209 (26.0) 629 (24.7) College or above 105 (13.0) 465 (18.3) Physical index BMI 23.2 ± 3.4 23.1 ± 3.9 > 0.05 BSA 1.59 ± 0.2 1.61 ± 0.2 0.015 Different Regions < 0.001 Coastal cities 323 (36.3) 994 (32.8) Coastal rural areas 319 (35.9) 992 (32.7) Inland cities 149 (16.8) 502 (16.5) Rural land 98 (11.0) 546 (18.0) Lifestyle Smoking 0.05 No 628 (78.0) 1835 (72.2) Closed 28 (3.5) 119 (4.7) Yes 149 (18.5) 588 (23.1) Drinking < 0.001 No 677 (84.1) 1978 (77.8) Closed 19 (2.4) 52 (2.1) Yes 109 (13.5) 512 (20.1) Exercise habits 0.023 ≥ 6/week 209 (26.0) 530 (20.8) 3–5/week 131 (16.3) 397 (15.6) 1–2/week 130 (16.2) 473 (18.6) < 1/week 296 (36.8) 1023 (40.2) None 38 (4.7) 119 (4.7) Stay up late 0.001 No 587 (74.8) 1745 (68.5) Yes 198 (25.2) 803 (31.5) Eating habits Water iodine > 0.05 0–5 µg/L 561 (63.8) 2059 (67.6) 5–10 µg/L 270 (30.7) 830 (27.2) 10–20 µg/L 49 (5.2) 158 (5.6) Salt iodine > 0.05 NO 36 (4.5) 144 (5.8) YES 703 (88.2) 2226 (89.0) Iodine–rich food 0.002 < 1/week 416 (53.0) 1306 (51.3) 1–2/week 272 (34.6) 885 (34.7) 3–4/week 73 (9.3) 264 (10.4) > 5/week 24 (3.1) 93 (3.6) Milk and dairy intake < 0.001 < 1 per week 432 (55) 1379 (54.1) 1–2 per week 106 (13.5) 497 (19.5) 3–4/week 94 (12) 277 (10.9) > 5/week 153 (19.5) 395 (15.5) Goitrogenic food > 0.05 < 1/week 239 (30.4) 802 (31.5) 1–2/week 277 (35.3) 852 (33.4) 3–4/week 174 (22.2) 599 (23.5) > 5/week 95 (12.1) 295 (11.6) Vegetable and fruit intake > 0.05 < 1/week 8 (1) 39 (1.5) 1–2/week 22 (2.8) 88 (3.5) 3–4/week 74 (9.4) 221 (8.7) > 5/week 681 (86.8) 2,200 (86.3) Soybean and Products Intake > 0.05 < 1/week 295 (37.6) 868 (34.1) 1–2/week 254 (32.4) 878 (34.5) 3–4/week 138 (17.6) 491 (19.3) > 5/week 98 (12.5) 311 (12.2) Social psychological factors Daily work hours < 0.001 < 2 hours 153 (19.5) 401 (15.7) 2–4 hours 120 (15.3) 275 (10.8) 5–7 hours 279 (35.5) 857 (33.6) > 8 hours 233 (29.7) 1,015 (39.9) Pressure in the last five years 0.002 No pressure 470 (59.9) 1,325 (52) Occasional stress 242 (30.8) 944 (37) Always under pressure 62 (7.9) 259 (10.2) Anxiety 11 (1.4) 20 (0.8)
下载: 导出CSV
-
[1] Chen ZP. Measurement of urinary iodine and its clinical significance. Chin J Endemiol, 1997; 16, 35-7. (In Chinese) [2] Zhao W, Han C, Shi XG, et al. Prevalence of goiter and thyroid nodules before and after implementation of the universal salt iodization program in mainland China from 1985 to 2014: a systematic review and meta-analysis. PLoS One, 2014; 14, e109549. [3] Lou XM, Wang XF, Wang ZF, et al. The effect of iodine status on the risk of thyroid nodules: a cross-sectional study in Zhejiang, China. Int J Endocrinol, 2020; 2020, 3760375. [4] Yildirim Simsir I, Cetinkalp S, Kabalak T. Review of factors contributing to nodular goiter and thyroid carcinoma. Med Princ Pract, 2020; 29, 1−5. doi: 10.1159/000503575 [5] Tian CY, Bu Y, Ji CL, et al. Iodine nutrition and the prevalence status of thyroid nodules in the population: a cross-sectional survey in Heilongjiang Province, China. Biol Trace Elem Res, 2021; 199, 3181−9. doi: 10.1007/s12011-020-02442-y [6] Procopiou M. Recognize, when and how to intervene thyroid nodules. Dtsch Med Wochenschr, 2015; 68, 285-9. [7] Leng S, Liu Y, Liu HX, et al. Thyroid nodule disease among adult health examination participants in Dalian. Med Philos, 2011; 32, 22−4. (In Chinese) [8] Jung SK, Kim K, Tae K, et al. The effect of raw vegetable and fruit intake on thyroid cancer risk among women: a case-control study in South Korea. Br J Nutr, 2013; 109, 118−28. doi: 10.1017/S0007114512000591 [9] Li YH, Jin C, Li J, et al. Prevalence of thyroid nodules in China: a health examination cohort-based study. Front Endocrinol (Lausanne), 2021; 12, 676144. doi: 10.3389/fendo.2021.676144 [10] Rezzonico J, Rezzonico M, Pusiol E, et al. Introducing the thyroid gland as another victim of the insulin resistance syndrome. Thyroid, 2008; 18, 461−4. doi: 10.1089/thy.2007.0223 -
 24167+Supplementary Materials.pdf

-

 点击查看大图
计量
- 文章访问数: 884
- HTML全文浏览量: 322
- PDF下载量: 23
- 被引次数: 0

 Quick Links