

 下载:
下载:

-
In 2014, a case of a worker diagnosed with Alzheimer’s disease (AD) following occupational exposure to aluminum (Al) was first reported by British scientist Christopher Exley[1]. This patient had an early onset and a shorter course than the average person, indicating that Al may be an important environmental factor resulting in cognitive impairment.
For occupational workers, Al enters mainly through the respiratory tract. Furthermore, Al3+ enters the brain through the blood-brain barrier or olfactory bulb directly and produces severe neurotoxicity[2].
Most previous research have focused on secondary Al processing among smelter and foundry workers, and emphasized little on primary Al production. More than half of the world’s electrolytic Al is produced in China. Workers are highly exposed to Al oxide dust that has a bioavailability 7 times higher than drinking water[3]. Research on the cognitive assessment of electrolytic Al workers is lacking in China.
In this case, the first complaint was memory impairment (AD’s core symptom). Were there damages in other cognitive domains that have gone unnoticed? As we know, cognition includes various domains such as orientation, memory, language, visuospatial and executive ability, attention, calculation, and comprehension. The relationship between Al and cognitive domains is uncertain. Given the early onset and mild symptoms, early detection of impaired domains and separation from Al becomes necessary.
All participants (30−59 years) were from different department of the SH Aluminum factory, China. One group included 172 electrolytic Al workers. The control group included 245 transport workers without any history of Al exposure. The two groups were matched in age and education. All workers were male and wore work clothes, masks, and gloves during working time. Al concentration in drinking water was lower than national standards (< 0.2 mg/L). Accurate demographic and medical information was collected. Cognitive functions were evaluated using Cognitive Screening Tests, including the Mini-mental state examination (MMSE), Clock drawing test (CDT), Digit span test (DS), Fuld object-memory evaluation (FOM), and Verbal fluency Test (VFT). (Supplementary File, available in www.besjournal.com).
Exclusion criteria for our study were: (1) any diseases that may cause cognitive impairment including hepatic or renal disorders, brain trauma, hypertension, diabetes, cerebrovascular disease, epilepsy, Parkinson's, and mental diseases; (2) any family history of dementia in first-degree relatives; (3) any history of regular drug use (anti-acid drugs containing Al or mental drugs affecting the central nervous system); (4) apparent poor vision and hearing; (5) absence of intact demographic information and blood samples.
All participants signed informed consent. The Ethics and Human committees of Shanxi Medical University approved the study. Face-to-face interviews and cognitive assessments were performed on the same day.
Venous blood was collected in EDTA tubes from each participant. The plasma was separated within 30 min by centrifugation (4 ℃, 5 min, 402 g/min) and stored at −80 °C until analysis. Plasma Al was analyzed by inductively coupled plasma mass spectrometry (ICP-MS) (NexlON 300D, PekinElme, USA). Each sample was measured twice. The instrument was calibrated after every 10 samples, using the Al standard liquid (Agilent, USA). The linearity, limit of detection (LOD), and recovery rates were 0.9998−1, 0.39 μg/L, and 98.24%−99.65%, respectively. Results lower than LOD were expressed by LOD/2.
Education was classified into junior middle school and below (≤ 9 years) and senior middle and above (> 9 years). Marital status and household incomes per capita were dichotomized into no or yes and < 1,000 or ≥ 1,000 Yuan per month, respectively. Smokers were defined as participants who smoked during the investigation or had quit smoking for less than 6 months. The participants who drank during the investigation or had quit drinking for less than 6 months (more than once a week) were defined as drinkers. Plasma Al was categorized into a binary variable according to the median. Two chief cognitive domains were identified after combining the tests: ‘learning and memory ability’ including ‘recall in MMSE’ + FOM (total retrieval) + DSF, and ‘visuospatial and executive ability’ including ‘visuospatial in MMSE’ + CDT + DSB[4]. The cut-off of various tests (MMSE/CDT/DS/FOM) and cognitive domains were 1 standard deviation below the mean of the controls[5].
SPSS 22.0 was used for analysis. The Student’s t-test or Mann-Whitney U test was used to compare continuous variables depending on the distribution types. Differences between categorical variables were calculated using the chi-square test. Multivariate logistic regression was used to analyze all the risk factors. A P value < 0.05 was considered statistically significant.
Table 1 presents the characteristics of electrolytic Al workers and controls. Age, education, marriage, income, and smoking between the two groups were adjusted and compare (P > 0.05). The electrolytic Al workers had a lower drinking proportion (P < 0.001). There was a significant difference in plasma Al between the two groups (P < 0.001) with the proportion of plasma Al ≥ 14.90 μg/L being significantly higher in Al workers than in controls (P < 0.001).
Table 1. Basic information of electrolytic Al workers and controls
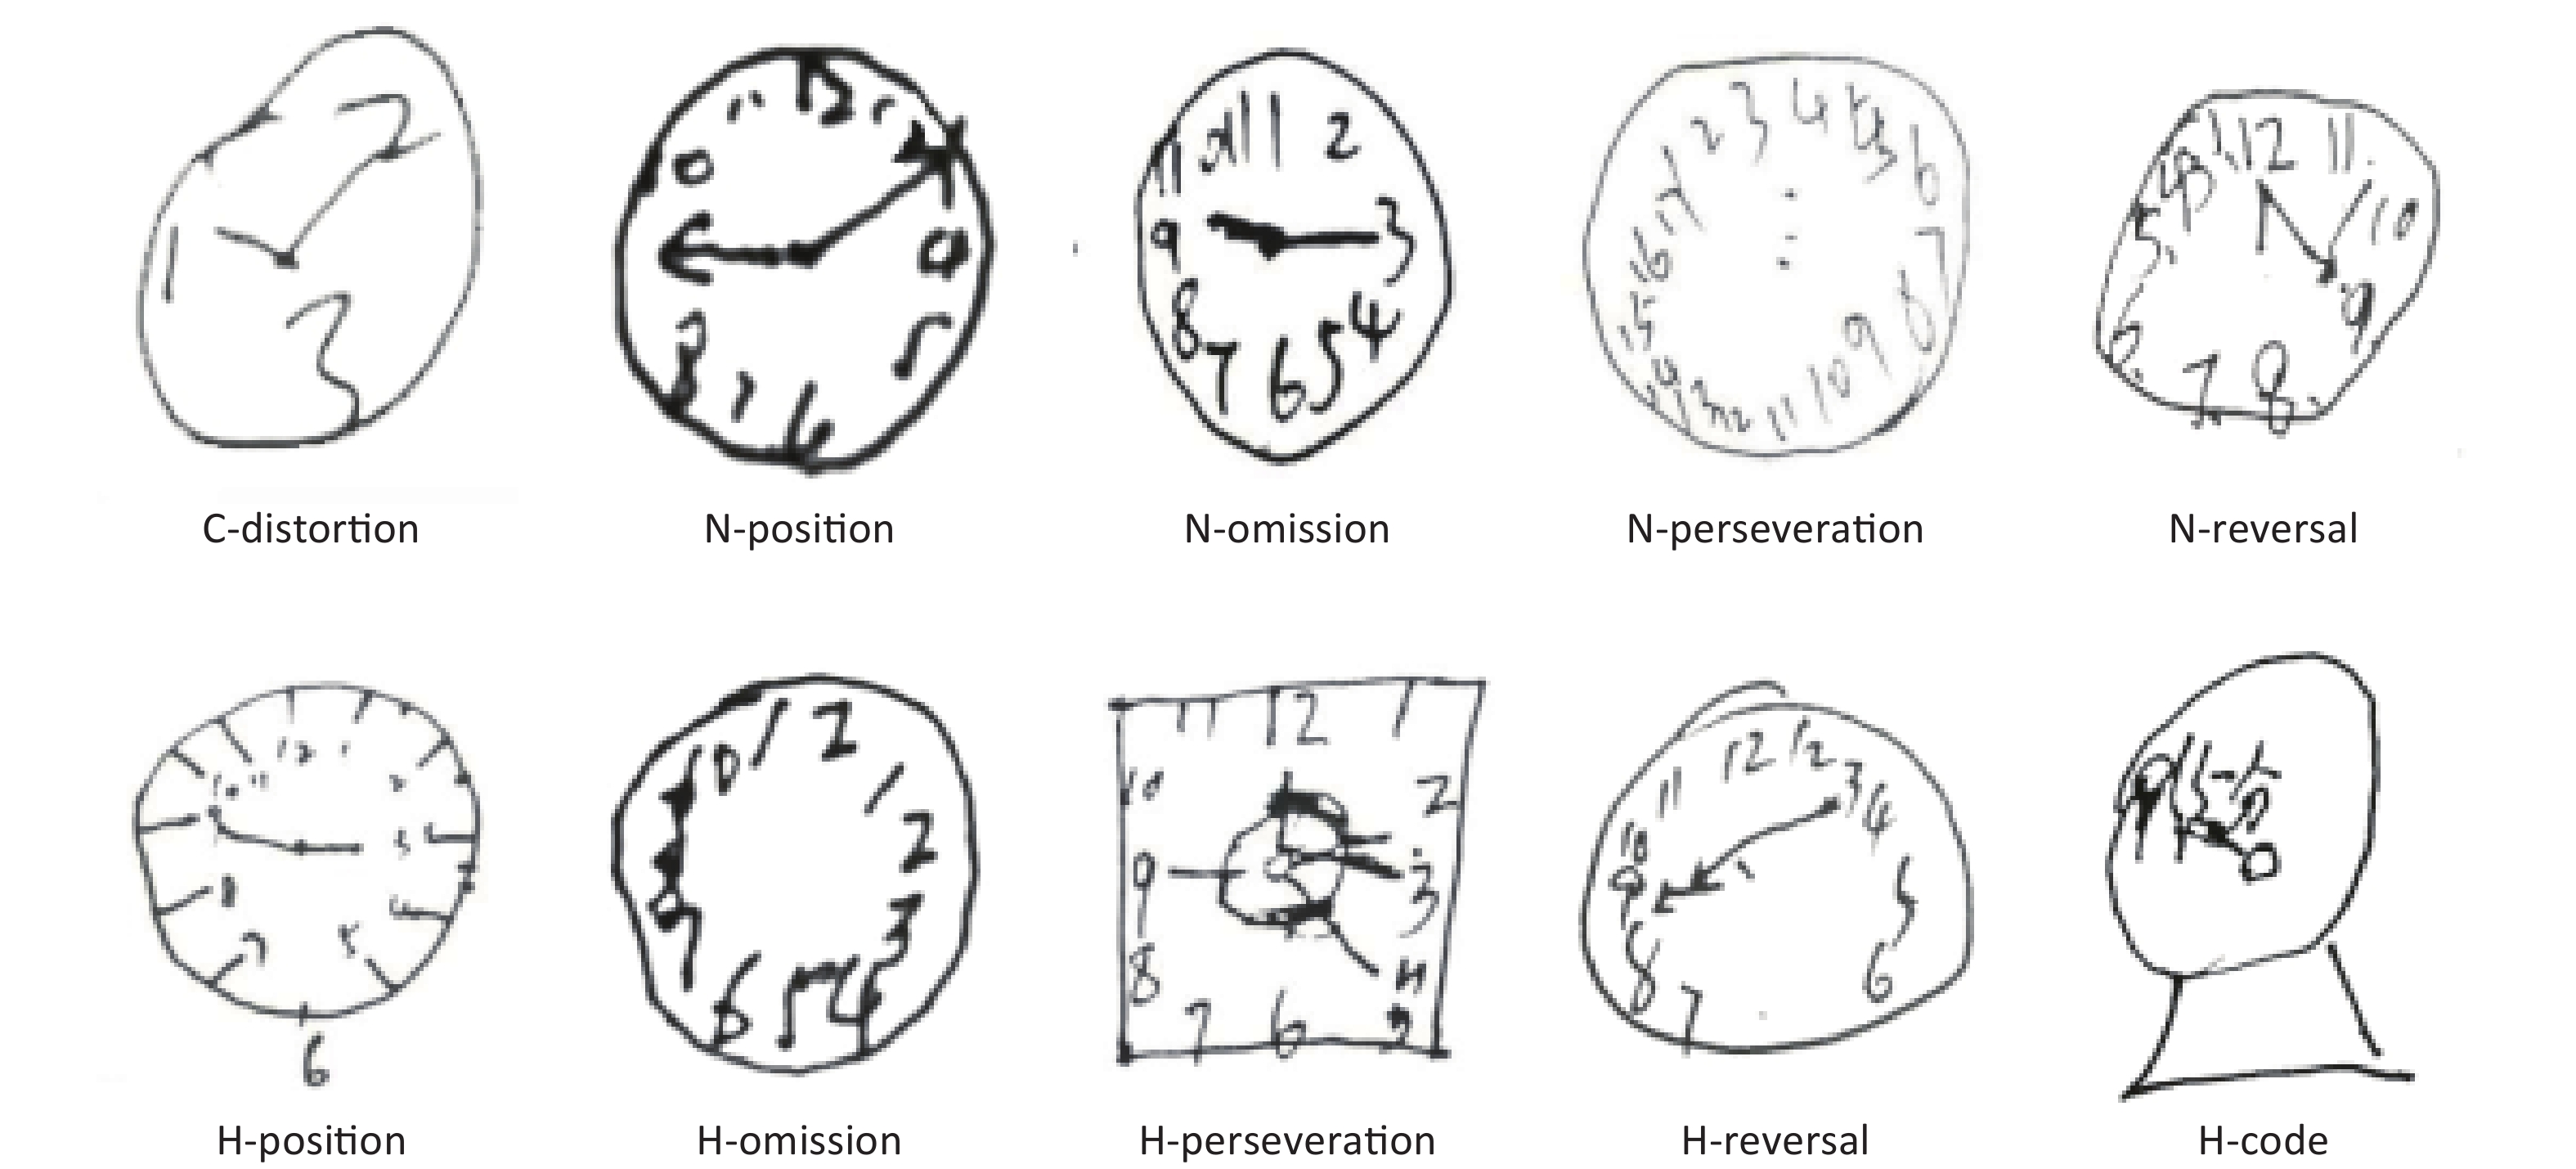
Variables Electrolytic Al workers (n = 172) Controls (n = 245) P value Age(y), mean ± SD 40.89 ± 5.77 41.63 ± 5.38 0.181a Education, n (%) Junior middle and below 115 (66.9) 175 (71.4) 0.187b Senior middle and above 57 (33.1) 70 (28.6) Marriage, n (%) No 1 (0.6) 2 (0.8) 0.780b Yes 171 (99.4) 243 (99.2) Income, n (%) < 1,000 RMB 46 (27.7) 77 (31,4) 0.419b ≥ 1,000 RMB 120 (72.3) 168 (68.6) Smoking, n (%) No 53 (30.8) 82 (33.5) 0.742b Yes 119 (69.2) 163 (66.5) Drinking, n (%) No 141 (82.0) 164 (66.9) 0.001b Yes 31 (18.0) 81 (33.1) Plasma Al, Med (25th−75th) 21.18 (11.84, 40.54) 10.46 (5.32, 19.24) < 0.001c Plasma Al, n (%) < 14.90 µg/L 55 (32.0) 153 (62.4) < 0.001b ≥ 14.90 µg/L 117 (68.0) 92 (37.8) Al working time, mean ± SD 6.64 ± 6.37 0 < 0.001a Note. Concentration unit of plasma Al is µg/L. Data were presented as Mean (SD) or n (%) or Med (25th−75th). aP value determined by Student’s t-test; bP value determined by Pearson chi-square test; cP value determined by Mann-Whitney U test. Missing value: Al exposure workers--income (6). RMB is Chinese money. Table 2 presents the cognitive status of the groups. Electrolytic Al workers had low scores in MMSE, CDT, DS, and FOM (P < 0.001). In MMSE, there were significant differences in recall (P = 0.035) and visuospatial domains (P = 0.014). In the CDT, H-position error was found to be the most common participant error type. C-distortion, H-position, and H-perseveration were significantly different between the two groups (P = 0.037, P = 0.013, P = 0.029). The Supplementary Figure S1 (available in www.besjournal.com) displays several typical error types of Al workers. Al workers also had low DS and FOM scores (P < 0.01).
Table 2. The cognition of workers in two groups
Variables Electrolytic Al workers (n = 172) Controls (n = 245) P value MMSE, mean ± SD 27.93 ± 1.91 28.62 ± 1.25 < 0.001a Orientation 9.93 ± 0.30 9.98 ± 0.18 0.054a Registration 2.97 ± 0.25 3.00 ± 0.00 0.072a Recall 2.27 ± 0.99 2.45 ± 0.71 0.035a Attention and Calculation 4.48 ± 1.01 4.64 ± 0.70 0.057a Language 7.54 ± 0.57 7.65 ± 0.82 0.122a Visuospatial ability 0.74 ± 0.44 0.84 ± 0.37 0.014a CDT, mean ± SD 2.70 ± 1.03 3.16 ± 0.86 < 0.001a Error type of CDT, n (%) C-distortion 9 (5.2) 4 (1.6) 0.037b N-position 22 (12.8) 18 (7.3) 0.063b N-omission 11 (6.4) 14 (5.7) 0.773b N-perseveration 6 (3.5) 14 (5.7) 0.295b N-reversal 1 (0.6) 2 (0.8) 0.780b H-position 102 (59.3) 115 (46.9) 0.013b H-omission 8 (4.7) 4 (1.6) 0.070b H-perseveration 21 (12.2) 15 (6.1) 0.029b H-reversal 0 (0) 1 (0.4) 0.402b H-code 1 (0.6) 0 (0) 0.232b DS, mean ± SD 10.97 ± 1.96 12.24 ± 2.15 < 0.001a Forward 6.81 ± 1.25 7.59 ± 1.32 0.001a Backward 4.16 ± 1.09 4.65 ± 1.28 < 0.001a FOM, mean ± SD 23.60 ± 3.12 25.80 ± 2.84 < 0.001a Total retrieval (0−30) 23.60 ± 3.12 25.80 ± 2.84 < 0.001a Total storage (0−30) 25.96 ± 2.68 27.39 ± 2.40 < 0.001a Repeated retrieval (0−20) 13.08 ± 2.95 15.21 ± 2.94 < 0.001a Infective reminder (0−20) 1.34 ± 1.62 0.78 ± 1.48 < 0.001a Verbal Fluency Test 33.91 ± 8.53 38.66 ± 8.22 0.002a Note. Data were presented as Mean ± SD. aP value determined by Student’s t-test; bP value determined by Pearson chi-square test. C-circle, N-number; H-hand. 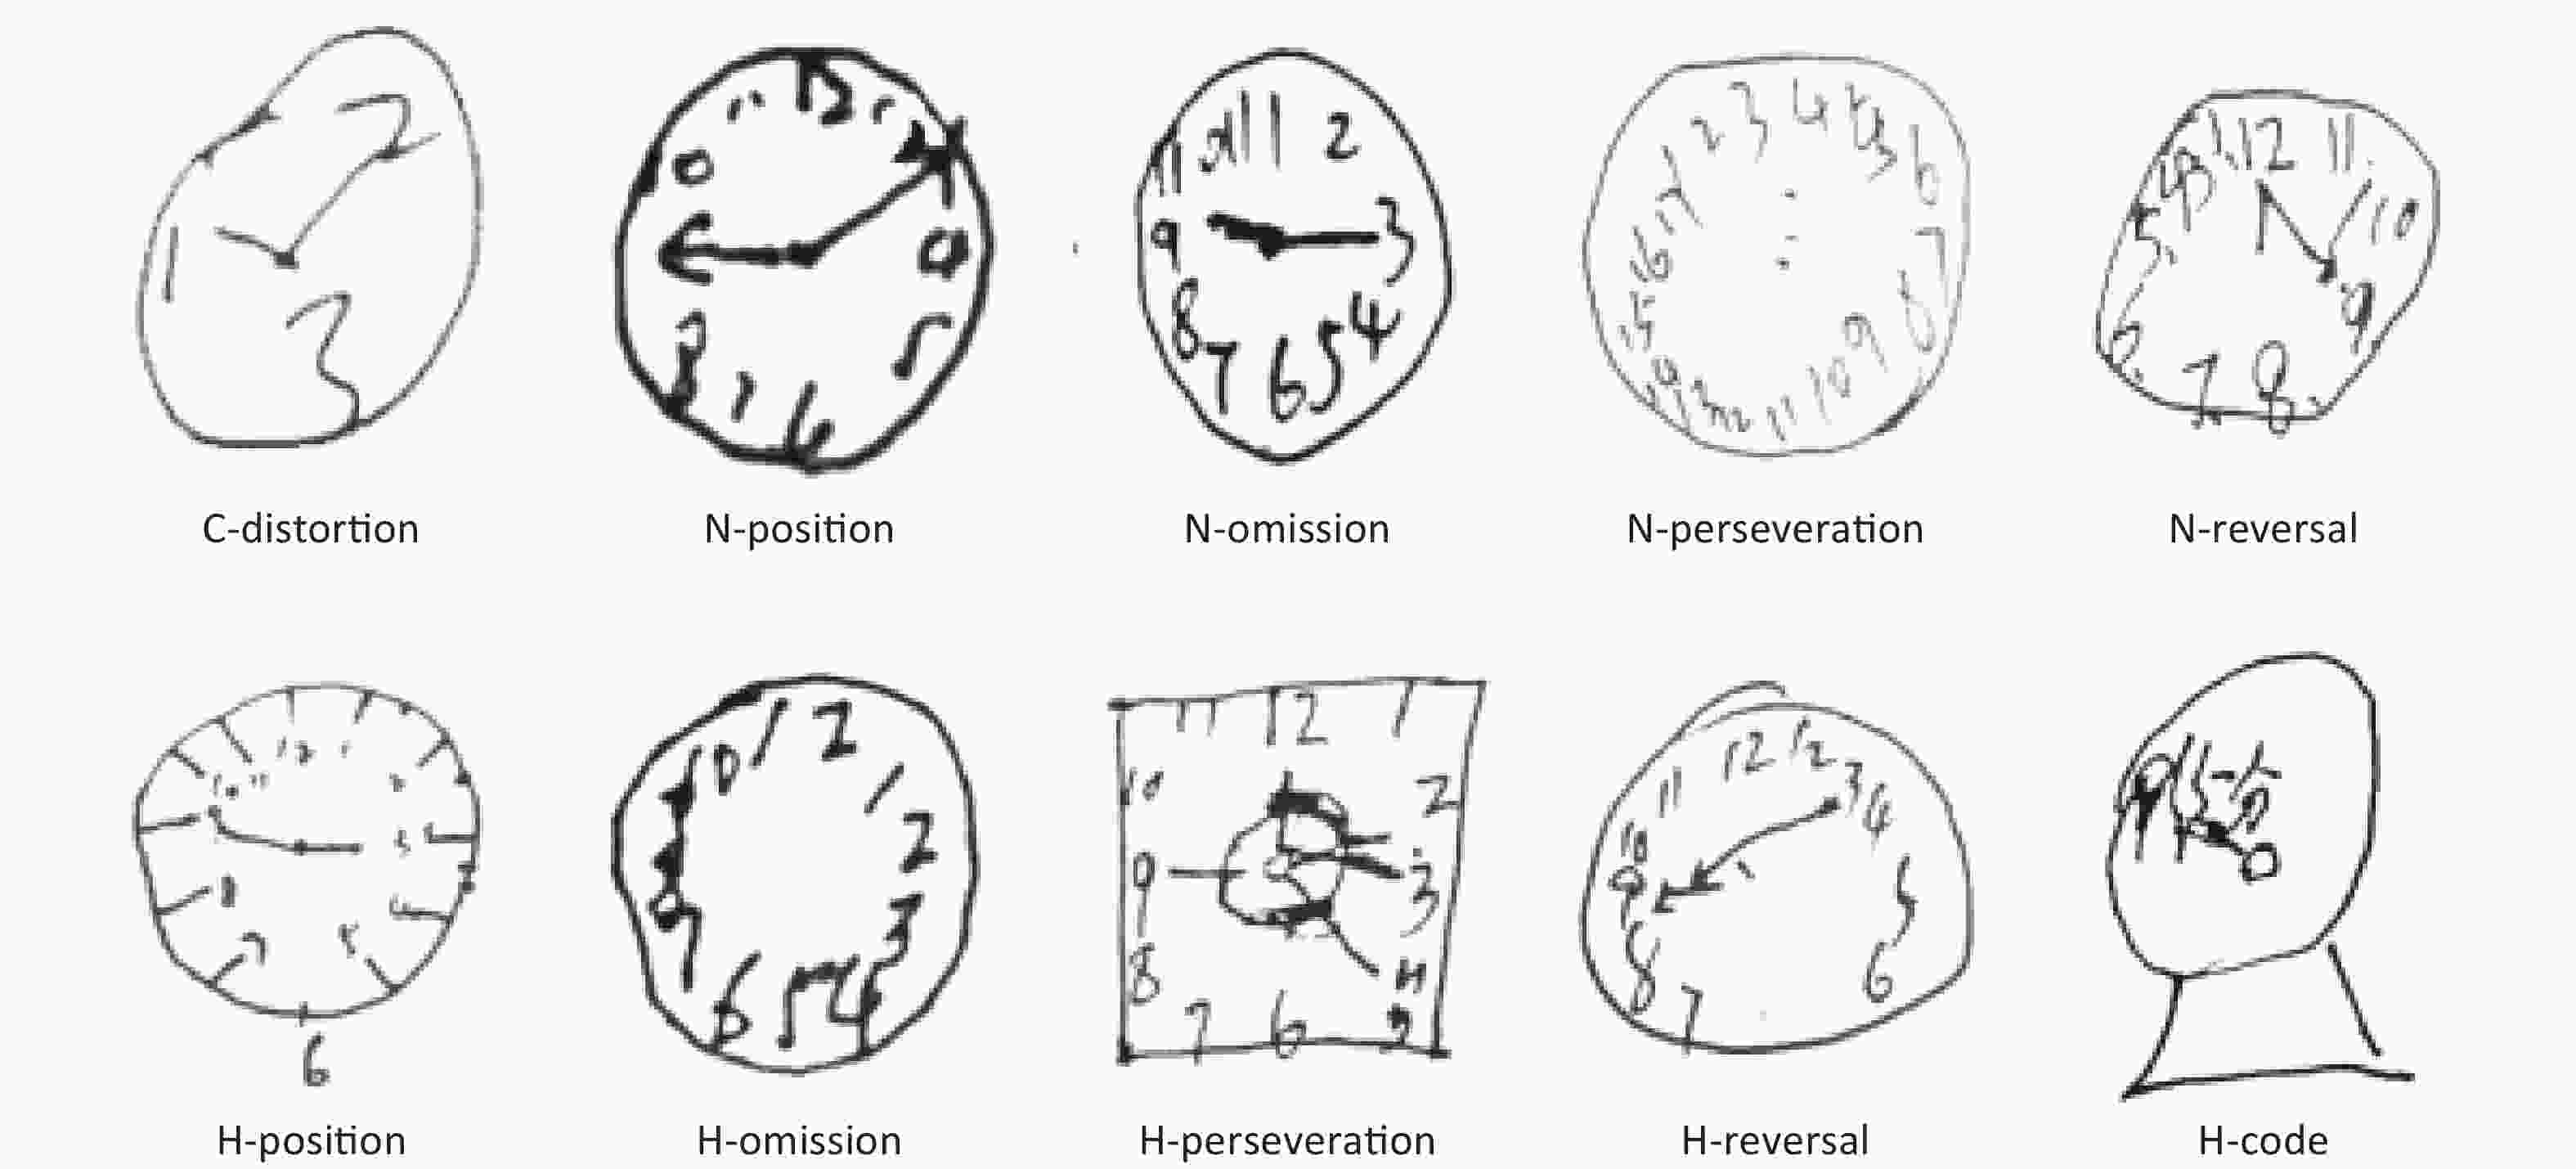
Figure S1. Various error types among electrolytic Al workers.
Supplementary Table S1 (available in www.besjournal.com) presents comparisons in the plasma Al between the cognitive impairment group and the normal group. Plasma Al was elevated in the cognitive impairment group (P < 0.05).
Table S1. The plasma Al between cognitive impairment group and normal group
Variables The plasma Al of abnormal The plasma Al of normal P value MMSE 17.14 (8.73, 29.52) 13.74 (6.78, 24.12) 0.020 CDT 18.10 (8.88, 31.00) 13.05 (6.63, 23.16) 0.004 DS 16.10 (8.09, 30.22) 13.71 (6.65, 23.69) 0.046 FOM 18.97 (7.71, 37.49) 13.72 (6.94, 23.12) 0.009 Note. Concentration unit of plasma Al is µg/L. Data were presented as Med (25th–75th). P value determined by Mann-Whitney U test. Cut-off is 1 standard deviation below the mean of the control. We found that the higher level of plasma Al was associated with a high risk of cognitive impairment in CDT (OR: 1.790, 95% CI: 1.127, 2.843, P = 0.014) (Supplementary Table S2, available in www.besjournal.com). Furthermore, we analyzed the relationship between plasma Al and specific cognitive domains (learning and memory ability; visuospatial and executive ability) presented in Table 3. After adjusting the age, education, income, smoking, and drinking, the elevated plasma Al was found to increase the risk of learning and memory impairments (OR: 1.883, 95% CI: 1.203, 2.947, P = 0.006) as well as visuospatial and executive dysfunction (OR: 2.016, 95% CI: 1.111, 3.656, P = 0.021).
Table S2. Multivariate logistic regression of cognitive impairment
Variables MCI, n (%) AOR (95% CI) P value MMSE 417 (19.7) Age 1.062 (1.015−1.113) 0.010 Income 1.886 (1.032−3.447) 0.039 CDT 417 (24.9) Median of Al 1.790 (1.127−2.843) 0.014 DS 414 (30.0) Age 1.067 (1.025−1.110) 0.002 FOM 415 (18.5) Income 0.593 (0.356, 0.988) 0.045 Note. OR is adjusted by age, education, smoking, drinking, income. AOR: adjusted odds ratio cut-off is 1 standard deviation below the mean of the control. Table 3. Multivariate logistic regression of cognitive domains
Variables AOR (95% CI) P-value Memory and learning Age 1.006 (0.966, 1.047) 0.777 Education 0.986 (0.605, 1.606) 0.954 Median of Al 1.883 (1.203, 2.947) 0.006 Income 0.719 (0.447, 1.158) 0.175 Smoking 0.785 (0.492, 1.254) 0.312 Drinking 0.668 (0.390, 1.145) 0.142 Visuospatial and executive ability Age 1.044 (0.992, 1.098) 0.097 Education 1.434 (0.797, 2.580) 0.230 Median of Al 2.016 (1.111, 3.656) 0.021 Income 0.936 (0.508, 1.725) 0.831 Smoking 1.157 (0.630, 2.126) 0.638 Drinking 0.797 (0.410, 1.551) 0.505 Note. OR is adjusted by age, education, smoking, drinking and income. Cut-off is 1 standard deviation below the mean of the control. In our study, the workers’ average occupational exposure to Al was 6.64 years. Our findings showed no significant differences in age, education, income, marriage, and smoking between the two groups. Controls had a higher drinking ratio. However, Al workers had higher plasma Al level than controls. In previous occupational studies[6, 7], the median of plasma Al varied in the range of 9.9−33.5 µg/L. Our result (21.18 µg/L) was within this range. The plasma Al level in the control group was higher than the general population (< 5 µg/L), probably because the control group also lived in the Al plant community, which was already polluted.
We utilized cognitive screening tests including MMSE, CDT, DS, FOM, and VFT, to evaluate the participants’ cognitive status. In MMSE, there were statistical differences in recall and visuospatial ability. In our previous study[8], orientation, recall, and calculation ability were decreased in Al retired workers. The cause of this difference may be the comparatively younger age and higher education level of the participants, with possibly better orientation and calculation ability.
Age was also a risk factor. However, the relationship between income and cognition was controversial. High income may be a protective factor, but our workers' income levels were low and did not reflect the advantages of income. Smoking and drinking were unrelated to cognition in our study. The neurotoxicity of Al was also confirmed by Polizzi[9], Zawilla[7], and other scholars. In contrast, several studies[10, 11] found no association between Al exposure and cognition. Despite this, the role of Al cannot be definitively excluded.
The influence of Al on ‘learning and memory ability’ was confirmed by many previous researchers. ‘Visuospatial and executive ability’ was also significantly affected by Al. In Zawilla’s study[7], memory, language, and visuospatial abilities of Al workers were impaired, but the data of a multivariate analysis were lacking. In recent years, visual space and imaging have been increasingly researched. MRI studies have identified the relation of CDT impairment to temporoparietal regions. Matsuoka[12] found that CDT scores were positively correlated with regional gray matter volume in the bilateral posterior temporal lobes, right posterior inferior temporal lobe, and right posterior superior temporal lobe, based on different scoring methods. Hirjak[13] suggested the involvement of different hippocampal subfields in impaired CDT performance. We speculate that the hippocampus and temporoparietal areas of Al workers may be affected.
For the relationship between Al and cognition, epidemiological studies can only provide uncertain data; the specific pathogenesis needs further study. We will conduct magnetic resonance research on Al workers. There were some limitations in our study. First, all workers were exposed to Al from only one factory. Second, there was no imaging data to further explain the impairments. Last, a longitudinal follow-up study is needed to clarify the hazards of Al.
The cognitive functions of electrolytic Al workers declined. Learning and memory ability, as well as visuospatial and executive ability, were affected.
The authors declare no conflicts of interest.
doi: 10.3967/bes2019.110
Cognitive Status of Electrolytic Aluminum Workers: A Cross-sectional Study Using Cognitive Screening Tests
-
-
Table 1. Basic information of electrolytic Al workers and controls
Variables Electrolytic Al workers (n = 172) Controls (n = 245) P value Age(y), mean ± SD 40.89 ± 5.77 41.63 ± 5.38 0.181a Education, n (%) Junior middle and below 115 (66.9) 175 (71.4) 0.187b Senior middle and above 57 (33.1) 70 (28.6) Marriage, n (%) No 1 (0.6) 2 (0.8) 0.780b Yes 171 (99.4) 243 (99.2) Income, n (%) < 1,000 RMB 46 (27.7) 77 (31,4) 0.419b ≥ 1,000 RMB 120 (72.3) 168 (68.6) Smoking, n (%) No 53 (30.8) 82 (33.5) 0.742b Yes 119 (69.2) 163 (66.5) Drinking, n (%) No 141 (82.0) 164 (66.9) 0.001b Yes 31 (18.0) 81 (33.1) Plasma Al, Med (25th−75th) 21.18 (11.84, 40.54) 10.46 (5.32, 19.24) < 0.001c Plasma Al, n (%) < 14.90 µg/L 55 (32.0) 153 (62.4) < 0.001b ≥ 14.90 µg/L 117 (68.0) 92 (37.8) Al working time, mean ± SD 6.64 ± 6.37 0 < 0.001a Note. Concentration unit of plasma Al is µg/L. Data were presented as Mean (SD) or n (%) or Med (25th−75th). aP value determined by Student’s t-test; bP value determined by Pearson chi-square test; cP value determined by Mann-Whitney U test. Missing value: Al exposure workers--income (6). RMB is Chinese money.  下载: 导出CSV
Table 2. The cognition of workers in two groups
Variables Electrolytic Al workers (n = 172) Controls (n = 245) P value MMSE, mean ± SD 27.93 ± 1.91 28.62 ± 1.25 < 0.001a Orientation 9.93 ± 0.30 9.98 ± 0.18 0.054a Registration 2.97 ± 0.25 3.00 ± 0.00 0.072a Recall 2.27 ± 0.99 2.45 ± 0.71 0.035a Attention and Calculation 4.48 ± 1.01 4.64 ± 0.70 0.057a Language 7.54 ± 0.57 7.65 ± 0.82 0.122a Visuospatial ability 0.74 ± 0.44 0.84 ± 0.37 0.014a CDT, mean ± SD 2.70 ± 1.03 3.16 ± 0.86 < 0.001a Error type of CDT, n (%) C-distortion 9 (5.2) 4 (1.6) 0.037b N-position 22 (12.8) 18 (7.3) 0.063b N-omission 11 (6.4) 14 (5.7) 0.773b N-perseveration 6 (3.5) 14 (5.7) 0.295b N-reversal 1 (0.6) 2 (0.8) 0.780b H-position 102 (59.3) 115 (46.9) 0.013b H-omission 8 (4.7) 4 (1.6) 0.070b H-perseveration 21 (12.2) 15 (6.1) 0.029b H-reversal 0 (0) 1 (0.4) 0.402b H-code 1 (0.6) 0 (0) 0.232b DS, mean ± SD 10.97 ± 1.96 12.24 ± 2.15 < 0.001a Forward 6.81 ± 1.25 7.59 ± 1.32 0.001a Backward 4.16 ± 1.09 4.65 ± 1.28 < 0.001a FOM, mean ± SD 23.60 ± 3.12 25.80 ± 2.84 < 0.001a Total retrieval (0−30) 23.60 ± 3.12 25.80 ± 2.84 < 0.001a Total storage (0−30) 25.96 ± 2.68 27.39 ± 2.40 < 0.001a Repeated retrieval (0−20) 13.08 ± 2.95 15.21 ± 2.94 < 0.001a Infective reminder (0−20) 1.34 ± 1.62 0.78 ± 1.48 < 0.001a Verbal Fluency Test 33.91 ± 8.53 38.66 ± 8.22 0.002a Note. Data were presented as Mean ± SD. aP value determined by Student’s t-test; bP value determined by Pearson chi-square test. C-circle, N-number; H-hand.
下载: 导出CSV
S1. The plasma Al between cognitive impairment group and normal group
Variables The plasma Al of abnormal The plasma Al of normal P value MMSE 17.14 (8.73, 29.52) 13.74 (6.78, 24.12) 0.020 CDT 18.10 (8.88, 31.00) 13.05 (6.63, 23.16) 0.004 DS 16.10 (8.09, 30.22) 13.71 (6.65, 23.69) 0.046 FOM 18.97 (7.71, 37.49) 13.72 (6.94, 23.12) 0.009 Note. Concentration unit of plasma Al is µg/L. Data were presented as Med (25th–75th). P value determined by Mann-Whitney U test. Cut-off is 1 standard deviation below the mean of the control.
下载: 导出CSV
S2. Multivariate logistic regression of cognitive impairment
Variables MCI, n (%) AOR (95% CI) P value MMSE 417 (19.7) Age 1.062 (1.015−1.113) 0.010 Income 1.886 (1.032−3.447) 0.039 CDT 417 (24.9) Median of Al 1.790 (1.127−2.843) 0.014 DS 414 (30.0) Age 1.067 (1.025−1.110) 0.002 FOM 415 (18.5) Income 0.593 (0.356, 0.988) 0.045 Note. OR is adjusted by age, education, smoking, drinking, income. AOR: adjusted odds ratio cut-off is 1 standard deviation below the mean of the control.
下载: 导出CSV
Table 3. Multivariate logistic regression of cognitive domains
Variables AOR (95% CI) P-value Memory and learning Age 1.006 (0.966, 1.047) 0.777 Education 0.986 (0.605, 1.606) 0.954 Median of Al 1.883 (1.203, 2.947) 0.006 Income 0.719 (0.447, 1.158) 0.175 Smoking 0.785 (0.492, 1.254) 0.312 Drinking 0.668 (0.390, 1.145) 0.142 Visuospatial and executive ability Age 1.044 (0.992, 1.098) 0.097 Education 1.434 (0.797, 2.580) 0.230 Median of Al 2.016 (1.111, 3.656) 0.021 Income 0.936 (0.508, 1.725) 0.831 Smoking 1.157 (0.630, 2.126) 0.638 Drinking 0.797 (0.410, 1.551) 0.505 Note. OR is adjusted by age, education, smoking, drinking and income. Cut-off is 1 standard deviation below the mean of the control.
下载: 导出CSV
-
[1] Exley C, Vickers T. Elevated brain aluminium and early onset Alzheimer’s disease in an individual occupationally exposed to aluminium: a case report. J Med Case Rep, 2014; 8, 41. doi: 10.1186/1752-1947-8-41 [2] Klotz K, Weistenh ¶FER W, Neff F, et al. The Health Effects of Aluminum Exposure. Dtsch Arztebl Int, 2017; 114, 653-9. [3] Reis AP, Patinha C, Noack Y, et al. Assessing the human health risk for aluminium, zinc and lead in outdoor dusts collected in recreational sites used by children at an industrial area in the western part of the Bassin Minier de Provence, France. J Afr Earth Sci, 2014; 99, 724-34. doi: 10.1016/j.jafrearsci.2013.08.001 [4] Paula JJ, Miranda DM, Moraes EN, et al. Mapping the clockworks: what does the Clock Drawing Test assess in normal and pathological aging?. Arq Neuro-psiquiat, 2013; 71, 763-8. doi: 10.1590/0004-282X20130118 [5] Ho RTH, Fong TCT, Hon T, et al. Psychometric validation of Fuld Object Memory Evaluation in older adults with cognitive impairments. Aging Ment Health, 2018; 6, 1-7. [6] Kiesswetter E, Sch Per M, Buchta M, et al. Longitudinal study on potential neurotoxic effects of aluminium: I. Assessment of exposure and neurobehavioural performance of Al welders in the train and truck construction industry over 4years. Int Arch Occ Env Hea, 2007; 81, 41-67. doi: 10.1007/s00420-007-0191-2 [7] Zawilla NH, Taha FM, Kishk NA, et al. Occupational exposure to aluminum and its amyloidogenic link with cognitive functions. J Inorg Biochem, 2014; 139, 57-64. doi: 10.1016/j.jinorgbio.2014.06.003 [8] Lu X, Liang R, Jia Z, et al. Cognitive disorders and tau-protein expression among retired aluminum smelting workers. J Occup Environ Med, 2014; 56, 155. doi: 10.1097/JOM.0000000000000100 [9] Polizzi S, Pira E, Ferrara M, et al. Neurotoxic effects of aluminium among foundry workers and Alzheimer's disease. Neurotoxicology, 2002; 23, 761-74. doi: 10.1016/S0161-813X(02)00097-9 [10] Wang Z, Wei X, Yang J, et al. Chronic exposure to aluminum and risk of Alzheimer's disease: A meta-analysis. Neurosci Lett, 2016; 610, 200-6. doi: 10.1016/j.neulet.2015.11.014 [11] Virk SA, Eslick GD. Occupational Exposure to Aluminum and Alzheimer Disease: A Meta-Analysis[J]. Alzheimers Dement, 2015; 11, P595-P6. [12] Matsuoka T, Narumoto J, Shibata K, et al. Neural correlates of performance on the different scoring systems of the clock drawing test. Neurosc Lett, 2011; 487, 421-5. doi: 10.1016/j.neulet.2010.10.069 [13] Hirjak D, Sambataro F, Remmele B, et al. The relevance of hippocampal subfield integrity and clock drawing test performance for the diagnosis of Alzheimer's Disease and Mild Cognitive Impairment. World J Biol Psychia, 2017; 1-32. -

 点击查看大图
图(1) / 表ll (5)
计量
- 文章访问数: 1038
- HTML全文浏览量: 325
- PDF下载量: 48
- 被引次数: 0

 Quick Links